Submitted:
19 January 2024
Posted:
22 January 2024
You are already at the latest version
Abstract
The effect of current density of electrodeposition on the morphology, hardness, and corrosion resistance of the Ni coatings and Ni-Al2O3 coatings on Q345 steels were investigated. The surface of Ni coatings exhibited the cellular structure, while the surface of Ni-Al2O3 composite coatings showed the finer protrusions structure. The thickness of all coatings increased as the current density of electrodeposition increased from 1.5 A/dm2 to 3.0 A/dm2. After coating, the hardness and corrosion resistance of the Q345 steels were significantly enhanced. Furthermore, for the Ni coatings and Ni-Al2O3 coatings, the highest hardness and best anticorrosion property were obtained at 2.5 A/dm2 of electrodeposition current density. Compared with the Ni coatings, the co-deposition of Al2O3 nanoparticles improved the hardness of Ni-Al2O3 coating due to the second phase strengthen, but reduced the thickness and corrosion resistance due to more defects caused by the coelectrodeposition of the Al2O3 particles.
Keywords:
Q345 steel
; Electrodeposition
; Al2O3 nanoparticles
; Ni coatings
1. Introduction
High strength low alloy steels (HSLA Steels) have been widely used due to their excellent mechanical property and economic performance [1,2]. However, their low hardness and poor corrosion resistance lead to the premature failure [3,4,5,6]. To improve the service life, surface coating has been widely used on their surface [6,7,8]. Ni coatings prepared by electrodeposition have attracted the attention of researchers due to their ease of preparation and economy, have been widely used for corrosion protection of mild steels [7,9,10]. However, the hardness of Ni coatings is low. Thus, the co-deposition of hard nanoparticles has been proposed [11,12,13]. W. Wang et al. [13] revealed that the composite Ni coating doped with 3.37% ZrO2 particles achieved a maximum hardness of 462 HV, which is more than twice the hardness of Ni coating (213 HV). However, the corrosion resistance of the coatings was not revealed. However, the effect of SiC particles doping on the hardness of the Ni coating was not studied.
Nano alumina particles have high hardness and have been co-deposited in metal coatings and improved the wear resistance and heat resistance of metal coatings [9,14,15]. Furthermore, Al2O3 particles have good chemical stability. Therefore, Ni-Al2O3 composite coating is expected to achieve excellent wear and corrosion resistance. Several reports have focused on the effect of coelectrodeposition of alumina nanoparticles in Ni coatings on the unilateral performance of wear resistance or corrosion resistance. L. Chen et al. [16] confirmed that the coelectrodeposition of alumina nanoparticles improved hardness and decreased wear rate of the Ni coatings. A. Goral et al. [17] prepared Ni-Al2O3 nanocomposite coatings on mild steels by electrodeposition. The results showed that compared with Ni coating, the hardness of Ni-Al2O3 composite coating increased by 40% due to Al2O3 particles changed the structure of the Ni coating. H. Gül et al. [18] prepared Ni-Al2O3 nanocomposite coatings by electrodeposition at different current densities. At a current density of 9.0 A/dm2, the hardness of the coating reached high up to 641 HV, which is more than twice the hardness of the Ni coating (290 HV). The study of B. Szczygieł et al. [19] showed that, after 14 days of exposure in a 0.5M solution of Na2SO4, the nickel coating corroded three times faster than the Ni-Al2O3 coating.
The hardness and corrosion resistance of Q345 steel used in bridges, ships, etc. are crucial for its application when working in environments with seawater corrosion and sand gravel friction. Unfortunately, there are few reports on the effect of Ni-Al2O3 coating on both hardness and corrosion resistance of Q345 steel. In this paper, Ni coatings and Ni-Al2O3 composite coatings were prepared on Q345 steels by electrodeposition, and the effects of current density of electrodeposition on thickness, surface morphology, hardness and corrosion resistance of Ni coatings without and with Al2O3 doping were investigated and compared.
2. Experimental materials and methods
A Q345 steel plate with a thickness of 3 mm was cut into 8 cm x 6 cm sheets and pretreated as follows: (1) polishing with 180-2000 # SiC metallographic sandpaper; (2) alkali washing using 35 g/L-1 NaOH solution for 2 min at room temperature to remove surface grease; (3) acid washing using 10% HCl solution for 2 min at room temperature to remove the surface oxide film and enhance the bonding strength between the coating and the substrate. And the ultrasonic cleaning with anhydrous ethanol was used for 1 min after each step.
The alumina suspension was prepared by following steps: adding H3BO3 to the ethanol solution and the pH value was adjusted to 4 by HCl solution. Then, the solution was magnetically stirred at 60 ℃, and an appropriate amount of nano- Al2O3 particles (average particle diameter 20 nm, purity 98%) was slowly added in it. After stirring for 1 h, the stable suspension was obtained.
The basic composition of the electrodeposition solution was shown in Table 1. The electrodeposition current density was set at 1.5, 2.0, 2.5, and 3.0 A/dm2, respectively. The electrodeposition was executed at about 40 ℃ under pH value of 4.0-4.2. The current density of electrodeposition was provided by YJ92/5Z DC regulated power supply, and a pure nickel plate and the Q345 steel substrate keeping a distance of 3 cm were used as the anode and cathode, respectively. During the electrodeposition process, magnetic stirring was used to reduce the concentration difference of the solution near the cathode, ensuring the uniformity of the coating composition. After coating, the sample was ultrasonically cleaned with deionized water for 5 min, and then dried.
The surface and cross-sectional morphologies and thickness of coating were observed using an electron scanning microscope (SEM, Czech Tescan VEGA 3SUB). The elemental distribution in coating was analyzed by an energy spectrometer (EDS) attached to the SEM. And the working voltage was 15 KV.
A Vickers microhardness tester (HV-1000STA) was used to measure the hardness of the uncoated- and coated samples with a load of 1000 g for 10 s. Take the average of 10 measurements at different positions as the surface hardness of the sample.
The corrosion resistance of the uncoated- and coated samples through an electrochemical measurement (MFT-EC4000). The polarization curves and AC impedance spectra were tested using a 3.5 wt. % NaCl solution. The sample was used as the working electrode, and a Pt plate and saturated calomel electrode were used as the auxiliary electrode and reference electrode, respectively. Firstly, the open-circuit potential was measured, and then the impedance spectrum and polarization curve were performed after the open-circuit potential stabilized. The AC impedance spectrum was scanned in the range of 105 ~ 10-2 Hz, and the Nyquist and Bode plots were fitted by the equivalent circuit diagram using a ZSimpWin software. The polarization curve was set to ± 0.8 V relative to the open-circuit potential at a scan rate of 1 mV/s and fitted using the Tafel extrapolation method.
Salt spray corrosion test was applied using YWX-015 salt spray corrosion chamber with a 5 wt. % of sodium chloride solution, which was carried for 48 h at 35 ℃ and 6.7 of pH value. The sample was sealed and kept 2 cm × 2 cm exposure area. After test, the specimen was brushed and rinsed in the deionized water to remove the surface corrosion products, and then was placed in a drying box for 1 h. And the corrosion rate of sample was calculated by weight loss before and after the salt spray corrosion experiment.
3. Results and Discussion
3.1. Morphology
Figure 1 shows the surface and cross-sectional SEM morphologies of the Ni coatings (Figure 1 a-d) and Ni-Al2O3 composite coatings (Figure 1 e-h) prepared at different current densities of electrodeposition. All surfaces of the coatings showed a dense structure. All coatings exhibited strong bonging strength with the substrates since there was no lamination could be seen. All Ni coatings showed a cellular structure because of the enriched growth of Ni element [20]. With the increase of current density of electrodeposition (no more than 2.5 A/dm2), the cellular size of the Ni coatings increased and the number of particles decreased (Figure 1 b and c), and the particles almost disappeared at a current density of 2.5 A/dm2 for electrodeposition (Figure 1 c). At the current density of 3.0 A/dm2 for electrodeposition, the cellular size of the coating decreased. However, some large particles were formed and locally peeled off, resulting in a rougher coating surface (Figure 1 d). Compared with the Ni coatings, the coelectrodeposition of Al2O3 particles inhibited the growth of Ni crystals, affected the growth pattern of the coating, refined the structure of the coating, but increased the surface roughness of the coating. At the current density of 1.5 A/dm2 (Figure 1 e) and 2.0 A/ dm2 (Figure 1 f) for electrodeposition, the Ni-Al2O3 composite coatings showed a fine and dense particle structure, which is consistent with the literature [21,22,23]. At the current density of 2.5 A/ dm2 for electrodeposition (Figure 1 g), the coating exhibited a dense cellular structure. However, compared with the Ni coating at the same current density of electrodeposition, a large number of particles were observed on the surface of the Ni-Al2O3 coating. With the current density of electrodeposition further increased, the cellular size of the coating and particle size increased, but the quantity of particle decreased (Figure 1 h). In addition, there was some local flaking and loose hole defects (yellow elliptical area), which is attributed to: (1) the formation of crack defects caused by the large current density of electrodeposition[24]; (2) the agglomeration of alumina nanoparticles.
At 1.5, 2.0, 2.5, and 3.0 A/ dm2 current densities for electrodeposition, the thicknesses of the Ni coatings were 9.6, 11.2, 12.5, and 16.6 μm, and that of the Ni-Al2O3 composite coatings were 5.2, 9.5, 10.6, and 11.4 μm, respectively. Which indicates that the thicknesses of the coatings increased with the increase of electrodeposition current density. This is due to the fact that when the current density of electrodeposition increased, the nucleation rate of the coating and the amount of Ni deposited in the coating increased [25]. Comparing to the Ni coatings, under the same current density of electrodeposition, the thickness of Ni-Al2O3 composite coatings was smaller, which is due to non-conductive alumina nanoparticles increased flow resistance of electrodeposition solution. As a result, the Ni content in the electrodeposition solution and the deposition rate reduced [21,22,26].
In order to verify the Al2O3 particles have were co-deposited in the Ni coating to form a composite coating, as shown in Figure 2. In Figure 2 a, the backscattering and elemental mapping of the Ni-Al2O3 coating prepared at a current density of 2.5 A/dm2 for electrodeposition were performed. The coating consisted of the gray matrix phase and the black second phase. Figure 2 b shows the uniform distribution of high concentration Ni on the surface of the coating. The Ni element wholly covered the steel surface, indicating that the Ni coating was dense. Oxygen and aluminum elements (Figure 2 c, d) were uniformly distributed in the coating, indicating that the Al2O3 particles were coelectrodeposited in coating. However, the local aggregation of oxygen and aluminum elements (as shown by the white and yellow circles of Figure 2 c and d, corresponding to the black particles in the white and yellow circles in Figure 2 c) implies the local aggregation of Al2O3 particles. The local agglomeration of the Al2O3 nanoparticles in the Ni coating due to the high surface free energy of the nano-alumina particles [27].
3.2. XRD spectra
The XRD spectra of Ni coatings and Ni-Al2O3 composite coatings are shown in Figure 3. The (111) and (200) planes were observed in all Ni coatings. The preferential growth crystal plane was (200) [18,28] at 1.0 A/dm2 of the electrodeposition current density. However, the Ni coatings preferential grew along the (111) plane when the electrodeposition current density of electrodeposition was higher than 1.0 A/dm2. For the Ni-Al2O3 composite coatings, the crystal plane (111) showed a much higher intensity than the (200) plane, inferring that there were overlapped diffraction peaks of Ni and α-Al2O3 due to the addition of alumina enhanced the (111) crystal plane and weaken the (200) crystal plane [29]. Moreover, all Ni-Al2O3 composite coatings preferential grew along the (111) planes and exhibited a significant (220) diffraction peak. No separate alumina peak was observed may be due to its amorphous nanocrystalline nature and low content in the coating and high intensity of nickel diffraction peaks [30].
3.3. Hardness
Figure 4 shows the Vickers hardness of the uncoated-, Ni coated-, and Ni-Al2O3 coated specimens. The hardness of the substrate was 200 ± 3 HV. The hardness of the Ni coated- and Ni-Al2O3 coated samples was significantly enhanced, indicating that all coatings can provide the friction protection for the steel substrate. The hardness variation trend of the Ni coatings and Ni-Al2O3 coatings was the same, that is, as the current density of electrodeposition increased, the hardness of the coatings first increased and then decreased. And at a current density of 2.5A/dm2, the maximum hardness of the electrodeposited Ni coatings was 293 ± 11HV, and the hardness of the Ni-Al2O3 coatings was 331 ± 9HV.
During the hardness testing process, the coating hardness test will be affected by the substrate hardness. The thicker the coating, the less affected it is by the soft substrate [31]. With the current density of electrodeposition increased from 1.5 A/dm2 to 2.5 A/dm2, the thicker coatings without local spalling were obtained (Figure 1 a-c, e-g), thus the hardness of the coatings increased. However, at a current density of 3.0 A/dm2 for electrodeposition, the brittleness of coating caused by the high current density of electrodeposition increased and the Ni and Ni-Al2O3 coatings locally peeled off (Figure 1 d, h), which resulting in the hardness of coatings decreased.
Due to the Al2O3 particles coelectrodeposition, the Ni-Al2O3 coating will has higher hardness than the Ni coating due to the second phase strengthen [17] and fine crystal strengthening [26,28]. Therefore, compared with the Ni coatings, the thinner Ni-Al2O3 composite coatings prepared using the same current density of electrodeposition exhibited a higher hardness. When the current density of electrodeposition increased to 3.0 A/dm2, there was little difference in hardness between the Ni-Al2O3 composite coating and the Ni coating. This may be due to the increased brittleness of the Ni-Al2O3 coating prepared under high electrodeposition current density, resulting in more severe local peeling (Figure 1 h).
3.4 Corrosion resistance
The polarization curves of the Ni coated- and Ni-Al2O3 coated specimens prepared with different current densities of electrodeposition (Ec) were shown in Figure 5, and the fitted corrosion current density (icorr), self-corrosion potential (Ecorr), anodic slope (ba), cathodic slope (bc), and calculated polarization resistance (Rp) were shown in Table 2. Generally, the positive shift of self-corrosion potential indicates that a lower corrosion tendency [32], and a lower current density and larger polarization resistance means a higher corrosion resistance of specimen.
The polarization resistance was calculated according to the Stern-Geary formula (1) [33]:
For the uncoated substrate, the Ecorr was -0.584 V and the icorr was 4.36 × 10⁻⁶ A∙cm-2. Compared with the uncoated substrate, the Ecorr of the coated specimens was positively shifted to above -0.347 V and the icorr was reduced by 1 to 2 orders of magnitude. It means all coatings improved the corrosion resistance of the Q345 steels. With the increase of current density of electrodeposition, the icorr of the Ni coated- and Ni-Al2O3 coated specimens showed a same trend, i.e., first decreased and then increased. At 2.5 A/dm2 of current density for electrodeposition, the Ni coated- and Ni-Al2O3 coated specimens gained the most positive self-corrosion potential values of -0.245 V and -0.254 V, the minimum icorr values of 2.74 × 10⁻⁸ A∙cm-2 and 5.20 × 10⁻⁸ A∙cm-2, and the maximum Rp values of 626.99 kΩ∙cm2and 508.22 kΩ∙cm2, respectively. It infers that, at the optimum electrodeposition current density of 2.5 A/dm2, the Ni coated- and Ni-Al2O3 coated specimens exhibited the lowest corrosion tendency and the best corrosion resistance. This can be explained by the large thickness (Figure 1) and uniform structures without local spalling. After the electrodeposition current density reached 3.0 A/dm2, more voids in coating, agglomeration of the Al2O3 particle, and local spalling [24] increased the quantity of corrosion channels. That caused the coatings’ corrosion resistance declined.
However, compared with the Ni coated samples, under the same electrodeposition current density, the Ni-Al2O3 coated samples exhibited a larger corrosion current density. It indicates that the co-deposition of Al2O3 nanoparticles declined the corrosion resistance of Ni coating, and similar phenomena have also been observed in the literature [25,34,35]. Several studies regard that whether the incorporation of alumina nanoparticles can enhance the corrosion resistance of coating depends on their distribution within the coating [14,18]. In the well dispersed area of nano alumina particles, nano alumina particles serve as fillers to fill the pore defects in the coating, making the structure of the coating compacter and thus improving the corrosion resistance of the coating [25]. In the area where nanoparticles aggregate, the defects of the coating increase, leading to a decrease in its corrosion resistance [24,34]. In this paper, during the Ni-Al2O3 composite coating deposition, the nano-alumina particles disturbed the deposition of Ni and refined structure, however, the alumina particles locally agglomerated, as a result, the corrosion resistance of coating decreased.
Electrochemical impedance spectroscopy (EIS) was used to further evaluate the corrosion protection performance of coating. Figure 6 shows the Nyquist and Bode plots of the uncoated substrate, Ni coated- and Ni-Al2O3 composite coated specimens. The Nyquist diagrams of all specimens showed medium- and high frequencies capacitance arcs, indicating that the controlling step of the polarization process was the electrochemical step. In addition, a low-frequency inductance loop was observed for the uncoated substrate. In general, the larger capacitive arc means the better corrosion resistance of specimen [36,37]. In the frequency-impedance modulus curve, the plateau values in the high- and low frequency regions reflect the solution resistance of the electrochemical system and resistance of coating, respectively. Therefore, the larger difference of plateau values of the low-frequency region and high-frequency region reflects the larger polarization resistance of sample [38]. In the frequency-phase angle curve, a phase angle of -90° indicates that the coating is equivalent to an insulating layer with a high resistance value and low capacitance value. So, the phase angle is closer to -90° indicates the better protection of sample [39]. As shown in the Nyquist diagram (Figure 6 a), it can be seen that the capacitive arcs of the coated specimens were enhanced to different degrees compared with the substrate, indicating that the coatings provided different degrees of corrosion protection for the Q345 steel substrates. Compared with the Ni-Al2O3 composite coated samples, the Ni-coated specimen had the larger capacitance arcs (Figure 6 a), the larger difference of impedance modulus in the high- and low frequency regions (Figure 6 b), and the closer phase angles to -90° in the high frequency region (Figure 6 c), indicating that the Ni-coated specimen had better corrosion resistance, which is consistent with the polarization curve results.
Two capacitive arcs in all specimens at high and medium frequencies were corresponded to two time constants (Figure 6 c). Considering the structure of the coating and the EIS spectra, the impedance spectrum was analyzed and fitted by the equivalent circuits shown in Figure 7. The Q345 substrate was suitable for equivalent circuit Figure 7 a since it had an inductive arc at low frequencies, and the coated samples were suitable for equivalent circuit Figure 7 b. The constant phase element CPE was used to fit the EIS spectra instead of pure capacitance (the barrier properties of the bilayer capacitance to the solution at the coating/substrate interface), and its presence is due to the surface reaction, surface inhomogeneity, roughness, fractal geometry, electrode porosity, and current and potential distribution associated with the electrode geometry [40,41]. For the Q345 substrate, Rc represented the resistive properties of the oxide film on its surface. Table 3 shows the fitted results of the uncoated-, Ni coated- and Ni-Al2O3 coated specimens. The coating resistance Rc of the Ni-Al2O3 composite coating was lower than that of the Ni coating, which led to a decrease of the coating corrosion resistance [34]. The capacitance CPE1 of the Ni-Al2O3 composite coatings was slightly higher than that of the Ni coatings prepared at the same electrodeposition current density, which may be due to the surface roughness (Figure 1) or dielectric constant of the composite coatings were larger than that of the pure Ni coatings [40,41]. The CPE2 of the composite coatings was larger than that of the pure Ni coatings, which is caused by the increase of the active surface in the composite coatings [34]. It has been pointed out that the higher value of Rct means the better corrosion resistance of coating [42]. So, the lower Rct of the Ni-Al2O3 composite coatings than that of the Ni coatings prepared at the same current density referred that the Al2O3 second phase nanoparticles decreased the corrosion resistance of the coating due to more cracks, pores and other defects were formed in the coating, as previous description. Furthermore, the maximum values of Rct of the pure Ni coating (1410 kΩ∙cm2) and the composite coating (556 kΩ∙cm2) were obtained at the 2.5 A/dm2 of the electrodeposition current density. So, the two kinds of coatings gained the best corrosion resistance when 2.5 A/dm2 of the electrodeposition current density was used, this is consistent with the conclusion obtained from the previous polarization curves.
The optical micrograph of Ni coated- and Ni-Al2O3 coated specimens covered with the corrosion products after salt spray corrosion tests were shown in Figure 8. Compared with the uncoated substrate, the corrosion areas (with reddish-brown corrosion products) of the coated samples were significantly reduced by Ni coatings and composite coatings, indicating that all coatings provided effective corrosion protection for the Q345 steels.
The corrosion rate was calculated by formula (3):
where, V is the corrosion rate (g/h∙cm2), Δg is the quality difference (g) before and after salt spray corrosion test, s is the test area (cm2), and τ is the salt spray corrosion time (h). The corrosion rate of the substrate and Ni-coated and Ni-Al2O3 coated samples prepared at different electrodeposition current densities was shown in Figure 9. The substrate showed the maximum corrosion rate of 12.08 × 10⁻⁵ g/h∙cm2, it was significantly decreased by Ni coatings and Ni-Al2O3 coatings, and with the increase of electrodeposition current density, the corrosion rate of Ni coatings and Ni-Al2O3 coatings showed a same change trend of first decreasing and then increasing. Under 2.5 A/dm2 of electrodeposition current density, the minimum corrosion rates of Ni coatings and Ni-Al2O3 coatings obtained the minimum values of 1.51 × 10⁻⁵ g/h∙cm2 and 1.56 × 10⁻⁵ g/h∙cm2, respectively. Furthermore, the corrosion rate of Ni-Al2O3 composite coatings was slighter higher than that of Ni coatings prepared at the same current density, which indicates that the addition of Al2O3 nanoparticles second phase declined corrosion resistance of coatings. This is related to more defects caused by the coelectrodeposition of the Al2O3 particles.
4. Conclusion
The Ni coatings and Ni-Al2O3 composite coatings were prepared on the Q345 steels by electrodeposition. The effects of electrodeposition current density on the morphology, hardness, and corrosion resistance of the coatings were studied and compared:
(1) The electrodeposition current density affects the morphology of coatings. The Ni coatings showed a cellular structure. However, with the current density of electrodeposition increased, the Ni-Al2O3 composite coatings morphology gradually changed from granular structure to cellular structure. Except for local aggregation, nanoparticles were uniformly distributed in the coating. At the current density of 3.0 A/dm2 for electrodeposition, the Ni coating and Ni-Al2O3 composite coating showed local brittle spalling on the surface.
(2) With the increase of electrodeposition current density (below 2.5 A/dm2), the hardness and corrosion resistance of Ni coated- and Ni-Al2O3 coated samples increased, and then decreased with the increase of electrodeposition current density. At current density of 2.5 A/dm2 for electrodeposition, the maximum hardness values of Ni coatings and Ni-Al2O3 composite coatings were 293 ± 11 HV and 331 ± 9 HV, respectively, and the minimum corrosion current density values were 2.74 × 10⁻⁸ A∙cm-2 and 5.20 × 10⁻⁸, respectively.
(3) Compared with the Ni coatings, the Ni-Al2O3 composite coatings prepared at the same electrodeposition current density showed a thinner thickness and finer structure. The higher hardness was obtained due to the second phase strengthen and fine grain strengthening. However, the poorer corrosion resistance was attributed to more defects caused by the coelectrodeposition of the Al2O3 particles, leading to an increase in corrosion channels.
Funding
This work was supported by the Project for Returning from Studying Abroad of Sichuan University of Science and Engineering(2023RC24), Provincial Key Lab of Process Equipment and Control (GK202302), Sichuan Provincial Science and Technology Plan Project (2022YFSY0036) and Graduate Innovation Fund of Sichuan University of Science & Engineering (y2021030).
References
- Pa, F.; Zhang, J.; Chen, H.-L.; Kuo, C.-L.; Su, Y.-H.; Chen, S.-H.; Lin, K.-J.; Hsieh, P.-H.; Hwang, W.-S. Effects of Rare Earth Metals on Steel Microstructures. Materials 2016, 9, 417. [Google Scholar]
- Gerengi, H.; Sahin, H.I. Schinopsis lorentzii Extract As a Green Corrosion Inhibitor for Low Carbon Steel in 1 M HCl Solution. Journal of Industrial & Engineering Chemistry 2012, 780–787. [Google Scholar]
- Bazant, Z.P. Physical model for steel corrosion in concrete sea structures—theory. Journal of Structural Divison 1979, 105, 1138–1153. [Google Scholar]
- Xu, W.; Han, E.H.; Wang, Z. Effect of tannic acid on corrosion behavior of carbon steel in NaCl solution. Journal of Materials Science & Technology 2019, 64–75. [Google Scholar]
- Cabrera, J.G. Deterioration of concrete due to reinforcement steel corrosion. Cement & Concrete Composites 1996, 18, 47–59. [Google Scholar]
- Shakoor, R.A.; Kahraman, R.; Waware, U.S.; Wang, Y.; Gao, W. Synthesis and properties of electrodeposited Ni–B–CeO2 composite coatings. Materials & Design 2014, 59, 421–429. [Google Scholar]
- Yuxin; Wang; Xin; Shu; Shanghai; Wei; Chuming; Liu; Wei; Gao. Duplex Ni–P–ZrO2/Ni–P electroless coating on stainless steel. Journal of Alloys & Compounds 2015, 630, 189–194. [CrossRef]
- Shakoor, R.A.; Kahraman, R.; Waware, U.; Wang, Y.; Wei, G. Properties of electrodeposited Ni–B–Al2O3 composite coatings. Materials and Design 2014, 64, 127–135. [Google Scholar] [CrossRef]
- Sheu, H.H.; Huang, P.C.; Tsai, L.C.; Hou, K.H. Effects of plating parameters on the Ni–P–Al2O3 composite coatings prepared by pulse and direct current plating. Surface & Coatings Technology 2013, 235, 529–535. [Google Scholar]
- Narayanan, T.; Krishnaveni, K.; Seshadri, S.K. Electroless Ni–P/Ni–B duplex coatings: preparation and evaluation of microhardness, wear and corrosion resistance. Materials Chemistry & Physics 2003, 82, 771–779. [Google Scholar]
- Wang, L.; Yan, G.; Liu, H.; Xue, Q.; Tao, X. Effects of bivalent Co ion on the co-deposition of nickel and nano-diamond particles. Surface & Coatings Technology 2005, 191, 1–6. [Google Scholar]
- Shrestha, N.K.; Masuko, M.; Saji, T. Composite plating of Ni/SiC using azo-cationic surfactants and wear resistance of coatings. Wear 2003, 254, 555–564. [Google Scholar] [CrossRef]
- Wei; Wang; and; Feng-Yan; Hou; and; Hui; Wang; and; He-Tong. Fabrication and characterization of Ni–ZrO2 composite nano-coatings by pulse electrodeposition. Scripta Materialia 2005, 53, 613–618. [CrossRef]
- Alirezaei, S.; Monirvaghefi, S.M.; Saatchi, A.; ürgen, M.; Kazmanl?, K. Novel investigation on tribological properties of Ni–P–Ag–Al2O3 hybrid nanocomposite coatings. Tribology International 2013, 62, 110–116. [Google Scholar] [CrossRef]
- Zhou, G.H.; Ding, H.Y.; Zhou, F.; Zhang, Y. Structure and Mechanical Properties of Ni-P-Nano Al_2O_3 Composite Coatings Synthesized by Electroless Plating. Journal of Iron and Steel Research International 2008, 15, 65–69. [Google Scholar]
- Chen, L.; Wang, L.; Zeng, Z.; Zhang, J. Effect of surfactant on the electrodeposition and wear resistance of Ni–Al2O3 composite coatings. Materials Science and Engineering: A 2006, 434, 319–325. [Google Scholar] [CrossRef]
- Goral, A.; Beltowska-Lehman, E.; Indyka, P. Structure characterization of Ni/Al2O3 composite coatings prepared by electrodeposition. Solid State Phenomena 2010, 163, 64–67. [Google Scholar] [CrossRef]
- Gül, H.; Kılıc, F.; Aslan, S.; Alp, A.; Akbulut, H. Characteristics of electro-co-deposited Ni–Al2O3 nano-particle reinforced metal matrix composite (MMC) coatings. Wear 2009, 267, 976–990. [Google Scholar] [CrossRef]
- Szczygieł, B.; Kołodziej, M. Composite Ni/Al2O3 coatings and their corrosion resistance. Electrochim. Acta 2005, 50, 4188–4195. [Google Scholar] [CrossRef]
- Góral; Anna. Nanoscale structural defects in electrodeposited Ni/Al 2 O 3 composite coatings. Surface and Coatings Technology 2017, 319, 23–32. [CrossRef]
- Karthikeyan, S.; Ramamoorthy, B. Effect of reducing agent and nano Al2O3 particles on the properties of electroless Ni–P coating. Appl. Surf. Sci. 2014, 307, 654–660. [Google Scholar] [CrossRef]
- Wang, R.; Sawada, H.; Nan, W.; Jian, N. Preparation of Ni-P-Al2O3 Composite Film on Mild Steel with High Resistances to Corrosion and Wear. Materials ence Forum 2013, 750, 31–35. [Google Scholar] [CrossRef]
- 胡佳宇; 陈金龙; 陈龙; 李少鹏; 黄登皓; 陈子昂; 陈华建; 谢文玲. 电镀电流密度对Al2O3-Ni复合镀层的耐蚀性影响. 广东化工 2023, 50, 24–26, 55. [Google Scholar]
- Gáliková, Z.; Chovancová, M.; Danielik, V. Properties of Ni-W alloy coatings on steel substrate. Chemical Papers 2006, 60, 353–359. [Google Scholar] [CrossRef]
- Ghaziof, S.; Gao, W. The effect of pulse electroplating on Zn–Ni alloy and Zn–Ni–Al2O3 composite coatings. Journal of Alloys & Compounds 2015, 622, 918–924. [Google Scholar]
- Mitsuo, K. Electrodeposited Co–Ni–Al2O3composite coatings. Surface and Coatings Technology 2004, 176, 157–164. [Google Scholar]
- Li, C.; Wang, L.; Zeng, Z.; Zhang, J. Effect of surfactant on the electrodeposition and wear resistance of Ni–Al2O3 composite coatings. Materials Science and Engineering A 2006, 434, 319–325. [Google Scholar]
- Feng, Q.; Li, T.; Yue, H.; Kai, Q.; Bai, F.; Jin, J. Preparation and characterization of nickel nano-Al 2O 3 composite coatings by sediment co-deposition. Applied Surface Science 2008, 254, 2262–2268. [Google Scholar] [CrossRef]
- Shafiee, Z.; Bahrololoom, M.E.; Hashemi, B. Electrodeposition of nanocrystalline Ni/Ni–Al2O3 nanocomposite modulated multilayer coatings. Materials & Design 2016, 19–26. [Google Scholar]
- Kucharska, B.; Poplawski, K.; Oleszak, D.; Jezierska, E.; Sobiecki, J. Influence of stirring conditions on Ni/Al2O3nanocomposite coatings. Surface Engineering 2016, 32, 457–463. [Google Scholar] [CrossRef]
- Husen, J.; Qi, L.; Jin, W.; Xiaolian, W.; Peng, Z.; Shufeng, S. Effect of Substrate Hardness and Coating Thickness on the Hardness of AlCrN. Material Protection and Surface Engineering 2017, 38, 2401–2404. [Google Scholar]
- Zhao, W.M.; Wang, Y.; Han, T.; Wu, K.Y.; Xue, J. Electrochemical evaluation of corrosion resistance of NiCrBSi coatings deposited by HVOF. Surface & Coatings Technology 2004, 183, 118–125. [Google Scholar]
- Cui, X.-J.; Ning, C.-M.; Shang, L.-L.; Zhang, G.-A.; Liu, X.-Q. Structure and anticorrosion, friction, and wear characteristics of Pure Diamond-Like Carbon (DLC), Cr-DLC, and Cr-H-DLC films on AZ91D Mg alloy. Journal of Materials Engineering and Performance 2019, 28, 1213–1225. [Google Scholar] [CrossRef]
- Szczygie, B.; Ko?Odziej, M. Composite Ni/Al2O3 coatings and their corrosion resistance. Electrochimica Acta 2005, 50, 4188–4195. [Google Scholar] [CrossRef]
- Babak; Bakhit; Alireza; Akbari. Effect of particle size and co-deposition technique on hardness and corrosion properties of Ni–Co/SiC composite coating. Surface & Coatings Technology 2012, 206, 4964–4975. [CrossRef]
- Zhang, D.; Wei, B.; Wu, Z.; Qi, Z.; Wang, Z. A comparative study on the corrosion behaviour of Al, Ti, Zr and Hf metallic coatings deposited on AZ91D magnesium alloys. Surface and Coatings Technology 2016, 303, 94–102. [Google Scholar] [CrossRef]
- Cui; Xue-jun; Gong; Min; Liu; Chun-hai; Zheng; Xing-wen; Lin; Xiu-zhou. Fabrication and corrosion resistance of a hydrophobic micro-arc oxidation coating on AZ31 Mg alloy. Corrosion Science 2015, 90, 402–412. [CrossRef]
- Yang, Z.; Wang, R.-q.; Liu, C.; Wu, Y.-k.; Wang, D.-d.; Liu, X.-t.; Zhang, X.-z.; Wu, G.-r.; Shen, D.-j. The electrochemical corrosion behavior of plasma electrolytic oxidation coatings fabricated on aluminum in silicate electrolyte. Journal of Materials Engineering and Performance 2019, 28, 3652–3660. [Google Scholar] [CrossRef]
- Jianqing, Z.; Chunan, C. Study and evai_uation on organic coatings by eijectrochemicai impedance spectroscopy. Corrosion and Protection 1998, 19(3), 99–104. [Google Scholar]
- Cai, J.; Cao, F.; Chang, L.; Zheng, J.; Zhanga, J.; Cao, C. The preparation and corrosion behaviors of MAO coating on AZ91D with rare earth conversion precursor film. Applied Surface Science 2011, 257, 3804–3811. [Google Scholar] [CrossRef]
- RAMMELT, U.; REINHARD*, G. On the applicability of a constant phase element (CPE) to the estimation of roughness of solid metal electrodes. Electrochimica Acta 1990, 35, 1045–1049. [Google Scholar] [CrossRef]
- Ranganatha, S.; Venkatesha, T.V.; Vathsala, K. Development of electroless Ni–Zn–P/nano-TiO 2 composite coatings and their properties. Applied Surface Science 2010, 256, 7377–7383. [Google Scholar] [CrossRef]
Figure 1.
Surface and cross-sectional SEM morphologies of (a-d) Ni coatings and (e-h) Ni-Al2O3 composite coatings prepared with current densities of (a, e) 1.5 A/dm2, (b, f) 2.0 A/dm2, (c, g) 2.5 A/dm2, (d, h) 3.0 A/dm2.
Figure 1.
Surface and cross-sectional SEM morphologies of (a-d) Ni coatings and (e-h) Ni-Al2O3 composite coatings prepared with current densities of (a, e) 1.5 A/dm2, (b, f) 2.0 A/dm2, (c, g) 2.5 A/dm2, (d, h) 3.0 A/dm2.
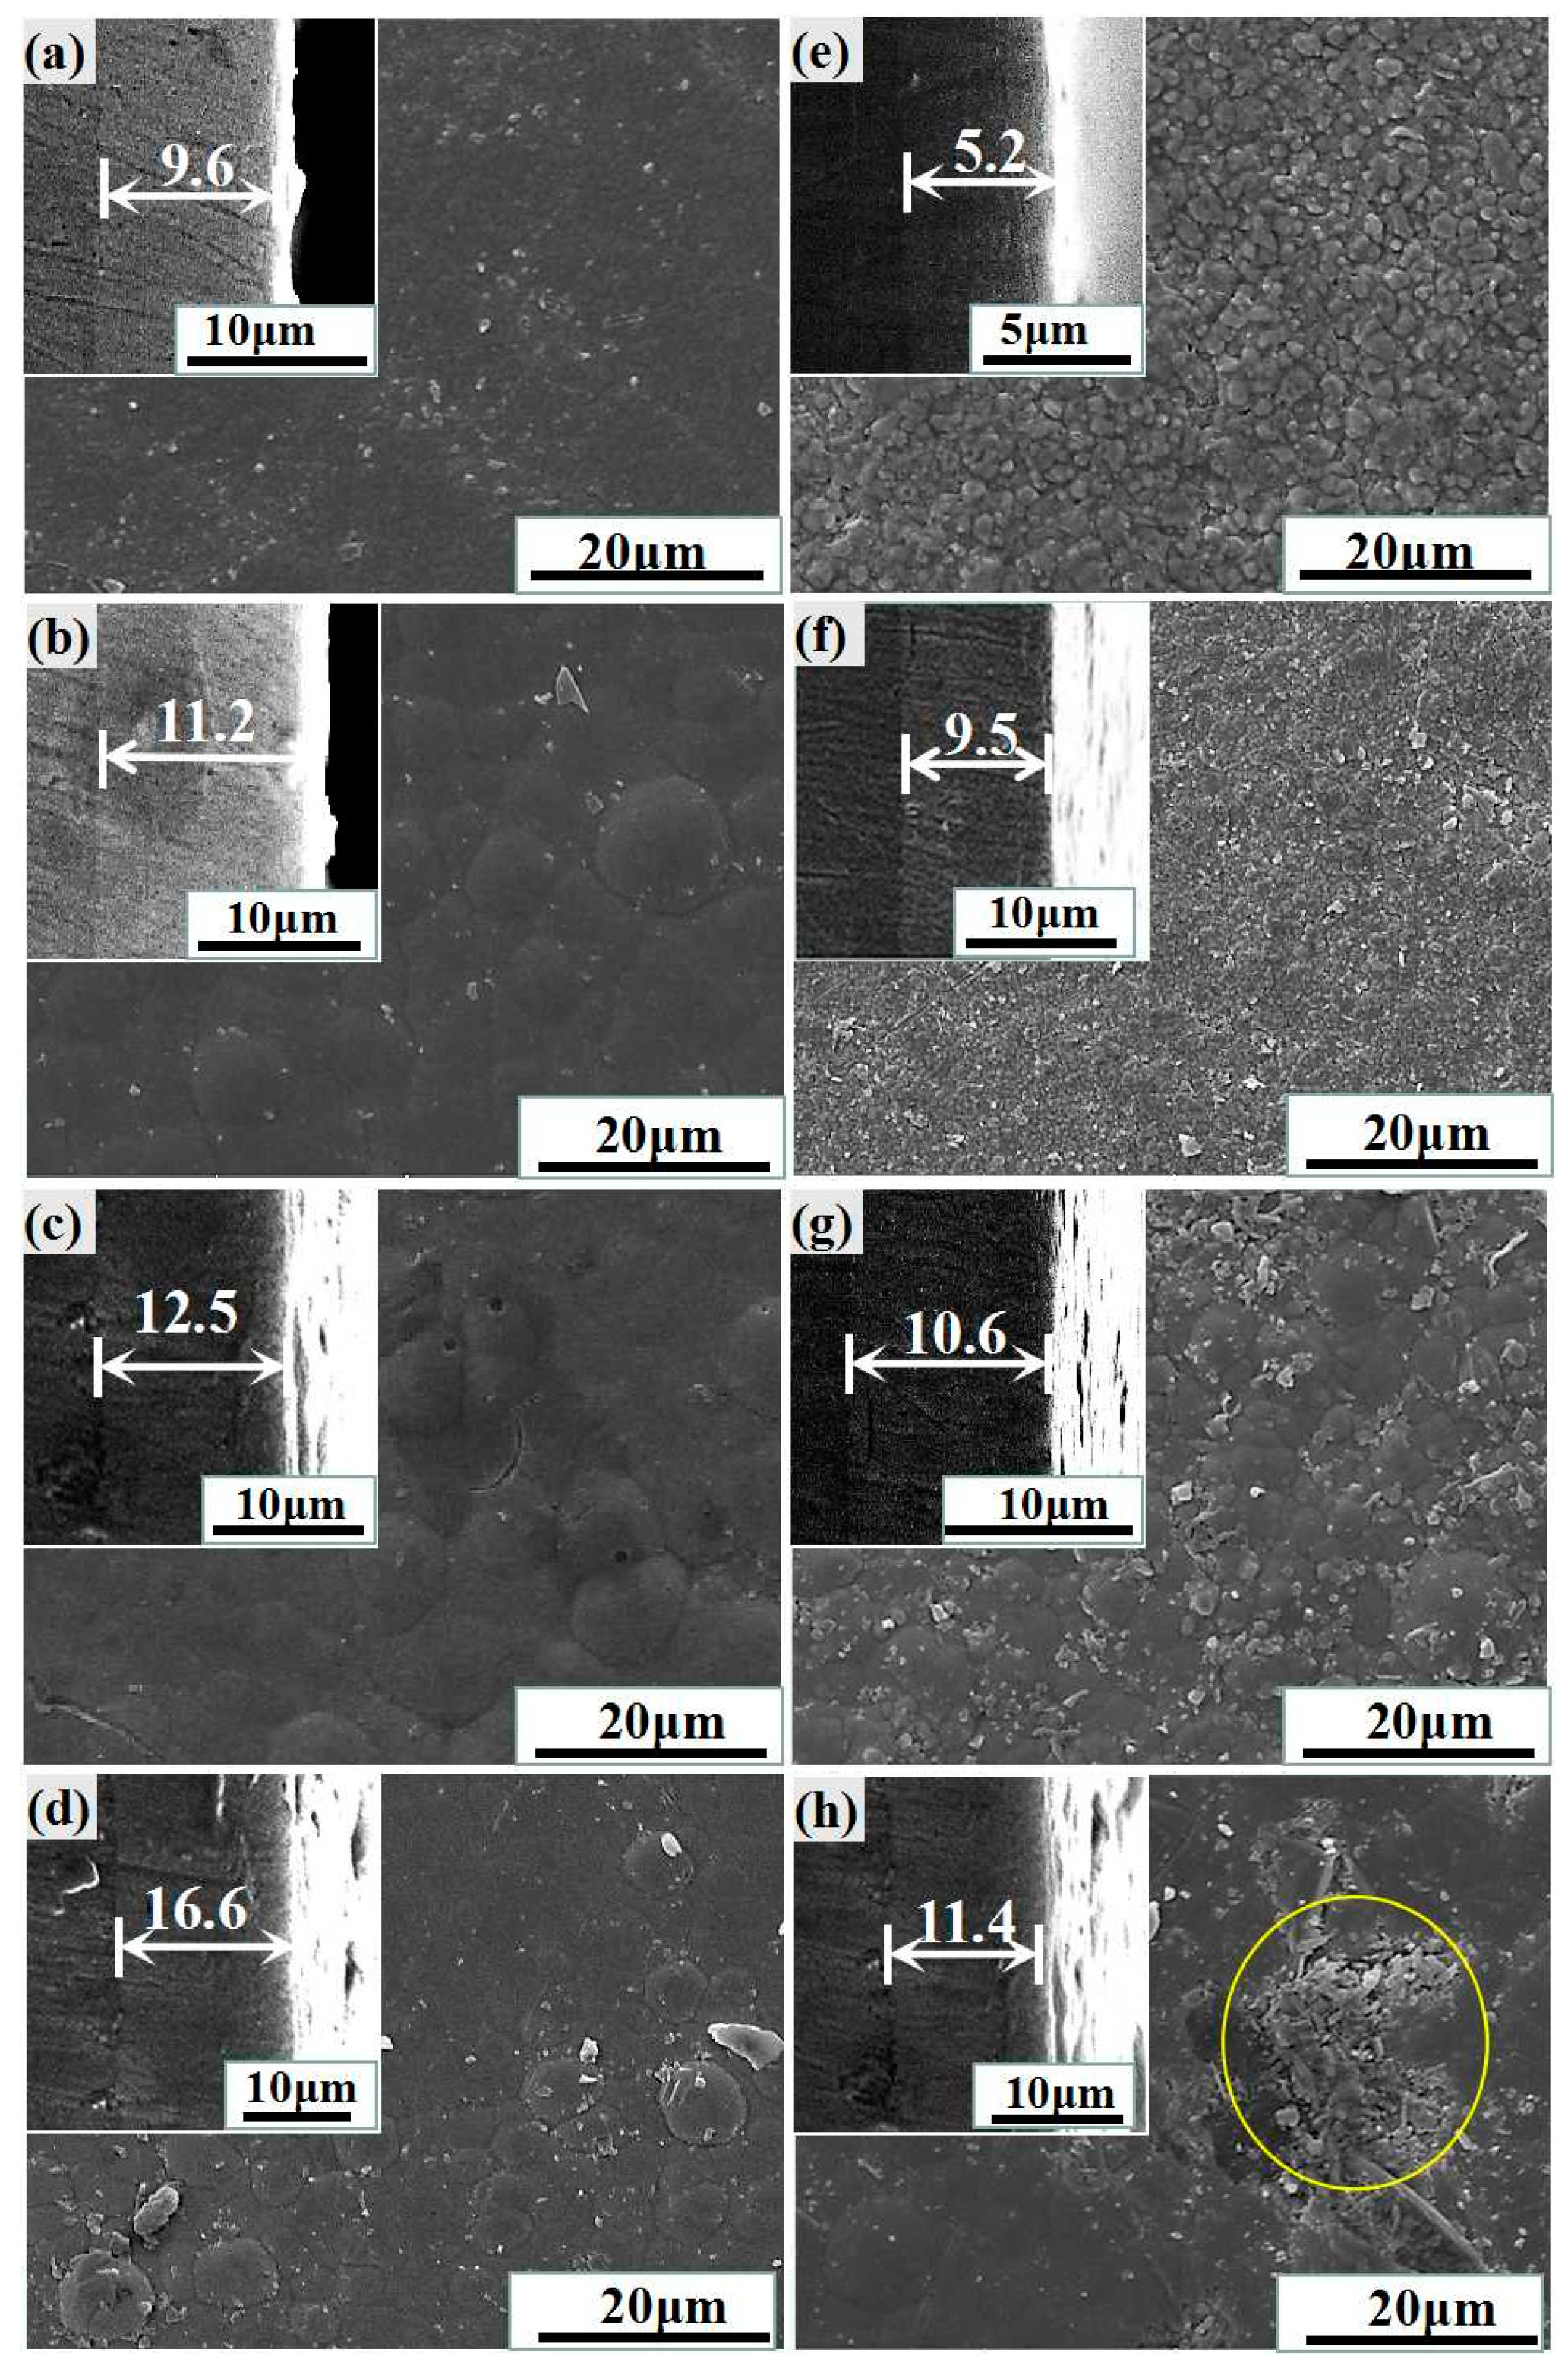
Figure 2.
(a) Backscattering surface morphology and mapping spectra of (b) Ni, (c) O, and (d) Al elements of Ni-Al2O3 composite coating.
Figure 2.
(a) Backscattering surface morphology and mapping spectra of (b) Ni, (c) O, and (d) Al elements of Ni-Al2O3 composite coating.
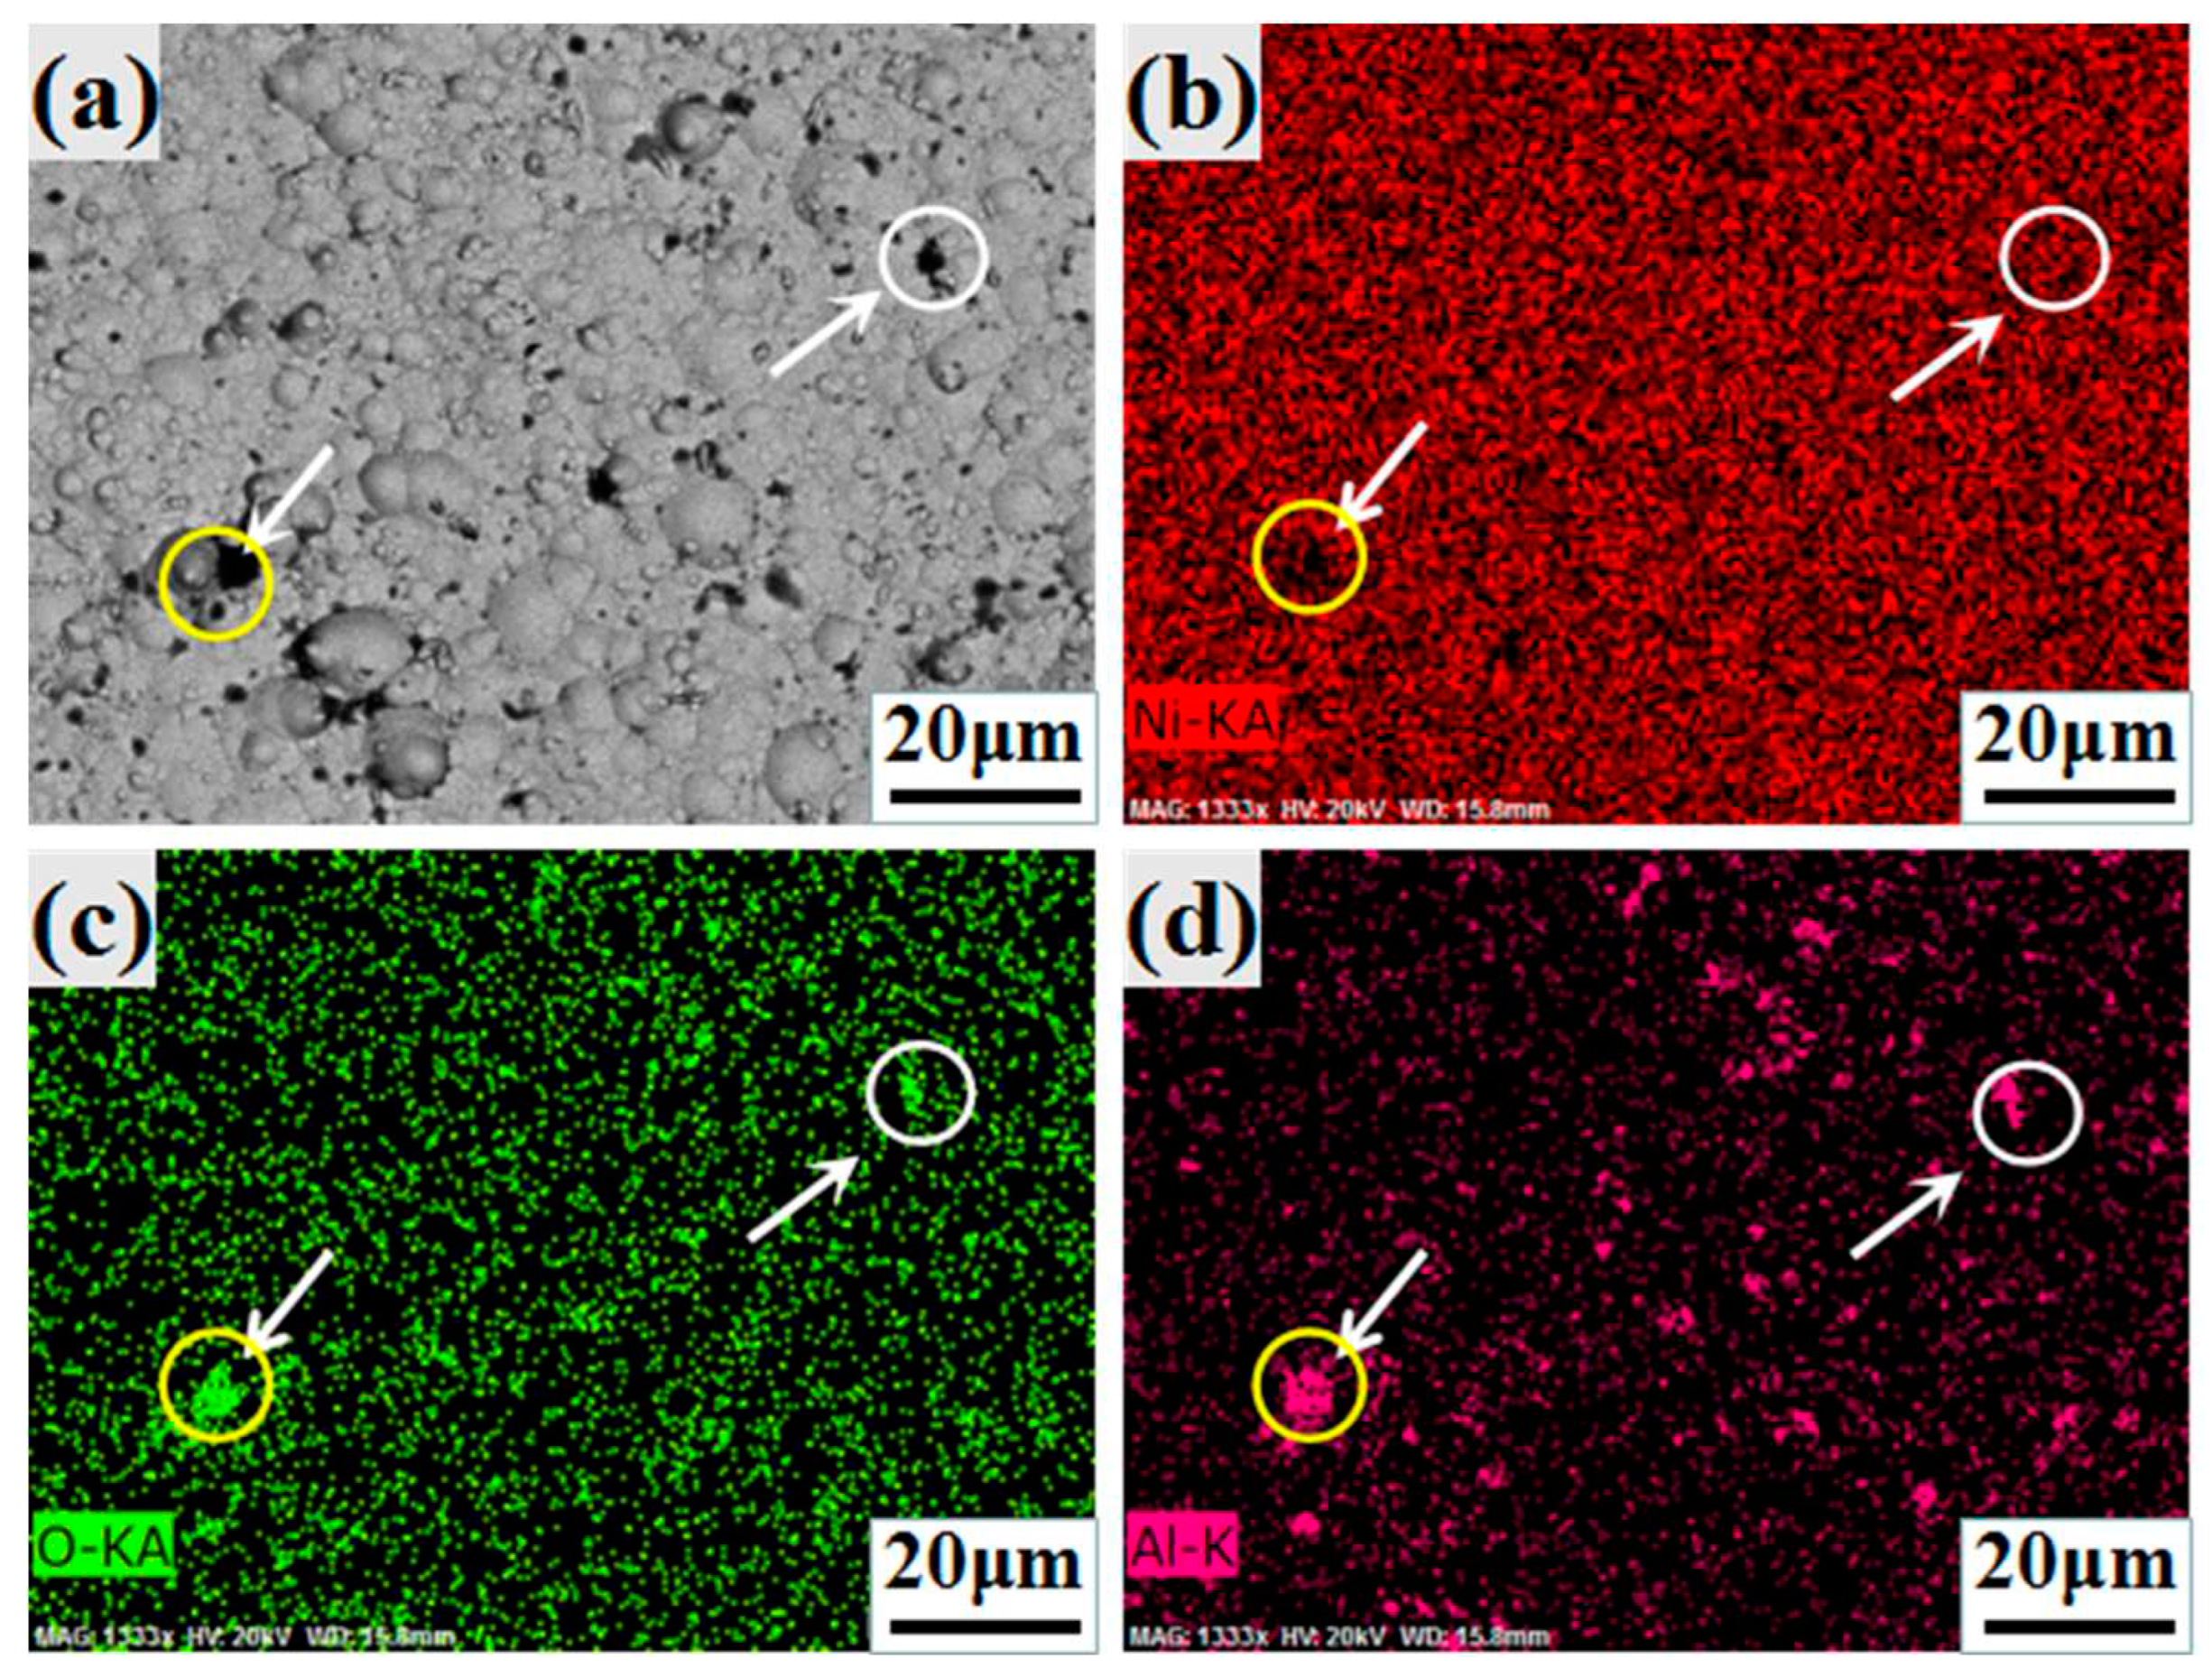
Figure 3.
XRD of Ni/Ni-Al2O3 composite coating at different electrodeposition current density.
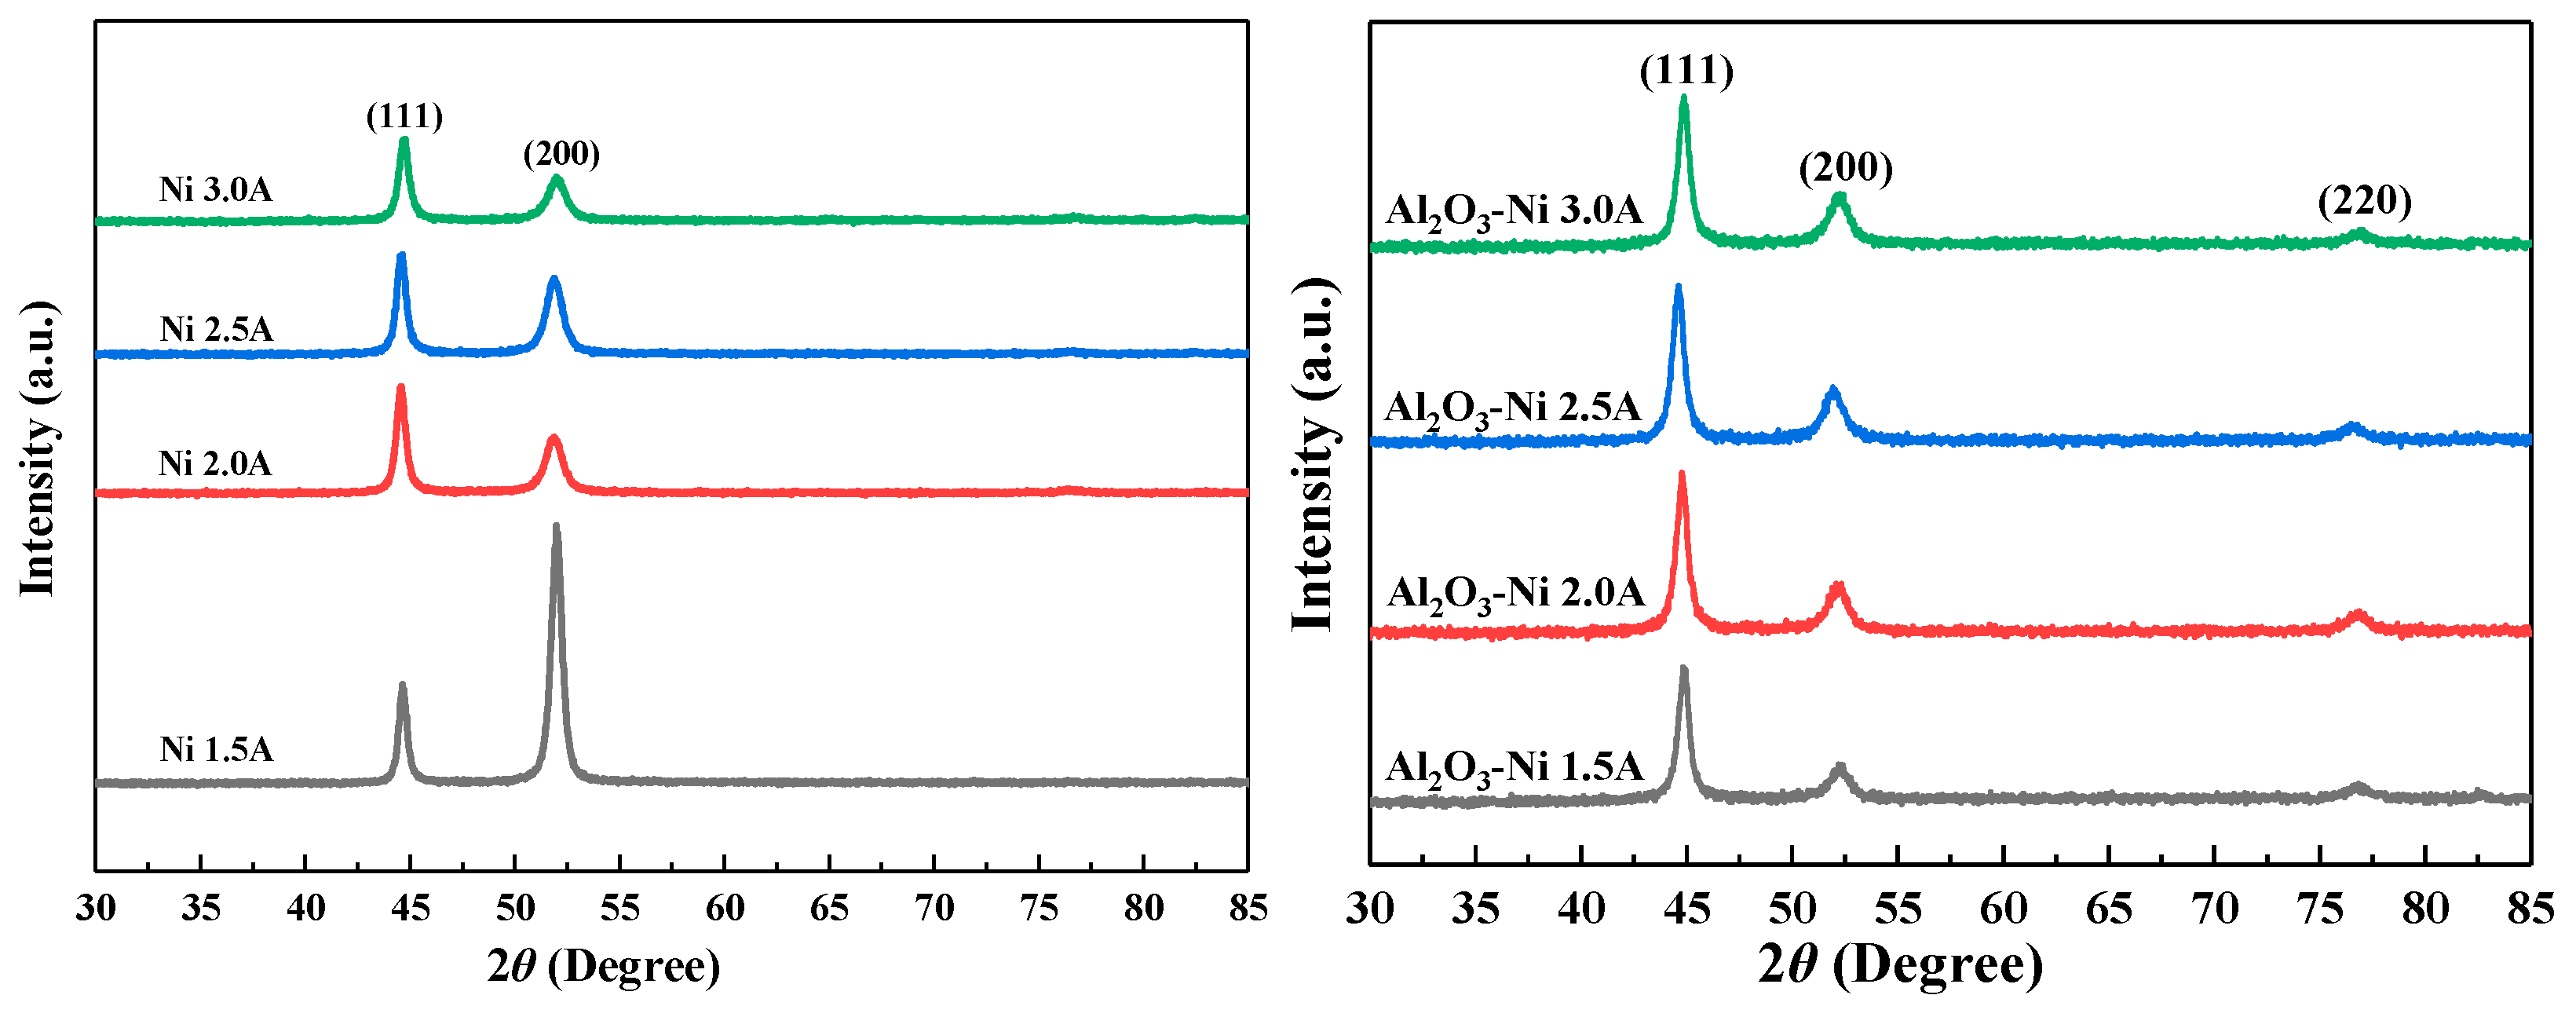
Figure 4.
Vickers hardness of Ni / Al2O3 Ni coating at different currents.
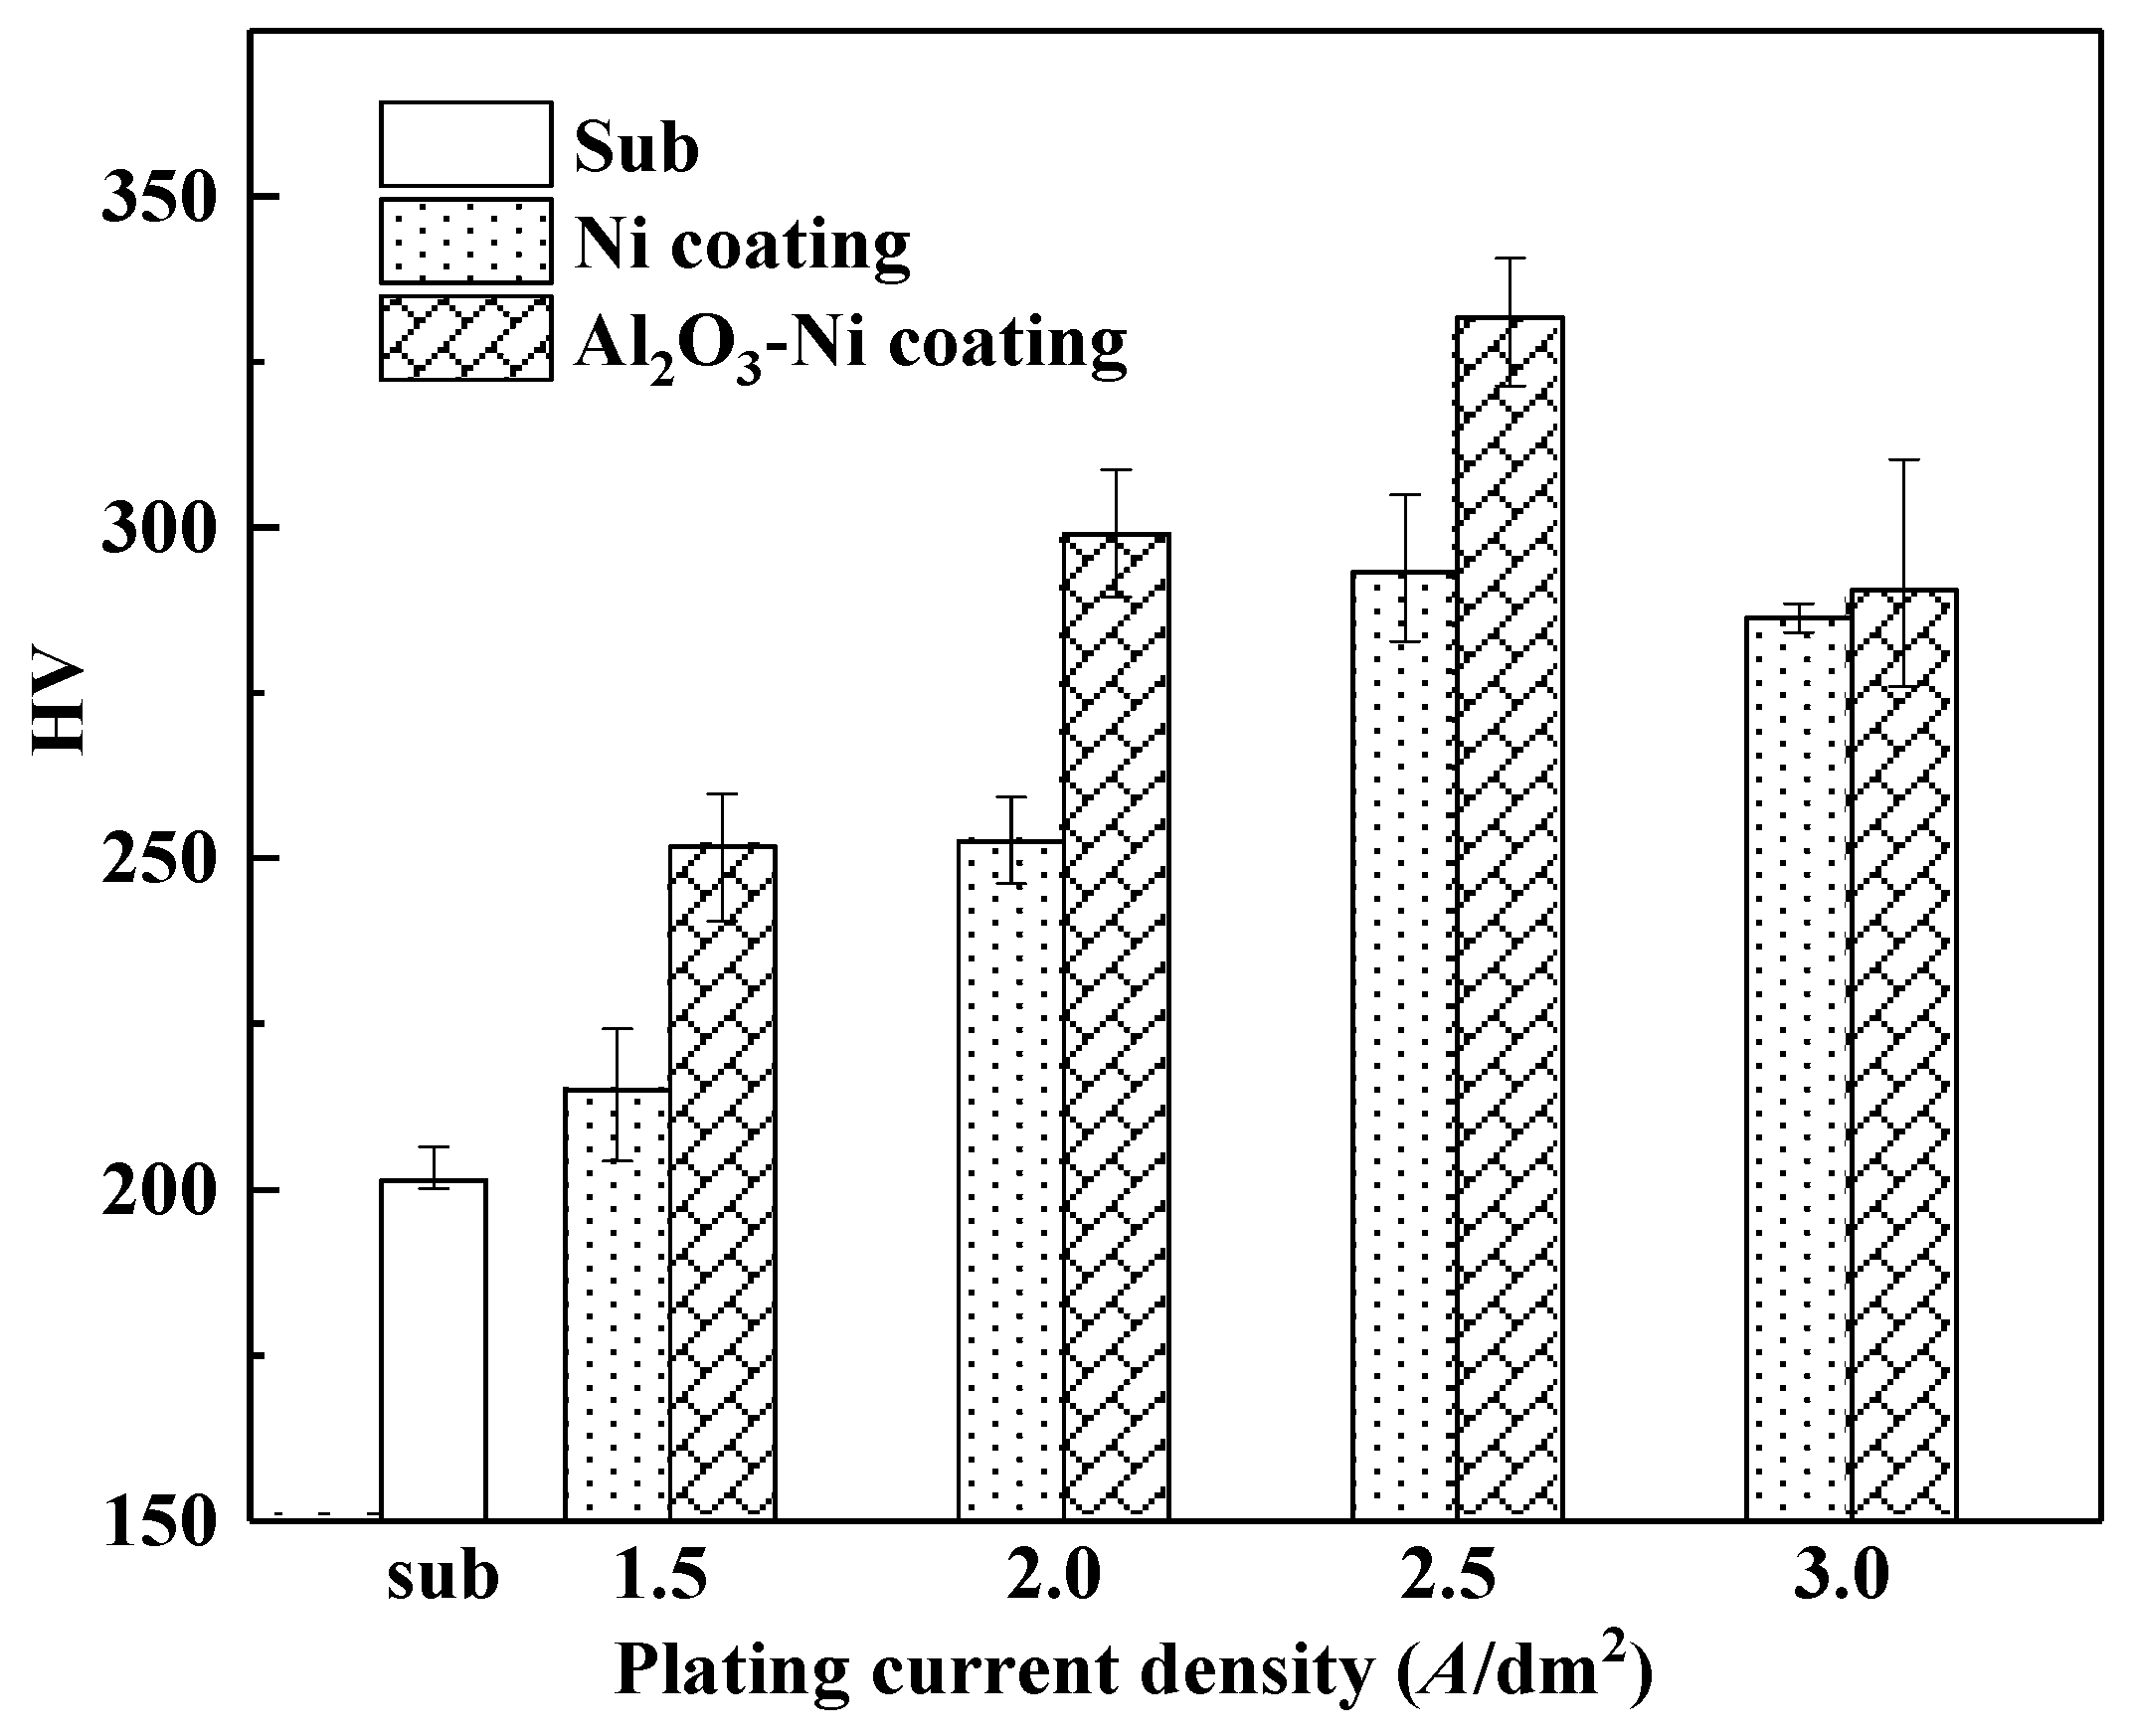
Figure 5.
Potentiodynamic polarization curves of (a) substrate, (b) nickel coated- and (c) Ni-Al2O3 composite coated samples.
Figure 5.
Potentiodynamic polarization curves of (a) substrate, (b) nickel coated- and (c) Ni-Al2O3 composite coated samples.
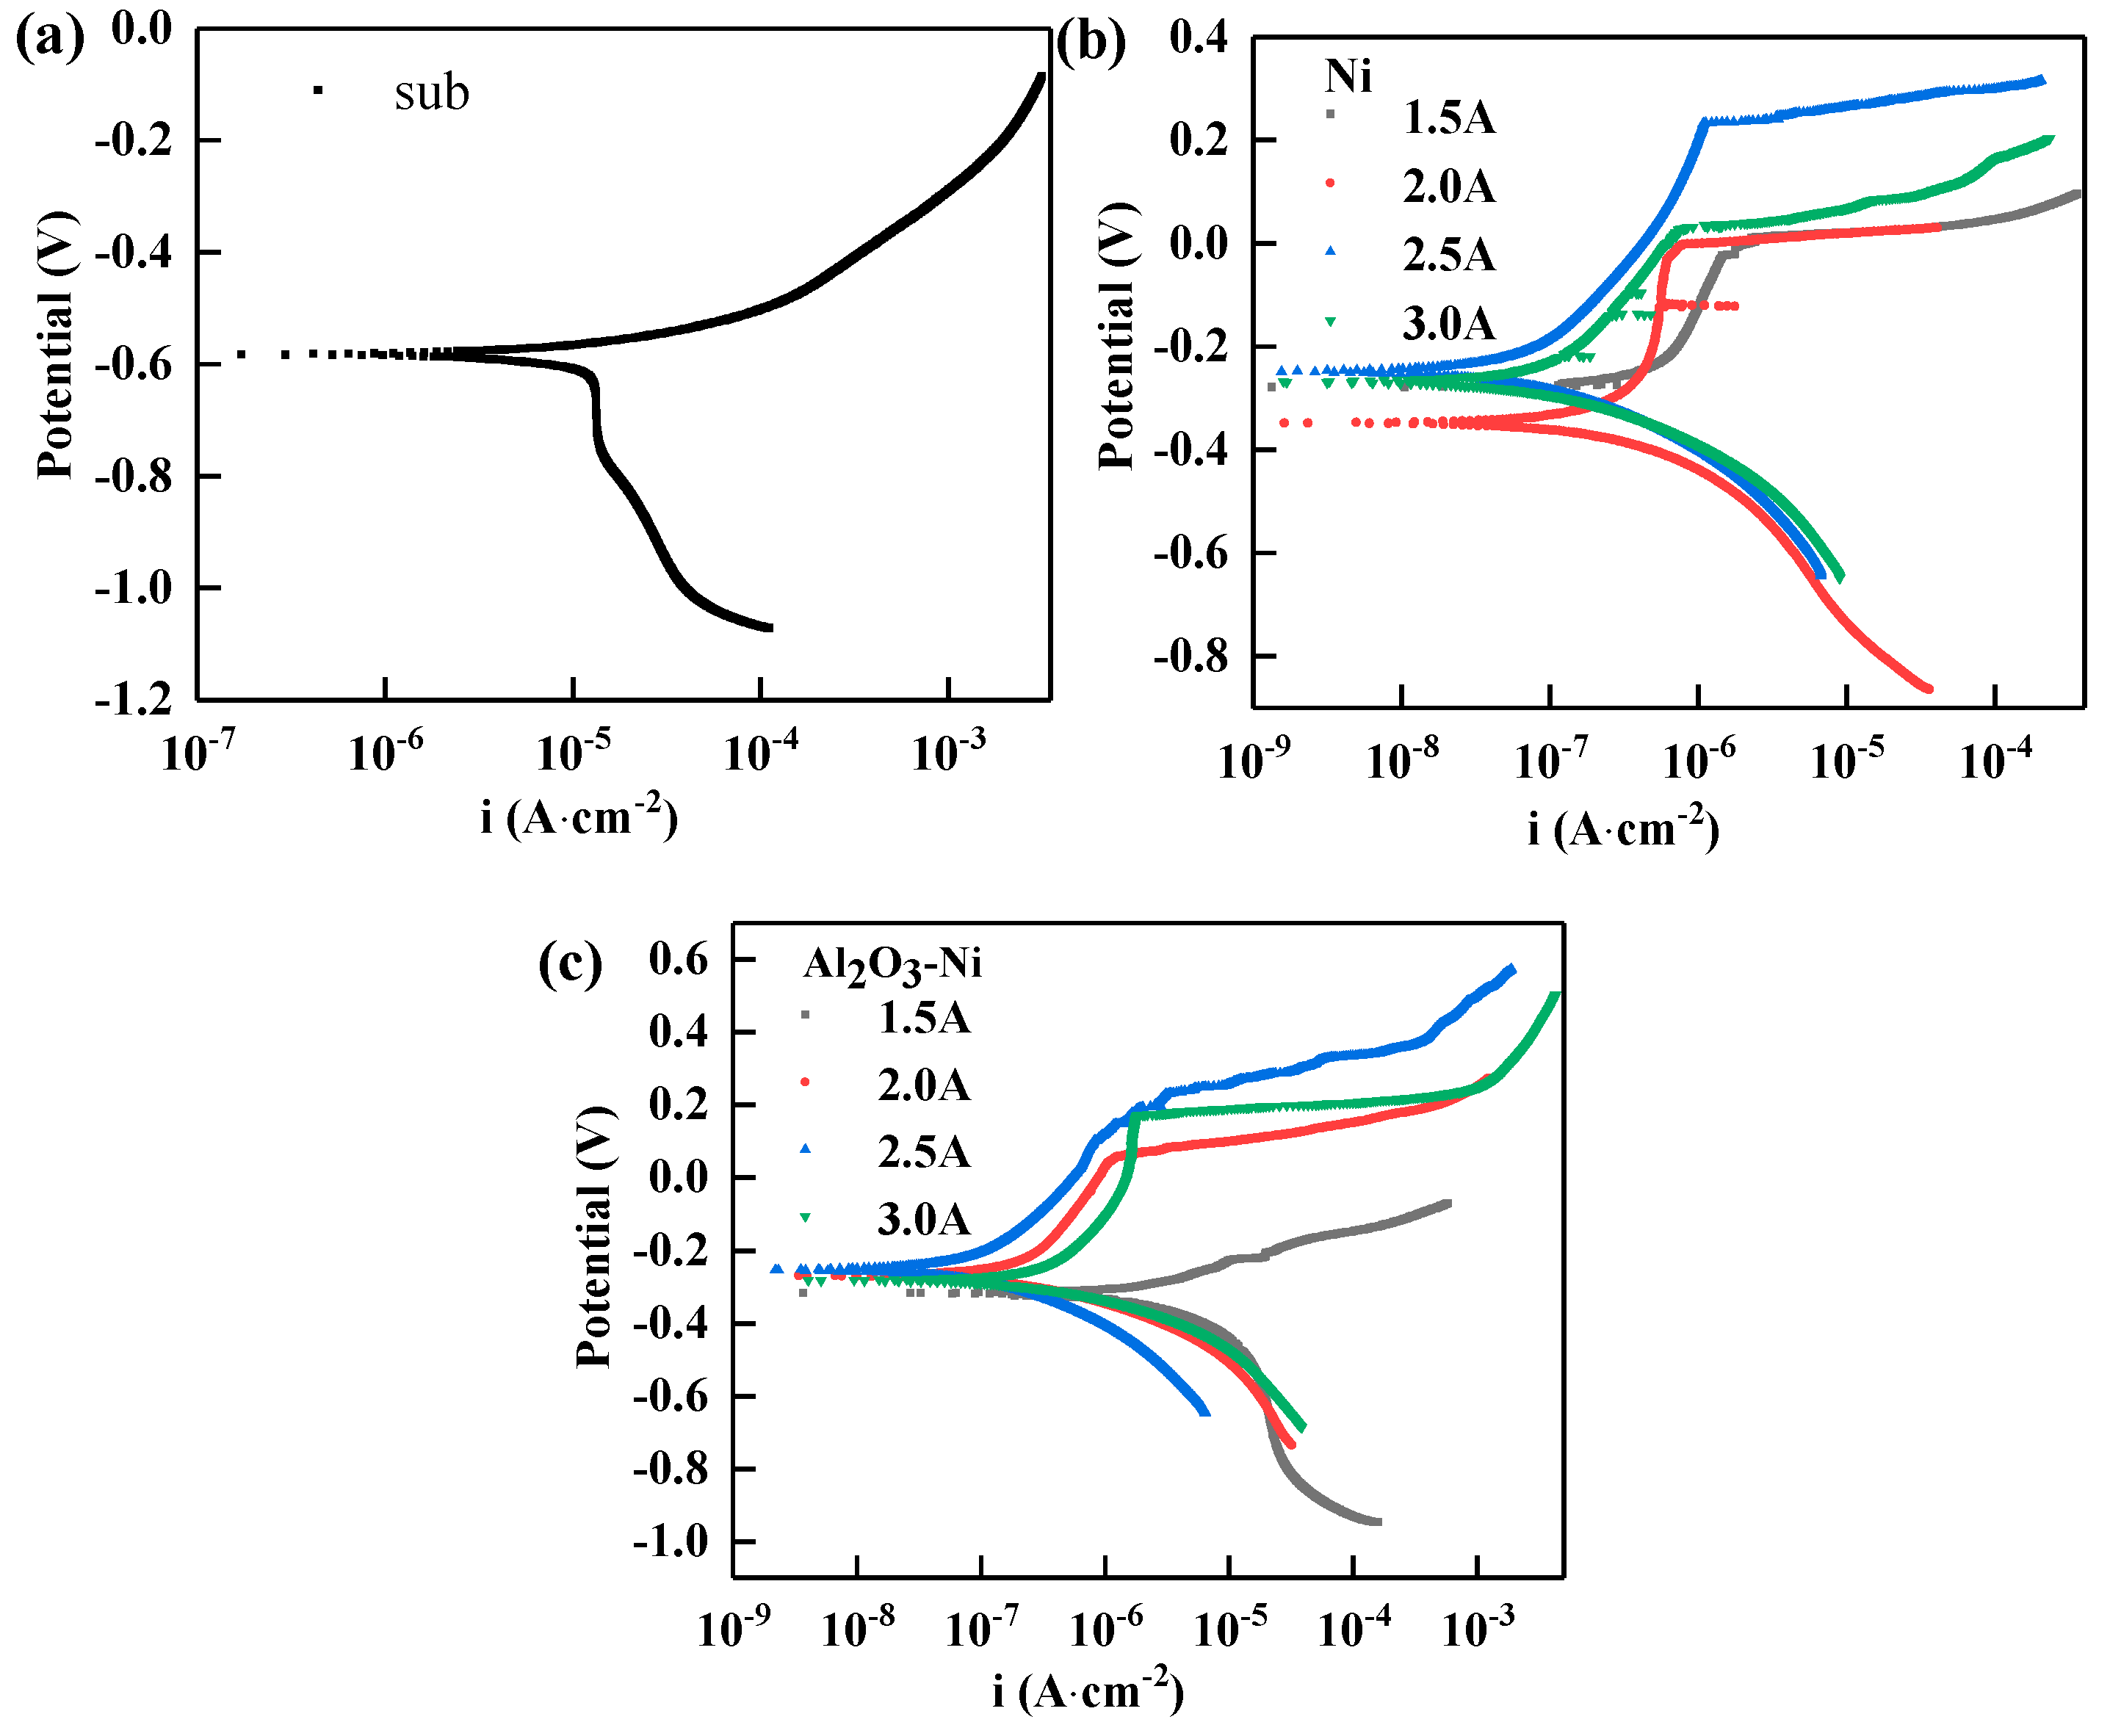
Figure 6.
Matrix, Ni coating and Al2O3 Ni composite coating in 3.5% sodium chloride solution (a) Nyquist Figure (b) Bode frequency impedance modulus Figure (c) Bode frequency phase angle Fig.
Figure 6.
Matrix, Ni coating and Al2O3 Ni composite coating in 3.5% sodium chloride solution (a) Nyquist Figure (b) Bode frequency impedance modulus Figure (c) Bode frequency phase angle Fig.

Figure 7.
Equivalent circuit diagram for (a) uncoated- and (b) coated samples.
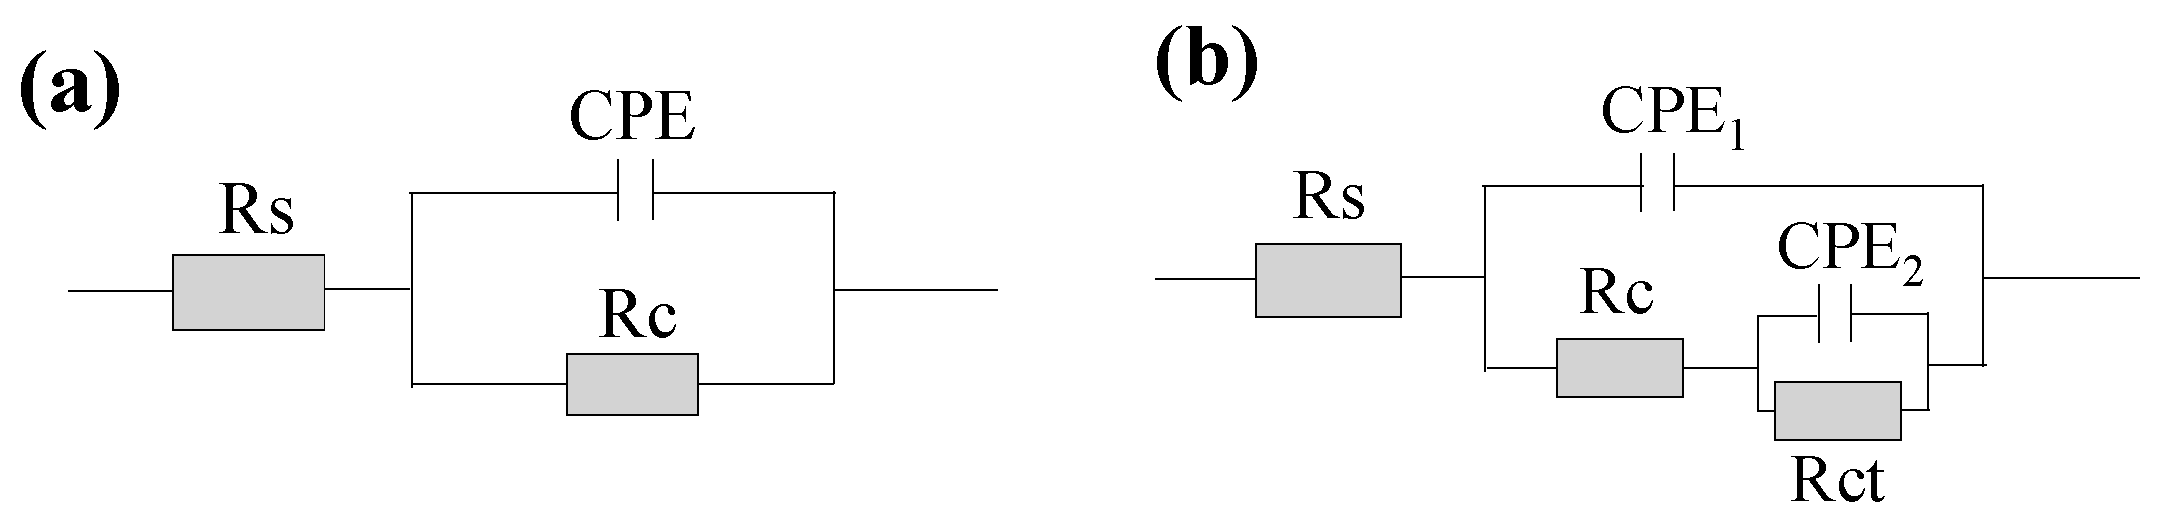
Figure 8.
Optical topography of (a) uncoated-, (b-e) Ni coated-, and (f-i) Ni-Al2O3 coated samples prepared with electrodeposition current density of (b, f) 1.5 A/dm2, (c, g) 2.0 A/dm2, (d, h) 2.5 A/dm2, (h, i) 3.0 A/dm2 after 48 h salt spray corrosion.
Figure 8.
Optical topography of (a) uncoated-, (b-e) Ni coated-, and (f-i) Ni-Al2O3 coated samples prepared with electrodeposition current density of (b, f) 1.5 A/dm2, (c, g) 2.0 A/dm2, (d, h) 2.5 A/dm2, (h, i) 3.0 A/dm2 after 48 h salt spray corrosion.
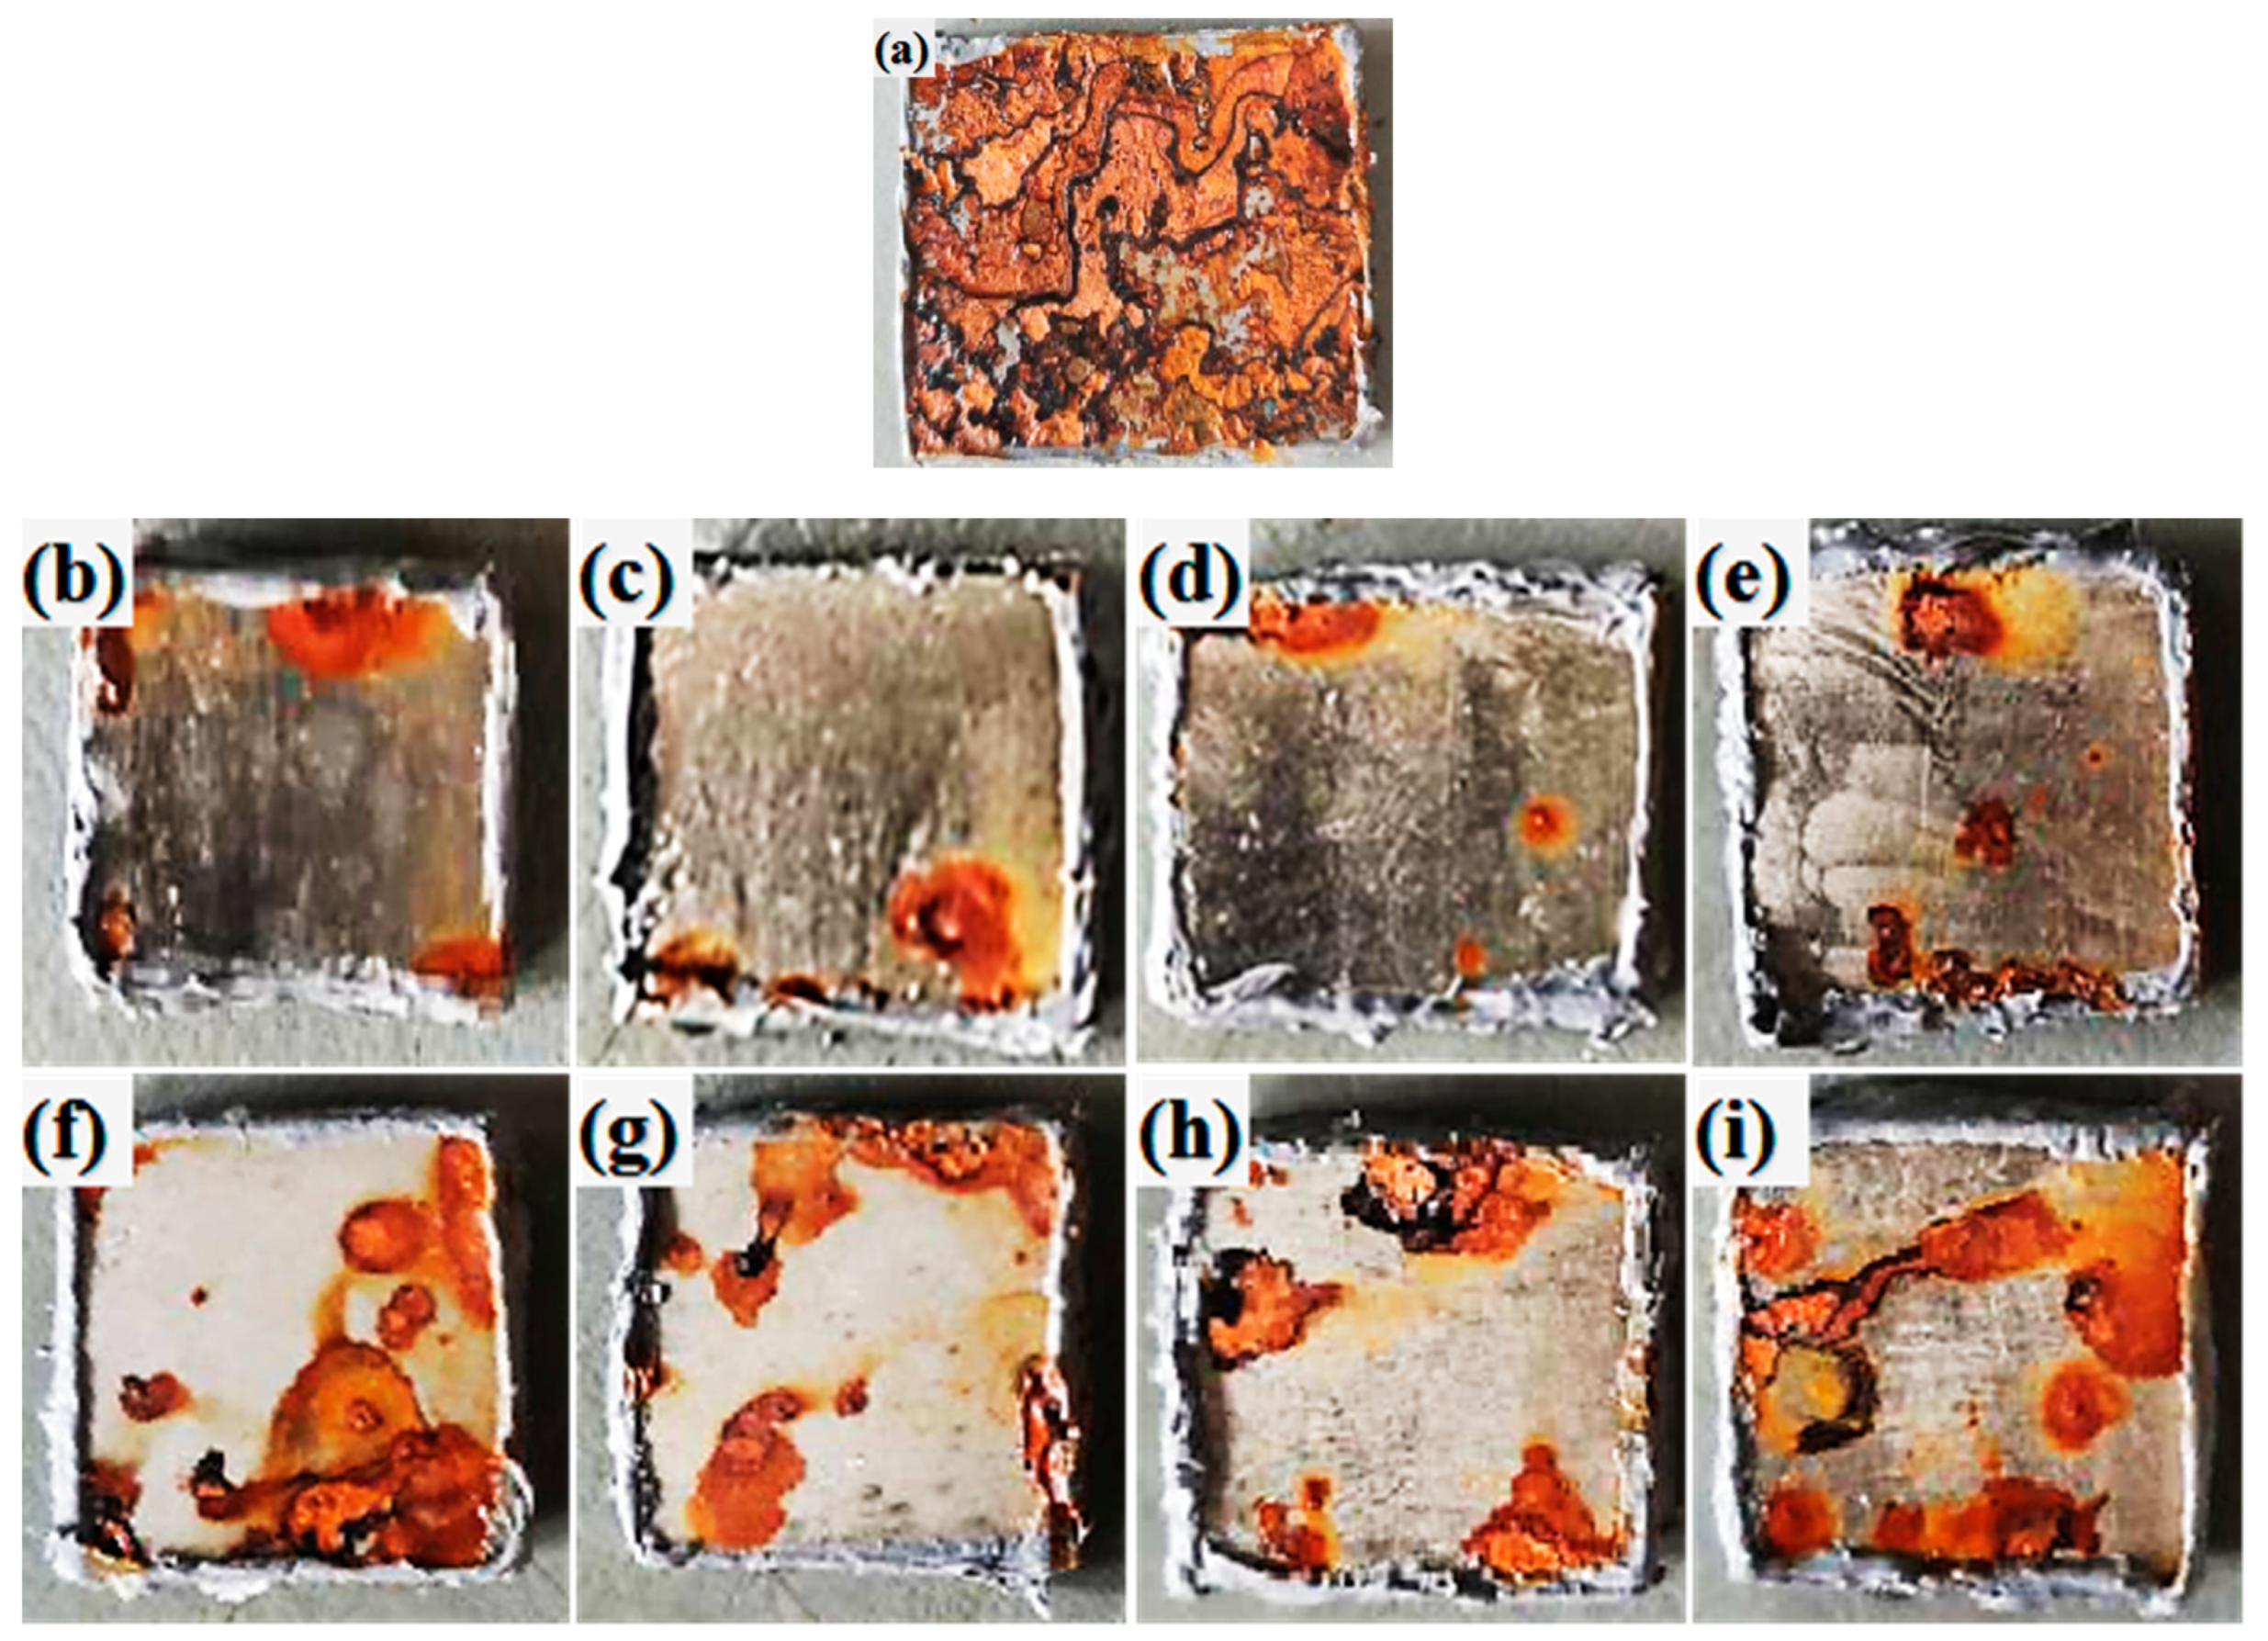
Figure 9.
Corrosion rate of substrate and Ni-coated and Ni-Al2O3 coated samples prepared with different electrodeposition current densities.
Figure 9.
Corrosion rate of substrate and Ni-coated and Ni-Al2O3 coated samples prepared with different electrodeposition current densities.


Table 1.
Compositions of solution and parameters of electrodeposition.
| Compositions | Ni coatings | Ni-Al2O3 coatings |
|---|---|---|
| Ni2SO4·6H2O (g/L) | 26 | 26 |
| NiCl2·6H2O (g/L) | 23 | 23 |
| Boric acid (H3BO3) (g/L) | 30 | 30 |
| Alumina (Al2O3) (g/L) | 0 | 10 |
| Stabilizer | Balance | Balance |
| pH | 4.0-4.2 | 4.0-4.2 |
| Temperature (℃) | 40 | 40 |
| Stirring speed (rpm) | 300 | 300 |
| Current density (A/dm²) | 1.5, 2.0, 2.5, 3.0 | 1.5, 2.0, 2.5, 3.0 |
| Electrodeposition time (h) | 0.5 | 0.5 |
Table 2.
Fitted data according to Figure 5.
Table 2.
Fitted data according to Figure 5.
| Sample |
Ec (A/dm2) |
ba (mV/dec) |
-bc (mV/dec) |
icorr (A∙cm-2) |
Ecorr (V) |
Rp (kΩ∙cm2) |
|---|---|---|---|---|---|---|
| Substrate | 44.98 | 67.01 | 4.36×10⁻⁶ | -0.584 | 2.68 | |
| Ni coated samples | 1.5 | 107.06 | 59.86 | 2.10×10⁻⁷ | -0.278 | 79.34 |
| 2.0 | 69.02 | 56.87 | 6.98×10⁻⁸ | -0.347 | 193.93 | |
| 2.5 | 88.29 | 71.66 | 2.74×10⁻⁸ | -0.245 | 626.99 | |
| 3.0 | 102.92 | 63.69 | 4.10×10⁻⁸ | -0.269 | 417.08 | |
| Ni-Al2O3 coated samples | 1.5 | 64.33 | 80.18 | 8.68×10⁻⁷ | -0.319 | 17.86 |
| 2.0 | 187.88 | 90.58 | 1.77×10⁻⁷ | -0.268 | 147.34 | |
| 2.5 | 166.42 | 95.87 | 5.20×10⁻⁸ | -0.254 | 508.22 | |
| 3.0 | 190.91 | 77.87 | 2.08×10⁻⁷ | -0.283 | 115.31 |
Table 3.
Fitting results of impedance spectrum of the uncoated-, Ni coated- and Ni-Al2O3 coated samples by equivalent circuits of Figure 7 in 3.5% sodium chloride solution.
Table 3.
Fitting results of impedance spectrum of the uncoated-, Ni coated- and Ni-Al2O3 coated samples by equivalent circuits of Figure 7 in 3.5% sodium chloride solution.
| coating |
Ec (A∙dm-2) |
Rs (Ω∙cm2) |
CPE1 (μF∙cm-2) |
Rc (kΩ∙cm2) |
CPE2 (μF∙cm-2) |
Rct (kΩ∙cm2) |
|---|---|---|---|---|---|---|
| Sub | 11.42 | 4.56 | 1.48 | |||
| Ni | 1.5 | 10.36 | 3.25 | 1.01 | 2.33 | 1080 |
| 2.0 | 6.25 | 1.99 | 2.56 | 2.14 | 1320 | |
| 2.5 | 11.63 | 2.41 | 5.38 | 3.28 | 1410 | |
| 3.0 | 22.31 | 1.23 | 0.87 | 2.19 | 881 | |
| Ni-Al2O3 | 1.5 | 14.31 | 3.21 | 0.19 | 6.78 | 108 |
| 2.0 | 11.8 | 7.27 | 0.33 | 4.96 | 541 | |
| 2.5 | 8.14 | 2.01 | 0.34 | 3.72 | 556 | |
| 3.0 | 5.18 | 4.86 | 0.13 | 7.29 | 280 |
Disclaimer/Publisher’s Note: The statements, opinions and data contained in all publications are solely those of the individual author(s) and contributor(s) and not of MDPI and/or the editor(s). MDPI and/or the editor(s) disclaim responsibility for any injury to people or property resulting from any ideas, methods, instructions or products referred to in the content. |
© 2024 by the authors. Licensee MDPI, Basel, Switzerland. This article is an open access article distributed under the terms and conditions of the Creative Commons Attribution (CC BY) license (http://creativecommons.org/licenses/by/4.0/).
Copyright: This open access article is published under a Creative Commons CC BY 4.0 license, which permit the free download, distribution, and reuse, provided that the author and preprint are cited in any reuse.


