
Submitted:
19 January 2024
Posted:
22 January 2024
You are already at the latest version
Abstract
Background: School meals represent a significant supply of nutrients for children in Brazil, especially those in conditions of social vulnerability. Objectives: This study aimed to assess the levels of arsenic (As), cadmium (Cd), and lead (Pb) in meals served in public elementary schools in four municipalities in the state of Bahia, Brazil, and assess the risk posed to children's health. Methods: Ninety-six samples were collected from 16 schools, freeze-dried, and subjected to microwave-assisted digestion. The As, Cd, and Pb levels were determined by graphite furnace atomic absorption spectrometry. The risk assessment was based on calculating each element's hazard quotient (HQ). Results: None of the samples reached or exceeded the tolerable levels for the elements analyzed. Pb was the metal that obtained the most significant result, reaching maximum levels of 39-157 µg.kg-¹. Conclusions: No element exceeded the PTWI proposed by JECFA; thus, the toxic metal content in school meals poses a negligible risk to children´s health.
Keywords:
School meals
; Toxic metals
; Inorganic contaminants
; School-children
; Risk assessment
; Food security
1. Introduction
Food was, and still is, a matter of individual and collective concern, considered a fundamental need to guarantee survival, and is the responsibility of individuals, communities, and states [1].
Because of this need, the School Meals Campaign was set up in Brazil in the 1950s, and after several improvement processes, it was renamed the National School Feeding Program (PNAE) in 1979. The PNAE aims to contribute to growth and biopsychosocial development, learning, school performance, and the formation of healthy eating habits. The program also aims to promote food and nutrition education and provide meals that cover part of the nutritional needs during the school term, serving mainly socially vulnerable children and offering a fundamental source of nutrients and energy [2,3].
The implementation of this program in the country took place at the same time as the term Food Safety (FS) emerged in the world. Although FS mainly guarantees access to food and nutritional quality, it also encompasses its biological and sanitary quality [4,5]. Although most incidents related to food contamination are associated with biological risks, food contamination by inorganic contaminants has become a growing problem, mainly due to the development of new technologies and the inadequate disposal of toxic waste by large industries [1,6].
Children may suffer repeated exposure to these toxic elements, as they often put their hands to their mouths, and even in small quantities, they can trigger health risks [7,8]. Children also have physiological factors that facilitate intoxication by these elements, as they are in the midst of a growth phase. In addition, they consume more significant quantities of food per kilogram of body weight when compared to adults, absorption in their gastrointestinal tract is faster, and their renal system is still immature [8]. Metals such as cadmium (Cd) and lead (Pb) have an affinity for the kidneys and bones [9], respectively, having long half-lives of 10 - 30 years, making them significant exposure sources for unborn children due to remobilization during pregnancy and breast-feeding [6].
The International Agency for Research on Cancer (IARC) has classified arsenic (As), organic and inorganic, as a Group 1 Human Carcinogen [10]; despite being a metalloid, it is classified as a toxic element regardless of its mass [11]. Also, according to the IARC, lead is a probable human carcinogen (Group 2), and an increase in blood concentration from 0.5 to 5.0 μg/dL can reduce children´s IQ scores by up to 8.6 points [12,13,14]. Concerning Cd, Chandravanshi et al. (2015), in a review study on the toxic effects of this inorganic contaminant, recorded several findings for neuropsychological changes in children, especially in the early stages of life, which can cause cognitive dysfunctions, cancer, and nephrotoxicity.
Several studies carried out in Brazil and around the world have shown the presence of inorganic elements such as As, Cd, and Pb in foods consumed by the general population and in foods for children, mainly in rice, rice products, cereals, fish and crustaceans [16,17].
Few studies have quantified the presence of inorganic elements in meals served to school children. A study conducted in Chile found As levels below the Provisional Tolerable Intake (PTI) established by the FAO in meals from 65 schools [17]. In Brazil, a research was carried out with meals offered to pre-schoolers, and the results indicated that there were no concentrations of As and Cd that could, at the time, cause harm to children [18]. Another study conducted in Brazil analyzed the presence of As, Cd, and Pb in samples of meals from daycare centers in São Paulo, where high levels of blood Pb had previously been found in children from these institutions [19]. Also, no values higher than those stipulated by the European Union were found in that study.
Therefore, research must be carried out to understand and generate data on the state of chemical contamination by inorganic elements in the meals served to schoolchildren. Given the above, this study aimed to assess the levels of inorganic elements (As, Cd, and Pb) in school meals offered in four municipalities in Bahia, Brazil, and the risk of exposure to these toxic elements.
2. Materials and Methods
A descriptive study was carried out with a quantitative approach, collecting data and samples of school meals from public primary education institutions in 16 schools in four municipalities in Bahia, Brazil.
2.1. Study Area
In their article, França et al. [20] investigated the composition of essential elements in meals served to schoolchildren in the municipalities of Jaguaripe, Brumado, and Jacobina (Figure 1). In these municipalities, the authors collected 72 samples of the meals served in four schools in each of the municipalities in the two school semesters of 2016. The mineralized samples were stored at room temperature in the Toxicology Laboratory of the Federal University of Bahia (UFBA).
In order to assess the possible impact of environmental contaminants on communities with a greater propensity for social vulnerability, a list of elementary schools in outlying neighborhoods was obtained from the Salvador Municipal Department of Education. Thus, four schools located in the Railway Suburb were selected, where the most socially vulnerable population lives and the inclusion criteria were the schools with the highest number of students enrolled that year.
Data from the 2015 school census show that the municipality of Brumado had 84% of school-age children enrolled in municipal schools served by the PNAE, Jacobina had 71%, Jaguaripe had a total of 95% [20] and Salvador had 60.7% of children enrolled in municipal educational institutions [21]. Thus, there is a significant representation of children served by the PNAE who are potentially exposed to any contaminants in the meals served. Supplementary Table S1 shows a more detailed characteristic of the municipalities included in the study.
2.2. Sample Planning and Collection Technique
The same technique used by França et al. [20] was used to assess students’ daily intake. An identical portion of food and drink served to the study population was collected on three alternate days in the first and second semesters of 2019 in four schools in the municipality of Salvador, in addition to the samples collected in the previous study.
The visits took place without prior scheduling, allowing for reliable collection of the actual conditions of the schools. The samples were collected and packed in an unrefrigerated isothermal box and transported to the Toxicology Laboratory, where they were weighed on an analytical balance (CP2245 Sartorius®, Germany) and homogenized in an industrial blender (regardless of their consistency). They were then packed in polypropylene tubes, previously decontaminated with 10% HNO3, and stored in an ultra-freezer (Quimis®, Q315U-33, São Paulo, Brazil) at -33oC until mineralization processing.
2.3. Microwave-Assisted Mineralization
After being removed from the ultra-freezer, a small amount of each sample was subjected to moisture analysis using the methodology of the Adolf Lutz Institute (IAL) [22]. The rest was subjected to freeze-drying (Liotop L101 Freeze-dryer, São Paulo, Brazil); freeze-dried material was ground in a mortar using a porcelain pistil until a homogeneous powder was obtained. Next, about 0.2500 g of each sample was weighed on an analytical balance (CP2245 Sartorius®, Germany) directly into the Teflon® tubes of the digester oven and recorded to the fourth decimal place. Subsequently, 4.0 mL of ultrapure concentrated nitric acid (J.T. Baker®, Philipsburg, USA) and 1.0 mL of hydrogen peroxide (Suprapur Grade, Merck®, Darmstadt, Germany) were added.
After 15 min at room temperature, the Teflon® tubes were sealed and placed in the microwave-assisted digester oven (CEM, Mars 6®, Matthews, USA), using the standard program for food digestion, whose specifications were: power 900-1800W, temperature: 210°C, pressure (psi): 800, ramp time: 20 - 25 minutes, digestion time: 15 minutes and cooling of 15 min.
After cooling to room temperature, the mineralized samples, including reagent blanks and certified reference materials (CRMs) used for quality control purposes, were volumetrically transferred to polypropylene graduated tubes and volumetrically filled to 10 mL with ultrapure water (Merck-Millipore®, Billerica, USA).
2.4. Determination of Toxic Elements
Graphite furnace atomic absorption spectrometry (GF AAS) was used to determine the inorganic contaminants using a Varian spectrometer (Spectra AA 240FGZ, Mulgrave Victoria, Australia). A calibration curve was used for Pb at concentrations of 0.2, 0.4, 10, 16, and 20 μg/L at a wavelength of 283.3 nm and a lamp current of 10 mA. For Cd, a curve was used at concentrations of 0.05. 1.0, 2.0, and 4.0 μg/L, at a wavelength of 228.8 nm and a lamp current of 4 mA. For As determination, the standard addition technique was used, and the equipment was programmed to add to each sample and control two concentration values (30 µg/L and 60 µg/L) from a standard solution of 100 µg/L at a wavelength of 193.7 nm and a lamp current of 10 mA. The concentration results in mass/volume were transformed into mass/mass units by multiplying the concentration in µg/L by the final volume of the mineralized material (0.01 L) and dividing by the weighed dry mass of the sample (~0.250 g) after subtracting the average from the metal levels in the reagent blanks. Then, the concentration of metals was corrected for the moisture content of the samples and then expressed in wet mass (mg.kg-1 wet weight). All the food samples were analyzed in duplicate, expressing the average values.
2.5. Analytical Quality Assurance
For quality assurance purposes, two certified reference materials (CRM) were used: Apple Leaves (NIST - 1515) and Spinach Leaves (NIST - 1570a) (National Institute of Standards and Technology, Gaithersburg, Maryland, USA). The method’s precision was calculated based on the coefficient of variation of eight replicates (four in one week and four the following week), analyzed on the same apparatus by the same analyst. Accuracy (Relative Error - RE) was calculated by the difference between the value obtained from the CRM and the certified value, and then divided by the certified value from the CRM. Finally, the result was expressed as a percentage after being multiplied by 100. The reagent blanks were analyzed in eight replicates to calculate the limit of quantification (LOQ) and detection (LOD), which were calculated considering the average concentration of the blanks plus ten times the standard deviation (SD) for the LOQ and the average concentration of the blank plus three times the SD for the LOD, as performed by França et al. [20] who followed national and international quality assurance guidelines [23,24].
2.6. Risk Assessment of School Lunch Consumption
The exposure assessment in this study is based on possible adverse effects on human health (non-cancerous) due to exposure to As, Cd, and Pb resulting from the consumption of the food served, based on the calculation of the risk quotient (RQ) [15,25,26] from Equation 1:
Equation 1. Risk quotient (non-cancer) associated with food consumption.
Where Ef is the frequency of exposure (days/year); ED is the duration of exposure (years); FIR is the average daily intake per person (g/day); C is the concentration of the toxic element in school meals (mg. kg-1); Wab is body weight (kg); TA is the average exposure time to non-cancerous substances (365 x Age); RfD (or EfD) is the oral reference dose (mg.kg-1/day) (Cd = 1.0 × 10⁻³ μg g−1/day, Pb = 4.0 × 10⁻³ μg g-1/day and As = 0.3 × 10⁻³ μg g-1/day) [27].
For this calculation, we considered the data obtained by this study and by the most recent Family Budget Survey (POF) [28] in three different scenarios, described in Table 1 and Tables S1–S3, which correspond, respectively, to elementary school students (a period lasting nine years), secondary school students (a period lasting three years) and the overall average number of years that students served by the PNAE remain in school (12 years), under Law No. 9.394 of 1996 [29].
In these scenarios, the duration of exposure (ED) corresponded to the time that the students must remain in school, the average daily intake (FIR) corresponded to the median weight of the food obtained in the schools in the two school semesters, the frequency of exposure (Ef) considered the number of school days during 2019 (202 days) and the body weight (Wab) used was the median of that reported in the POF (2008-2009) [30]. There is no reference dose (maximum acceptable limit) for oral Pb, so 4 × 10⁻³ mg.kg-1 was adopted, as followed in other studies [15,26].
2.7. Statistical Analysis
Microsoft Excel® was used to build the database and calculate the moisture content. SPSS statistical software, version 20 (SPSS Inc., Chicago, IL, USA) was used for statistical analysis. The results of the analysis of the concentration of toxic elements in the food samples were described with median, minimum, and maximum values and interquartile range (IQR) for each municipality for the two sampling periods. The non-parametric analysis of variance Shapiro-Wilk test was used to evaluate the differences in the median concentrations of inorganic elements between the municipalities, and the Wilcoxon test was used to identify possible statistical differences between the collection periods with a 95% confidence level. The analytical methodology was adapted following the recommendations established in the guidelines of national regulatory authorities DOC - CGCRE - 008 (2016) of INMETRO (National Institute of Metrology, Quality, and Technology) and RDC No. 166 of National Health Surveillance Agency [31]. The studies of linearity, sensitivity (LOD and LOQ), precision, and accuracy (as recovery) were performed.
3. Results and Discussion
3.1. Quality Assurance
The parameters used in this study’s methodology to guarantee analytical quality are shown in Table 2.
The methodology’s precision and accuracy align with current standards, as the European Commission recommended [32], with the values obtained being below 10%. Also, according to the legislation in force in the country, the parameters agree that the difference between the expected value for the MRCs and that obtained in the analyses was well below the acceptable limit of ≤ 20% [31]. The method’s sensitivity was also satisfactory, with the LOD and LOQ being sufficiently low and within the recommended standards for trace metal analysis. Therefore, the method’s validation is in accordance with the guidelines for all the elements analyzed.
3.2. Levels of Inorganic Elements in School Meals
In this study, the average weight of the portions served to schoolchildren in Brumado was 192.5 g/day, ranging from 150 g/day to 235 g/day; 194.1 g/day, ranging from 133 g/day to 260 g/day in Jacobina; 236 g/day, ranging from 185 g/day to 255 g/day in Jaguaripe; and 257 g/day, ranging from 57.5 to 488 g/day, in Salvador. These values were used to calculate the hazard quotients.
The medians, interquartile range (IQR), and maximum and minimum values calculated for the three elements (As, Cd, and Pb) are described in Table 3, Table 4 and Table 5, respectively.
3.2.1. Arsenic
The highest values found for As were observed in the schools of the municipality of Jacobina (5 µg.kg-1) in the second semester and in Salvador 4 µg.kg-1 in the first and second semesters (Table 3). The meals in this study were analyzed entirely; in Brazil, the existing legislation only covers limits for food and not for the total diet [33]. A study by Maihara et al. [18] in schools in the municipality of São Paulo, Brazil, also found concentrations below those permitted by the legislation, in which daily arsenic intake values were obtained with a median of 64.7 µg.kg−1.
According to the EFSA, it is estimated that dietary exposure to inorganic As in children is around 2 to 3 times higher than in adults due to various factors, from putting their hands to their mouths more often to consuming more food per kg body weight per day (kg.bw/day) compared to the adult population [6].
The risk of toxic effects from dietary consumption of arsenic increases, especially when the population consumes a greater quantity of cereal and starchy foods, particularly rice or seafood, which can be seen in the municipality of Jacobina, where a value of 1 µg.kg−1 was found in the first semester and 5 µg.kg−1 in the second semester. This difference can be explained by the fact that, in the second semester, the supply of starchy preparations was higher than in the first, especially those containing rice, such as rice pudding and rice with meat and vegetables [34,35].
None of the preparations obtained in this study contained fish or seafood, which justifies the values of total As below those reported in other studies, such as the work carried out by Roma et al. [36] in Italy and Bastías et al. [17] in Chile, where the levels of total As were higher [10].
JECFA does not have a safe PTWI value for arsenic exposure. At its last meeting, a PTWI of 15 µg.kg−1 was established. The maximum value of As found in this study was 10 µg.kg−1 in the second half of the year in Salvador and Jaguaripe and 11 µg.kg−1 in the second half of the year in Jacobina. The stipulated weight value for population C1 was 25.4 kg, and C2 was 51.8 kg, the exposure value for Salvador and Jagaripe would be respectively 0.010 and 0.09 µg.kg−1 for C1, 0.050 and 0.045 for C2, for the second semester in Jacobina the exposure value would be 0.084 µg.kg−1 for C1 and 0.041 µg.kg−1 for C2, thus, in this hypothesis, the exposure value would not exceed the PTWI proposed by JECFA. It is worth noting that this figure would only reflect a single meal eaten by the population.
3.2.2. Cadmium
The values found for Cd are shown in Table 4, with the values for the second semester in Jacobina, Jaguaripe, and Salvador being the highest, 5 µg.kg-1, 4 µg.kg-1, and 4 µg.kg-1, respectively.
Like As, Cd has rice and wheat as the leading oral deliverers of contamination in the human diet. Rice, along with other cereals, legumes, and meat products, is the basis of Brazilians’ meals and one of the primary sources of exposure to Cd [6,12,37]. Many of the samples collected in the schools for this study contained rice in their composition, such as rice pudding and rice with meat or chicken.
Again, corroborating with the literature already cited, the difference in values between the first and second semesters in Jacobina is because, in the second semester, the samples collected had a more significant amount of starch and meat products in their composition. Despite the low values found for Cd, it is essential to note that this toxic element has a long half-life. Several authors have reported harmful effects on children’s health, primarily cognitive and behavioral effects, demonstrating an inversely proportional relationship between Cd levels and IQ, as well as significant associations between Cd levels and learning disorders in children and adolescents aged 6 to 15 [38–40].
3.2.3. Lead
Of the elements analyzed in this study, the one with the highest levels measured in school meals was Pb (Table 5), with the second half of Brumado and Jacobina having the highest levels of this inorganic contaminant, 42 µg.kg-1 and 38 µg.kg-1, respectively.
The results for Pb were higher than those reported in other studies that analyzed meals served in schools, diverging from the fact that these studies resulted in higher concentrations of As and Cd [36,41]. For Roma et al. [36], exposure to lead measured in the diet was <7 µg.kg−1, while Nacano et al. [41], evaluating meals served to schoolchildren in São Paulo, obtained values between 1 and 33 µg.kg-1.
The analysis of this toxic element in foods, especially those offered to children, is essential, as even small amounts can trigger various health effects ranging from speech, hearing, hyperactivity, IQ reduction, and growth and development disorders, among others [42,43].
JECFA stipulated a PTWI for Pb of 25 µg.kg−1 of body weight per week; the maximum value of Pb found in this study was 137 µg.kg−1, in the second semester of Salvador, 157 and 137 µg.kg−1 for the first and second semester of Jaguaripe, respectively. Following the hypothesis based on the scenarios established, Salvador’s exposure value for S1 and S2 would be 1.38 and 0.68 µg.kg−1, respectively. For Jaguaripe, in the first semester, the exposure value for S1 and S2 would be 1.45 and 0.71 µg.kg−1, respectively, and in the second semester, the exposure would be 1.27 and 0.62 µg.kg−1, for S1 and S2, values higher than those found by Leroux et al. in a study carried out in kindergartens in São Paulo, where the total values for Pb for children was 0.18 µg.kg−1 [19].
All the municipalities showed higher concentrations of Pb in the second semester. One possibility highlighted could be a variation in the food served. In Brumado, where the value for the second semester increased sixfold, the meals served contained more fruit and vegetables with starch in their composition, similar to the observations of previous studies in Brazil. Vasconcelos-Neto et al. [44] reported values ranging from 20 to 30 µg.kg-1, with the highest values found in meals containing fruit and vegetables.
No statistically significant differences were found between most of the medians of the samples taken in the two semesters (p>0.05), except for Cd, which differed in the municipalities of Salvador (p = 0.011), Brumado (p = 0.025), Jaguaripe (p = 0.011), and Jacobina (p = 0.03), where the later had the highest levels of this inorganic contaminant.
Brumado also showed a difference between the medians of the two semesters for Pb (p = 0.03), wherein in the second semester, the median concentration for this toxic element increased sevenfold. This issue may have been due to the difference between the menus from one semester to the other, the difference in the brands of products used, and the larger supply of food groups that could contribute to a higher percentage of contamination of these elements.
3.3. Risk Assessment
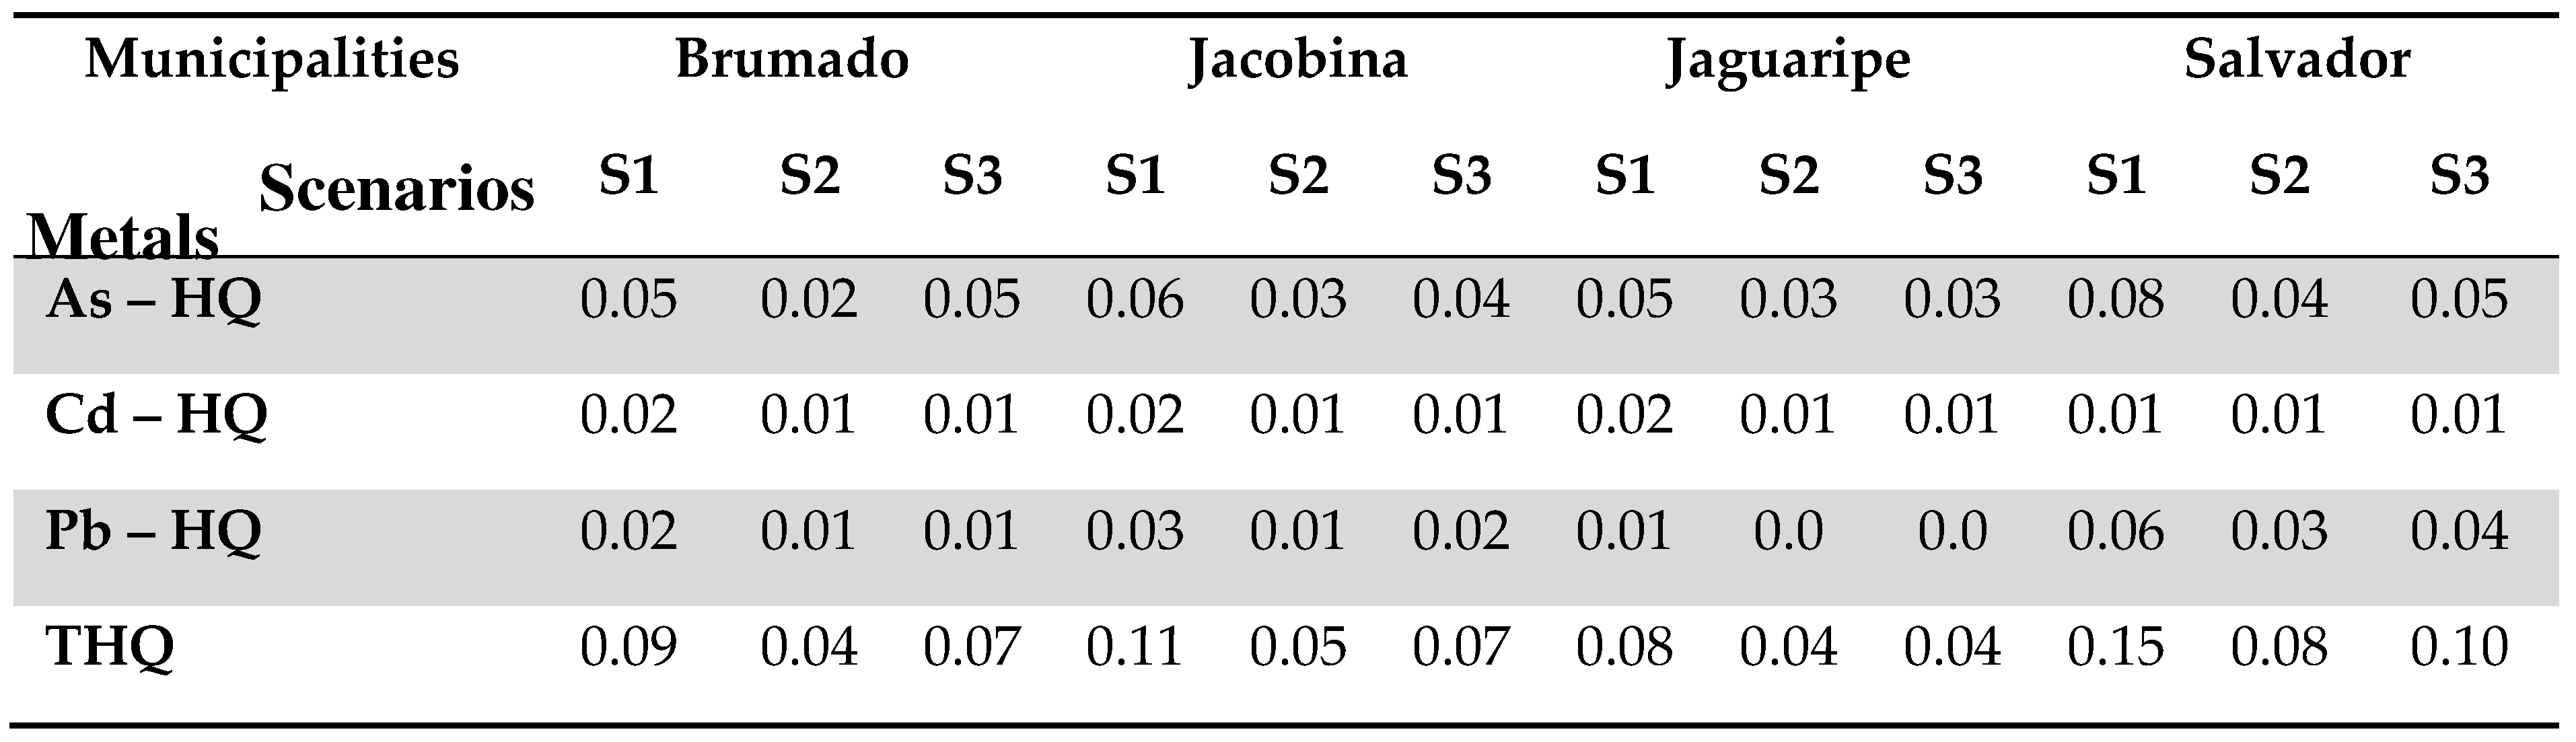
All the results found in the analysis of the elements were below the tolerable limits for the methodology used [33,45]. Table 6 shows the study population’s hazard quotients (HQ) in the three proposed scenarios.
For all the scenarios studied, the HQ did not exceed the limit value of 1 (HQ<1), which is the ratio between the reference dose (RfD) and the daily intake of the toxic agent evaluated. All the values, including THQ, are well below this parameter; thus, the risk can be classified as negligible [46]. Comparatively, for all the elements, S1 presents the most significant non-cancer risk related to eating school meals, as these are children of a younger age and lower weight. In this case, the food served in schools in Salvador had the highest HQs and, consequently, the highest THQs found, which may be justified by the fact that the average value (in grams) of the meals served was higher in this municipality. Each of these inorganic elements represents a potential risk for the populations under study, as they are a more vulnerable population, given that even small exposures may pose a risk of deleterious effects in the long term.
One of the study’s limitations was that it was not possible to assess which specific foods contributed the highest percentage of the contaminants studied in the meals offered. In addition, due to the demand for time and more resources, it was not possible to assess the weight of the students in order to obtain a more reliable value for calculating the HQs.
On the other hand, the fact that the samples were collected in municipalities in different state regions and of a varied Brazilian education development rank (IDEB index, Supplementary S1) makes this study more geographically comprehensive and reliable regarding the different realities of the students assisted by the PNAE. In this way, it makes it possible to differentiate between areas with greater or lesser exposure and to promote debate on the importance of contaminant-free food, signaling the need for further studies.
It should also be borne in mind that, despite not representing a risk, attention is needed, given that the age and body weight range of children receiving school meals in Brazil varies and that, for younger children, exposure through school meals, combined with food consumed outside of school, may exceed the values considered safe by current guidelines.
4. Conclusions
Given this gap and considering that children and adolescents are more easily exposed and consequently more susceptible to harmful effects, we recommend further studies using the theme in schools.
The study showed that children were exposed to more Pb contamination than other elements, with the main food groups responsible for the highest values being those containing starch, fruit, and vegetables. The values found in this study were higher than in other studies on the same subject.
The HQ calculated for the proposed scenarios suggests that the risk of exposure to inorganic elements is negligible. Nevertheless, despite the values being considered negligible, it is of the utmost importance that studies like this be carried out, given that currently, neither the WHO nor the EFSA have parameters considered safe for ingesting these elements. There are no safe levels for exposure to those toxic metals, especially lead, which recent findings show subtle cognitive effects at blood lead levels far below the recommended value for children.
Supplementary Materials
The following supporting information can be downloaded at the website of this paper posted on Preprints.org.
Author Contributions
Conceptualization, J.A. Menezes-Filho and L.S. SantosY.Y.; methodology J.A. Menezes-Filho and M.V. Lopes Silva; software, E.A. Gomes-Jr; validation, J.A. Menezes-Filho, M.V. Lopes Silva and F.F. Chagas.; formal analysis, L.S. Santos; investigation, L.S. Santos and F.F. Chagas; resources, J.A. Menezes-Filho.; data curation, E.A. Gomes-Jr. and M.G.D. Martinho; writing—original draft preparation, L.S. Santos.; writing—review and editing, J.A. Menezes-Filho; funding acquisition, J.A. Menezes-Filho. All authors have read and agreed to the published version of the manuscript.
Funding
This investigation was partially funded by Fundação de Apoio a Pesquisa do Estado da Bahia, Brazil (FAPESB), grant no. JCB 0029/2015.
Data Availability Statement
Data will be made available upon reasonable request.
Acknowledgments
We are thankful to the Secretariats of Education of Brumado, Jacobina, Jaguaripe, and Salvador especially the nutritionists, who accompanied us and provided the necessary information. This investigation was partially funded by Fundação de Apoio a Pesquisa do Estado da Bahia, Brazil (FAPESB), grant no. JCB 0029/2015. Finally, we thank the comments and careful reviews of Vera A. Maihara (CNEM) and Ryzia C. V. Cardoso (UFBA).
Conflicts of Interest
The authors declare no conflicts of interest.
References
- Silva, C.O. Segurança Alimentar e Nutricional. Rio de Janeiro: Rubio, 2015.
- Cesar JT, Valentim EA, Almeida CCB, Schieferdecker MEM, Schmidt S. 2018. Alimentação Escolar no Brasil e Estados Unidos: uma revisão integrativa. Ciência & Saúde Coletiva. 23(3):991-1007. [CrossRef]
- Horta PM, Carmo AS, Junior EV, Santos LC. 2019. Consuming School Meals Improves Brazilian Children’s Diets According to Their Social Vulnerability Risk. Public Health Nutrition. 22(14): 2714–19. [CrossRef]
- Sobrinho, JF. Avaliação da qualidade dos cardápios ofertados para préescolares de uma escola privada no Distrito Federal. Monografia (Especialização) – Universidade Federal de Brasília, Faculdade de Ciências da Saúde, Brasília – DF, 2017.
- Soares, T.M.S. O Programa Nacional de Alimentação Escolar (PNAE) no município de Santo Antônio da Patrulha – RS. Monografia (Trabalho de Conclusão de Curso) – Universidade Federal do Rio Grande do Sul, Tramandaí – RS, 2018.
- EFSA, European Food Safety Authority. Scientific Opinion on Lead in Food. EFSA Panel on Contaminants in the Food Chain (CONTAM). EFSA Journal, Parma, Italy, 2010, v. 4, n.8, 151, p. Available at: Scientific Opinion on Lead in Food (wiley.com).
- Rahmani J, Fakhri Y, Shahsavani A, Bahmani Z, Urbina MA, Chirumbolo S, Keramati H, Moradi B, Bay A, Bjørklund G. 2018. A systematic review and meta-analysis of metal concentrations in canned tuna fish in Iran and human health risk assessment. Food and Chemical Toxicology, [S.L.], v. 118, p. 753-765, ago. Elsevier BV. [CrossRef]
- Gao Y, Li X, Dong J, Cao Y, Li T, Mielke HW. 2020. Snack foods and lead ingestion risks for school aged children: a comparative evaluation of potentially toxic metals and children’s exposure response of blood lead, copper and zinc levels. Chemosphere. 261:127547. [CrossRef]
- Amaya E, Gil F, Freire C, Olmedo P, Fernández-Rodríguez M, Fernández MF, Olea N. 2013. Placental concentrations of heavy metals in a mother–child cohort. Environmental Research. 120(15):63 – 70. [CrossRef]
- IARC. 2012. A review of human carcinogens: Part C: Arsenic, metals, fibres, and dusts. IARC Monographs on the Evaluation of Carcinogenic Risks to Humans, No. 100C. Lyon.
- Duffus JH. 2002. Heavy Metals’ a Meaningless Term?: IUPAC Technical Report. Pure and Applied Chemistry. 74(5):793-807. [CrossRef]
- EFSA, European Food Safety Authority. Scientific opinion of the panel on contaminants in the food-chain. Cadmium dietary exposure in the European population. European Food Safety Authority, Parma, Italy, 2012.
- Menezes-Filho JÁ, Carvalho C, Rodrigues J, Araújo C, Santos N, Lima C, Bandeira M, Marques B, Anjos A, Bah H. 2018. Environmental Co-Exposure to Lead and Manganese and Intellectual Deficit in School-Aged Children. International Journal of Environmental Research And Public Health. 15 (11):2418-0. [CrossRef]
- IARC. Inorganic and organic lead compounds. IARC. Monogr. Eval. Carcinog. Risks Hum.87 (24) (2006). Ten Chemicals of Major Public Health Concern.
- Araújo, C.F.S; Lopes, M.V; Vasquez, M.R; Porcino, T.S; Ribeiro, A.S.V; Rodrigues, J.L.G; Oliveira, S.S.P; Menezes-Filho, J.A. 2016. Cadmium and lead in seafood from the Aratu Bay, Brazil and the human health risk assessment. Environmental Monitoring and Assessment, 188 (4). [CrossRef]
- Kato LS, Fernandes EAN, Raab A, Bacchi MA, Feldmann J. 2019. Arsenic and cadmium contents in Brazilian rice from different origins can vary more than two orders of magnitude. Food Chemistry. 286:644-650. [CrossRef]
- Bastías JM, Bermðdez M, Carrasco J, Espinoza O, Muñoz M, Galotto MJ, Muñoz O. 2010. Determination of Dietary Intake of Total Arsenic, Inorganic Arsenic and Total Mercury in the Chilean School Meal Program. Food Science and Technology International. 16(5):443-450. [CrossRef]
- Maihara VA, Vasconcellos MBA, Cordeiro MB, Cozzolino SMF. 1998. Estimate of toxic element intake in diets of pre-school children and elderly collected by duplicate portion sampling. Food Additives and Contaminants. 15 (7):782-788. [CrossRef]
- Leroux I, Ferreira A, Paniz F, Pedron T, Salles F, Silva F, Maltez H, Batista B, Olympio K. 2018. Lead, Cadmium, and Arsenic Bioaccessibility of 24 h Duplicate Diet Ingested by Preschool Children Attending Day Care Centers in Brazil. International Journal of environmental Research and Public Health.15 (8):1778. [CrossRef]
- França FCO, Andrade IS, Silva MV, Lordêlo MS, Costa RG, Menezes-Filho JA. 2018. School meals’ centesimal and mineral composition and their nutritional value for Brazilian children. Journal Of Trace Elements In Medicine And Biology. 48:97-104. [CrossRef]
- IBGE, Instituto Brasileiro de Geografia e Estatítica. Censo escolar da educação básica, 2016. Brasília, 2017. [Accessed: jul 2020]. http://ces.ibge.gov.br/base-de-dados/metadados/inep/educacao-basica.
- IAL, Instituto Adolfo Lutz. Physico-chemical Methods for Food Analysis. Instituto Adolfo Lutz, São Paulo, 2008.
- IUPAC. Chemistry Compendium of Chemical Terminology. Zurique, v. 2,1997.
- BRASIL. 2017. Agência Nacional de Vigilância Sanitária. Guia para validação de métodos analíticos. RDC Nº 166, 24/07/2017. 2017.
- Rahman MM, Alauddin M, Alauddin ST, Siddique AB, Islam MR, Agosta G, Mondal D, Naidu R. 2021. Bioaccessibility and speciation of arsenic in children’s diets and health risk assessment of an endemic area in Bangladesh. Journal Of Hazardous Materials. 403:124064. [CrossRef]
- Gomes-Junior EA, Bah HAF, Rodrigues YJM, Bandeira MJ, Santos NR, Menezes-Filho JA. 2020. Lead in soil and vegetables in a glazed ceramic production area: a risk assessment. Environmental Nanotechnology, Monitoring & Management. [CrossRef]
- United States Environmental Protection Agency (US EPA), 2013. Risk Assessment Information System. Available at: https://rais.ornl.gov.
- IBGE, Instituto Brasileiro de Geografia e Estatística. Pesquisa de Orçamentos Familiares 2017-2018 – POF. Rio de Janeiro, 2020.
- BRASIL. 1996. Lei nº 9.394, de 20 de dezembro de 1996: Estabelece as diretrizes e bases da educação nacional. Available at: <L9394 (planalto.gov.br)>.
- IBGE. Instituto Brasileiro de Geografia e Estatística. Pesquisa de Orçamentos Familiares 2008-2009: Aquisição alimentar domiciliar per capita. Rio de Janeiro, 2010.
- Brazil. National Health Surveillance Agency, 2017. Validation of analytical methods and other provisions. RDC 166, 249/07/2017.
- EC. Commission decision 657/2002: implementing council directive 96/23/EC concerning performance of analytical methods and the interpretation of result. Official Journal of the European Communities, Bruxelas, 2002, n. 221, p. 8–36. Available at: eur-lex.europa.eu/legal-content/PT/TXT/PDF/?uri=CELEX:32002D0657.
- BRASIL. 2021.Instrução Normativa – IN nº 88, de 26 de março de 2021, Estabelece os limites máximos tolerados (LTM) de contaminantes de alimentos. Brasília.
- Chen HL, Lee CC, Huang WJ, Huang HT, Wu YC, Hsu YC, Kao YT. 2015. Arsenic speciation in rice and risk assessment of inorganic arsenic in Taiwan population. Environmental Science and Pollution Research. 23(5):4481-448. [CrossRef]
- Shibata T, Meng C, Umoren J, West H. 2016. Risk Assessment of Arsenic in Rice Cereal and Other Dietary Sources for Infants and Toddlers in the U.S. International Journal Of Environmental Research And Public Health. 13 (4):361. [CrossRef]
- Roma A, Esposito M, Chiaravalle E, Miedico O, Filippis SP, Brambilla G. 2017. Occurrence of cadmium, lead, mercury, and arsenic in prepared meals in Italy: potential relevance for intake assessment. Journal of Food Composition and Analysis. 63: 28-33. [CrossRef]
- Kim K, Melough M, Vance T, Noh H, Koo S, Chun O. 2018. Dietary Cadmium Intake and Sources in the US. Nutrients.11 (1): 2. [CrossRef]
- Kippler M, Tofail F, Hamadani JD, Gardner RM, Grantham-Mcgregor SM, Bottai M, Vahter M. 2012. Early-Life Cadmium Exposure and Child Development in 5-Year-Old Girls and Boys: a cohort study in rural bangladesh. Environmental Health Perspectives.120 (10):1462-1468. [CrossRef]
- Ciesielski T, Weuve J, Bellinger DC, Schwartz J, Lanphear B, Wright RO. 2012. Cadmium Exposure and Neurodevelopmental Outcomes in U.S. Children. Environmental Health Perspectives. 120(5):758-763. [CrossRef]
- Jeong KS, Park H, Ha E, Hong YC, Ha M, Park H, Kim BN, Lee BE, Lee SJ, Lee KY. 2015. Performance IQ in children is associated with blood cadmium concentration in early pregnancy. Journal Of Trace Elements In Medicine And Biology. 30:107-111.
- Nacano LR, Freitas R, Barbosa F. 2014. Evaluation of Seasonal Dietary Exposure to Arsenic, Cadmium and Lead in Schoolchildren Through the Analysis of Meals Served by Public Schools of Ribeirão Preto, Brazil. Journal Of Toxicology And Environmental Health, Part A. 77 (7): p. 367-374, 11 mar. Informa UK Limited. [CrossRef]
- Wani AL, Ara A, Usmani JÁ, 2015. Lead toxicity: a review. Interdisciplinary Toxicology. 8 (2): 55-64. [CrossRef]
- Charkiewicz AE, Backstrand JR. 2020. Lead Toxicity and Pollution in Poland. International Journal of Environmental Research and Public Health. 17(12):4385. [CrossRef]
- Vasconcelos M, Quintal APN, Pôrto LBG, Souza SVC. 2021. Lead in Brazilian food: exposure assessment and risk characterization. Food Additives & Contaminants: Part A. 38 (2): 315-325. [CrossRef]
- EU. Commission Regulation (EC) no 1881/2006: setting maximum levels for certain contaminants in foodstuffs. Official Journal of the European Union, Bruxelas, 2006.Available at: LexUriServ.do (europa.eu).
- Storelli, M.M. 2008. Potential human health risks from metals (Hg, Cd, and Pb) and polychlorinated biphenyls (PCBs) via seafood consumption: estimation of target hazard quotients (thqs) and toxic equivalents (teqs). Food And Chemical Toxicology. 46 (8): 2782-2788. [CrossRef]
Figure 1.
Geographical location of the study municipalities. A - Brumado; B - Jacobina; C - Jaguaripe; D - Salvador (Capital of the State of Bahia).
Figure 1.
Geographical location of the study municipalities. A - Brumado; B - Jacobina; C - Jaguaripe; D - Salvador (Capital of the State of Bahia).
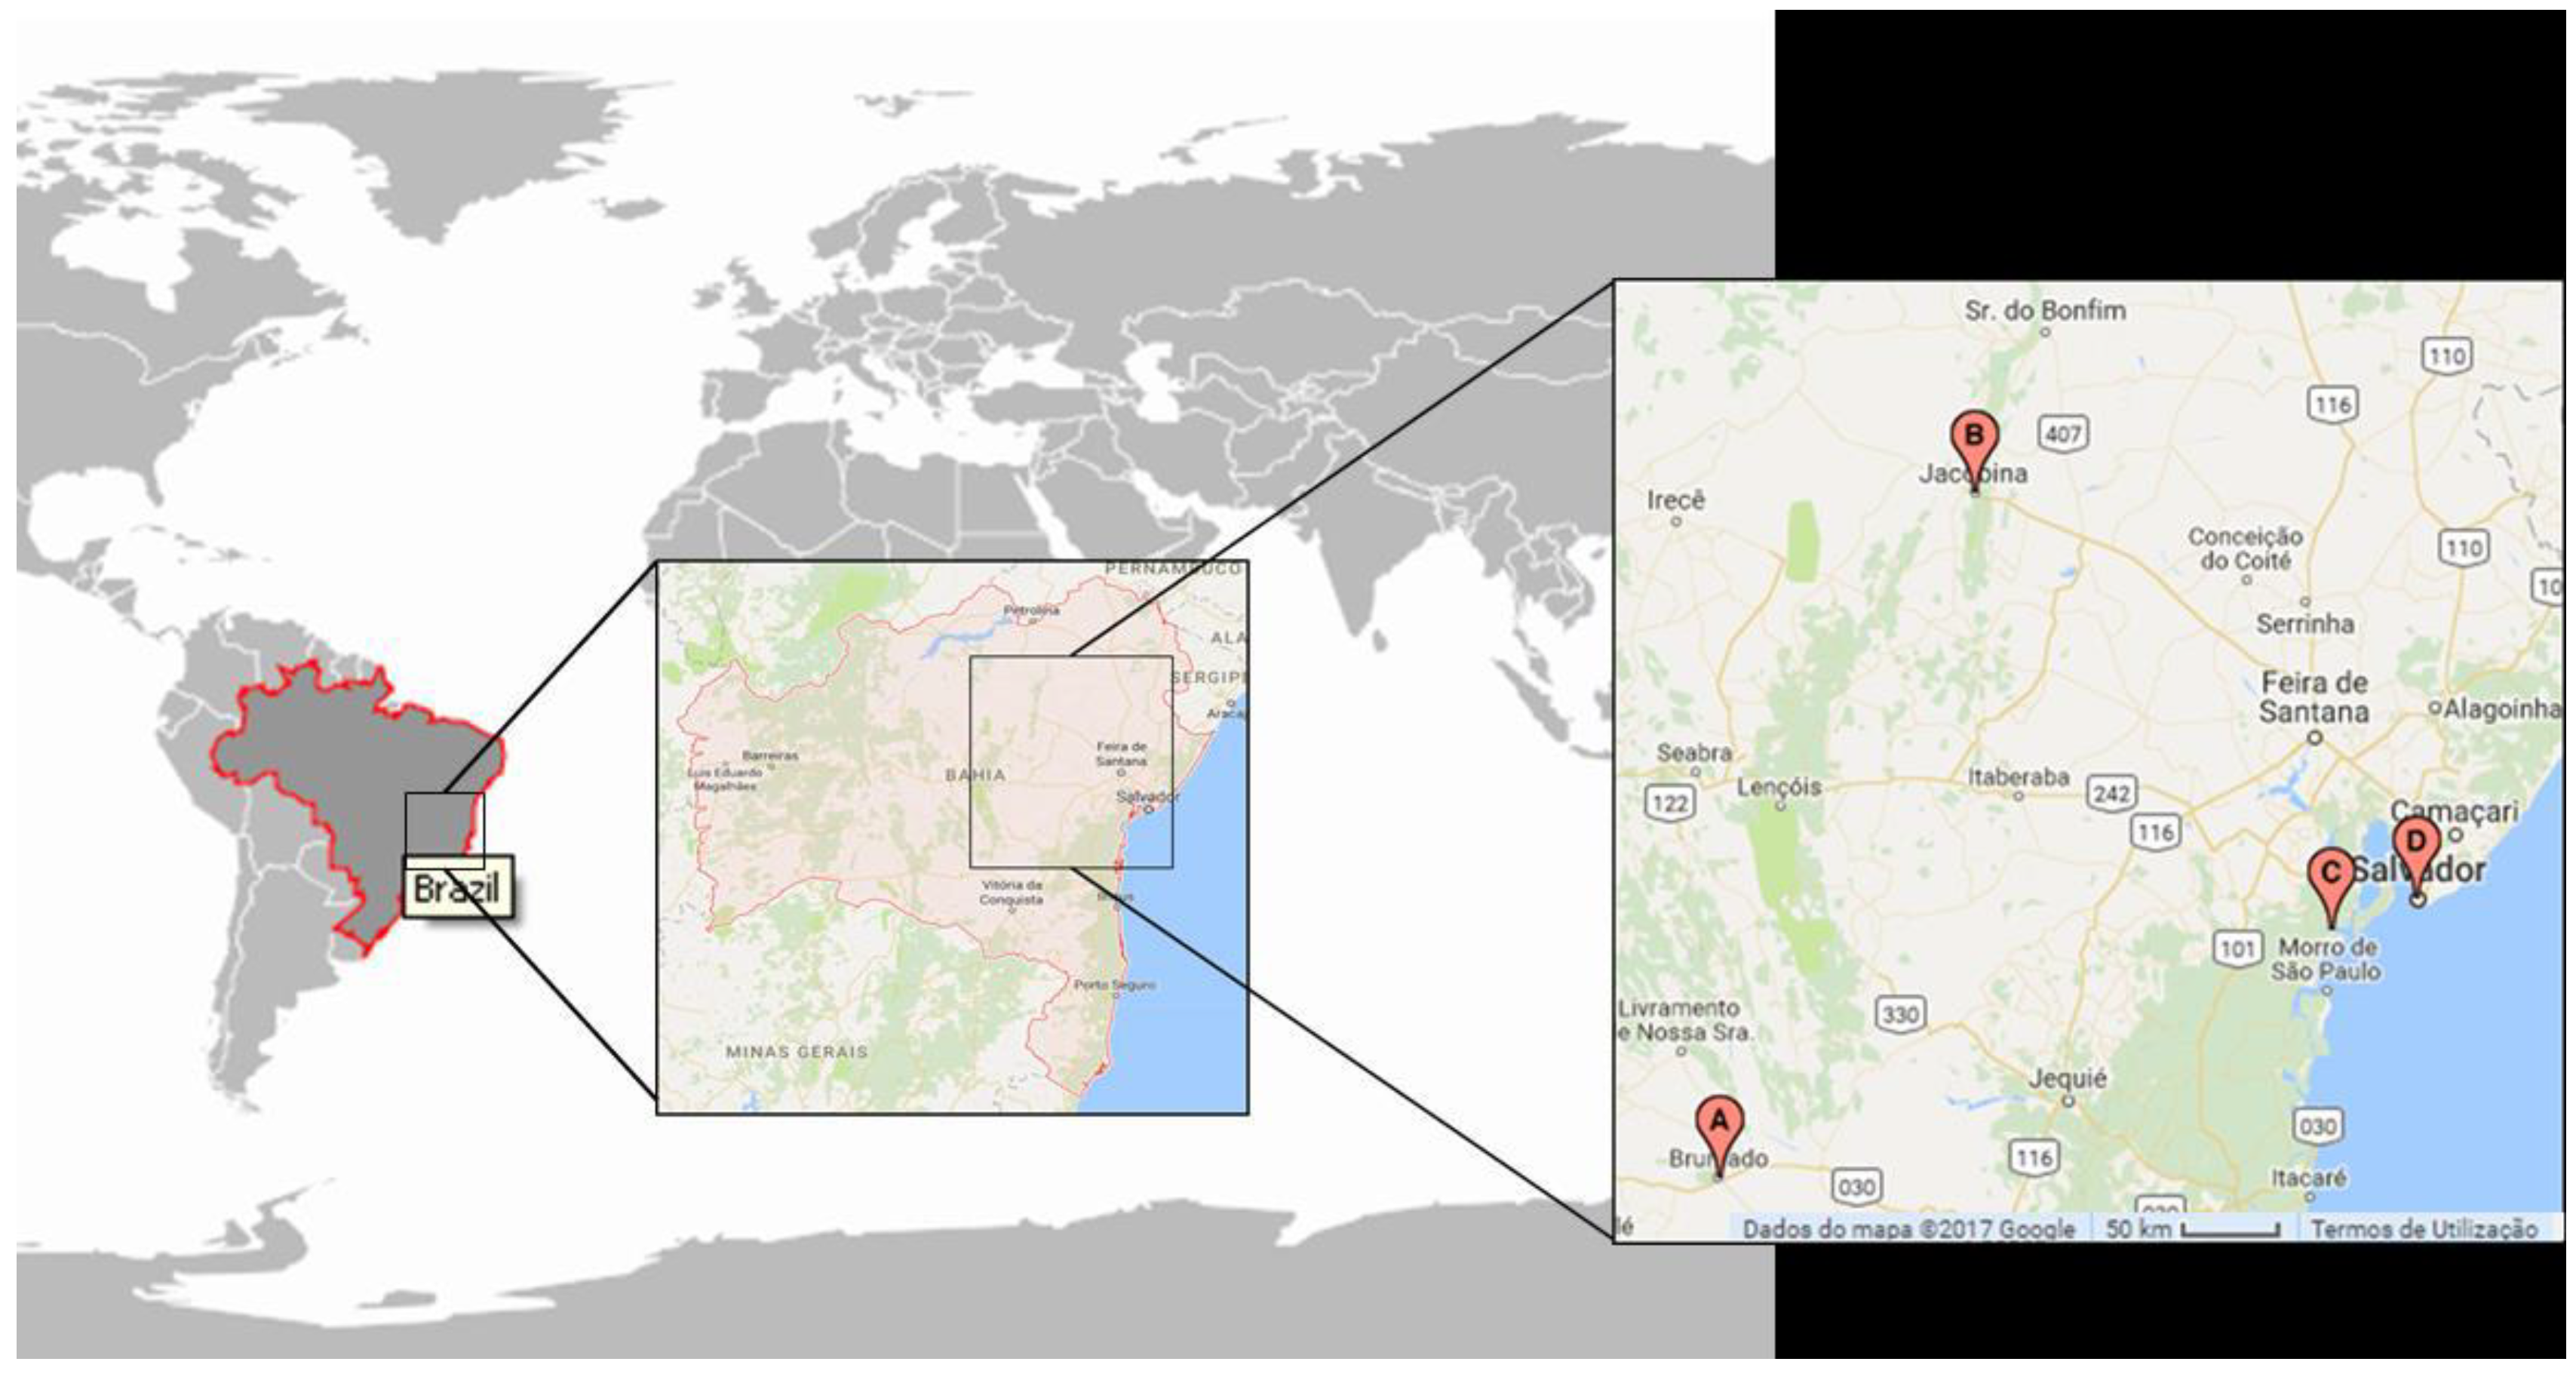

Table 1.
Parameters used to estimate the dose of exposure to As, Cd and Pb from the consumption of school meals..
Table 1.
Parameters used to estimate the dose of exposure to As, Cd and Pb from the consumption of school meals..
| Parameters | S1 (Elementary school) |
S2 (Middle school) |
S3 (Overall average) |
|---|---|---|---|
| Duration of exposure (years) | 9 | 3 | 12 |
| Body weight (Kg) | 25.4 | 51.8 | 41.2 |
| Exposure frequency (days/year) | 202 | 202 | 202 |
Table 2.
Quality assurance parameters for toxic metal determination in school meals.
| CRM | CERTIFIED VALUE (MG.KG−1) |
MEASURED VALUE (MG.KG−1) |
LOD (MG.KG−1) |
LOQ (MG.KG−1) |
PRECISION (RSR %) |
ACCURACY (RE %) |
|
|---|---|---|---|---|---|---|---|
| AS | Spinach leaves | 0.068 ± 0.012 | 0.067 | 0.008 | 0.012 | 7.73 | 1.47 |
| CD | Apple leaves | 0.013 ± 0.002 | 0.012 | 0.009 | 0.024 | 6.80 | 9.09 |
| PB | Apple leaves | 0.470 ± 0.024 | 0.471 | 0.005 | 0.013 | 1.61 | 0.15 |
Table 3.
Arsenic content (µg.kg-1) in wet weight in school meal samples, by municipality, in two semesters.
Table 3.
Arsenic content (µg.kg-1) in wet weight in school meal samples, by municipality, in two semesters.
| Municipalities | Semester | Median | IQR1 | Min | Max |
|---|---|---|---|---|---|
| Brumado | 1st Sem | 2 | 1 | <LD | 8 |
| 2nd Sem | 3 | 4 | 2 | 8 | |
| Jacobina | 1st Sem | 1 | <LOD | 1 | 3 |
| 2nd Sem | 5 | 3 | 3 | 11 | |
| Jaguaripe | 1st Sem | 2 | 1 | 1 | 6 |
| 2nd Sem | 4 | 3 | 2 | 10 | |
| Salvador | 1st Sem | 4 | 5 | <LOD | 1 |
| 2nd Sem | 4 | 3 | 2 | 10 |
1 IQR: interquartile range.
Table 4.
Cadmium content (µg.kg-1) in wet weight in school meal samples, by municipality, in two semesters.
Table 4.
Cadmium content (µg.kg-1) in wet weight in school meal samples, by municipality, in two semesters.
| Municipalities | Semester | Median | IQR1 | Min | Max |
|---|---|---|---|---|---|
| Brumado | 1st Sem | 2 | 2 | 1 | 4 |
| 2nd Sem | 3 | 4 | 2 | 8 | |
| Jacobina | 1st Sem | 1 | <LOD | 1 | 3 |
| 2nd Sem | 5 | 3 | 3 | 11 | |
| Jaguaripe | 1st Sem | 2 | 1 | 1 | 6 |
| 2nd Sem | 4 | 3 | 2 | 10 | |
| Salvador | 1st Sem | 2 | 1 | 1 | 6 |
| 2nd Sem | 4 | 3 | 2 | 10 |
1IQR: interquartile range.
Table 5.
Lead content (µg.kg-1) in wet weight in school meal samples, by municipality, in two semesters.
Table 5.
Lead content (µg.kg-1) in wet weight in school meal samples, by municipality, in two semesters.
| Municípalities | Semester | Median | IQR1 | Min | Max |
|---|---|---|---|---|---|
| Brumado | 1st Sem | 7 | 9 | 1 | 43 |
| 2nd Sem | 42 | 40 | 11 | 96 | |
| Jacobina | 1st Sem | 25 | 22 | 1 | 58 |
| 2nd Sem | 38 | 55 | 11 | 101 | |
| Jaguaripe | 1st Sem | 3 | 8 | 2 | 157 |
| 2nd Sem | 12 | 74 | 4 | 137 | |
| Salvador | 1st Sem | 3 | 8 | 2 | 39 |
| 2nd Sem | 12 | 74 | 4 | 137 |
1IQR: interquartile range.
Table 6.
Non-carcinogenic risk quotient associated with school meal consumption for each scenario, S1 children, S2 adolescents and S3 general population average.
Table 6.
Non-carcinogenic risk quotient associated with school meal consumption for each scenario, S1 children, S2 adolescents and S3 general population average.
Disclaimer/Publisher’s Note: The statements, opinions and data contained in all publications are solely those of the individual author(s) and contributor(s) and not of MDPI and/or the editor(s). MDPI and/or the editor(s) disclaim responsibility for any injury to people or property resulting from any ideas, methods, instructions or products referred to in the content. |
© 2024 by the authors. Licensee MDPI, Basel, Switzerland. This article is an open access article distributed under the terms and conditions of the Creative Commons Attribution (CC BY) license (http://creativecommons.org/licenses/by/4.0/).
Copyright: This open access article is published under a Creative Commons CC BY 4.0 license, which permit the free download, distribution, and reuse, provided that the author and preprint are cited in any reuse.


