
Submitted:
16 January 2024
Posted:
17 January 2024
You are already at the latest version
Abstract
Low efficiency and excessive application of nitrogen (N) fertilizers is a frequent problem in agriculture that impacts the environment. Omeprazole (OMP) has been reported to promote N uptake and assimilation in tomato, basil, and corn. However, information about the effect of omeprazole on N assimilation, recovery and N use efficiency parameters for bean plants is limited. Therefore, the objective of the present study was to determine the effect of foliar application of OMP at 0, 1, 10 and 100 µM on nitrogen assimilation, growth, yield, nitrogen use efficiency parameters and recovery percentage in green bean plants. Green bean plants cv. Strike grown in pots were used. Biomass, yield, nitrate reductase activity, photosynthetic pigments concentration, soluble amino acids and protein concentration, total nitrogen concentration, nitrogen use efficiency parameters and nitrogen recovery were analyzed. The results obtained indicate that the application of OMP at 1 µM increased yield, biomass and promoted N assimilation through higher NR enzyme activity, higher amino acid concentration, higher N use efficiency coefficient and allowed a more efficient nitrogen recovery percentage.
Keywords:
Phaseolus vulgaris L.
; ammonium assimilation
; productivity
; efficiency
; nitrate reductase
1. Introduction
The low efficiency of nitrogen (N) fertilizers in agriculture has led to an intensified use with detrimental effects on the environment [1]. Depending on crop conditions, about 50% of the applied N is lost by volatization or leaching and is released to the atmosphere or deposited in water bodies [2]. In addition, agricultural soils with appropriate ammonium (NH4+) or nitrate (NO3−) content are uncommon, so external input is necessary to satisfy production demand [3]. Therefore, increasing nitrogen use efficiency (NUE) is a crucial objective to achieve sustainable food production [4,5].
Generally, NUE has been described as the amount of N applied to crops that is assimilated by plants and transformed into plant mass [6]. It has been further divided into two terms that refer to central processes in its assimilation. The capacity of roots to absorb N from the soil is called absorption efficiency (NUpE) and the capacity to mobilize it to the different plant organs is called utilization efficiency (NUtE) [7].
A novel alternative that has shown positive results in the efficient use of nutrients in plants is the application of low weight molecules such as omeprazole [8,9]. Omeprazole (OMP) (C17H19N3O3S) is a proton pump inhibitor in humans, with influence on other physiological processes in plant species [10]. Previous studies have proven that OMP application in tomato stimulates root and plant growth and enhances photosynthesis [11]. Also, in basil plants it improves potassium and nitrate uptake [12,13]. Moreover, in maize seedlings it allowed to increase N assimilation through changes in nitrate reductase activity, primary metabolism, and gene expression [10].
However, although there is evidence of increased NUE with the use of OMP in other crops, the pathways responsible for these responses in green bean (Phaseolus vulgaris L.) plants are still unknown. Therefore, the objective of the present study was to determine the effect of foliar application of OMP on nitrogen assimilation, growth, yield, and NUE parameters in green bean plants cv. Strike.
2. Materials and Methods
2.1. Crop management
The experiment was conducted at the facilities of the Centro de Investigación en Alimentación y Desarrollo, in Cd. Delicias, Chihuahua, Mexico, during the months of September and October 2022, under shade net conditions. Seeds of green bean cv. Strike provided by Hydro Environment® were used. Seeds were direct sown on 13 L plastic pots filled with vermiculite and perlite in a 2:1 (v/v) ratio. During the experiment, the plants were irrigated with a standard Hoagland nutrient solution (Table 1) adapted to the physiological needs of beans, with pH 6±0.1. 500 mL of nutrient solution were applied per pot every 48 h until the flowering stage (32 Days after sowing (DAS)), and an amount of 1 L until harvest (53 DAS).
2.2. Experimental design
A completely randomized design with a unifactorial arrangement and 4 levels was used. The factor to be evaluated was the foliar application of OMP and the levels were 0, 1, 10 and 100 µM. There were 4 treatments and 6 replications per treatment. The experimental unit was one plant per pot (Figure 1). The model used for the experiment was Yij=µ + τi + εij, where Yij was the response variable, under the effect of the i-th treatment and the j-th repetition, µ was the overall mean, τi was the effect of the i-th treatment and εij was the experimental error.
2.3. Plant sampling
Once the plants reached physiological maturity at 53 DAS, the plant material was harvested. The collected material was washed with distilled water to remove residues and finally separated into organs (root, stem, leaves and fruit). The samples were divided into fresh and dry material. The fresh material was used for in vivo analyses, which included yield, nitrate reductase activity, photosynthetic pigments and soluble amino acids and protein. The dry material was used for the quantification of biomass, total nitrogen, and efficiency parameters.
2.4. Plant Analysis
2.4.1. Total biomass and yield
One plant was randomly selected from each pot and weighed fresh using a compact balance (A&D Co., LTD, EK-120, Tokyo, Japan). Subsequently, the plant was dissected into leaves, stem, pods and root, and each organ was weighed fresh. Yield was expressed as the fresh weight of pods per plant (g plant−1 FW).
The obtained organs were rinsed three times in distilled water and dried on filter paper at room temperature for 24 h. After this period, the plant material was dried inside a 13.9-cubic-foot forced-air laboratory oven (Shel-Lab 1380FX, Oregon, United States) at 70 °C for 24 h. After the samples lost moisture, they were weighed with an electronic analytical balance (A&D Co., LTD, HR-120, Tokyo, Japan). Total biomass was expressed as the sum of the dry weight of the four plant organs (g plant−1 DW). Finally, the samples were ground and stored for quantification of total nitrogen.
The plant that was not subjected to drying was divided into leaves, stem, fruit and root and used in vivo for the quantification of nitrate reductase activity, photosynthetic pigments, amino acids and soluble proteins.
2.4.2. “In vivo" nitrate reductase enzyme activity (E.C. 1.7.1.1)
Nitrate reductase enzyme activity was quantified using the method described by Sánchez et al. [15]. 0.25-0.5 g of leaf discs were weighed and infiltrated with 10 mL of a 100 mM P-buffer solution (18.21 g of Na2HPO4·12H2O dissolved in 1 L of distilled water, adjusted to pH 7.5 with a solution of 13.60 g of KH2PO4 dissolved in 1 L of distilled water) for endogenous activity and with buffer-P 100 mM, pH 7.5 with 50 mM of KNO3 for the activity infiltrated with NO3-. Samples were infiltrated under vacuum at 0.8 bar for 10 min (NAPCO 5851 vacuum oven, Winchester, Virginia, USA) and incubated in the dark at 30 °C for 1 h (WIG-50 digital incubator, DAIHAN SCIENTIFIC, Seoul, Korea). The samples were then subjected to a water bath at 100 °C for 15 min. A 1 mL aliquot was then extracted and mixed with 2 mL of 1% sulfanilamide (1 g of sulfanilamide dissolved in 100 mL of distilled water and HCl in a 4:1 ratio (v/v)). Then, 2 mL of N-(1-Naphthyl) ethylenediamine dichlorohydrate at 0.02% was added (20 mg of NNEDA dissolved in 100 mL of distilled water). The reaction mixture was measured on a UV-visible spectrophotometer at a wavelength of 540 nm (Thermo Fisher Scientific, GENESYS™ 10S, Wisconsin, United States). The results were expressed a µM NO2- formed g−1 FW h−1.
2.4.3. Photosynthetic pigments
The concentration of chlorophyll a, b and carotenoids was determined by the method described by Wellburn [16]. Ten leaf discs of 7 mm diameter were weighed and infiltrated with 10 mL of methanol (CH3OH). The samples were sealed and allowed to stand in the dark for 24 h. After that time, the absorbance of the samples was measured at a wavelength of 470, 653 and 666 nm for carotenoids, chlorophyll b and chlorophyll a, respectively, using a UV-visible spectrophotometer (Thermo Fisher Scientific, GENESYS™ 10S, Wisconsin, United States). The pigment concentrations were expressed as µg cm2 FW and were calculated using the following formulas:
Chl a =(15.65 ×abs 666) - (7.34 ×abs 653)
(Chl a ×V ×W1)/(W2 × (π ×r^2 ) ×n)
Chl b =(27.05 ×abs 653) - (11.21 ×abs 666)
(Chl b ×V ×W1)/(W2 × (π ×r^2 ) ×n)
Carotenoids =((1000×abs 470) - (2.86×Chl a) -(129.2 ×Chl b))/221
(Carotenoids ×V ×W1)/(W2 × (π ×r^2 ) ×n)
Where, V: Final volume; W1: Weight per leaf disc; W2: Total weight of leaf discs; r: radius of the leaf discs; n: Number of leaf discs.
2.4.4. Soluble amino acid and soluble protein concentration
0.5 g of plant sample from leaf blade was homogenized with 5 mL of 50 mM phosphate buffer, pH 7 at 4°C (solution of 6.8 g of K2HPO4 dissolved in 1 L of distilled water, adjusted to pH 7 with a solution of 8.81 g of KH2PO4 dissolved in 1 L of distilled water). The sample was filtered through 4 layers of gauze and centrifuged at 1000 rpm for 15 min in a refrigerated centrifuge at 4 °C (Allegra™, 64R Centrifuge, Beckman Coulter, Brea, California, United States). The supernatant was used for the determination of amino acid and soluble protein concentration by the methods described by Yemm et al. [17] and Bradford [18], respectively.
For quantification of soluble amino acids, a 100 µL aliquot of supernatant was mixed with 1.5 mL of ninhydrin reagent (2 g of ninhydrin dissolved in 50 mL of ethylene glycol (CH2OHCH2OH), mixed with 80 mg of stannous chloride (SnCl2 · 2H2O) dissolved in 50 mL of 200 mM citrate buffer, pH 5 (solution of 59. 41 g of tribasic sodium citrate dihydrate (C6H5Na3O7 · 2H2O) dissolved in 1 L of distilled water, buffered to pH 5 with a solution of 38.81 g of anhydrous citric acid (C6H8O7)). The sample was shaken and subjected to a water bath at 100 °C for 20 min. The samples were then subjected to a water bath at 4 °C for 30 min and 8 mL of 1-Propanol (C3H8O) at 50% (v/v). Finally, the samples were measured at 570 nm using a UV-visible spectrophotometer (Thermo Fisher Scientific, GENESYS™ 10S, Wisconsin, United States), versus a glycine standard curve. The results were expressed as (mg g−1 FW).
For soluble protein quantification, a 20 µL aliquot of the centrifuged supernatant was taken and mixed with 1 mL of the Bradford Quick Start™ Protein Assay Kit dye reagent. Samples were shaken and allowed to stand for 15 min. Finally, they were measured at an absorbance of 595 nm through a UV-visible spectrophotometer. (Thermo Fisher Scientific, GENESYS™ 10S, Wisconsin, United States) against a bovine serum albumin (BSA) standard curve. The curve was prepared by taking 20 µL of each of the standards from the Bradford Quick Start™ protein assay kit at concentrations of. 0.125, 0.25, 0.5, 0.75, 1, 1.5, and 2 mg mL−1 of BSA and distilled water for the blank. The results were expressed as (mg g−1 FW).
2.4.5. Total nitrogen concentration
For the quantification of total nitrogen, an organic elemental analyzer was used (Thermo Fisher Scientific, FLASH 2000, Massachusetts, United States), the methodology described by Dumas [19] and adapted by Krotz and Giazzi [20] for plant material was used as a basis. 0.3 mg of the ground plant material (leaf, stem, fruit and root) was weighed on a soft tin microcontainer in an ultra-microbalance (Mettler Toledo, XP6 Excellence Plus XP, Ohio, United States), to which 9 mg of vanadium pentoxide (V2O5) was added and subsequently sealed. The sealed capsules were placed inside the automatic sampler carousel for analysis. The results were expressed as percentage of total nitrogen (%).
2.4.6. Nitrogen use efficiency parameters
Calculations of nitrogen use efficiency (NUE) parameters were based on the methodology of Moll et al. [21], with adaptations suggested by Congreves et al. [22]. Once the total N concentration was obtained, it was multiplied by 10 to obtain the total nitrogen content (TNC). The TNC was expressed as (mg g−1 DW).
TNC= Total nitrogen concentration×10
To obtain the amount of total nitrogen accumulated (TNA), the total biomass was multiplied by the TNC. The TNA was expressed as (mg).
TNA= Total biomass ×TNC
For the calculation of nitrogen utilization efficiency (NUtE), total biomass was divided by TNC. The value of NUtE was expressed as (g2 DW mg-1 N).
NUtE= (Total biomass)/TNC
The nitrogen uptake efficiency (NUpE) value was obtained by dividing TNA by the root biomass in dry weight and was expressed as (mg N g−1 DW).
NUpE= TNA/(Root biomass)
Finally, the nitrogen use efficiency index (NUE) was obtained by dividing the dry weight yield by TNA. NUE was expressed as (mg DW).
NUE= Yield/TNA
2.4.7. Nitrogen recovery percentage
The determination of the percentage of N recovered was based on the methodology described by Westermann et al. [23], with modifications suggested by Martin [24]. The total liters of nutrient solution applied to the crop were considered to calculate the amount of N applied. The total amount of nutrient solution per plant (L) was multiplied by the ammonium nitrate concentration (NH4NO3). The result was multiplied by a factor of 0.35, corresponding to the total N in the NH4NO3. The result was expressed as mg N applied. To determine the percentage of N recovered, the TNA (mg N) was divided by mg N applied. The result was multiplied by 100 and expressed as a percentage (%).
Percentage of N recovered= TNA/(Total N applied)
2.5. Statistical analysis
Once the data were obtained, they were subjected to a Shapiro-Wilk test to check the normal distribution. Additionally, they were subjected to a Bartlett's test to test for homogeneity of variances. Once the assumptions had been checked, the data were subjected to a one-way analysis of variance and a test of separation of means using the LSD-Fisher test. The SAS 9.0 statistical package was used for the statistical analyses. Different letters showed statistically significant differences according to the LSD-Fisher test (p≤0.05). Significance level: *: p≤0.05; **: p≤0.01; ***: p≤0.001.
3. Results
3.1. Total biomass and yield
The efficacy of the OMP doses applied in this experiment was reflected in the accumulation of total biomass (p<0.01), whose value increased significantly with respect to the control with the three doses used (Figure 2). Furthermore, despite the fact that the highest amount of biomass was presented in the OMP 100 treatment, with an increase of 32% with respect to the control, no significant differences were found between the doses of 1, 10 and 100 µM of OMP, so that the lower dose can be an effective alternative to promote biomass accumulation.
Pod yield was stimulated by the application of OMP on green bean plants (p<0.001). That is, all doses achieved an increase in pod production (Figure 2B). However, the highest yield was obtained in the OMP 1 treatment, with an increase of 171% with respect to the control. Finally, a downward trend was observed as the dose of OMP applied increased.
3.2. “In vivo" nitrate reductase enzyme activity (E.C. 1.7.1.1)
In our experiment, endogenous (p<0.01) and NO3− induced (p<0.001) NR activity was affected at different levels, depending on the dose of OMP applied. The highest endogenous NR activity was presented in the OMP 10 treatment, which was able to increase by 51% relative to the control (Figure 3a). On the other hand, the highest NO3- induced NR activity was obtained in the control treatment, which increased by 49% relative to OMP 100 and 30% relative to OMP 1 (Figure 3B).
3.3. Photosynthetic pigments concentration
Regarding the concentration of photosynthetic pigments, the application of OMP at a dose of 100 µM obtained the best results (Table 2). The highest concentration of chlorophyll a (p<0.01) was present in the OMP 100 treatment, being higher by 22% and 16% with respect to OMP 10 and OMP 1. As for chlorophyll b (p<0.05), the OMP 100 treatment showed the highest concentration, with an increase of 14% with respect to the control. A similar trend was observed for carotenoid concentration (p<0.001), where the OMP 100 treatment was the most favored, with an increase of 31% over the control.
3.4. Soluble amino acid and soluble protein concentration
Regarding the concentration of soluble amino acids and soluble protein analyzed in our study, the application of OMP stimulated their production at low doses in bean plants (Figure 4). In other words, the highest concentration of soluble amino acids (p<0.01) was presented in the OMP 1 treatment, with an increase of 14% with respect to the control. On the other hand, the OMP 10 treatment presented the highest concentration of soluble proteins (p<0.07), with an increase of 18% with respect to the control.
3.5. Total nitrogen concentration
In our study, a slight increase in N concentration (p<0.001) was observed as the dose of OMP applied increased (Figure 5). However, although total N concentration was not statistically different between the 1, 10 and 100 µM doses, the highest concentration was found in the OMP 100 treatment, with an increase of 15% with respect to the control. Finally, the 1 µM dose could be more effective by reducing the OMP dose 100 times and increasing the N concentration by 13%.
3.6. Nitrogen use efficiency parameters
The nitrogen use efficiency, estimated through four different parameters, obtained the best results with the 1 µM dose of OMP in green bean plants (Figure 6). The highest amount of total nitrogen accumulated (p<0.001) was found in the OMP 100 treatment, with an increase of 52% compared to the control (Figure 6a). However, no significant differences were found between the 1, 10 and 100 µM doses.
With respect to NUpE (p<0.06) and NUtE (NS) parameters, the treatments with the most favorable increases were respectively OMP 10, with an increase of 16% compared to the control and OMP 100 with an increase of 15% compared to the control, respectively. Finally, the highest nitrogen use efficiency index (p≤0.05) was obtained in the OMP 1 treatment, being 82% higher compared to the control.
3.7. Nitrogen recovery percentage
Finally, the effectiveness of the OMP doses used in this experiment, in the recovery of nitrogen percentage (p<0.01) had a positive effect without depending on the dose (Figure 7). The highest percentage recovery was found in the OMP 100 treatment, with an increase of 52% with respect to the control. However, no significant statistical difference was found with respect to the 1 and 10 µM doses, both options being viable with a considerable decrease in OMP applied.
4. Discussion
Previous studies have documented the effectiveness of omeprazole application to improve growth, development and nitrogen assimilation in several crops such as corn, tomato, basil and mint. In our experiment, the total biomass of bean plants showed a similar increase at both low and high doses (Figure 2a). This behavior has been previously described by several authors, who suggest that OMP-treated plants increase plant growth and prolong their plant growth stage, due to the interaction of OMP with endogenous auxin [25]. For example, Elansary and El-Abedin [25] reported a 15% increase in dry weight of mint plants treated with OMP at 100 µM. Carrillo et al. [26] reported increases of 14% in shoot dry weight and 27% in root dry weight of basil plants treated with OMP at 10 µM. Likewise, Carrillo et al. [27] found 7% increases in dry biomass of lettuce plants treated with 10 µM OMP. Also, Rouphael et al. [11] reported that, under salinity conditions, the application of 100 µM OMP increased the dry weight of tomato plants by 43%.
Crop yield is influenced by growth conditions and nutritional status, among other factors [28]. Therefore, yield estimation can be indicative of the effectiveness of the treatments applied. Regarding pod yield, the results are similar to those found by several authors in other plant species. Rouphael et al. [11] reported yield increases of 54% and 39% in tomato plants when omeprazole was applied at doses of 10 and 100 µM, respectively. However, in our study, the higher dose of OMP resulted in a decrease in yield. That is, the highest yield was obtained at the 1 µM dose and as the dose was increased by 10 and 100 times, the value decreased with a drop of 37%. This could indicate a negative effect of OMP at high concentrations on pod production for bean plants. In addition, the national average yield in Mexico for green beans is around 51.8 g plant−1 FW [29]. The treatment with the highest pod yield (OMP 1) was below that average by 29%, however, the treatment without OMP application was drastically reduced by 249%. This indicates that OMP at low doses can be a viable alternative to increase crop yield.
The most limiting step for N assimilation in plants is the reduction of NO3− to NO2−, carried out by the enzyme NR [30]. In addition, the drastic effect on the increase of plant biomass may be related to a correct supply of N-assimilates, which starts with this process. The 10 µM dose was optimal for increasing NR activity, however, it was not statistically different to the 1 µM dose (Figure 3A). These results are identical to those reported by Van Oosten et al. [10], who found 48% increases in NR enzyme activity in maize seedlings treated with OMP at 10 µM dose and 18% at 1 µM dose. Similarly, Possibly the improvement in enzyme activity is due to the increase in the activation state of the enzyme. Likewise, among the 1 and 10 µM doses, the one that showed the lowest activity upon induction with NO3− was OMP 1, which may suggest that the enzyme was saturated with substrate and therefore at its maximum activity capacity. The results suggest that the application of OMP contributes to maintaining a specificity of the NR enzyme to the substrate and thus a constant catalytic activity [10].
Previously, several authors have used the concentration of photosynthetic pigments in leaves as a valuable indicator of physiological status in plants [31]. In the present study, chlorophyll a, chlorophyll b and carotenoids obtained their greatest value with the highest dose of OMP (Table 2). A deficiency of photosynthetic pigments may be related to a nutritional imbalance of N in leaves. Moreover, since photosynthetic pigments are readily available nitrogenous compounds, they can be used as an intracellular N reserve to support growth in case of limiting [32]. Possibly, this mechanism was manifested in the OMP 100 treatment, where chlorophyll a, b and carotenoid concentrations were stimulated and, in addition, the highest biomass was obtained, reinforcing the idea that the application of OMP at high concentrations prolongs the vegetative cycle of plants. On the other hand, OMP has been described as responsible for interacting with endogenous abscisic acid (ABA) levels in plants [10]. Possibly the prolongation of the vegetative period and the lack of induction in pod formation and filling was caused by the high doses of OMP that induced a higher concentration of carotenoids (Table 2). Thus, as the ripening stage progresses, ABA levels drop, so carotenoid concentration decreases [33]. This condition may have occurred in the OMP 1 treatment, which achieved a higher yield, as opposed to OMP 100, which only achieved a higher biomass accumulation. Finally, further studies on the role of OMP in the biosynthesis of ABA and carotenoid-derived compounds are needed.
Plant development and growth can be related to an adequate amino acid content as these are key products to form proteins, nucleic acids and other cellular compounds [34]. Overall, OMP treatment at 1 µM dose was notable for its higher concentration of soluble amino acids and high concentration of soluble proteins (Figure 5). Possibly, the key to the mechanism through which OMP acts to increase plant growth and yield is in the amino acid content. The treatment with the highest yield was the same treatment with the highest concentration of soluble amino acids (b and Figure 4a). As described by several authors previously, OMP enhances plant growth through its interaction with the auxin synthesis process [10]. Endogenous auxin synthesis starts from intracellular amino acid content, specifically tryptophan as a precursor [35]. Probably, one of the mechanisms that favored both biomass accumulation and higher yield in OMP 1 was the accumulation of soluble amino acids, which facilitated the transport of assimilates to the source organs.
Finally, total nitrogen concentration and nitrogen use efficiency parameters can be indicators of the mechanisms that favored high yield and plant biomass creation in bean plants [36]. Similarly, commonly used parameters to estimate the efficiency of fertilizers used for crop production are uptake efficiency (NUpE), utilization (NUtE) and nitrogen use efficiency (NUE) [37]. The application of OMP at both high and low rates contributed to the increase in N concentration (Figure 5). Likewise, according to the values obtained in nitrogen uptake efficiency (NUpE) and utilization (NUtE), it can be indicated that the application of OMP at both low and high doses favors N uptake and translocation in bean plants (Figure 6). It is possible that the reason why there were no significant differences in the utilization coefficient (NUtE) is that all treatments were under optimal N nutrition, so their performance was normal (Figure 6c). However, the highest coefficient of efficiency (NUE) was obtained with the lowest dose of OMP (1 µM) (Figure 6d). This result could indicate that the most favorable dose for both agronomic, biochemical and resource use efficiency parameters is the 1 µM dose.
It is important to know the percentage of N recovery in plants as a complement to the parameters of NUE, since, sometimes, systems with high N inputs tend to decrease yields, contrary to what might be thought [38]. Likewise, the lowest dose of OMP contributed to recover about 10% of N applied to bean plants, competing with doses 10 and 100 times higher, which could be reflected in higher yields and a considerable decrease in inputs (Figure 7).
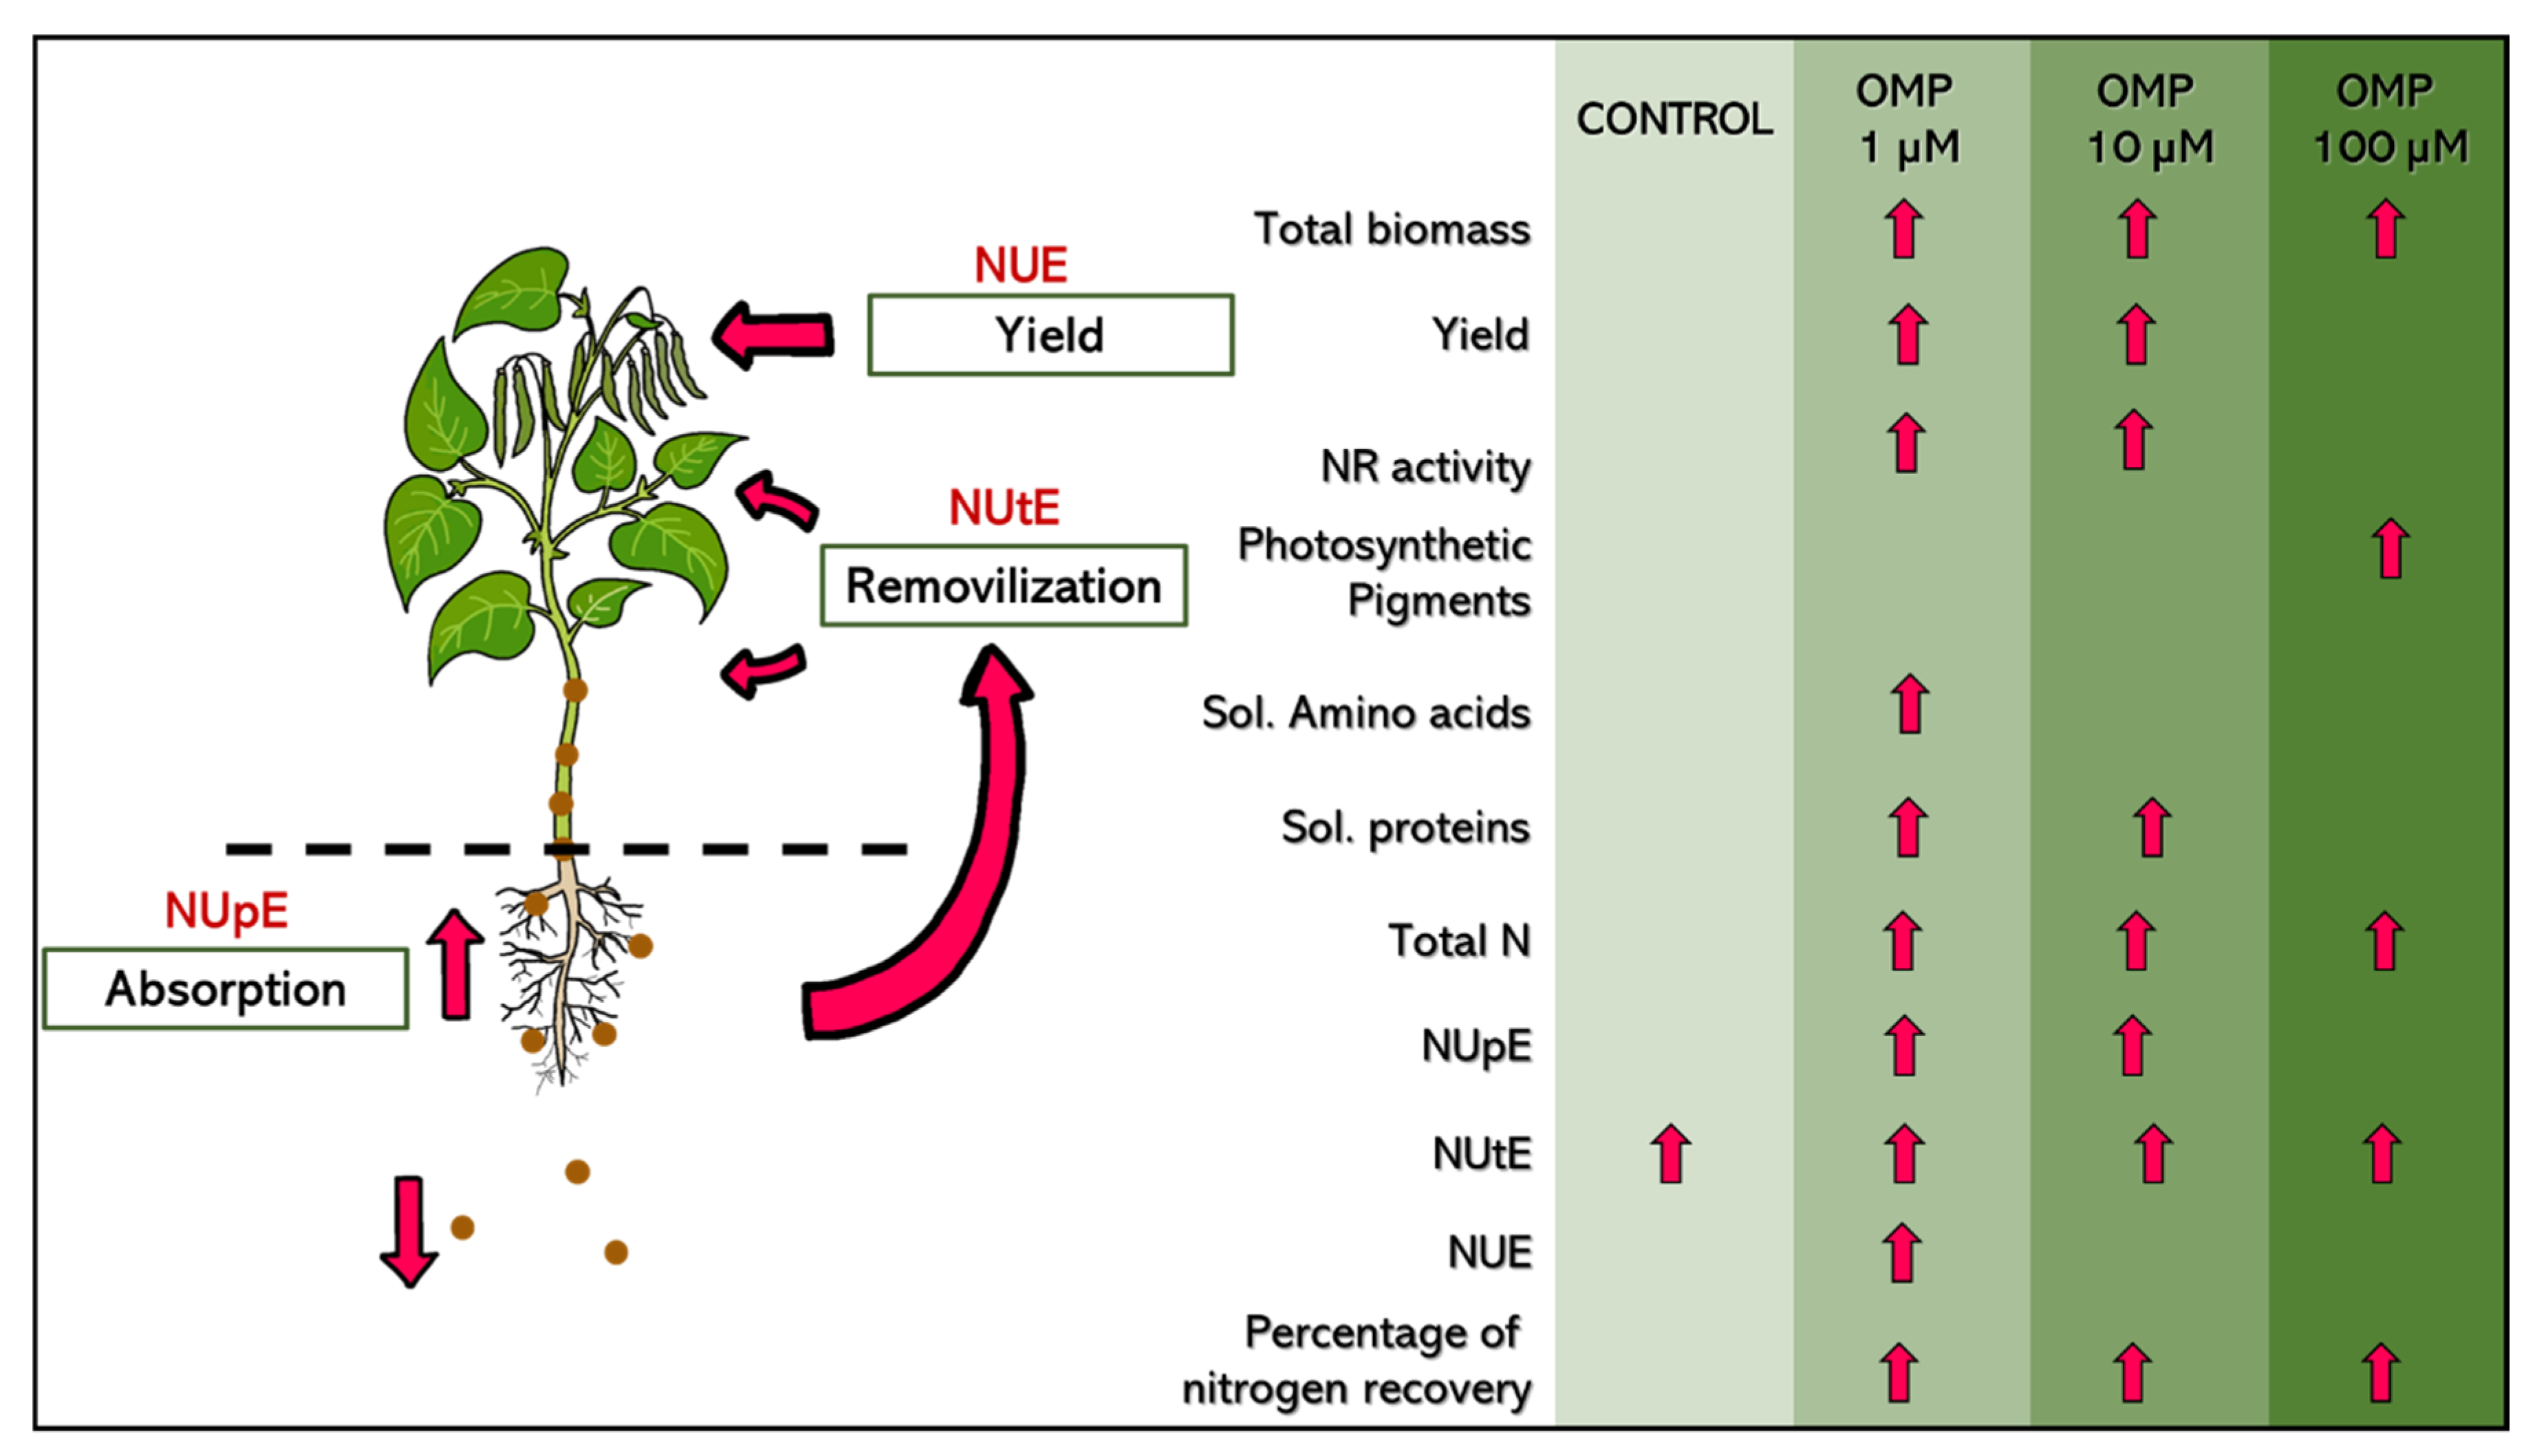
Figure 8.
Diagram of physiological and biochemical responses of green bean plants cv. Strike to foliar application of OMP at 0 (control), 1, 10 and 100 µM.
Figure 8.
Diagram of physiological and biochemical responses of green bean plants cv. Strike to foliar application of OMP at 0 (control), 1, 10 and 100 µM.
5. Conclusions
According to the results obtained, it is concluded that the foliar application of OMP at a dose of 1 µM is considered optimal to increase growth, pod production, soluble amino acids and nitrogen use efficiency of green bean plants cv. Strike. In addition, OMP application was able to promote N assimilation through increased NR enzyme activity, higher N concentration and end products such as amino acids and proteins. Also, the application of OMP at 100 µM dose increased the photosynthetic pigments. Finally, the results suggest that OMP can be a viable alternative to be incorporated in agriculture and increase crop production in a sustainable way.
Author Contributions
The authors confirm contribution to the paper as follows: study conception and design (C.A.R.-E.) and (E.S.); Data collection: (C.A.R.-E), (S.P.-Á.) And (R.M.Y.-M); Analysis and interpretation of results: (C.C.-M.), (M.A.F.-C.); draft manuscript preparation: (C.A.R.-E.), (E.S.). All authors reviewed the results and approved the final version of the manuscript.
Funding
This research received no external funding.
Data Availability Statement
The authors declare that all data discussed in the study are available in the manuscript.
Acknowledgments
We would like to thank the Consejo Nacional de Humanidades, Ciencia y Tecnología (CONHACyT— Mexico) for the support provided by the Convocatoria Atención a Problemas Nacionales: Project #1529 “Biofortification of basic agricultural crops representing the key to combat malnutrition and ensure food security in Mexico”. Also, for the scholarship granted to Carlos Abel Ramirez Estrada through the "Becas Nacionales CONAHCYT" program with CVU No. 1011744.
Conflicts of Interest
The authors declare no conflicts of interest.
References
- Huang, S.; He, P.; Jia, L.; Ding, W.; Ullah, S.; Zhao, R.; Zhang, J.; Xu, X.; Liu, M.; Zhou, W. Improving nitrogen use efficiency and reducing environmental cost with long-term nutrient expert management in a summer maize-winter wheat rotation system. Soil tillage res. 2021, 213, 105117. [Google Scholar] [CrossRef]
- Cameron, K.C.; Di, H.J.; Moir, J.L. Nitrogen losses from the soil/plant system: a review. Ann. Appl. Biol. 2013, 162(2), 145–173. [Google Scholar] [CrossRef]
- Barker, A.V.; Bryson, G.M. Nitrogen. In Handbook of plant nutrition, 1st ed.; Barker, A.V., Pilbeam, D.J., Eds.; CRC Press: Boca Raton, United States, 2006; Volume , pp. 37–66. [Google Scholar] [CrossRef]
- Snyder, C.S.; Davidson, E.A.; Smith, P.; Venterea, R.T. Agriculture: sustainable crop and animal production to help mitigate nitrous oxide emissions. Curr. Opin. Environ. Sustain. 2014, 9, 46–54. [Google Scholar] [CrossRef]
- Li, H.; Hu, B.; Chu, C. Nitrogen use efficiency in crops: lessons from Arabidopsis and rice. J. Exp. Bot. 2017, 68(10), 2477–2488. [Google Scholar] [CrossRef]
- Javed, T.; Singhal, R.K.; Shabbir, R.; Shah, A.N.; Kumar, P.; Jinger, D.; Dharmappa, P.M.; Shad, M.A.; Saha, D.; Anuragi, H.; Adamski, R.; Siuta, D. Recent advances in agronomic and physio-molecular approaches for improving nitrogen use efficiency in crop plants. Front. Plant Sci. 2022, 13, 877544. [Google Scholar] [CrossRef] [PubMed]
- Beatty, P.H.; Klein, M.S.; Fischer, J.J.; Lewis, I.A.; Muench, D.G.; Good, A.G. Understanding plant nitrogen metabolism through metabolomics and computational approaches. Plants. 2016, 5(4), 39. [Google Scholar] [CrossRef] [PubMed]
- Karpova, N.V.; Shagdarova, B.T.; Lyalina, T.S.; Il’Ina, A.V.; Tereshina, V.M.; Varlamov, V.P. Influence of the main characteristics of low weight chitosan on the growth of the plant pathogenic fungus Botrytis сinerea. ppl. Biochem. Microbiol. 2019, 55, 405–413. [Google Scholar] [CrossRef]
- Gago, J.; Estrany, J.; Estes, L.; Fernie, A.R.; Alorda, B.; Brotman, Y.; Flexas, J.; Escalona, J.M.; Medrano, H. Nano and micro unmanned aerial vehicles (UAVs): a new grand challenge for precision agriculture? . Curr. Protoc. Plant Biol. 2020, 5(1), e20103. [Google Scholar] [CrossRef] [PubMed]
- Van Oosten, M.J.; Dell’Aversana, E.; Ruggiero, A.; Cirillo, V.; Gibon, Y.; Woodrow, P.; Maggio, A.; Carillo, P. Omeprazole treatment enhances nitrogen use efficiency through increased nitrogen uptake and assimilation in corn. Front. Plant Sci. 2019, 10, 1507–10. [Google Scholar] [CrossRef] [PubMed]
- Rouphael, Y.; Raimondi, G.; Lucini, L.; Carillo, P.; Kyriacou, M.C.; Colla, G.; Cirillo, V.; Pannico, A.; El-Nakhel, C.; De Pascale, S. Physiological and metabolic responses triggered by omeprazole improve tomato plant tolerance to NaCl stress. Front. Plant Sci. 2018, 9, 249. [Google Scholar] [CrossRef] [PubMed]
- Maggio, A.; Cirillo, V. Omeprazole, a proton-pump inhibitor on humans, acts as a growth enhancer and stress protectant in plants. Doctoral thesis, Università degli Studi di Napoli Federico II. Napoli, Italy, October 2018.
- Cirillo, V.; Van Oosten, M.J.; Izzo, M.; Maggio, A. Omeprazole treatment elicits contrasting responses to salt stress in two basil genotypes. Ann. Appl. Biol. 2019, 174(3), 329–338. [Google Scholar] [CrossRef]
- Sánchez, E.; Ruiz, J.M.; Romero, L. Proline metabolism in response to nitrogen toxicity in fruit of French Bean plants (Phaseolus vulgaris L. cv Strike). Sci. Hortic. 2022, 93, 225–233. [Google Scholar] [CrossRef]
- Sánchez, E.; Rivero, R.M.; Ruiz, J.M.; Romero, L. Changes in biomass, enzymatic activity and protein concentration in roots and leaves of green bean plants (Phaseolus vulgaris L. cv. Strike) under high NH4NO3 application rates. Sci. Hortic 2004, 99, 237–248. [Google Scholar] [CrossRef]
- Wellburn, A.R. The spectral determination of chlorophylls a and b, as well as total carotenoids, using various solvents with spectrophotometers of different resolution. J. Plant Physiol. 1994, 144(3), 307–313. [Google Scholar] [CrossRef]
- Yemm, E.E.; Cocking, E.C.; Ricketts, R.E. The determination of amino-acids whit ninhydrin. Analyst 1955, 80, 209–214. [Google Scholar] [CrossRef]
- Bradford, M.M. A rapid and sensitive method for the quantitation of microgram quantities of protein utilizing the principle of protein-dye binding. Anal. Biochem. 1976, 72, 248–254. [Google Scholar] [CrossRef] [PubMed]
- Dumas, J.B.A. Procédés de l’analyse organique. Annal. Chim. Phys. 1831, 47, 198–205. [Google Scholar]
- Krotz, L.; Giazzi, G. Nitrogen, carbon and sulfur determination in paper by flash combustion. In Thermo Fisher Scientific, Italy. Available online (Access on 3 November 2023).
- Moll, R.H.; Kamprath, E.J.; Jackson, W.A. Analysis and interpretation of factors which contribute to efficiency of nitrogen utilization. Agron J. 1982, 74(3), 562–564. [Google Scholar] [CrossRef]
- Congreves, K.A.; Otchere, O.; Ferland, D.; Farzadfar, S.; Williams, S.; Arcand, M.M. Nitrogen use efficiency definitions of today and tomorrow. Front. Plant Sci. 2021, 12, 637108. [Google Scholar] [CrossRef]
- Westermann, D.T.; Kleinkopf, G.E.; Porter, L.K. Nitrogen fertilizer efficiencies on potatoes. Am. Potato J. 1988, 65, 377–386. [Google Scholar] [CrossRef]
- Martin, R.J. The effect of nitrogen fertilizer on the recovery of nitrogen by a potato crop. Proceedings of Agronomy Society of New Zealand 1995, 25, 97–104. [Google Scholar]
- Elansary, H.O. El-Abedin, T.K.Z. Omeprazole alleviates water stress in peppermint and modulates the expression of menthol biosynthesis genes. Plant Physiol. Biochem. 2019, 139, 578–586. [Google Scholar] [CrossRef] [PubMed]
- Carillo, P.; Woodrow, P.; Raimondi, G.; El-Nakhel, C.; Pannico, A.; Kyriacou, M.C.; Colla, G.; Mori, M.; Giordano, M.; De Pascale, S.; Rouphael, Y. Omeprazole promotes chloride exclusion and induces salt tolerance in greenhouse basil. Agronomy 2019, 9, 355. [Google Scholar] [CrossRef]
- Carillo, P.; Raimondi, G.; Kyriacou, M.C.; Pannico, A.; El-Nakhel, C.; Cirillo, V.; Colla, G.; De Pascale, S. Rouphael, Y. Morpho-physiological and homeostatic adaptive responses triggered by omeprazole enhance lettuce tolerance to salt stress. Sci. Hortic. 2019, 249, 22–30. [Google Scholar] [CrossRef]
- Monreal, C.M.; DeRosa, M.; Mallubhotla, S.C.; Bindraban, P.S. Dimkpa, C. Nanotechnologies for increasing the crop use efficiency of fertilizer-micronutrients. Biol. Fertil. Soils. 2016, 52, 423–437. [Google Scholar] [CrossRef]
- Servicio de Información Agroalimentaria y Pesquera (SIAP). (12 de octubre de 2023). Cierre de la producción agrícola. Recuperado de http: https://nube.siap.gob.mx/cierreagricola/. Agrifood and Fisheries Information Service (SIAP-México) (October 12, 2023). Closing of agricultural production. Recovered from https://nube.siap.gob.mx/cierreagricola/.
- Kishorekumar, R.; Bulle, M.; Wany, A.; Gupta, K.J. An overview of important enzymes involved in nitrogen assimilation of plants. In Nitrogen metabolism in plants: methods and protocols; 2020; pp. 1–13. [Google Scholar] [CrossRef]
- Filimon, R.V.; Rotaru, L.; Filimon, R. M. Quantitative investigation of leaf photosynthetic pigments during annual biological cycle of Vitis vinifera L. table grape cultivars. South African J. Enol. Vitic. 2016, 37, 1–14. [Google Scholar] [CrossRef]
- Benavente-Valdés, J.R.; Aguilar, C.; Contreras-Esquivel, J.C.; Méndez-Zavala, A.; Montañez, J. Strategies to enhance the production of photosynthetic pigments and lipids in chlorophycae species. Biotechnol. Rep. 2016, 10, 117–125. [Google Scholar] [CrossRef]
- Jia, K.P.; Mi, J.; Ali, S.; Ohyanagi, H.; Moreno, J.C.; Ablazov, A.; Balakrishna, A.; Berqdar, L.; Fiore, A.; Diretto, G.; Martínez, C.; de Lera, A.R.; Gojobori, T.; Al-Babili, S. An alternative, zeaxanthin epoxidase-independent abscisic acid biosynthetic pathway in plants. Mol. Plant. 2022, 15(1), 151–166. [Google Scholar] [CrossRef]
- Moe, L.A. Amino acids in the rhizosphere: from plants to microbes. Am. J. Bot. 2013, 100(9), 1692–1705. [Google Scholar] [CrossRef]
- Gomes, G.L.B.; Scortecci, K.C. Auxin and its role in plant development: structure, signalling, regulation and response mechanisms. Plant Biol. 2021, 23(6), 894–904. [Google Scholar] [CrossRef]
- Cameron, K.C.; Di, H.J.; Moir, J.L. Nitrogen losses from the soil/plant system: a review. Ann. Appl. Biol. 2013, 162(2), 145–173. [Google Scholar] [CrossRef]
- Galloway, J.N.; Winiwarter, W.; Leip, A.; Leach, A.M.; Bleeker, A.; Erisman, J.W. Nitrogen footprints: past, present and future. Environ. Res. Lett. 2014, 9(11), 115003. [Google Scholar] [CrossRef]
- Conant, R.T.; Berdanier, A.B.; Grace, P.R. Patterns and trends in nitrogen use and nitrogen recovery efficiency in world agriculture. Glob. Biogeochem. Cycles. 2013, 27(2), 558–566. [Google Scholar] [CrossRef]
Figure 1.
Graphic description of omeprazole treatments.
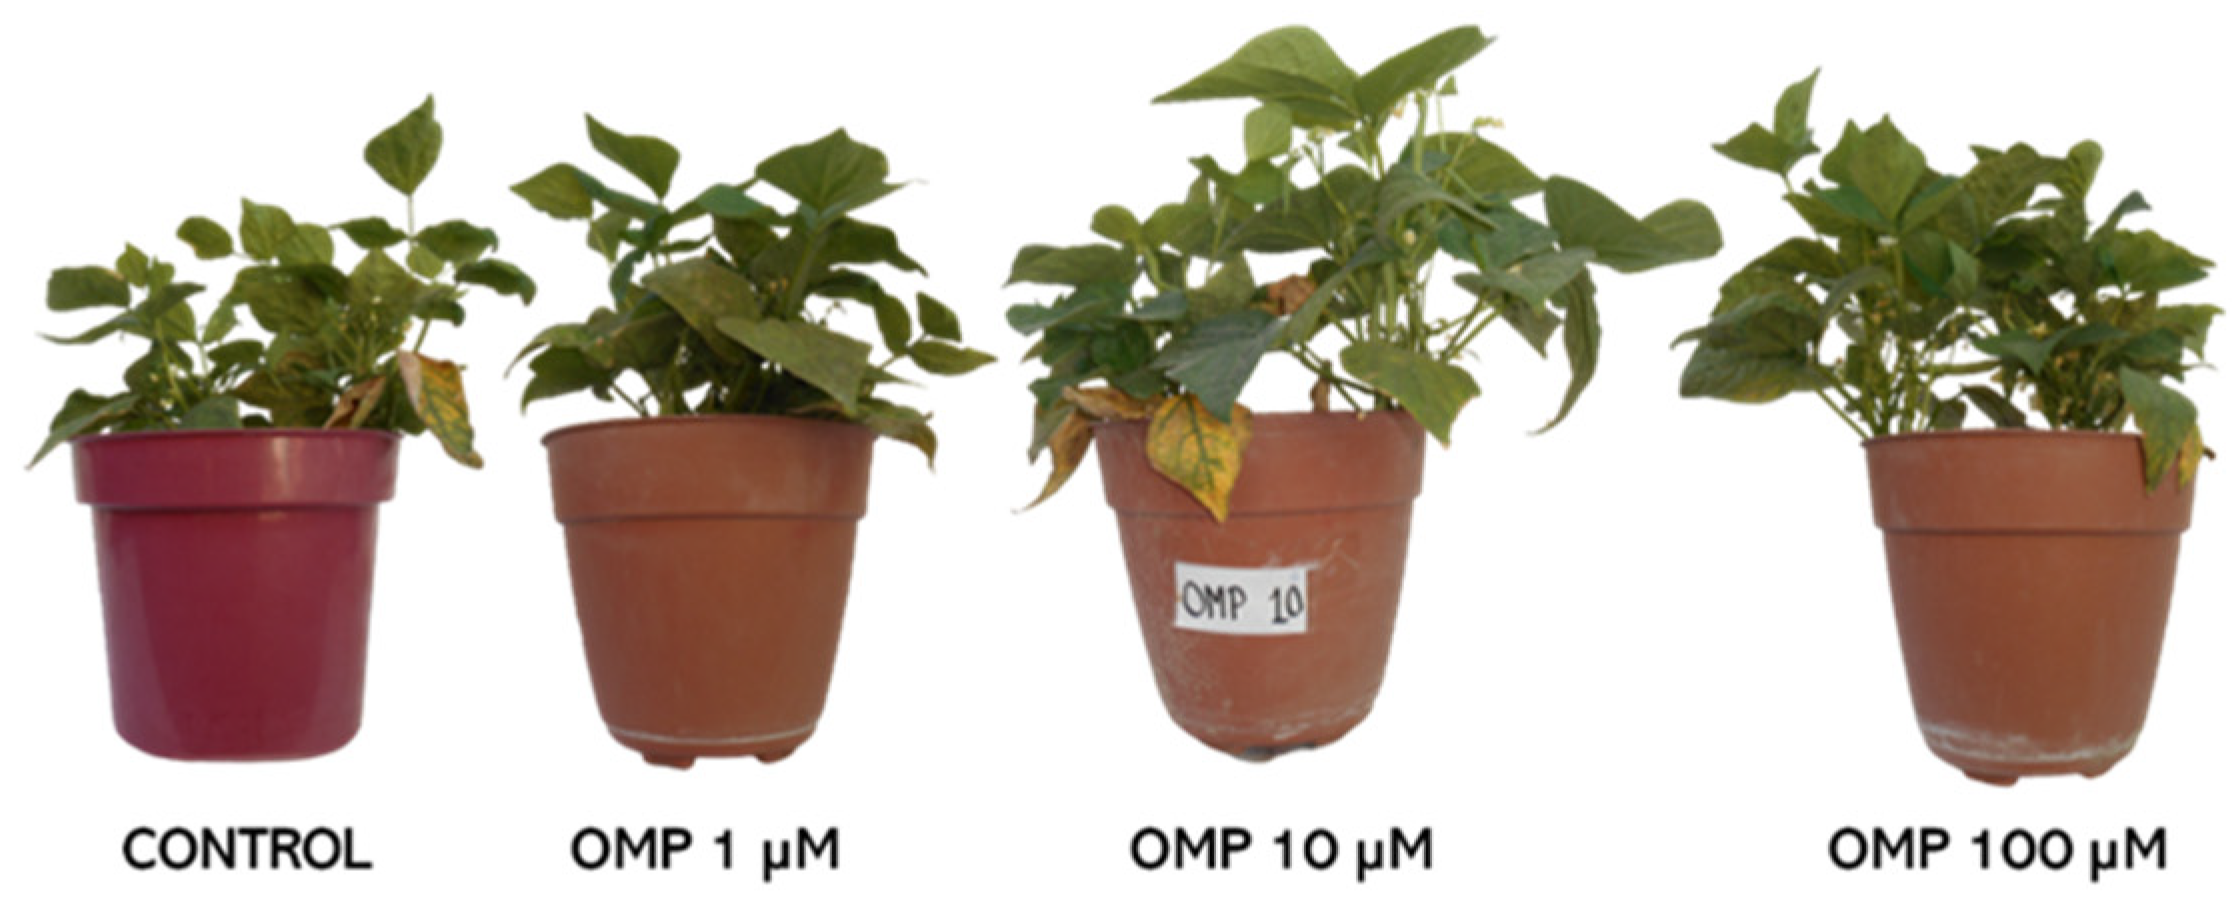
Figure 2.
Effect of foliar OMP dose applied to green bean plants cv. Strike on total biomass accumulation (a) and pod yield (b). Different letters indicate significant statistical differences according to the LSD-Fisher test (p≤0.05).
Figure 2.
Effect of foliar OMP dose applied to green bean plants cv. Strike on total biomass accumulation (a) and pod yield (b). Different letters indicate significant statistical differences according to the LSD-Fisher test (p≤0.05).
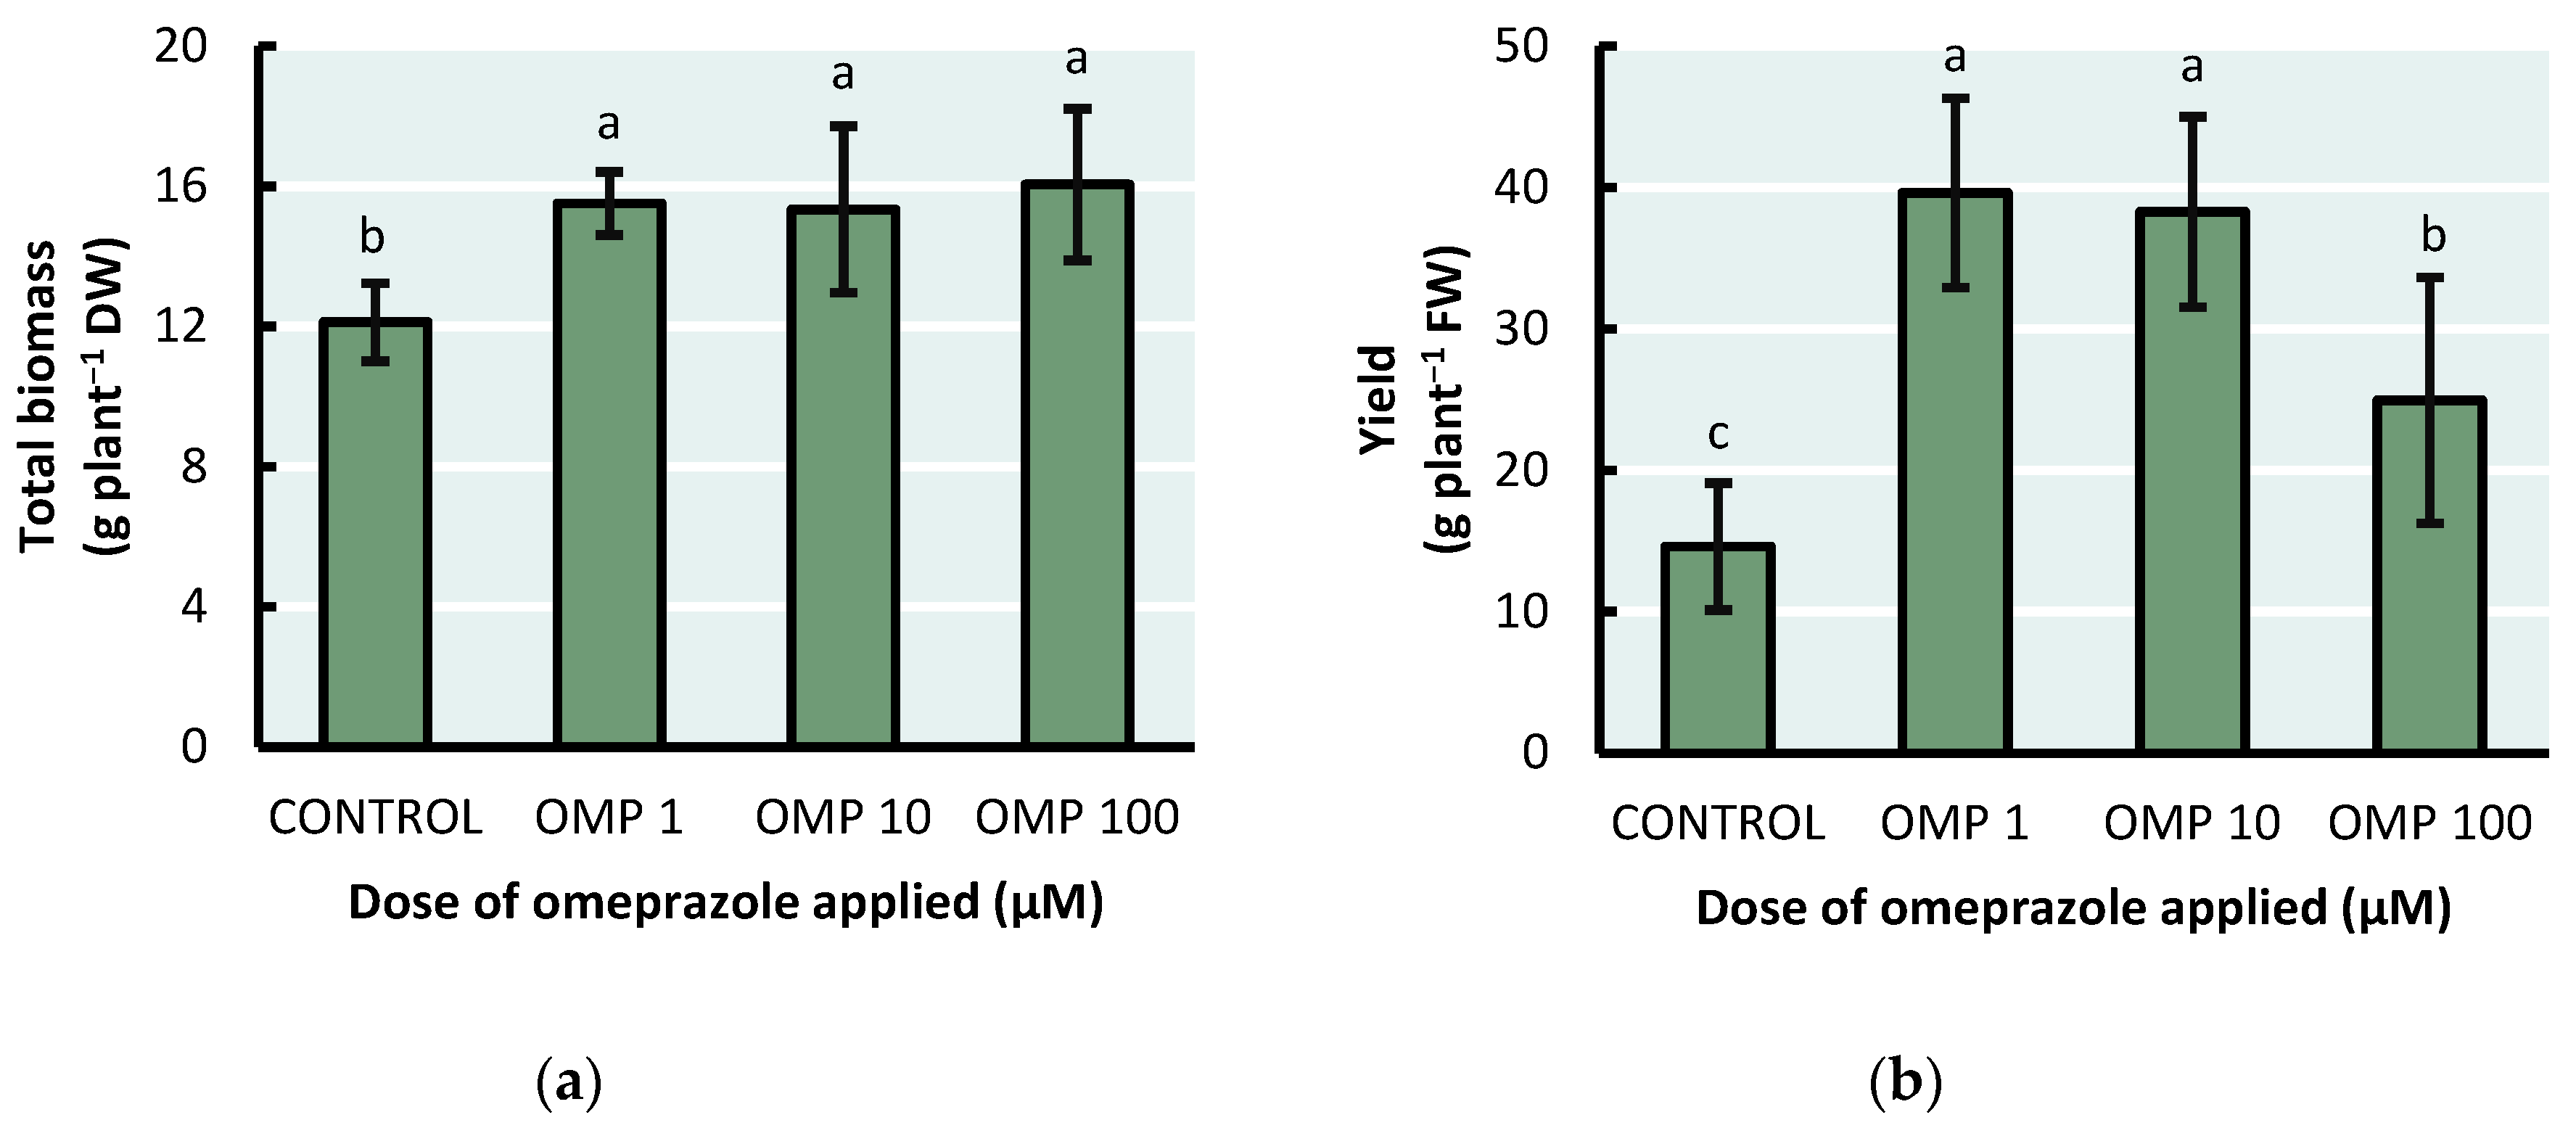
Figure 3.
Effect of foliar OMP applied to green bean plants cv. Strike on (a) endogenous NR enzyme activity and (b) induced with NO3- nitrate reductase activity. Different letters indicate significant statistical differences according to the LSD-Fisher test (p≤0.05).
Figure 3.
Effect of foliar OMP applied to green bean plants cv. Strike on (a) endogenous NR enzyme activity and (b) induced with NO3- nitrate reductase activity. Different letters indicate significant statistical differences according to the LSD-Fisher test (p≤0.05).
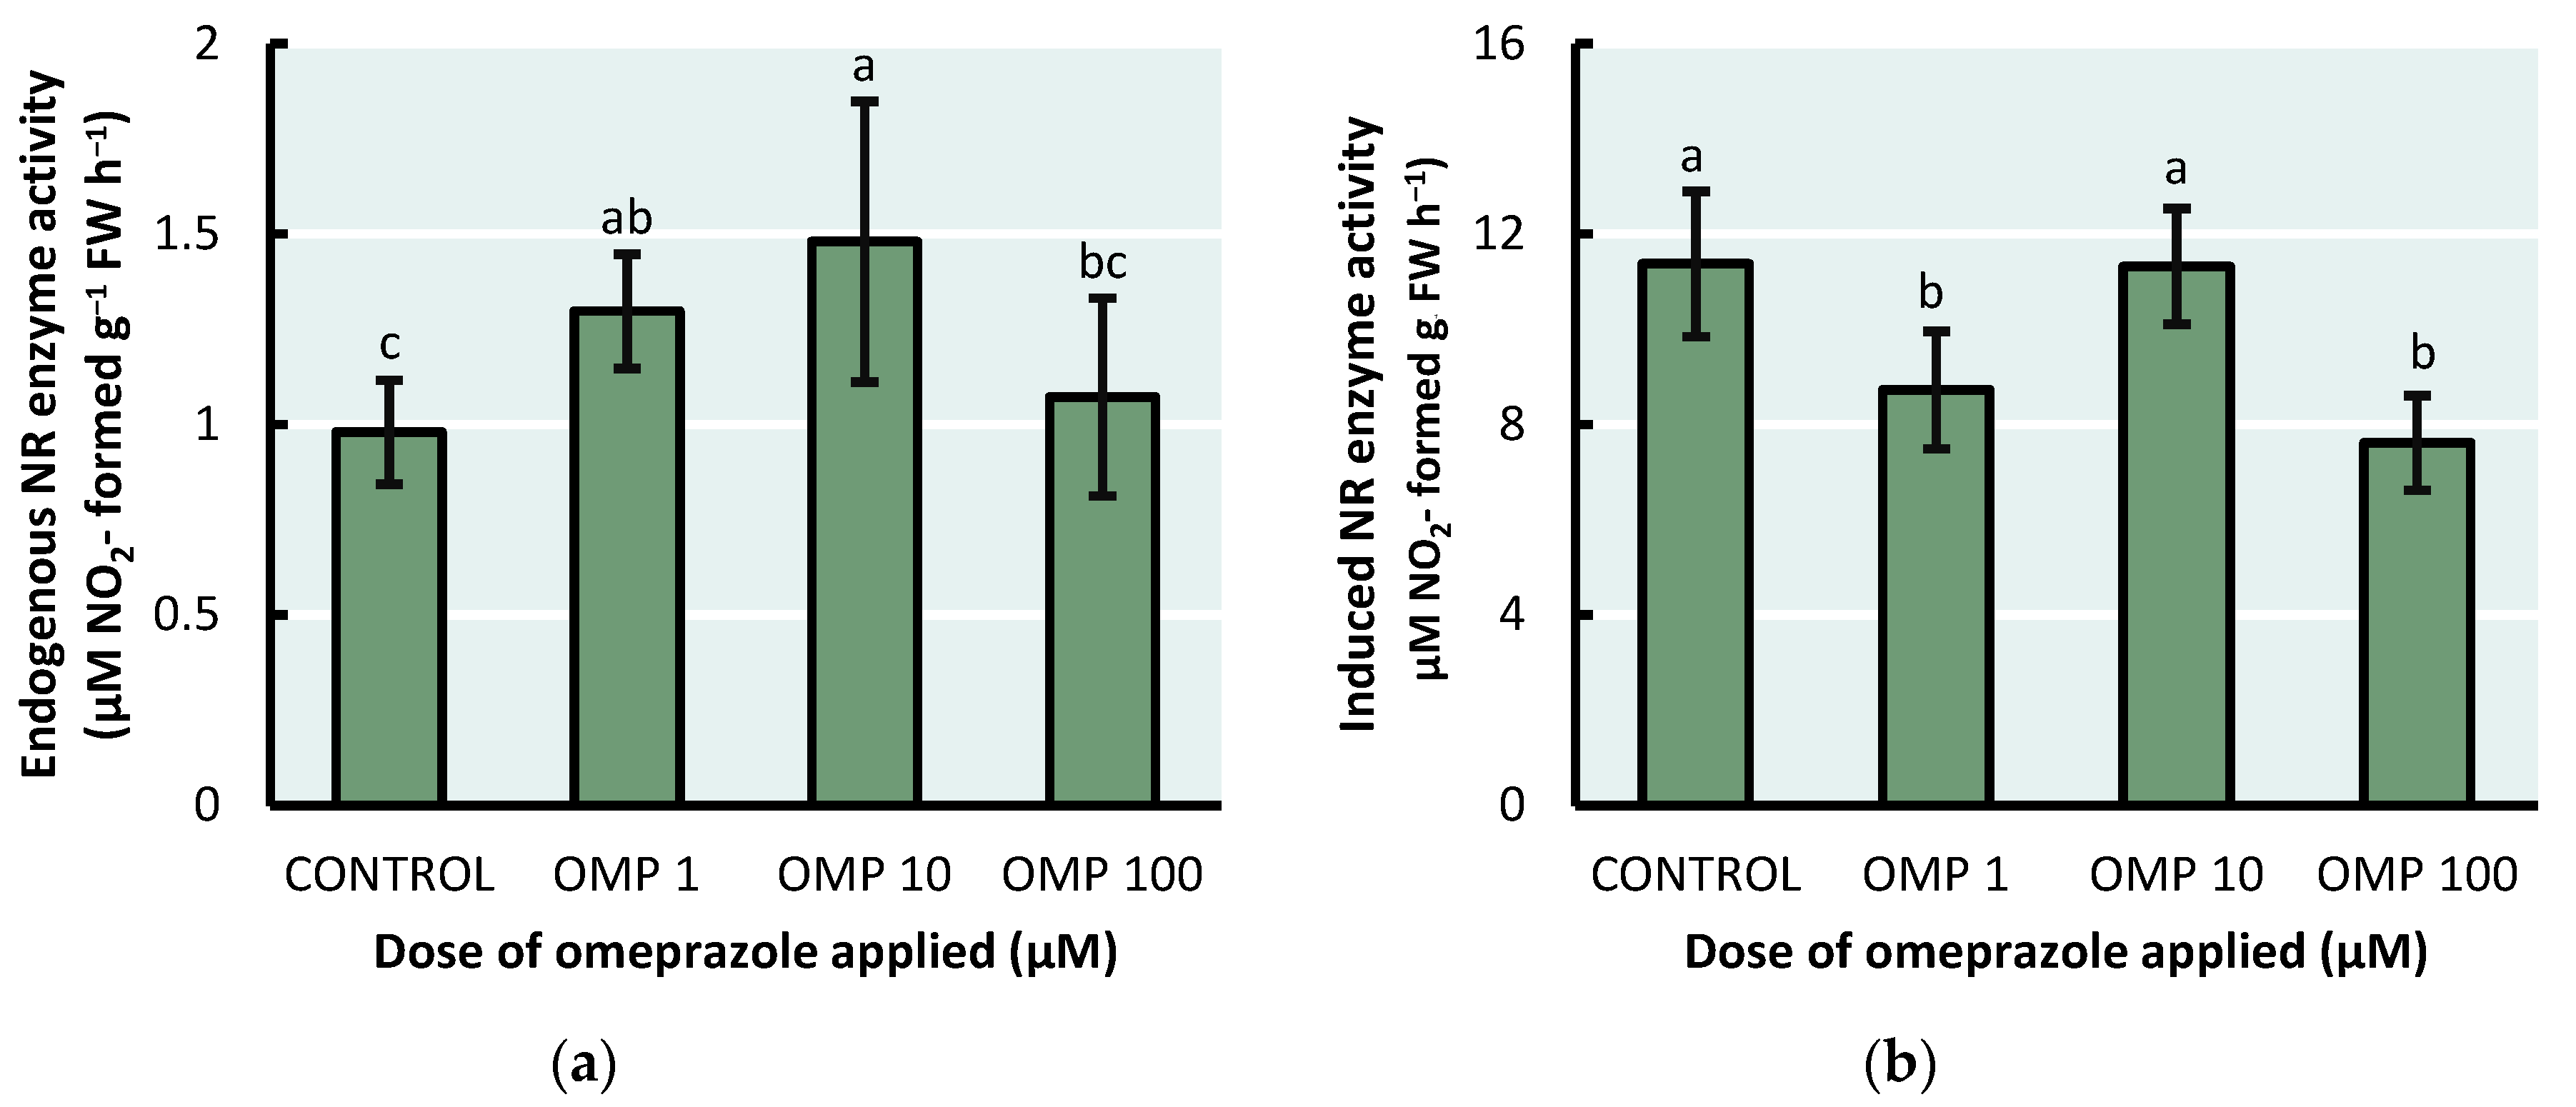
Figure 4.
Effect of foliar OMP dose applied to green bean plants cv. Strike on the concentration of (a) soluble amino acids and (b) soluble proteins. Different letters indicate significant statistical differences according to the LSD-Fisher test (p≤0.05).
Figure 4.
Effect of foliar OMP dose applied to green bean plants cv. Strike on the concentration of (a) soluble amino acids and (b) soluble proteins. Different letters indicate significant statistical differences according to the LSD-Fisher test (p≤0.05).
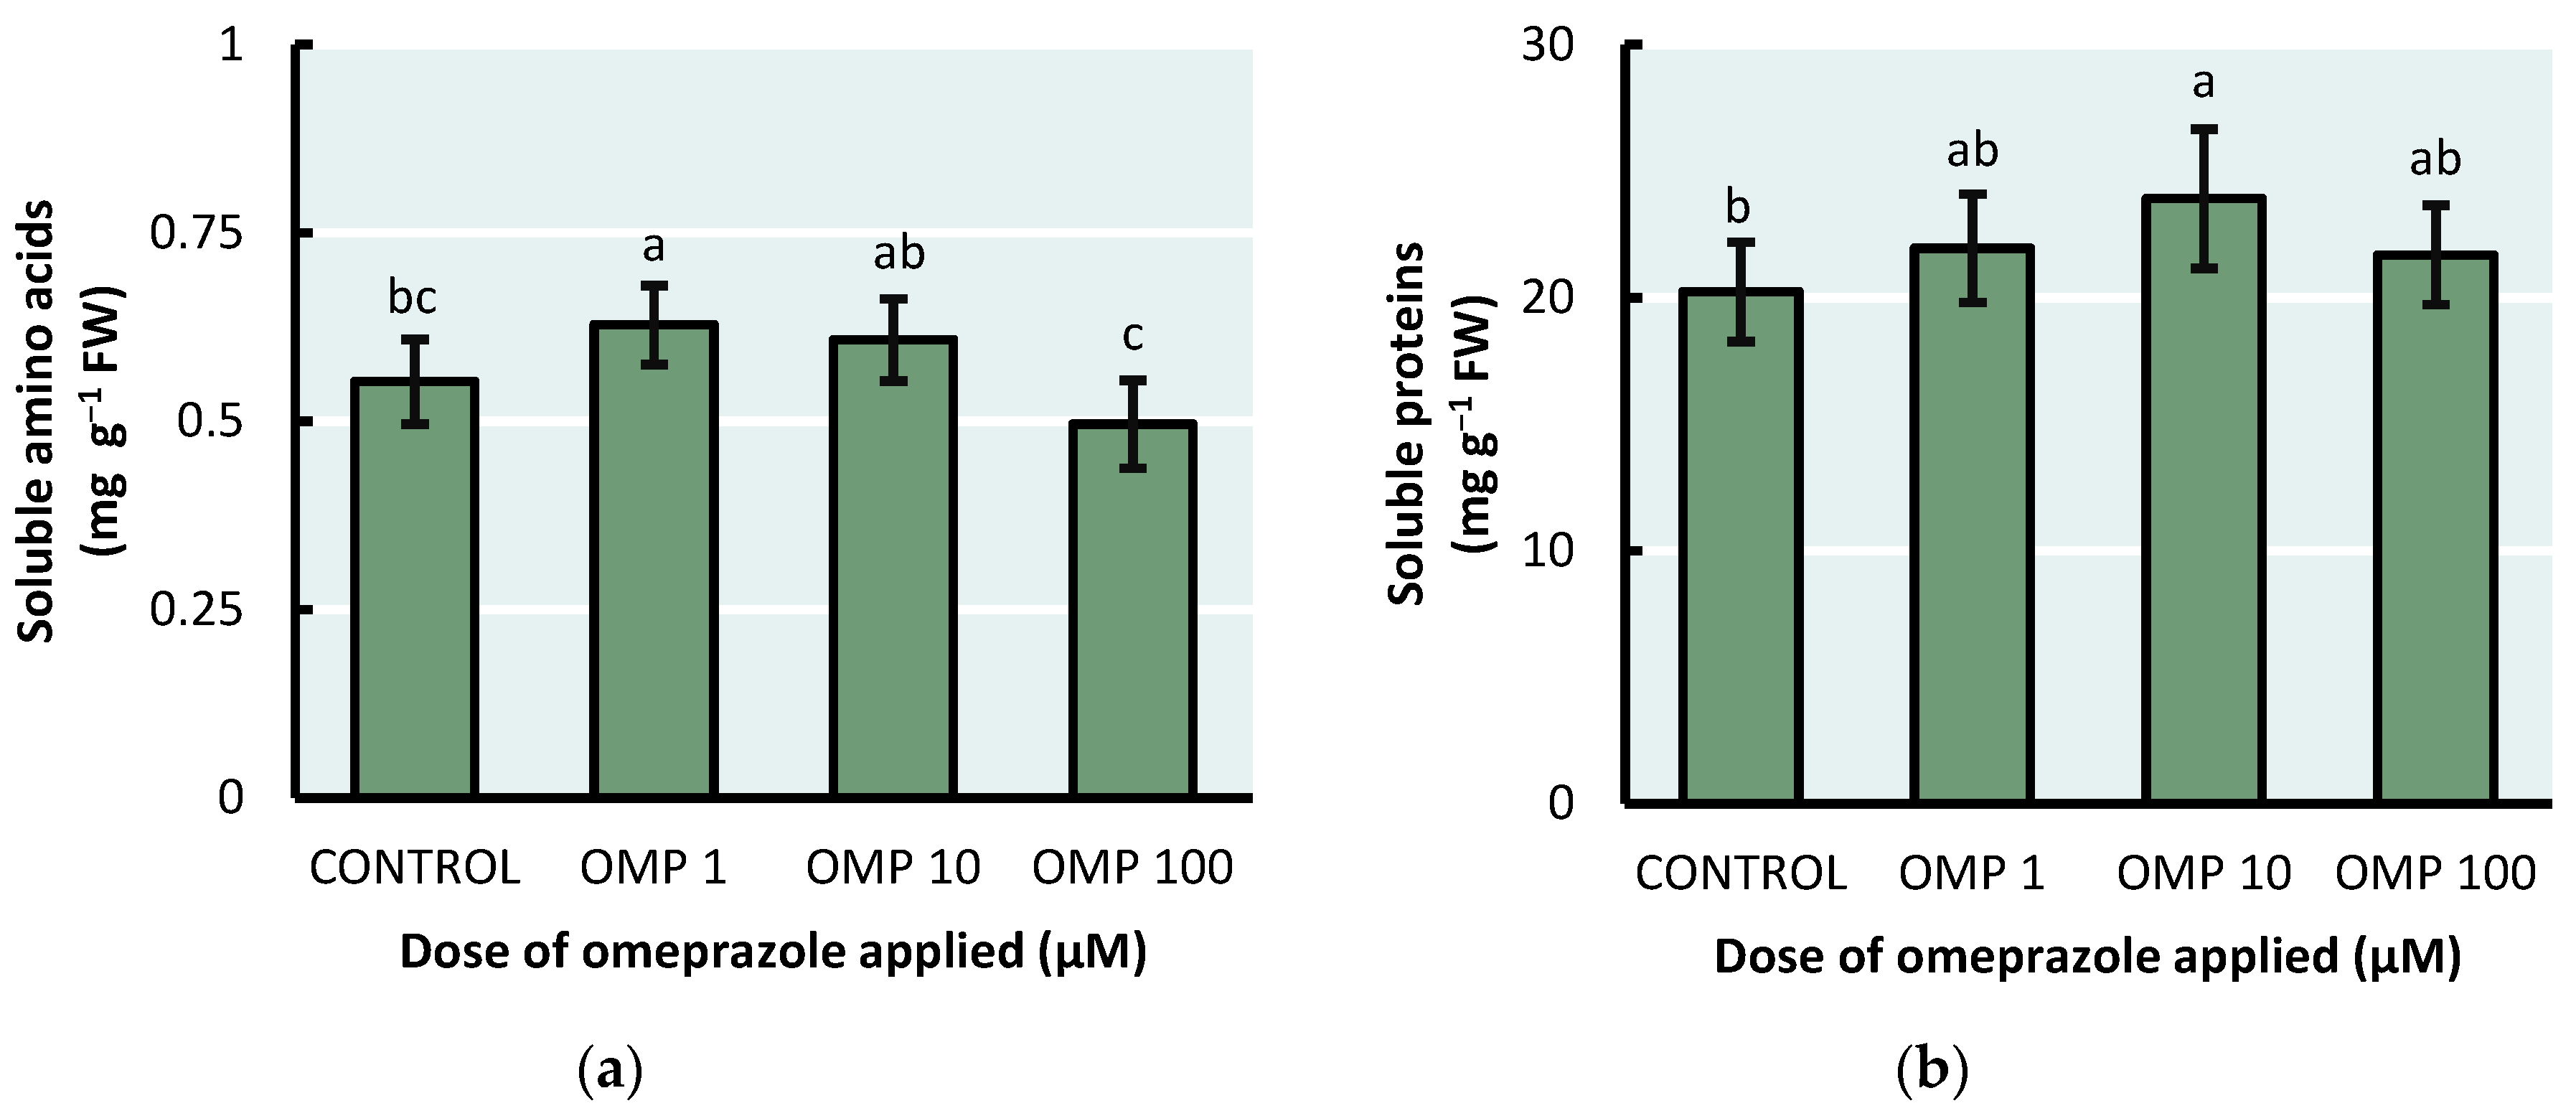
Figure 5.
Effect of foliar OMP dose applied to green bean plants cv. Strike on total N concentration. Different letters indicate significant statistical differences according to the LSD-Fisher test (p≤0.05).
Figure 5.
Effect of foliar OMP dose applied to green bean plants cv. Strike on total N concentration. Different letters indicate significant statistical differences according to the LSD-Fisher test (p≤0.05).
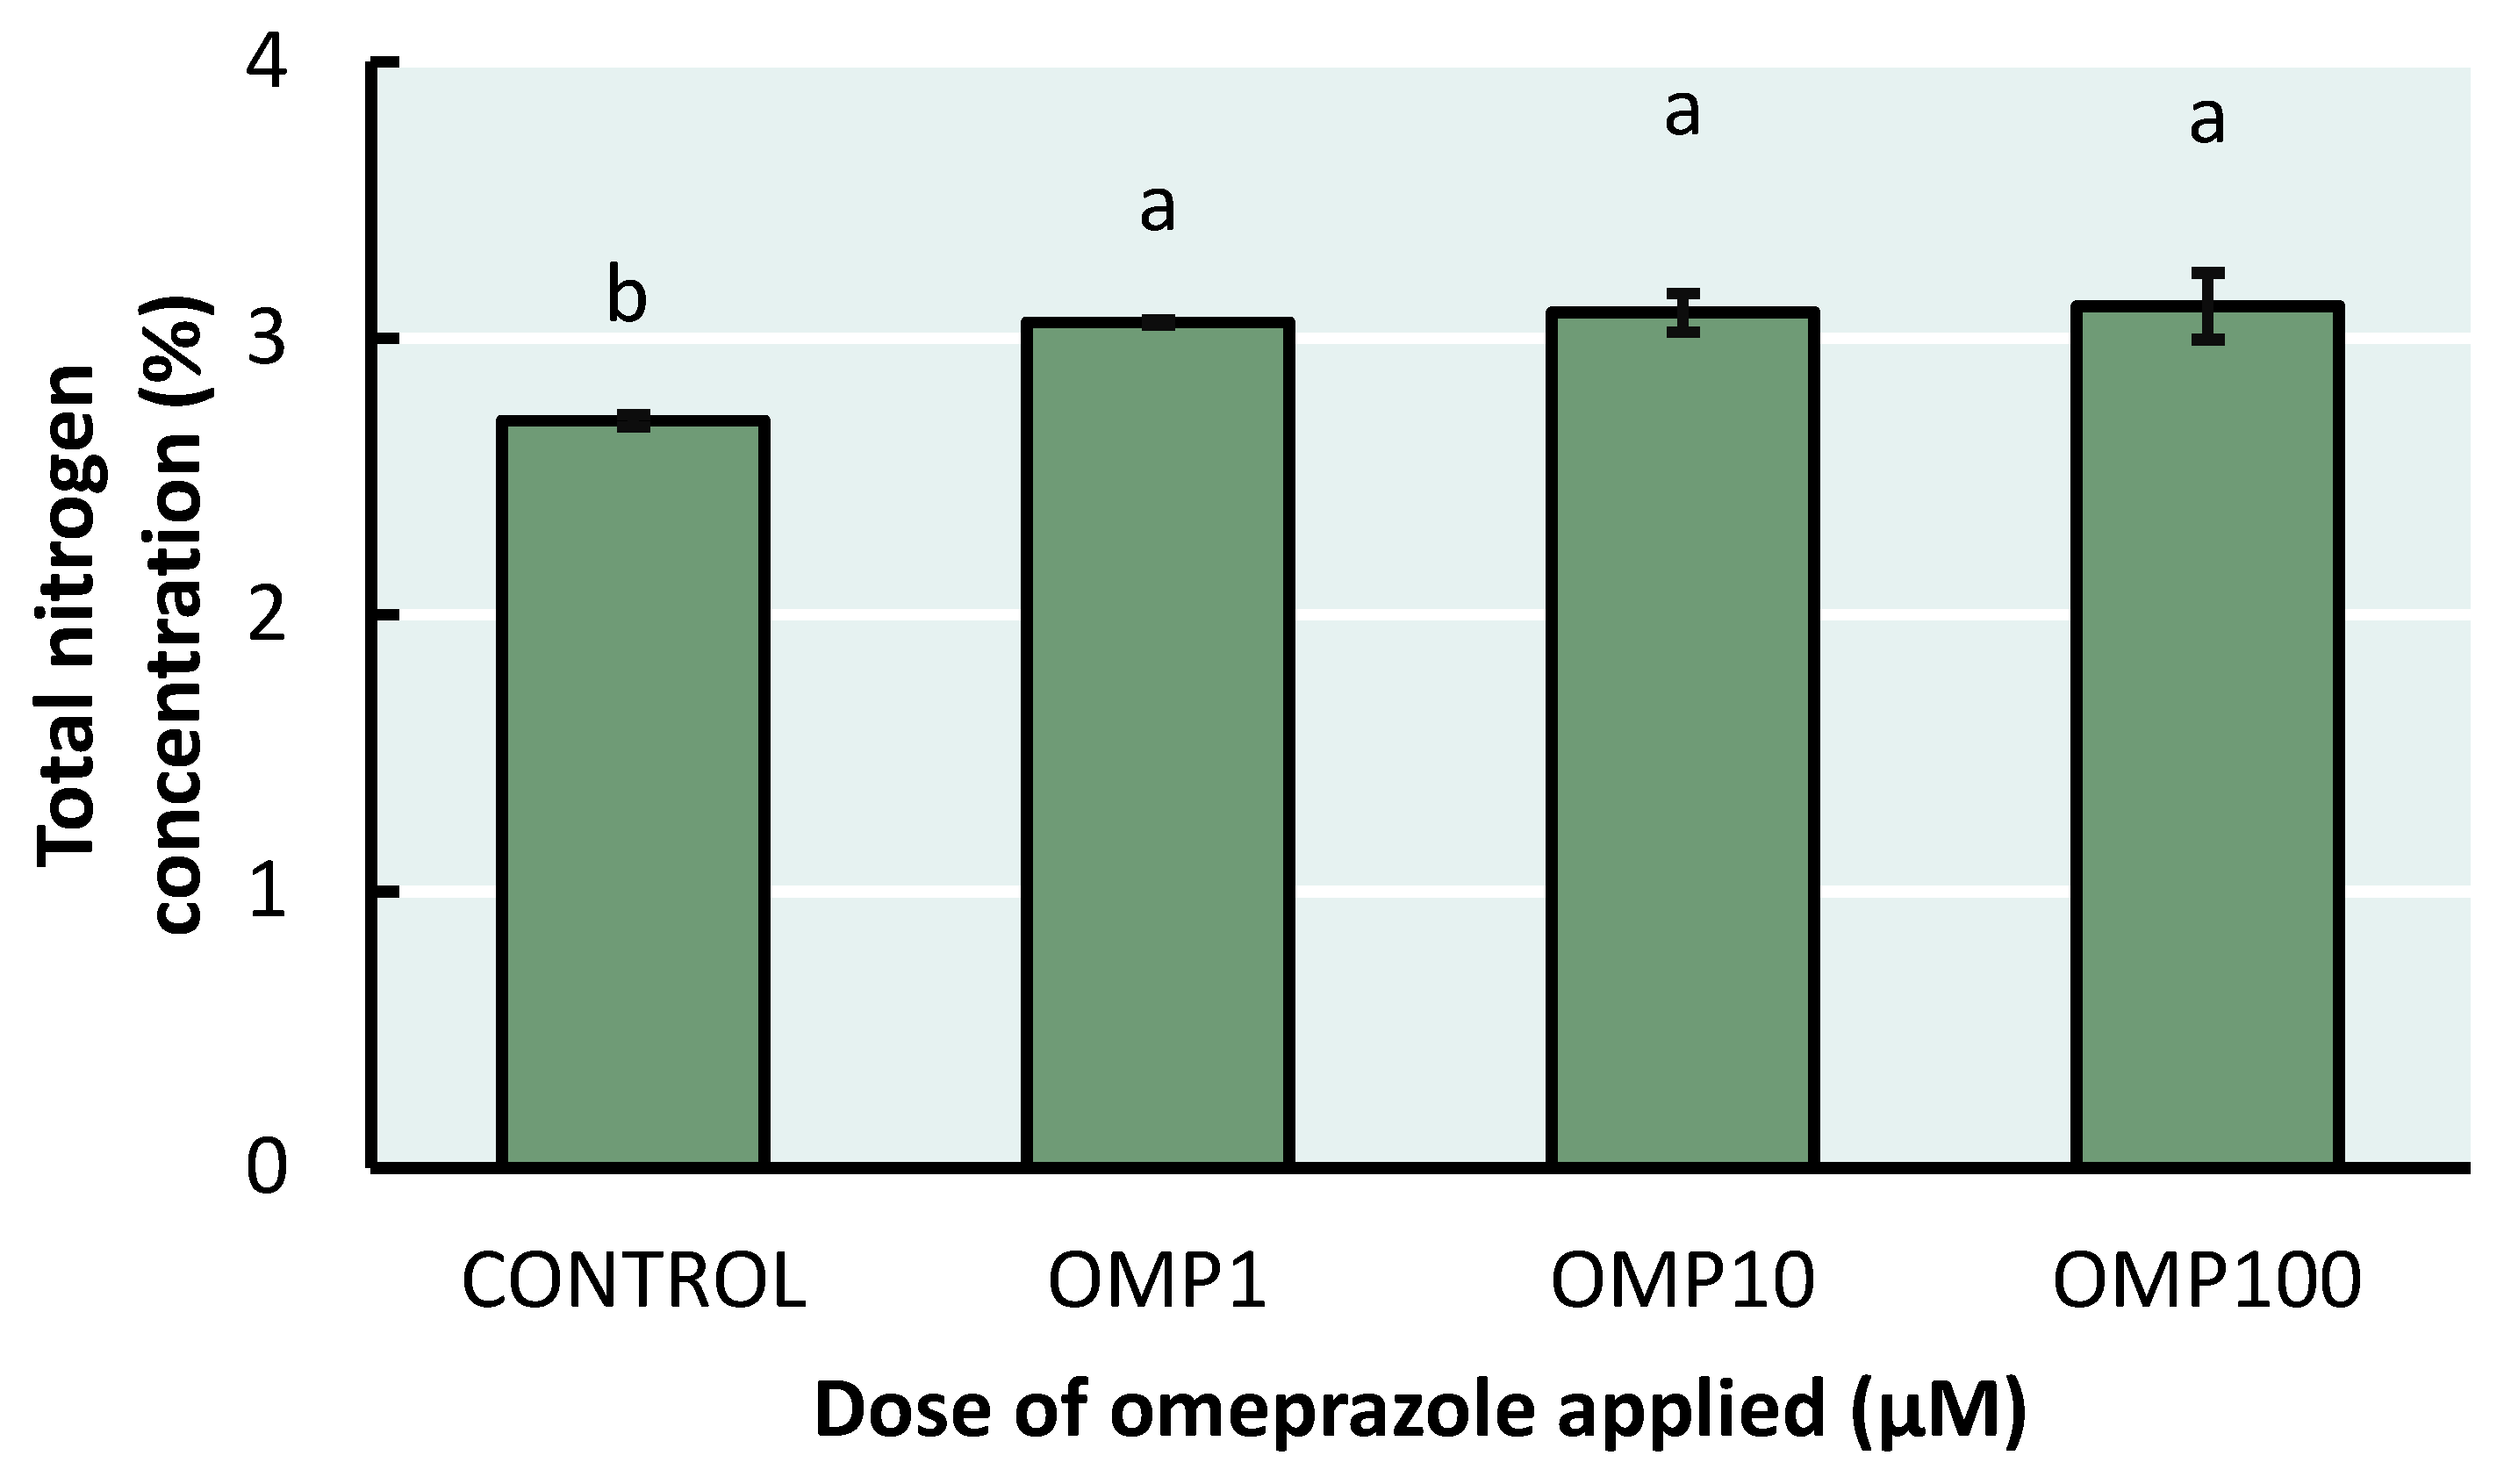
Figure 6.
Effect of foliar OMP dose applied to green bean plants cv. Strike on (a) total nitrogen accumulated, (b) nitrogen uptake efficiency, (c) nitrogen utilization efficiency and (d) nitrogen use efficiency index. Different letters indicate significant statistical differences according to the LSD-Fisher test (p≤0.05).
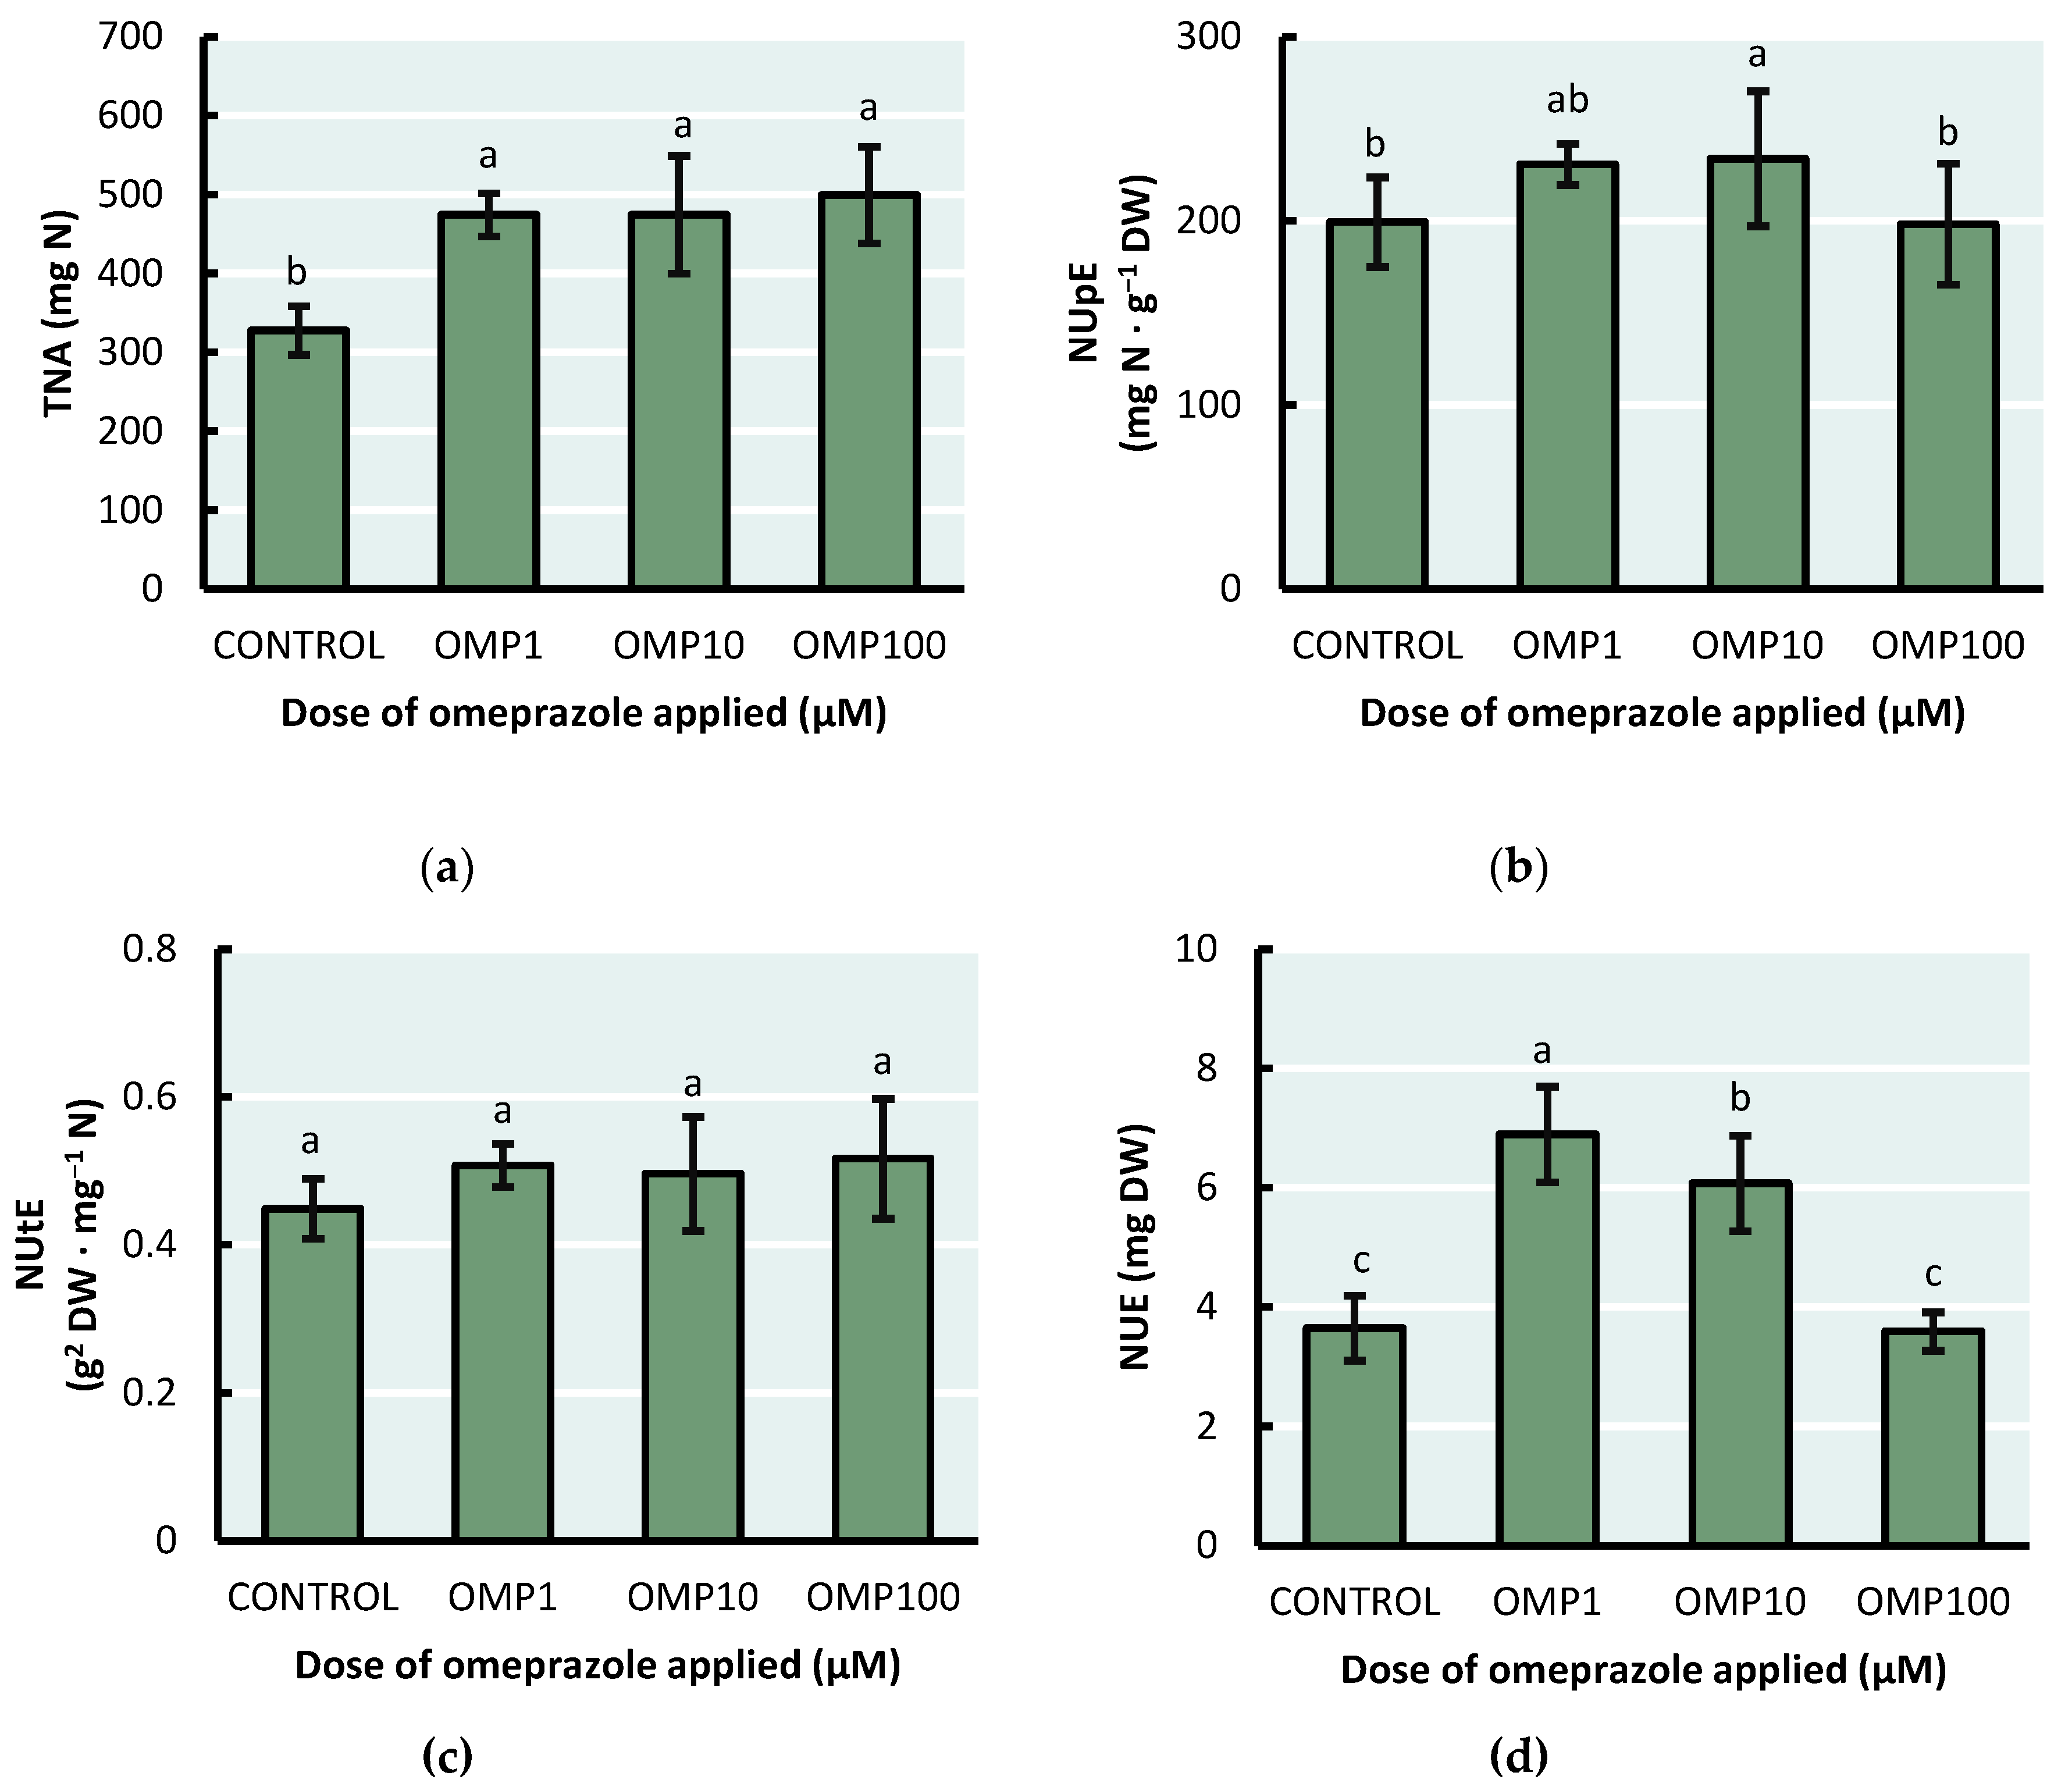
Figure 7.
Effect of foliar OMP dose applied to green bean plants cv. Strike on nitrogen recovery percentage. Different letters indicate significant statistical differences according to the LSD-Fisher test (p≤0.05).
Figure 7.
Effect of foliar OMP dose applied to green bean plants cv. Strike on nitrogen recovery percentage. Different letters indicate significant statistical differences according to the LSD-Fisher test (p≤0.05).
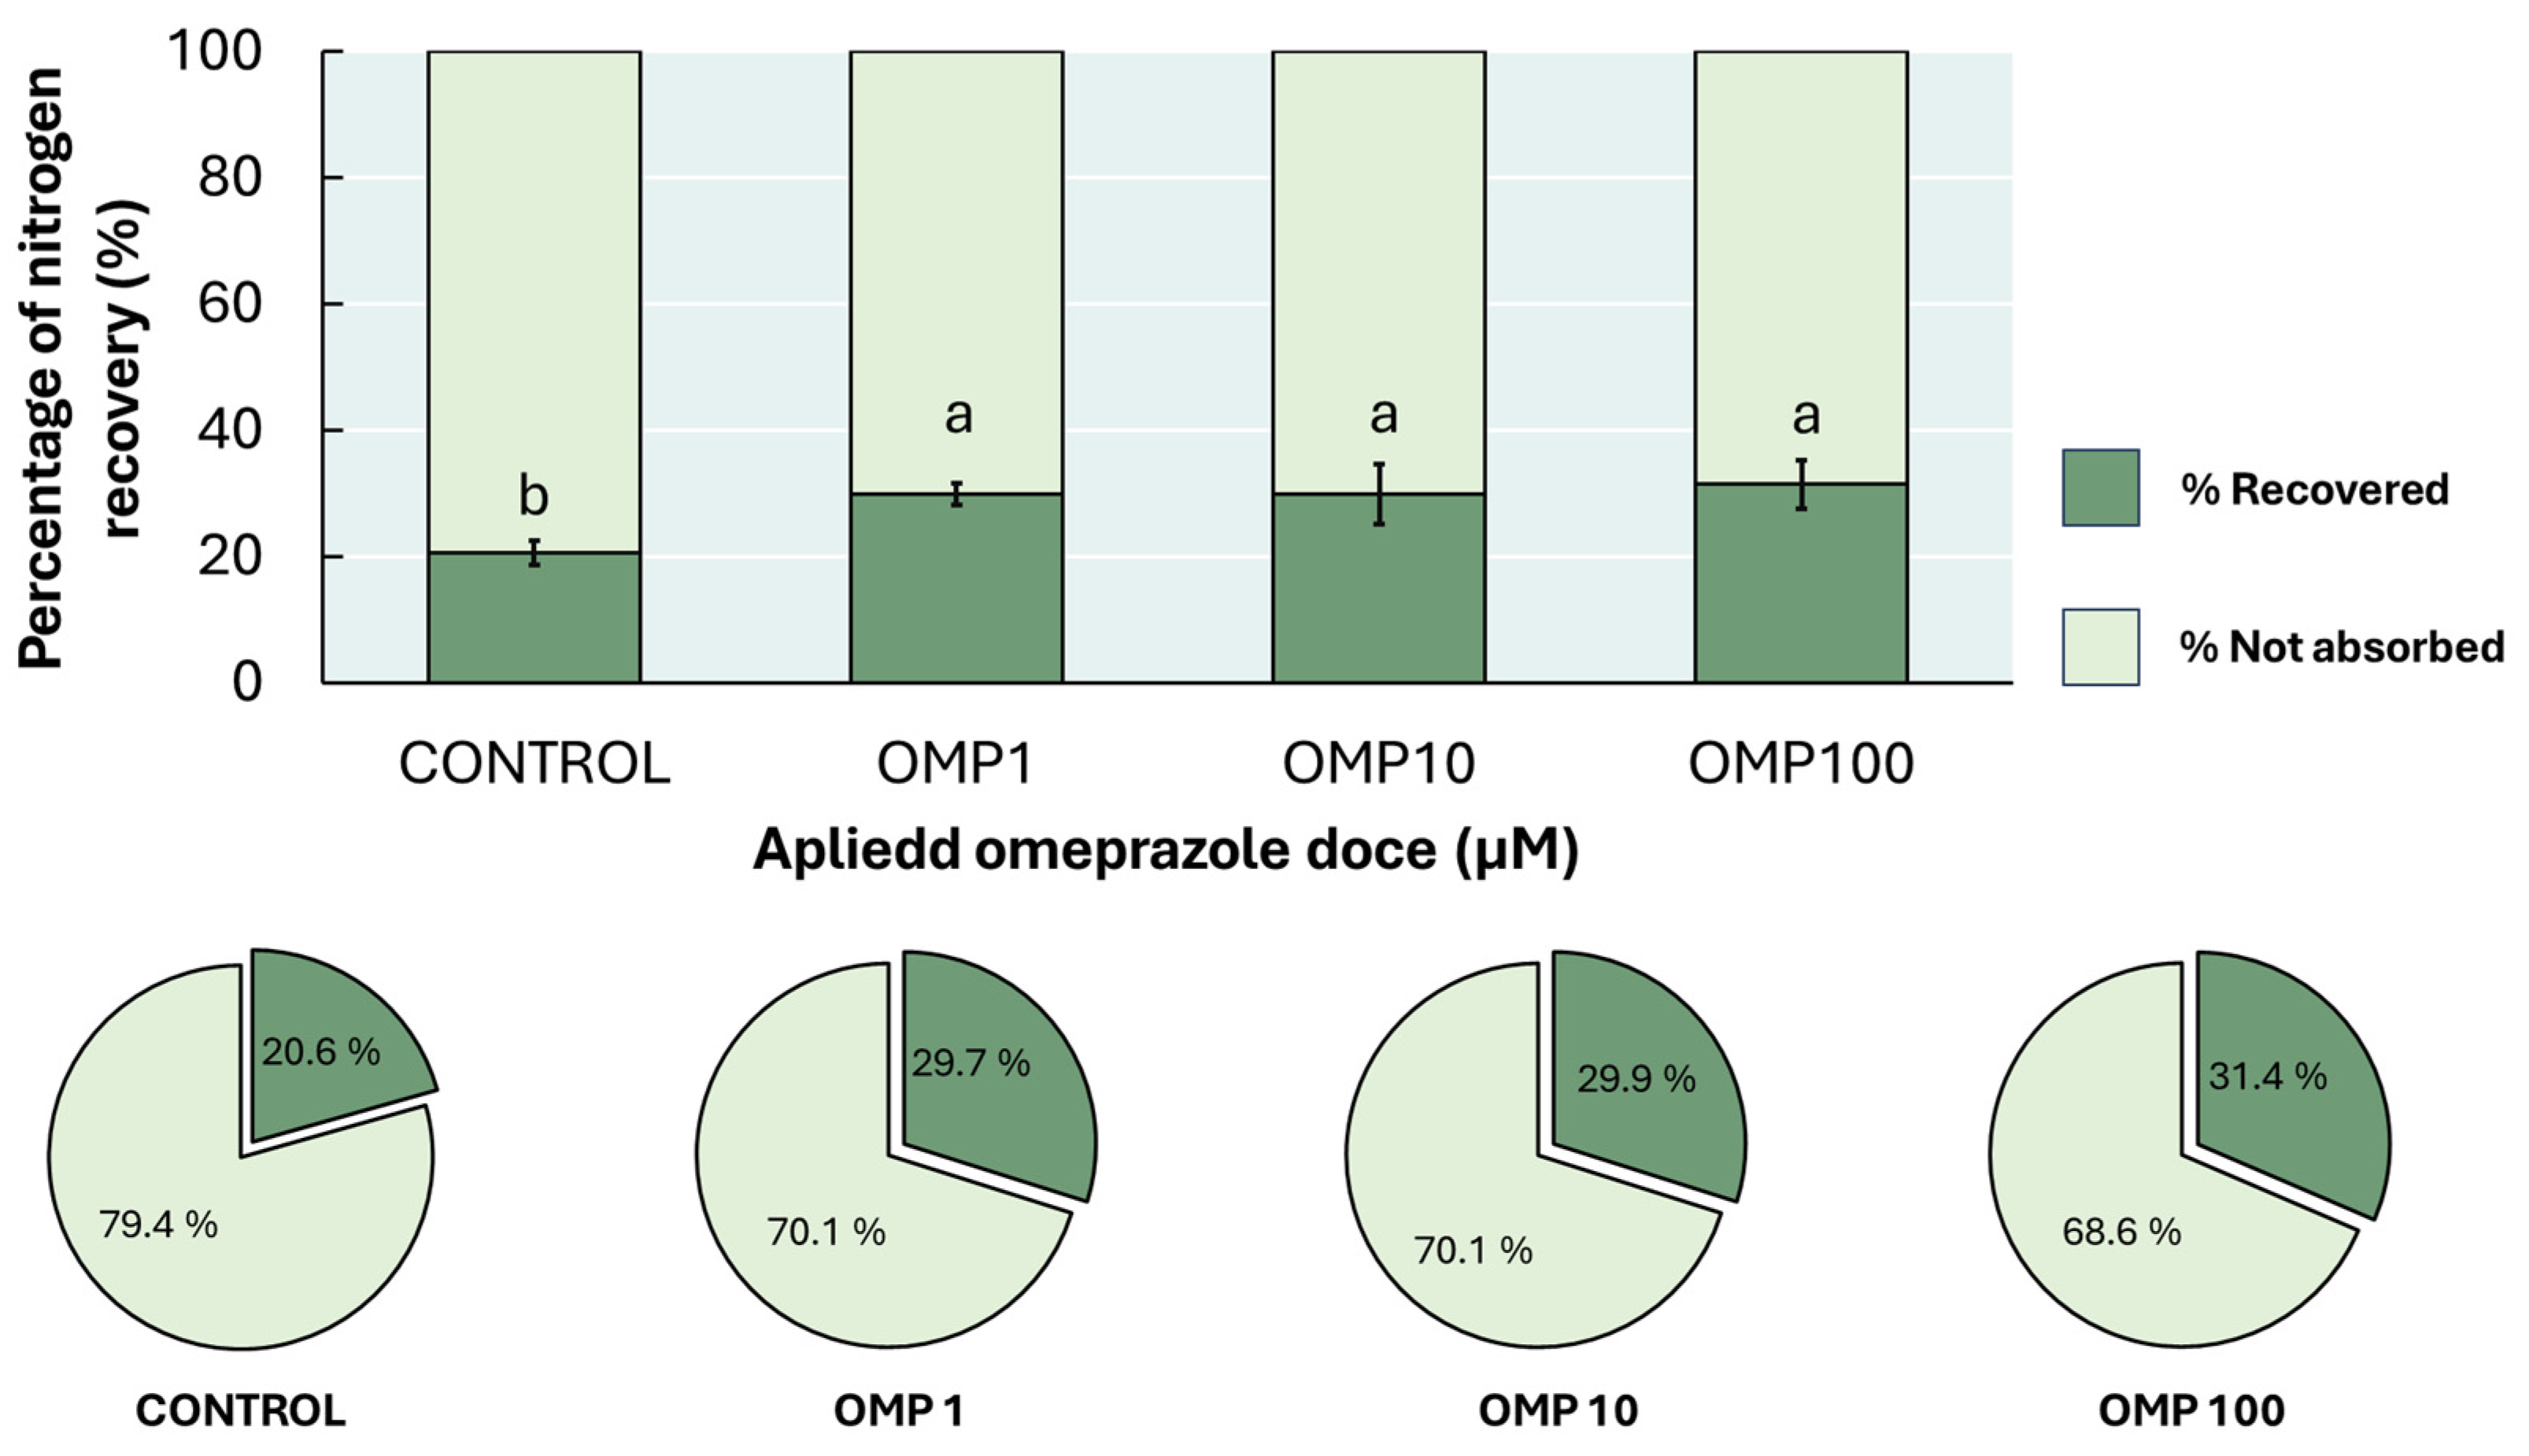

Table 1.
Composition of the Hoagland standard nutrient solution adapted to green bean [14].
Table 1.
Composition of the Hoagland standard nutrient solution adapted to green bean [14].
| Macronutrients | ||
| Compound | Chemical formula | Concentration (mM) |
| Ammonium nitrate | NH4NO3 | 6 |
| Dibasic potassium phosphate | K2HPO4 | 1.6 |
| Potassium sulfate | K2SO4 | 0.3 |
| Calcium chloride | CaCl2 | 4 |
| Magnesium sulfate | MgSO4 | 1.4 |
| Micronutrients | ||
| Compound | Chemical formula | Concentration (mM) |
| Iron chelate | Fe-EDDHA | 5 |
| Manganese sulfate | MnSO4 | 2 |
| Copper sulfate | CuSO4 | 0.15 |
| Boric acid | H3BO3 | 3.5 |
| Sodium molybdate | Na2MoO4 | 0.3 |
Table 2.
Effect of foliar OMP applied to green bean plants cv. Strike on photosynthetic pigment concentration. Different letters indicate significant statistical differences according to the LSD-Fisher test (p≤0.05).
Table 2.
Effect of foliar OMP applied to green bean plants cv. Strike on photosynthetic pigment concentration. Different letters indicate significant statistical differences according to the LSD-Fisher test (p≤0.05).
| Chlorophyll a | Chlorophyll b | Carotenoids | |
| Treatment | |||
| CONTROL | 3.28±0.35 ab | 1.4±0.15 b | 0.42±0.06 bc |
| OMP 1 | 3.14±0.21 b | 1.4±0.13 b | 0.47±0.03 b |
| OMP 10 | 2.99±0.23 b | 1.33±0.10 b | 0.39±0.03 c |
| OMP 100 | 3.65±0.41 a | 1.59±0.16 a | 0.55±0.06 a |
| p≤0.05 | *** | * | *** |
Pigment concentration is expressed as µg cm2 FW.
Disclaimer/Publisher’s Note: The statements, opinions and data contained in all publications are solely those of the individual author(s) and contributor(s) and not of MDPI and/or the editor(s). MDPI and/or the editor(s) disclaim responsibility for any injury to people or property resulting from any ideas, methods, instructions or products referred to in the content. |
© 2024 by the authors. Licensee MDPI, Basel, Switzerland. This article is an open access article distributed under the terms and conditions of the Creative Commons Attribution (CC BY) license (http://creativecommons.org/licenses/by/4.0/).
Copyright: This open access article is published under a Creative Commons CC BY 4.0 license, which permit the free download, distribution, and reuse, provided that the author and preprint are cited in any reuse.


