Submitted:
03 January 2024
Posted:
17 January 2024
You are already at the latest version
Abstract
Single-cell green microalga Nannochloropsis oceanica is potentially considered to be the bioresource for biofuel and pharmaceutical production. Urea is a kind of nutrient component for photosyn-thetic N. oceanica. Meanwhile, urea could induce to accumulate some substances such as lipid and affect its growth and physiology. However, how marine microalga N. oceanica respond and adapt to urea addition remains elusive. Here, acclimation of the metabolic reprogramming to changes in the nutrient environment was studied by high-throughput mRNA sequencing in N. oceanica under Ct vs U, there were 2104 genes displayed differential expression (including 1354 upregulation and 750 downregulation, respectively) and some pathways including carbon/nitrogen metabolism, photosynthesis, and lipid metabolism would be reprogrammed in N. oceanica. The results showed that genes related to photosynthesis in N. oceanica were significantly down-regulated, especially those related to light harvesting proteins. Interestingly, urea absorption and transport may de-pend not only on specialized transport mechanisms such as urease, but also on alternative transport channels such as the ABC transporter family, CLC protein family. In addition, urea causes specific changes in carbon and lipid metabolism. Genes associated with the Calvin cycle and carbon concentration mechanisms were significantly upregulated. In lipid metabolism, genes associated with lipases, or polyunsaturated fatty acid enzymes, are highly activated. In addition, expression is enhanced in the tricarboxylic acid cycle and folate metabolism, making important contributions to energy supply and synthesis and modification of genes or macromolecules. These phenomena indicate that N. oceanica actively and dynamically regulates the redistribution of carbon and nitrogen after urea addition., which will provide references for further research on the effects of urea on N. oceanica.
Keywords:
Adaptation mechanism
; Urea addition
; Transcriptome
; Nannochloropsis oceanica
1. Introduction
Nitrogen performs a indispensable role in the growth and development of microalgae, existing in various forms in the marine environment, such as dissolved inorganic nitrogen, dissolved organic nitrogen, and particulate nitrogen. Different nitrogen sources significantly impact the absorption and utilization efficiency of microalgae. Urea, a commonly used nitrogen source in microalgae cultivation, stands out for its ability to provide both organic carbon and nitrogen. Subsequently, urea affects protein synthesis, photosynthesis, cell division and growth, and biomass accumulation. Researchers have conducted extensive studies on the impact of urea concentration on biological growth. For instance, it has been demonstrated that microalgae would exhibit a higher rate of absorption and utilization of urea compared to inorganic nitrogen sources [1]. Maintaining an appropriate concentration of organic nitrogen is essential. Organic nitrogen influences the cell cycle, quiescence, and the accumulation of triacylglycerol (TAG) in algal cells. Therefore, urea, which can provide organic nitrogen, is a crucial nitrogen source for algal cells [2]. Minimal urea supply promotes the highest production of total and neutral lipids in Chlorella pyrenoidosa compared to high urea concentrations by Ali Nawaz Kumbhar's research [3]. However, excessive nitrogen concentrations, particularly ammonium ions, can accumulate inside cells, leading to PSII damage and impacting the photosynthetic process. For example, urea affects lutein production, and optimal urea addition increases biomass and lutein content, while excessive urea negatively affects growth and lutein synthesis [4]. Despite urea's evident impact on the physiological and ecological aspects of microalgae, its precise molecular mechanisms remain unclear.
Nannochloropsis oceanica, a single-cell green microalga, holds great promise as a biological resource for biofuel and pharmaceutical production. This small green microalga is renowned for its abundance in photosynthetic pigments, proteins, and polyunsaturated fatty acids, particularly eicosapentaenoic acid (EPA). Widely utilized in laboratory engineering and as a model organism, N. oceanica is characterized by its rapid growth, excellent photosynthetic efficiency, and high oil accumulation. Under the condition of nitrogen stress, the growth of algae will be limited, usually manifested as lower biomass growth rate and smaller cell size, which will lead to the reduction of chlorophyll content, affect the chlorophyll fluorescence and photosynthesis efficiency of algae, and even cause algae to adopt various adaptation mechanisms to reduce unnecessary bomb consumption and save nitrogen resources. N. oceanica is highly sensitive to nitrogen and other nutrient elements, and its growth and metabolism require an adequate supply of nitrogen. Adding 2 g/L of urea to the culture medium significantly promotes the growth of N. oceanica under conditions of 25°C and 5% CO2 [5]. By using urea at different concentration gradients as a nitrogen source at varying rates, it could increase the protein, fat content, as well as essential amino acids and fatty acid content in N. oceanica [6]. A higher cell count in N. oceanica was observed, which indicates that the growth of this microalgae can be promoted by urea. However, the impact of urea on lipid content was relatively small [7]. Compared to other nitrogen sources (NaNO3, NH4NO3, NH4HCO3, (NH4)2SO4), N. oceanica cultivated with urea had lower lipid content [8]. However, reducing the urea concentration to 0.2 g/L inhibits cell growth. Under urea-limiting conditions, it may adjust its nitrogen metabolism to adapt to the environment. As mentioned above, urea stress inhibits photosynthesis, but is conducive to the formation of oils. Urea can regulate the nitrogen metabolism of microalgae, influencing their lipid accumulation. These different metabolic strategies of N. oceanica under urea addition are worth exploring.
In this study, we will explore the effects of different nitrogen nutrition conditions (with and without the addition of urea; NaNO3 + urea or NaNO3) on the growth of N. oceanica through two experimental groups and apply mRNA-seq to reveal the molecular response. Transcriptome analysis revealed that the addition of urea led to differential expression of 2104 genes in the experimental group (NaNO3 + urea; U) compared to the control group (NaNO3; Ct). The result indicated a significant downregulation of photosynthesis-related genes in microalgae, especially genes related to light-harvesting protein. Interestingly, the absorption and transport of urea may not only rely on a specialized transport mechanism like urease but also alternative transport channels such as the ABC transporter family, CLC protein family. Additionally, urea induced specific changes in carbon metabolism and lipid metabolism. Genes related to the Calvin cycle and carbon concentration mechanisms were significantly upregulated. In lipid metabolism, genes associated with lipases or polyunsaturated fatty acid enzymes were highly activated. Furthermore, there was enhanced expression in the tricarboxylic acid cycle and folate metabolism, contributing significantly to energy supply and the synthesis and modification of genes or large biomolecules.
2. Materials and Methods
2.1. Culture Conditions of N. oceanica
N. oceanica IMET1 was inoculated into modified f/2 liquid medium containing 30 g/L sea salt, 1 g L-1 NaNO3, 3.65 mg L-1 FeCl3*6H2O, 67 mg L-1 NaH2PO4*H2O, 4.37 mg L-1 Na2EDTA*2H2O, trace metal mix (0.36 mg L-1 MnCl2*4H2O, 0.0126 mg L-1 NaMoO4*2H2O, 0.0196 mg L-1, CuSO4*5H2O, 0.044 mg L-1 ZnSO4*7H2O, , and 0.01mg L-1 CoCl2), and vitamin mix (2.5 µg L-1 biotin, 2.5 µg L-1 VB12, and 0.5 µg L-1 thiamine HCl) [9]. Microalgal cells were cultivated in f/2 medium under continuous irradiation (light intensity: 50±5 μmol m-2 s-1) at 25°C in a 1 L column reactor (inner diameter: 5 cm). During the logarithmic growth phase (OD750=3.0), cells were harvested via 5,000 rpm centrifugation. One set was designated as the control (Ct) and subjected to RNA extraction, with three replicates. Simultaneously, the other set underwent washing with fresh nitrogen-free medium thrice and served as the experimental group. Cell pellets were then inoculated into culture medium containing either NaNO3 or NaNO3 + Urea (the final urea density of urea addition 2g/L). All cultures commenced with the same initial cell concentration (OD750 = 3.0) and were continuously illuminated with the identical light intensity. After transfer to nitrogen-free conditions for 72 hours, cell aliquots from the urea addition samples (U) were collected for RNA isolation, with three replicates.
2.2. Total RNA Extraction
RNA extraction from microalgal cells involved the use of TRIzol® Re-agent and chloroform following Li's protocols (Invitrogen, Carlsbad, CA, USA). Genomic DNA elimination was achieved using DNase I (TaKara) [10]. Subsequently, the 2100 Bioanalyzer (Agilent Technologies, Inc., Santa Clara, CA, USA) assessed the integrity and purity of the total RNA, while quantification was performed with the ND-2000 (NanoDrop Thermo Scientific, Wilmington, DE, USA) and Qubit 3.0 (Life Technologies, Life Technologies). Only high-quality RNA samples meeting the criteria of OD260/280 = 1.8~2.2 and OD260/230 ≥ 2.0 were selected for the construction of the sequencing library.
2.3. Illumina Novaseq 6000 Sequencing and mRNA Sequencing Library Preparation
RNA purification, reverse transcription, library construction, and sequencing were conducted at Shanghai Majorbio Bio-pharm Biotechnology Co., Ltd. (Shanghai, China), following the guidelines of the Illumina manufacturer (San Diego, CA). The creation of the four mRNA-seq libraries utilized the Illumina TruSeqTM RNA Sample Preparation Kit (San Diego, CA). Initial steps involved total RNA purification and isolation using oligo-dT-attached magnetic beads, followed by RNA fragmentation with a fragmentation buffer. Subsequently, short RNA fragments served as templates for double-stranded cDNA synthesis using the SuperScript Double-Stranded cDNA Synthesis Kit (Invitrogen, CA) with random hexamer primers. The synthesized double-stranded cDNA underwent end-repair, phosphorylation, and 'A' base addition as per Illumina's library construction protocol. Target fragments of 200-300 bp were selected, and libraries were run on 2% Low Range Ultra Agarose post PCR-amplification using Phusion DNA Polymerase (New England Biolabs, Boston, MA) for fifteen cycles. After quantification, the four RNA sequencing libraries underwent sequencing in a single lane on an Illumina NovaSeq 6000 platform (Illumina, San Diego, CA) for 2×150bp paired-end reads.
2.4. Transcriptome Assembly and Functional Annotation
The raw paired-end reads of mRNA-seq were trimmed and data quality was controlled using software of SeqPrep (https://github.com/jstjohn/SeqPrep) and Sickle (https://github.com/najoshi/sickle) with default parameters. Then clean data from the samples (Ct) were employed to perform de novo assembly with Trinity (https://github.com/trinityrnaseq/trinityrnaseq) [11]. All the assembled transcripts were searched against the protein nonredundant (NR) of NCBI, String, and KEGG databases using BLASTX to identify the proteins that had the highest sequence similarity with the given transcripts to retrieve their function annotations and a typical cut-off E-values less than 1.0×10⁻⁵ was set. BLAST2GO (http://www.blast2go.com/b2ghome) [12] program was used to get GO annotations of unique assembled transcripts for describing biological processes, molecular functions and cellular components. Metabolic pathway analysis was performed using the KEGG (Kyoto Encyclopedia of Genes and Genomes; http://www.genome.jp/kegg/) [13]. Raw sequencing data is assessed for quality using FastQC and then subjected to quality trimming using Trimmomatic, resulting in relatively accurate and valid data. Clean data is assembled into transcripts de novo using Trinity [14]. The effective data from the samples are subjected to mixed splicing assembly, resulting in transcripts, and the sequence length and GC content of the assembled sequences are counted. The assembled transcripts are used as a reference sequence, and the sequencing data is compared and analyzed against them to filter sequencing sequences that can be mapped to the reference sequence. The expression level of a gene is directly reflected by the abundance of its transcripts; the higher the transcript abundance, the higher the gene expression level [15]. Through RNA-seq analysis, counting the sequencing sequences (reads) that are mapped to the gene's genomic region or exonic region can estimate the gene's expression level. Reads counting is positively correlated with the gene's true expression level, gene length, and sequencing depth [16].
2.5. Differential Expression Analysis and Functional Enrichment
Differential expression genes (DEGs) identification between two distinct samples involved analyzing the expression levels of individual transcripts using the Fragments Per Kilobase of Exon Per Million Mapped Reads (FRKM) method. Quantification of gene and isoform abundances employed the RSEM tool (http://deweylab.biostat.wisc.edu/rsem/) [17]. The R statistical package software EdgeR (Empirical analysis of Digital Gene Expression in R, (http://www.bioconductor.org/packages/2.12/bioc/html/edgeR.html) facilitated the differential expression analysis [18]. Furthermore, functional enrichment analysis, encompassing Gene Ontology (GO) and Kyoto Encyclopedia of Genes and Genomes (KEGG), was conducted. This aimed to identify DEGs significantly enriched in GO terms and metabolic pathways at a Bonferroni-corrected P-value ≤0.05 when compared with the entire transcriptome background. The GO functional enrichment and KEGG pathway analysis were carried out using two software tools, namely Goatools (https://github.com/tanghaibao/Goatools) and KOBAS (http://kobas.cbi.pku.edu.cn/home.do) [19].
3. Results and Discussion
3.1. Physiological Changes after Urea Addition
To survey the impact of urea addition on growth, the physiological responses were tracked under two contrasting culture conditions for N. oceanica IMET1: NaNO3 (Ct: control) and NaNO3 + urea (U: experimental group). In this experiment, the growth of microalgae was assessed by measuring the optical density (OD) of the algal culture using a spectrophotometer. After a 14-day cultivation period, there were no significant differences in the growth of microalgae between the control group and the experimental group.
3.2. Molecular-Level Response of N. oceanica to Urea
3.2.1. Transcriptome Data of N. oceanica Cruentum from Illumina Sequencing
TPM (Transcripts Per Million) is a common method for estimating gene expression levels, which considers the true expression level of genes, gene length, and sequencing depth's impact on reads counting [20]. The correlation of gene expression between samples is an important indicator for assessing the reliability of experiments and the rationality of sample selection [21]. Typically, the Pearson correlation coefficient is used as an evaluation metric for replicative correlation [22], and the closer the coefficient value is to 1, the higher the similarity of expression characteristics between samples. In both the experimental group with added urea and the control group without urea, no significadifferences were observed in the overall conditions (Figure 1A).
Sample Correlation Analysis. Based on the correlation analysis Heatmap chart of the samples, the correlation among the three replicates in the control group (Ct1, Ct2, Ct3) ranges from 0.993 to 1, while in the experimental group (U1, U2, U3), the correlation among the three replicates falls between 0.986 and 1. The strong correlation within each group confirms the reliability of the data quality and indicates that it can be used for further analysis (Figure 1B).
3.2.2. Sample Correlation AnalysisInter-Sample Venn Analysis and Differentially Gene Expression Analysis by the Volcano Plot
In the control group, there are 212 unique genes, accounting for 2.24% of the total genes. In the experimental group, there are 197 unique genes, making up 2.08% of the total genes. There are 9,051 genes shared between the two groups, which represent 95.68% of the total genes (Figure 2A).
The differential gene expression analysis between the urea-added group and the urea-free group of marine microalgae N. oceanica revealed a total of 2,104 differentially expressed genes. Among these, 1,354 genes were upregulated, while 750 genes were downregulated (Figure. 2B). The upregulated genes exhibited a higher fold change in expression compared to the downregulated genes, and the differential expression of upregulated genes was also more pronounced than that of downregulated genes. Using the R language DESeq to identify differentially expressed genes, with the filtering criteria set as q Value < 0.05 and |Fold Change| > 2. The volcano plot is the most commonly used way to display the results of differential gene expression analysis. It uses a t-test to analyze genes with significant differential expression between two samples, with log2 (Fold Change) as the x-axis and the negative logarithm -Log10 (q-value) of the p-value from the t-test as the y-axis. The volcano plot includes two important metrics, Fold Change and adjusted q-value, and each point on the plot represents a gene. Colors are used to differentiate whether genes are differentially expressed (Figure 2B).
3.2.3. Functional Enrichment of Differential Expressed Gene by GO and KEGG
Gene ontology classification annotation was performed on the obtained genes, as shown in the figure. The vertical axis represents functional categories, the horizontal axis represents the number of genes in each category, and different colors represent different classifications. From the graph, we can observe that the majority of genes are annotated to the cellular component category, while the differences in genes annotated to biological processes and molecular functions are less pronounced. Within the biological process category, there are a total of six enriched functions, including “response to stimulus”, “cellular component organization or biogenesis”, “localization”, “biological regulation”, “metabolic process” and “cellular process”. Among these, “metabolic process” and “cellular process” show significant enrichment. In the cellular component category, the affected parts include “cell”, “membrane”, “organelle part”, “protein-containing complex”, “organellecell part” and “membrane part”. Notably, “single-cell part” and “membrane part” exhibit the most significant differential gene enrichment. In the molecular function category, he functions associated with differentially expressed genes include “molecular regulator activity”, ”transcription regulator activity”, ”translation regulator activity”, “structural molecule activity”, “transporter activity”, “binding” and “catalytic activity”. Differential gene enrichment is particularly pronounced in the “binding” and “catalytic activity' functions” (Figure 3A).
After performing KEGG annotation on differentially expressed genes and classifying KEGG metabolic pathways based on the connections between KEGG and pathways, they are mainly divided into five categories: Environment Information Processing (This category includes two pathways: Membrane transport and Signal transduction), Human Diseases (includes two pathways: Endocrine and metabolic diseases and Infectious diseases: parasitic), Cellular Processes (Under this category, there are pathways related to the metabolism of terpenoids and polyketides), Metabolism (This category encompasses ten pathways: Biosynthesis of other secondary metabolites, Glycan biosynthesis and metabolism, Nucleotide metabolism, Metabolism of other amino acids, Metabolism of cofactors and vitamins, Lipid metabolism, Transport and catabolism, Energy metabolism, Carbohydrate metabolism, and Amino acid metabolism), Genetic Information Processing (four pathways: Transcription, Folding, sorting, and degradation, Replication and repair, and Translation). In terms of metabolic functions, the highest enrichment of differentially expressed genes is observed, especially in carbohydrate metabolism pathways, where 68 genes are enriched. Most of these genes involved in controlling photosynthetic carbon fixation are upregulated. Additionally, differential gene enrichment in lipid metabolism pathways is also noticeable, with 35 genes enriched (Fig 3B).
3.3. Nitrogen Metabolism Affected by Urea Addition in N. oceanica
To study the impact of urea addition on nitrogen metabolism, we analyzed the main pathways of nitrogen assimilation. We annotated the relevant genes in the transcriptome and three genes (g6410, g7989, and g7791) related to nitrogen transporter exhibited significant downregulation (Figure 4 and Table 1). Among them, Urea/Na+ high-affinity symporter (DUR3; g6410) involved in the urea transport process, downregulated by a foldchang of 13.33 under Ct vs U. Uder urea-added cultivation conditions, N. oceanica tend to preferentially utilize NH4+ [23]. However, the transcriptional expression of the ammonium transporter gene differs significantly from the expected pattern. This preference may be mediated through a low-affinity ammonium transport protein system (LATS) [24]. Unfortunately, Nitrate high affinity transporter (g7989) responsible for nitrate absorption and transport, showing a 9.36-fold downregulation in the experimental group. Ammonium transporter (AMT:g7791) is a type of NH4+ transport protein responsible for the transport of NH4+ within organisms. Under Ct vs U, the expression of this ammonium transport protein was downregulated by 21.74-fold. The AMT gene possesses a conserved C-terminal regulatory domain and a highly protein homologous structure. It can form trimers by binding with other related monomeric transport proteins to facilitate the transport of NH4+. Additionally, studies indicate that the conserved C-terminal regulatory domain of the AMT protein is regulated by phosphorylation at two threonine residues, T460 and T472 [25,26]. When the external NH4+ concentration is low, the phosphorylation state of the serine residues at the C-terminal region determines whether dephosphorylation occurs, thereby influencing NH4+ absorption or inhibition [27,28]. Nitroreductase-like protein (g7797) is involved in the reduction of nitrite to ammonia or other nitrogen compounds, and its expression level has decreased by 28.57-fold (Figure 4 and Table 1). Ferredoxin nitrite reductase (g3438) is also involved in the nitrate reduction metabolic pathway, converting nitrate into nitrite. However, based on the provided data, its expression level is downregulated by 17.54-fold (Figure 4 and Table 1). This phenomenon indicates the inhibition of the nitrogen absorption pathway for nitrate. In general, urea is absorbed by algae through two pathways: urease or ureamide hydrolase (DUR) degradation to produce ammonia, which is subsequently converted to other forms of nitrogen via the GS cycle [29]. It has been reported that urease activity in algal cells is regulated by nitrogen species in the culture environment. Urea and NO3- can enhance it, and NH4+ can inhibit it. Interestingly, it was found that the expression of Dur3 gene under different nitrogen source conditions was also affected by nitrogen source type, and the addition of urea and NH4+ inhibited the expression of Dur3 gene [30]. In addition, some prokaryotes, such as cyanobacteria, can also be driven to take up urea by ABC binding box (ATP-binding protein) transporters [31]. Research has shown that the expression of various nitrogen transport proteins and auxiliary proteins in the experimental group is significantly downregulated. This observed downregulation occurs in Arabidopsis, wheat seedlings, and various algae. However, we note that the transcriptional levels of some possible low-affinity transport channels are significantly up-regulated. This means that N. oceanica might take different modes of nitrogen transport to complete the absorption of nitrogen sources. The expression of some ABC protein families is significantly upregulated (Dataset S1). This may indicate the involvement of ABC protein families in the transport of urea in N. oceanica. These protein families typically involve ATP binding and hydrolysis to facilitate the transmembrane transport of substances [32,33]. In addition, Chloride Channel Protein 7 (g3611) is a member of the CLC protein family, and it exhibits a significant upregulation at the mRNA level with a fold change of 3.67 (Dataset S1). CLC transport proteins belong to the nitrate transporter protein family. Previously, it has been discovered that CLCa and chloroplast-localized CLCe cooperatively participate in the assimilation process of nitrate nitrogen [34]. In N. oceanica, g3611 might perform the same function.
At the same time, we found that the GS/GOGAT cycle is highly activated, and the genes for aspartate synthetase and its associated amino acids (such as serine, tryptophan, and nucleotides) are significantly upregulated at the transcriptional level. This indicates that nitrogen utilization and transfer as well as amino acid anabolism are active under urea addition. In Arabidopsis, urea-derived ammonia is converted into glutamine, and then further synthesized into glutamate by the GS/GOGAT cycle. This indicates that the addition of urea promotes the activity of the GS/GOGAT cycle [35]. There is significant activity in both ammonia assimilation and ammonia dissimilation. For instance, in the direction of ammonia assimilation, the expression of gene delta-1-pyrroline-5-carboxylate synthetase (g10184) is upregulated by 6.46-fold, gene le kynureninase (g9735) is upregulated by 177.16-fold, and gene asparagine synthase (g8147) is upregulated by 63.69-fold (Table 1). These genes are involved in the synthesis and metabolism of amino acids. Regarding ammonia dissimilation, gene urate oxidase (g615) encodes uricase, which is involved in uric acid metabolism, while the function of gene putative urate catabolism protein (g6250) is suspected to be related to uric acid breakdown metabolism (Table 1). Urate oxidase and gene putative urate catabolism protein each show an upregulation of about 2-fold at the mRNA level. As for urea cycle, although there were no detected differential expressions in the genes encoding Ornithine Transcarbamylase (OTC) and Argininosuccinate Lyase (ASL), the gene expression of argininosuccinate synthase (As: g9579) showed a substantial upregulation (2.12-fold) (Dataset S1). Argininosuccinate synthase plays a crucial roin the synthesis of argininosuccinate from citrulline and aspartate, a key step in the conversion of arginine to urea in the urea cycle. This upregulation may indicate a cellular response to increased demand for argininosuccinate or enhanced urea cycle activity. These indicate that in response to additional urea supply, N. oceanica adopted a series of regulatory reactions to maintain the balance of nitrogen metabolism. These regulatory reactions include that conventional nitrogen transporters are inhibited and may turn to low-affinity transport channels to enhance nitrogen utilization and transfer through amino acid synthesis and metabolism.
3.4. Change of Photosynthesis in Response to Urea Addition
In order to explore whether urea addition has an effect on photosynthesis, we conducted a detailed analysis of transcripts related to the photosystem I and II, and chlorophyll biosynthesis genes in N. oceanica. The presence of urea significantly downregulates the expression of genes associated with both the light-harvesting complex (LHC) proteins and photosystem proteins. Notably, most LHC genes (including g240, g5628, g3077, g6113, g5629, g9713, g903) uniquely showed a 2.0~2.5-fold downregulation at the transcript level (Table 2). Additionally, other genes encoded (cytochrome c biogenesis protein, thiol reduction transmembrane region) also displayed significant downregulation, which indicates potential inhibition of photosynthetic activity occurred in N. oceanica. In previous study, ammonium limitation in algal cultivation may impair photosynthesis by damaging the photosystem or uncoupling photophosphorylation with electron transport [36]. Furthermore, the addition of urea in Gracilariopsis lemaneiformis led to a decrease in photosynthetic pigment proteins, potentially prioritizing the degradation of these proteins during urea substitution, serving as a strategy for rapid restructuring and balancing nitrogen metabolism in algal cells [37]. On the other hand, reducing pigment content in plants can improve water and nitrogen utilization efficiency [38], supported by studies showing an increase in biomass in photosynthetic organisms through reduced pigment content [39,40]. Additionally, we observed an upregulation of the expression of cytochrome b6-f complex iron-sulfur subunit (g9470) by 2.42-fold at the mRNA level (Table 2). This complex is crucial in the chloroplast, participating in electron transport and proton pumping during photosynthesis [41]. The upregulation of iron-sulfur assembly-like protein (g4344) and ribulose-phosphate 3-epimerase (g5017) suggests adaptations to different growth conditions and photosynthetic requirements under urea + NaNO3 or NaNO3 (Table 2). These observations indicate that urea, likely hydrolyzed to produce CO2, participates in the Carbon Concentrating Mechanism (CCM) as a new carbon source, optimizing nitrogen supply and prompting N. oceanica to adjust its photosynthetic carbon fixation strategy.
3.5. Change of Carbon Fixation and Central Carbon Metabolism in Response to Urea Addition
To survey urea addition on the CCM (carbon concentrating mechanism) and Photosynthetic Carbon Fixation in N. oceanica, we first explored transcriptional changes in various pathways, consisting of glycolysis, gluconeogenesis, the carbon concentrating mechanism, and Calvin-Benson cycle (Figure 4 and Table 1).
As for CCM, one carbonic anhydrase gene (CA), responsible for the conversion between CO2 and HCO3-, was annotated as a key component of CCM [42,43]. The significant increases in g2018 by 26.86-fold suggest urea regulates CCM at the RNA level (Table 3). This implies that urea addition enhances carbon concentrating mechanisms in microalgae, involving organic carbon in the metabolic processes that promote biological growth. Similar conclusions were drawn in Microcystis aeruginosa [44]. Unfortunately, we did not annotate candidate genes responsible for bicarbonate transport, another crucial component of CCM. However, other transporters that may be involved in bicarbonate transport change under nitrogen deficiency conditions and change further under urea conditions [45]. Bile acid: Sodium cotransporter (BASS) is thought to mediate acetoacetic acid's entry into the peroxisome. After nitrogen deficiency, transcription levels gradually increased [46] (Table 3). Although no differential expression of BASS was detected, the sodium/hydrogen exchange family protein (NDH: g10029) (Table 3), which is responsible for maintaining the equilibrium of sodium ion inflow, was found to be down-regulated by a factor of 2.64. In addition, we observed upregulated expression of the ATP/ADP transporter AAT (g1797) (Table 3).
Secondly, in terms of photosynthetic carbon sequestration, we pay special attention to genes participating in the Calvin cycle. Those genes were observed, including PGK (phosphoglycerate kinase), GPDH (glyceraldehyde-3-phosphate dehydrogenase), RPE (ribulose-phosphate 3-epimerase), and TL (transketolase), showed varying degrees of upregulation (Figure 5 and Table 3). This suggests increased carbon fixation in microalgae, leading to the accumulation of carbon compounds. This signifies the strengthening of the Calvin cycle. The upregulation of genes related to the electron transport chain, associated with the degradation of photosynthetic pigments, combined with urea addition, suggests compensation for the energy consumption caused by pigment degradation, enhancing the Calvin cycle and promoting the carbon fixation capacity of microalgae. The key product of the Calvin cycle, glyceraldehyde-3-phosphate (G3P), is transformed into pyruvate through the glycolytic pathway, serving as a precursor in lipid biosynthesis.
Thirdly, several genes related to the glycolytic pathway also have different expressions. The downregulation of FBPA (fructose-1,6-bisphosphate aldolase) by 3.02-fold indicates reduced glycolytic activity, emphasizing the accumulation of organic compounds in N. oceanica (Figure 5 and Table 3). In the transcriptome analysis of glycolysis, ALDO (aldolase) showed significant downregulation, while TPI (triose phosphate isomerase) and PGK exhibited significant upregulation (Figure 5 and Table 3). Aldolase plays a crucial role in catalyzing the fourth step of glycolysis, breaking down fructose-1,6-bisphosphate into dihydroxyacetone phosphate (DHAP) and glyceraldehyde-3-phosphate (G3P). TPI facilitates the interconversion between DHAP and G3P, while PGK catalyzes the mutual conversion of 1,3-bisphosphoglycerate and G3P. The differential expression of these three important genes leads to the enrichment of DHAP, providing enhanced energy supply and serving as a key precursor in lipid synthesis, particularly for triacylglycerols (TAGs). Additionally, DHAP participates in lipid degradation through fatty acid beta-oxidation.
Fourthly, in the tricarboxylic acid cycle (TCA), the transcription levels of SDH (g1987), FHD (g8597), and MDH (g9301) were upregulated by two fold (Figure 5 and Table 3), indicating the enhancement of the TCA cycle as a central hub for carbohydrate, lipid, and protein metabolism. On the one hand, it provides energy supply, and on the other hand, it facilitates the transfer of carbon and nitrogen in response to urea addition. Acetyl-CoA can directly supply the TCA cycle or undergo a bypass process in citrate synthesis using aconitase [47]. Nitrogen concentration and the presence of organic C guide metabolism toward lipid or carbohydrate production [48,49,50]. This indicates that microalgae have adjusted their metabolic strategies. We observed the expression of malate dehydrogenase (MDH) in the experimental group, while its FPKM value was 0 in the control group. MDH catalyzes the oxidation of citrate to oxaloacetate, and the produced NADH further contributes to the generation of ATP from ADP, serving as a major source of cellular energy.
Lastly, in the transcriptome analysis of the C4 cycle pathway, only one malic acid dehydrogenase (g9301) was found (Table 3), catalyzing the oxidation of malic acid to oxaloacetate, reducing NAD+ to NADH in a reversible reaction. As this enzyme does not participate in CO2 fixation, it is more likely involved in supplementing intermediates of the TCA cycle to lipid biosynthesis (Figure 5) rather than redirecting CO2 to the plastid for carbon fixation. Acetyl-CoA can also be produced from pyruvate through the "pyruvate dehydrogenase bypass" process, where pyruvate decarboxylase (PDC) and aldehyde dehydrogenase (ALDH) convert pyruvate to acetyl acetate. Although PDC was not detected, two ALDH enzymes (g2887, g956) were found (Figure 5 and Table 3). The transcription level of g2887 was upregulated by 2.71-fold, while g956 was downregulated by 2.36-fold. One of the ALDH enzymes (g2887) is located in the cytoplasm, suggesting its involvement in converting cytoplasmic pyruvate (possibly from glycolysis) to acetyl acetate. Acetyl acetate generated in the cytoplasm through the PDHC pathway and in the mitochondria then forms flexible acetyl-CoA through acetyl-CoA synthetase.These changes may represent a cellular adjustment to energy balance in response to the new growth conditions (urea addition).
3.6. Lipid Metabolism Affected by Urea Addition
To investigate the effect of urea addition in N. oceanica, our study focused on examining how it influences the fatty acid biosynthetic pathway and the synthesis of triacylglycerol (TAG) in N. oceanica. We observed a significant downregulation (2.26-fold) of acetyl-CoA carboxylase (ACC) transcript abundance (Figure 5 and Dataset S1). ACC is a crucial enzyme in the first step of fatty acid biosynthesis. Its main function is to convert acetyl-CoA into malonyl-CoA, a key precursor required for fatty acid synthesis. The downregulation of ACC results in reduced availability of malonyl-CoA, leading to a decrease in the rate of fatty acid synthesis [10]. Other genes related to fatty acid biosynthase have not been found in the transcriptome or are not differentially expressed.
For TAG (triacylglycerol), first of all the synthesis process of TAG involves several enzymatic steps. Glycerol-3-Phosphate Acyltransferase (GPAT) is the enzyme responsible for the first step in TAG synthesis. It catalyzes the formation of glycerol-3-phosphate fatty acid esters by combining glycerol-3-phosphate and fatty acids. The second step of TAG synthesis is the conversion of glycerol-3-phosphate fatty acid ester into lysophosphatidic acid (LPA), the precursor of TAG, catalyzed by Lysophosphatidic Acid Acyltransferase (LPAAT). Fatty Acid Synthase (FAS) plays an important role in TAG synthesis of long chain fatty acids. Fatty acid desaturase is involved in the desaturation of fatty acids by introducing double bonds into the fatty acid chain. Although no differential expression of GPAT, LPAAT, or FAS was found. However, In the transcriptome analysis, we identified the alpha/beta hydrolase fold protein (g20) (Dataset S1). This protein not only participates in the esterification process of fatty acids, but also catalyzes the combination of fatty acids and glycerol to form triglycerides (TAG). Moreover, these proteins also exhibit lipid-soluble activity, breaking down lipid molecules (including TAG) into glycerol and fatty acids. The upregulation of g20 in mRNA expression by 2.40-fold suggests an increased expression of these alpha/beta hydrolase fold proteins under the study conditions. This upregulation may indicate enhanced TAG synthesis and lipolytic activity, potentially influencing energy generation and other metabolic pathways [51,52]. In addition, we found that many other genes for unsaturated fatty acid enzymes are very active. The gene Patatin-like phospholipase, putative (g6254) exhibited a significant upregulation, with its expression level increasing by 3.65-fold (Dataset S1). Similarly, the gene "Hydrolase, alpha/beta fold family protein" (g8602) also showed an upregulation, with its expression level increasing by 2.42-fold (Dataset S1). The putative delta-5 fatty acid desaturase (g1001) and delta-4 fatty acid desaturase (g1678) both exhibit a significant upregulation of over three fold (Dataset S1). These enzymes are responsible for introducing double bonds by desaturating the saturated carbon chains in fatty acid molecules. This desaturation process contributes to the synthesis of long-chain fatty acids. The downregulation of Alpha/beta hydrolase (g4532) by 2.30-fold suggests a potential inhibition of lipid hydrolysis reactions (Dataset S1). This downregulation could lead to the accumulation of lipids within the system. The common end products of de novo FA biosynthesis are C16:0, C18:0, and C18:1 in the plastids of algae and vascular plants [10].
On the other hand, the metabolic performance of fatty acids is also very important. Transcriptome analysis showed that the enzymes involved in β-oxidation were significantly up-regulated. Beta-oxidation (β-oxidation) typically occurs in the mitochondria and is utilized to break down fatty acids to generate energy rapidly. It gradually breaks down long-chain fatty acids into shorter acyl-CoA molecules while simultaneously producing abundant ATP energy. Transcriptome analysis indicates that Acyl-CoA dehydrogenase (g1094) and Acyl-CoA oxidase (g3898) were upregulated by 3.76 and 2.30 fold, respectively (Dataset S1). These enzymes play crucial roles in fatty acid metabolism and are involved in various biochemical processes within the cell. Acyl-CoA dehydrogenase is responsible for catalyzing the alpha, beta-dehydrogenation of acyl-CoA molecules, a key step in fatty acid degradation. On the other hand, Acyl-CoA oxidase is involved in the oxidation of acyl-CoA molecules. The upregulation of these enzyme genes suggests an increased demand for fatty acid metabolism or energy production in the analyzed context. These enzymes are essential for breaking down fatty acids, which can be used as an energy source or as building blocks for various cellular processes [53]. The upregulation of Acyl-CoA dehydrogenase and Acyl-CoA oxidase indicates an enhanced capacity for fatty acid utilization and suggests an active metabolic state in the studied system.
In comparison with other algae studies, it can be found that the response strategies adopted by N. oceanica are different. In the presence of urea, diatoms tend to exhibit higher lipid synthesis activity. The lipid metabolism strategy of diatoms may favor carbon storage [54]. On the other hand, green algae, in urea conditions, tend to show lower lipid synthesis activity. Green algae may prioritize nitrogen utilization to support growth and protein synthesis [55]. This suggests that green algae may focus more on nitrogen uptake and metabolism rather than lipid accumulation. Through the analysis of metabolic pathways, it is evident that the proportion of mRNA expression related to unsaturated fatty acids significantly increases. This indicates that under the addition of urea, N. oceanica enhance the rate of synthesizing unsaturated fatty acids to adapt to environmental changes. Overall, the addition of urea enhances lipid metabolism. Urea metabolism releases bicarbonate ions (HCO3-), further promoting the growth and lipid metabolism of N. oceanica. Additionally, there are alterations in the composition of lipid production in N. oceanica.
3.7. Folate Metabolism Affected by Urea Addition
Interestingly, we note a significant activity in the derivative folate metabolism. Folate serves as the predominant supplier and receptor of one-carbon units in the majority of organisms, playing a vital role in various essential metabolic processes such asmethylation cycles, amino acid metabolism, and the biosynthesis of nucleotides [56]. The first stage of folate metabolism is commonly facilitated by dihydrofolate reductase (DHFR: g5758), employing NADPH as a coenzyme to enzymatically reduce folate to dihydrofolate. Subsequently, DHFR further reduces dihydrofolate to tetrahydrofolic acid (Figure 6 and Dataset S1). Methylenetetrahydrofolate Reductase (MTHFR: g6732) exhibited a 2.03-fold upregulation at the mRNA level (Figure 6 and Dataset S1). This enzyme, a key regulator in the methyl cycle, catalyzes the conversion of 5,10-methylenetetrahydrofolate (5,10-MTHF) to 5-methyltetrahydrofolate (5-MTHF). It plays a crucial role in folate metabolism, DNA synthesis, and the methylation reactions [57]. Adenosylhomocysteinase (g5816) and Methylthioadenosine/S-Adenosylhomocysteine nucleosidase (g648) catalyze the reversible hydrolysis of S-Adenosylhomocysteine (SAH), breaking it down into adenosine and homocysteine. At the mRNA level, both showed a significant upregulation (5.56-fold and 2.29- fold, respectively) (Figure 6 and Dataset S1). Homocysteine undergoes two metabolic pathways in the body. Firstly, it can be converted into methionine through a remethylation process, involving a key gene for methionine synthesis. Notably, the formation of methionine is associated with remethylation, but the specific gene responsible for the synthesis of methionine has not been detected. Secondly, homocysteine enters the transsulfuration pathway, where it combines with serine catalyzed by cystathionine beta-synthase (CBS: g8386, downregulation, FPKM=0) and its cofactor vitamin B6 (not yet identified) (Dataset S1). This interaction leads to a two-step reaction resulting in the formation of cysteine and α-ketobutyric acid. Seipiapterin Reductase (g1887), an essential enzyme in folate resynthesis, is downregulated by 2.79-fold at the transcriptional level under Ct vs U (Dataset S1). Folate metabolism likely acts as a pivotal hub, contributing to the redistribution of carbon and nitrogen. On one hand, it plays a role in amino acid synthesis (such as methionine), protein synthesis, DNA methylation, and other biological processes. On the other hand, it may impact gene expression by participating in de novo synthesis of purines and pyrimidines [58,59,60,61].
4. Conclusions
Using the mRNA-Seq, we systematically investigated the response of N. oceanica to the addition of urea. This study provides novel insights into the regulation mechanism in response to urea addition. Over a 14-day growth period, there was no significant difference in cell concentration in the experimental group compared to the control group. However, at the transcriptional level, N. oceanica actively and dynamically regulates the redistribution of carbon and nitrogen after urea addition. To acclimate to urea addition, photosynthesis, carbon/nitrogen metabolism, fatty acid biosynthesis, and lipid metabolism were reprogrammed. Those processes such as amino acid and protein synthesis and degradation, as well as carbon fixation, are enhanced under urea addition. Notably, genes associated with lipases or polyunsaturated fatty acid enzymes were highly activated. These data will serve as a reference for future in-depth research into the effects of urea on N. oceanica.
Supplementary Materials
The following supporting information can be downloaded at: www.mdpi.com/xxx/s1, Dataset S1: The mRNA-Seq data for the genes involved in glycerolipid metabolism, fatty acid biosynthesis, lipases, carbon fixation and CCM, carbon metabolism, and transporter,nitrogen metabolism,folate metabolism and beta-oxidation.
Author Contributions
Conceived and Designed research, L.W.; Completed the experiment, H.Z., Z.Y. and Z.X.; Organized and analyzed data, wrote the paper, L.W. and H.Z. All authors have read and agreed to the published version of the manuscript.
Acknowledgments
This work was supported by National Natural Science Foundation of China (32160020), Hainan Provincial Natural Science Foundation of China (321MS036), National College Students’ innovation and entrepreneurship training program of China (202111658008 and 202111658010), and the project of the Education Department of Hainan Province (Hnky2021ZD-11) and the fund of The Innovation Platform for Academicians of Hainan Province (YSPTZX202130).
Conflicts of Interest
The authors declare that there are no competing interests.
References
- Rosa, R. M.; Machado, M.; Vaz, M.; Lopes-Santos, R.; Nascimento, A. G. D.; Araújo, W. L.; Nunes-Nesi, A., Urea as a source of nitrogen and carbon leads to increased photosynthesis rates in Chlamydomonas reinhardtii under mixotrophy. J Biotechnol 2023, 367, 20-30. [CrossRef]
- Sun, M.; Li, S.; Yu, H.; Gong, Q.; Zhang, B.; Liu, G.; Xiao, Y.; Peng, F., Effects of Valine and Urea on Carbon and Nitrogen Accumulation and Lignin Content in Peach Trees. Plants (Basel) 2023, 12 (8). [CrossRef]
- Kumbhar, A. N.; He, M.; Rajper, A. R.; Memon, K. A.; Rizwan, M.; Nagi, M.; Woldemicael, A. G.; Li, D.; Wang, C.; Wang, C., The Use of Urea and Kelp Waste Extract is A Promising Strategy for Maximizing the Biomass Productivity and Lipid Content in Chlorella sorokiniana. Plants (Basel) 2020, 9 (4). [CrossRef]
- Kuo, C. M.; Yang, Y. C.; Zhang, W. X.; Wu, J. X.; Chen, Y. T.; Lin, C. H.; Lin, M. W.; Lin, C. S., A Low-Cost Fertilizer Medium Supplemented with Urea for the Lutein Production of Chlorella sp. and the Ability of the Lutein to Protect Cells against Blue Light Irradiation. Bioengineering (Basel) 2023, 10 (5). [CrossRef]
- Lai, Y. J., Omega-3 fatty acid obtained from Nannochloropsis oceanica cultures grown under low urea protect against Abeta-induced neural damage. J Food Sci Technol 2015, 52 (5), 2982-9. [CrossRef]
- Abougrara, A. M., Effects of Different Levels of Urea as Nitrogen Source on Chemical Composition of Marine Microalgae Nannochloropsis oculata. Al-Mukhtar Journal of Sciences 2021, 36 (1), 1-11. [CrossRef]
- Majid, M.; Salimeh, S., Characterization of the Growth, Total Lipid and Fatty Acid Profiles in Microalga, Nannochloropsis oceanica under Different Nitrogen Sources. Microbiol. Biotechnol. Lett 2019, 47 (1), 11-19.
- Dong, H. P.; Williams, E.; Wang, D. Z.; Xie, Z. X.; Hsia, R. C.; Jenck, A.; Halden, R.; Li, J.; Chen, F.; Place, A. R., Responses of Nannochloropsis oceanica IMET1 to Long-Term Nitrogen Starvation and Recovery. Plant Physiol 2013, 162 (2), 1110-26. [CrossRef]
- Kang, N. K.; Jeon, S.; Kwon, S.; Koh, H. G.; Shin, S. E.; Lee, B.; Choi, G. G.; Yang, J. W.; Jeong, B. R.; Chang, Y. K., Effects of overexpression of a bHLH transcription factor on biomass and lipid production in Nannochloropsis salina. Biotechnol Biofuels 2015, 8, 200. [CrossRef]
- Li, J.; Han, D.; Wang, D.; Ning, K.; Jia, J.; Wei, L.; Jing, X.; Huang, S.; Chen, J.; Li, Y.; Hu, Q.; Xu, J., Choreography of Transcriptomes and Lipidomes of Nannochloropsis Reveals the Mechanisms of Oil Synthesis in Microalgae. Plant Cell 2014, 26 (4), 1645-1665. [CrossRef]
- Haas, B. J.; Papanicolaou, A.; Yassour, M.; Grabherr, M.; Blood, P. D.; Bowden, J.; Couger, M. B.; Eccles, D.; Li, B.; Lieber, M.; MacManes, M. D.; Ott, M.; Orvis, J.; Pochet, N.; Strozzi, F.; Weeks, N.; Westerman, R.; William, T.; Dewey, C. N.; Henschel, R.; LeDuc, R. D.; Friedman, N.; Regev, A., De novo transcript sequence reconstruction from RNA-seq using the Trinity platform for reference generation and analysis. Nat Protoc 2013, 8 (8), 1494-512. [CrossRef]
- Conesa, A.; Gotz, S.; Garcia-Gomez, J. M.; Terol, J.; Talon, M.; Robles, M., Blast2GO: a universal tool for annotation, visualization and analysis in functional genomics research. BIOINFORMATICS 2005, 21 (18), 3674-6. [CrossRef]
- Goto, M. K. a. S., KEGG: Kyoto Encyclopedia of Genes and Genomes. Nucleic Acids Research 2000, 28 (1), 27-30. [CrossRef]
- Raghavan, V.; Kraft, L.; Mesny, F.; Rigerte, L., A simple guide to de novo transcriptome assembly and annotation. Briefings in Bioinformatics 2022, 23 (2). [CrossRef]
- Soneson, C.; Love, M. I.; Robinson, M. D., Differential analyses for RNA-seq: transcript-level estimates improve gene-level inferences. F1000Res 2015, 4, 1521. [CrossRef]
- Conesa, A.; Madrigal, P.; Tarazona, S.; Gomez-Cabrero, D.; Cervera, A.; McPherson, A.; Szcześniak, M. W.; Gaffney, D. J.; Elo, L. L.; Zhang, X.; Mortazavi, A., A survey of best practices for RNA-seq data analysis. Genome Biology 2016, 17 (1), 13. [CrossRef]
- Li, B.; Dewey, C. N., RSEM: accurate transcript quantification from RNA-Seq data with or without a reference genome. BMC Bioinformatics 2011, 12, 323. [CrossRef]
- Robinson, M. D.; McCarthy, D. J.; Smyth, G. K., edgeR: a Bioconductor package for differential expression analysis of digital gene expression data. BIOINFORMATICS 2010, 26 (1), 139-40. [CrossRef]
- Xie, C.; Mao, X.; Huang, J.; Ding, Y.; Wu, J.; Dong, S.; Kong, L.; Gao, G.; Li, C. Y.; Wei, L., KOBAS 2.0: a web server for annotation and identification of enriched pathways and diseases. Nucleic Acids Res 2011, 39 (Web Server issue), W316-22. [CrossRef]
- Zhao, S.; Ye, Z.; Stanton, R., Misuse of RPKM or TPM normalization when comparing across samples and sequencing protocols. Rna 2020, 26 (8), 903-909. [CrossRef]
- Vera Alvarez, R.; Pongor, L. S.; Mariño-Ramírez, L.; Landsman, D., TPMCalculator: one-step software to quantify mRNA abundance of genomic features. Bioinformatics 2019, 35 (11), 1960-1962. [CrossRef]
- Mohapatra, S.; Weisshaar, J. C., Modified Pearson correlation coefficient for two-color imaging in spherocylindrical cells. BMC Bioinformatics 2018, 19 (1), 428. [CrossRef]
- Salbitani, G.; Carfagna, S., Ammonium Utilization in Microalgae: A Sustainable Method for Wastewater Treatment. Sustainability 2021, 13 (2), 956. [CrossRef]
- Calabrese, S.; Pérez-Tienda, J.; Ellerbeck, M.; Arnould, C.; Chatagnier, O.; Boller, T.; Schüßler, A.; Brachmann, A.; Wipf, D.; Ferrol, N.; Courty, P.-E., GintAMT3 – a Low-Affinity Ammonium Transporter of the Arbuscular Mycorrhizal Rhizophagus irregularis. Frontiers in Plant Science 2016, 7. [CrossRef]
- Lanquar, V.; Loqué, D.; Hörmann, F.; Yuan, L.; Bohner, A.; Engelsberger, W. R.; Lalonde, S.; Schulze, W. X.; von Wirén, N.; Frommer, W. B., Feedback inhibition of ammonium uptake by a phospho-dependent allosteric mechanism in Arabidopsis. Plant Cell 2009, 21 (11), 3610-22.
- Hao, D.; Li, X.; Kong, W.; Chen, R.; Liu, J.; Guo, H.; Zhou, J., Phosphorylation regulation of nitrogen, phosphorus, and potassium uptake systems in plants. The Crop Journal 2023, 11 (4), 1034-1047. [CrossRef]
- Loqué, D.; Lalonde, S.; Looger, L. L.; von Wirén, N.; Frommer, W. B., A cytosolic trans-activation domain essential for ammonium uptake. Nature 446 (7132), 195-8. [CrossRef]
- Neuhäuser, B.; Dynowski, M.; Mayer, M.; Ludewig, U., Regulation of NH4+ transport by essential cross talk between AMT monomers through the carboxyl tails. Plant Physiol 2007, 143 (4), 1651-9. [CrossRef]
- Miller, E. F.; Maier, R. J., Ammonium metabolism enzymes aid Helicobacter pylori acid resistance. J Bacteriol 2014, 196 (17), 3074-81. [CrossRef]
- Pechkovskaya, S. A.; Knyazev, N. A.; Matantseva, O. V.; Emelyanov, A. K.; Telesh, I. V.; Skarlato, S. O.; Filatova, N. A., Dur3 and nrt2 genes in the bloom-forming dinoflagellate Prorocentrum minimum: Transcriptional responses to available nitrogen sources. Chemosphere 2020, 241, 125083. [CrossRef]
- Veaudor, T.; Cassier-Chauvat, C.; Chauvat, F., Genomics of Urea Transport and Catabolism in Cyanobacteria: Biotechnological Implications. Frontiers in Microbiology 2019, 10. [CrossRef]
- Su, Z.; Olman, V.; Mao, F.; Xu, Y., Comparative genomics analysis of NtcA regulons in cyanobacteria: regulation of nitrogen assimilation and its coupling to photosynthesis. Nucleic Acids Res 2005, 33 (16), 5156-71. [CrossRef]
- Beckers, G.; Bendt, A. K.; Krämer, R.; Burkovski, A., Molecular Identification of the Urea Uptake System and Transcriptional Analysis of Urea Transporter- and Urease-Encoding Genes in Corynebacterium glutamicum. Journal of Bacteriology 2004, 186, 7645 - 7652. [CrossRef]
- Hodin, J.; Lind, C.; Marmagne, A.; Espagne, C.; Bianchi, M. W.; De Angeli, A.; Abou-Choucha, F.; Bourge, M.; Chardon, F.; Thomine, S.; Filleur, S., Proton exchange by the vacuolar nitrate transporter CLCa is required for plant growth and nitrogen use efficiency. Plant Cell 2023, 35 (1), 318-335. [CrossRef]
- Mérigout, P.; Lelandais, M.; Bitton, F.; Renou, J. P.; Briand, X.; Meyer, C.; Daniel-Vedele, F., Physiological and transcriptomic aspects of urea uptake and assimilation in Arabidopsis plants. Plant Physiol 2008, 147 (3), 1225-38. [CrossRef]
- Gutierrez, J.; Kwan, T.; Zimmerman, J.; Peccia, J., Ammonia inhibition in oleaginous microalgae. Algal Research 2016, 19, 123-127. [CrossRef]
- Takeuchi, T.; Benning, C., Nitrogen-dependent coordination of cell cycle, quiescence and TAG accumulation in Chlamydomonas. Biotechnology for Biofuels 2019, 12 (1), 292. [CrossRef]
- Ort, D. R.; Zhu, X.; Melis, A., Optimizing Antenna Size to Maximize Photosynthetic Efficiency. Plant Physiology 2010, 155 (1), 79-85. [CrossRef]
- Kirst, H.; Formighieri, C.; Melis, A., Maximizing photosynthetic efficiency and culture productivity in cyanobacteria upon minimizing the phycobilisome light-harvesting antenna size. Biochimica et Biophysica Acta (BBA) - Bioenergetics 2014, 1837 (10), 1653-1664. [CrossRef]
- Nakajima, Y.; Itayama, T., Analysis of photosynthetic productivity of microalgal mass cultures. Journal of Applied Phycology 2003, 15 (6), 497-505. [CrossRef]
- Chadee, A.; Alber, N. A.; Dahal, K.; Vanlerberghe, G. C., The Complementary Roles of Chloroplast Cyclic Electron Transport and Mitochondrial Alternative Oxidase to Ensure Photosynthetic Performance. Front Plant Sci 2021, 12, 748204. [CrossRef]
- Wei, L.; Shen, C.; El Hajjami, M.; You, W.; Wang, Q.; Zhang, P.; Ji, Y.; Hu, H.; Hu, Q.; Poetsch, A.; Xu, J., Knockdown of carbonate anhydrase elevates Nannochloropsis productivity at high CO2 level. Metab Eng 2019, 54, 96-108. [CrossRef]
- Wei, L.; El Hajjami, M.; Shen, C.; You, W.; Lu, Y.; Li, J.; Jing, X.; Hu, Q.; Zhou, W.; Poetsch, A.; Xu, J., Transcriptomic and proteomic responses to very low CO2 suggest multiple carbon concentrating mechanisms in Nannochloropsis oceanica. Biotechnol Biofuels 2019, 12, 168. [CrossRef]
- Krausfeldt, L. E.; Farmer, A. T.; Castro Gonzalez, H. F.; Zepernick, B. N.; Campagna, S. R.; Wilhelm, S. W., Urea Is Both a Carbon and Nitrogen Source for Microcystis aeruginosa: Tracking 13C Incorporation at Bloom pH Conditions. Frontiers in Microbiology 2019, 10. [CrossRef]
- Matsuda, Y.; Hopkinson, B. M.; Nakajima, K.; Dupont, C. L.; Tsuji, Y., Mechanisms of carbon dioxide acquisition and CO2 sensing in marine diatoms: a gateway to carbon metabolism. Philos Trans R Soc Lond B Biol Sci 2017, 372 (1728). [CrossRef]
- Becker, P.; Naughton, F.; Brotherton, D.; Pacheco-Gomez, R.; Beckstein, O.; Cameron, A. D., Mechanism of substrate binding and transport in BASS transporters. Elife 2023, 12. [CrossRef]
- Arnold, P. K.; Finley, L. W. S., Regulation and function of the mammalian tricarboxylic acid cycle. J Biol Chem 2023, 299 (2), 102838. [CrossRef]
- Zarrinmehr, M. J.; Farhadian, O.; Heyrati, F. P.; Keramat, J.; Koutra, E.; Kornaros, M.; Daneshvar, E., Effect of nitrogen concentration on the growth rate and biochemical composition of the microalga, Isochrysis galbana. The Egyptian Journal of Aquatic Research 2020, 46 (2), 153-158. [CrossRef]
- Choi, I.; Son, H.; Baek, J. H., Tricarboxylic Acid (TCA) Cycle Intermediates: Regulators of Immune Responses. Life (Basel) 2021, 11 (1). [CrossRef]
- Rosa, R. M.; Machado, M.; Vaz, M. G. M. V.; Lopes-Santos, R.; Nascimento, A. G. d.; Araújo, W. L.; Nunes-Nesi, A., Urea as a source of nitrogen and carbon leads to increased photosynthesis rates in Chlamydomonas reinhardtii under mixotrophy. Journal of Biotechnology 2023, 367, 20-30. [CrossRef]
- Ollis, D. L.; Cheah, E.; Cygler, M.; Dijkstra, B.; Frolow, F.; Franken, S. M.; Harel, M.; Remington, S. J.; Silman, I.; Schrag, J.; et al., The alpha/beta hydrolase fold. Protein Eng 1992, 5 (3), 197-211.
- Nardini, M.; Dijkstra, B. W., Alpha/beta hydrolase fold enzymes: the family keeps growing. Curr Opin Struct Biol 1999, 9 (6), 732-7. [CrossRef]
- Edwards, M.; Mohiuddin, S. S., Biochemistry, Lipolysis. In StatPearls, StatPearls Publishing Copyright © 2023, StatPearls Publishing LLC.: Treasure Island (FL) ineligible companies. Disclosure: Shamim Mohiuddin declares no relevant financial relationships with ineligible companies., 2023.
- Bhuyar, P.; Sundararaju, S.; Rahim, M. H. A.; Maniam, G. P.; Govindan, N., Enhanced productivity of lipid extraction by urea stress conditions on marine microalgae Coelastrum sp. for improved biodiesel production. Bioresource Technology Reports 2021, 15, 100696. [CrossRef]
- Popko, J.; Herrfurth, C.; Feussner, K.; Ischebeck, T.; Iven, T.; Haslam, R.; Hamilton, M.; Sayanova, O.; Napier, J.; Khozin-Goldberg, I.; Feussner, I., Metabolome Analysis Reveals Betaine Lipids as Major Source for Triglyceride Formation, and the Accumulation of Sedoheptulose during Nitrogen-Starvation of Phaeodactylum tricornutum. PLoS One 2016, 11 (10), e0164673. [CrossRef]
- Gorelova, V.; Bastien, O.; De Clerck, O.; Lespinats, S.; Rébeillé, F.; Van Der Straeten, D., Evolution of folate biosynthesis and metabolism across algae and land plant lineages. Scientific Reports 2019, 9 (1), 5731. [CrossRef]
- Raghubeer, S.; Matsha, T. E., Methylenetetrahydrofolate (MTHFR), the One-Carbon Cycle, and Cardiovascular Risks. Nutrients 2021, 13 (12). [CrossRef]
- Geryk, J.; Krsička, D.; Vlčková, M.; Havlovicová, M.; Macek, M., Jr.; Kremlíková Pourová, R., The Key Role of Purine Metabolism in the Folate-Dependent Phenotype of Autism Spectrum Disorders: An In Silico Analysis. Metabolites 2020, 10 (5). [CrossRef]
- Rozen, R., Biochemistry and genetics of folate metabolism. Cerebrospinal Fluid Research 2010, 7 (1), S4. [CrossRef]
- Stover, P. J., One-carbon metabolism-genome interactions in folate-associated pathologies. J Nutr 2009, 139 (12), 2402-5. [CrossRef]
- Zheng, Y.; Cantley, L. C., Toward a better understanding of folate metabolism in health and disease. J Exp Med 2019, 216 (2), 253-266. [CrossRef]
Figure 1.
Primary analysis of mRNA-seq data in N. oceanica. (A)The expression distribution of samples in the experimental group with added urea and the control group without added urea. (B)Sample Correlation Analysis Heatmap Note: Red indicates strong correlation, blue indicates weak correlation. Red indicates a strong correlation, while blue indicates a weak correlation.
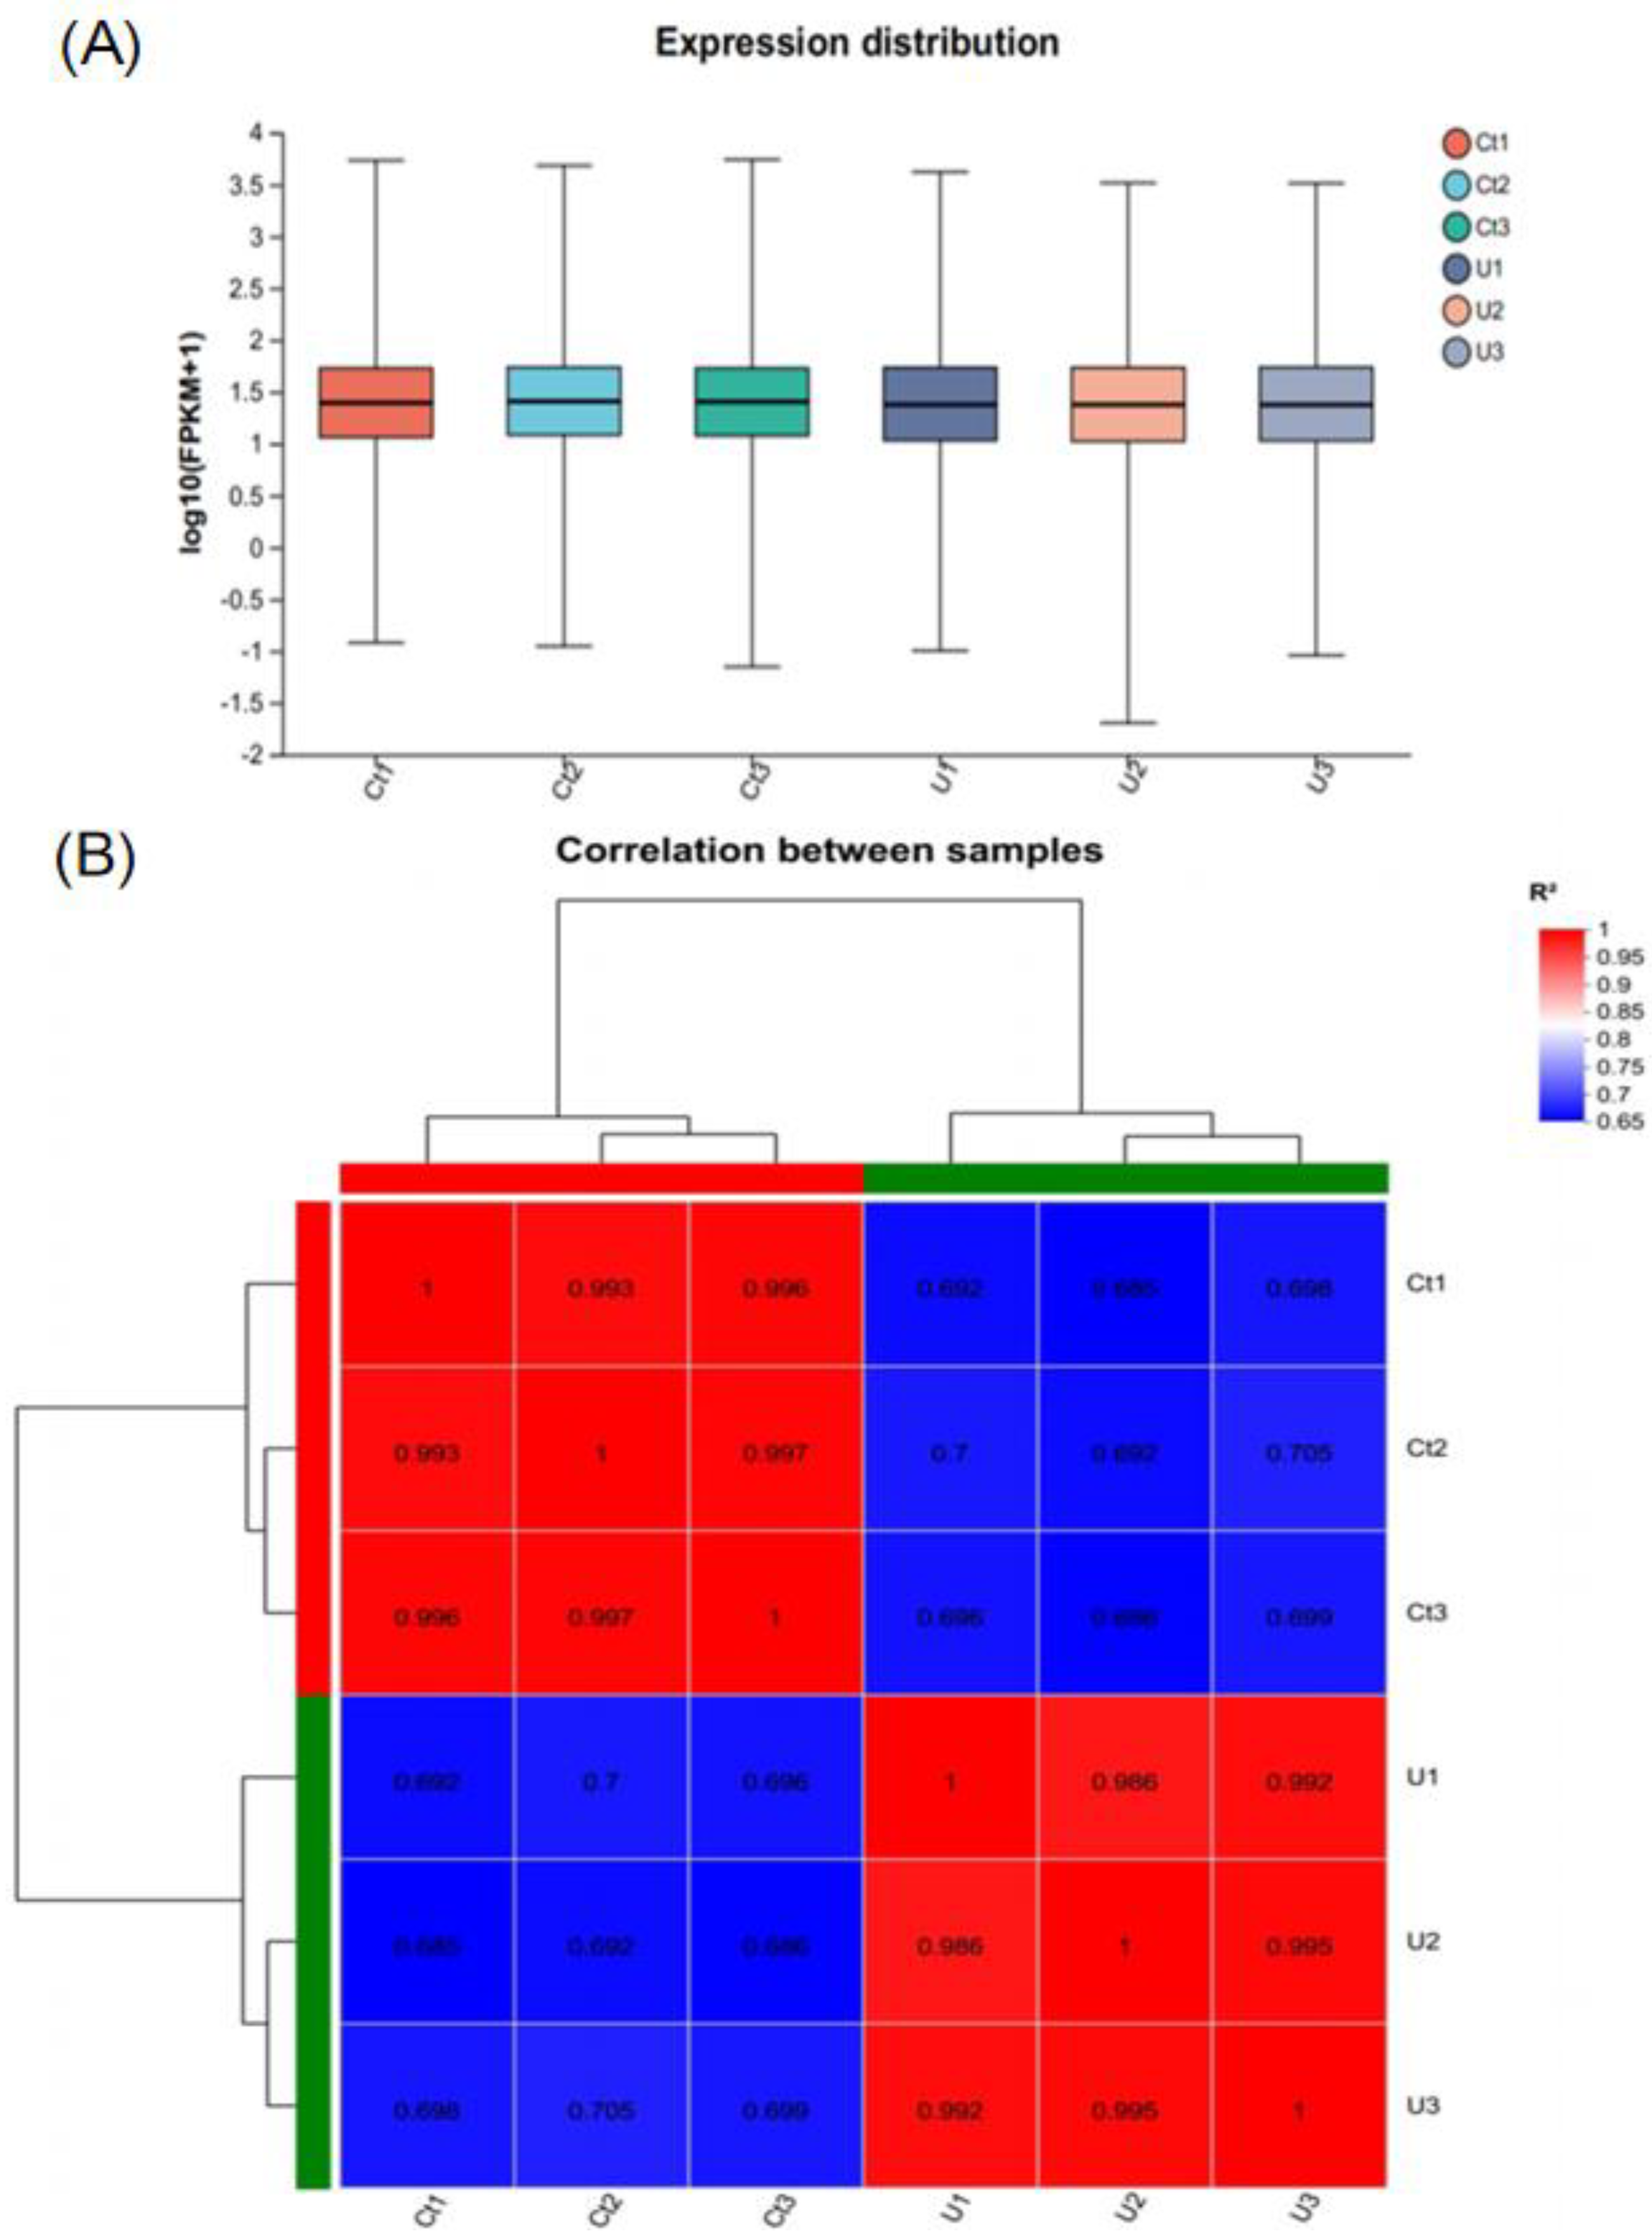
Figure 2.
Venn diagram between samples and analysis of differentially expressed genes. The red portion represents unique genes from the group without urea addition, the blue portion represents unique genes from the group with urea addition and the region at the intersection of the two parts represents shared genes. (A) Quantification of differentially expressed genes in N. oceanica under U (NaNO3 + urea) and Ct (NaNO3) cultivation conditions (at least a 2-fold change under urea addition). (B) Volcano plot illustrating the differential expression pattern of genes between Ct and U conditions. Red dots, blue dots, and gray dots represent upregulated DEGs, downregulated DEGs, and genes with no significant change (Ct), respectively.
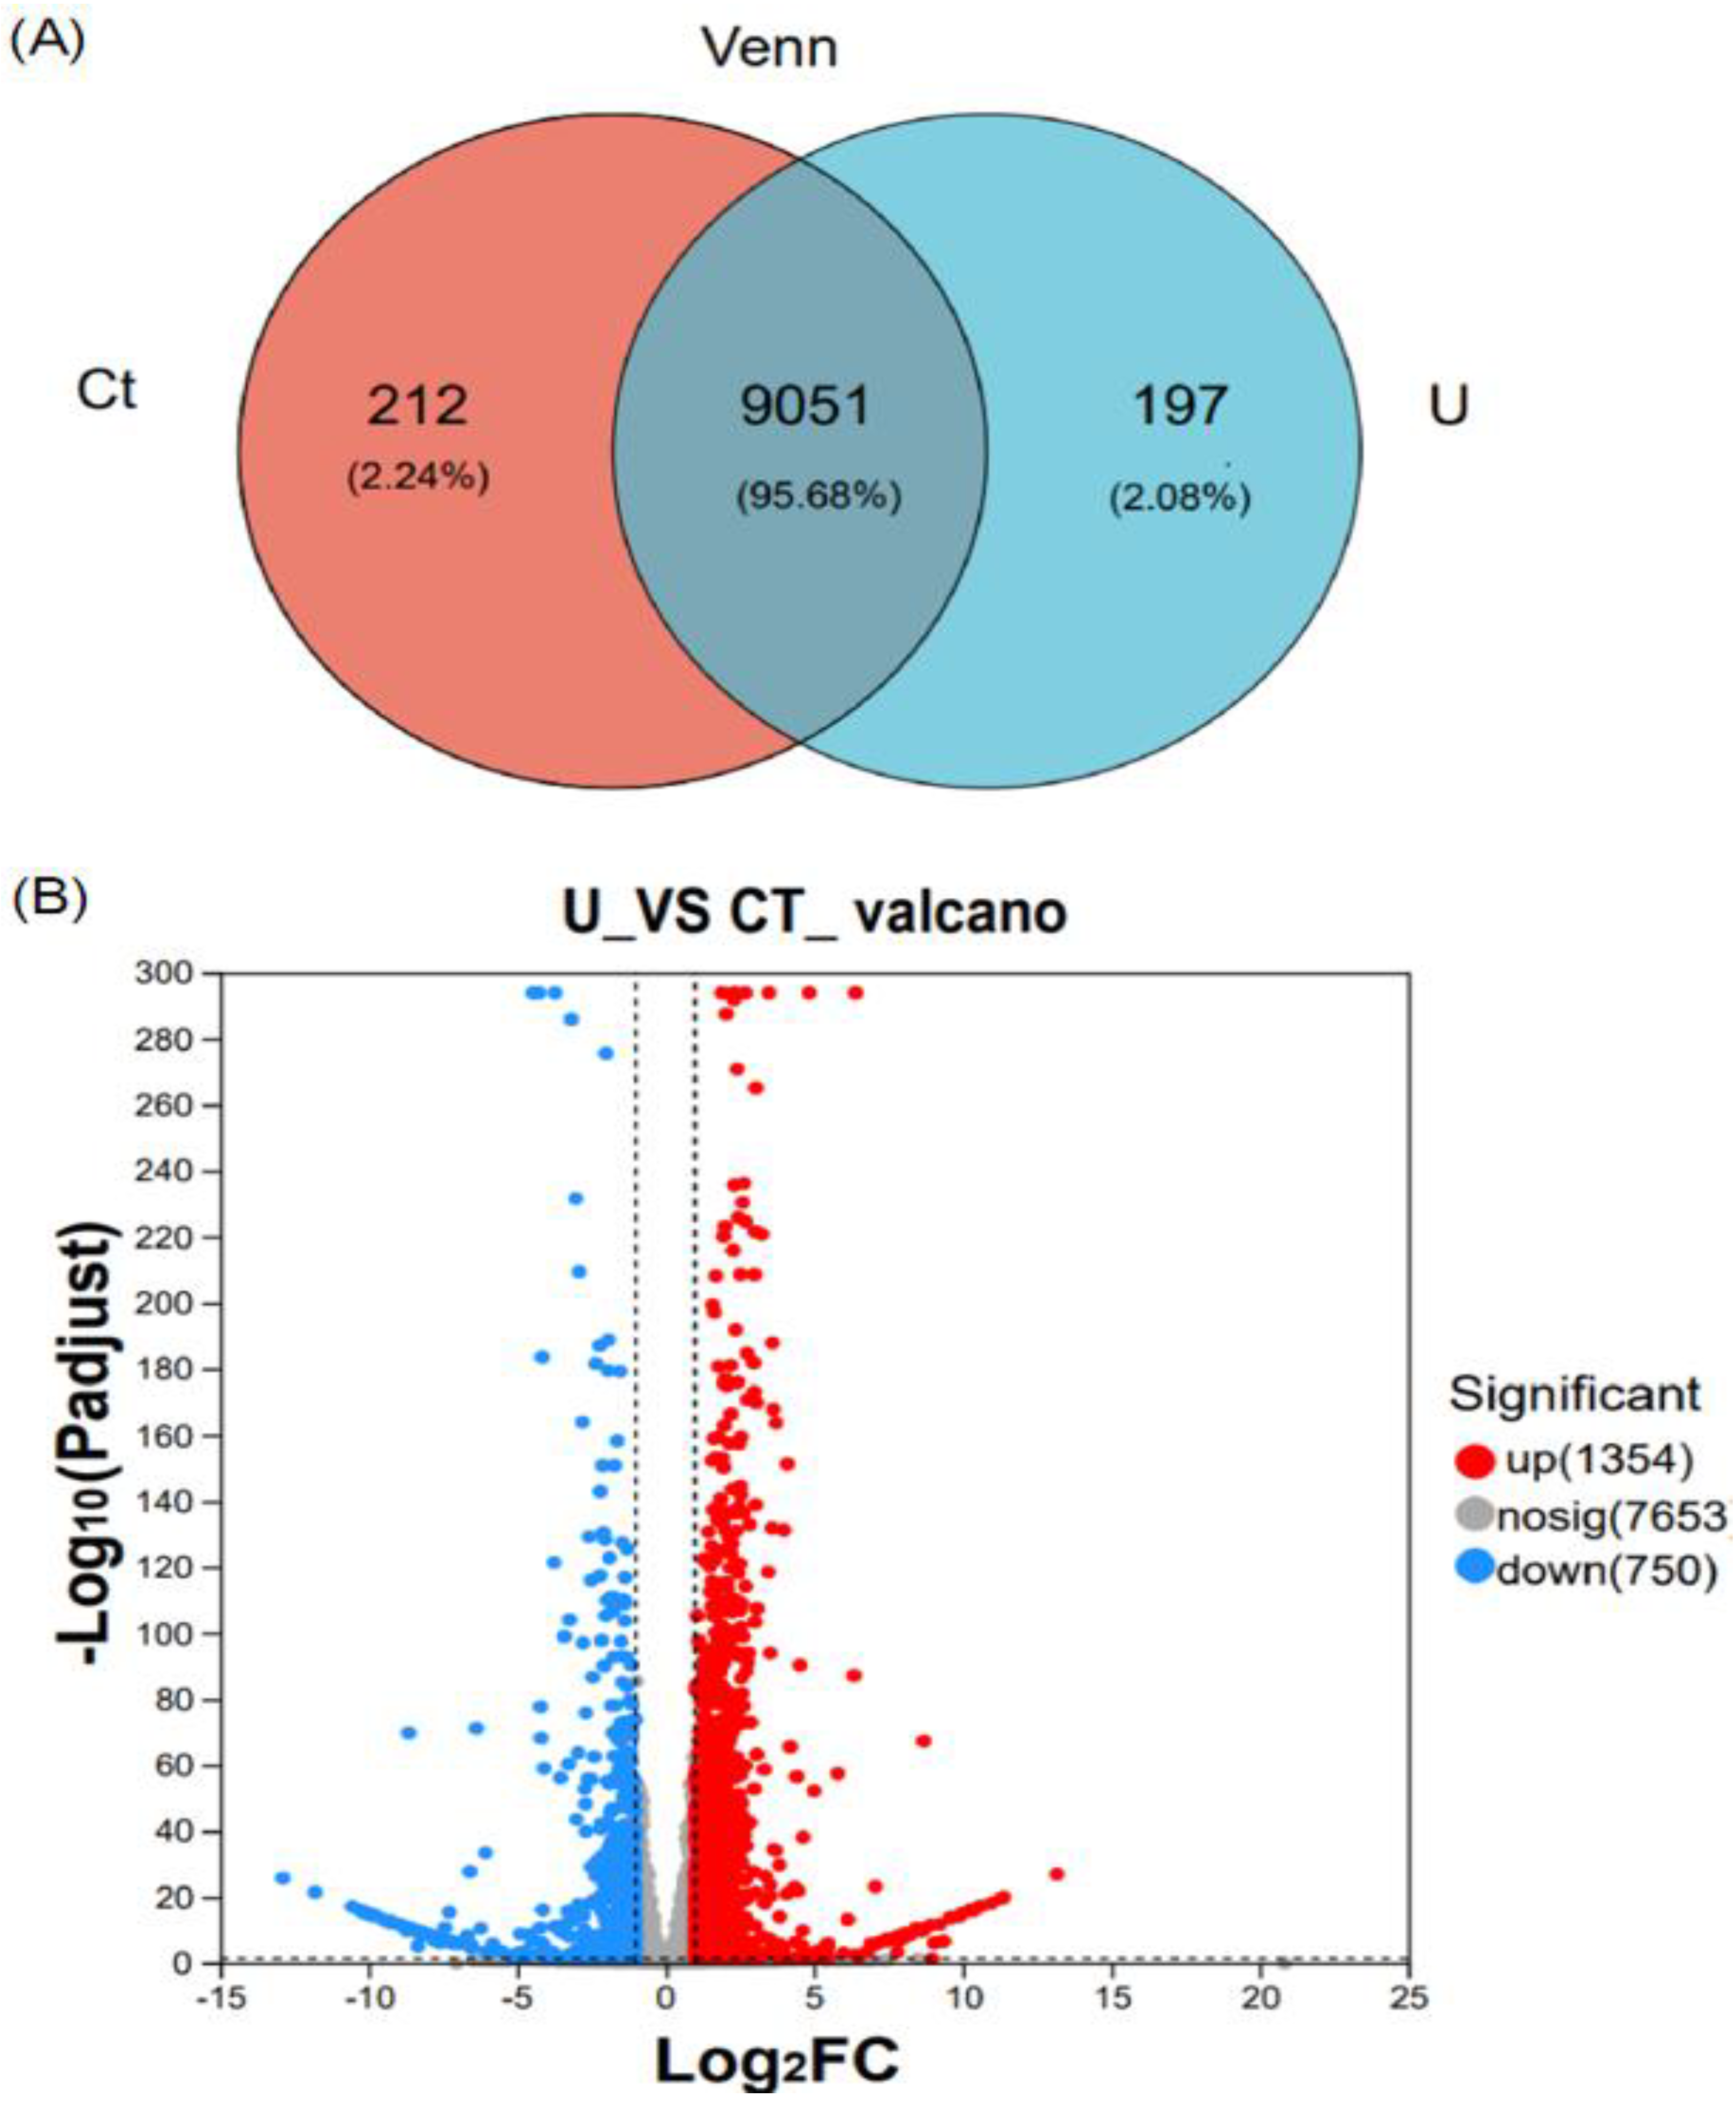
Figure 3.
Functional enrichments and classfications of differentially expressed genes in N. oceanica. (A) The N. oceanica genes were systematically categorized into biological process (BP), cellular component (CC), and molecular function (MF) subclasses through Gene Ontology (GO) analysis. The distribution of genes in each class was visualized using a histogram. (B) Additionally, a pathway enrichment analysis of DEGs was conducted using the KEGG. .
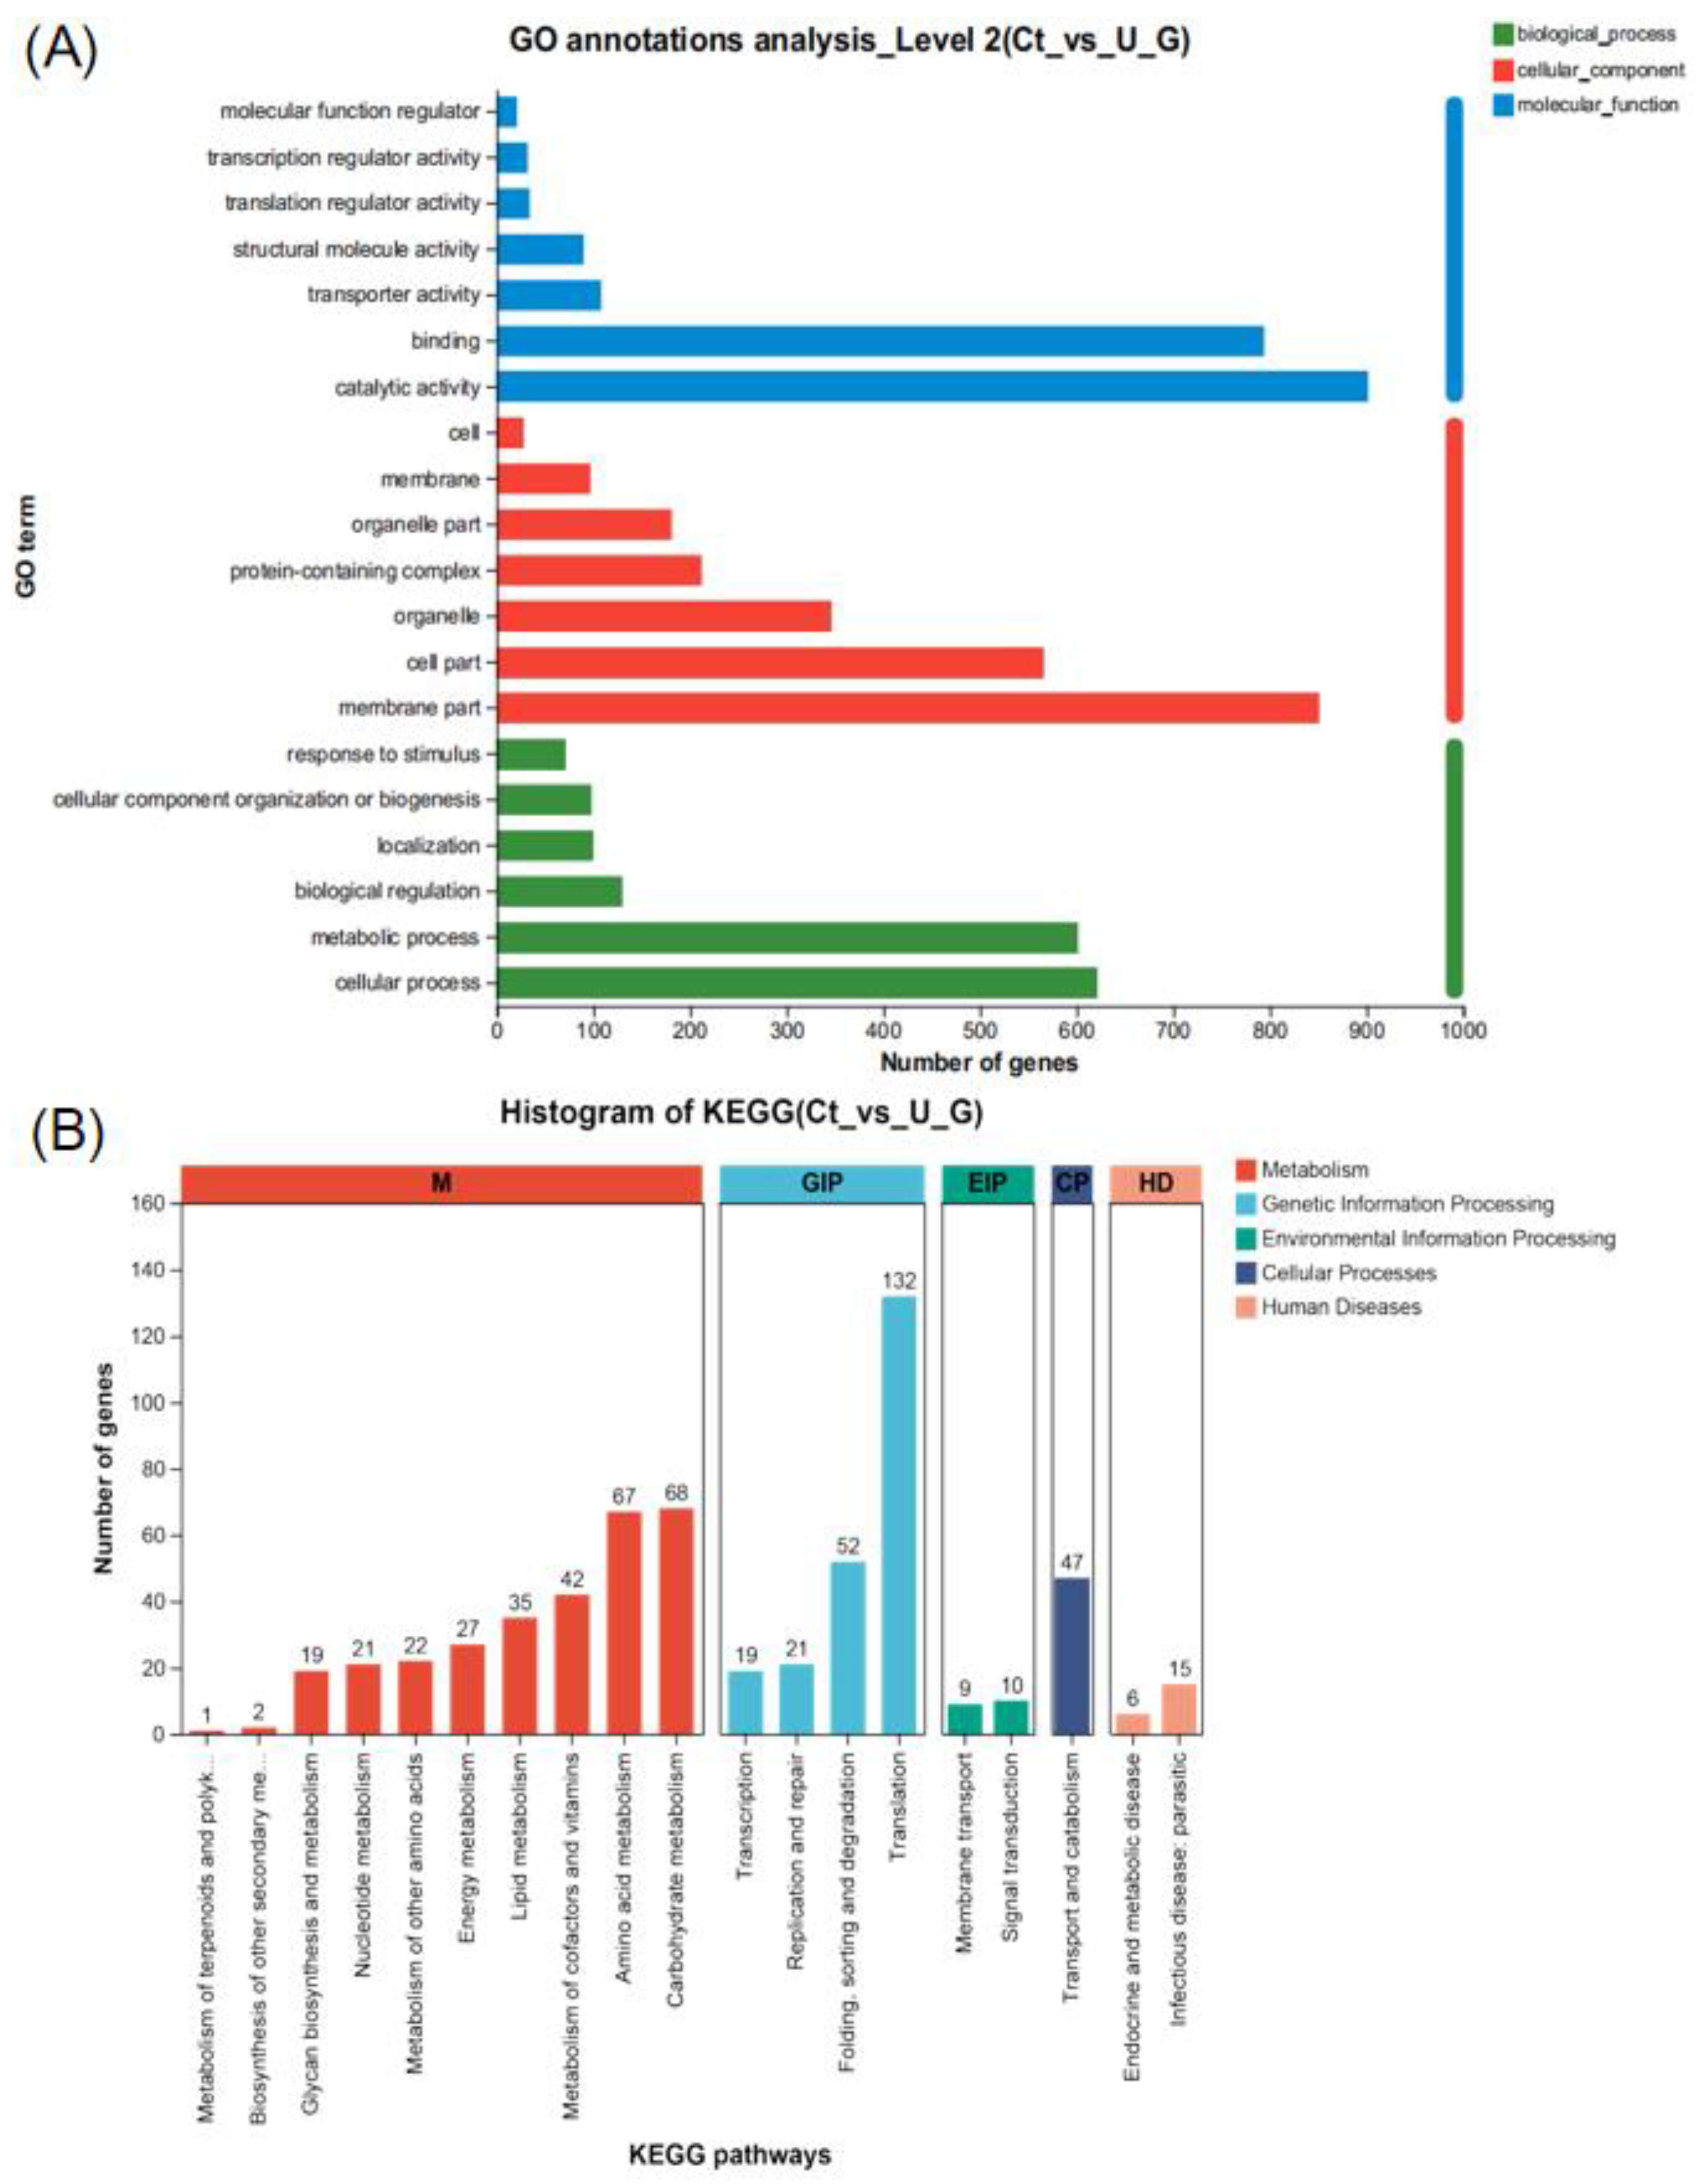
Figure 4.
Nitrogen metabolism-related genes differential expression analysis in N. oceanica under urea addition conditions. Brief construction of the nitrogen assimilation pathway and transcriptional level changes of key genes marked with arrows. The different colored arrows represent the transcriptional changes of the gene, the “red arrows” and the “blue arrows” represent the up-regulation and down-regulation of the urea addition condition respectively.
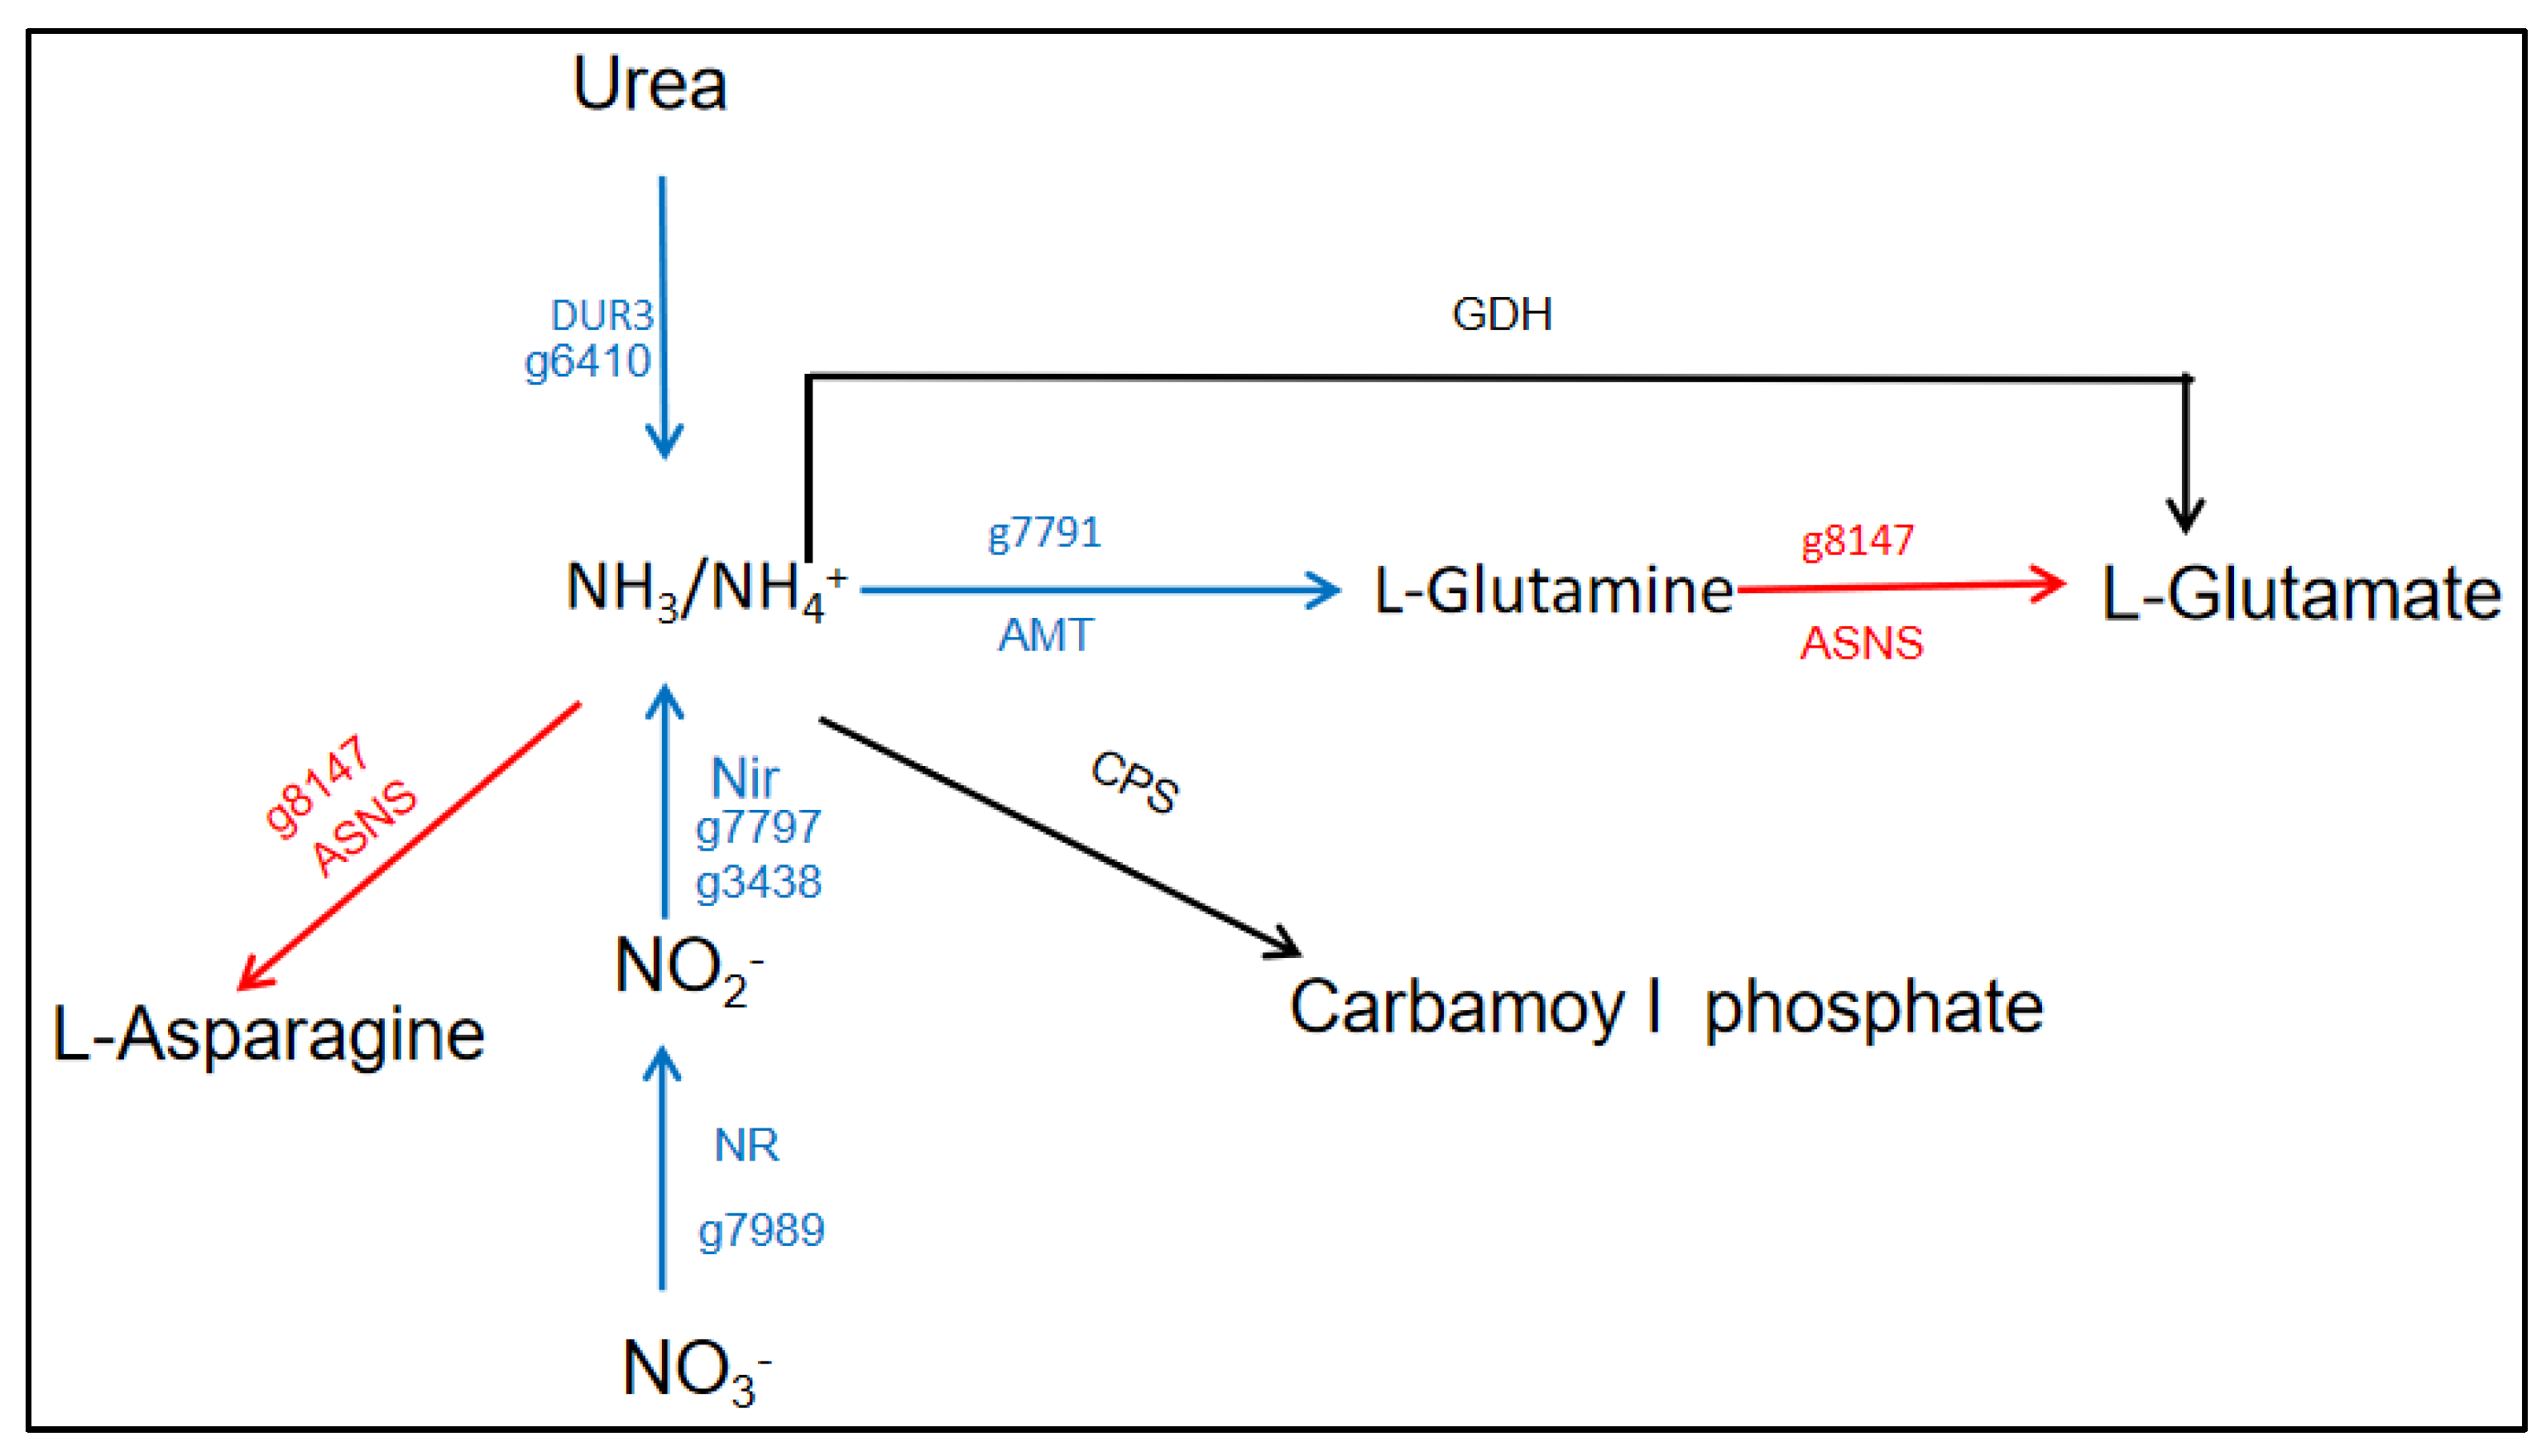
Figure 5.
Differential expression analysis of genes related to lipid metabolism and carbon metabolism in N. oceanica under urea addition. The carbon metabolism pathway and lipid metabolism pathway were briefly constructed. The different colored arrows represent the transcriptional changes of the gene, the “red arrows” and the “blue arrows” represent the up-regulation and down-regulation uder Ct vs U , respectively.
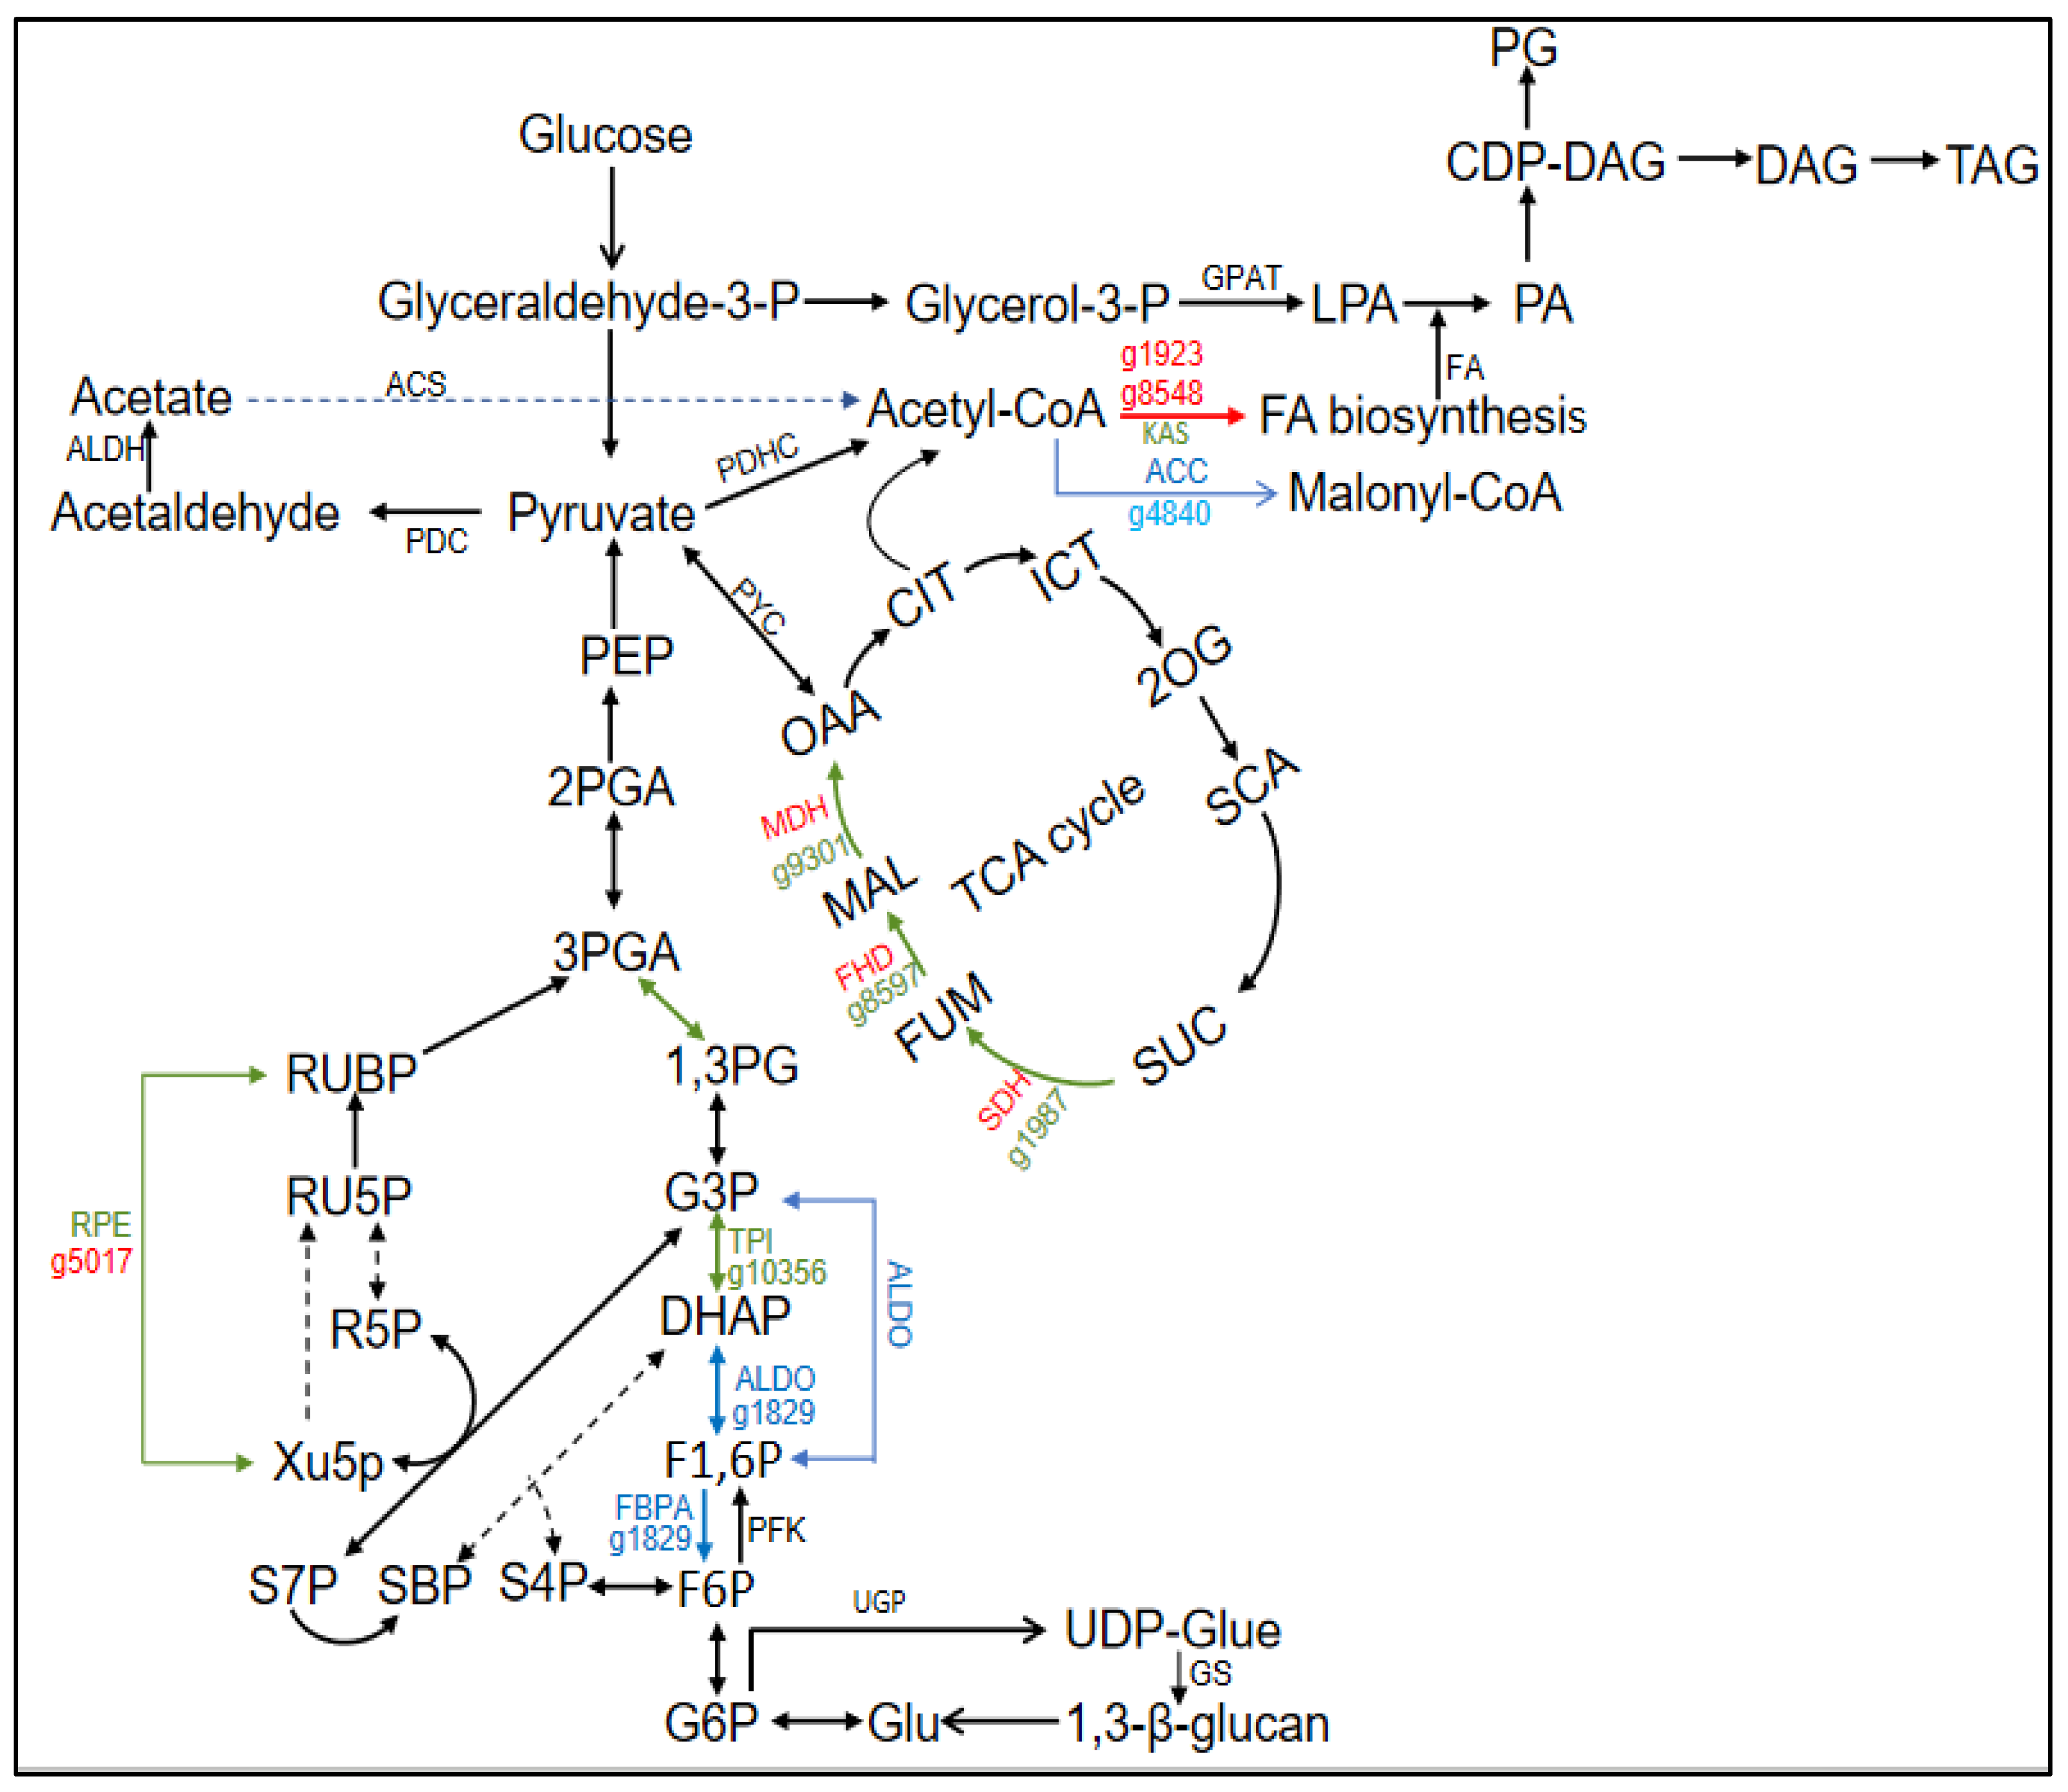
Figure 6.
Differential expression analysis of genes related to folate metabolism affected by urea addition in N. oceanica. The folate metabolism pathway was briefly constructed. The different colored arrows represent the transcriptional changes of the gene, the “red arrows” and the “blue arrows” represent the up-regulation and down-regulation of the urea addition condition respectively. .
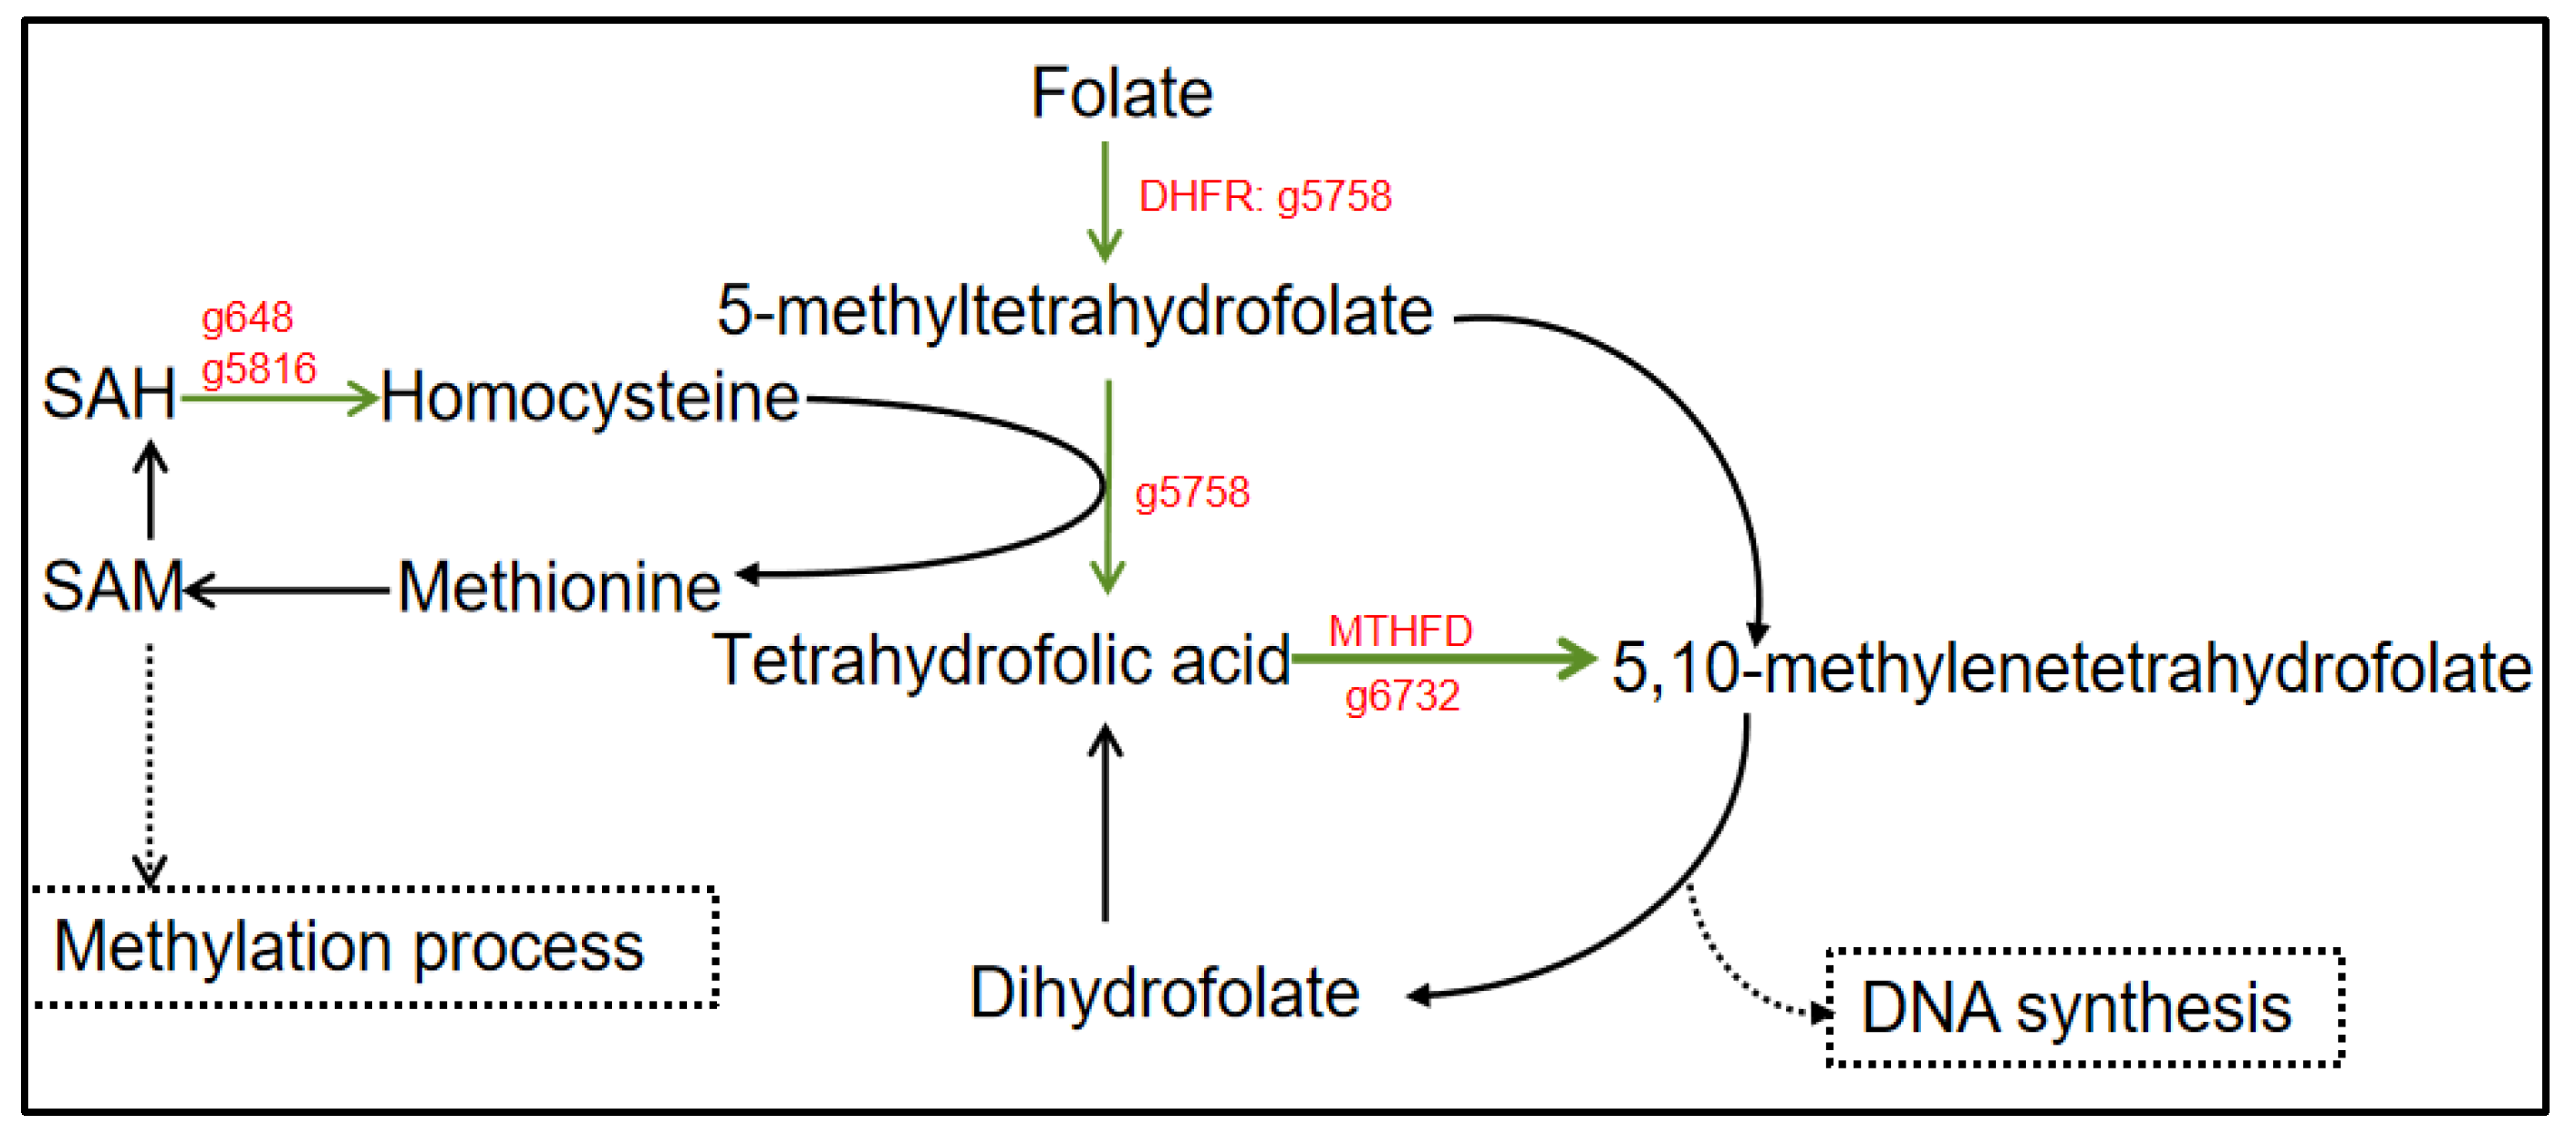

Table 1.
Differential gene expression participated in nitrogen metabolism in N.oceanica.
| Gene ID | Gene name | Abbreviation | Fold change (U Vs Ct; fold) |
|
|---|---|---|---|---|
| g9735 | Kynureninase | KYNU | ↑177.17 | |
| g8147 | Asparagine synthase | ASNS | ↑63.69 | |
| g10184 | Delta-1-pyrroline-5-carboxylate synthetase | P5CS | ↑6.46 | |
| g4389 | Similar to dimethylanaline monooxygenase-like (predicted) | FMO | ↑4.23 | |
| g615 | Urate oxidase | UOX | ↑2.12 | |
| g8006 | Urease accessory protein | URE | ↓2.17 | |
| g6250 | Putative urate catabolism protein | UCP | ↓2.25 | |
| g7989 | Nitrate high affinity transporter | NR | ↓9.35 | |
| g6410 | Urea/Na+ high-affinity symporter | DUR3 | ↓13.33 | |
| g3438 | Ferredoxin nitrite reductase | NiR | ↓17.54 | |
| g7791 | Ammonium transporter | AMT | ↓21.7 | |
| g7797 | Nitroreductase-like protein | NTR | ↓28.57 |
“↑” and “↓” represented up- and down-regulation respectively.
Table 2.
Differential gene expression related to photosynthesis in N. oceanica.
| Gene ID | Gene name | Abbreviation | Fold change (U VsCt; fold) |
|---|---|---|---|
| g5017 | Ribulose-phosphate 3-epimerase | RPE | ↑20.97 |
| g9470 | Cytochrome b6-f complex iron-sulfur subunit | PetC | ↑2.42 |
| g876 | Light-dependent protochlorophyllide reductase | LPOR | ↑2.40 |
| g4344 | Iron-sulfur assembly-like protein | ISU | ↑15.12 |
| g240 | Light harvesting complex protein | LHC | ↓2.04 |
| g5628 | Light harvesting complex protein | LHC | ↓2.05 |
| g7977 | 3,8-divinyl protochlorophyllide a 8-vinyl reductase,putative chloroplast precursor | DVR | ↓2.12 |
| g4337 | Cytochrome c biogenesis protein,thiol reduction transmembrane region | CcdA | ↓2.14 |
| g5629 | Light harvesting complex protein | LHC | ↓2.18 |
| g3077 | Light harvesting complex protein | LHC | ↓2.00 |
| g6113 | Light harvesting complex protein | LHC | ↓2.32 |
| g9713 | Light harvesting complex protein | LHC | ↓2.46 |
| g903 | Light harvesting complex protein | LHC | ↓2.55 |
| g5529 | Ferredoxin(cyanobacterial type ferredoxin family) | Fd | ↓6.62 |
“↑” and “↓” represented up- and down-regulation respectively.
Table 3.
Differential gene expression participated in carbon metabolism in N. oceanica.
| Gene ID Gene name | Abbreviation | Fold change (U Vs Ct; fold) |
||
|---|---|---|---|---|
| Calvin Cycle | ||||
| g6144 | Phosphoglycerate kinase | PGK | ↑2.18 | |
| g10356 | Glyceraldehyde-3-phosphate dehydrogenase | GPDH | ↑2.47 | |
| g1829 | Fructose-1,6-bisphosphate aldolase | FBPA | ↓3.02 | |
| g8036 | Transketolase | TL | ↑2.07 | |
| g5017 | Ribulose-phosphate 3-epimerase | RPE | ↑20.97/3.41 | |
| CCM | ||||
| g2018 | Carbonic anhydrase | CA | ↑26.86/3.06 | |
| C4-like pathway | ||||
| g9301 | Malate dehydrogenase | MDH | ↑265.43 | |
| Degradation of 1,3-β glucan | ||||
| g5401 | Endoglucanase A | EG | ↓2.07 | |
| g4700 | Glucan 1,3-beta-glucosidase | GluB | ↑16.24 | |
| Glycolysis | ||||
| g1829 | Fructose-1,6-bisphosphate aldolase | ALDO | ↓3.02 | |
| g4700 | Triosephosphate isomerase | TPI | ↑2.47 | |
| g5401 | Phosphoglycerate kinase | PGK | ↑2.18 | |
| PDHC Bypass | ||||
| g2887 g956 |
Aldehyde dehydrogenase | ALDH | ↑2.71 | |
| ALDH | ↓2.36 | |||
| TCA cycle | ||||
| g1987 | Succinate dehydrogenase | SDH | ↑2.01 | |
| g8597 | Fumarate hydratase | FHD | ↑2.47 | |
| g9301 | Malate dehydrogenase | MDH | ↑265.43 | |
| Transporter | ||||
| g10029 | Sodium/hydrogen exchanger | NDH | ↓2.64 | |
| g1797 | ATP/ADP transporter | AAT | ↑4.62 | |
“↑” and “↓” represented up- and down-regulation respectively.
Disclaimer/Publisher’s Note: The statements, opinions and data contained in all publications are solely those of the individual author(s) and contributor(s) and not of MDPI and/or the editor(s). MDPI and/or the editor(s) disclaim responsibility for any injury to people or property resulting from any ideas, methods, instructions or products referred to in the content. |
© 2024 by the authors. Licensee MDPI, Basel, Switzerland. This article is an open access article distributed under the terms and conditions of the Creative Commons Attribution (CC BY) license (http://creativecommons.org/licenses/by/4.0/).
Copyright: This open access article is published under a Creative Commons CC BY 4.0 license, which permit the free download, distribution, and reuse, provided that the author and preprint are cited in any reuse.


