
Submitted:
15 January 2024
Posted:
16 January 2024
Read the latest preprint version here
Abstract
Research has shown that the consumption of herbal teas is linked with positive effects on the regulation of postprandial blood glucose level. In this study, aqueous and ethanol extractions are performed on four herbal teas to evaluate their phytochemical profiles and functional activities. Investigations of phytochemical contents, antioxidant activities, α-glucosidase inhibitory activities and chemical compositions are carried out through colorimetric analyses and UPLC-Q-Orbitrap HRMS/MS, respectively. Results showed that ethanol extracted samples yielded higher phytochemicals content, antioxidant activities and α-glucosidase inhibitory activities. Moreover, phytochemicals contents presented positive correlation with antioxidant activities and α-glucosidase inhibitory activities. Meanwhile, antioxidant activities displayed similar positive correlation with α-glucosidase inhibitory activities. Among the studied herbal teas, Vine exhibited the highest glucose regulating abilities under both aqueous and ethanol extractions. Results from this study provided evidence that ethanol extracts from herbal teas possess valuable phytochemicals composition for hyperglycemic populations, and are promising candidates for potential applications as functional foods with health promoting effects and natural additives to boost the nutritional value of herbal food products.
Keywords:
herbal tea
; phytochemicals
; antioxidant
; α-glucosidase
1. Introduction
Diabetes mellitus is a type of metabolic disorders with hyperglycemia which could induce disruptions of insulin secretion [1]. Meanwhile, postprandial hyperglycemia is a symptom of diabetes mellitus, and the regulation of postprandial hyperglycemia indeed plays vital roles for the treatments of diabetic patients. For instance, studies have found that regardless of diabetics or unaffected individuals, α-glucosidase played crucial parts in the adjustment of postprandial hyperglycemia [2]. With increasing research interests regarding α-glucosidase, presences of α-glucosidase were found within the epithelium of the human intestines, and the inhibitions of such α-glucosidase could serve as potential targets of postprandial hyperglycemia regulations for diabetic patients. As a result, inhibition of α-glucosidase enzyme activities has become a promising strategy to regulate blood glucose levels [3], and therefore triggered great significances of natural α-glucosidase inhibitors for the well-being of diabetic patients.
In recent years, health benefits from the consumption of plant-based products have attracted increasing consumer and research attentions. These are partly due to the rich content of healthy active ingredients from plants and plant-based products, such as dietary phytochemicals, considered as active ingredients with numerous health beneficial effects [4]. Meanwhile, several epidemiological and preclinical studies have reported that the consumptions of herbal tea could reduce the risk of chronic diseases, such as cancer, cardiovascular disease [5], diabetes mellitus [6], and more. China is a major country of tea productions with high quality and wide variety of teas existed around the world. Traditionally speaking, tea was made from the leaves and/or leaf buds of Camellia sinensis; In practice, the leaves, flowers, fruits, roots and other components from herbs or plants were processed for infusion worldwide, such as male papaya flower [7], Eucommia ulmoides [8], magnolia flower. Herbal tea with antioxidative and antidiabetic potentials is consumed as health promoting goods in different regions of the world with low side effects, which has demonstrated important industrial values [9]. More importantly, consumptions of herbal teas and the provided benefits have been advised as alternatives to pharmacology for improving health and reducing pain toward certain diseases [10]. Therefore, there have been increasing demands for research studies to analyze the mechanisms of herbal tea and its phytochemicals’ physiological activities, which would be applicable across a mass of research and practical applications for pharmaceutical, plantation and food industry.
In general, phenolics could interact with metabolic enzymes in the human body, and could affect the activities of these metabolic enzymes [11]. For instance, research has revealed that the interactions between phenolics from diet and metabolic enzymes could result in impacts toward human health [12], and the mechanisms of such interactions are worth exploring. Though there have been reports regarding the interactions between flavonoids and α-glucosidase, there have been a lack of studyin regard to the interactions of phytochemical contents from non-camellia herbal teas with α-glucosidase. Therefore, further investigations on the interactions between non-camellia herbal teas with α-glucosidase are crucial to promote their health benefits as well as practical applications. In light of the above reasonings, the present study was aimed to evaluate the total phenolics content, total flavonoids content, total flavonol content of phytochemicals, antioxidant activities, and inhibitions of ɑ-glucosidase acvitity of four herbal tea extracts extracted withhot-water and ethanol methods (Table 1). Moreover, the four herbal tea extracts were further subjected to in depth phytochemicals profile investigation through HPLC-DAD-Q-Orbitrap HRMS/MS analysis.
2. Materials and Methods
2.1. Chemicals
Gallic acid was obtained from Sigma-Aldrich (Saint Louis, MO, USA). Rutin was bought from Shanghai Macklin Biochemical Co., Ltd. (Shanghai, China). Catechin and 2,2′-azinobis(3-ethyl-benzothiazoline-6-sulfonic acid) diammonium salt (ABTS) were acquired from Aladdin Biochemical Technology Co., Ltd., (Shanghai, China).1,1-Diphenyl-2-picrylhydrazyl (DPPH) was obtained from Shanghai Yuanye Biotechnology Co., Ltd., (Shanghai, China). The other reagents were analytically pure.
2.2. Sample Preparation
Four herbal teas were bought from local market (Table 1). Specifically, Partridge tea (Mallotusoblongifolius (Miq.) Müll.Arg.) was yielded from Baoting, Hainan Province, China; Sweet tea (Rubus savissimus S.Lee) was planted in Jinxiu, Guangxi Province, China; Cyclocaryapaliurus (Batal.) was produced in Xiangxi, Hunan Province, China; Vine tea was obtained from Zhangjiajie, Hunan Province, China. All herbal teas were crushed at room temperature and passed through a screen with 60-mesh sieve, the powders were stored at -25 ℃ until further analysis.
Aqueous extraction: herbal teas powder (1 g, 60 mesh) was blended with 50 mL boiling distilled water in a 95 ℃ water bath for 6 min before vaccum filtration, and the residue was repeated twice. All collected perfiltration fluid was transferred to volumetric flask (200 mL) with distilled water to 200 mL tick mark and stored at -20 ℃ until analysis. Organic extraction: herbal teas powder (1 g, 60 mesh) was blended with 50 mL ethyl alcohol in 60 ℃ for 30 min before vaccum filtration, and the residue was repeated twice. All collected perfiltration fluid was transferred to volumetric flask (200 mL) with distilled water to 200 mL tick mark and stored at -20 ℃ until analysis.
2.3. Determination of total phenolic content (TPC)
The TPC was determined using the Folin-Ciocalteu reagent method following previous report [13]. Briefly, tested extracts or gallic acid solution were blended with Folin-Ciocalteu reagent and Na2CO3 solution, respectively. Finally, the mixture was measured at 760 nm. Gallic acid was employed as a standard, and the total phenolic content was shown as milligrams of gallic acid equivalent (GAE) per gram of dry weight (DW).
2.4. Determination of total flavonoid content
The total flavonoid content was analyzed through colorimetric assay according to the previous report [14]. Briefly, samples and standard solution were mixed with NaNO2, AlCl3 and NaOH, respectively. The resulting solution was read at 415 nm. Catechin was employed as a reference, and the total flavonoid content was shown as milligrams of catechin equivalent (CE) per gram of DW.
2.5. Determination of total flavonols content
The total flavonols content was measured using a colorimetric method [15]. Briefly, extracts and standard solution were blended with AlCl3 and sodium acetate solution, respectively. The absorbance of the mixture was immediately measured at 510 nm. Rutin was employed as a standard. The flavonols content was expressed as mg rutin equivalent (RE)/g DW.
2.6. Determination of 2,2-Diphenyl-1-picrylhydrazyl radical (DPPH ) scavenging
The DPPH scavenging assay was carried out according to previous report [16]. Briefly, extracts and standard solution were mixed with DPPH working solution kept in dark. The absorbance was analyzed at 515 nm. Results were compared with a standard curve prepared with quercet in and expressed as mg quercetin equivalents (QE)/g DW.
2.7. Determination of 2,2′-azino-bis(3-ethylbezothiazoline-6-sulfonic acid) radical cation (ABTS•+) scavenging
The ABTS assay was performed referring to previous report [17]. The radical cation working solution was prepared by ABTS [2,2′-azinobis-(3-ethylbenzothiazoline-6-sulfonic acid) diammonium salt] and K2S2O8. Extracts and standard solution were blended with ABTS working solution in the dark. The absorbance of mixture was analyzed at 734 nm. Inhibition percentage values were calculated according to the equation:
where = absorbance of the samples, = absorbance of the control. Results were compared with a curve of Trolox and expressed as mmol TE/g DW.
2.8. Determination of α-glucosidase inhibition in vitro
The α-glucosidase inhibition assay was performed with previously described method [2]. Briefly, the α-glucosidase was formed using phosphate buffer saline (PBS, 0.1M; pH 6.8), meanwhile 4-nitrophenyl-α-D-glucopyranoside (p-NPG) was picked up as a substrate. Pre-diluted tea infusion was mixed with α-glucosidase solution at 37 ℃ for 10 min. Then, substrate was added into the mixture to start the reaction, and the mixture was maintained for 20 min at 37 ℃. Adding 1 mL absolute ethanol as enzyme inhibitor, the p-nitrophenyl was released and the absorbance was measured at 405 nm. Absolute ethanol and acarbose were used as blank group and positive control, respectively. The rate of inhibition (%) on α-glucosidase by inhibitor was calculated as follows:
where and represent the absorbance of the control and sample, respectively. Substrate was present in all these groups. Inhibitory activity is expressed as efficient concentration EC50: the sample concentration (μg/mL) required to obtain 50% activity.
2.9. Determination of enzyme kinetics assays for α-glucosidase
The reversible assays of herbal tea extracts against α-glucosidase were established through a series of concentrations of p-NPG with different concentrations of herbal tea extract at α-glucosidase assay, respectively. To determine the type of inhibition kinetic, the velocity of the reaction was carried out at different concentrations of substrate and herbal tea extract. In the mode of α-glucosidase inhibition assay, a gradient of 0.2, 0.4, 0.6, 0.8and 1 mM p-NPG was applied as the substrate. Lineweaver-Burk plots were employed to investigate the inhibition kinetics, including the plot of 1/ν versus 1/[S].
2.10. UPLC-Q-Orbitrap HRMS/MS analysis
UPLC analysis was performed on an instrument coupled to a Dionex 3000 Ultimate UPLC with an auto-sampler and a Q-Exactive Orbitrap HRMS/MS (Thermo Fisher, MA, USA). The Acquity UPLC BEH C18 (2.1 mm×100 mm, 1.8 μm) was operated at 35 ℃. The mobile phase was composed of: (A) 0.1% formic acid in water, and (B) acetonitrile with a flow rate of 0.3 mL/min.
MS analysis was performed with a heated electrospray ionization source in negative ionization mode. The mass parameters were set as follows: auxiliary gas flow, 10 arb; sheath gas flow, 45 arb; spray voltage, 3500 V; mass scan range, m/z 100-1000; auxiliary gas heater temperature, 100 ℃; capillary temperature, 350 ℃.
2.10.1. Cyclocarya paliurus (Batal.) Iljinskaja
The elution parameters were: 0-5 min, 5%-18% B; 5-8 min, 18%-20% B; 8-13 min, 20%-25% B; 13-18 min, 25%-80% B; 18-20 min, 80%-80% B, followed by 5 min of re-equilibration.
2.10.2. Mallotus oblongifolius (Miq.) Muell-Arg
The elution parameters were: 0-7 min, 5%-10% B; 7-21 min, 10%-20% B; 21-24 min, 20%-50% B, followed by 5 min of re-equilibration.
2.10.3. Lithocarpus litseifolius(Hance) Chun
The elution parameters were: 0-6 min, 5%-10% B; 6-20 min, 10%-15% B; 20-30 min, 15%-20% B; 30-34 min, 20%-50% B; followed by 5 min of re-equilibration.
2.10.4. Ampelopsis grossedentata (Hand-Mazz) W.T.Wang.
The elution parameters were: 0-3 min, 5%-12% B; 3-11 min, 12%-15% B; 11-16 min, 15%-30% B; 16-20 min, 30%-80% B; followed by 5 min of re-equilibration.
2.11. Statistical analysis
Statistical analyses were performed using SPSS software (SPSS Inc., Chicago, IL, USA). The significance was fixed at P < 0.05. All data were presented as the mean ± SD from at least three replications.
3. Results and Discussion
3.1. Phytochemicals in herbal extract
3.1.1. Total phenolic content
Exploration of the phytochemical compositions of herbal teas would provide useful information for their application potentials, while phenolic is one of the common phytochemicals within herbal teas. The detected total phenolic content in aqueous extracts and ethanol extracts are displayed in Figure 1.The results showed that the four herbal tea extracts, extracted by either the aqueous or ethanol methods, exhibited significant differences in the content of active ingredients (P< 0.05). The TPC values of four herbal tea extracts varied from 3.86 ± 0.79 to 66.12 ± 2.98 mg GAE/g DW (Figure 1). Among which, Vine possesses the highest phenolic content. In detail, by aqueous extraction, Vine has the highest TPC value (35.77 ± 1.31 mg GAE/g DW, P < 0.05), followed by Mallotus > Cyclocarya > Rubus, respectively. Similarly, with ethanol extraction, Vine has the highest TPC value (66.12 ± 2.98 mg GAE/g DW), followed by Mallotus > Cyclocarya > Rubus, respectively. The differences of total phenolic content were significant among the four herbal tea varieties (P < 0.05).
3.1.2. Total flavonoid content
The analyzed values of total flavonoid content from the herbal tea extracts are presented in Figure 2, and by comparison higher total flavonoid contents were obtained by ethanol extraction method. Across different varieties, the flavonoid content value varied from 0.26 ± 0.02 mg CE/ g DW to 1.89 ± 0.06 mg CE/ g DW. The differences in flavonoid content of four herbal tea extracts yielded a pattern different from that of the phenolic content. Vine from ethanol extraction has the highest total flavonoid content (1.89 ± 0.06 mg CE/ g DW, P < 0.05) in all samples, followed by Mallotus > Rubus > Cyclocarya. Meanwhile, it is interesting that Rubus possesses the highest total flavonoid content (0.79 ± 0.01 mg CE/ g DW, P < 0.05) from aqueous extraction, followed by Mallotus > Vine > Cyclocarya.
3.1.3. Total flavonol content
The determined total flavonol content from four herbal tea extracts acquired from ethanol and aqueous methods are shown in Figure 3. The total flavonol content values of different herbal tea extracts varied from 2.09 ± 0.33 RE/ g DW to 24.98 ± 0.49 mg RE/ g DW. With ethanol extraction, Vine displayed the highest total flavonol content (24.98 ± 0.50 mg RE/ g DW, P < 0.05), while the lowest total flavonol content was obtained from Cyclocarya through aqueous extraction (2.09 ± 0.33 RE/ g DW, P < 0.05). More specifically, with ethanol extraction, vine had the highest value of total flavonol content (P < 0.05), followed by Cyclocarya > Mallotus > Rubus. While with aqueous extraction, Vine also had the highest value of total flavonol content, followed by Mallotus > Rubus > Cyclocarya.
3.2. Percentage contribution of flavonod/flavonol to phenolics
On a molar basis, the percentage contribution of flavonoids/flavonol to phenolics was estimated and demonstrated in Figure 4. The contributions of total flavonoids to total phenolics ranged from 1.12 to 12.05%, indicating flavonoids composed of only a samll part of phenolics for the four herbal teas. At the same time, the contribution of flavonoids to phenolics was the highest in aqueous extraction of Rubus (12.05 ± 0.14 %), followed by ethanol extraction of Rubus (9.96 ± 0.10 %), then ethanol extract of Cyclocarya (3.13 ± 0.10 %), and was lowest in aqueous extract of Vine (1.12 ± 0.04 %). The factors affecting the phenolic and flavonoid levels within herbal teas could be season, location, climate, variety, species, the age of the leaf plucked, manufacturing conditions and processes, as well as particle sizes [18]. Gao et al. [19] also pointed out that flavonoids tend to be unstable when exposed to high temperature and light for long period of times, which could result in inactivation and/or degradation. However, tea processings almost always involve light and heat, which may cause different degrees of flavonoids loss in tea, and leads to varied testing results. Besides flavonoids, the contributions of total flavonols to total phenolics ranged from 7.25 to 33.20%, indicating that flavonol made up of larger part of phenolics in the four herbal teas. The contribution of flavonol to phenolics was the highest in aqueous extracted Rubus (33.20 ± 0.30 %) and the lowest in aqueous extracted Mallotus (7.25 ± 0.34 %). Nevertheless, there were no significant differences among the three samples: Cyclocarya ≈ Vine ≈ Mallotus, indicating flavonols were one of the major phenolics within Euphorbiaceae. With ethanol extract, the contribution of flavonol to phenolics was the highest in Rubus (27.67 ± 0.30 %), followed by Cyclocarya > Vine ≈ Mallotus.
3.3. Antioxidant activity
Herbal tea phytochemicals are known to be potent antioxidants, in addition to numerous other beneficial effects on human health. In vitro antioxidant activities were determined using DPPH radical scavenging assay and ABTS•+ radical cation scavenging assay. The DPPH radical scavenging ability of different extracts is displayed as EC50 value in Figure 5A. As a rule, the lower value of EC50, the higher radical scavenging ability. Ethanol extract of vine had the lowest EC50 value (0.045±0.002 mg/mL, P< 0.05), and ethanol extract of Rubus had the highest EC50 value (1.76 ±0.04 mg/mL, P< 0.05) among all samples, indicating highest and lowest DPPH radical scavenging ability in Vine and Rubus with ethanol extraction, respectively. The general trend of DPPH radical scavenging ability with ethanol extraction was followed by Rubus < Cyclocarya < Mallotus < Vine. Meanwhile, through aqueous extraction the DPPH radical scavenging ability was followed by Cyclocarya< Rubus < Vine < Mallotus. As shown in Figure 5B, the ABTS•+ radical cation scavenging activity was similar to that of DPPH radical scavenging ability: in ethanol extracts, the ABTS•+ radical cation scavenging activity is ranked as Rubus < Cyclocarya < Mallotus < Vine, and in aqueous extracts, the ABTS•+ radical cation scavenging activity is ranked as Cyclocarya < Rubus < Mallotus < Vine.
3.3.α-. Gucosidase inhibitory activity
As shown in Figure 6, the EC50 of ɑ-glucosidase inhibitions of four herbal tea extracts varied significantly, from 0.02 ± 0.001 to 2.31 ± 0.07 mg/mL. Besides aqueous extract of Cyclocarya, other herbal tea extracts showed strong inhibitory activities. The inhibitory effect of water extracts on α-glucosidase activity followed as Mallotus > Rubus ≈ Vine > Cyclocarya. While the inhibitory effect of alcohol extracts on α-glucosidase activity followed as Mallotus ≈ Vine ≈ Cyclocaryapaliurus > Rubus.
3.4. Inhibitory types
To further analyze the inhibition types of the four herbal tea extracts on α-glucosidase, the sample concentration and substrate concentration were first fixed, and the enzymatic reaction was carried out in the same reaction system. According to the Lineweaver-Burk and Dixon double reciprocal curve mapping method, the double reciprocal curve was drawn to determine the type of enzymatic reaction competition. The double reciprocal curves were displayed in the Figure 7. The point of intersection of the straight line with the y-axis represents, and the point of intersection of the straight line with the x-axis represents . The slope of this line is K. As shown in Figure 7, the enzymatic reaction rate V changes with the substrate concentration [S]. For instance, during the enzymatic reaction, with the increase of sample concentration, the apparent Michaelis constant remained unchanged and the initial velocity of the maximum catalytic reaction decreased, indicating that the inhibition type of the four herbal tea extracts on α-glucosidase was non-competitive reversible inhibition.
3.5. Correlation between phytochemical and activities
Since the stronger the activity of four herbal tea extracts, the smaller the EC50 value, 1/EC50 is used to represent the activities of the samples when analyzing the correlation between the active ingredient and the antioxidant and hypoglycemic activities. The results of Pearson correlation coefficient between the active components of herbal teas and the antioxidant and hypoglycemic activities are shown in Table 2. The total phenolics content was significantly and positively correlated with DPPH radical scavenging and ABTS•+ radical scavenging abilities (P < 0.01). And the correlation coefficients were 0.903** and 0.756**, respectively, indicating that the tea phenolics were important factors influencing the antioxidant activity of the herbal teas. More importantly, the contents of total phenolics exhibited positive correlation with the inhibition of α-glucosidase, indicating that the in vitro hypoglycemic activity was related to the total polyphenol contents. At the same time, the DPPH free radical scavenging effect was significantly and positively correlated with the ABTS value (0.750, P < 0.01), indicating that these two methods of evaluating antioxidant activity can be mutually corroborated. The DPPH free radical scavenging ability and ABTS scavenging ability also displayed positive correlation with that of α-glucosidase inhibition. The stable usage of herbal plant antioxidants to improve the endogenous antioxidant self-defense could be one promising way to relieve oxidative stress in diabetic patients through reductions of free radicals, and by increasing intake of herbal plant antioxidants could lead to increasing activity of endogenous antioxidant enzymes [20,21].
3.6. UPLC-Q-Orbitrap HRMS/MS analysis
In the present study, the chemical composition of phytochemicals extracted by water or ethanol from four herbal teas was analyzed by the rapid UPLC-Q-Orbitrap HRMS/MS analytical coupling technique. UPLC-Q-Orbitrap HRMS/MS could provide comprehensive insight into the chemical structural and composition of complex natural sources with high specificity and sensitivity. The accurate mass and composition of the precursor and product ions of compounds in four herbal teas were analyzed in negative ionization mode (Figure 8). Representative compounds in four herbal teas were tentatively identified based on comparing retention behavior, HRMS/MS data, and mass fragment characteristics with the compounds in previous references and/or available reference compounds. The compound characterization results are shown in SI Tables S1–S8.
4. Conclusions
Among the herbal tea samples studied, Vine possessed the highest phytochemical contents, antioxidant activity and α-glucosidase inhibitory activity across either aqueous or ethanol extractions. Meanwhile, compared to aqueous extraction, ethanol extraction enhanced the release of phenolics compounds, and displayed improved antioxidant activity and α-glucosidase inhibitory activity of herbal tea samples. In this regard, ethanol extract should be considered as an efficient and economical processing method that is useful for improving the phytochemical contents and bioactivities of herbal teas in the natural functional food and natural medicine industries.
Supplementary Materials
The following supporting information can be downloaded at the website of this paper posted on Preprints.org.
Author Contributions
Conceptualization, Y.S.; methodology, G.D. and Y.S.; software, J.; validation, J., J.L and G.D.; investigation, J., J.L and G.D.; resources, Y.S.; data curation, J., J.L and G.D.; writing—original draft preparation, J., and G.D.; writing—review and editing, J.J. and Y.S.; visualization, J.J. and Y.S.; supervision, Y.S.; project administration, Y.S.; funding acquisition, Y.S. All authors have read and agreed to the published version of the manuscript.
Funding
This research was funded by the Fundamental Research Funds for the Central Universities, 21622412.
Conflicts of Interest
The authors declare no conflicts of interest.
References
- Serra-Navarro, B.; Fernandez-Ruiz, R.; Garcia-Alaman, A.; Pradas-Juni, M.; Fernandez-Rebollo, E.; Esteban, Y.; Mir-Coll, J.; Mathieu, J.; Dalle, S.; Hahn, M.; Ahlgren, U.; Weinstein, L.S.; Vidal, J.; Gomis, R.; Gasa, R. Gsα-dependent signaling is required for postnatal establishment of a functional β-cell mass. Molecular Metabolism 2021, 53. [Google Scholar] [CrossRef]
- Chen, Y.; Geng, S.; Liu, B. Three common caffeoylquinic acids as potential hypoglycemic nutraceuticals: Evaluation of alpha-glucosidase inhibitory activity and glucose consumption in HepG2 cells. Journal of Food Biochemistry 2020, 44, e13361. [Google Scholar] [CrossRef]
- Joshi, S.R.; Standl, E.; Tong, N.; Shah, P.; Kalra, S.; Rathod, R. Therapeutic potential of α-glucosidase inhibitors in type 2 diabetes mellitus: an evidence-based review. Expert opinion on pharmacotherapy 2015, 16, 1959–1981. [Google Scholar] [CrossRef]
- Samtiya, M.; Aluko, R.E.; Dhewa, T.; Moreno-Rojas, J.M. Potential health benefits of plant food-derived bioactive components: An overview. Foods 2021, 10, 839. [Google Scholar] [CrossRef]
- Khan, N.; Mukhtar, H. Tea polyphenols for health promotion. Life Sciences 2007, 81, 519–533. [Google Scholar] [CrossRef]
- Chen, Y.; Wang, E.; Wei, Z.; Zheng, Y.; Yan, R.; Ma, X. Phytochemical analysis, cellular antioxidant and alpha-glucosidase inhibitory activities of various herb plant organs. Ind. Crop. Prod. 2019, 141. [Google Scholar]
- Bergonio, K.B.; Perez, M.A. The potential of male papaya (<i>Carica papaya</i>, L.) flower as a functional ingredient for herbal tea production. Indian Journal of Traditional Knowledge 2016, 15, 41–49. [Google Scholar]
- Dong, J.; Ma, X.; Ma, Z.; Fu, Z.; Wei, Q.; Qiu, G. Effects of green-keeping treatment on the functional constituents in flower tea of Eucommia ulmoides. Ind. Crop. Prod. 2012, 36, 389–394. [Google Scholar] [CrossRef]
- Dalar, A.; Konczak, I. Phenolic contents, antioxidant capacities and inhibitory activities against key metabolic syndrome relevant enzymes of herbal teas from Eastern Anatolia. Industrial crops and products 2013, 44, 383–390. [Google Scholar] [CrossRef]
- Hayat, K.; Iqbal, H.; Malik, U.; Bilal, U.; Mushtaq, S. Tea and its consumption: benefits and risks. Critical reviews in food science and nutrition 2015, 55, 939–954. [Google Scholar] [CrossRef] [PubMed]
- Velderrain-Rodríguez, G.; Palafox-Carlos, H.; Wall-Medrano, A.; Ayala-Zavala, J.; Chen, C.O.; Robles-Sánchez, M.; Astiazaran-García, H.; Alvarez-Parrilla, E.; González-Aguilar, G. Phenolic compounds: their journey after intake. Food & function 2014, 5, 189–197. [Google Scholar]
- Valdés, L.; Cuervo, A.; Salazar, N.; Ruas-Madiedo, P.; Gueimonde, M.; González, S. The relationship between phenolic compounds from diet and microbiota: impact on human health. Food & function 2015, 6, 2424–2439. [Google Scholar]
- Chen, Y.; Chen, G.; Fu, X.; Liu, R.H. Phytochemical Profiles and Antioxidant Activity of Different Varieties of Adinandra Tea (Adinandra Jack). Journal of agricultural and food chemistry 2015, 63, 169–176. [Google Scholar] [CrossRef] [PubMed]
- Chen, Y.; Ma, X.; Fu, X.; Yan, R. Phytochemical content, cellular antioxidant activity and antiproliferative activity of Adinandra nitida tea (Shiyacha) infusion subjected to in vitro gastrointestinal digestion. Rsc Advances 2017, 7, 50430–50440. [Google Scholar] [CrossRef]
- Chen, Y.; Wang, E.; Wei, Z.; Zheng, Y.; Yan, R.; Ma, X. Phytochemical analysis, cellular antioxidant and alpha-glucosidase inhibitory activities of various herb plant organs. Industrial Crops and Products 2019, 141, 111771. [Google Scholar] [CrossRef]
- Chen, Y.; Ahmed, A.-G.A.; Elshikh, M.S.; Shah, M.H.; Al-Dosary, M.A.; Abbasi, A.M. Phytochemical profiling, antioxidant and HepG2 cancer cells' antiproliferation potential in the kernels of apricot cultivars. Saudi J Biol Sci 2020, 27, 163–172. [Google Scholar] [CrossRef] [PubMed]
- Chen, Y.; Shan, S.; Cao, D.; Tang, D. Steam flash explosion pretreatment enhances soybean seed coat phenolic profiles and antioxidant activity. Food Chemistry 2020, 319, 126552. [Google Scholar] [CrossRef] [PubMed]
- Lin, Y.-S.; Tsai, Y.-J.; Tsay, J.-S.; Lin, J.-K. Factors affecting the levels of tea polyphenols and caffeine in tea leaves. Journal of agricultural and food chemistry 2003, 51, 1864–1873. [Google Scholar] [CrossRef] [PubMed]
- Gao, X.; Liu, E.; Zhang, J.; Yang, M.; Chen, S.; Liu, Z.; Ma, H.; Hu, F. Effects of sonication during moromi fermentation on antioxidant activities of compounds in raw soy sauce. LWT 2019, 116, 108605. [Google Scholar] [CrossRef]
- Oboh, G.; Ademosun, A.O.; Akinleye, M.; Omojokun, O.S.; Boligon, A.A.; Athayde, M.L. Starch composition, glycemic indices, phenolic constituents, and antioxidative and antidiabetic properties of some common tropical fruits. Journal of Ethnic Foods 2015, 2, 64–73. [Google Scholar] [CrossRef]
- Nimse, S.B.; Pal, D. Free radicals, natural antioxidants, and their reaction mechanisms. RSC advances 2015, 5, 27986–28006. [Google Scholar] [CrossRef]
Figure 1.
Total phenolic contents of four herbal tea varieties (mean ± SD, n=3). Bars with different letters of differ significantly at P < 0.05.
Figure 1.
Total phenolic contents of four herbal tea varieties (mean ± SD, n=3). Bars with different letters of differ significantly at P < 0.05.
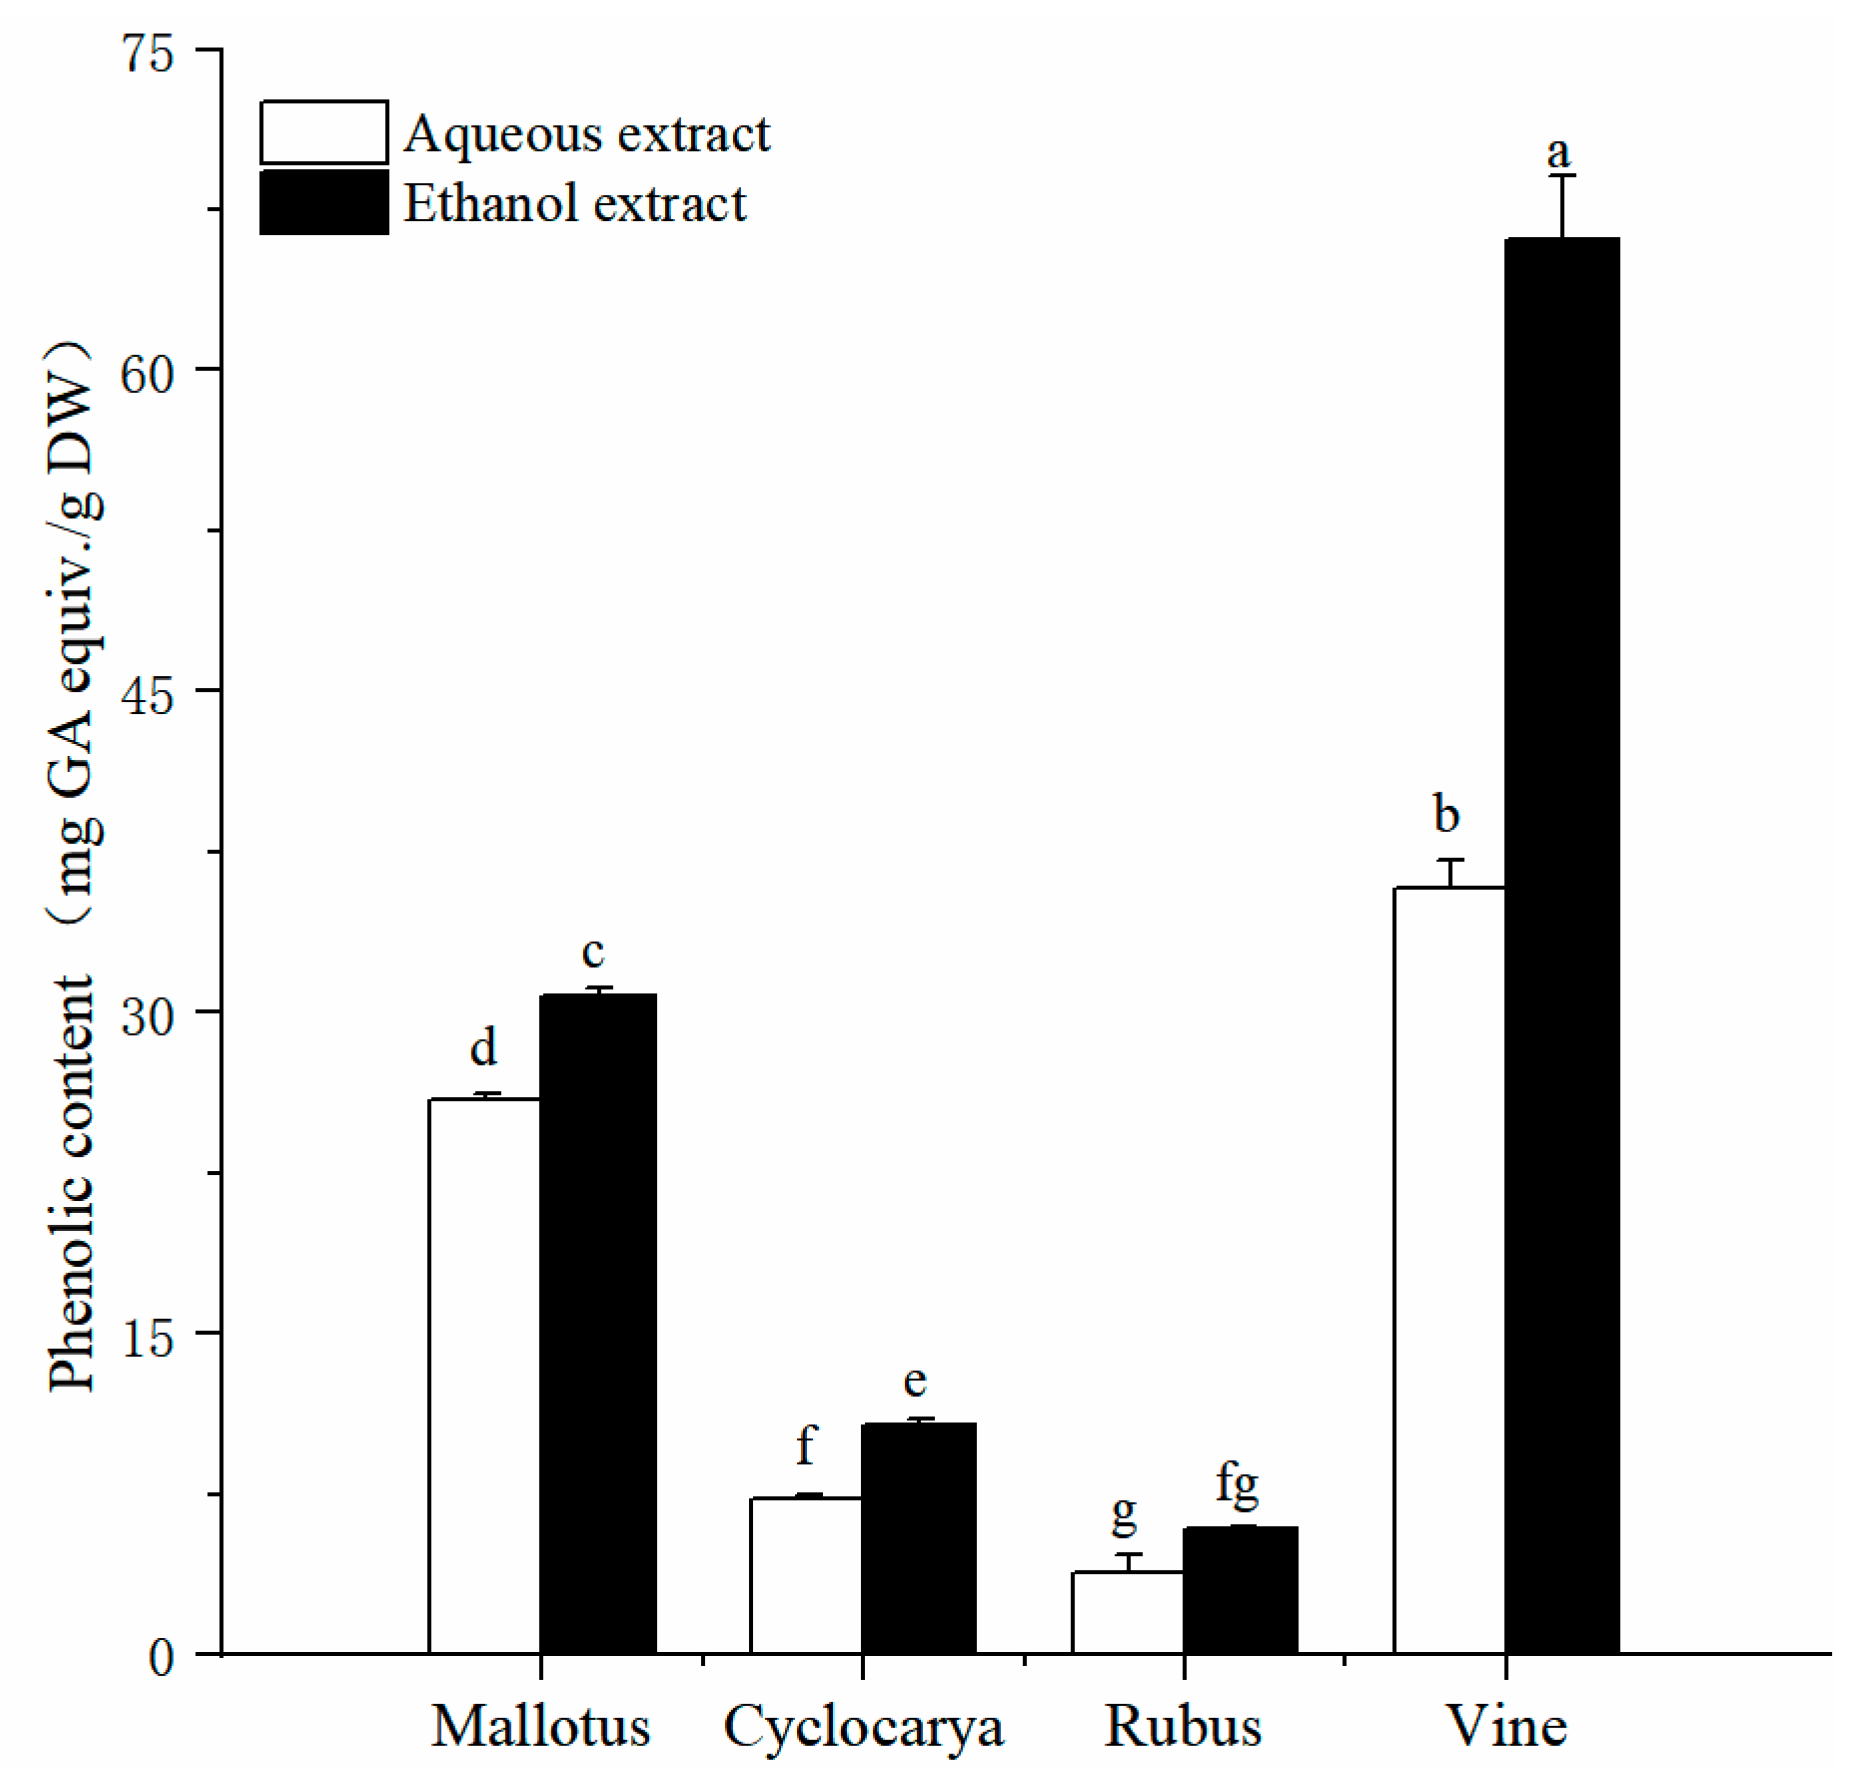
Figure 2.
Total flavonoids contents of four herbal tea varieties (mean ± SD, n=3). Bars with different letters of differ significantly at P < 0.05.
Figure 2.
Total flavonoids contents of four herbal tea varieties (mean ± SD, n=3). Bars with different letters of differ significantly at P < 0.05.
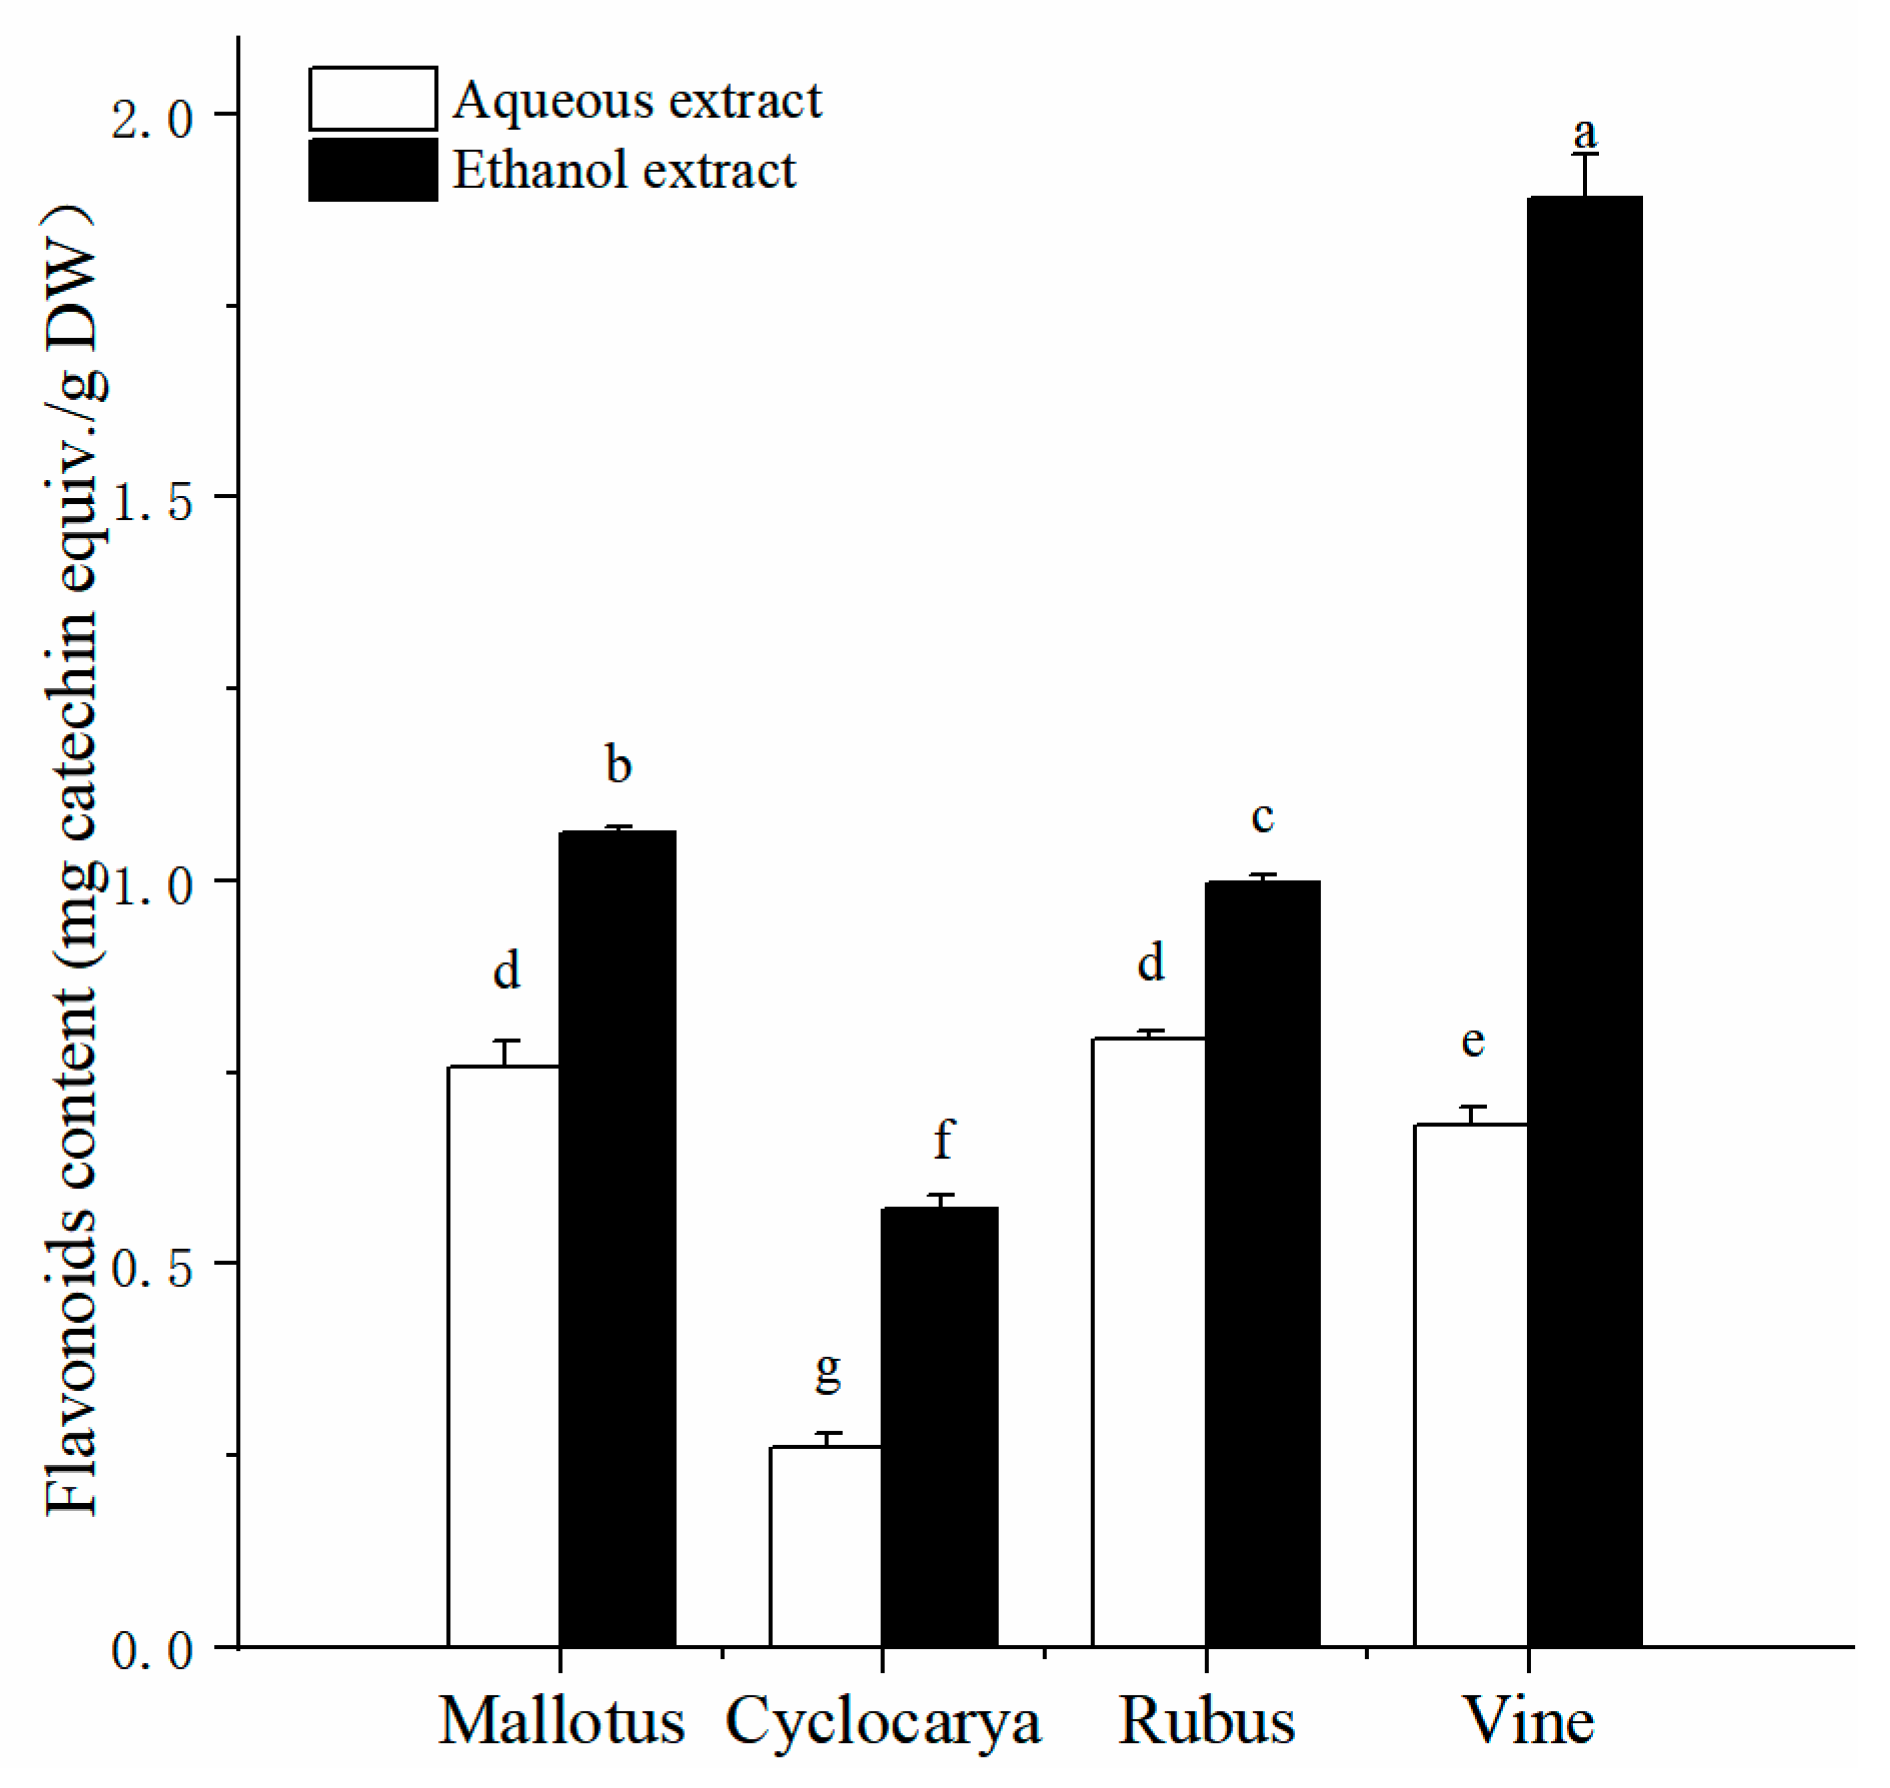
Figure 3.
Total flavonol contents of four herbal tea varieties (mean ± SD, n=3). Bars with different letters of differ significantly at P < 0.05.
Figure 3.
Total flavonol contents of four herbal tea varieties (mean ± SD, n=3). Bars with different letters of differ significantly at P < 0.05.

Figure 4.
Percent contribution of flavonoids to phenolics (A), percent contribution of flavonol to phenolics (B) (mean ± SD, n=3). Bars with different letters of differ significantly at P < 0.05.
Figure 4.
Percent contribution of flavonoids to phenolics (A), percent contribution of flavonol to phenolics (B) (mean ± SD, n=3). Bars with different letters of differ significantly at P < 0.05.
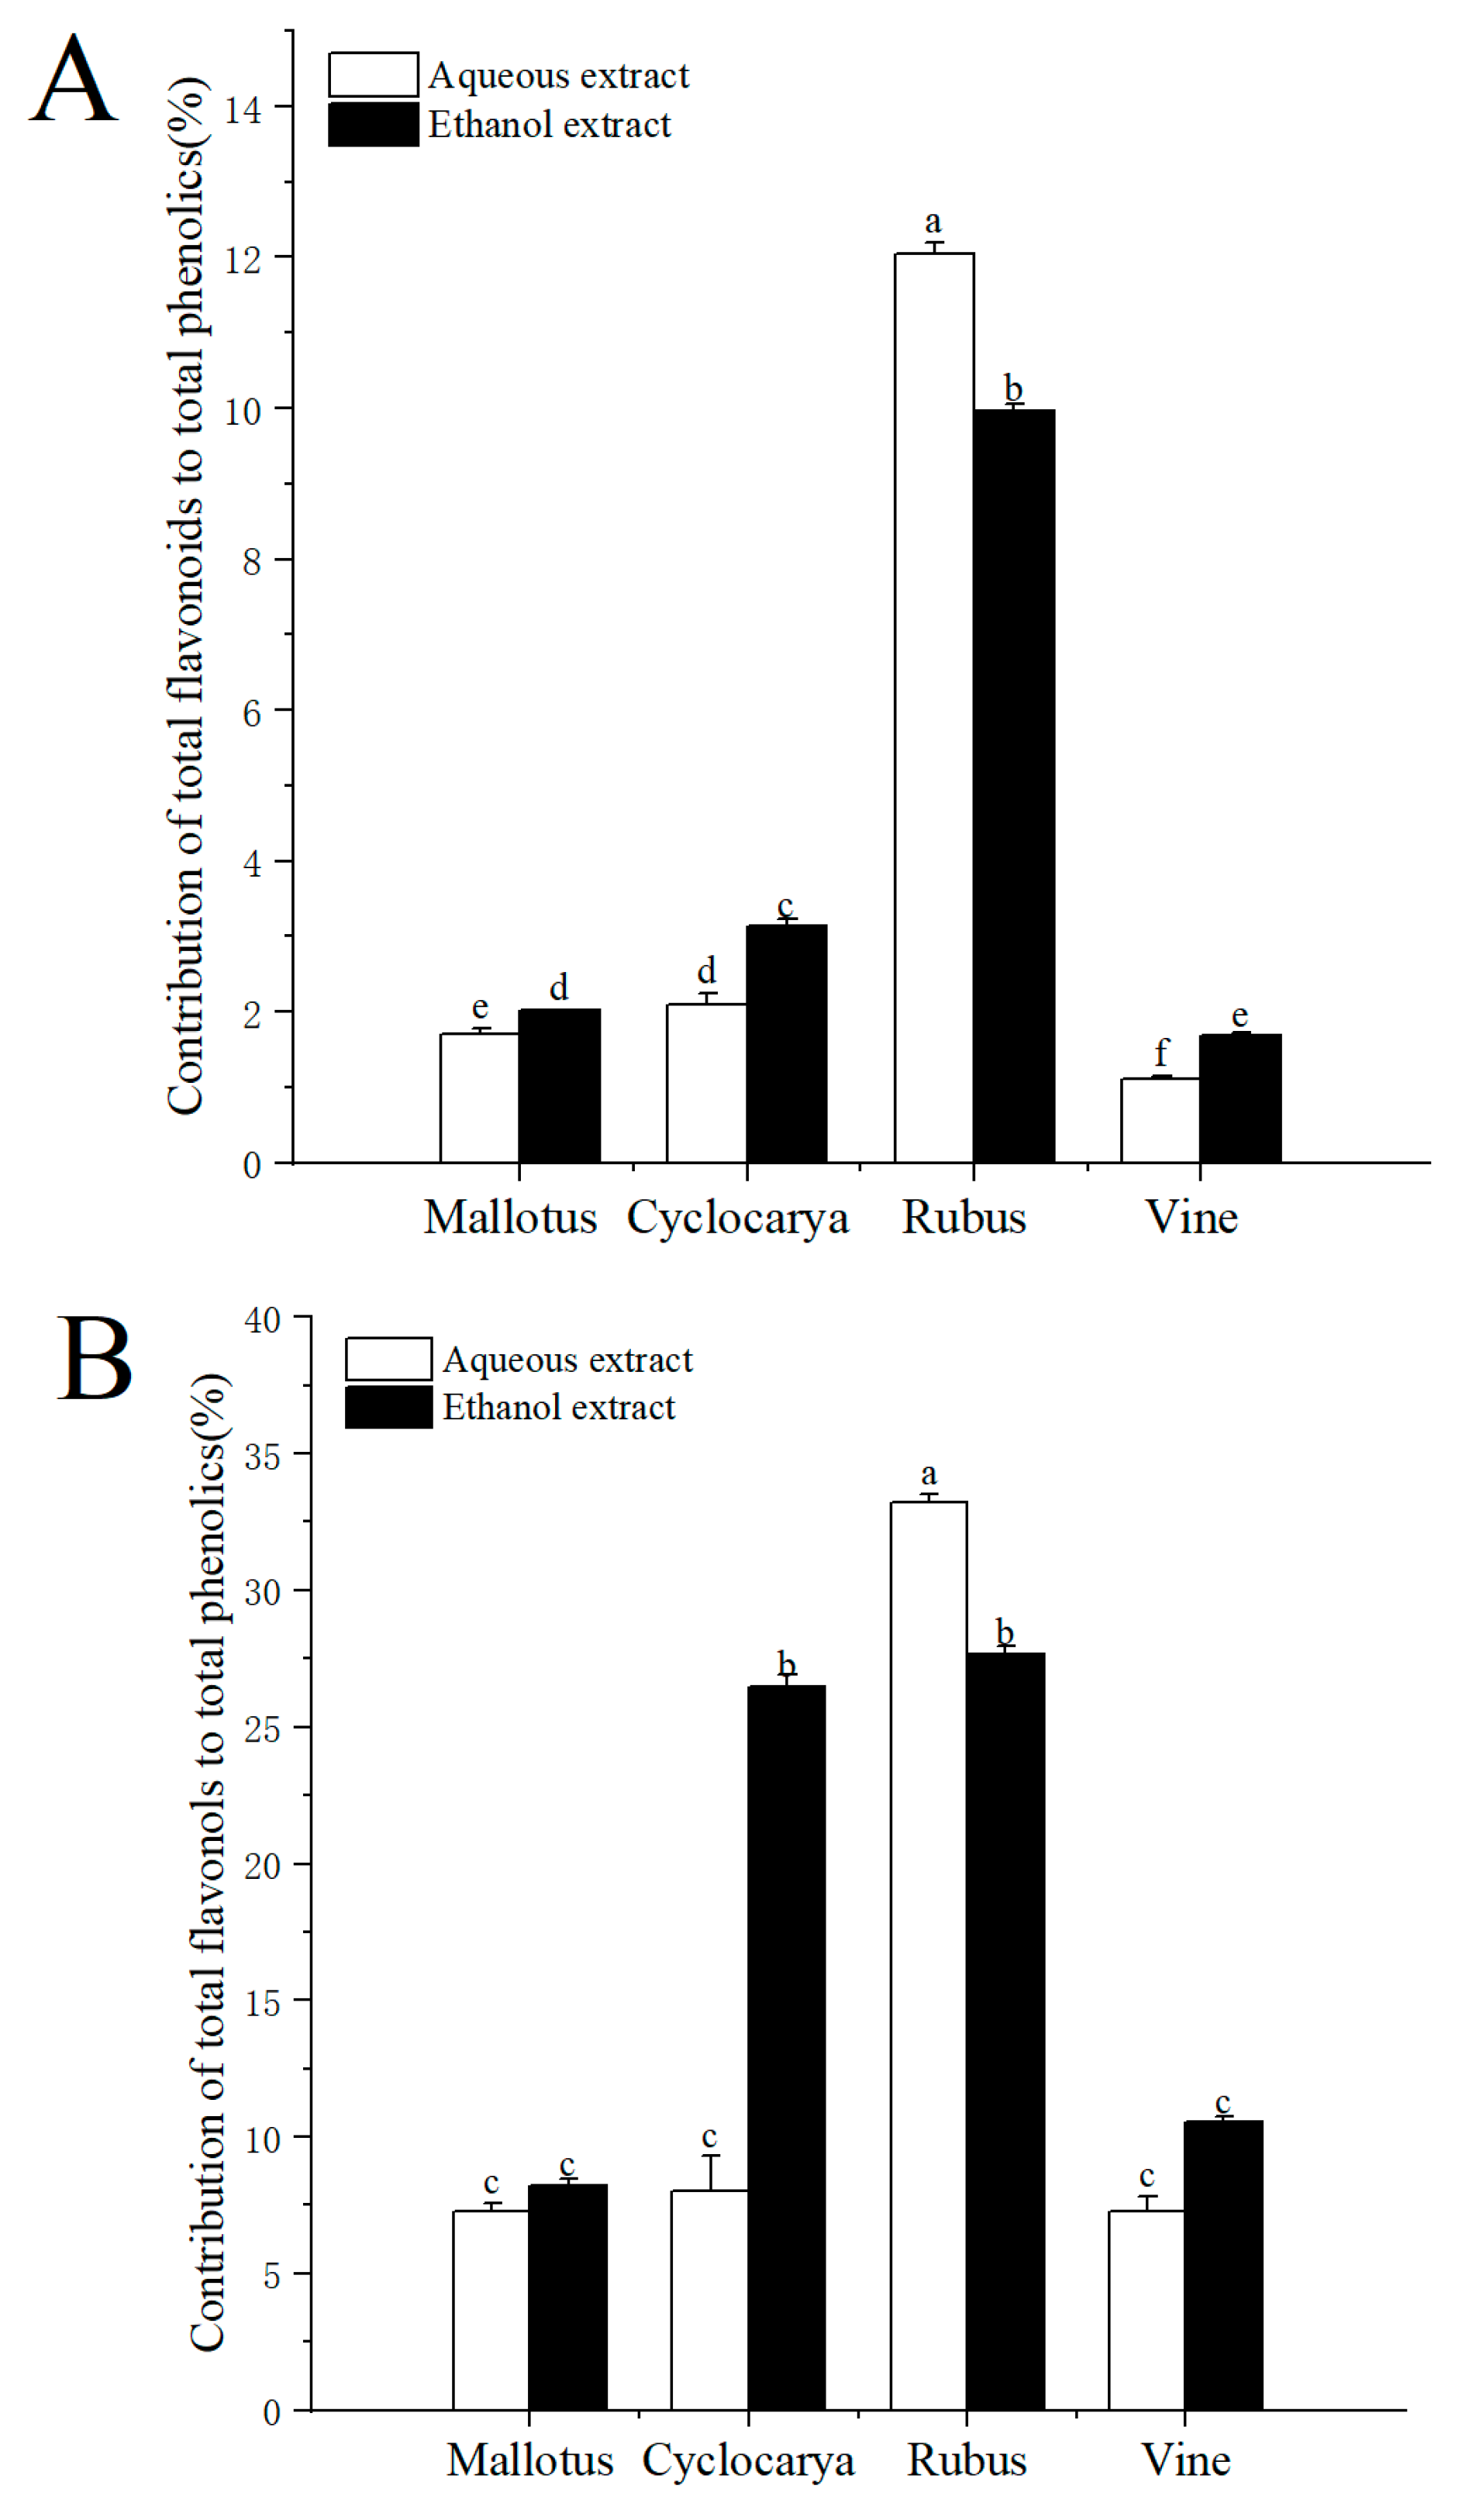
Figure 5.
DPPH (A) and ABTS (B) EC50 value of four herbal tea varieties (mean ± SD, n=3). Bars with different letters of differ significantly at P < 0.05.
Figure 5.
DPPH (A) and ABTS (B) EC50 value of four herbal tea varieties (mean ± SD, n=3). Bars with different letters of differ significantly at P < 0.05.
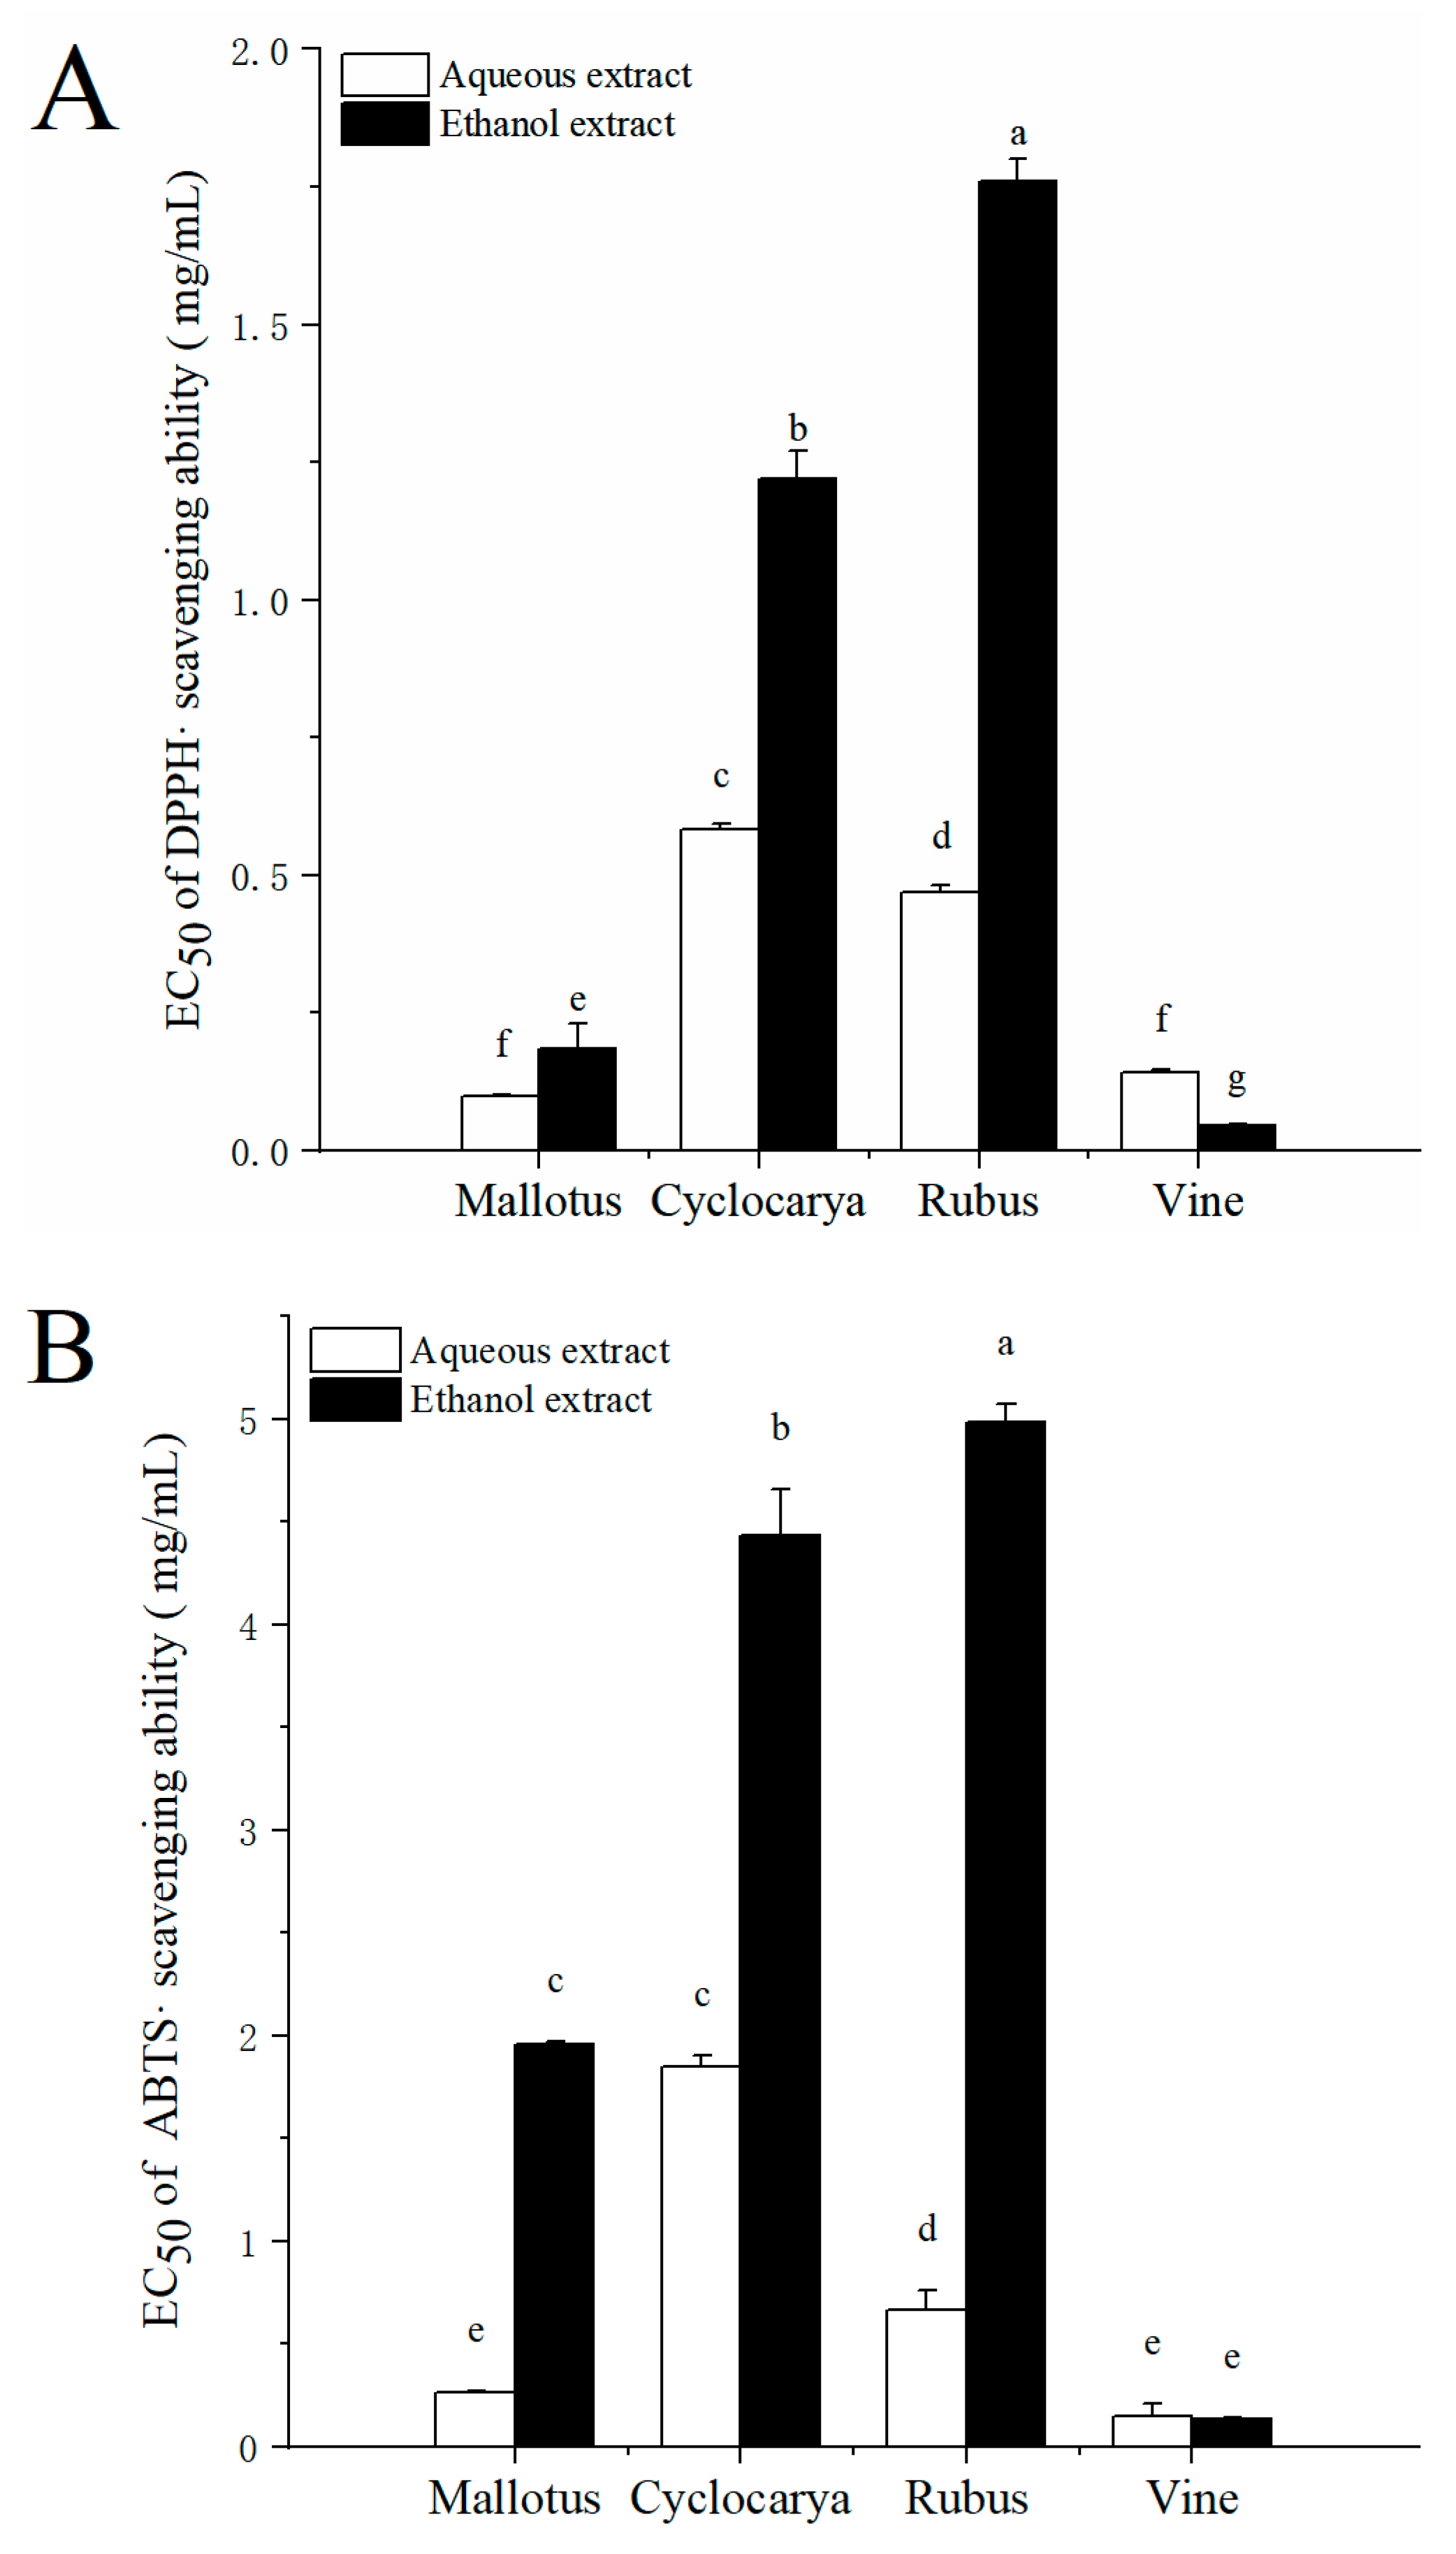
Figure 6.
ɑ-Glucosidase inhibitory activity EC50 value of four herbal tea varieties (mean ± SD, n=3). Bars with different letters of differ significantly at P < 0.05.
Figure 6.
ɑ-Glucosidase inhibitory activity EC50 value of four herbal tea varieties (mean ± SD, n=3). Bars with different letters of differ significantly at P < 0.05.
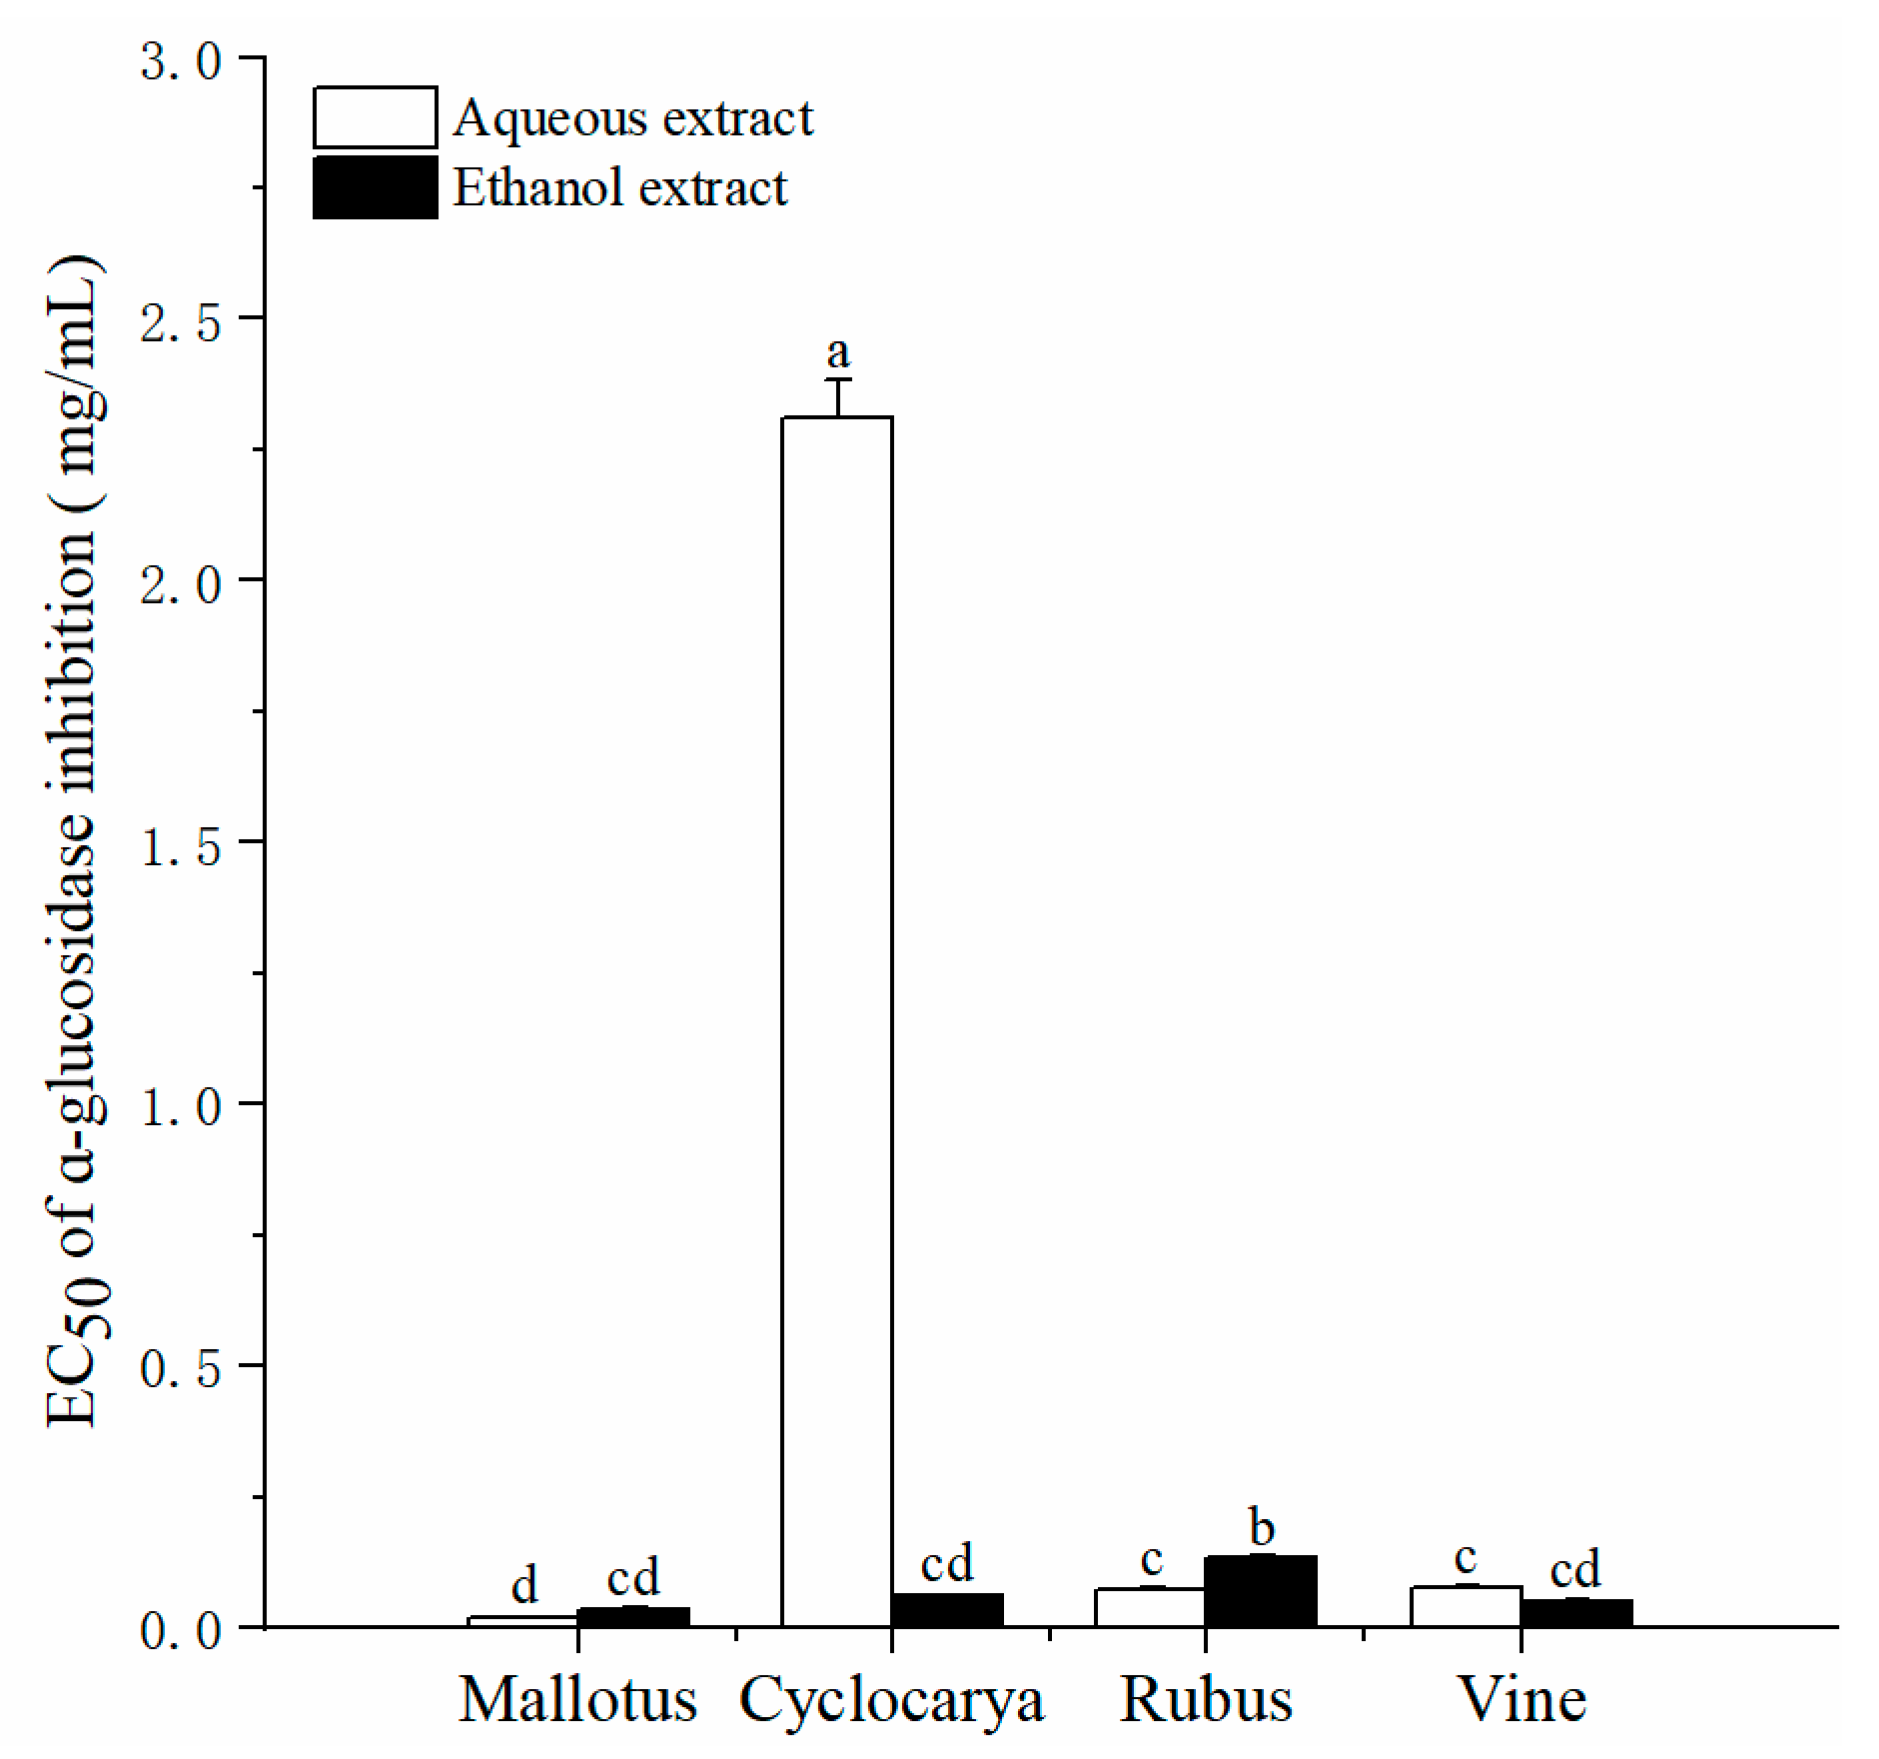
Figure 7.
Lineweaver-Burk plot of four herbal tea varieties extract for determining the inhibitory mode.
Figure 7.
Lineweaver-Burk plot of four herbal tea varieties extract for determining the inhibitory mode.

Figure 8.
HPLC-DAD chromatogram of four herbal tea varieties extracts (A: Cyclnocarya; B: Mallotus; C: Rubus; D: Vine).
Figure 8.
HPLC-DAD chromatogram of four herbal tea varieties extracts (A: Cyclnocarya; B: Mallotus; C: Rubus; D: Vine).
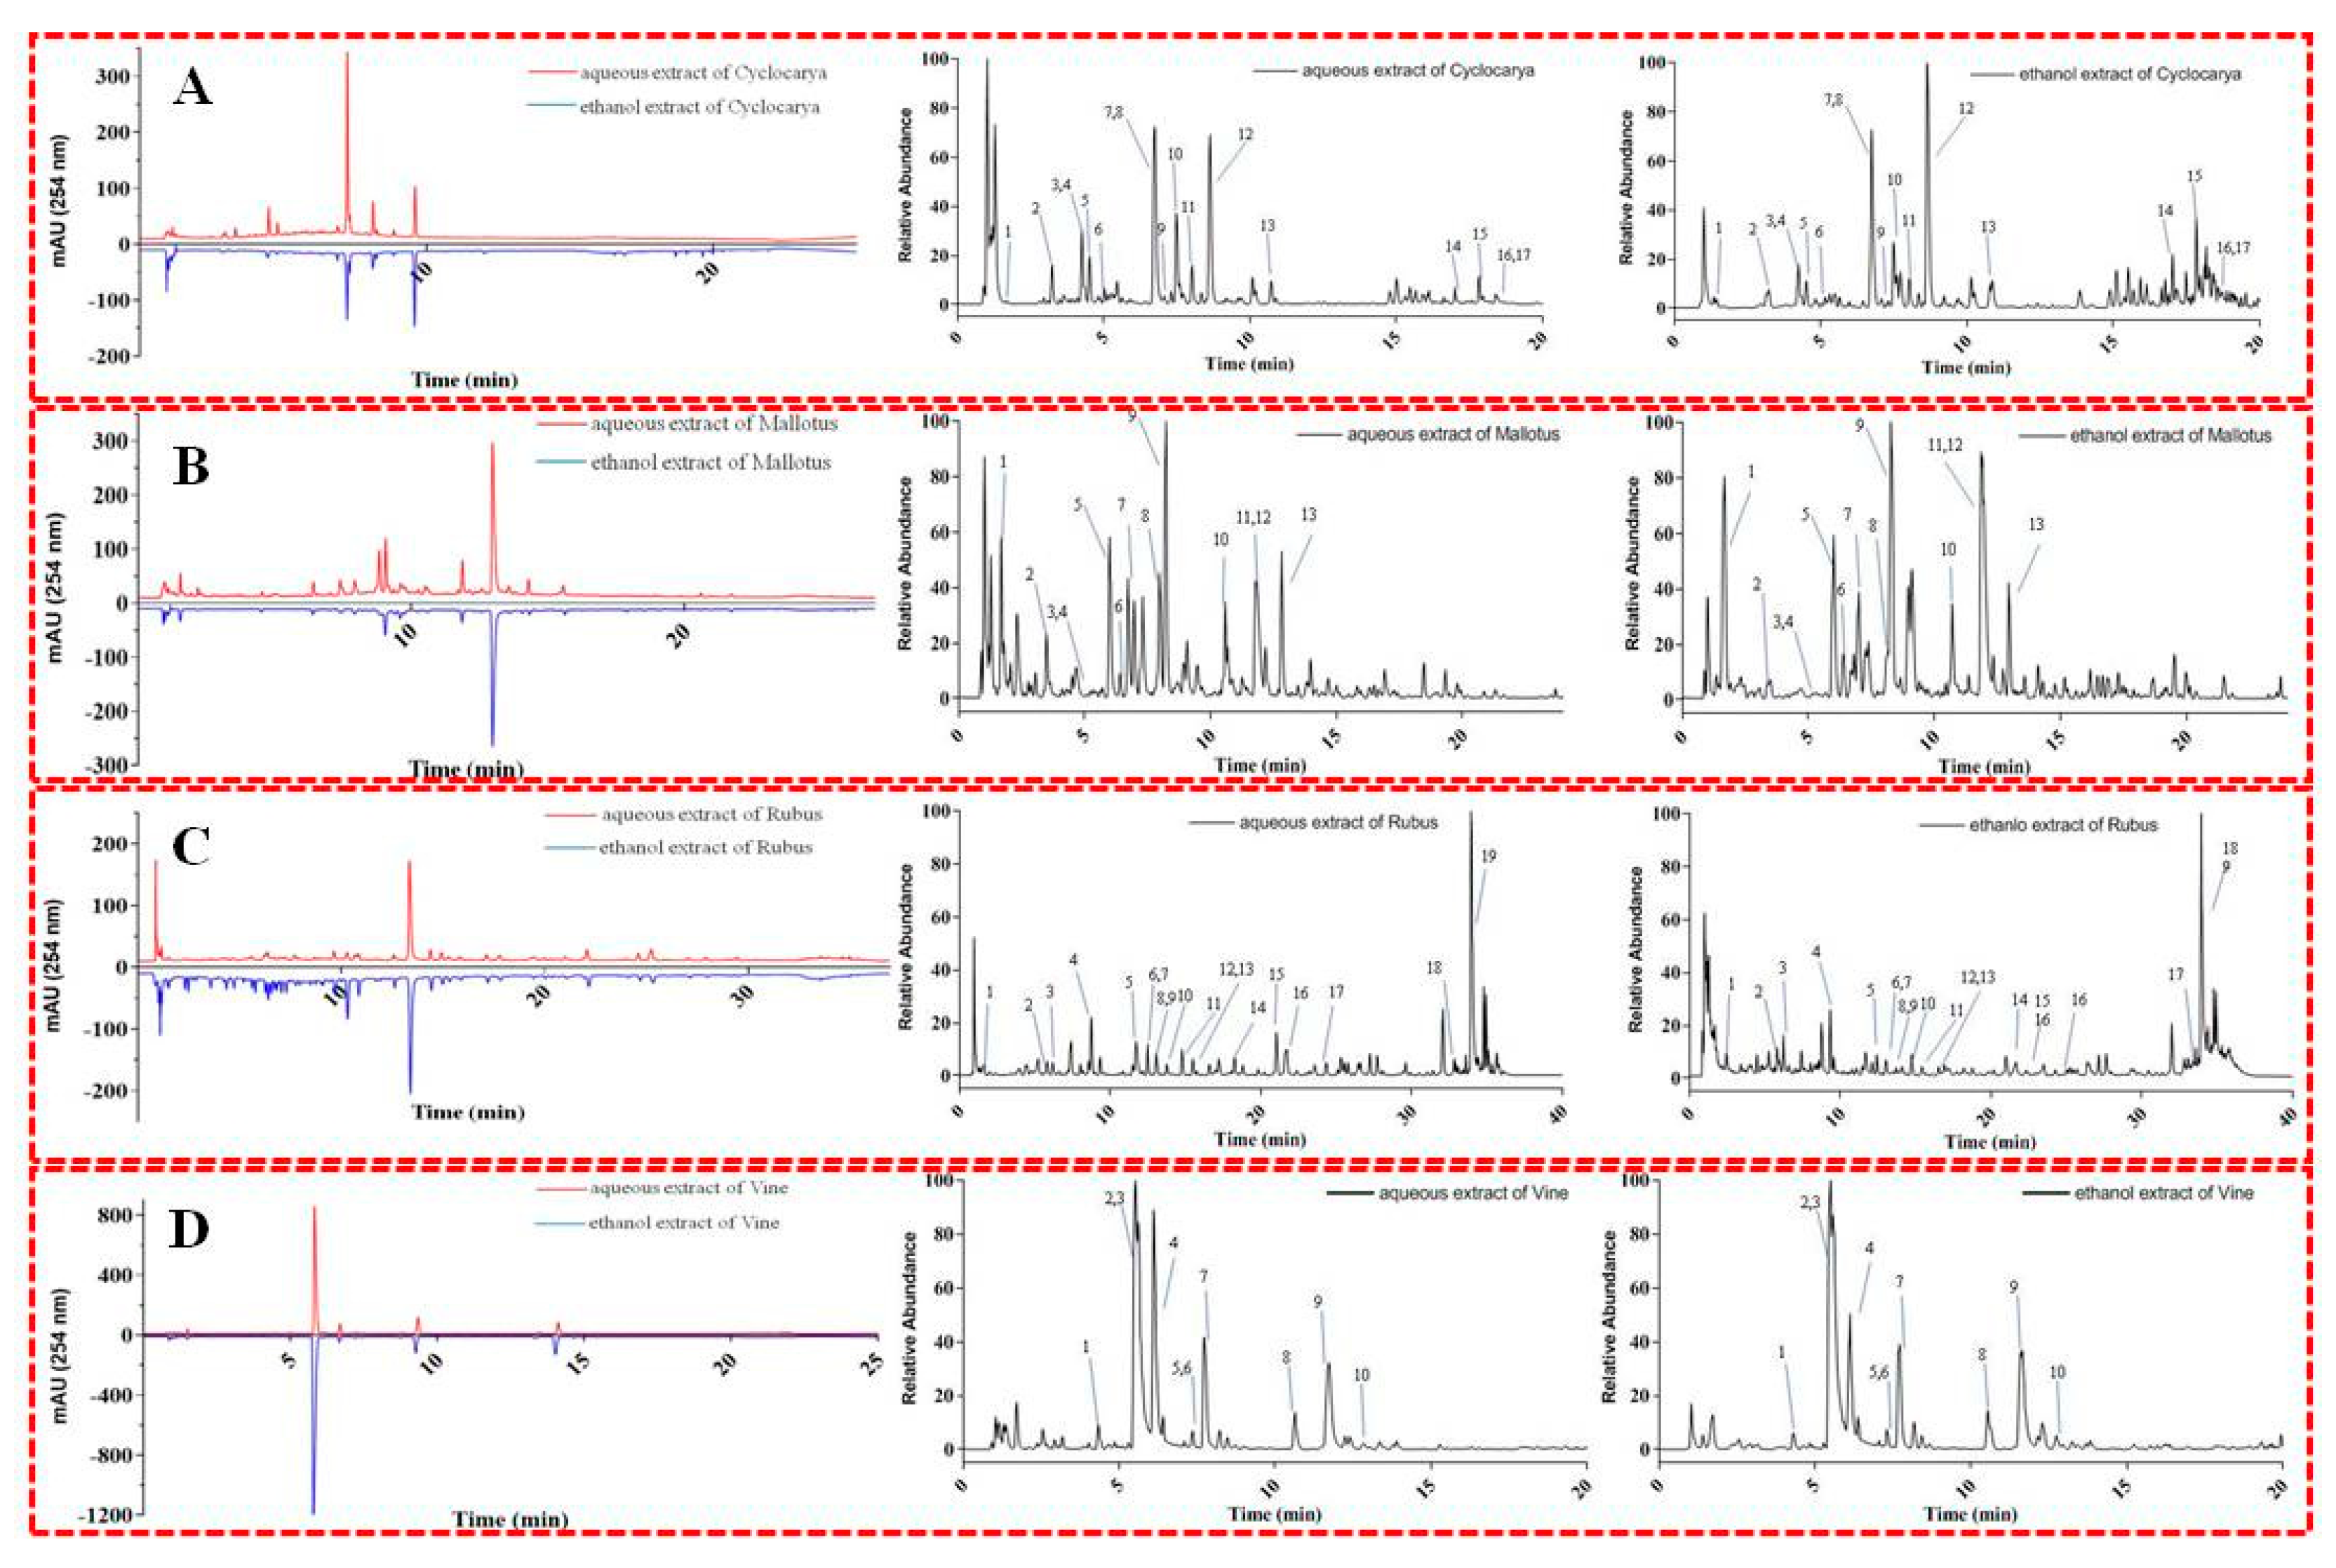

Table 1.
Descriptions of the four herbal teas employed in the study.
| Flower teas | Common name | Chinese name | Species | Family |
 |
Mallotus | Shankucha | Mallotus peltatus | Euphorbiaceae |
 |
Cyclocarya | Qingqianliu | Cyclocarya paliurus | Juglandaceae |
 |
Rubus | Tiancha | Rubus chingii | Rosaceae |
 |
Vine | Meicha | Ampelopsis grossedentata | Vitaceae |
Table 2.
Correlation analysis of 1/EC50 value and various indexes of tea extracts from different varieties.
Table 2.
Correlation analysis of 1/EC50 value and various indexes of tea extracts from different varieties.
| Index | Total polypheols |
Total flavonoids |
Total flavonols |
DPPH· scavenging ability |
ABTS· scavenging ability |
ɑ-glucosidase inhibition |
| Total polyphenols | 1.00 | 0.05 | 0.04 | 0.903** | 0.756** | 0.32 |
| Total flavonoids | 1.00 | 0.872** | 0.06 | -0.15 | -0.12 | |
| Total flavonols | 1.00 | 0.02 | -0.13 | -0.19 | ||
| DPPH·scavenging ability | 1.00 | 0.750** | 0.33 | |||
| ABTS·scavenging ability | 1.00 | 0.17 | ||||
| ɑ-glucosidase inhibition | 1.00 |
* Significant correlation at the P < 0.05 level, ** Very significant correlation at the P < 0.01 level.
Disclaimer/Publisher’s Note: The statements, opinions and data contained in all publications are solely those of the individual author(s) and contributor(s) and not of MDPI and/or the editor(s). MDPI and/or the editor(s) disclaim responsibility for any injury to people or property resulting from any ideas, methods, instructions or products referred to in the content. |
© 2024 by the authors. Licensee MDPI, Basel, Switzerland. This article is an open access article distributed under the terms and conditions of the Creative Commons Attribution (CC BY) license (http://creativecommons.org/licenses/by/4.0/).
Copyright: This open access article is published under a Creative Commons CC BY 4.0 license, which permit the free download, distribution, and reuse, provided that the author and preprint are cited in any reuse.


