
Submitted:
15 January 2024
Posted:
16 January 2024
You are already at the latest version
Abstract
Background. IgA nephropathy (IgAN) is associated with chronic inflammation. Platelet-related parameters, such as platelet (PLT) count, platelet-to-albumin ratio (PAR) and platelet-to-lymphocyte ratio (PLR), were examined as potential prognostic indicators for renal and cardiovascular (CV) outcomes in IgAN.
Methods. 150 IgAN patients were devided into two groups based on the cut-off value of PAR. All-cause mortality, major CV events and end-stage renal disease were the primary combined endpoints. Secondary endpoints, such as CV or renal endpoints, were also analyzed separately.
Results. The patient’s mean age was 43.7 ± 13.5 years, and the follow-up time was 124 ± 67 months. The K-M curve showed that PLR, PAR and PLT were strongly associated with primary combined (p = 0.002, p = 0.004, p = 0.001) and renal outcomes (p < 0.001, p < 0.001, p < 0.001), but not with CV outcomes in IgAN. However, when combined with left ventricular hypertrophy (LVH) or metabolic syndrome (MetS) PAR was found to be a significant predictor of both primary (p < 0.001, p < 0.001) and secondary outcomes (p = 0.001 and p = 0.038; p = 0.001 and p = 0.015). Additionally, PLR correlated with microalbuminuria (r = -0.165, p = 0.033) and LVH (r = -0.178, p = 0.025), while PLT correlated with eGFR (r = 0.158, p = 0.040).
Conclusion. Elevated PAR and PLR may predict progression to end-stage kidney disease, but in combination with LVH and MetS, they showed CV events also in IgAN. The determination of PAR and PLR can be useful and cost-effective parameters for assessing both cardiovascular and renal risks in CKD.
Keywords:
Platelet-to-albumin ratio
; Platelet-to-lymphocyte ratio
; Chronic kidney disease
; IgA nephropathy
; Renal and cardiovascular prognosis.
Introduction
Immunoglobulin A nephropathy (IgAN) is one of the most common types of primary glomerulonephritis worldwide (1). Based on the immune pathomechanism of IgAN it is also associated with chronic inflammation. Studies showed that about 20–40% of IgAN patients may lose their kidney function gradually and progress to end-stage kidney disease (ESKD) within 20 years from the time of diagnosis, costing considerable socioeconomic resources (2). The identification of patients with IgAN who are at high risk of progressive reduction of renal function is worthwhile, but the patients die from cardiovascular (CV) causes before reaching ESKD. As a result, it is crucial to recognize high-risk patients and take appropriate action. Accumulating evidence has illustrated that IgAN is an immune system disease where the activation of inflammation is closely related to the outcome of the disease (3–4). Platelet-related parameters, including platelet (PLT), platelet-to-albumin ratio (PAR), and platelet-to-lymphocyte ratio (PLR), are easy to obtain clinically and have been proven to be novel prognostic indicators for several different inflammatory diseases (5–7), such as psoriasis, head and neck cancers, and soft tissue sarcoma. Moreover, the results of multiple studies consistently report that PAR and PLR are associated with inflammation and have been described as emerging inflammation indexes (5–7). In addition to hemostasis, platelets may also be able to trigger and aggravate inflammation by interacting with immune cells and secreting proinflammatory cytokines (8). Nevertheless, few studies have demonstrated the precise relationship between platelet-related parameters and chronic kidney disease (CKD).
Materials and Methods
Patient Selection
The study included 150 patients with IgAN diagnosed by renal biopsy at the 2nd Department of Internal Medicine, Nephrology, and Diabetes Center of the University of Pécs Clinical Center between January 2003 and December 2018. Among these, 150 patients, only one patient withdrew the informed consent. 12 individuals whose data were missing during follow-up and 13 subjects treated with immunosuppression were excluded from the study. Ultimately, 124 patients were enrolled in our study. All patients were monitored regularly at the outpatient clinic for at least one to three months following the kidney biopsy. This study was approved by the Ethics Committee of the University of Pécs (3170/2008), and all methods were carried out according to relevant guidelines and regulations. All patients completed the written informed consent form to be included in this study.
Clinical and pathological data collection
At the time of the renal biopsy and the follow-up visit, demographic information and clinical data were gathered. Hypertension was defined as SBP >140 mmHg and/or DBP >90 mmHg at rest. The Oxford classification (M, mesangial hypercellularity; S, glomerulosclerosis; E, endocapillary hypercellularity; T, tubular atrophy and interstitial fibrosis; and C, cellular or fibro-cellular crescents) was used to evaluate the pathological lesions (7).
Renal and cardiovascular endpoints
The primary composite endpoint included cardiovascular (CV) outcomes (containing overall mortality), coronary intervention (acute coronary events (ACS)) and stroke, as well as renal outcomes (ESKD development: renal replacement therapy was started or eGFR <15 ml/min/1,73 m2). Subsequently, CV and renal endpoints were analyzed separately as secondary endpoints.
The Definition of Platelet-Related Parameters
PLT was obtained by the absolute platelet count of a routine blood examination, where platelets were measured per microliter of blood. The PAR is the absolute number of platelets divided by serum albumin. The PLR is the ratio of platelets to lymphocytes. In this study, the cut-off was defined as PAR, PLR, and PLT (maximum Youden index: sensitivity + specificity - 1). Routine laboratory examinations (hemoglobin, uric acid, total cholesterol, triglyceride, HDL cholesterol), and urine albumin measurements were also performed.
Statistical Analysis
Univariate and multivariate linear regression were used to identify independent predictor variables or risk factors. Cox regression was used to compare parameters and renal survival. Normally, continuous variables are expressed as the means ± SD and compared using a T-test. P<0.05 was considered statistically significant. Nonparametric variables are usually expressed as medians with interquartile ranges and were compared using either the Mann-Whitney U or the Kruskal-Wallis test. Categorical variables were compared using a χ2 test. The data were analyzed using Microsoft Excel and SPSS software.
Results
We included 124 patients with IgAN, who were followed for an average of 124 ± 67 months between 2005 and 2021. Figure 1 shows the flow chart of recruited patients. The mean age of patients was 43.7 ± 13.5 years, of whom 74 were male. The majority of patients (84%) were hypertensive, and 27% were diabetic at the time of the IgAN diagnosis. The main clinical data and the incidence of risk factors are detailed in Table 1.
The mean PLT, PLR, and PAR of the 124 patients were 140.14 ± 65.18 (G/l), 5.78 ± 1.89, and 238.9 ± 68.88 (G/g). Patients were divided into two groups according to the PAR AUC values determined by ROC analysis. Clinical data of patients divided into two groups based on low and high PAR is listed in Table 1. These two groups of IgAN patients differed significantly in gender, mean blood pressure, LVH, and diastolic dysfunction. There were no differences between the two groups regarding age, eGFR, metabolic parameters (dyslipidemia, carbohydrate metabolism, obesity, BMI, hypertension), ejection fraction, laboratory results (Hb, MAU, UA), using angiotensin-converting enzyme inhibitor (ACEI), angiotensin II receptor blocker (ARB), statins, or MEST-C score.
In our study, 35 (28%) of the 124 IgAN patients reached the primary combined endpoint, 22 (18%) the secondary renal and 13 (10%) the secondary cardiovascular endpoints. Survival analysis showed significant differences between high and low PLR in the case of the primary combined endpoint (p = 0.002) (Figure 2A) and the secondary renal endpoint (p < 0.001) (Figure 2B), but the secondary cardiovascular endpoint was not significant (p=NS) (Figure 2C). There was also a significant difference between high and low PAR in the case of the primary combined endpoint (p = 0.004) (Figure 2D) and the secondary renal endpoint (p < 0.001) (Figure 2E), but in this case, the secondary cardiovascular endpoint was not significant (Figure 2F). The high PLT compared to the low PLT showed significantly worse survival in the case of the primary combined endpoint (p = 0.001) (Figure 2G) and the secondary renal endpoint (p < 0.001) (Figure 2H), but the cardiovascular endpoint was not significant (Figure 2I). In that case, if we combined the high PAR with high PLR and compared it with the low PAR and PLR group, we got the same results: the primary combined endpoint and the secondary renal endpoint showed significantly worse survival (p = 0.034 and p = 0.005) (Figure 2J-K) in the high PAR and PLR group, but there was no significant difference between the two groups in the cardiovascular outcomes (Figure 2L).
PAR was correlated with gender and segmental glomerulosclerosis in histology (S). PLR was correlated with microalbuminuria and left ventricular hypertrophy; PLT was correlated with gender and eGFR (Table 2). There were no significant differences between male and female patient’s primary and secondary renal and cardiovascular outcomes. There was no significant correlation between PAR, PLR and PLT and the drugs (ACEI/ARB, BB, CCB and statins) taken by the patients.
When we analyzed 14 parameters by uni- and multivariate logistic regression analysis, only gender was a significant influencing factor for PAR, LVH for PLR, and gender and hypertension for PLT (Table 3).
PLR, gender, dyslipidemia, and microalbuminuria were associated with the primary combined endpoints; left ventricular hypertrophy and microalbuminuria with the secondary renal endpoints; and gender, age, and diabetes with the cardiovascular endpoints by multivariate Cox regression (Table 4).
In our follow-up study, the presence of high PAR combined with the presence of LVH significantly worsened survival in the cases of primary endpoints (p < 0.001), renal endpoints (p < 0.001), and also in CV endpoints (p = 0.038) (Figure 3), but there was no significant difference in the case of the combination of PLR and LVH in neither endpoint. The presence of metabolic syndrome (MetS) combined with high PAR and high PLR significantly impaired survival at both primary (p < 0.001; p < 0.001) and secondary renal (p = 0.001, p = 0.013) and cardiovascular endpoints (p = 0.015; p = 0.018) (Figure 4).
Discussion
IgAN is a common disease that has a variety of factors contributing to its development and progression (1). Most researchers concur that autoimmune (forming IgG antidg-IgA1-ab) and inflammation (activation of the complement cascade) play significant roles in the pathomechanism and progression of IgAN, even though the exact pathophysiology of the disease is still unknown (1, 2). According to recent studies, CKD, diabetic nephropathy, sclerosing nephropathy, and several other renal disorders' outcomes are associated with platelet-related factors (9, 10). As a result, it is assumed that platelet numbers may reflect the activity of the immune response during IgAN, which was demonstrated by our results.
Tan et al. also found in IgAN patients that PAR seemed to be a better marker of adverse renal outcome than PLR, albumin, and PLT, suggesting that PAR was the only platelet-related parameter that could be used as an independent risk factor (11).
In our study, the K-M curve revealed that PLT, PLR, and PAR were all significantly linked with only the renal but not the cardiovascular outcomes of IgAN, indicating that each of them may be used as prospective predictors of renal endpoints, as Tan et al. (11) reported in their cohort. In our previous studies, we found the left ventricular mass index (LVMI) and the development of the metabolic syndrome (MetS) in IgAN patients have an impact on cardiovascular outcomes (12, 13). Inflammatory parameters may indicate further factors that are responsible for the accelerated manifestation of the endpoints. It is supported by the stronger correlation of the outcome if we were taking into consideration the presence of MetS as well. Although PAR and PLT were correlated with gender, there were no significant differences between male and female patients' primary and secondary outcomes.
Serum albumin is thought to be linked to inflammation in addition to reflecting the body's nutritional state (14, 15). A new indicator called PAR that combines the two is suggested as having the potential to more accurately reflect the body's inflammatory state (16). IgAN's pathophysiology and progression were probably influenced by an abnormal immune response by forming abnormal dg-IgA1, which process can be characterized as chronic inflammation and activation of various immune mediators (17). Therefore, the negative renal effects of IgAN are unquestionably predicted by a high level of PAR, which suggests a hyperinflammatory state and/or inadequate nutrition in cases of end-stage kidney disease.
According to Huang et al. (18), there was a favorable correlation between PAR and the disease activity of axial spondyloarthritis. The use of PAR to forecast patient mortality in cases of severe fever and thrombocytopenia syndrome was also demonstrated (19). Similar to how peritoneal dialysis patients' results are predicted by PAR (20). The PAR may therefore evolve into a novel prognostic indicator in the future, according to the consistent findings of several articles (21–22) in diseases where the presence of inflammation is much more obvious.
Surprisingly, PAR could still forecast a poor prognosis in IgAN. Consequently, as well as on the basis of our results, the preceding hypothesis appeared to not adequately explain this phenomenon. Recent research has shown that various chronic inflammatory indicators and platelet counts are positively correlated in end-stage kidney disease and peritoneal dialysed patients (23, 24).
The deposition of IgA in the glomeruli may start with unspecific activation of vascular mediators, which will lead to BP elevation and glomerulosclerosis (11). This phenomenon may be unique in all chronic glomerular diseases. The hypertension-induced LVH and deteriorating renal function, and they also have metabolic syndrome, our previous data confirmed that these two cardiometabolic alterations cause higher cardiovascular morbidity and mortality (12, 13). So it is indispensable to recognize the high CV risk of IgAN patients and treat them more aggressively to reduce their risk. That is why we combined PAR and PLR with cardiometabolic factors, which reinforced each other. PAR may be more predictive of prognosis and outcome in patients who are already in higher CKD stages at the time of biopsy, which may be because mild renal impairment patients progress to ESRD relatively slowly, while patients with severe renal impairment develop to the endpoint somewhat quickly (25).
However, several studies have shown that PAR is indeed an inflammatory index. As a result, PAR was thought to be a preferred marker due to its low cost and ease of calculation in the clinic. Therefore, PAR, a new inflammatory marker, may be used in clinical practice. In addition, PAR is a combination marker that seems more accurate in prediction than other platelet-related parameters. It has been reported that PAR might be more stable and less likely to be affected by dynamic physiological conditions than other platelet parameters and/or inflammatory markers (26, 27). We could also confirm this.
In our study, there was no significant difference in the Histological Classification (Oxford) between the high and low groups of PAR. However, in the Tan et al. study (11), they found a significant difference between low and high PAR in endocapillary hypercellularity (E0/E1) in their cohort of 966 IgAN patients. This indicates that the severity of the histological abnormality is only one factor in the progression of the disease. This may draw attention to the fact that in some cases (high PAR), immunosuppressive treatment has a right to exist.
Wang et al. demonstrated in their study that IgAN patients with high PAR usually had adverse renal survival when they did not receive any immunosuppressive therapy (28). We did not examine the effect of the immunosuppressive therapy on our IgAN patients.
In another previous study, PAR was correlated with one of the most commonly used inflammatory serum markers, such as C-reactive protein (CRP); therefore, CRP and IL-6 are not routine examination items for patients with IgA nephropathy, and there is no guideline recommending routine examination of CRP and IL-6 in IgAN patients. Unfortunately, we did not examine the association between CRP, IL-6, and PAR.
In Yi et al.'s study, crescent formation in the glomeruli and platelet count were also risk predictors of poor prognosis in IgAN (29), but the platelet count was not an independent predictor of crescent formation in IgAN. We also found no correlation between these two parameters in our study. However, we found a weak, but significant correlation between PAR and segmental glomerulosclerosis (S0/S1), which could draw attention to the early risk stratification and treatment of high-risk patients.
Previous studies have suggested that proteinuria is a well-established risk factor for kidney function decline in IgAN (30). We also demonstrated that proteinuria was shown to be an independent risk factor for PLR but not for PAR or PLT. In certain diseases, PAR shows a closer correlation, while in other diseases PLR shows a closer correlation with proteinuria, which may indicate activity differences at different levels of inflammatory processes and different degrees of activation in the complement cascade, which can be caused by different changes in PLT, lymphocytes, and albumin values.
Gan and Zeng et al. showed in their prospective cohort and meta-analysis that CKD patients have higher PLR values compared to non-CKD patients, and PLR values were highly associated with all-cause mortality in CKD patients. PLR is a valid predictor as a clinically accessible indicator for patients with CKD (31, 32). Our study found associations between the PLR and combined and renal endpoints, but not with the cardiovascular endpoints, which supports this observation in a smaller but more uniform kidney disease.
Chen et al. demonstrated in their study that PLR was independently associated with CVD events in a small number of peritoneal dialysis patients during a 22-month median follow-up period (33). In these patients, peritoneal inflammatory activation is consistently present and should be much higher (more active) than in IgAN.
In our study, we could not confirm this, but the difference could have been that the peritoneal dialysis patients were in severe CV status; in our patients, they were not dialized and had better renal function and a better CV status. If we combined PAR and PLR with the presence of LVH and MetS, strengthening the results of our study, the CV endpoints also became significant. Metabolic alterations like MetS cause further acceleration of atherosclerosis and a progression of kidney alterations. Therefore, we could recommend cardiovascular and metabolic screening at least annually for the high-risk asymptomatic (especially with high PAR or PLR) IgAN patients.
Limitations of the study
First, this is a one-center study with limited follow-up time. Second, the cut-off value is based on this cohort. Therefore, it may not be appropriate for other populations and races. Third, since this was a retrospective study, there was no detailed data for regular follow-up in each subject, so a dynamic analysis of PAR could not be performed. Fourth, retrospective analyses are prone to residual confounding effects of comorbidity, lifting style, and medications that affect blood cell counts and selection bias. This is why prospective studies need to be conducted with large sample sizes. Fifth, this study included more men than women, which may bias the results.
Conclusion
Increased PAR and PLR may predict the progression to end-stage renal disease, but combined with LVH and MetS, they showed CV events in IgAN. Determining PAR and PLR, which are simple and cheap parameters, may be useful parameters not only for CV risk but also for the stratification of renal risk in IgAN.
Author Contributions
All authors have read and approved the manuscript. Balázs Sági conceived and designed the study collected clinical data and drafted and approved the manuscript. Botond Csiky: identified study plot, and contributed to the interpretation of the drafting approved of the manuscript. Tibor Vas: identify study plot, identify the classification of biopsies, statistical analysis, review, and approval of the manuscript. Judit Nagy: drafting an application to the committee of ethics, organizing the database, reviewing, and approving the manuscript. Tibor József Kovács: a collection of clinical data, review, drafting and approval of the manuscript.
Funding
None.
Acknowledgements
We are grateful to Ilona Varga Sámikné for her conscientious work in the study and the recording of the data.
Availability of data and materials
The data underlying this article cannot be shared publicly due to Hungarian regulations and the privacy of individuals who participated in the study. The data could be shared on reasonable request to the corresponding author if accepted by the Regional Committee for Medical and Health Research Ethics and local Data Protection Officials.
Declarations
Ethics approval and consent to participate. The study was approved by the University of Pécs Clinical Center Regional Research Ethical Committee (Reference no. 3170/2008). All the study participants provided informed consent. The research was done according to the Declaration of Helsinki.
Consent for publication
Not Applicable.
Competing interests
Not Applicable.
References
- Rodrigues JC, Haas M, Reich HN. IgA Nephropathy. Clin J Am Soc Nephrol (2017) 12:677–86. [CrossRef]
- Kim JK, Kim JH, Lee SC, Kang EW, Chang TI, Moon SJ, et al. Clinical Features and Outcomes of IgA Nephropathy With Nephrotic Syndrome. Clin J Am Soc Nephrol (2012) 7:427–36. [CrossRef]
- Rauen T, Floege J. Inflammation in IgA Nephropathy. Pediatr Nephrol (2017) 32:2215–24. [CrossRef]
- Schena FP, Rossini M, Abbrescia DI, Zaza G. The Molecular Mechanisms of Inflammation and Scarring in the Kidneys of Immunoglobulin A Nephropathy: Gene Involvement in the Mechanisms of Inflammation and Scarring in Kidney Biopsy of IgAN Patients. Semin Immunopathol (2021) 43(5):691–705. [CrossRef]
- Kumarasamy C, Tiwary V, Sunil K, Suresh D, Shetty S, Muthukaliannan GK, et al.. Prognostic Utility of Platelet-Lymphocyte Ratio, Neutrophil-Lymphocyte Ratio and Monocyte-Lymphocyte Ratio in Head and Neck Cancers: A Detailed PRISMA Compliant Systematic Review and Meta-Analysis. Cancers (Basel) (2021) 13(16):4166. [CrossRef]
- Li L, Yu J, Zhou Z. Platelet-Associated Parameters in Patients With Psoriasis: A PRISMA-Compliant Systematic Review and Meta-Analysis. Med (Baltimore). (2021) 100(50):e28234. [CrossRef]
- Li LQ, Bai ZH, Zhang LH, Zhang Y, Lu XC, Zhang Y, et al.. Meta-Analysis of Hematological Biomarkers as Reliable Indicators of Soft Tissue Sarcoma Prognosis. Front Oncol (2020) 10:30. [CrossRef]
- Holinstat, M. Normal Platelet Function. Cancer Metastasis Rev (2017) 36(2):195–8. [CrossRef]
- Baaten C, Schröer JR, Floege J, Marx N, Jankowski J, Berger M, et al. Platelet Abnormalities in CKD and Their Implications for Antiplatelet Therapy. Clin J Am Soc Nephrol (2021) 17(1)155–70. [CrossRef]
- El Haouari, M. Platelet Oxidative Stress and its Relationship With Cardiovascular Diseases in Type 2 Diabetes Mellitus Patients. Curr Med Chem (2019) 26(22):4145–65. [CrossRef]
- Tan J, Song G, Wang S, Dong L, Liu X et al. Platelet-to-Albumin Ratio: A Novel IgA Nephropathy Prognosis Predictor. Front Immun (2022) 13:1-10. [CrossRef]
- Sági B, Késői I, Vas T, Csiky B, Nagy J, Kovács TJ. Left ventricular myocardial mass index associated with cardiovascular and renal prognosis in IgA nephropathy. BMC Nephrol. 2022 Aug 16;23(1):285. [CrossRef]
- Sági B, Késői I, Vas T, Csiky B, Nagy J, Kovács T.The prognostic role of heart rate recovery after exercise and metabolic syndrome in IgA nephropathy. BMC Nephrol. 2021 Nov 23;22(1):390. [CrossRef]
- Arroyo V, Garcı́a-Martinez R, Salvatella X. Human Serum Albumin, Systemic Inflammation, and Cirrhosis. J Hepatol (2014) 61(2):396–407. [CrossRef]
- Li T, Li X, Wei Y, Dong G, Yang J, Yang J, et al. Predictive Value of C-Reactive Protein-To-Albumin Ratio for Neonatal Sepsis. J Inflammation Res (2021) 14:3207–15. [CrossRef]
- Haksoyler V, Topkan E. High Pretreatment Platelet-To-Albumin Ratio Predicts Poor Survival Results in Locally Advanced Nasopharyngeal Cancers Treated With Chemoradiotherapy. Ther Clin Risk Manage (2021) 17:691–700. [CrossRef]
- Fogo, AB. Mechanisms of Progression of Chronic Kidney Disease. Pediatr Nephrol (2007) 22(12):2011–22. [CrossRef]
- Huang Y, Deng W, Pan X, Liu M, Zhong Z, Huang Q, et al. The Relationship Between Platelet to Albumin Ratio and Disease Activity in Axial Spondyloarthritis Patients. Mod Rheumatol (2021). [CrossRef]
- Gui Y, Xu Y, Yang P. Predictive Value of the Platelet-To-Albumin Ratio (PAR) on the Risk of Death at Admission in Patients Suffering From Severe Fever With Thrombocytopenia Syndrome. J Inflammation Res (2021) 14:5647–52. [CrossRef]
- Yang Y, Yuan J, Liu L, Qie S, Yang L, Yan Z. Platelet-To-Albumin Ratio: A Risk Factor Associated With Technique Failure and Mortality in Peritoneal Dialysis Patients. Ren Fail (2021) 43(1):1359–67. [CrossRef]
- Li L, Yu J, Zhou Z. Platelet-Associated Parameters in Patients With Psoriasis: A PRISMA-Compliant Systematic Review and Meta-Analysis. Med (Baltimore). (2021) 100(50):e28234. [CrossRef]
- Li LQ, Bai ZH, Zhang LH, Zhang Y, Lu XC, Zhang Y, et al. Meta-Analysis of Hematological Biomarkers as Reliable Indicators of Soft Tissue Sarcoma Prognosis. Front Oncol (2020) 10:30. [CrossRef]
- Molnar MZ, Streja E, Kovesdy CP, Budoff MJ, Nissenson AR, Krishnan M, et al. High Platelet Count as a Link Between Renal Cachexia and Cardiovascular Mortality in End-Stage Renal Disease Patients. Am J Clin Nutr (2011) 94(3):945–54. [CrossRef]
- Peng F, Li Z, Yi C, Guo Q, Yang R, Long H, et al. Platelet Index Levels and Cardiovascular Mortality in Incident Peritoneal Dialysis Patients: A Cohort Study. Platelets (2017) 28(6):576–84. [CrossRef]
- Yamamoto R, Nagasawa Y, Shoji T, Iwatani H, Hamano T, Kawada N, et al. Cigarette Smoking and Progression of IgA Nephropathy. Am J Kidney Dis (2010) 56(2):313–24. [CrossRef]
- Saito N, Shirai Y, Horiuchi T, Sugano H, Shiba H, Sakamoto T, et al. Preoperative Platelet to Albumin Ratio Predicts Outcome of Patients With Cholangiocarcinoma. Anticancer Res (2018) 38(2):987–92. [CrossRef]
- Guo M, Sun T, Zhao Z, Ming L. Preoperative Platelet to Albumin Ratio Predicts Outcome of Patients With Non-Small-Cell Lung Cancer. Ann Thorac Cardiovasc Surg (2021) 27(2):84–90. [CrossRef]
- Wang S, Dong L, Pei G, Jiang Z, Qin A, Tan J, et al.. High Neutrophil-To-Lymphocyte Ratio Is an Independent Risk Factor for End Stage Renal Diseases in IgA Nephropathy. Front Immunol (2021) 12:700224. [CrossRef]
- Yi F, Li Z, Jiang J, Lan L, Bai Y. Related factors of crescents and prognosis in IgA nephropathy. Clin Nephrol. 2023 Jan;99(1):24-31. [CrossRef]
- Chang D, Cheng Y, Luo R, Zhang C, Zuo M, Xu Y, Dai W, Li Y, Han M, He X, Ge S, Xu G.The prognostic value of platelet-to-lymphocyte ratio on the long-term renal survival in patients with IgA nephropathy. Int Urol Nephrol. 2021 Mar;53(3):523-530. [CrossRef]
- Gan W, Guan Q, Hu X, Zeng X, Shao D, et al. The association between platelet-lymphocyte ratio and the risk of all-cause mortality in chronic kidney disease: a systematic review and meta-analysis. Int Urol Nephrol. 2022 Nov;54(11):2959-2967. [CrossRef]
- Zeng M, Liu Y, Liu F, Peng Y, Sun L, et al. J-shaped association of platelet-to—lymphocyte ratio with 5-year mortality among patients with chronic kidney disease in a prospective cohort study. Int Urol Nephrol. 2020 Oct;52(10):1943-1957. [CrossRef]
- Chen T, Yang M. Platelet-to. lymphocyte ratio is associated with cardiovascular disease in continuous ambulatory peritoneal dialysis patients. Int. Immunology. 2020; 78: 106063. [CrossRef]
Figure 1.
The flow chart of recruited patients.
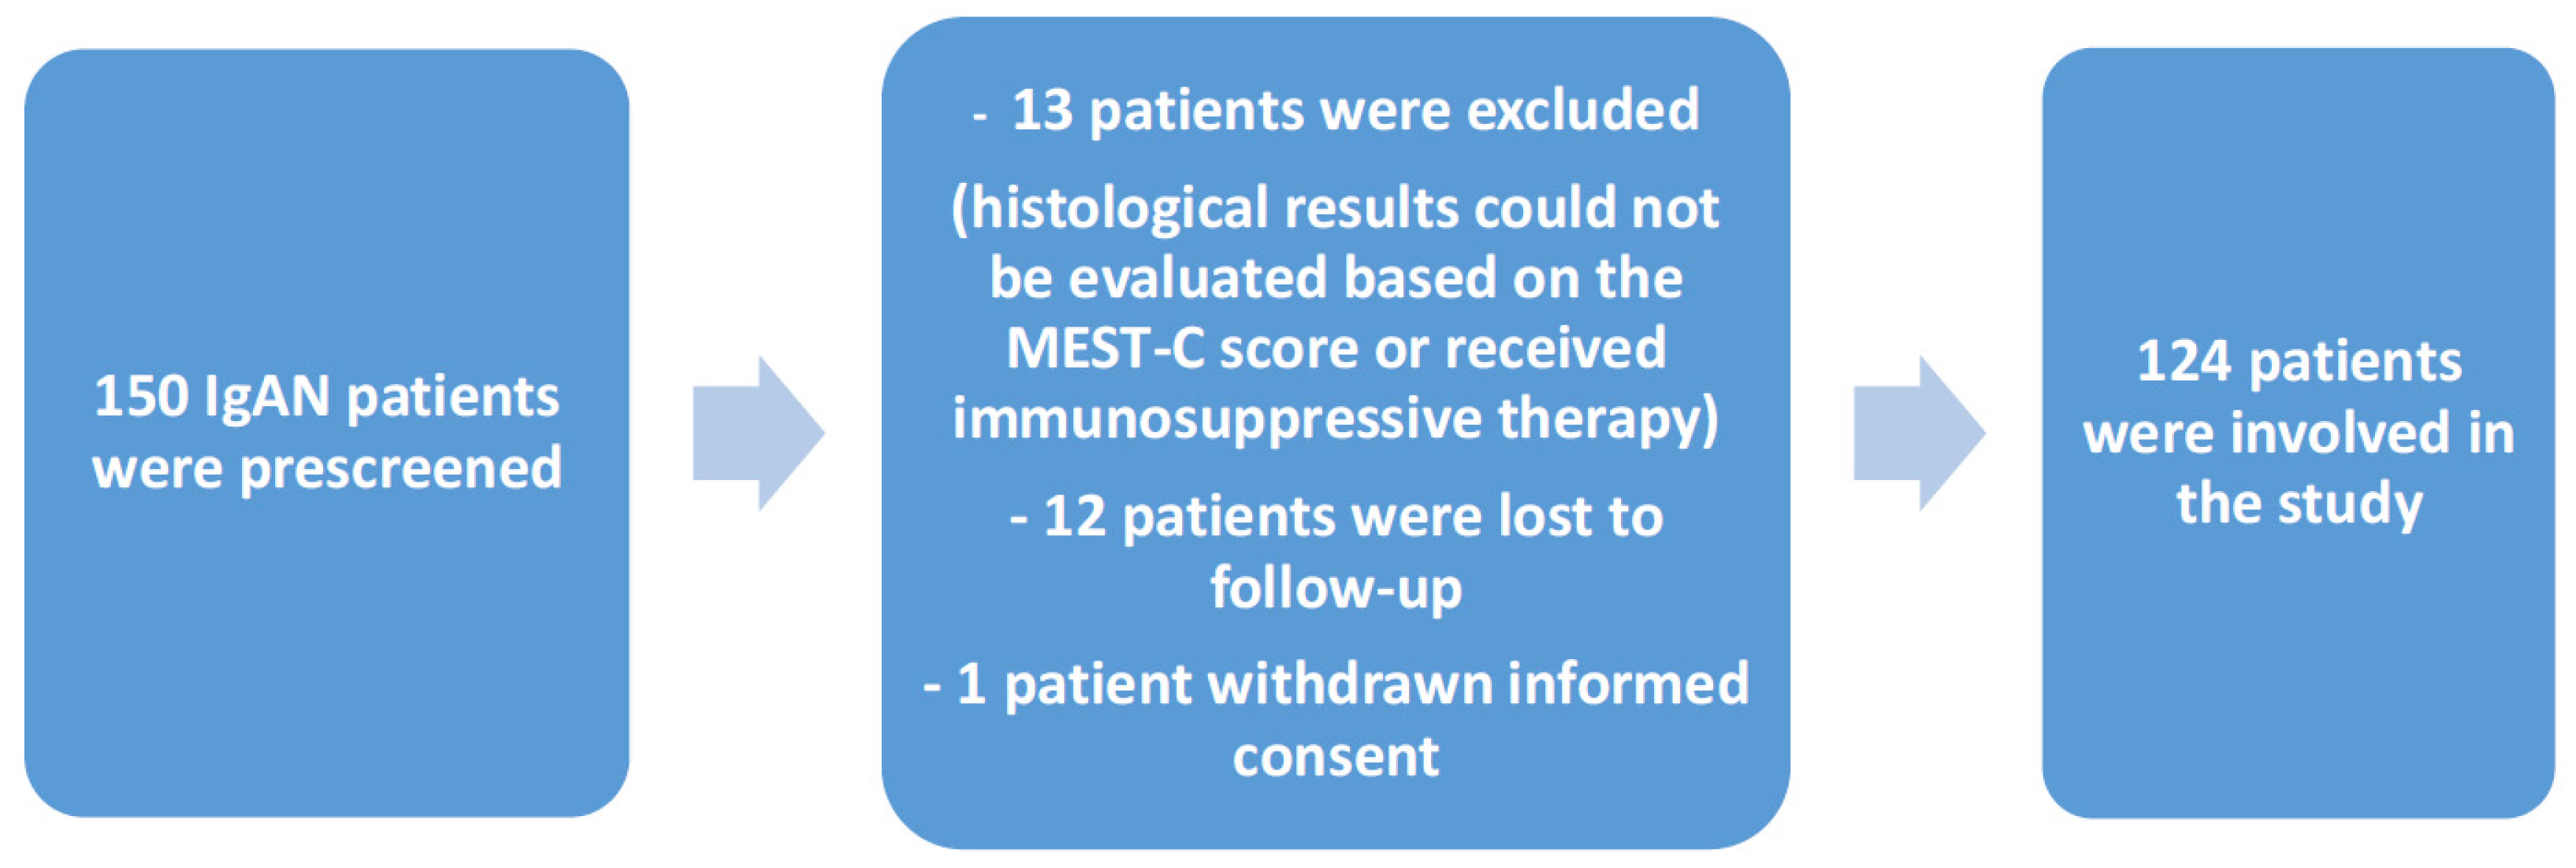
Figure 2.
Kaplan-Meier curves show primary combined (A), renal (B) and cardiovascular (C) endpoints in the case of platelet-to-lymphocyte ratio (PLR); primary combined (D), renal (E) and cardiovascular (F) endpoints in case of platelet-to-albumin ratio (PAR); primary combined (G), renal (H) and cardiovascular (I) endpoints in case of platelet count (PLT); primary combined (J), renal (K) and cardiovascular (L) endpoints in case of PLR and PAR.
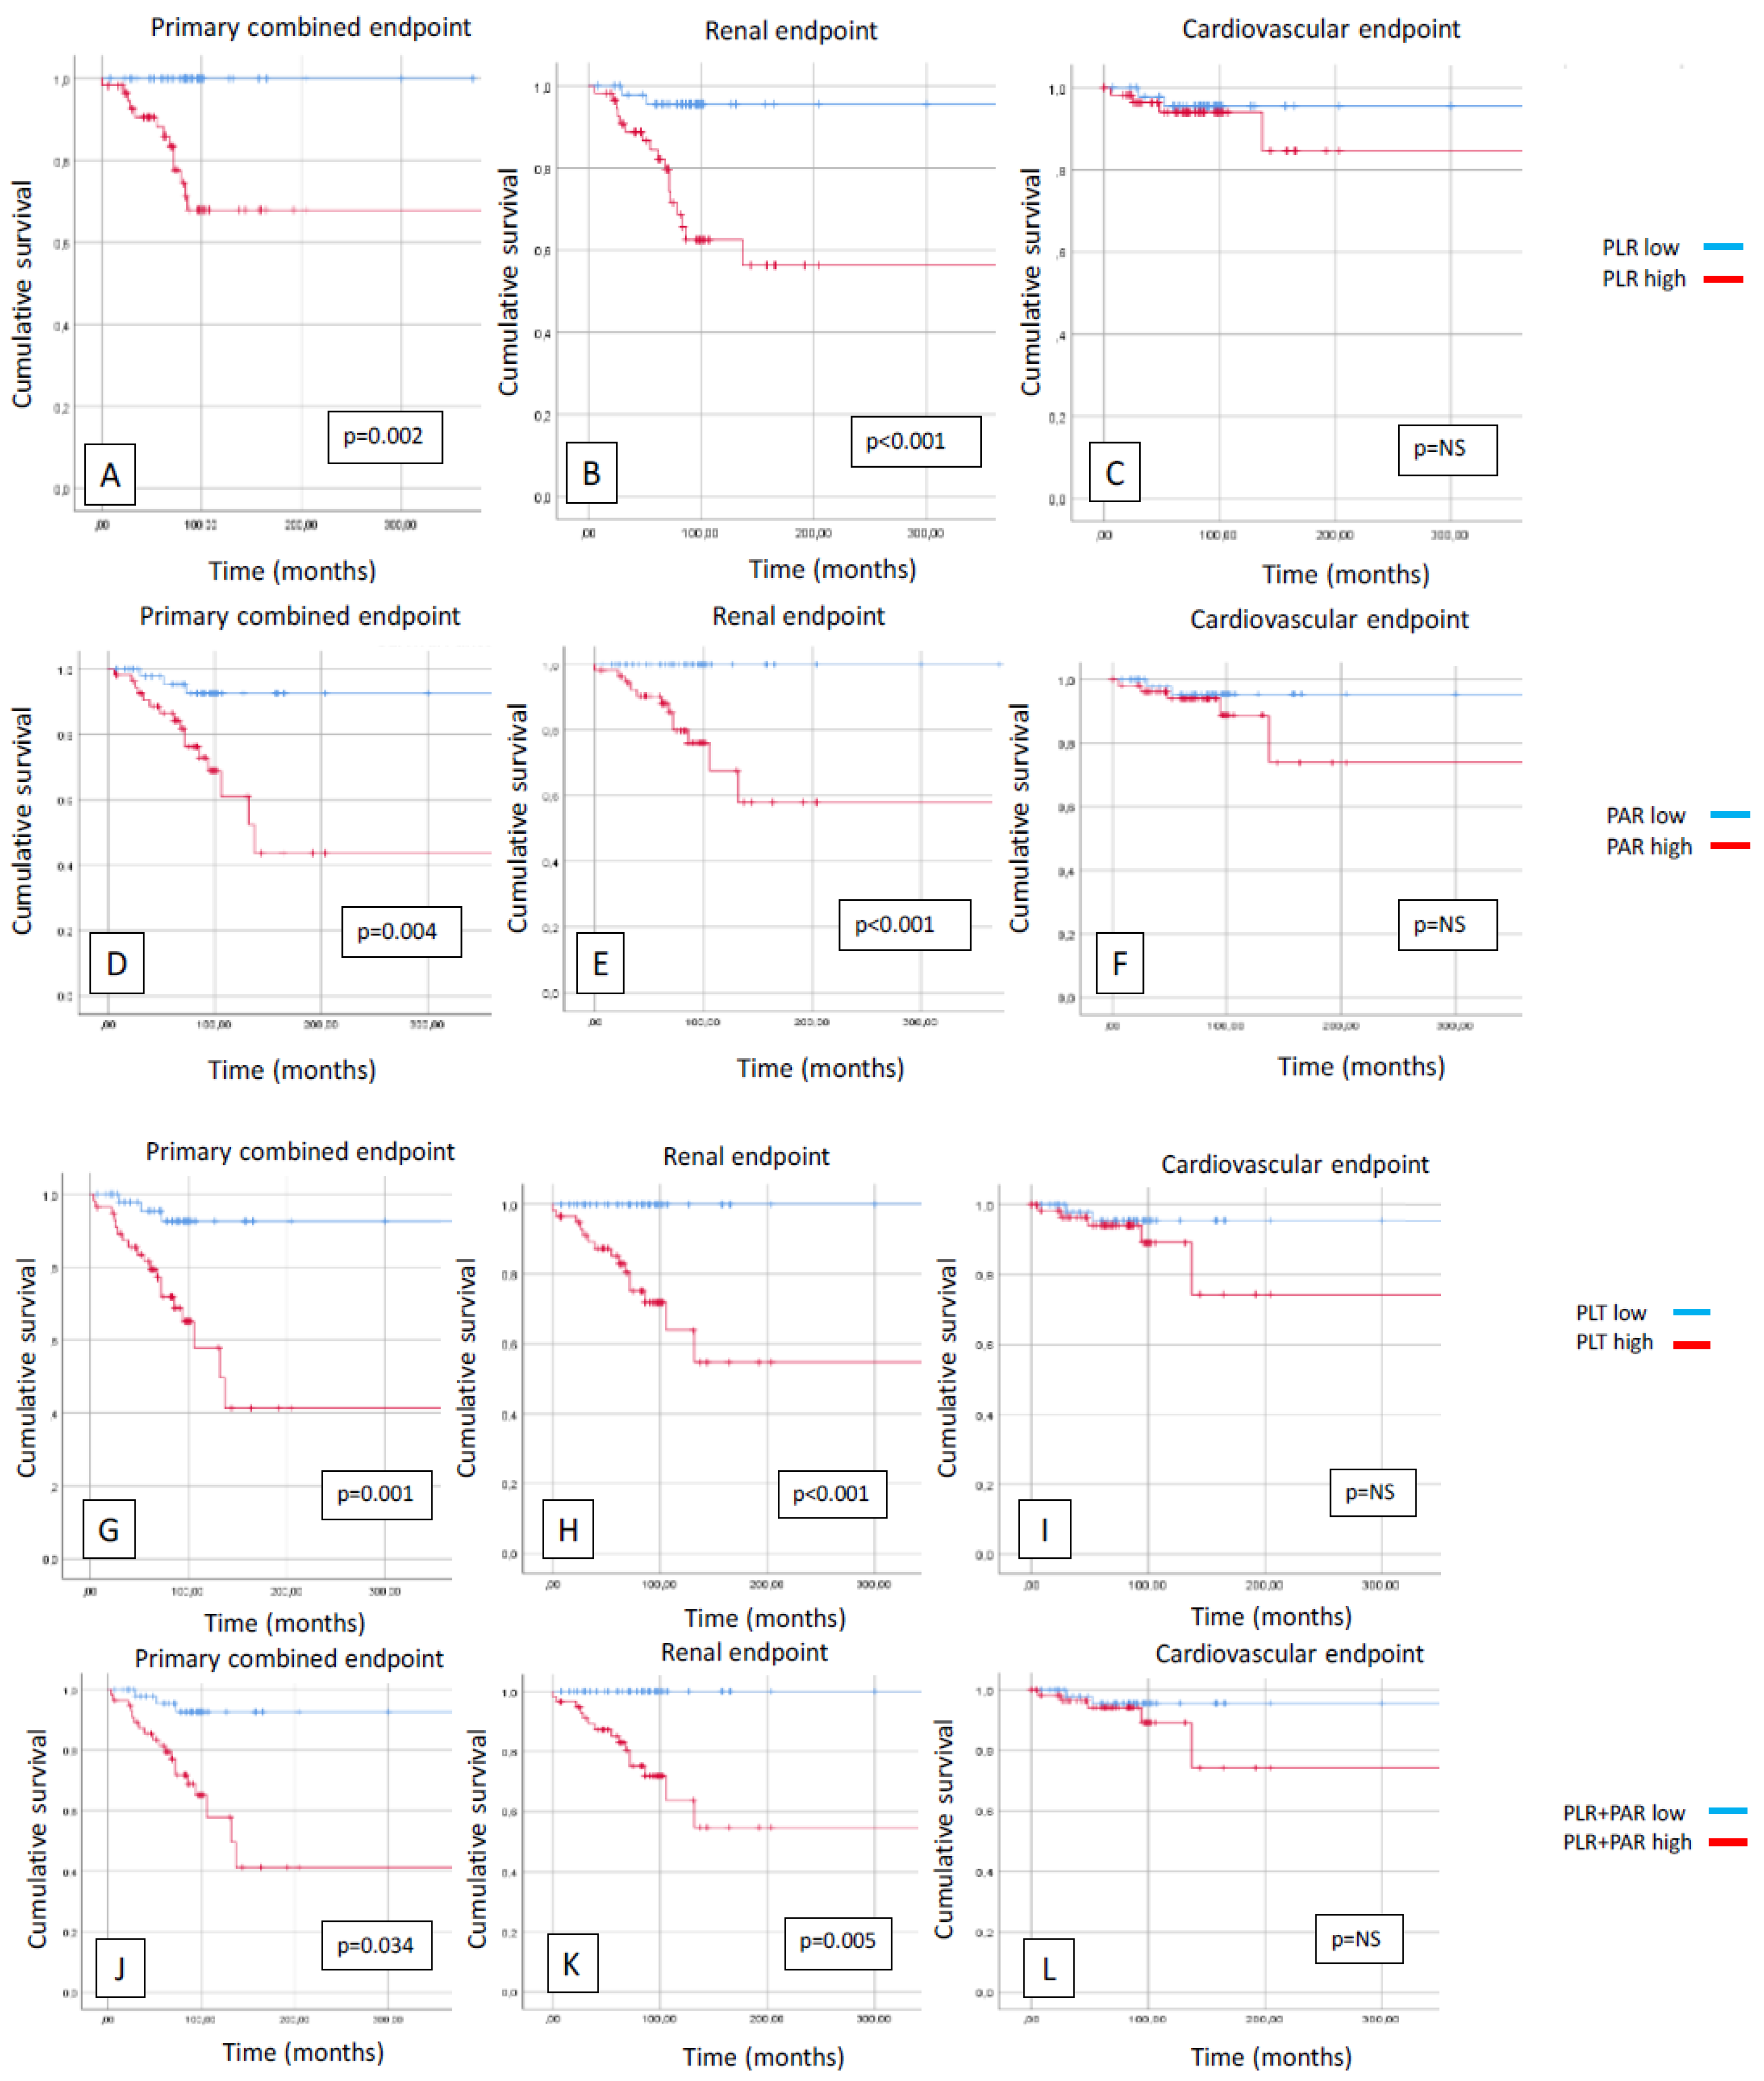
Figure 3.
Kaplan-Meier curves show primary combined (A), renal (B) and cardiovascular (C) endpoints in case of left ventricular hypertrophy (LVH) positive/negative and platelet-to-albumin ratio (PAR) high/low and primary combined (D), renal (E) and cardiovascular (F) endpoints in case of left ventricular hypertrophy (LVH) positive/negative and platelet-to-lymphocyte ratio (PLR) high/low.

Figure 4.
Kaplan-Meier curves show primary combined (A), renal (B) and cardiovascular (C) endpoints in case of metabolic syndrome (MetS) positive/negative and platelet-to-albumin ratio (PAR) high/low and primary combined (D), renal (E) and cardiovascular (F) endpoints in case of metabolic syndrome (MetS) positive/negative and platelet-to-lymphocyte ratio (PLR) high/low and.
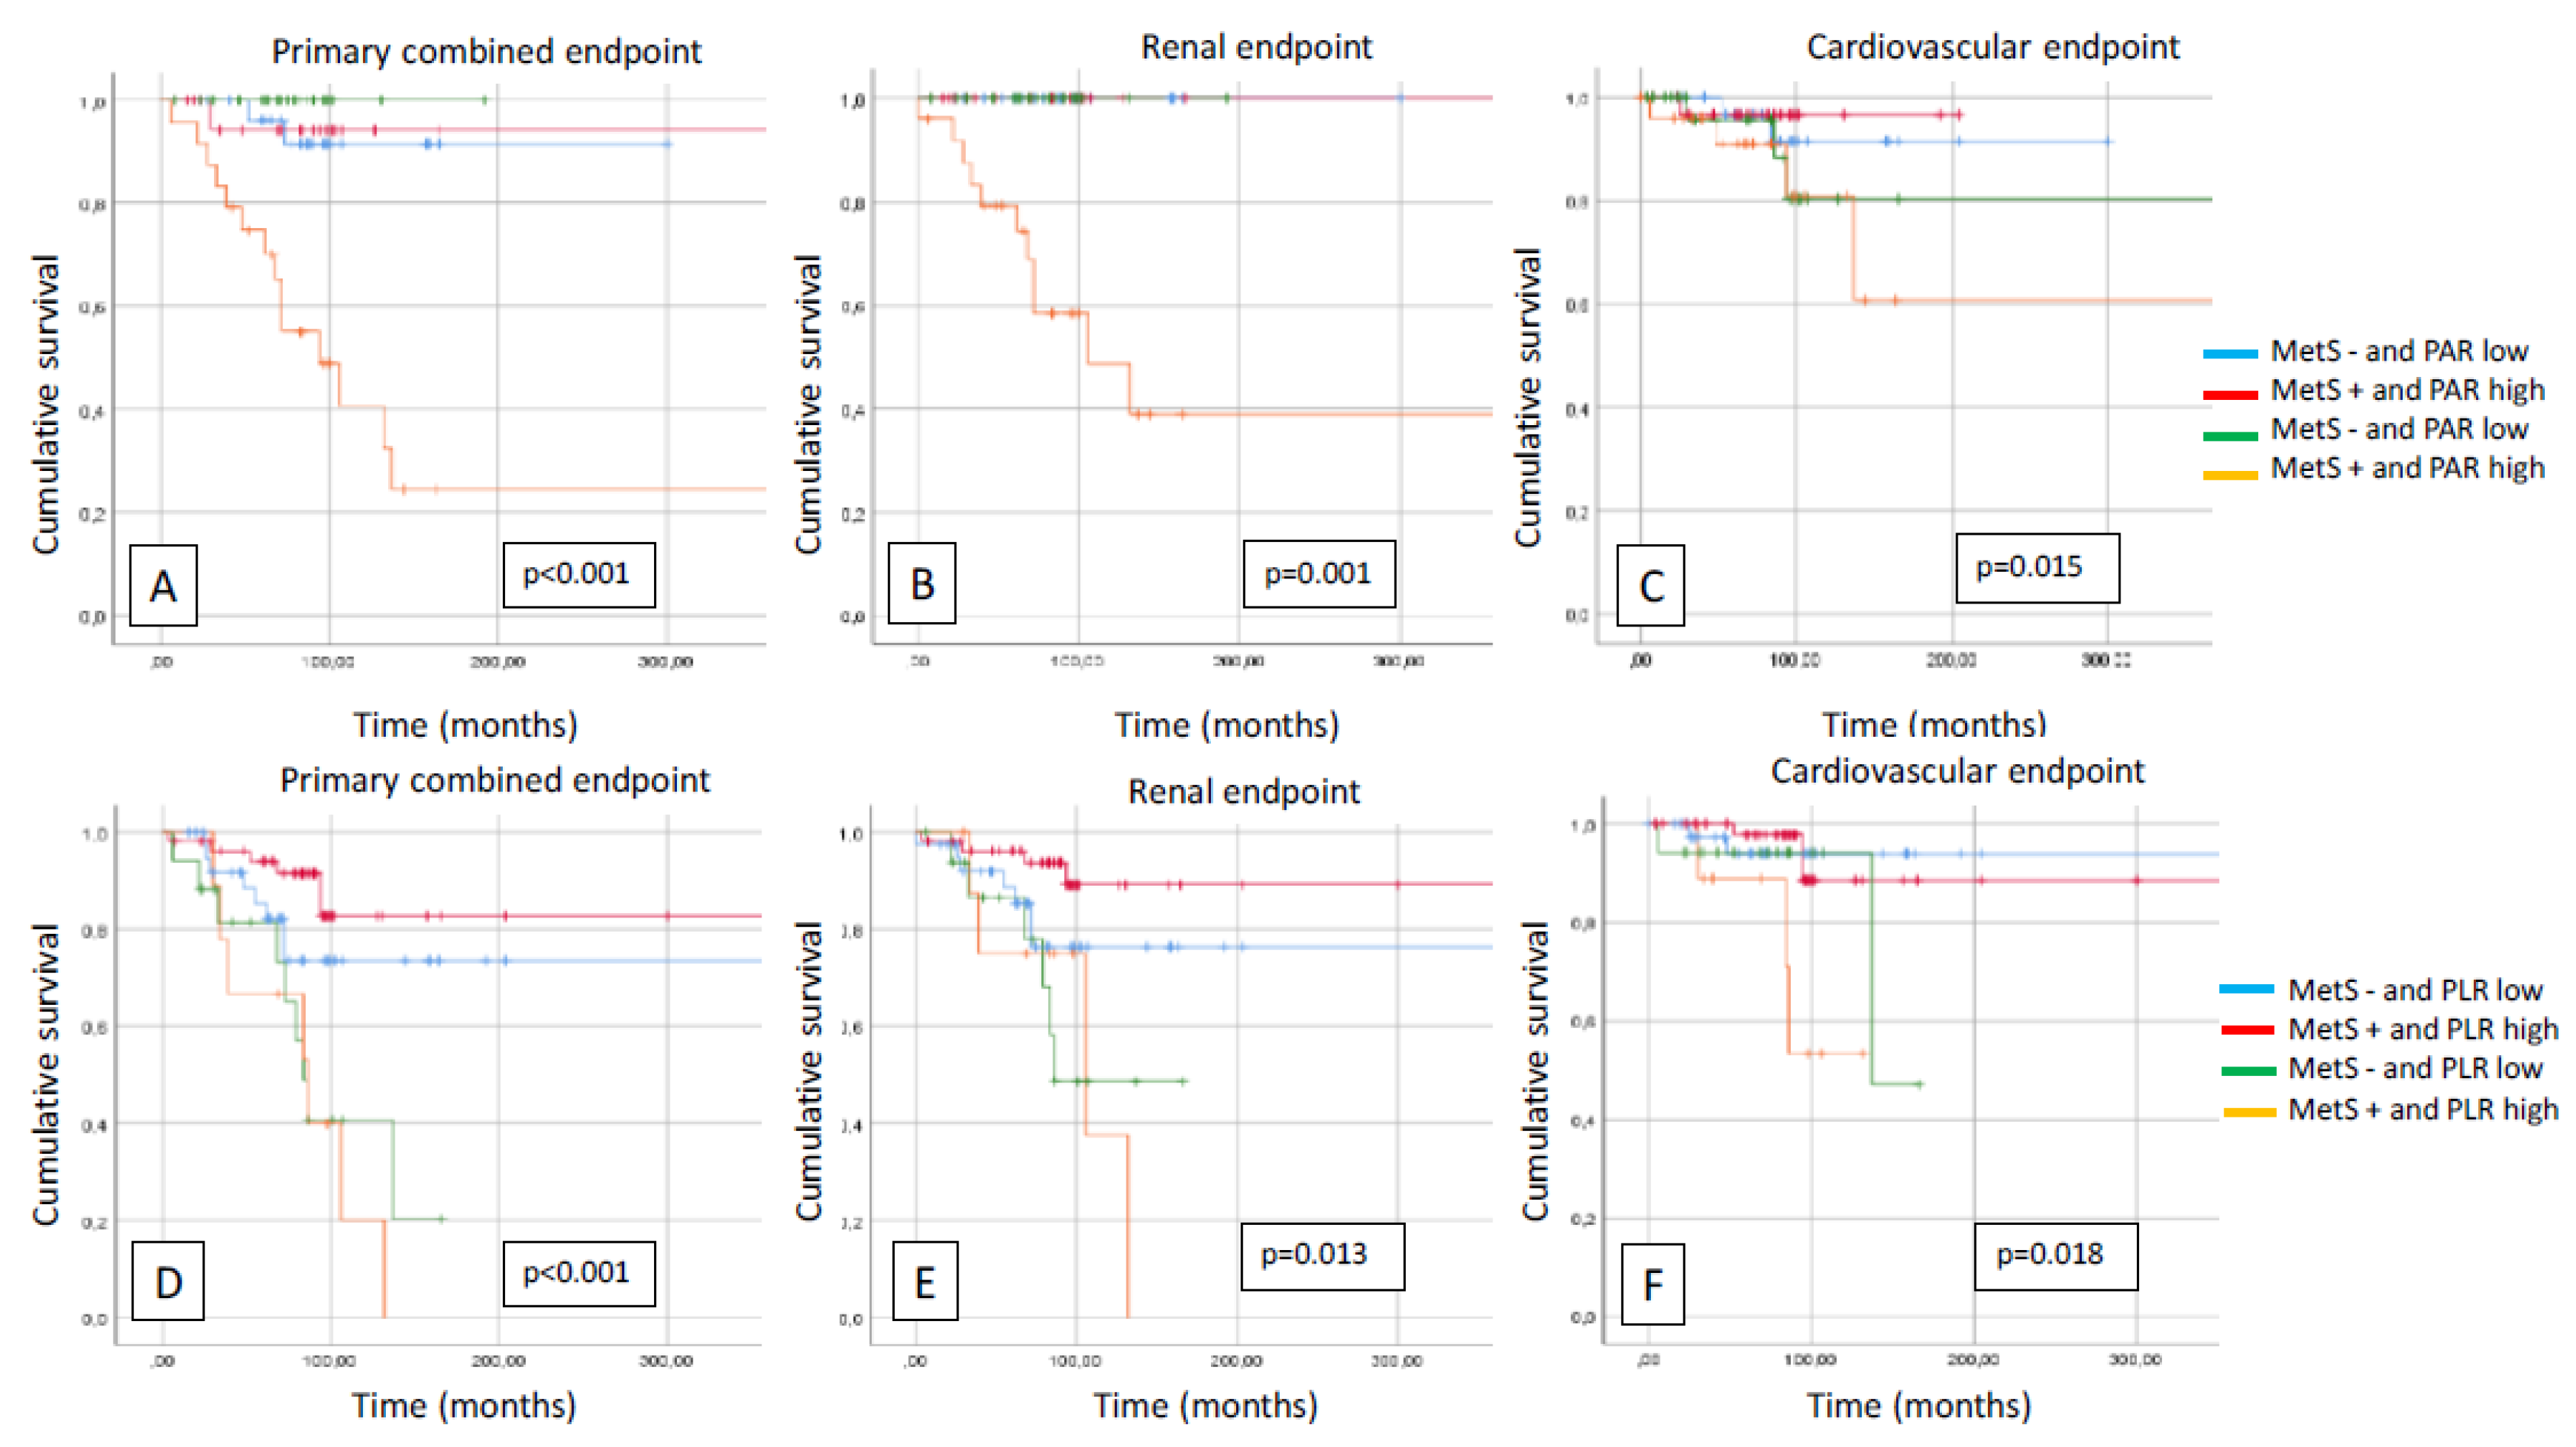

Table 1.
Baseline characteristics.
| Clinical data | IgAN patients (n=124) |
PAR high (n=61) |
PAR low (n=63) |
P |
| Man/woman (n/%) | 83/29 (74/26) | 48/13 (79/21) | 35/28 (55/45) | 0.004 |
| Age (year) | 43.7±13.5 | 43.6±11.7 | 43.9±11.2 | NS |
| Average systolic/diastolic RR (mmHg) | 124/74±14/9 | 127/75±15/9 | 120/73±11/8 | 0.003 |
| 24h pulse pressure (mmHg) | 49.6±10.7 | 52.2±12.8 | 47.1±7.7 | 0.012 |
| Diurnal index systolic (%) | 9.66±5.6 | 10.2±6.2 | 9.2±5.2 | NS |
| Metabolic parameters | ||||
| Hypertension (n, %) | 94 (84) | 51 (81) | 43 (70) | NS |
| BMI (kg/m2) | 26.6±4.6 | 26.7±4.5 | 26.5±4.7 | NS |
| Dyslipidemia (n, %) | 58 (52) | 32 (51) | 26 (43) | NS |
| Diabetes (n, %) | 30 (27) | 15 (24) | 15 (24) | NS |
| eGFR (ml/min/1,73m2) | 84.5±32.4 | 83.8±29.6 | 85.2±27.8 | NS |
| Duration of kidney disease (year) | 10.8±9.4 | 11.5±10 | 10±9 | NS |
| Smoking (n, %) | 21 (19) | 11 (17) | 10 (16) | NS |
| Metabolic syndrome (n, %) | 27 (24) | 14 (22) | 13 (21) | NS |
| Platelet related parameters | ||||
| PLR | 140.14±65.18 | 158.05±73.05 | 122.23±50.15 | 0.001 |
| PAR (G/g) | 5.78±1.89 | 7.12±1.64 | 4.41±0.89 | <0.001 |
| PLT (G/L) | 238.9±68.88 | 290±51.29 | 187.7±40.24 | <0.001 |
| Echocardiographic parameters | ||||
| LVEF (%) | 62.4±6.5 | 62.9±7.7 | 62.5±4.9 | NS |
| LVMI (g/m2) | 107.7±22.8 | 110.5±23.2 | 104.9±16.1 | 0.034 |
| LVM (g) | 204.4±51.4 | 239.0±48.8 | 194.9±44.0 | 0.028 |
| LVEDD (cm) | 5.09±0.4 | 4.93±0.39 | 5.05±0.41 | NS |
| DD (n/%) | 37 (47) | 24 (39) | 13 (21) | 0.025 |
| Pathological lesions | ||||
| M (n/%) | 52 (46) | 29 (46) | 23 (38) | NS |
| E (n/%) | 2 (2) | 1 (1.6) | 1 (1.6) | NS |
| S (n/%) | 22 (20) | 14 (22) | 8 (13) | NS |
| T (n/%) | 56 (50) | 27 (43) | 29 (47) | NS |
| C (n/%) | 28 (25) | 17 (27) | 11 (18) | NS |
| Laboratory results | ||||
| Hb (g/dL) | 13.6±1.53 | 13.6±1.54 | 13.7±1.56 | NS |
| MAU (mg/L) | 484.6±658.4 | 494.8±521.8 | 431.4±550.9 | NS |
| UA (umol/L) | 320.5±76.7 | 318.1±68.8 | 342.3±76.7 | NS |
| Total cholesterol (mmol/L) | 5.03±1.21 | 4.95±1.41 | 4.98±0.95 | NS |
| HDL cholesterol (mmol/L) | 1.28±0.51 | 1.23±0.36 | 1.31±0.64 | NS |
| TG (mmol/L) | 1.69±1.05 | 1.76±1.12 | 1.71±0.90 | NS |
| Therapy | ||||
| ACEI/ARB (n, %) | 65 (82) | 52 (82) | 50 (82) | NS |
| BB (n, %) | 22 (28) | 18 (28) | 13 (21) | NS |
| Statin (n, %) | 26 (33) | 18 (28) | 18 (46) | NS |
| CCB (n, %) | 22 (28) | 12 (19) | 18 (29) | NS |
BMI: body mass index; eGFR: estimated glomerular filtration rate; ACEI: angiotensin-converting enzyme inhibitor; ARB: angiotensin receptor blocker; BB:beta-blocker; CCB: calcium channel blocker; CAD: coronary artery disease; LVEF: left ventricular ejection fraction; LVMI: left ventricular mass index; LVM: left ventricular mass; DD: diastolic dysfunction; Hb: hemoglobin; MAU: urine albuminuria; UA: uric acid; HDL: high-density lipoprotein; TG: triglyceride.
Table 2.
Correlations.
| PAR | PLR | PLT | ||||
| r | p | r | p | r | p | |
| Gender | -0.273 | 0.001 | 0.031 | 0.367 | -0.201 | 0.013 |
| Age | -0.007 | 0.468 | -0.029 | 0.377 | -0.128 | 0.079 |
| Dyslipidemia | 0.073 | 0.209 | 0.005 | 0.477 | 0.084 | 0.176 |
| Obesity | -0.024 | 0.397 | -0.079 | 0.192 | -0.077 | 0.198 |
| HT | 0.068 | 0.227 | 0.077 | 0.198 | 0.073 | 0.211 |
| DM | -0.064 | 0.239 | -0.097 | 0.141 | -0.131 | 0.074 |
| eGFR (ml/min) | 0.056 | 0.266 | 0.143 | 0.057 | 0.158 | 0.040 |
| MAU (mg/L) | 0.048 | 0.296 | -0.165 | 0.033 | 0.038 | 0.336 |
| M | 0.081 | 0.205 | 0.056 | 0.283 | 0.084 | 0.194 |
| E | 0.033 | 0.367 | -0.041 | 0.334 | 0.045 | 0.319 |
| S | 0.161 | 0.047 | 0.001 | 0.497 | 0.087 | 0.185 |
| T | -0.016 | 0.435 | 0.019 | 0.423 | -0.058 | 0.274 |
| C | 0.053 | 0.292 | 0.069 | 0.237 | 0.061 | 0.264 |
| LVH | 0.003 | 0.486 | -0.178 | 0.025 | -0.130 | 0.077 |
PAR: platelet to albumin ratio; PLR: platelet to lymphocyte ratio; PLT: platelet; HT: hypertension; DM: diabetes mellitus; eGFR: estimated glomerular filtration rate; MAU: microalbuminuria; M: mesangial hypercellularity in histology; E: endocapillary hypercellularity; S: segmental glomerulosclerosis; T: tubular atrophy/interstitial fibrosis; C: cellular or fibrocellular crescents; LVH: left ventricular hypertrophy.
Table 3.
Uni-and multivariate regression analysis of PAR, PLR and PLT.
| UNIVARIATE ANALYSIS | MULTIVARIATE ANALYSIS | |||||||||||
| PAR | B | Std. errors | Beta | t | p | B | Std. errors | Beta | t | p | 95.0% CI for B lower |
95.0% CI for B upper |
| Gender | -1.098 | 0.348 | -0.273 | -3.153 | 0.002 | -1.264 | 0.418 | -0.315 | -3.025 | 0.003 | -2.094 | -0.434 |
| Age | -0.001 | 0.013 | -0.007 | -0.080 | 0.937 | 0.005 | 0.017 | 0.033 | 0.296 | 0.768 | -0.028 | 0.038 |
| Dyslipidemia | 0.278 | 0.342 | 0.073 | 0.812 | 0.418 | 0.351 | 0.395 | 0.092 | 0.888 | 0.377 | -0.434 | 1.136 |
| Obesity | -0.105 | 0.400 | -0.024 | -0.261 | 0.794 | 0.300 | 0.511 | 0.068 | 0.587 | 0.559 | -0.716 | 1.316 |
| HT | 0.297 | 0.395 | 0.068 | 0.751 | 0.454 | 0.669 | 0.510 | 0.152 | 1.313 | 0.193 | -0.344 | 1.683 |
| DM | -0.285 | 0.400 | -0.064 | -0.712 | 0.478 | -0.447 | 0.525 | -0.101 | -0.851 | 0.397 | -1.490 | 0.596 |
| eGFR | 0.003 | 0.005 | 0.056 | 0.627 | 0.532 | 0.008 | 0.006 | 0.156 | 1.298 | 0.197 | -0.004 | 0.021 |
| MAU | 0.001 | 0.001 | 0.048 | 0.537 | 0.592 | 0.001 | 0.001 | 0.063 | 0.607 | 0.545 | 0.001 | 0.002 |
| M | 0.305 | 0.369 | 0.081 | 0.828 | 0.410 | 0.470 | 0.391 | 0.124 | 1.200 | 0.233 | -0.308 | 1.247 |
| E | 0.655 | 1.921 | 0.033 | 0.341 | 0.734 | 0.845 | 1.979 | 0.043 | 0.427 | 0.670 | -3.087 | 4.777 |
| S | 0.760 | 0.451 | 0.161 | 1.687 | 0.095 | 0.848 | 0.518 | 0.180 | 1.638 | 0.105 | -0.180 | 1.876 |
| T | -0.041 | 0.249 | -0.016 | -0.163 | 0.871 | -0.070 | 0.291 | -0.027 | -0.240 | 0.811 | -0.648 | 0.508 |
| C | 0.230 | 0.418 | 0.053 | 0.550 | 0.583 | -0.028 | 0.459 | -0.006 | -0.061 | 0.951 | -0.940 | 0.883 |
| LVH | 0.012 | 0.346 | 0.003 | 0.034 | 0.973 | -0.115 | 0.453 | -0.030 | -0.253 | 0.801 | -1.015 | 0.785 |
| PLR | ||||||||||||
| Gender | 4.241 | 12.486 | 0.031 | 0.340 | 0.735 | 6.407 | 1.,524 | 0.046 | 0.441 | 0.660 | -22.442 | 35.256 |
| Age | -0.144 | 0.456 | -0.029 | -0.315 | 0.753 | 0.324 | 0.574 | 0.064 | 0.563 | 0.575 | -0.817 | 1.464 |
| Dyslipidemia | 0.695 | 11.831 | 0.005 | 0.059 | 0.953 | 2.324 | 13,736 | 0.018 | 0.169 | 0.866 | -24.961 | 29.608 |
| Obesity | -12.019 | 13.772 | -0.079 | -0.873 | 0.385 | -11.937 | 17.775 | -0.078 | -0.672 | 0.504 | -47.244 | 23.370 |
| HT | 11.600 | 13.622 | 0.077 | 0.852 | 0.396 | 29.988 | 17.724 | 0.199 | 1.692 | 0.094 | -5.218 | 65.195 |
| DM | -14.860 | 13.750 | -0.097 | -1.081 | 0.282 | -15.847 | 18.245 | -0.104 | -0.869 | 0.387 | -52.088 | 20.394 |
| eGFR | 0.261 | 0.164 | 0.143 | 1.590 | 0.114 | 0.341 | 0.222 | 0.186 | 1.535 | 0.128 | -0.100 | 0.782 |
| MAU | -0.017 | 0.009 | -0.165 | -1.850 | 0.067 | -0.020 | 0.011 | -0.195 | -1.864 | 0.066 | -0.041 | 0.001 |
| M | 7.295 | 12.696 | 0.056 | 0.575 | 0.567 | 10.273 | 13.604 | 0.079 | 0.755 | 0.452 | -16.750 | 37.297 |
| E | -28.315 | 65.985 | 0.041 | -0.429 | 0.669 | -56.341 | 68.790 | -0.082 | -0.819 | 0.415 | -192.983 | 80.302 |
| S | 0.135 | 15.688 | 0.001 | 0.009 | 0.993 | 14.410 | 17.985 | 0.089 | 0.801 | 0.425 | -21.315 | 50.134 |
| T | 1.671 | 8.540 | 0.019 | 0.196 | 0.845 | 12.890 | 10.112 | 0.146 | 1.275 | 0.206 | -7.196 | 32.976 |
| C | 10.334 | 14.354 | 0.069 | 0.720 | 0.473 | 4.195 | 15.947 | 0.028 | 0.263 | 0.793 | -27.481 | 35.871 |
| LVH | -23.245 | 11.713 | -0.178 | -1.985 | 0.049 | -27.749 | 15.746 | -0.213 | -1.762 | 0.081 | -59.026 | 3.528 |
| PLT | ||||||||||||
| Gender | -27.550 | 12.153 | -0.201 | -2.267 | 0.025 | -35.340 | 14.137 | -0.258 | -2.500 | 0.014 | -63.421 | -7.259 |
| Age | -0.639 | 0.449 | -0.128 | -1.422 | 0.157 | -0.318 | 0.559 | -0.063 | -0.568 | 0.571 | -1.428 | 0.793 |
| Dyslipidemia | 10.936 | 11.708 | 0.084 | 0.934 | 0.352 | 14.666 | 13.370 | 0.113 | 1.097 | 0.276 | -11.892 | 41.223 |
| Obesity | -11.645 | 13.680 | -0.077 | -0.851 | 0.396 | 2.471 | 17.301 | 0.016 | 0.143 | 0.887 | -31.896 | 36.838 |
| HT | 10.901 | 13.533 | 0.073 | 0.806 | 0.422 | 35.171 | 17.252 | 0.235 | 2.039 | 0.044 | 0.902 | 69.441 |
| DM | -19.848 | 13.602 | -0.131 | -1.459 | 0.147 | -19.807 | 17.759 | -0.131 | -1.115 | 0.268 | -55.083 | 15.469 |
| eGFR | 0.287 | 0.163 | 0.158 | 1.765 | 0.080 | 0.398 | 0.216 | 0.219 | 1.843 | 0.069 | -0.031 | 0.827 |
| MAU | 0.004 | 0.009 | 0.038 | 0.425 | 0.672 | 0.007 | 0.010 | 0.065 | 0.638 | 0.525 | -0.014 | 0.027 |
| M | 10.929 | 12.584 | 0.084 | 0.869 | 0.387 | 15.123 | 13.242 | 0.117 | 1.142 | 0.256 | -11.180 | 41.427 |
| E | 30.863 | 65.520 | 0.045 | 0.471 | 0.639 | 9.932 | 66.958 | 0.015 | 0.148 | 0.882 | -123.073 | 142.936 |
| S | 13.965 | 15.521 | 0.087 | 0.900 | 0.370 | 18.098 | 17.506 | 0.112 | 1.034 | 0.304 | -16.676 | 52.871 |
| T | -5.094 | 8.469 | -0.058 | -0.601 | 0.549 | 0.813 | 9.843 | 0.009 | 0.083 | 0.934 | -18.738 | 20.364 |
| C | 9.038 | 14.263 | 0.061 | 0.634 | 0.528 | -0.481 | 15.522 | -0.003 | -0.031 | 0.975 | -31.313 | 30.352 |
| LVH | -16.848 | 11.722 | -0.130 | -1.437 | 0.153 | -15.306 | 15.327 | -0.118 | -0.999 | 0.321 | -45.751 | 15.138 |
PAR: platelet to albumin ratio; PLR: platelet to lymphocyte ratio; PLT: platelet; HT: hypertension; DM: diabetes mellitus; eGFR: estimated glomerular filtration rate; MAU: microalbuminuria; M: mesangial hypercellularity in histology; E: endocapillary hypercellularity; S: segmental glomerulosclerosis; T: tubular atrophy/interstitial fibrosis; C: celluléar or fibrocellular crescents; LVH: left ventricular hypertrophy.
Table 4.
Multivariate Cox regression analysis with the primary combined, secondary renal and cardiovascular endpoints.
Table 4.
Multivariate Cox regression analysis with the primary combined, secondary renal and cardiovascular endpoints.
| Primary, combined endpoints | B | SE | Wald | df | p | Exp(B) | 95,0% CI for Exp(B) Lower | 95,0% CI for Exp(B) Upper |
| PLR | 0.009 | 0.004 | 4.903 | 1 | 0,027 | 1.009 | 1.001 | 1.017 |
| PAR | 0.734 | 0.465 | 2.489 | 1 | 0,115 | 2.084 | 0.837 | 5.188 |
| PLT | -0.019 | 0.013 | 2.048 | 1 | 0,152 | 0.981 | 0.957 | 1.007 |
| Gender | -2.021 | 0.778 | 6.740 | 1 | 0,009 | 0.133 | 0.029 | 0.609 |
| Age | 0.035 | 0.023 | 2.277 | 1 | 0,131 | 1.035 | 0.990 | 1.083 |
| Dyslipidemia | 1.186 | 0.564 | 4.421 | 1 | 0,036 | 3.273 | 1.084 | 9.885 |
| Obesity | 0.523 | 0.507 | 1.067 | 1 | 0,302 | 1.688 | 0.625 | 4.556 |
| HT | -1.262 | 1.171 | 1.162 | 1 | 0,281 | 0.283 | 0.029 | 2.810 |
| DM | -1.354 | 0.589 | 5.280 | 1 | 0,022 | 0.258 | 0.081 | 0.819 |
| eGFR (ml/min(1,73m2) | -0.015 | 0.010 | 2.556 | 1 | 0,110 | 0.985 | 0.966 | 1.003 |
| MAU (mg/L) | 0.001 | 0.001 | 1.567 | 1 | <0,001 | 1.001 | 1.001 | 1.002 |
| M | 0.509 | 0.527 | 0.933 | 1 | 0,334 | 1.663 | 0.593 | 4.668 |
| E | 9.206 | 528.463 | 0.001 | 1 | 0,986 | 9954.897 | 0.001 | 6781.987 |
| S | 0.457 | 0.646 | 0.500 | 1 | 0,479 | 1.579 | 0.445 | 5.604 |
| T | 0.660 | 0.657 | 1.009 | 1 | 0,315 | 1.936 | 0.534 | 7.022 |
| C | -.0.450 | 0.535 | 0.705 | 1 | 0,401 | 0.638 | 0.223 | 1.821 |
| LVH | -0.892 | 0.592 | 2.273 | 1 | 0,132 | 0.410 | 0.129 | 1.307 |
| Secondary renal endpoints | ||||||||
| PLR | 0.003 | 0.006 | 0.269 | 1 | 0,604 | 1.003 | 0.991 | 1.015 |
| PAR | 0.337 | 0.629 | 0.288 | 1 | 0,592 | 1.401 | 0.409 | 4.804 |
| Tct | -0.016 | 0.018 | 0.768 | 1 | 0,381 | 0.984 | 0.951 | 1.020 |
| Gender | 0.140 | 0.675 | 0.043 | 1 | 0,836 | 1.150 | 0.306 | 4.316 |
| Age | -0.008 | 0.027 | 0.079 | 1 | 0,778 | 0.992 | 0.941 | 1.047 |
| Dyslipidemia | 0.277 | 0.676 | 0.167 | 1 | 0,683 | 1.319 | 0.350 | 4.965 |
| Obesity | 0.458 | 0.608 | 0.569 | 1 | 0,451 | 1.581 | 0.481 | 5.204 |
| HT | -2.379 | 1.375 | 2.991 | 1 | 0,084 | 0.093 | 0.006 | 1.373 |
| DM | -0.332 | 0.769 | 0.187 | 1 | 0,666 | 0.717 | 0.159 | 3.236 |
| eGFR (ml/min/1,73m2) | -0.011 | 0.011 | 1.011 | 1 | 0,315 | 0.989 | 0.967 | 1.011 |
| MAU (mg/L) | 0.002 | 0.001 | 15.021 | 1 | 0,001 | 1.002 | 1.001 | 1.003 |
| M | 0.829 | 0.718 | 1.331 | 1 | 0,249 | 2.290 | 0.560 | 9.359 |
| E | 9.946 | 700.758 | 0.001 | 1 | 0,989 | 20870.393 | 0.001 | 12678.798 |
| S | -0.512 | 0.763 | 0.450 | 1 | 0,502 | 0.599 | 0.134 | 2.676 |
| T | -0.145 | 0.839 | 0.030 | 1 | 0,863 | 0.865 | 0.167 | 4.483 |
| C | 0.956 | 0.812 | 1.383 | 1 | 0,240 | 2.600 | 0.529 | 12.778 |
| LVH | -1.880 | 0.896 | 4.401 | 1 | 0,036 | 0.153 | 0.026 | 0.884 |
| Secondary cardiovascular endpoints | ||||||||
| PLR | 0.007 | 0.005 | 1.773 | 1 | 0,183 | 1.007 | 0.997 | 1.018 |
| PAR | 0.485 | 0.808 | 0.360 | 1 | 0,548 | 1.624 | 0.333 | 7.911 |
| PLT | 0.013 | 0.026 | 0.271 | 1 | 0,602 | 1.014 | 0.964 | 1.066 |
| Gender | -3.753 | 1.482 | 6.412 | 1 | 0,011 | 0.023 | 0.001 | 0.428 |
| Age | 0.137 | 0.064 | 4.595 | 1 | 0,032 | 1.147 | 1.012 | 1.300 |
| Dyslipidemia | 1.932 | 1.151 | 2.816 | 1 | 0,093 | 6.902 | 0.723 | 65.888 |
| Obesity | 1.271 | 1.294 | 0.965 | 1 | 0,326 | 3.563 | 0.282 | 44.995 |
| HT | -12.897 | 262.853 | 0.002 | 1 | 0,961 | 0.001 | 0.001 | 0.0001 |
| DM | -2.279 | 1.029 | 4.905 | 1 | 0,027 | 0.102 | 0.014 | 0.769 |
| eGFR (ml/min/1,73m2) | -0.039 | 0.028 | 2.009 | 1 | 0,156 | 0.962 | 0.911 | 1.015 |
| MAU (mg/L) | 0.001 | 0.001 | 0.234 | 1 | 0,629 | 1.000 | 0.999 | 1.002 |
| M | 1.180 | 1.175 | 1.010 | 1 | 0,315 | 3.256 | 0.326 | 32.551 |
| E | 8.193 | 1722.647 | 0.001 | 1 | 0,996 | 3615.569 | 0.001 | 2356.432 |
| S | 3.838 | 2.102 | 3.332 | 1 | 0,068 | 46.413 | 0.754 | 2858.117 |
| T | 1.857 | 1.825 | 1.035 | 1 | 0,309 | 6.407 | 0.179 | 229.266 |
| C | -0.912 | 1.041 | 0.766 | 1 | 0,381 | 0.402 | 0.052 | 3.094 |
| LVH | -1.799 | 1.252 | 2.063 | 1 | 0,151 | 0.165 | 0.014 | 1.926 |
PAR: platelet to albumin ratio; PLR: platelet to lymphocyte ratio; PLT: platelet; HT: hypertension; DM: diabetes mellitus; eGFR: estimated glomerular filtration rate; MAU: microalbuminuria; M: mesangial hypercellularity in histology; E: endocapillary hypercellularity; S: segmental glomerulosclerosis; T: tubular atrophy/interstitial fibrosis; C: celluléar or fibrocellular crescents; LVH: left ventricular hypertrophy.
Disclaimer/Publisher’s Note: The statements, opinions and data contained in all publications are solely those of the individual author(s) and contributor(s) and not of MDPI and/or the editor(s). MDPI and/or the editor(s) disclaim responsibility for any injury to people or property resulting from any ideas, methods, instructions or products referred to in the content. |
© 2024 by the authors. Licensee MDPI, Basel, Switzerland. This article is an open access article distributed under the terms and conditions of the Creative Commons Attribution (CC BY) license (http://creativecommons.org/licenses/by/4.0/).
Copyright: This open access article is published under a Creative Commons CC BY 4.0 license, which permit the free download, distribution, and reuse, provided that the author and preprint are cited in any reuse.


