Submitted:
10 January 2024
Posted:
11 January 2024
You are already at the latest version
Abstract
Clothing consumers mostly purchase, use, and dispose of clothing products in a linear business model. This approach pollutes the environment and causes economic and social crises in the ecosystems. This study evaluates the amount of generated postconsumer clothing waste (PCCW) and proposes recycling as a sustainable waste management approach. Data were collected to understand disposal behavior of consumers with 474 respondents selected from households in Bahir Dar city. The findings show that all the determinant factors on the PCCW generation level except religion were significant. The most frequently disposed type of clothing waste is jeans-trouser (51%). The CEBM was used to develop alternative products from a jeans-based clothing waste. The jean's fiber and fabric-reinforced composite materials were developed using unsaturated polyester resin as a sustainable way of PCCW management strategy. The shredded form fiber-reinforced composite was found to have a smoother surface than that of the chopped or cut fabric-reinforced composite. The product was characterized by physical and mechanical properties. The study can be further extended to the scope of the entire consumers in Ethiopia and alternative recyclable products can be studied.
Keywords:
recycling
; sustainability
; circular Economy
; post-consumer clothing waste
; business model
; composites
1. Introduction
The linear economy (LE) principle in the clothing industry is the Take-Use-Through philosophy which maximizes clothing waste generation [1] and encourages unethical waste disposal to landfills [2]. Hence, in response to these challenges, the concept of sustainability and circular economy (CE) has become the main issue during the last few decades. Sustainability is concerned with environmental, social, and economic aspects and it focuses on the satisfaction of the needs of the current generations without compromising the ability of future generations to meet their own needs [3,4]. The circular economy is the activity of reducing, reusing, and recycling during production, circulation, and consumption processes across the supply chains. Enhanced sustainable CE principle requires changes in the way companies generate value, understand, and do business where they interact within an ecosystem of different value chain actors shifting from a firm-centric to a network-centric operational business models that maximize value creation and resource utilization efficiency [5]. Hence, business model innovation (BMI) fundamental capability for companies moving toward sustainability [6]. The CE-oriented BM has a positive advantage in effective sustainability practices and recent research on it has grown rapidly in the last five years [7]. Next to the mining industry, the clothing industry has a huge industrial impact on sustainability [8,9]. Compared to the two waste generation phases (pre-consumer and during consumption) of the clothing industry, the PCCW contributes to a major environmental impact or pollution load [10]. It covers all categories of garments or household objects made from fabric that the consumer no longer uses [11]. Currently, consumers follow a linear economy (Take-Use-Through) strategy to manage the clothing products’ lifecycle [12]. Reports show that PCCW accounts for about 4% by weight of the total community solid waste which contributes up to 4mn tons per year [13]. Recent studies show that one truck of worn-out clothes is incinerated and disposed of in landfills every second from households [14]. This amount of waste contributes causes huge economic loss. Hence, the sustainability of the fast-fashion manufacturing system is risky for the sustainability of the ecosystem. Secondhand clothing imports from developed nations exacerbate the problem of postconsumer clothing waste amount for developing countries such as countries in sub-Saharan African countries like Ethiopia. Imported secondhand clothing is found in large quantities in Ethiopia [15,16] and most of them are made from polyester and petrochemical materials that account for 63% of textile fibers and cause carbon dioxide (CO2) emissions [17]. In the future, Ethiopia has the potential to have sufficient clothing manufacturers who will produce a sufficient amount of clothing for domestic consumers [18,19,20] and there is also faster population growth. Hence, it is expected that the PCCW disposal rate will increase as the consumption and disposal rate of domestic consumers increases. On the other hand, the awareness of consumers on the effect of PCCW disposal on sustainability. In addition to the environmental impact, the social aspect of sustainability is also affected. A sudden landslide incidence on 11, March 2017 in Addis Ababa (the capital city of Ethiopia) due to waste accumulated dumpsite ‘KOSHE’ caused the death of at least 113 lives indicating the social crisis related to PCCW disposal [21]. Hence, this study intends to evaluate the level of post-consumer clothing waste related to jean clothing products, develop a CE-based business model to find a sustainable way of waste disposal and evaluate the feasibility of the business model. Alternative products can be developed by recycling PCCW from jeans clothing for manufacturing of composite materials by the circular economy-based business model to ensure a sustainable clothing waste management approach for clothing industries and consumers in Ethiopia. Many studies have investigated post-consumer clothing waste disposal, where the demographic and psychographic factors of the respondents have been studied separately [22]. Most studies indicated that demographic characteristics are poor predictors of recycling behavior when studied alone. Psychographic variables, including the extent of environmental knowledge and concern and the interaction of attitudes, have been more successful in explaining recycling efforts, pro-environmental intention, and disposal behavior [23]. In this research, the consumer disposal rate is going to be studied by considering two factors together. Most researchers studied PCCW disposal practices and rate of disposal in the global context [12,13,24] and the African context [25,26,27]. But to effectively utilize the PCCW, CEBM should be designed so that garment manufacturers and consumers will gain economical and sustainable benefit from waste recycling. Alternative products or composites can be developed from the PCCW using epoxy resin [28]. Epoxy resin is too costly when compared with polyester resin. This research has investigated the possibilities of composite production from post-consumer denim waste using polyester resin instead of epoxy and some other silicon-based resins. There are various studies globally that show the amount of PCCW generation and its disadvantages to the ecosystem [14,29,30]. However, there are no studies on PCCW accounting and analysis in Ethiopian apparel industries. In this study, PCCW was identified as the most frequent type of clothing waste generated. This has been studied by developing a conceptual framework considering consumers’ demographic and psychographic variables. Demographic variables are age, gender, income, religion, geographical location, and level of education. Whereas, psychographic variables are attitude and perceived self-efficacy (PSE). The dependent variable is the level of PCCW, which is defined by the two factors of the consumer’s appearance. Based on the theoretical review of the literature, researchers formulated 8 hypotheses to be tested from the consumer survey. The first part of the study focused on consumer consumption and disposal behavior patterns related to their personal and psychological setup. Hypothesis 1: gender has a significant relation with PCCW; Hypothesis 2: age has a significant relation with PCCW; Hypothesis 3: educational level has a significant relation with PCCW Hypothesis 4: income level has a significant relation with PCCW; Hypothesis 5: religion has a significant relation with PCCW; Hypothesis 6: geographical area has a significant relation with PCCW; Hypothesis 7: attitude has a significant relation with PCCW; Hypothesis 8: PSE has a significant relation with PCCW. The preliminary study focuses on the waste generation amount and used as a basis for designing alternative products by recycling of post-consumer clothing wastes.
2. Results
Data Analysis and Interpretation
This section discusses the results and interprets the responses from the field. The next section deals with correlation and regression analysis. Finally, the composite product produced from PCCW has been characterized for mechanical, physical, and thermal characteristics, and the financial feasibility of the developed product in comparison to commercial products for similar applications has been discussed. The preliminary study was conducted to validate or pretest the survey instrument with a Cronbach’s alpha value of 0.724. The questionnaire was distributed to 520 residents of Bahir Dar City, and 474 were returned with a return rate of 92%, which is acceptable. The Cronbach’s alpha value of 0.788 is acceptable, and the survey method is valid [22]. The hypothesis tests showed that, except religion, all demographic and psychographic variables have a significant effect on the level of PCCW disposal behavior of respondents. The data was tested for normality, lack of symmetry, and collinearity using different statistical methods such as skewness, kurtosis, and PP-plot, and the result was acceptable. The variance inflation factor (VIF) was used to measure the multicollinearity of the variables in the regression analysis, and an acceptable result was obtained and presented in Table 1.
To ascertain the direction and strength of a linear association between two variables, Pearson’s correlation coefficient was utilized [32]. The degree of correlation is explained using the strength of correlation criteria. Table 2 presents the correlation between variables.
A robust association has been observed between gender and PCCW, with a value of 0.843. With a value of 0.861, age and PCCW likewise exhibit a very good association. Similarly, with a value of 0. 588, the connection between PCCW and level of education is modest. With a value of 0.834, income level and PSE exhibit a very strong correlation. Income level and PCCW demonstrate a very strong correlation of 0.904. Religion and PCCW exhibit a low correlation of 0.334. Geographical area and PCCW show a very strong correlation of 0.788. Attitude and PCCW exhibit a very strong correlation of 0.780. Finally, PSE and PCCW indicate a very strong correlation of 0.866. The significance test from one-way ANOVA analysis in Table 3 shows that the effect of the independent variables on the dependent variables is significant except for religion at p-value <0.05.
Regression analysis helps to estimate the values of the coefficients. The results are provided in Table 4.
Then standing on the coefficients table, the model is summarized as follows;
Where, γ = the dependent variable (PCCW)
α = Constant
c = Coefficient for independent variables
β = the independent variables
3. Discussion
3.1. Level of PCCW Generation Survey Result
Standing from the survey analysis results, it can be concluded that most of the respondents don’t have an awareness of the impact of simple PCCW disposals and their sustainability disadvantages (economic, environmental, and social impacts) as well as the CE concepts of recycling old clothes for the better sustainability experiences. Even if they have some awareness about it, their ability to act is very weak. Due to these and some other corresponding reasons, they practice simple disposals of PCCWs as garbage. According to the survey, the level of PCCW generated in the case city is, from the total of 474 respondents, 2536 clothes are taken per year, and from this amount, 1291 clothes are disposed of as garbage which is more than 50%. This shows that there is high availability of PCCW which could be a raw material for recycling-CE businesses. The most frequently disposable clothing type from the available clothing type of respondents is jean trousers PCCW. It is the highest rejected type of garment, more than 50% of respondents dispose of it as a PCCW.
Figure 1 shows the percentage of jeans trousers in the waste disposal of consumers and a recyclable product from a circular economy perspective can be considered it.
Composite manufacturing has specific procedures or steps to produce alternative commercial products that can be used for table tops or any other hard surfaces for furniture. For comparison, two composite samples are produced using different sizes and nature of denim trouser wastes. The composite sample-1 with 25mm thickness has been made from chopped denim fabric is presented in Figure 2. Similarly composite sample-2 with 15mm thickness has been made from sheared denim fiber thickness is presented in Figure 3.
3.2. Results of Mechanical Strengths, Physical and Thermal Property Tests
After producing the PCCW of a denim-based composite product, the products were prepared and cut into the required sample size using a jig saw and BOSCH electric circular wood cutter for testing different physical and mechanical properties such as tensile strength, flexural strength, compressive strength, thermal property, and water absorption according to their standard sample size.
The sample preparation procedures and required tools for various characterization tests such as tensile strength, flexural strength (modulus of rupture), compressive strength, thermal property, and water absorption are presented in Figure 4.
The tensile, flexural, and compression strengths are tested for a standardized sample was tested and the result is presented in Figure 5. The water absorbency test was conducted for both samples, the weight of composite sample-1 is 77.2g in dry weight and 91.9g weight in wet condition. Similarly, composite sample-2 is 20.5g in dry weight and 25.3g in wet weight. Then the calculated water absorbency becomes 7.3% and 23.4% respectively. The product made from chopped fabric reinforcement has a better capability to resist water than the product made from fiber reinforcement. The wicking property indicates the movement of moisture away from the body to the outer layer of the fabric so that it then has a better chance to evaporate away [33].
Thermal property analysis of the composite sample using DSC provides information on the thermal properties of the samples. Figure 6 shows the DSC test results of the two sample composite products at different temperatures.
3.3. Comparison of Commercial Products with Manufactured Composite Samples
The sample composite sample developed in this research has better mechanical and physical properties compared to a commercial material (MDF) used for similar end-use applications. The commercially available product has 30% water absorption, 20.7Mpa tensile strength, and compression strength of 35.1mpa [34].
3.4. Feasibility Study of Composite Manufacturing from PCCW
Feasibility analysis describes product/service feasibility, target market feasibility, technical/organizational feasibility, and financial feasibility [35]. The study used technical activities and processing steps to convert denim PCCWs in the CEBM which develops composite materials as alternative materials for furniture tops like table tops.
The technical procedures for developing a CEBM to recycle clothing wastes to produce alternative products with commercial feasibility are presented in Figure 7.
3.5. Financial Feasibility Analysis
Financial feasibility describes whether or not the product/service is fiscally viable. A financial feasibility report includes a cost/benefit analysis of the product. Financial feasibility focuses specifically on the financial aspects of the study. It assesses the economic viability of a proposed venture by evaluating the startup costs and operating expenses. The production cost is presented in Table 5.
The material cost of the sample composite manufactured from PCCW of jeans trousers is approximated as 15.1 USD. This section may be divided by subheadings. It should provide a concise and precise description of the experimental results, their interpretation, as well as the experimental conclusions that can be drawn.
4. Materials and Methods
4.1. General Research Methods
Researchers follow general research methodology as stated in Figure 8. The procedure starts with problem observation and identification and ends with the characterization of the sustainable product designed to reduce the PCCW disposal rate.
4.2. Data Collection Methods
Both primary and secondary data collection methods were used for data collection. A review of the literature was conducted to identify the types of clothing waste disposed of and the level of rejection. A 5-point Likert scale was used to design the questionnaire for primary data collection. Secondary data sources are textbooks and articles, the internet, websites, the environmental protection office of Bahir Dar city administration the sanitation and beautification office’s document, and the Bahir Dar city land administration. The data were analyzed using different statistical techniques to correlate the range of PCCW generation with the consumer’s different demographic and psychographic variables. Correlation analysis was used to analyze the data obtained from the respondents and the relationship between the independent and dependent variables of the study. The correlation coefficient was also calculated by using SPSS.
4.3. Sampling Techniques and Sample Sizes
The target populations for the survey were households in Bahir Dar city, the capital city of the Amhara regional state. The city includes sub-cities and other counties. Researchers used non-probability or judgmental sampling techniques. The required data has been collected from the selected households in Bahir Dar city. Demographic and psychographic factors are considered in the study. Multiple regression analysis was used to determine the effect of independent variables on the dependent variable. The regression analysis determines whether a group of variables together predicts a given dependent variable or not [36]. Reliability analysis in previous studies shows that 0.70 is a minimum acceptable level of Cronbach’s alpha coefficient. whereas, in some cases, 0.6 and 0.5 are also considered sufficient [21].
4.4. Composite Manufacturing Procedures
The list of materials required for composite manufacturing is provided in Table 6.
The composite has been developed by binding chopped fabric (1×1 inch) for sample composite 1 and fiber for sample composite 2 with polyester resin. A polyvinyl alcohol (PVA) mold-releasing agent was applied to the mold surface for easy removal of the composite from the mold surface after manufacturing. After preparing the polyester resin and hardener paste, the post-consumer denim fabric and fibers have been mixed with it for uniform dispersion within the composite. The mixture has been laid in the mold. Later, solidification or curing of the sample with sunlight follows. Finally, demolding the fabricated sample was performed.
The process flow of composite manufacturing procedures in this study is described in Figure 9.
4.5. Characterization of Composite Products
After the products had been developed, the mechanical and physical properties of the products were characterized. The mechanical properties of the composite have been measured using tensile, compression, and flexural strength measurements. According to Wang et al. [37], three specimen tests have been conducted for each type of product, and the average results were taken. A tensile strength test was performed using the ASTM D3039 standard, and a standard specimen size was used. The tensile tests produce a stress-strain diagram, which is used to determine the tensile modulus. The data is often used to specify a material and to design parts to withstand application force [38]. Similarly, the physical properties of water absorbency, compression strength, and thermal properties using differential scanning calorimetry (DSC) have been studied. For all types of tests, the required test standards, procedures, and standard specimen sizes were employed.
5. Conclusions
The fast fashion-oriented manufacturing approach and linear economy models are increasing the level of pot-consumer clothing waste from day to day. Manufacturers and retailers encourage their consumers to visit their shops periodically that increases the consumption of clothes and disposal frequency. Most research investigations show that the amount of clothing disposals becomes more than half of the consumption. The finding of the survey shows that consumers dispose 51% which is more than half of their clothing consumption. This amount of disposal ensures a constant supply of raw materials for composite manufacturing from the PCCW. The jeans trouser-based PCCWs are the most frequently disposed wastes which accounts over 50% of the total PCCW. It has the designed that circular economy business model uses the jeans-based PCCW collection up to composite production and characterization of composites. The level of awareness towards post-consumer clothing waste and its recycling in garment manufacturing sectors and households is low. Hence, awareness creation on recycling and sustainability practices will further strengthen reprocessing and reuse of the wastes. The government, garment manufacturing sectors, and consumers should work together for effective implementation of the circular economy business model for the beneficiation of post-consumer clothing wastes. The developed composite materials could be used for furnishing purposes and can be used as a alternative material to replace the MDF products. The feasibility of the composite sample is studied in evaluate its feasibility. The product, market, technical, and financial feasibility analysis shows the effectiveness of the composite samples. The circular economy-based business model creates an opportunity to reduce PCCWs. This study is limited to the scope of consumers in a regional city and the study can be further expanded to the scope of the entire consumers in Ethiopia and the alternative recyclable products can be studied.
Author Contributions
Conceptualization, Samuel Aysheshim, methodology, Samuel Aysheshim; software, Samuel Aysheshim.; validation, Shalemu Sharew Hailemariam and Samuel Aysheshim; formal analysis, Samuel Aysheshim; investigation, Samuel Aysheshim; resources, Samuel Aysheshim; data curation, Samuel Aysheshim; writing—original draft preparation, Samuel Aysheshim and Shalemu Sharew Hailemariam; writing—review and editing, Shalemu Sharew Hailemariam; visualization, Shalemu Sharew Hailemariam; Shalemu Sharew Hailemariam; project administration, Samuel Aysheshim; funding acquisition, Samuel Aysheshim. All authors have read and agreed to the published version of the manuscript.
Funding
This research was funded by BAHIR DAR UNIVERSITY, THESIS 2023.
Data Availability Statement
The raw data supporting the conclusions of this article will be made available by the authors on request.
Acknowledgments
We are grateful for Bahir Dar university for the funding and support for experimental facilities for this research.
Conflicts of Interest
The authors declare no conflicts of interest.
References
- Kaimal, M.M.; Sajoy, P.B. Circular Economy–A Paradigm Shift for Sustainable Development. Perspectives on Business Management & Economics 2020, 1, 132–141. [Google Scholar]
- Pui-Yan Ho, H.; Choi, T.M. A Five-R analysis for sustainable fashion supply chain management in Hong Kong: a case analysis. Journal of Fashion Marketing and Management: An International Journal 2012, 16, 161–175. [Google Scholar] [CrossRef]
- Arowoshegbe, A.O.; Emmanuel, U.; Gina, A. Sustainability and triple bottom line: An overview of two interrelated concepts. Igbinedion University Journal of Accounting 2016, 2, 88–126. [Google Scholar]
- Kuhlman, T.; Farrington, J. What is sustainability? Sustainability 2010, 2, 3436–3448. [Google Scholar] [CrossRef]
- Bocken, N.M.; De Pauw, I.; Bakker, C.; Van Der Grinten, B. Product design and business model strategies for a circular economy. Journal of industrial and production engineering 2016, 33, 308–320. [Google Scholar] [CrossRef]
- Pieroni, M.P.; McAloone, T.C.; Pigosso, D.C. Business model innovation for circular economy and sustainability: A review of approaches. Journal of Cleaner Production 2019, 215, 198–216. [Google Scholar] [CrossRef]
- Lopez, F.J.D.; Bastein, T.; Tukker, A. Business model innovation for resource-efficiency, circularity and cleaner production: What 143 cases tell us. Ecological Economics 2019, 155, 20–35. [Google Scholar] [CrossRef]
- Niinimäki, K.; Peters, G.; Dahlbo, H.; Perry, P.; Rissanen, T.; Gwilt, A. The environmental price of fast fashion. Nature Reviews Earth & Environment 2020, 1, 189–200. [Google Scholar]
- Cyamani, A. Disrupting the Linear Textile Model at the Community Scale. In State-of-the-Art Upcycling Research and Practice; Lecture Notes in Production, Engineering; Sung, K., Singh, J., Bridgens, B., Eds.; Springer: Switzerland, 2021; pp. 75–77. [Google Scholar]
- dos Santos, P.S.; Campos, L.M. Practices for garment industry’s post-consumer textile waste management in the circular economy context: an analysis on literature. Brazilian Journal of Operations & Production Management 2021, 18, 1–17. [Google Scholar]
- Sinha, P.; Dissanayke, D.G.K.; Abeysooriya, R.P.; Bulathgama, B.H.N. Addressing post-consumer textile waste in developing economies. The Journal of The Textile Institute 2022, 113, 1887–1907. [Google Scholar] [CrossRef]
- Bianchi, C.; Birtwistle, G. Consumer clothing disposal behavior: A comparative study. International journal of consumer studies 2012, 36, 335–341. [Google Scholar] [CrossRef]
- Domina, T.; Koch, K. Consumer reuse and recycling of post-consumer textile waste. Journal of Fashion Marketing and Management: An International Journal 1999, 3, 346–359. [Google Scholar] [CrossRef]
- Reichart, E. (Washington, USA); Drew, D. (Washington, USA). By the numbers: The economic, social and environmental impacts of “fast fashion”. 2019.
- Hoang, N.L. An Analysis of the Effects of Donating Secondhand Clothing to Sub-Saharan Africa. Bachelor of Arts, Scripps College: California, USA, 2015. [Google Scholar]
- Geremew, S.; Tizazu, B. Developing Anthropometric Standards for Ethiopian Clothing Design. International journal on recent & innovative trend in technology 2017, 3, 99–110. [Google Scholar]
- Shirvanimoghaddam, K.; Motamed, B.; Ramakrishna, S.; Naebe, M. Death by waste: Fashion and textile circular economy case. Science of The Total Environment 2020, 718, 1–26. [Google Scholar] [CrossRef]
- Khurana, K. An overview of textile and apparel business advances in Ethiopia. Research Journal of Textile and Apparel 2018, 22, 212–223. [Google Scholar] [CrossRef]
- Berg, A.; Hedrich, S.; Russo, B. East Africa: The next hub for apparel sourcing; McKinsey & Company, 2015. [Google Scholar]
- Pandit, P.; Nadathur, G.T.; Jose, S. Upcycled and low-cost sustainable business for value-added textiles and fashion. In Circular Economy in Textiles and Apparel processing, manufacturing and design; Subramanian Muthu, S.S., Ed.; Woodhead Publishing: Oxford, UK, 2019; pp. 95–122. [Google Scholar]
- Bujang, M.A.; Omar, E.D.; Baharum, N.A. A review on sample size determination for Cronbach’s alpha test: a simple guide for researchers. The Malaysian journal of medical sciences 2018, 25, 85–99. [Google Scholar] [CrossRef] [PubMed]
- Ajila, K.O. Analysis of post-consumer solid textile waste management among households in Oyo State of Nigeria. Journal of Environmental Protection 2019, 10, 1419–1435. [Google Scholar] [CrossRef]
- Žurga, Z.; Hladnik, A.; Forte Tavčer, P. Environmentally sustainable apparel acquisition and disposal behaviors among Slovenian consumers. Autex Research Journal 2015, 15, 243–259. [Google Scholar] [CrossRef]
- Nencková, L.; Pecáková, I.; Šauer, P. Disposal behavior of Czech consumers towards textile products. Waste Management 2020, 106, 71–76. [Google Scholar] [CrossRef]
- Omer, M.A. Effect of Household Solid Waste Management on Environmental Sanitation in Hargeisa, Somaliland. International Journal of Environmental Protection and Policy 2021, 9, 27–32. [Google Scholar] [CrossRef]
- Mohammed, A.; Elias, E. Domestic solid waste management and its environmental impacts in Addis Ababa city. Journal of Environment and Waste Management 2017, 4, 194–203. [Google Scholar]
- Viljoen, J.M.; Schenck, C.J.; Volschenk, L.; Blaauw, P.F.; Grobler, L. Household waste management practices and challenges in a rural remote town in the Hantam Municipality in the Northern Cape, South Africa. Sustainability 2021, 13, 5903. [Google Scholar] [CrossRef]
- Todor, M.P.; Kiss, I.; Cioata, V.G. Development of fabric-reinforced polymer matrix composites using bio-based components from post-consumer textile waste. Materials Today: Proceedings 2021, 45, 4150–4156. [Google Scholar] [CrossRef]
- Büyükaslan, E.; Jevsnik, S.; Kaloğlu, F.J.M.J. o. P.; Sciences, A. A sustainable approach to collect post-consumer textile waste in developing countries. Marmara Journal of Pure and Applied Sciences 2015, 27, 107–111. [Google Scholar] [CrossRef]
- Bukhari, M.A.; Carrasco-Gallego, R.; Ponce-Cueto, E. Developing a national programme for textiles and clothing recovery. Waste Management & Research 2018, 36, 321–331. [Google Scholar]
- Rumsey, D.J. How to interpret a correlation coefficient r. Statistics for dummies 2016, 26, 1–2. [Google Scholar]
- Achim, N.; Abd Razak, N. Assinteressing Intercultural Communication Competency and Health Communication. Proceedings of International Conference of Social and Humanities, IPEDR 2012; Volume 57, pp. 144–147. [Google Scholar]
- Gong, W.; Wang, X.; Yang, W.; Zhou, J.; Han, X.; Dickey, M.D.; Wang, H. Wicking–polarization-induced water cluster size effect on triboelectric evaporation textiles. Advanced Materials 2021, 33, 1–12. [Google Scholar] [CrossRef] [PubMed]
- Kowaluk, G. Machining processes for wood-based composite materials. In Machining Technology for Composite Materials; Hocheng H.; Woodhead Publishing: Oxford, UK, 2012; pp. 412–425. [Google Scholar]
- Berry, G.R. Feasibility analysis for the new venture nonprofit enterprise. New England Journal of Entrepreneurship 2017, 20, 52–70. [Google Scholar] [CrossRef]
- El Aissaoui, O.; El Alami El Madani, Y.; Oughdir, L.; Dakkak, A.; El Allioui, Y. A multiple linear regression-based approach to predict student performance. In Proceedings of the International Conference on Advanced Intelligent Systems for Sustainable Development, Morocco, 8–11 July 2019; 2019. [Google Scholar]
- Wang, S.; Zhang, T.; Zhang, X.; Ge, S.; Fan, W. Development of 3D needled composite from denim waste and polypropylene fibers for structural applications. Construction and Building Materials 2022, 314, 125583. [Google Scholar] [CrossRef]
- Razali, N.; Sultan, M.T.H.; Jawaid, M.; Md Shah, A.U.; Safri, S.N.A. Mechanical Properties of Flax/Kenaf Hybrid Composites. In Structural Health Monitoring System for Synthetic, Hybrid and Natural Fiber Composites. Composites Science and Technology; Jawaid, M., Hamdan, A., Hameed Sultan, M.T., Eds.; Springer: Singapore, 2021; pp. 177–194. [Google Scholar]
Figure 1.
Frequency of disposal for different products.
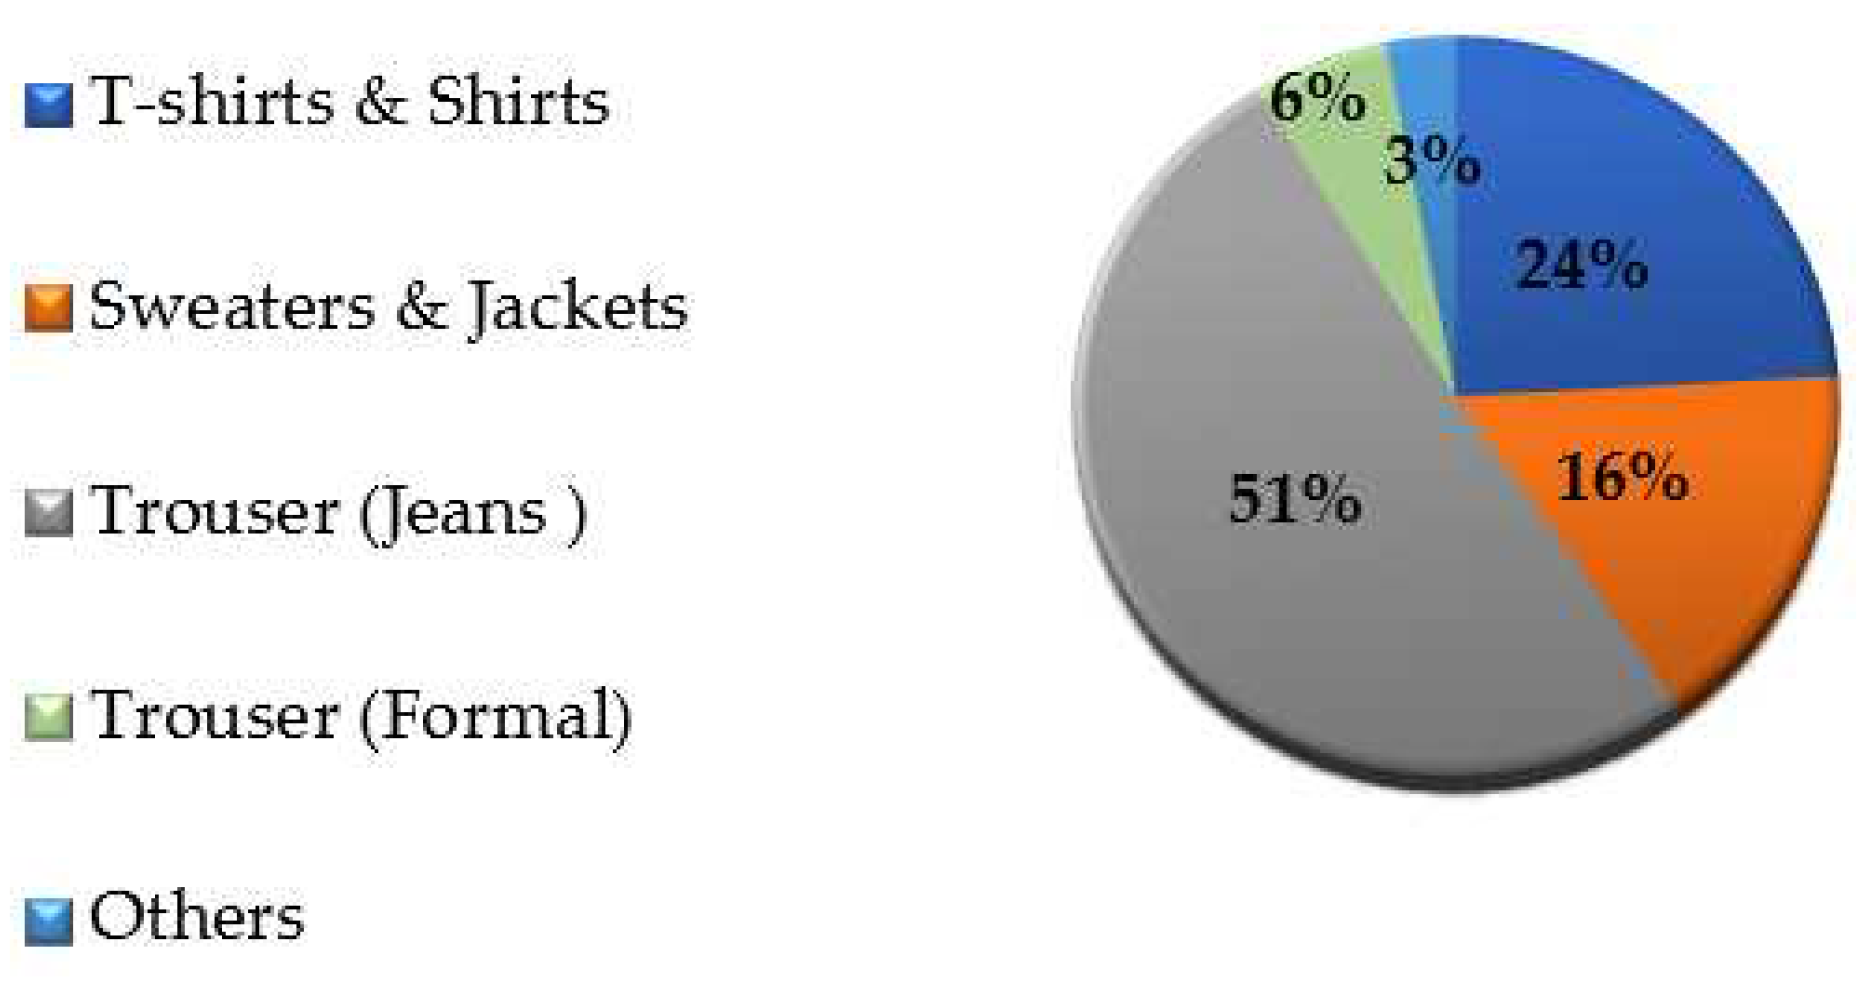
Figure 2.
Production steps for composite sample 1.
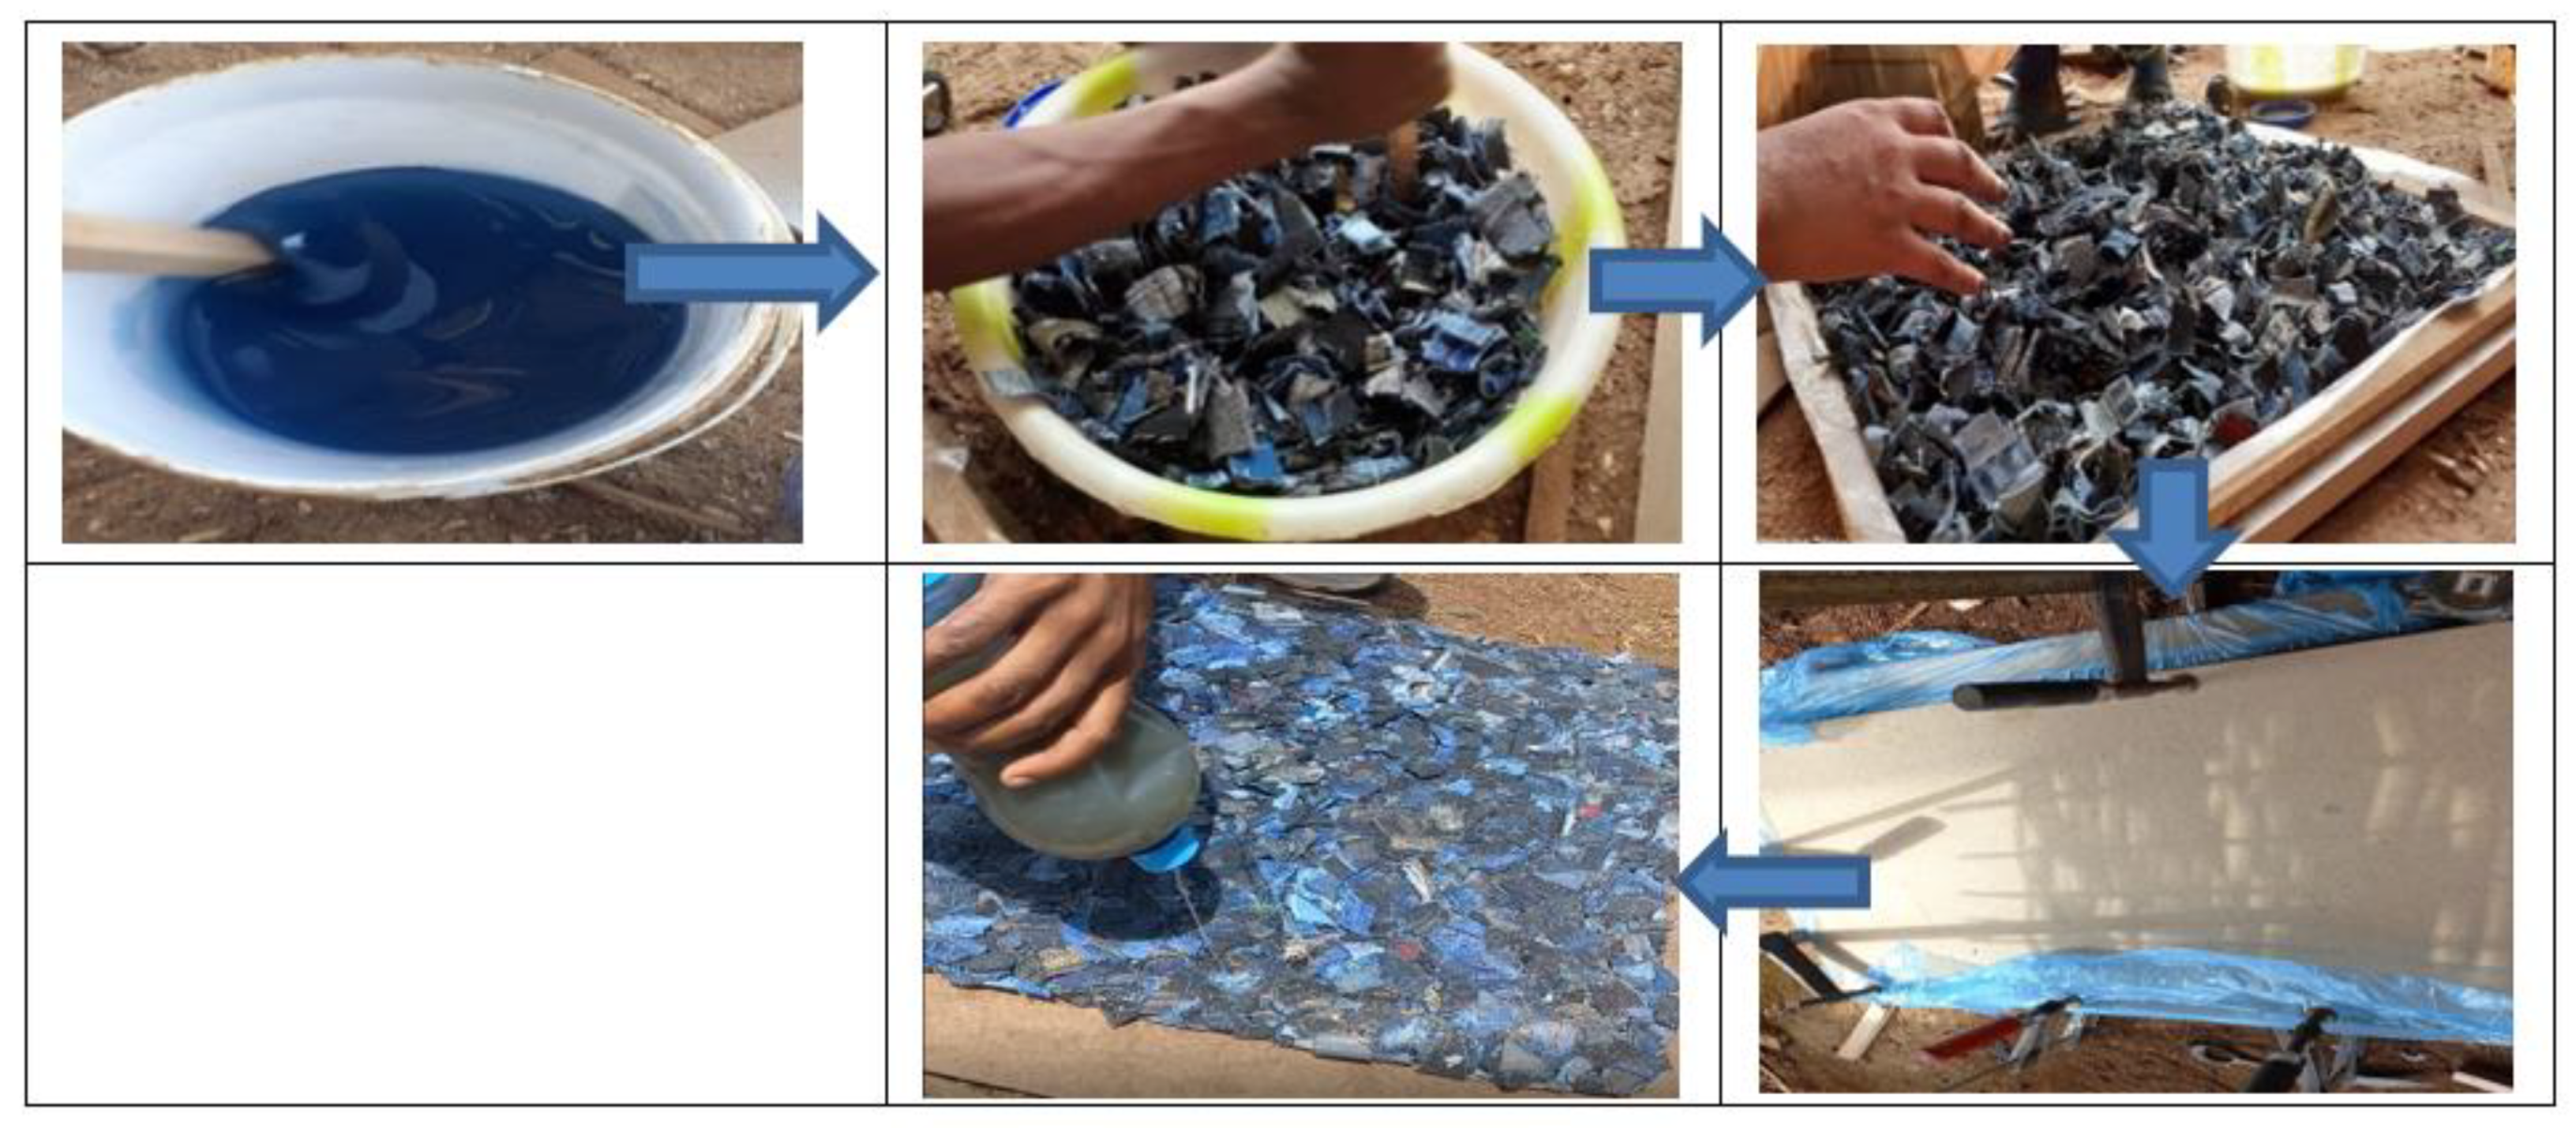
Figure 3.
Production steps for composite sample 2.
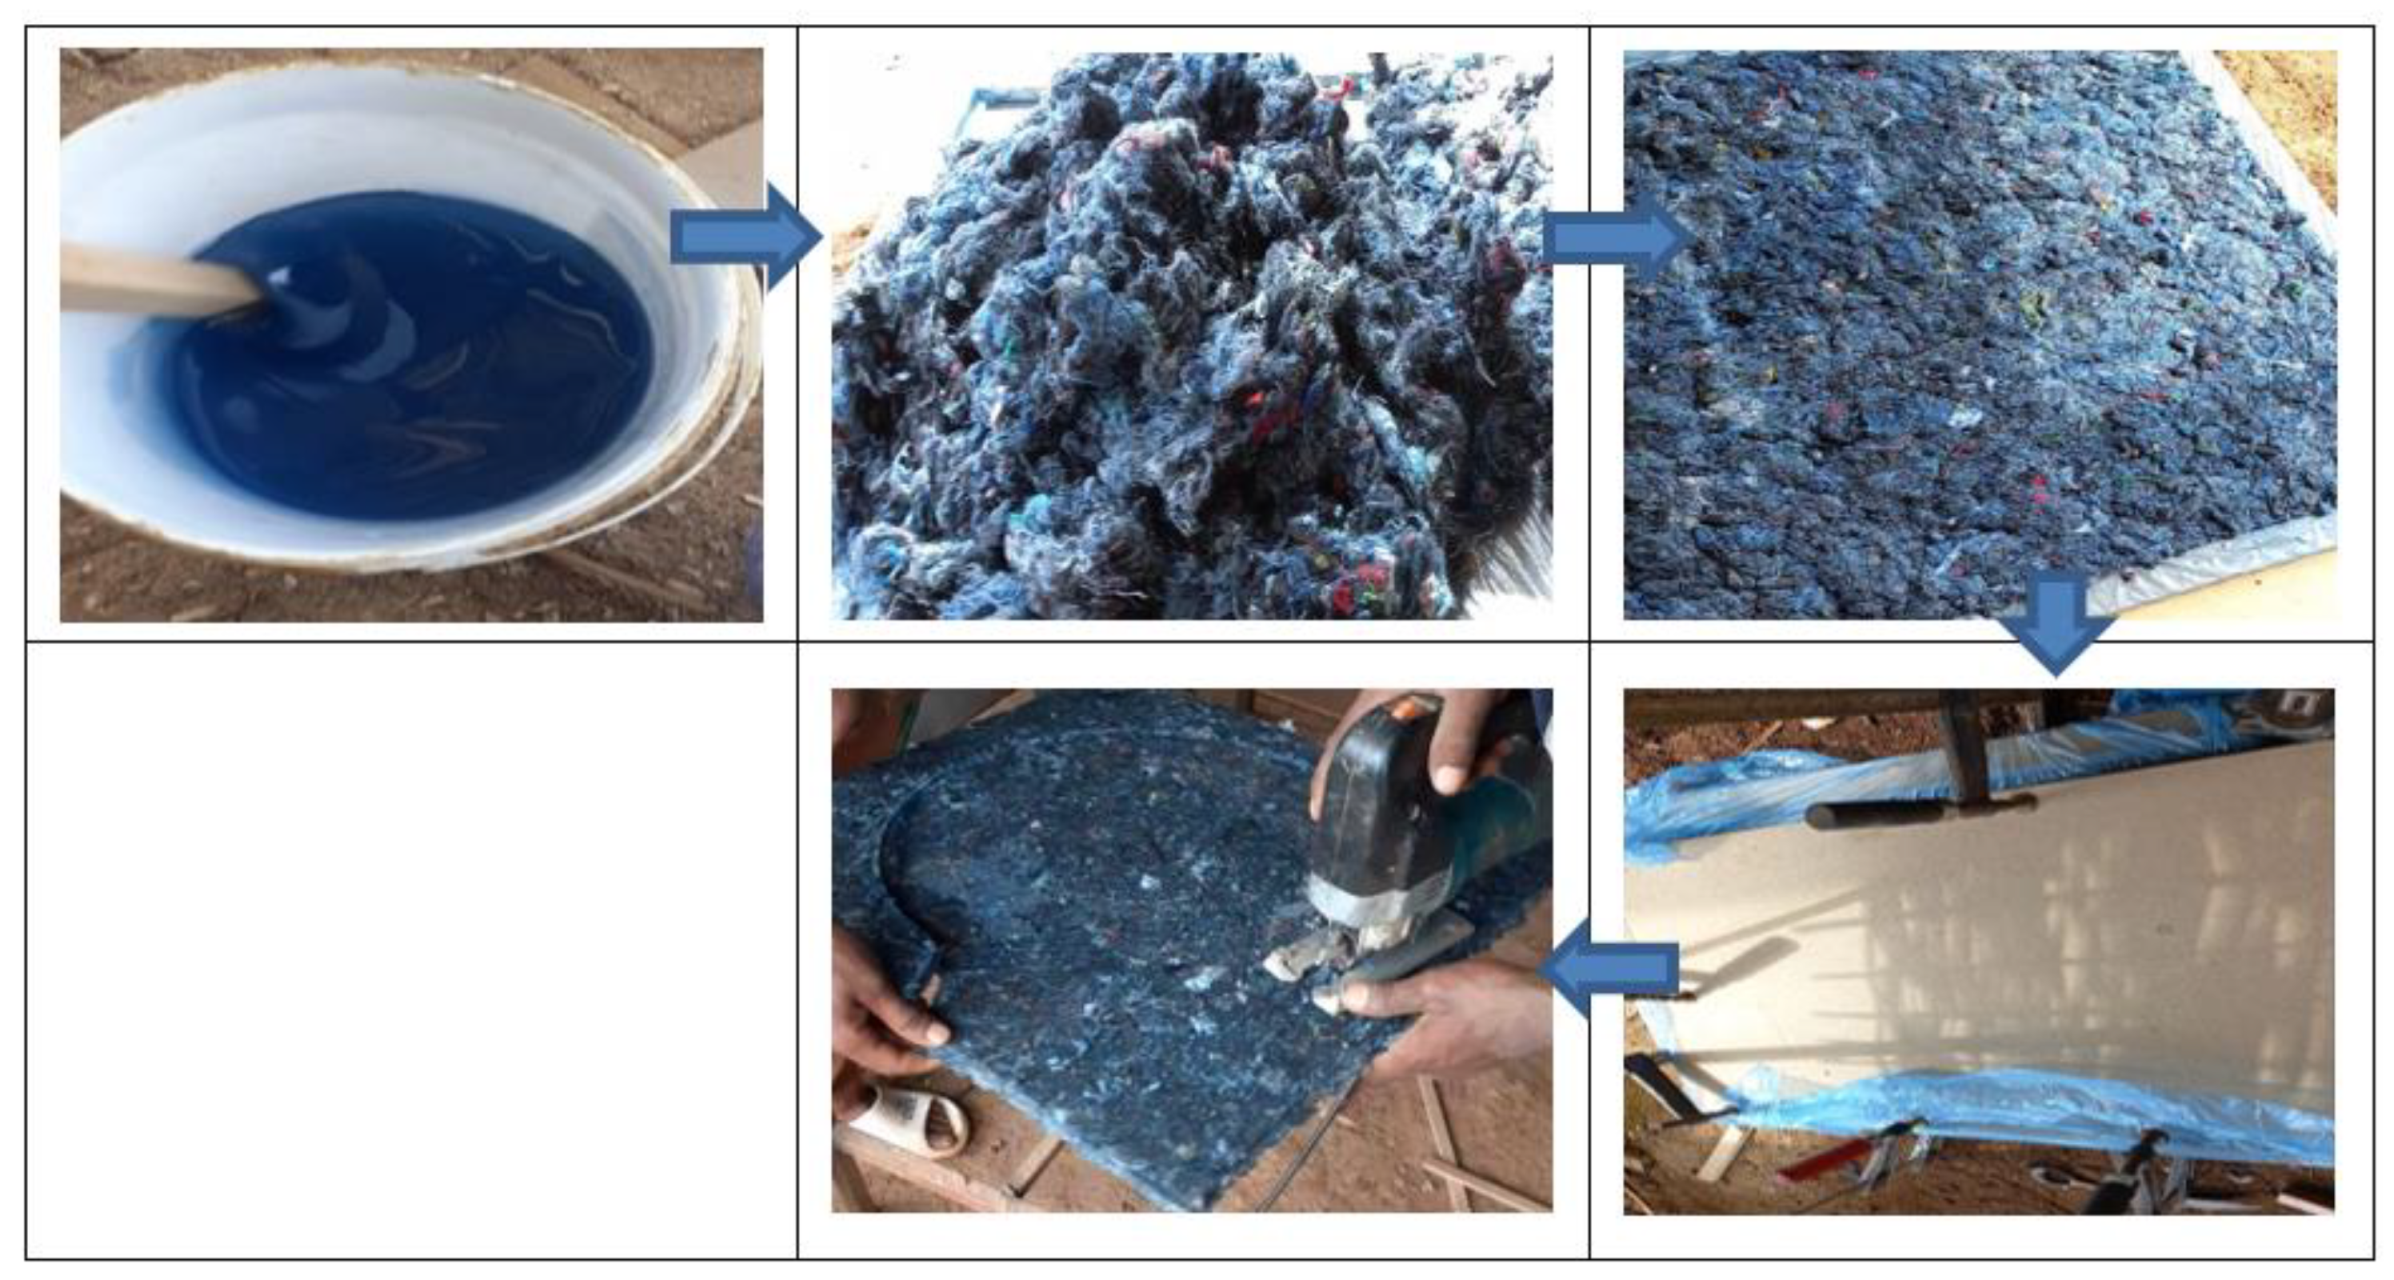
Figure 4.
Test sample preparation for characterization of composite samples.
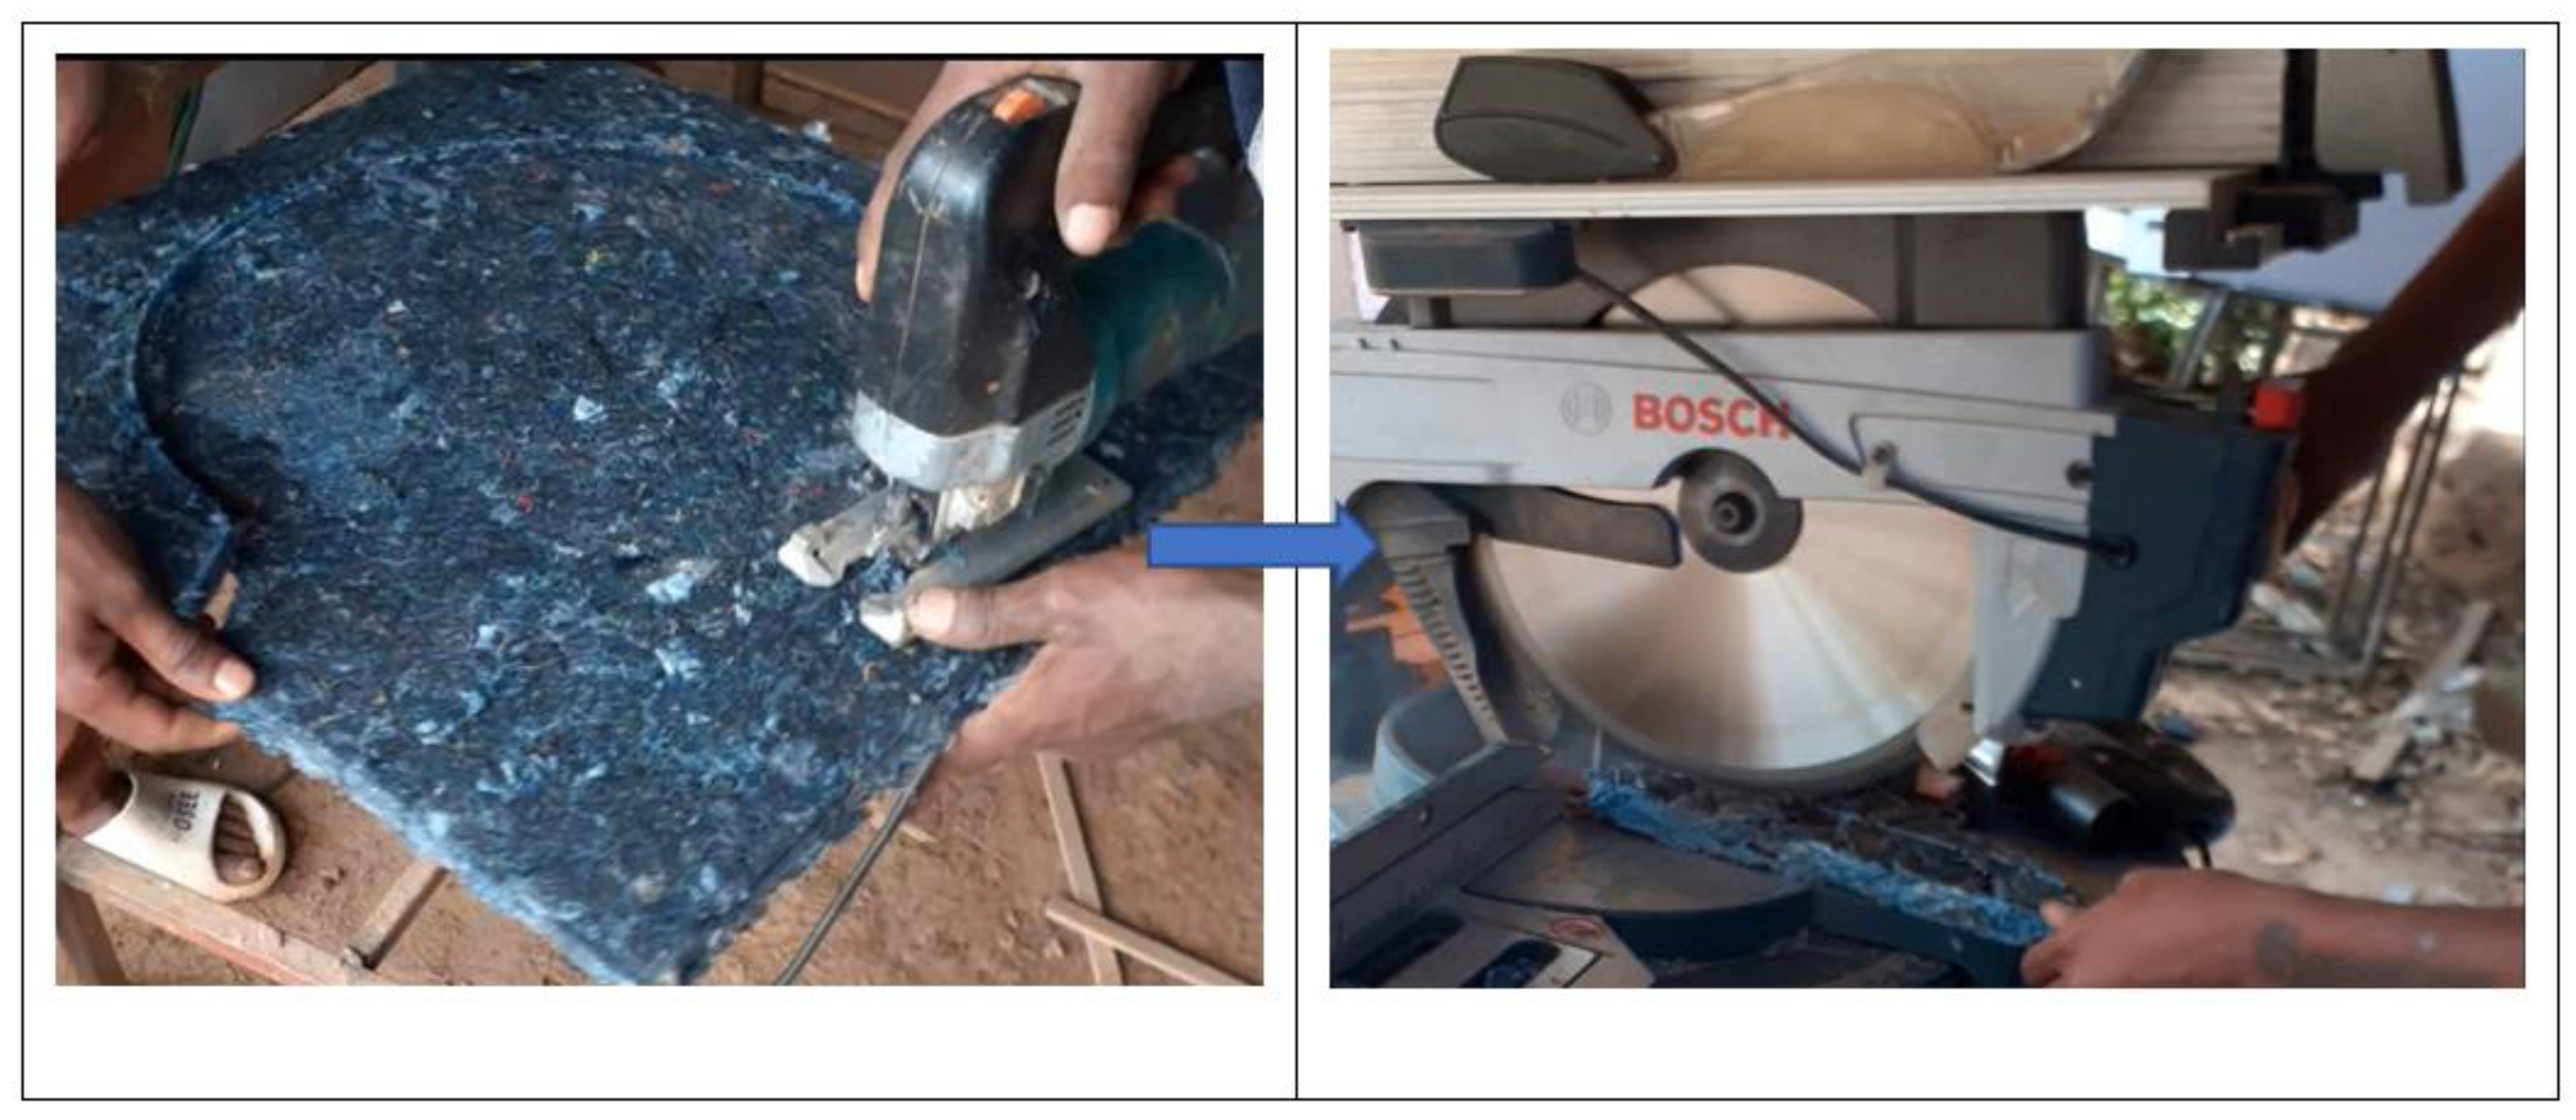
Figure 5.
Tensile, compressive, and flexural strength test results.
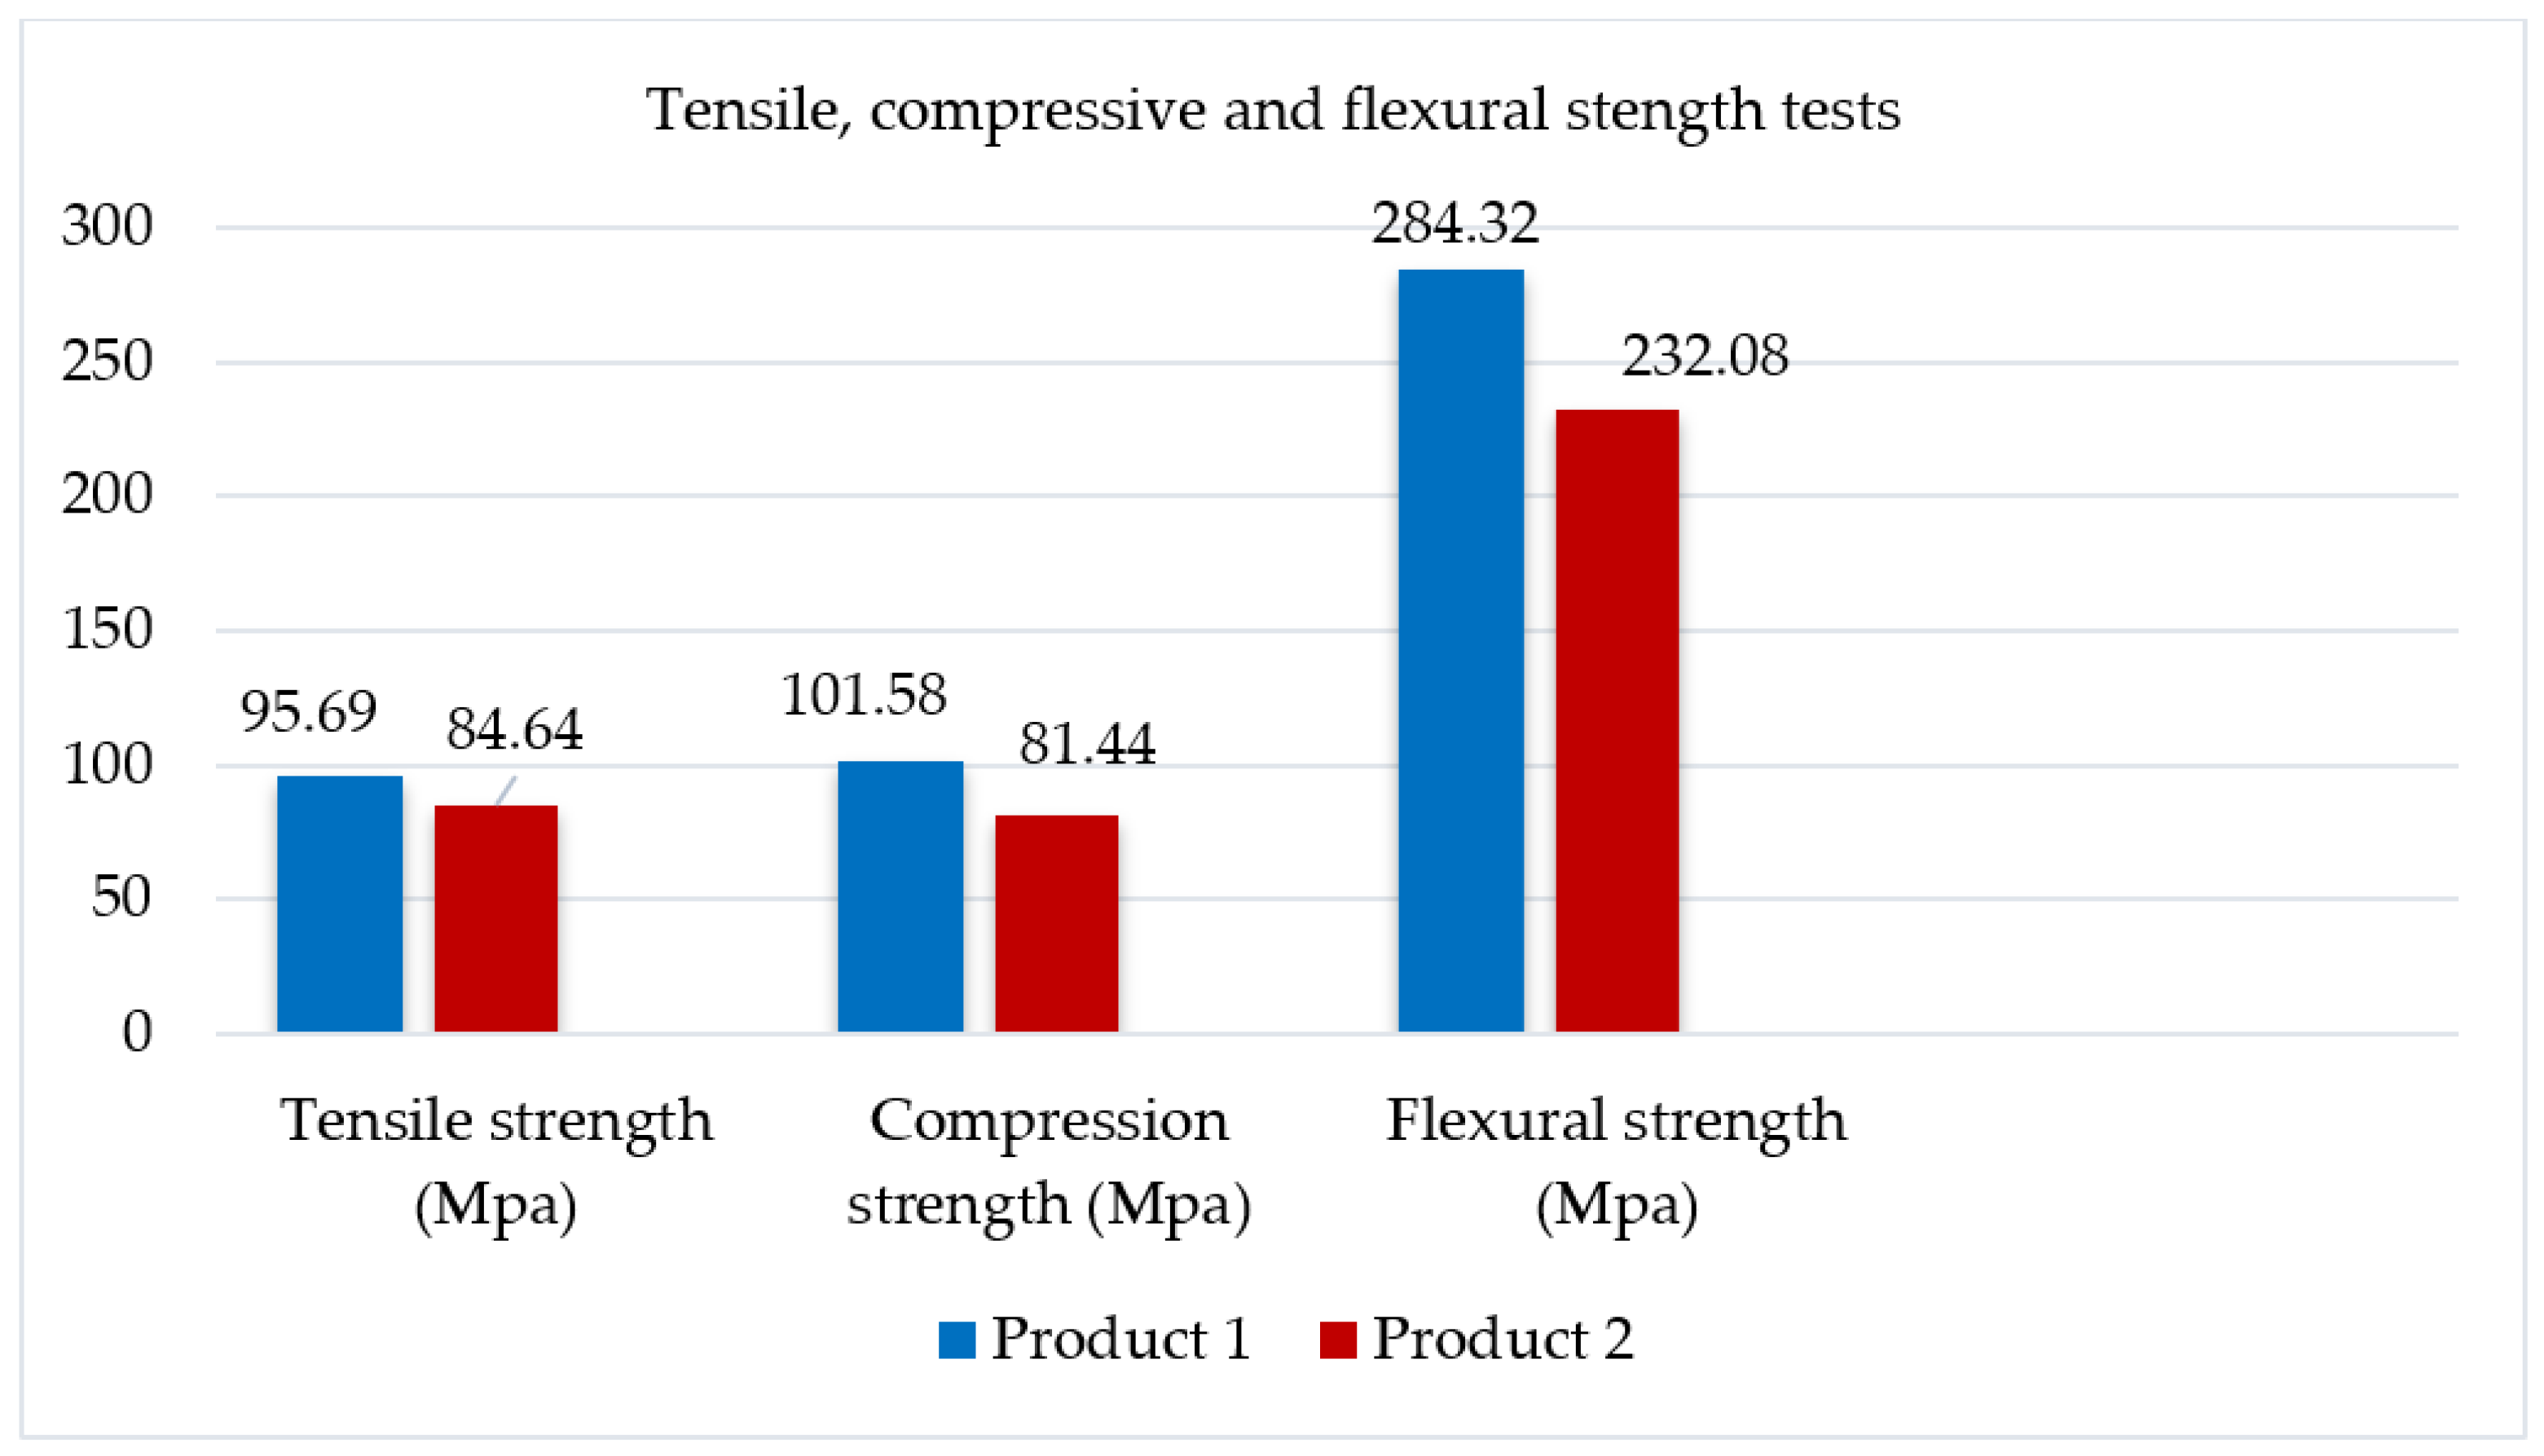
Figure 6.
Graphical representation of DSC test results for thermal properties.
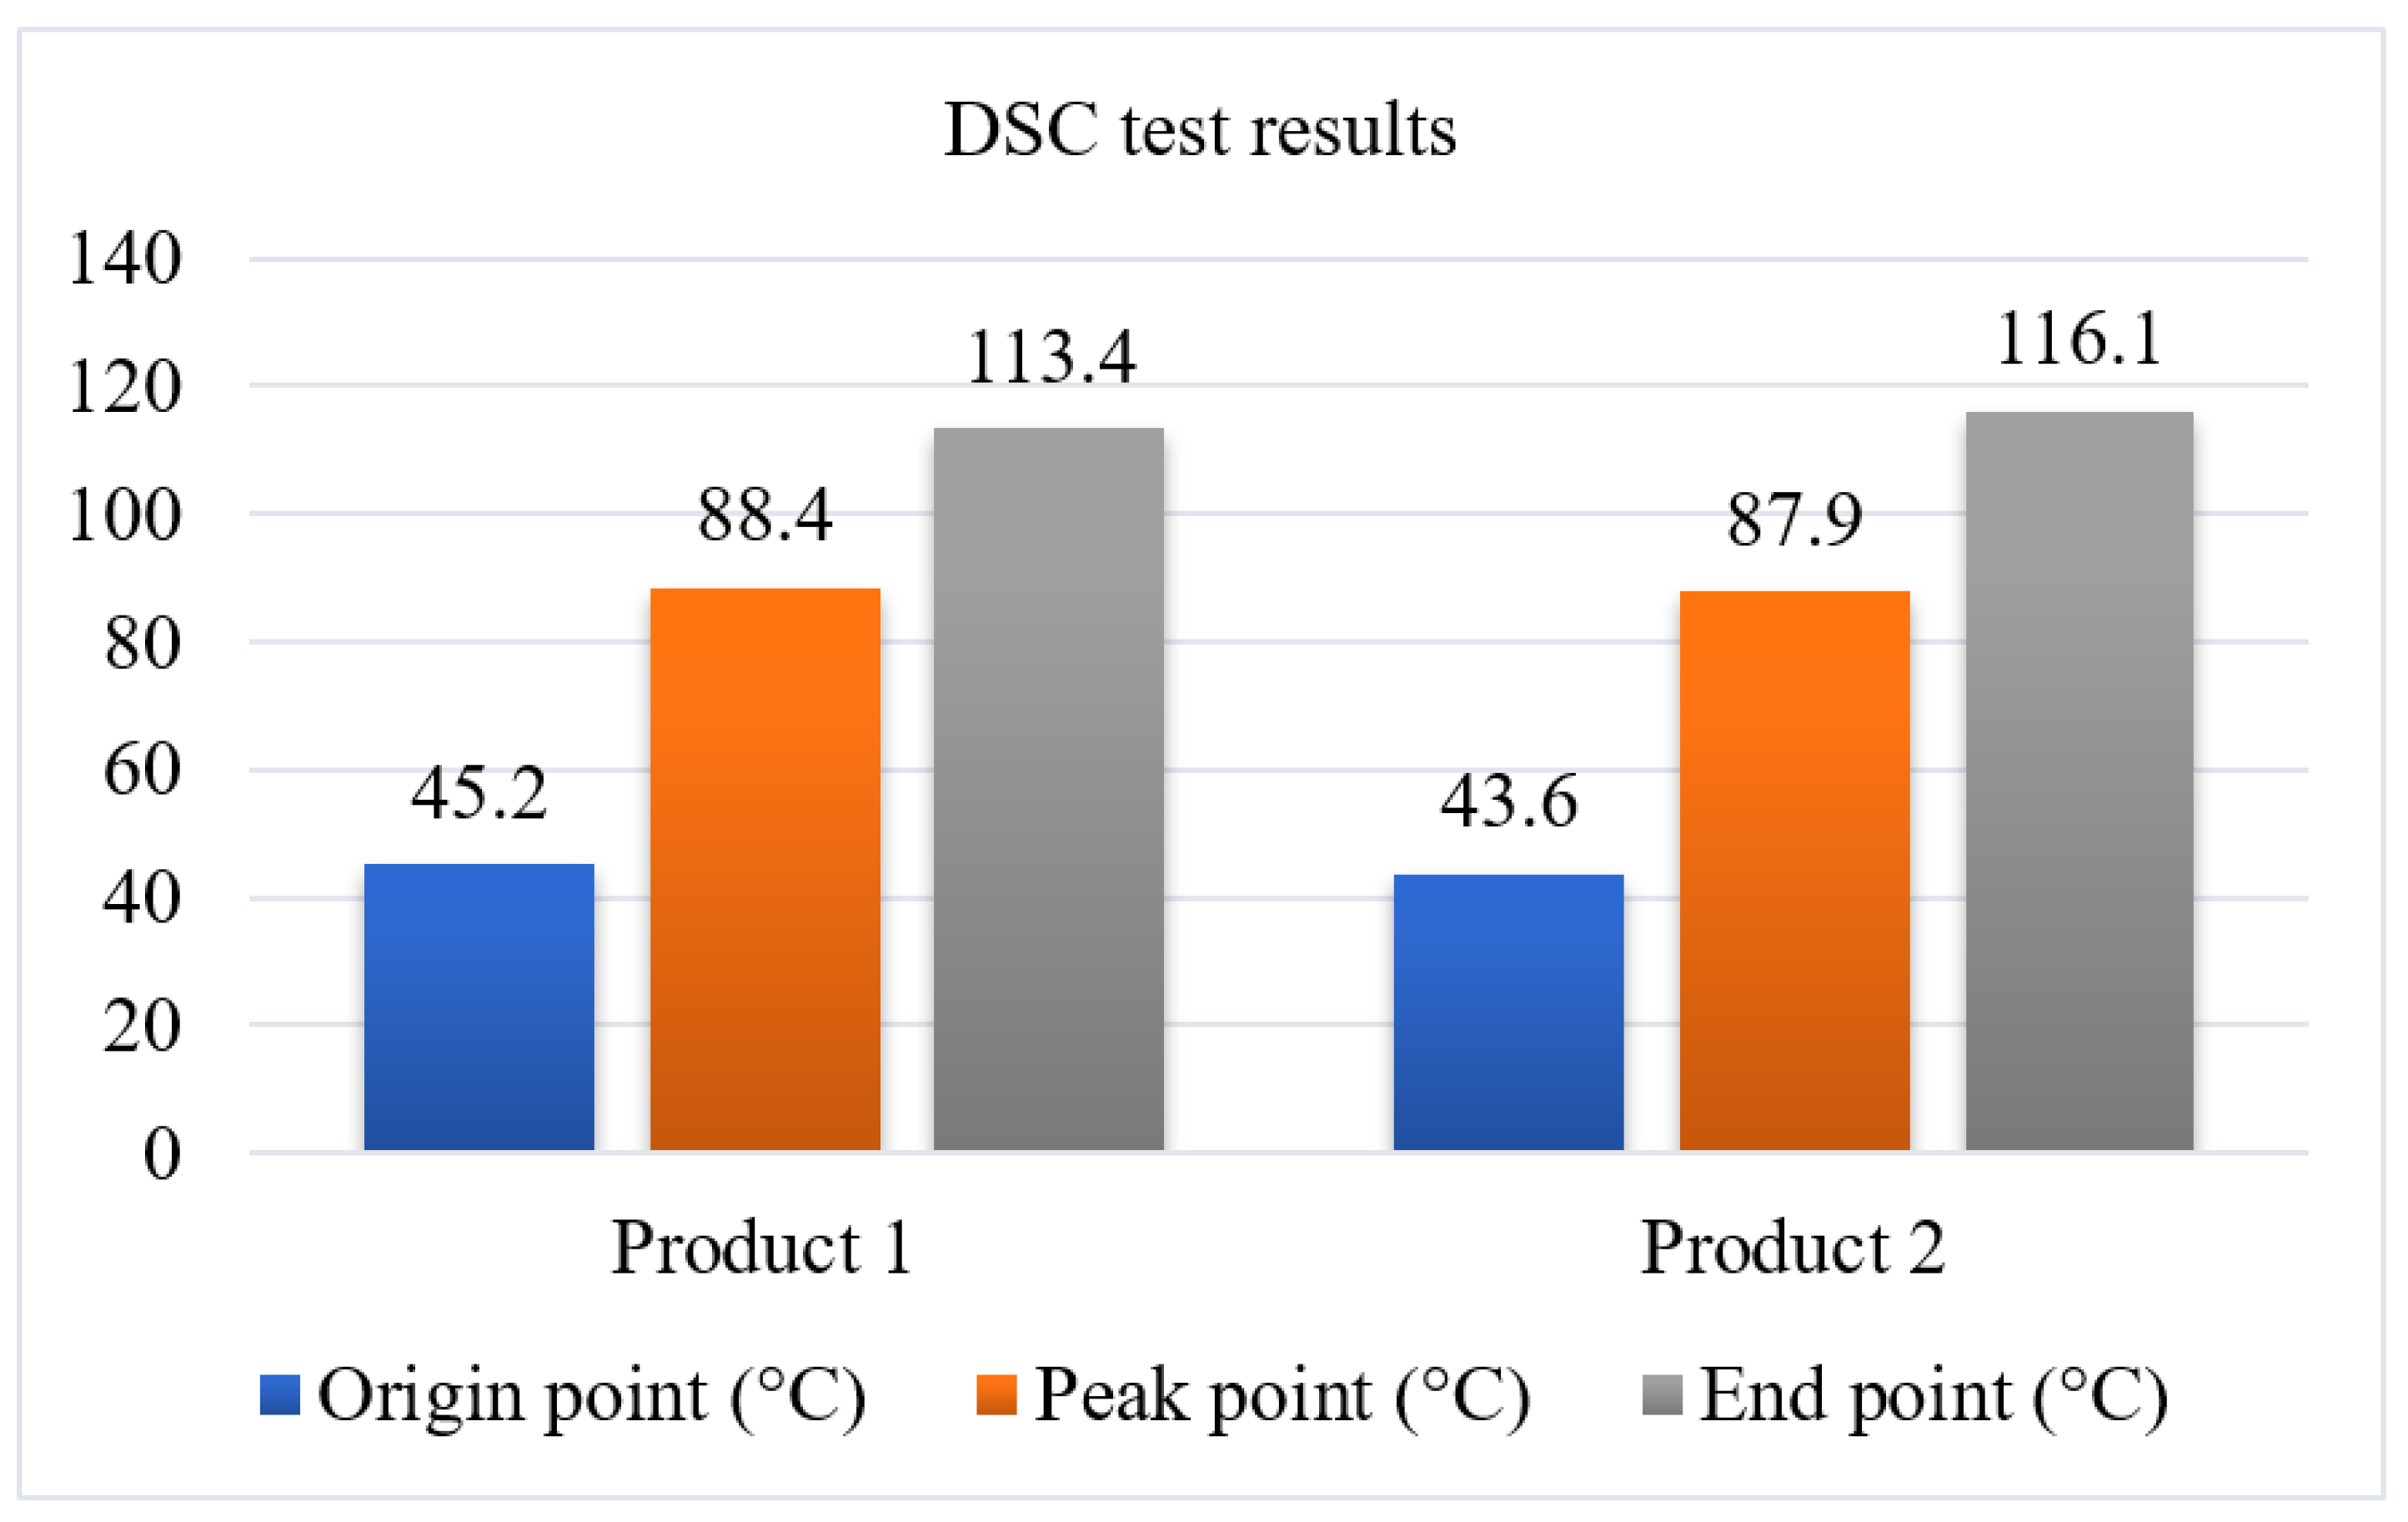
Figure 7.
Technical activities and process steps in the designed CEBM.
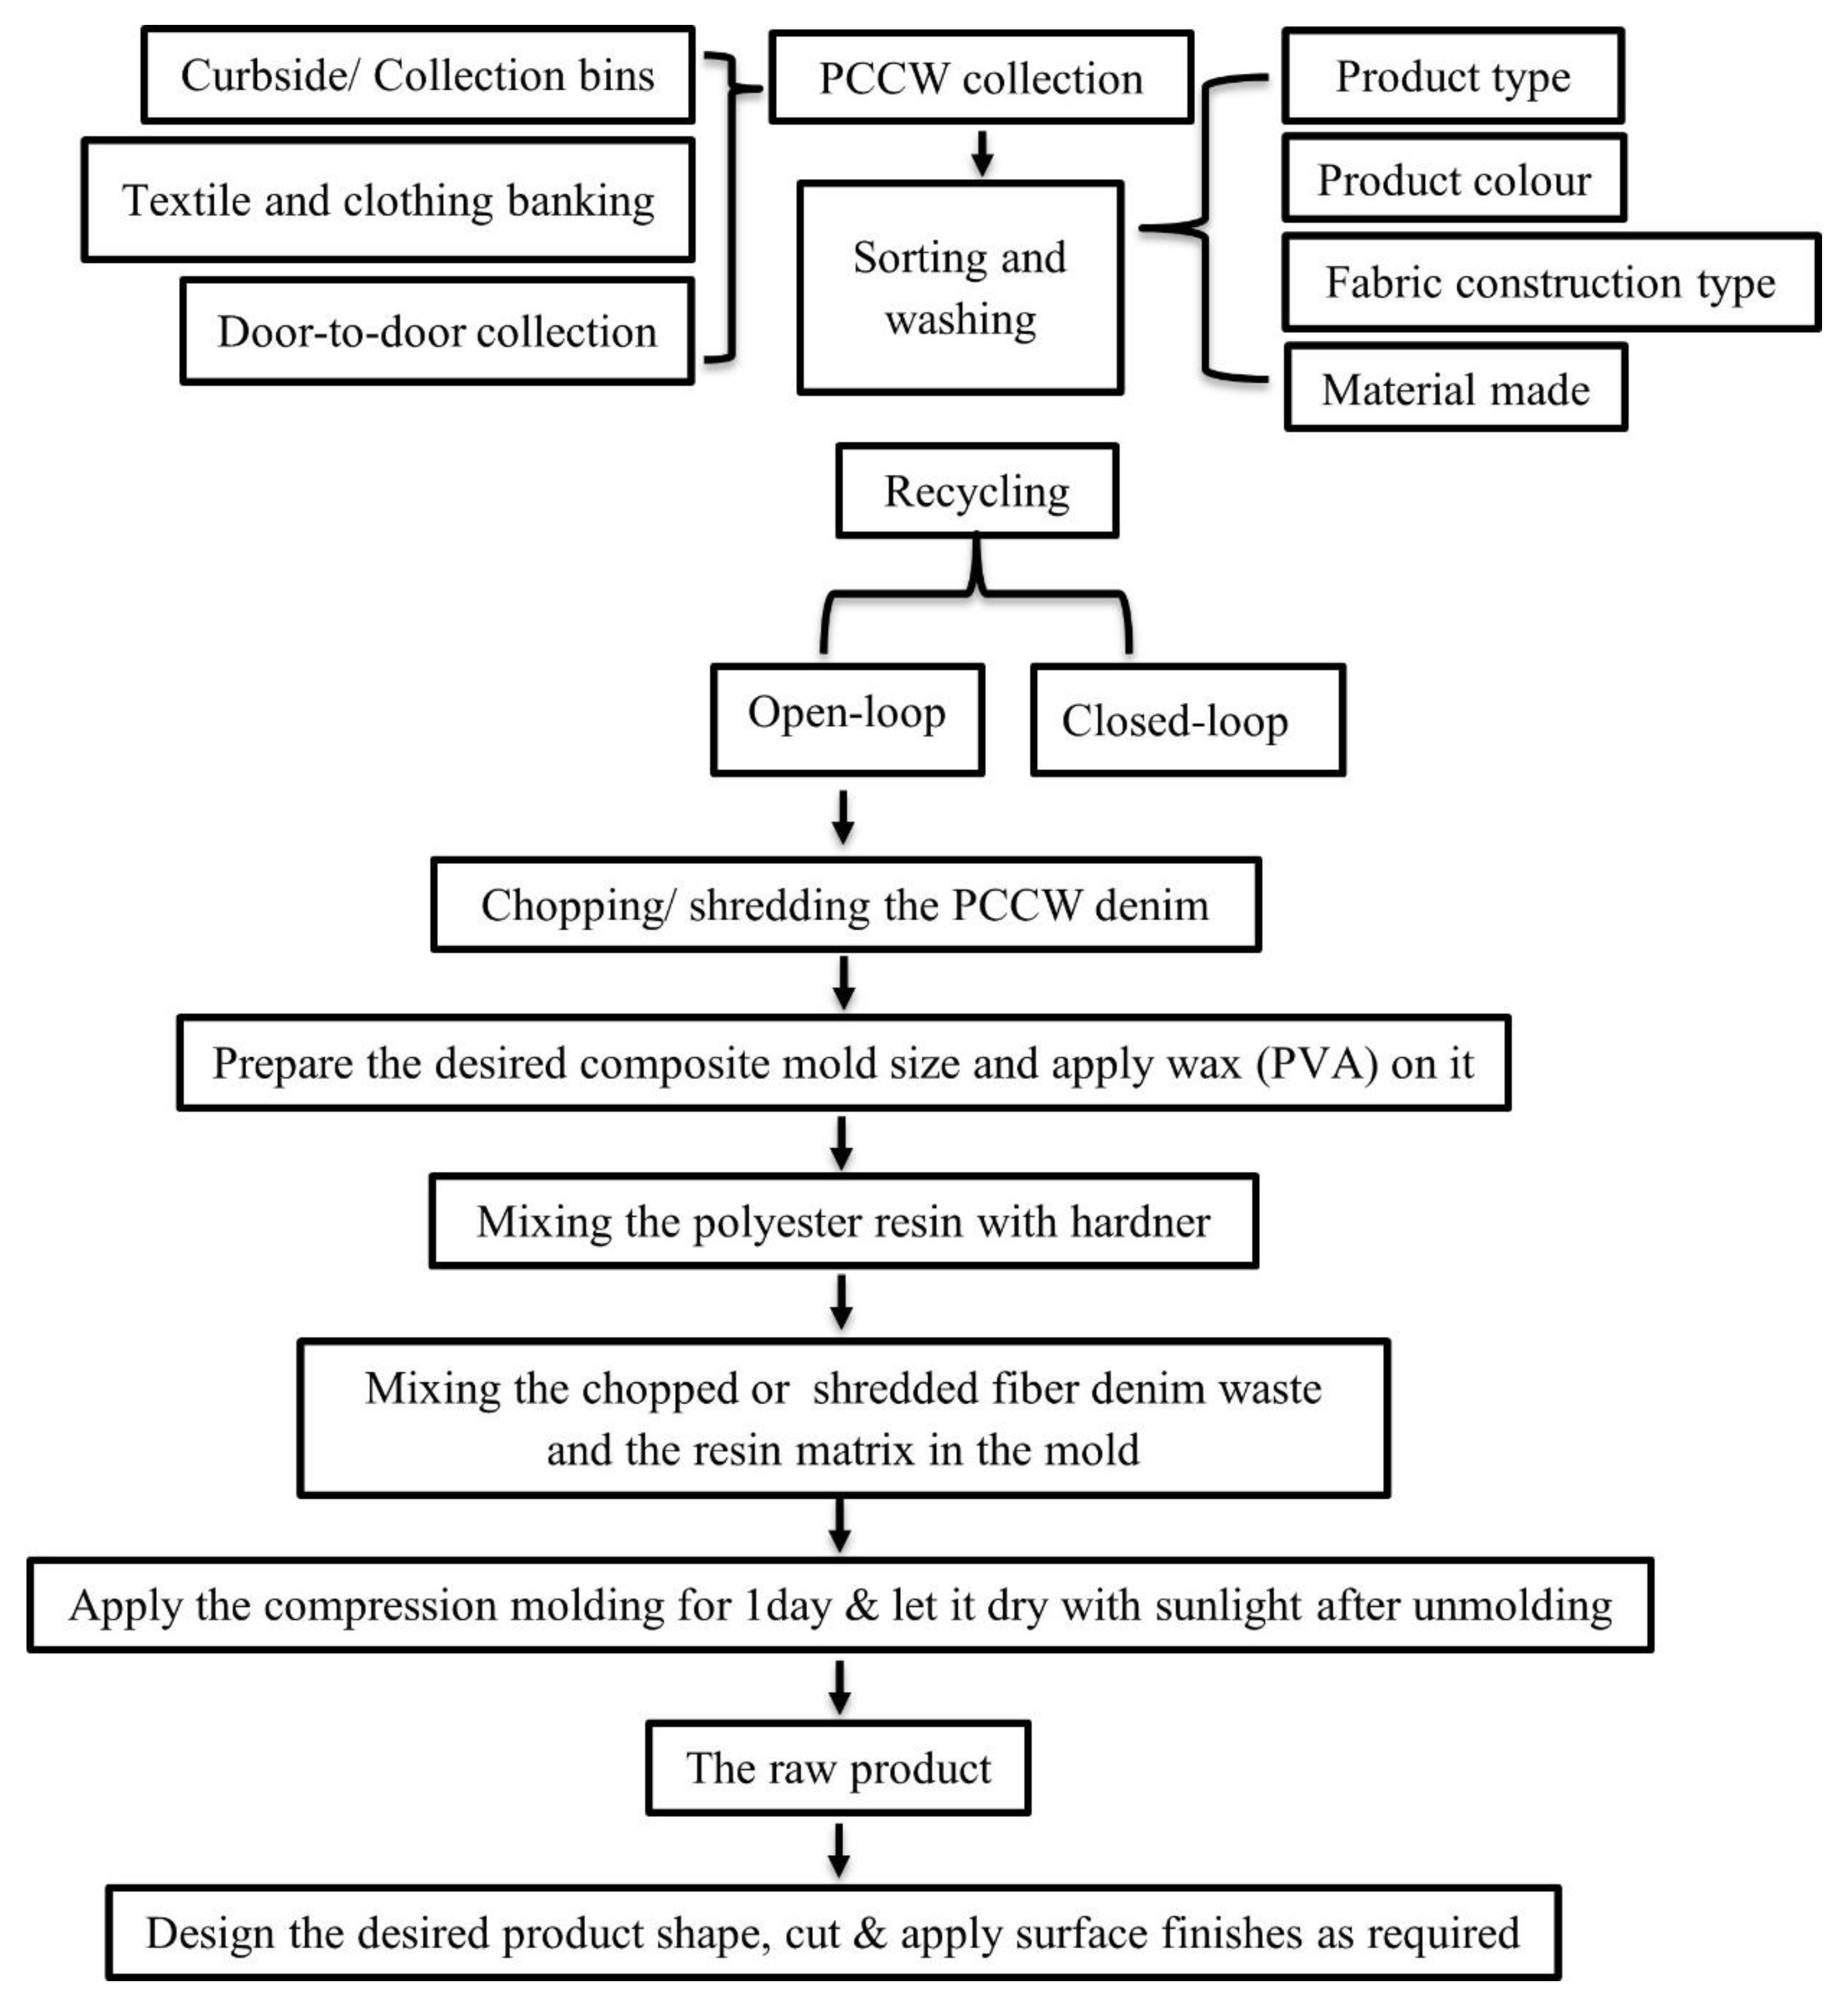
Figure 8.
Research process flow.
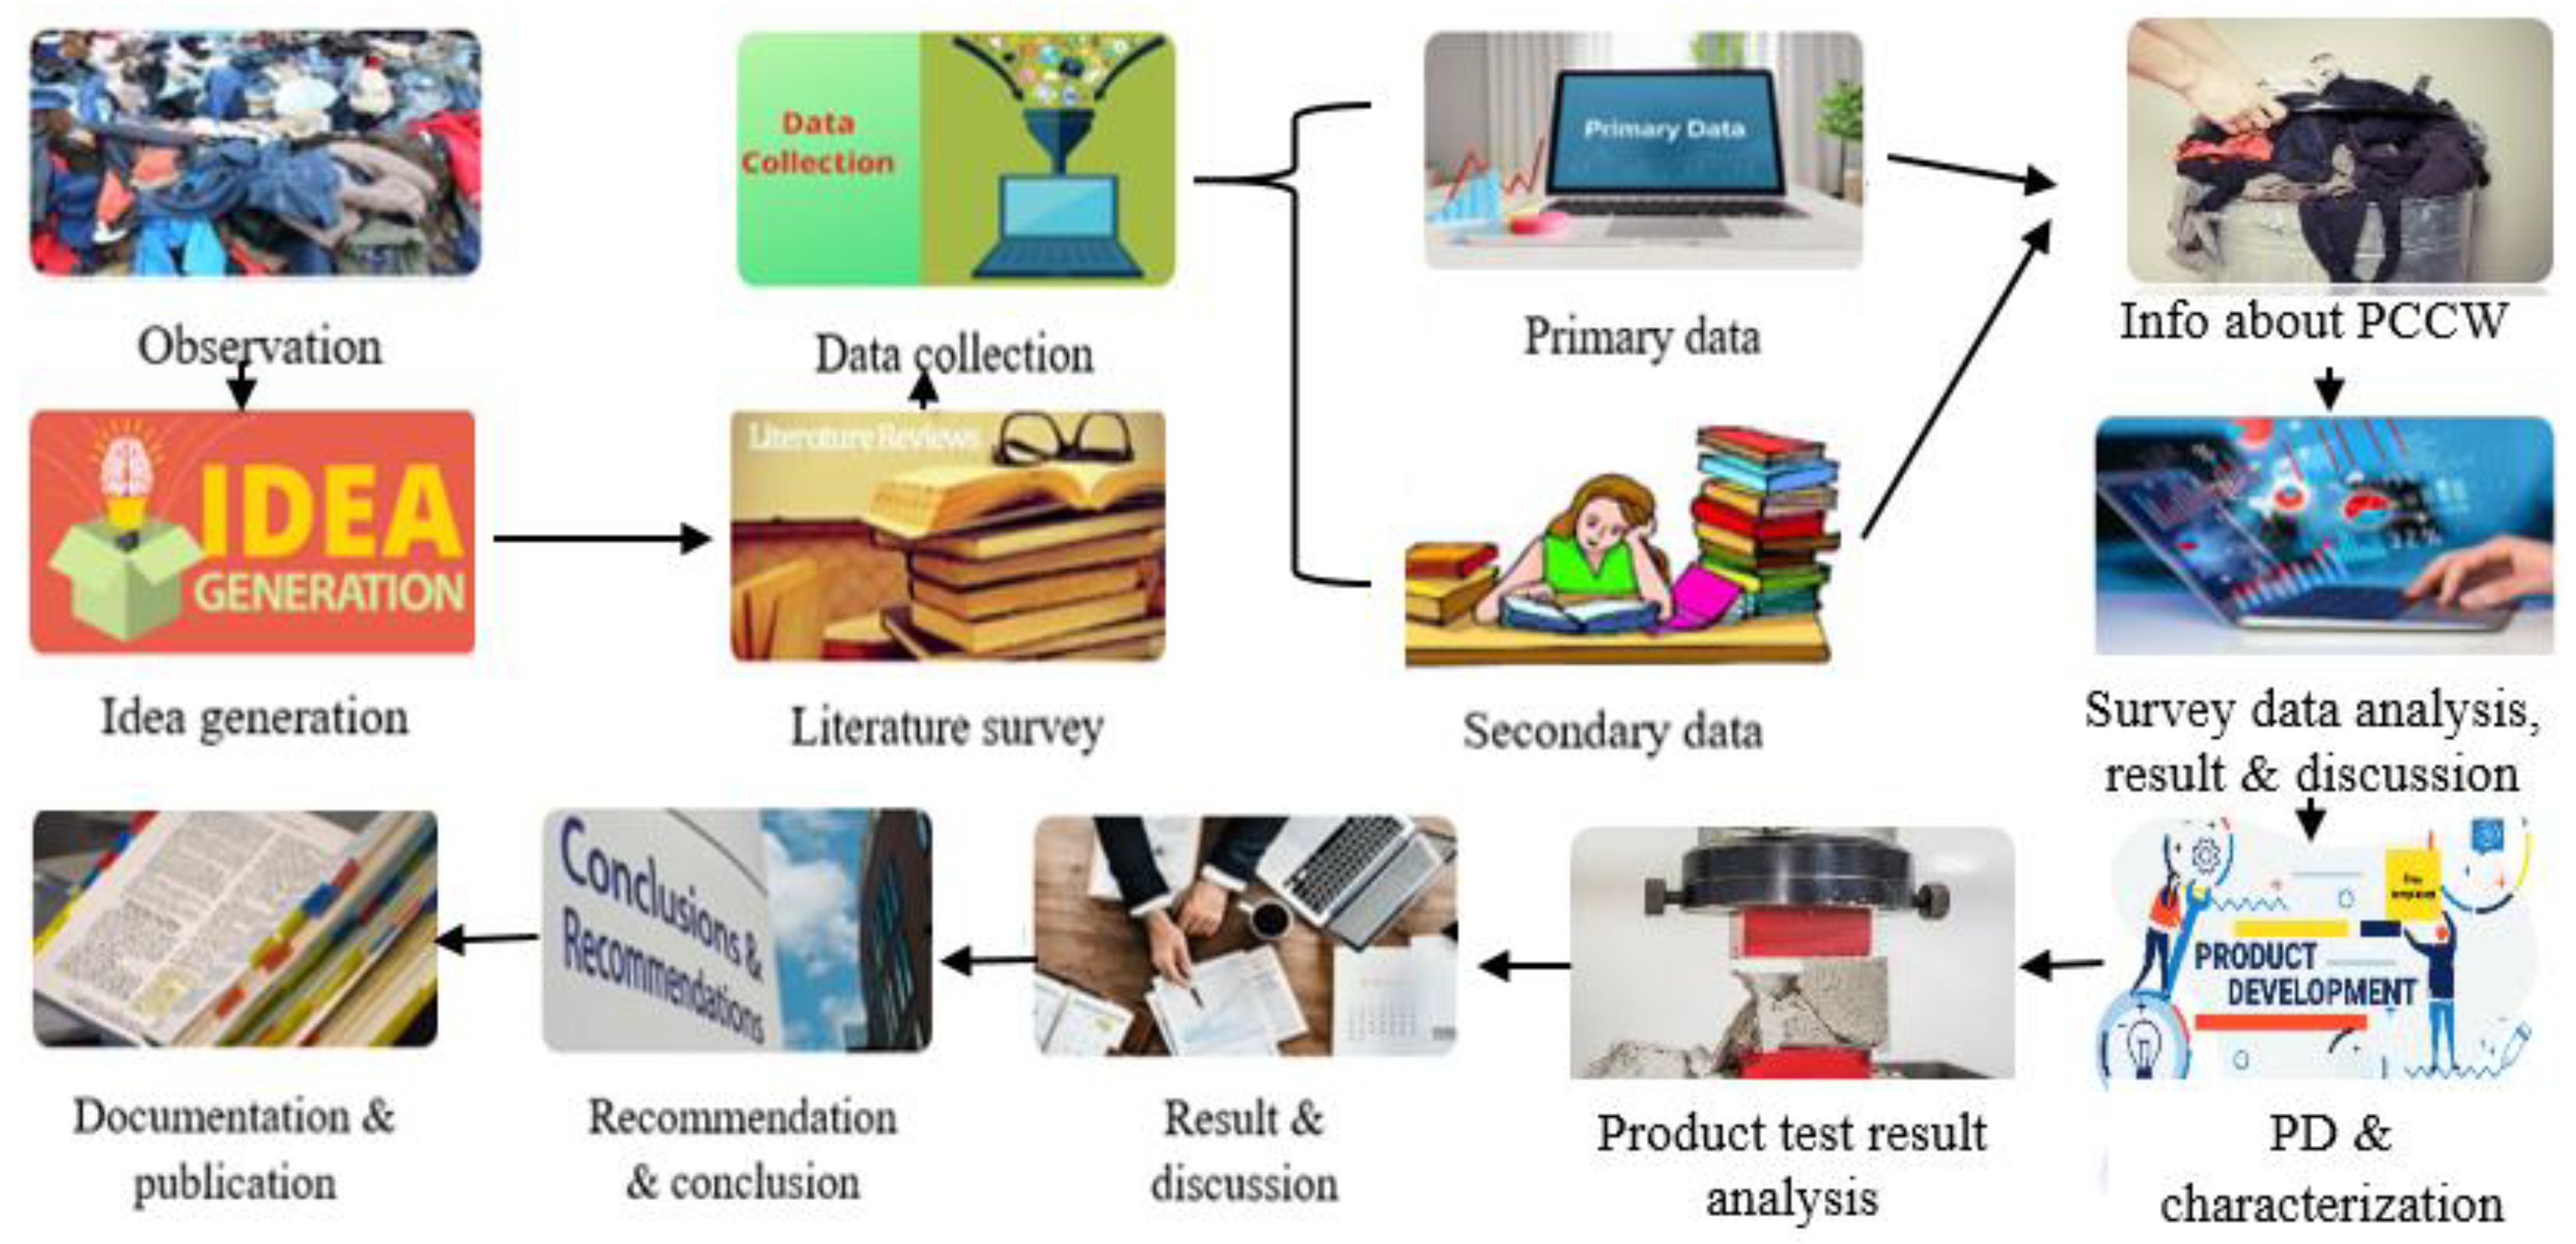
Figure 9.
Composite manufacturing process flow from PCCW denim jeans.
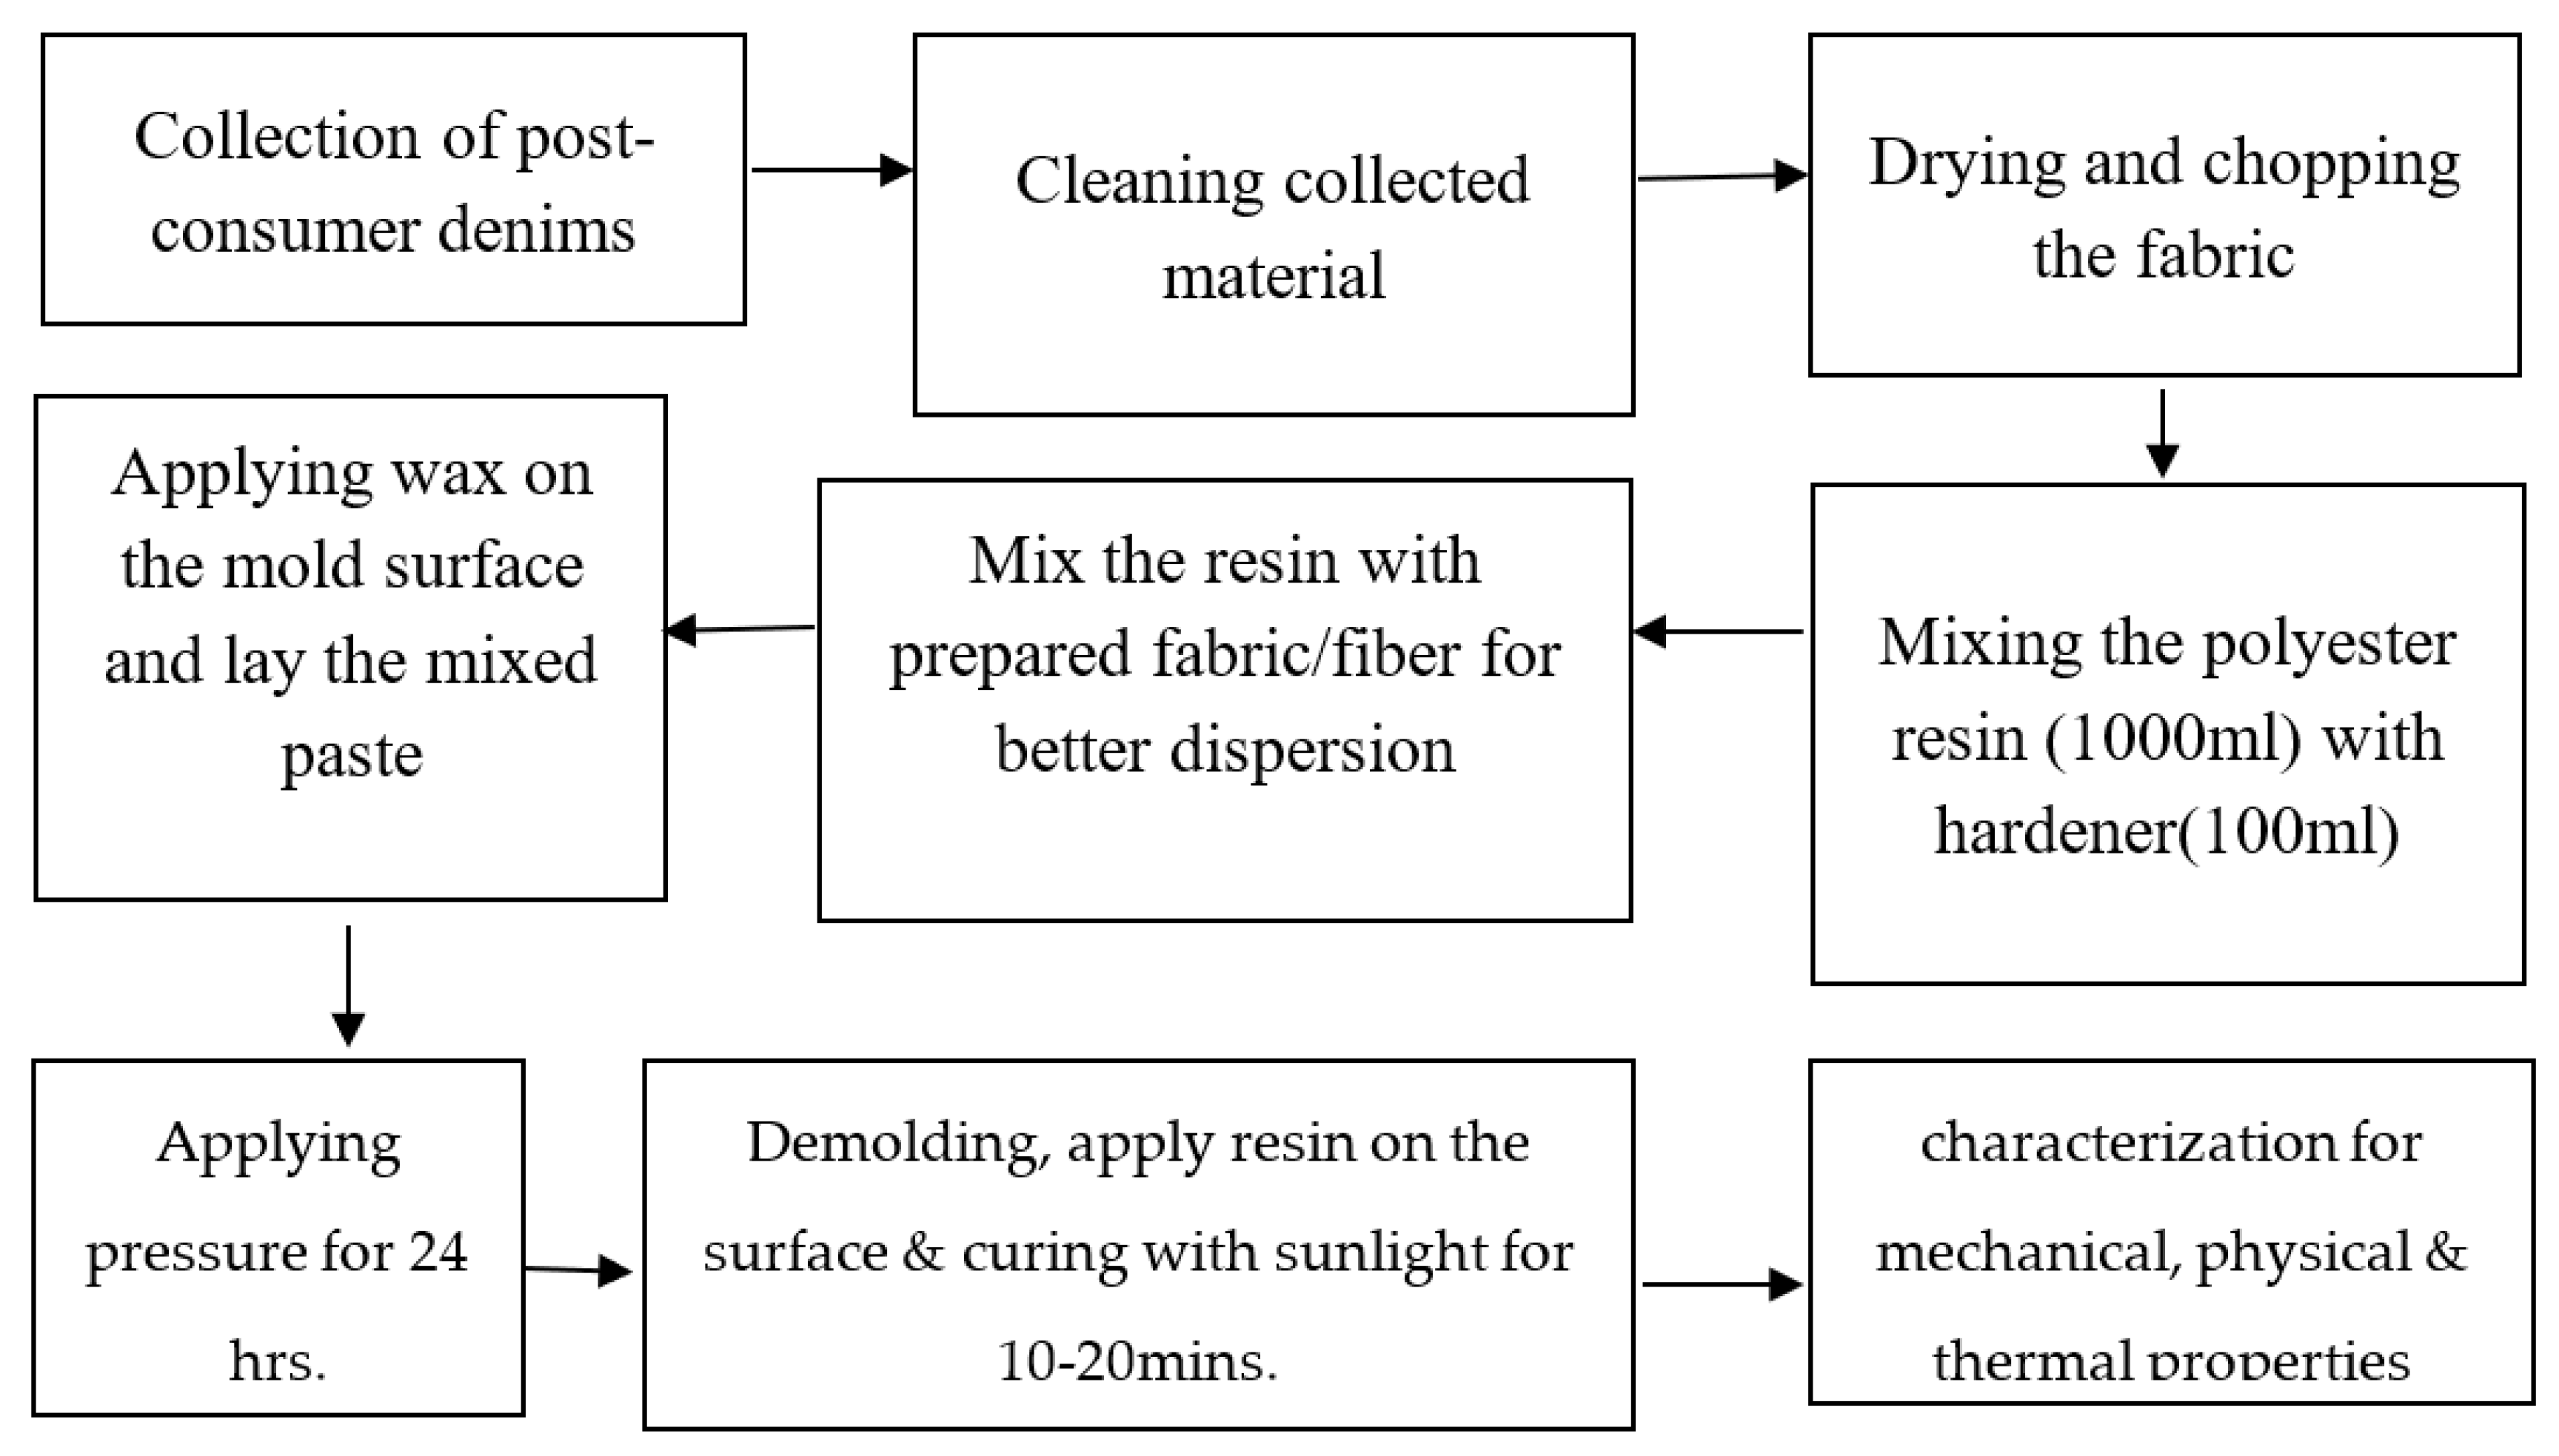

Table 1.
Collinearity test result among the independent variables.
| Model variables | Tolerance | VIF |
| Gender | .702 | 1.425 |
| Age | .523 | 1.912 |
| Educational level | .400 | 2.501 |
| Income level | .588 | 1.700 |
| Religion | .842 | 1.188 |
| Geographical area | .659 | 1.517 |
| Attitude | .592 | 1.690 |
| PSE | .745 | 1.343 |
Table 2.
Pearson correlation results among dependent and independent variables.
| Correlations | ||||||||||
|---|---|---|---|---|---|---|---|---|---|---|
| Gender | Age | Educational level | Income level | Religion | Geographical area | Attitude | PSE | PCCW | ||
| Gender | Pearson Correlation | 1 | .863 | .951 | .872 | .916 | .907 | .745 | .785 | .843 |
| Sig. (2-tailed) | .000 | .000 | .000 | .000 | .000 | .000 | .000 | .001 | ||
| N | 474 | 474 | 474 | 474 | 474 | 474 | 474 | 474 | 474 | |
| Age | Pearson Correlation | .863 | 1 | .867 | .94 | .857 | .786 | .915 | .774 | .861 |
| Sig. (2-tailed) | .000 | .000 | .000 | .000 | .000 | .000 | .000 | .000 | ||
| N | 474 | 474 | 474 | 474 | 474 | 474 | 474 | 474 | 474 | |
| Educational level | Pearson Correlation | .951 | .867 | 1 | .858 | .899 | .770 | .821 | .801 | .588 |
| Sig. (2-tailed) | .000 | .000 | .000 | .000 | .000 | .000 | .000 | .000 | ||
| N | 474 | 474 | 474 | 474 | 474 | 474 | 474 | 474 | 474 | |
| Income level | Pearson Correlation | .872 | .94 | .858 | 1 | .695 | .737 | .806 | .834 | .904 |
| Sig. (2-tailed) | .000 | .000 | .000 | .001 | .000 | .000 | .000 | .000 | ||
| N | 474 | 474 | 474 | 474 | 474 | 474 | 474 | 474 | 474 | |
| Religion | Pearson Correlation | .916 | .857 | .899 | .695 | 1 | .656 | .673 | .754 | .334 |
| Sig. (2-tailed) | .000 | .000 | .001 | .000 | .000 | .000 | .000 | .007 | ||
| N | 474 | 474 | 474 | 474 | 474 | 474 | 474 | 474 | 474 | |
| Geographical area | Pearson Correlation | .907 | .786 | .770 | .737 | .656 | 1 | .77 | .883 | .788 |
| Sig. (2-tailed) | .000 | .000 | .000 | .000 | .000 | .000 | .000 | .000 | ||
| N | 474 | 474 | 474 | 474 | 474 | 474 | 474 | 474 | 474 | |
| Attitude | Pearson Correlation | .745 | .915 | .821 | .806 | .673 | .776 | 1 | .888 | .780 |
| Sig. (2-tailed) | .000 | .000 | .000 | .000 | .001 | .000 | .000 | .000 | ||
| N | 474 | 474 | 474 | 474 | 474 | 474 | 474 | 474 | 474 | |
| PSE | Pearson Correlation | .785 | .774 | .801 | .834 | .754 | .883 | .888 | 1 | .866 |
| Sig. (2-tailed) | .000 | .000 | .000 | .000 | .000 | .000 | .000 | .000 | ||
| N | 474 | 474 | 474 | 474 | 474 | 474 | 474 | 474 | 474 | |
| PCCW | Pearson Correlation | .843 | .861 | .588 | .904 | .334 | .788 | .780 | .866 | 1 |
| Sig. (2-tailed) | .001 | .000 | .000 | .000 | .007 | .000 | .000 | .000 | ||
| N | 474 | 474 | 474 | 474 | 474 | 474 | 474 | 474 | 474 | |
| **. Correlation is significant at the 0.01 level (2-tailed). | ||||||||||
| *. Correlation is significant at the 0.05 level (2-tailed). | ||||||||||
Table 3.
Analysis of variance (ANOVA) test results.
| Variables | Types of variances | Sum of squares | df | Mean square | F | Sig. |
| Gender | Between Groups | 10.017 | 12 | .835 | 3.983 | .000 |
| Within Groups | 96.616 | 461 | .210 | |||
| Total | 106.633 | 473 | ||||
| Age | Between Groups | 66.203 | 12 | 5.517 | 3.028 | .000 |
| Within Groups | 839.915 | 461 | 1.822 | |||
| Total | 906.118 | 473 | ||||
| Educational level | Between Groups | 125.585 | 12 | 10.465 | 5.709 | .000 |
| Within Groups | 845.039 | 461 | 1.833 | |||
| Total | 970.624 | 473 | ||||
| Income level | Between Groups | 49.487 | 12 | 4.124 | 3.580 | .000 |
| Within Groups | 531.004 | 461 | 1.152 | |||
| Total | 580.492 | 473 | ||||
| Religion | Between Groups | 21.857 | 12 | 1.821 | 1.226 | .262 |
| Within Groups | 684.846 | 461 | 1.486 | |||
| Total | 706.703 | 473 | ||||
| Geographical area | Between Groups | 10.008 | 12 | .834 | 4.714 | .000 |
| With in Groups | 81.553 | 461 | .177 | |||
| Total | 91.561 | 473 | ||||
| Attitude | Between Groups | 2.549 | 12 | .212 | 2.051 | .019 |
| Within Groups | 47.749 | 461 | .104 | |||
| Total | 50.298 | 473 | ||||
| PSE | Between Groups | 30.090 | 12 | 2.507 | 4.551 | .000 |
| Within Groups | 254.011 | 461 | .551 | |||
| Total | 284.101 | 473 | .000 |
Table 4.
Regression coefficients of variables.
| Coefficients | |||||
| Model | Unstandardized coefficients | Standardized coefficients | T | Sig. | |
| B | Std. Error | Beta | |||
| (Constant) | 2.158 | .163 | 13.271 | .000 | |
| Gender | .033 | .030 | .254 | 4.072 | .000 |
| Age | .076 | .012 | .379 | 5.361 | .001 |
| Educational level | .082 | .013 | .411 | 6.164 | .000 |
| Income level | .089 | .014 | .537 | 7.666 | .000 |
| Religion | -.016 | .011 | -.367 | 4.463 | .054 |
| Geographical area | .201 | .034 | .309 | 5.942 | .000 |
| Attitude | .160 | .048 | .182 | 3.325 | .001 |
| PSE | .025 | .018 | .514 | 3.282 | .003 |
| Dependent Variable: PCCW | |||||
Table 5.
Raw material costs for composite manufacturing from PCCW.
| Material costs | Quantity | Unit cost (USD) | Total cost per product(USD) | |
| Product 1 | Product 2 | |||
| PCCW jeans | 2 Pcs | 2 Pcs | 0.94 | 1.88 |
| Unsaturated polyester(L) | 1 | 1 | 1.89 | 1.89 |
| Hardener (ml) | 100 | 100 | 0.38 | 38 |
| PVA (gm) | 25 | 25 | 0.47 | 11.75 |
| Wooden mica sheet (45 cm diameter) | 2 Pcs | 2 Pcs | 0.47 | 0.94 |
*1USD=53ETB.
Table 6.
Materials, equipment, and chemicals used for the composite manufacturing process.
| No. | Justification | Type and model no. | Origin |
| 1 | PCCW (Denim waste) | Cotton made | Ethiopia |
| 2 | Unsaturated polyester resin | GP resin 1003 | UAE |
| 3 | Wax | PVA (Polyvinyl alcohol) | China |
| 4 | Hardener | Cycloaliphatic hardener | India |
| 5 | Detergent | Omo detergent powder (500g) | Nigeria |
| 6 | Scissors | Fabric scissor (tailoring scissor) | China |
| 7 | Mixer | Manual mixer (wooden material) | Ethiopia |
| 8 | Manual molding material | Morsa | China |
| 9 | MDF | Melamine MDF board | Ethiopia |
| 10 | Grinder | GWS 600 angle grinder | India |
| 11 | Jig saw cutter | Makita (450W) | USA |
| 12 | Universal testing machine | WAW-600D | China |
| 13 | Differential Scanning Calorimeter | DSC-100 | China |
| 14 | Electronic balance | METTLER TOLEDO | China |
| 15 | Shredding machine | XRD30 OXRD | China |
| 16 | Wooden mica sheet | Sunmica | India |
Disclaimer/Publisher’s Note: The statements, opinions and data contained in all publications are solely those of the individual author(s) and contributor(s) and not of MDPI and/or the editor(s). MDPI and/or the editor(s) disclaim responsibility for any injury to people or property resulting from any ideas, methods, instructions or products referred to in the content. |
© 2024 by the authors. Licensee MDPI, Basel, Switzerland. This article is an open access article distributed under the terms and conditions of the Creative Commons Attribution (CC BY) license (http://creativecommons.org/licenses/by/4.0/).
Copyright: This open access article is published under a Creative Commons CC BY 4.0 license, which permit the free download, distribution, and reuse, provided that the author and preprint are cited in any reuse.


