Submitted:
31 December 2023
Posted:
12 January 2024
You are already at the latest version
Abstract
This study examines the absorption and concentration of anthracene (AN) in the garden radish. Studies were conducted to grow radishes from the sowing stage in soil contaminated with AN, and to grow radishes in soil contaminated with AN following maturity (27 days after sowing). For the growth in AN-containing soil from sowing onward, AN levels immediately after seeding ranged from 12,500-36,300 ng/g-ww. AN concentrations during growing period ranged from 7140-16,000 ng/g-ww in soil and from 38.2-2160 ng/g-ww in radish, respectively. For the growth in AN-containing soil after maturity, AN concentrations in soil and radish ranged from 9560-22,100 ng/g-ww and 342-2270 ng/g-ww. The concentrations of AN in the roots and leaves had a higher density than those in the stems. In these experiments, positive relationships between AN levels in soil and radishes were observed. It is inferred that the greater the degree of soil contamination, the greater the effect on the amount of AN assimilated by the radishes. The concentration ratio (radish-to-soil; Cr/Cs) decreased exponentially with days since AN application. This indicates that the concentration ratio is affected by time in contact with AN. According to the results for the change over time of Cr/Cs and contents by radish part, it is thought that AN in the soil has good absorption through the roots to circulate within the organism, and is preferentially distributed and accumulated in the roots and leaves, which have high organic matter content.
Keywords:
anthracene
; radish
; absorption
; concentration
1. Introduction
Anthracene (hereinafter referred to as
"AN") is a polycyclic aromatic hydrocarbon that is used as an
insecticide, a gasoline stabilizer, a triplet sensitizer, and a quenching
agent. As AN is generated unintentionally by the burning of the fossil fuels
such as petroleum and coal, it is discharged into the environment from numerous
emission sources, including automobiles, incinerators and factories (Shen et
al. 2011, Aydin et al. 2014, Satri et al. 2017, Lin et al.
2019, Thang et al. 2019). Accordingly, AN has been detected in air,
water, and other environmental media around the world (Zhou et al. 2013,
Obist et al. 2015, Subramanian et al. 2015, Adekulea et al.
2017, Li et al. 2017, Wang et al. 2017, Pratt et al. 2018,
Hazarika et al. 2019, Yang et al. 2019). In an evaluation by the
International Agency for Research on Cancer (IARC), AN is categorized as a
compound that cannot be evaluated with respect to carcinogenicity in humans
(Group 3) in 2010 (IARC 2021). However, due to its persistence, accumulation in
ecosystems, and toxicity, it was included in the first list of substances of
very high concern (SVHC) released by the European Chemicals Agency in October
2008, and it can be considered a harmful chemical substance of note (ECHA
2021). Accurately calculating the health risk of AN requires collecting
information on exposure level; accumulating data on concentration in
environmental media including water, air, and foods; and considering the
substance's environmental dynamics.
The authors conducted a study on vegetables,
targeting the radish Raphanus sativus. This vegetable of the Brassicaceae
family is native to Europe. It can be harvested around one month after sowing
under temperature conditions of approximately 20 °C . In large specimens,
leaves grow to a height of approximately 30 cm and the root grows into a red
sphere with a diameter of approximately 3 cm. The radish was selected for this
study as the time until harvest is short and management of growth is relatively
easy. The study attempted to understand the absorption and concentration
properties of the radish, including the degree to which AN in contaminated soil
is absorbed by the radish and how AN is transported and accumulates within the
organism.
2. Experimental methods
2.1. Overview of the study
Studies were conducted to grow radishes from the
sowing stage in soil contaminated with AN, and to grow radishes in soil
contaminated with AN following maturity (27 days after sowing). Experiments
were performed using four types of planters, as shown in Table 1. The study of growth in contaminated
soil from sowing onward was conducted using planters P1 and P2 from June 3 to
July 1, 2019, and using planter P3 from July 2 to July 30, 2019. The study of
growth in contaminated soil from maturity onward was conducted using planter P4
from June 1 to July 22, 2019. The average daily outdoor air temperature during
the growing period, as reported by the Japan Meteorological Agency, was 24.0 °C
for P1 and P2, 26.7 °C for P3, and 25.3 °C for P4. The average indoor
temperature in the growing room was 26.7 °C for the experiment with P1 and P2,
28.2 °C for P3, and 27.6 °C for P4.
2.2. Radish growth
The radishes were grown in planters in a room with
abundant sunlight from windows. The planters used had dimensions of 45 cm in
width, 30 cm in length, and 18 cm in depth. As Figure
1 indicates, approximately 400 g of potting stones were laid evenly on
the bottom of each planter, which was then covered with garden-use potting soil
to a depth of approximately 8 cm (approximately 400 g). The planters were
further prepared using potting soil mixed with fertilizer and AN, with the soil
laid to a depth of approximately 16 cm. The mass of the potting soil was
approximately 1600 g, the fertilizer approximately 15 g, and the AN additive
0.05 g in P1, 0.10 g in P2, and 0.20 g in P3. AN was not added to P4. After the
planters were readied, approximately 2 L of water was sprinkled into the
planters, and approximately sixty radish seeds were buried in two rows. The
radishes were grown with 300 mL to 500 mL of water sprinkled nearly every day.
When the air temperature was high, windows were opened to adjust the temperature
inside the growing room, except when raining and windy. In P4, which was used
to study growth in contaminated soil after maturity, a suspension of AN (1.6 mg
to 4.5 mg of AN added to approximately 20 mL of pure water) was sprayed water
round the roots 27 days after sowing, after which growth was continued.
2.3. Sampling of specimens
For the radishes grown in contaminated soil from
sowing onward, radishes and soil were collected five times in P1, P2, and P3:
immediately after sowing and at 6 days, 14 days, 21 days, and 28 days after
sowing. In these, 20 to 27 plant seeds were collected 6 days after, 10 to 17
plants were collected 14 days after, 5 to 6 plants were collected 21 days
after, and 3 plants were collected 28 days after sowing. Soil specimens with a
diameter of about 3 cm and a depth of about 3 cm were collected from five
locations (the center of the planter and near the four corners). The specimens
were collected and mixed to create test samples.
In P4, which was used to study growth in
contaminated soil after maturity, plants and soil were collected six times:
before application of AN and 1 day, 4 days, 11 days, 19 days, and 24 days after
application (27 days, 28 days, 31 days, 38 days, 46 days, and 51 days after sowing).
One radish was collected on each of the days. Soil with a diameter of about 5
cm and depth of about 5 cm surrounding the collected radish was collected and
mixed to prepare a test sample.
2.4. Analysis
The radish samples were thoroughly washed with water,
wiped with the paper towel, and weighed using an electronic scale. Each sample
was then cut into pieces several millimeters in size using scissors. The pieces
were placed in a cylindrical cellulose filter paper (Whatman, UK) and were
weighed again to assess the exact sample mass for ultrasonic extraction using
hexane. As the radishes 6 days after sowing in P1, P2, and P3 were small and
could not be divided into roots, stems, and leaves, the 20- to 27-day plants
were combined, chopped into pieces several millimeters in size, and mixed,
after which a portion of the sample was placed in the cylindrical cellulose
filter paper and weighed. As the plants in P1, P2, and P3 on days other than 6
days after sowing and the plants in P4 had grown large, these were separated
into roots, stems, and leaves, each of which was chopped into pieces several
millimeters in size and mixed thoroughly. A portion of the samples of each part
was placed in cylindrical cellulose filter papers and weighed. The soil samples
were also placed in cylindrical cellulose filter papers and weighed.
The cylindrical cellulose filter papers containing
the samples were set in 260 mL bottles into which 150 mL of hexane (for
pesticide residues and polychlorinated biphenyl analysis from Wako Pure Chemical
Industries, Ltd.) was added, after which ultrasonic extraction was performed
for 15 minutes. Anhydrous sodium sulfate was added to the extract liquid. After
dehydration for 30 minutes, the solution was concentrated to approximately 2 mL
using a rotary evaporator. This concentrated solution was combined with the
solution obtained by rinsing the rotary evaporator device with hexane;
anhydrous sodium sulfate was added to the combination and the mixture was
dehydrated for 30 minutes. The dehydrated solution was filtered by a syringe
filter (Whatman Puradisc 25 TF; GE Healthcare Bio-Sciences, Piscataway NJ, USA)
and was concentrated to 1.5 mL under a stream of nitrogen. Next, 0.2 mL of
internal standards solution (100-fold diluted solution of hexane, 3 Internal
Standards Mixture Solution from Wako Pure Chemical Industries, Ltd.) was added.
The mixture was accurately adjusted to 2.0 mL using hexane, and a sample
solution for GC/MS measurement was prepared.
The GC/MS used for measurement was the 5975B inert
XL E/CI MSD (Agilent Technologies). The capillary column used was the HP-5MS
(30 m × 0.25 mm × 0.25 μm). The injection port temperature was 250 °C, with
splitless injection used. The injection volume was 2 μL; the column temperature
rise condition was 70 °C (1.5 min) → 20 °C/min → 180 °C (0 min) → 5 °C/min →
290 °C (10 min). The carrier gas was helium and the interface temperature was
230 °C. A mass spectrometer was used to perform measurements under electron
impact ionization mode conditions of 70 eV ionizing voltage. For AN, mass
numbers 178.1 and 176.1 were selected, and for the internal standards substance
AN-d10, mass numbers 188.2 and 189.2 were selected for use in qualitative
evaluation. The quantitative evaluation was performed using the internal calibration
curve method, using the mass numbers with the highest sensitivity (178.1 for AN
and 188.2 for AN-d10). Preparations were produced through mixing and through
dilution with hexane as appropriate, using Polynuclear Aromatic Hydrocarbons
Mix (CRM48905; Sigma-Aldrich) for AN and 3 Internal Standards Mixture Solution
(091-05791; FUJIFILM Wako Pure Chemical Corporation) for AN-d10.
3. Findings and considerations
3.1. Results for radishes grown from sowing onward in soil contaminated with anthracene
Table 2 shows
the detailed results of the study (P1, P2, and P3) in which radishes were grown
in AN-contaminated soil from sowing onward. Figure
2(a) shows the AN concentration in the contaminated soil and Figure 2(b) shows the AN concentration in
radishes over time. Conditions for P1 and P2 were an average outdoor air
temperature of 24.0 °C during the growing period, with 0.05g and 0.10 g of AN,
respectively, added to the topsoil in the planters (approximately 1600 g of
potting soil and approximately 15 g of fertilizer). Conditions for P3 were an
average outdoor air temperature of 26.7 °C during the growing period, with 0.20
g of AN added. The AN concentration in collected soil that had been sprinkled
with approximately 2 L of water immediately after sowing was 12,500 ng/g-ww in
P1, 23,300 ng/g-ww in P2, and 36,300 ng/g-ww in P3. As shown by the figure, the
concentration subsequently decreased exponentially. The AN concentration in the
soil 28 days after sowing was 7140 ng/g-ww in P1, 8770 ng/g-ww in P2, and
11,300 ng/g-ww in P3. The AN concentration in radishes 6 days after sowing was
1170 ng/g-ww in P1, 1620 ng/g-ww in P2, and 2160 ng/g-ww in P3. The
concentration subsequently decreased exponentially 28 days after sowing to 38.2
ng/g-ww in P1, 122 ng/g-ww in P2, and 189 ng/g-ww in P3.
3.2. Results for radishes grown after maturity in soil contaminated with anthracene
Table 3 shows the detailed results of the study (P4) in which radishes were grown in AN-contaminated soil after maturity. The conditions were an average outdoor air temperature of 25.3 °C during the growing period, with AN not added at the time of sowing, and a suspension of AN sprinkled around the roots of the radishes 27 days after sowing. Concentration in the soil was highest 4 days after application of AN (31 days after sowing), at 22,100 ng/g-ww, and was lowest 11 days after application of AN (38 days after sowing), at 5670 ng/g-ww. Although there were some fluctuations due to AN suspensions of differing content being sprinkled around the roots, the concentration generally showed a decreasing trend.
In the same manner as the concentration in the soil, the concentration in the radishes tended to decrease over time following the addition of AN, with the highest concentration 4 days after application of AN, at 2270 ng/g-ww, and the lowest concentration 24 days after application of AN, at 342 ng/g-ww. Tendencies in concentration differed by part of the radish. The concentration in roots and stems was highest 1 day after application of AN, at 3470 ng/g-ww and 230 ng/g-ww, respectively. Concentration in the leaves was highest 4 days after application of AN, at 5750 ng/g-ww. Concentration was lowest in the roots 4 days after application of AN, at 228 ng/g-ww, and in the stems and leaves 24 days after application of AN, at 39.5 ng/g-ww and 55.9 ng/g-ww, respectively.
3.3. Relationship between anthracene concentration in soil and concentration in radishes
Figure 3 shows the relationship between AN concentration in soil and concentration in radishes in the study. In the figure, "●" indicates the common logarithmic values of the detected concentration in both soil and radishes in P1, P2, and P3, and "○" indicates the values in P4. While P1, P2, and P3 were used in a survey to grow plants from sowing onward in AN-contaminated soil and P4 was used in a methodologically different survey to grow plants after maturity in AN-contaminated soil, positive correlations were observed in each study. It is inferred that the greater the degree of soil contamination, the greater the effect on the amount of AN assimilated by the radishes.
Figure 4 shows the relationship between the number of days since application of AN and Cr/Cs. In the figure, "●" indicates results for radishes grown in contaminated soil from sowing onward in P1, P2, and P3. The relationship between the number of days elapsed after application of AN, x, and the concentration ratio, y, can be expressed as y = 0.201×e−0.113x. The correlation coefficient was 0.856, with the concentration ratio decreasing exponentially. In P4, "〇" indicates results for growth in contaminated soil after maturity. Despite the different growing conditions, the results were generally close to the expression. From this, it is thought that concentration ratio is affected by time in contact with AN.
3.4. Concentration ratio and content composition ratio of anthracene by radish part
Figure 5 shows the change over time in the concentration ratio of AN by radish part in P4. The concentration ratio in roots and stems was high 1 day after AN application at 15.1, but declined sharply 4 days after application to 4.4. It subsequently increased to 18.8 at 24 days after application of AN. The concentration ratio in roots and leaves was 1.2 at 1 day after AN application and it declined 4 days after application to 0.04 and subsequently rose (with fluctuations) to reach 13.2 at 24 days after application.
Figure 6 shows the change over time in the content composition ratio of AN by radish part in planters P1 to P4. The median AN content ratio in roots was 68.4%, with a range of 2.9–92.0%. The median AN content ratio in the stems was 3.3%, with a range of 0.3–35.8%. The median AN content ratio in the leaves was 26.8%, with a range of 4.5–96.3%. The median was highest in the roots, followed by the leaves and then by the stems. No characteristic tendencies were observed in the fluctuations in change over time for each content ratio. The moisture content of the radishes by part under dehydrating conditions of 105 °C and the organic matter content of radishes by part under combustion conditions of 650 °C, obtained in separate studies, yielded average moisture contents of 88.1%, 93.2%, and 94.4% and average organic matter contents of 87.1%, 81.9%, and 79.6% for roots, leaves, and stems, respectively. Taking into consideration that AN is a hydrophobic substance with a logKow value of 4.45 (Hansh et al. 1995) as well as the water content and organic matter content of radishes by part, it is thought that AN in the soil is absorbed through the roots to circulate within the organism, and is preferentially distributed and accumulated in the roots and leaves, which have high organic matter content.
4. Conclusions
The present study aims at understanding the absorption and concentration of anthracene (AN) in the garden radish. Here, empirical data for AN absorption and accumulation in the radish Raphanus sativus were analyzed and considered their implications. Studies were conducted to grow radishes from the sowing stage in soil contaminated with AN, and to grow radishes in soil contaminated with AN following maturity (27 days after sowing). In both experimental conditions, the relationship between AN concentrations in soil and radishes were positive. Radishes absorbed greater AN quantities the higher its concentration in soil. The concentration ratio (Cr/Cs) decreased exponentially with days since AN application. This suggests that the degree of AN absorbed by radishes is affected by exposure time. According to the results for the time series of part-specific AN concentration ratios and AN contents, it seems that AN in the soil were taken up through the roots to circulate within the organism, and were preferentially distributed and accumulated in the roots and leaves, which have organic matter content.
References
- Adekunlea, A.S. , Oyekunlea, J.A.O., Ojoa, O.S., Maxakatob, N.W., Olutonac, G.O., and Obisesanaa, O.R. “Determination of polycyclic aromatic hydrocarbon levels of groundwater in Ife north local government area of Osun state. Nigeria. Toxicology Reports 2017, 4, 39–48. [Google Scholar] [CrossRef] [PubMed]
- Aydin, Y.M. , Kara, M., Dumanoglu,Y,. Odabasi, M., and Elbir, T. “Source apportionment of polycyclic aromatic hydrocarbons (PAHs) and polychlorinated biphenyls (PCBs) in ambient air of an industrial region in Turkey”. Atmospheric Environment 2014, 97, 271–285. [Google Scholar] [CrossRef]
- ECHA (2021), Candidate List of substances of very high concern for Authorisation; ECHA, Helsinki, Finland. https://www.echa.europa.eu/candidate-list-table.
- Hansh, C. , Leo, A., and Hoekman. (1995), Exploring QSAR - Hydrophobic, Electronic, and Steric Constants, American Chemical Society, Washington, D.C.
- Hazarika, N. , Das, A., Kamal, V., Anwar, K., Srivastaba, A., and Jain, V.K. “Particle phase PAHs in the atmosphere of Delhi-NCR: With spatial distribution. source characterization and risk approximation. Atmospheric Environment, 2019; 200, 329–342, https://www.sciencedirect.com/science/article/pii/S1352231018308483. [Google Scholar]
- IARC (2021), Agents Classified by the IARC Monographs, Volumes 1–129; IARC, Lyon, France. https://monographs.iarc.who.int/agents-classified-by-the-iarc/.
- Li, J. , Li, F., and Liu, Q. “PAHs behavior in surface water and groundwater of the Yellow Riverestuary: Evidence from isotopes and hydrochemistry”. Chemosphere 2017, 178, 143–153, https://www.sciencedirect.com/science/article/pii/S0045653517304150. [Google Scholar] [CrossRef] [PubMed]
- Lin, Y.C. , Li, Y.C., Shangdiar, S., Chou, F.C., Sheu. Y.T., and Cheng, P.C. “Assessment of PM2.5and PAH content in PM2.5emitted from mobilesource gasoline-fueled vehicles in concomitant with the vehicle modeland mileages”. Chemosphere 2019, 226, 502–508, https://www.sciencedirect.com/science/article/pii/S0045653519305831. [Google Scholar] [CrossRef] [PubMed]
- Obrist, D. , Zielinska, B., and Perlinger, J.A. “Accumulation of polycyclic aromatic hydrocarbons (PAHs) and oxygenated PAHs (OPAHs) in organic and mineral soil horizons from four U.S. remote forests”. Chemosphere 2015, 134, 98–105, https://www.sciencedirect.com/science/article/pii/S0045653515003318. [Google Scholar] [CrossRef] [PubMed]
- Pratt, G.C. , Herbrandson, C., Krause, M., Schmitt, C., Lippert, C.J., McMahon, C.R., and Elickson, K.M. “Measurements of gas and particle polycyclic aromatic hydrocarbons (PAHs) in air at urban. rural and near-roadway sites. Atmospheric Environment 2018, 179, 268–278, https://www.sciencedirect.com/science/article/pii/S1352231018301201. [Google Scholar] [CrossRef]
- Satri, E. , Pasti, L., Scaroni, I., Casali, P., Cavazzini, A., and Rossi, M. “Determination of n-alkanes. PAHs and nitro-PAHs in PM2.5and PM1sampled in the surroundings of a municipal waste incinerator. Atmospheric Environment 2017, 149, 12–23, https://www.sciencedirect.com/science/article/pii/S1352231016308913. [Google Scholar]
- Shen, H. , Tao, S., Wang, R., Wang, B., Shen, G., Li, W., Su, S., Huang, Y., Wang, X., Liu, W., Li, B., and Sun, K. “Global time trends in PAH emissions from motor vehicles”. Atmospheric Environment, 2011; 45, 2067–2073, https://www.sciencedirect.com/science/article/pii/S1352231011000951. [Google Scholar]
- Subramanian, A. , Kunisue, T., and Tanabe, S. “Recent status of organohalogens. heavy metals and PAHs pollution in specific locations in India. Chemosphere 2015, 137, 122–134, https://www.sciencedirect.com/science/article/pii/S0045653515006840. [Google Scholar] [CrossRef] [PubMed]
- Thang, P.Q. , Kim, S.J., Lee, S.J., Ye, J., Seo, Y.K., Baek, S.O., and Choi, S.D. “Seasonalcharacteristicsofparticulatepolycyclicaromatichydrocarbons(PAHs)inapetrochemicalandoilrefineryindustrialareaonthewestcoastofSouthKorea”. Atmospheric Environment 2019, 198, 398–406, https://www.sciencedirect.com/science/article/pii/S135223101830774X. [Google Scholar] [CrossRef]
- Wang, C. , Zhou, S., Wu, S., Song, J., Shi, Y., Li, B., and Chen H. “Surface water polycyclic aromatic hydrocarbons (PAH) in urban areas of Nanjing. China. Water Science & Technology, 2017; 76, 2150–2157, https://iwaponline.com/wst/article/76/8/2150/19239/Surface-water-polycyclic-aromatic-hydrocarbons-PAH. [Google Scholar]
- Yang, T. , Cheng, H, Wang, H., Drews, M., Li, S., Huang, W., Zhou, H., Chen, C.M., and Diao, X. “Comparative study of polycyclic aromatic hydrocarbons (PAHs) and heavy metals (HMs) in corals. surrounding sediments and surface water at the Dazhou Island, China. Chemosphere 2019, 218, 157–168, https://www.sciencedirect.com/science/article/pii/S0045653518321702. [Google Scholar] [CrossRef] [PubMed]
- Zhou, C. , Zhu, X., Wang, Z., Ma, X., Chen, J., Ni, Y., Wang, W.E.I.,, Mu, J.U.N., and Li, X. “Gas-Particle Partitioning of PAHs in the urban air of Dalian. China: measurements and assessments. Polycyclic Aromatic Compounds, 2013; 33, 31–51, https://www.tandfonline.com/doi/full/10.1080/10406638.2012.683467. [Google Scholar]
Figure 1.
Planter structure.
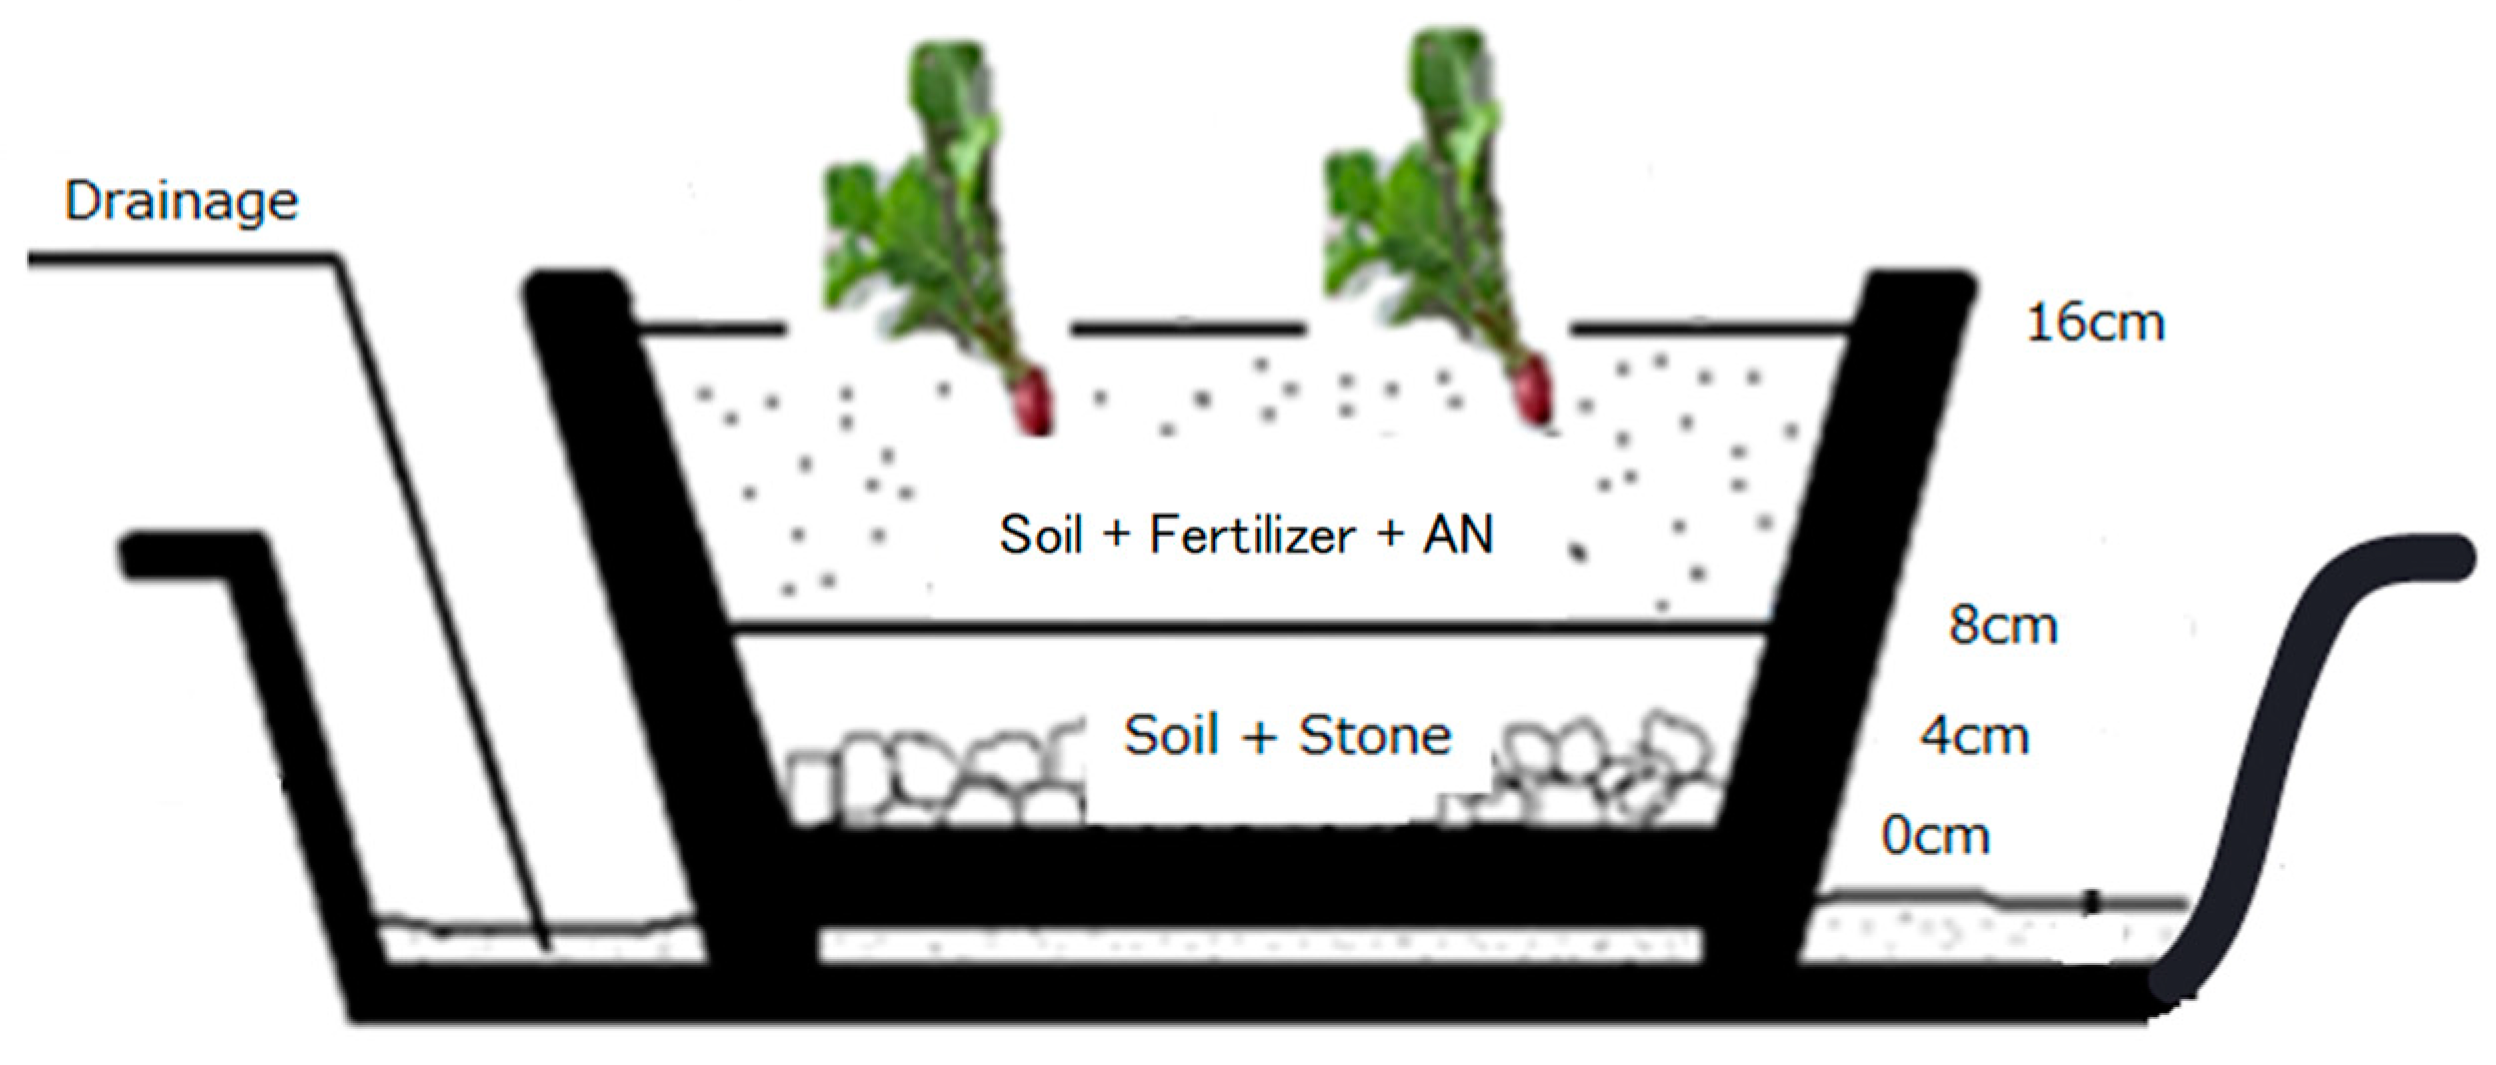
Figure 2.
AN concentrations in (a) soils and (b) radish.
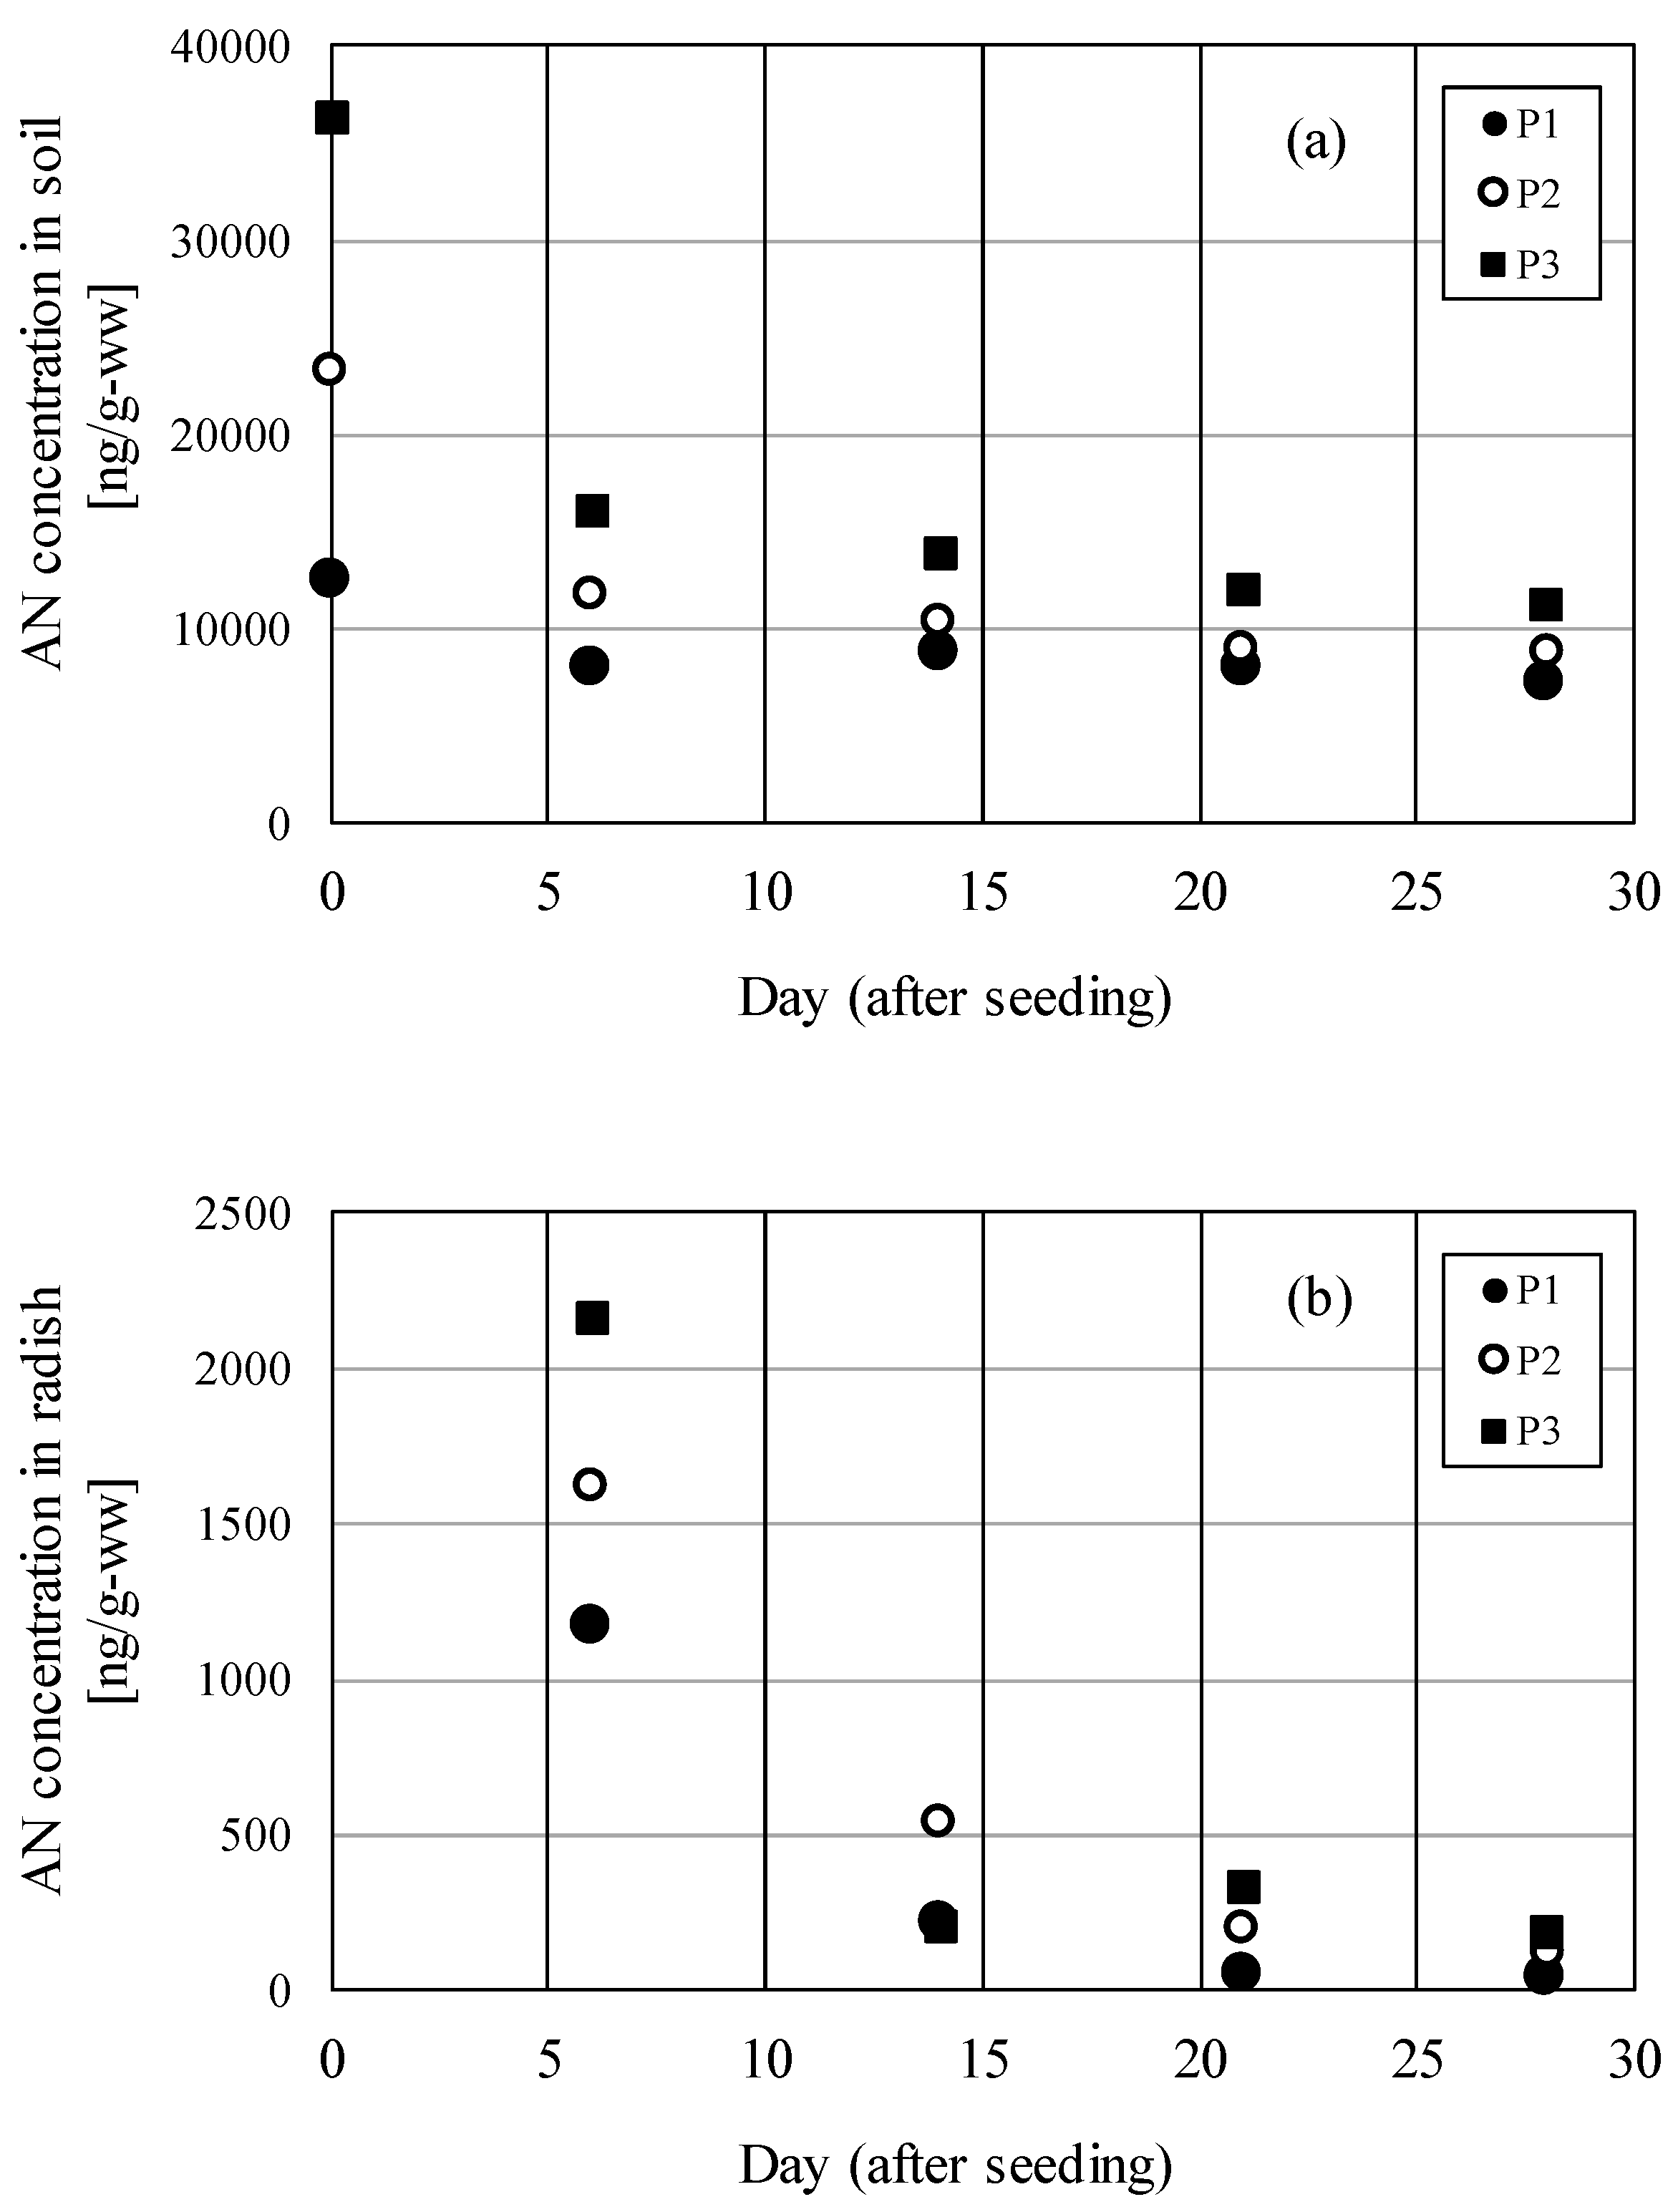
Figure 3.
AN concentration in soil versus radishes.
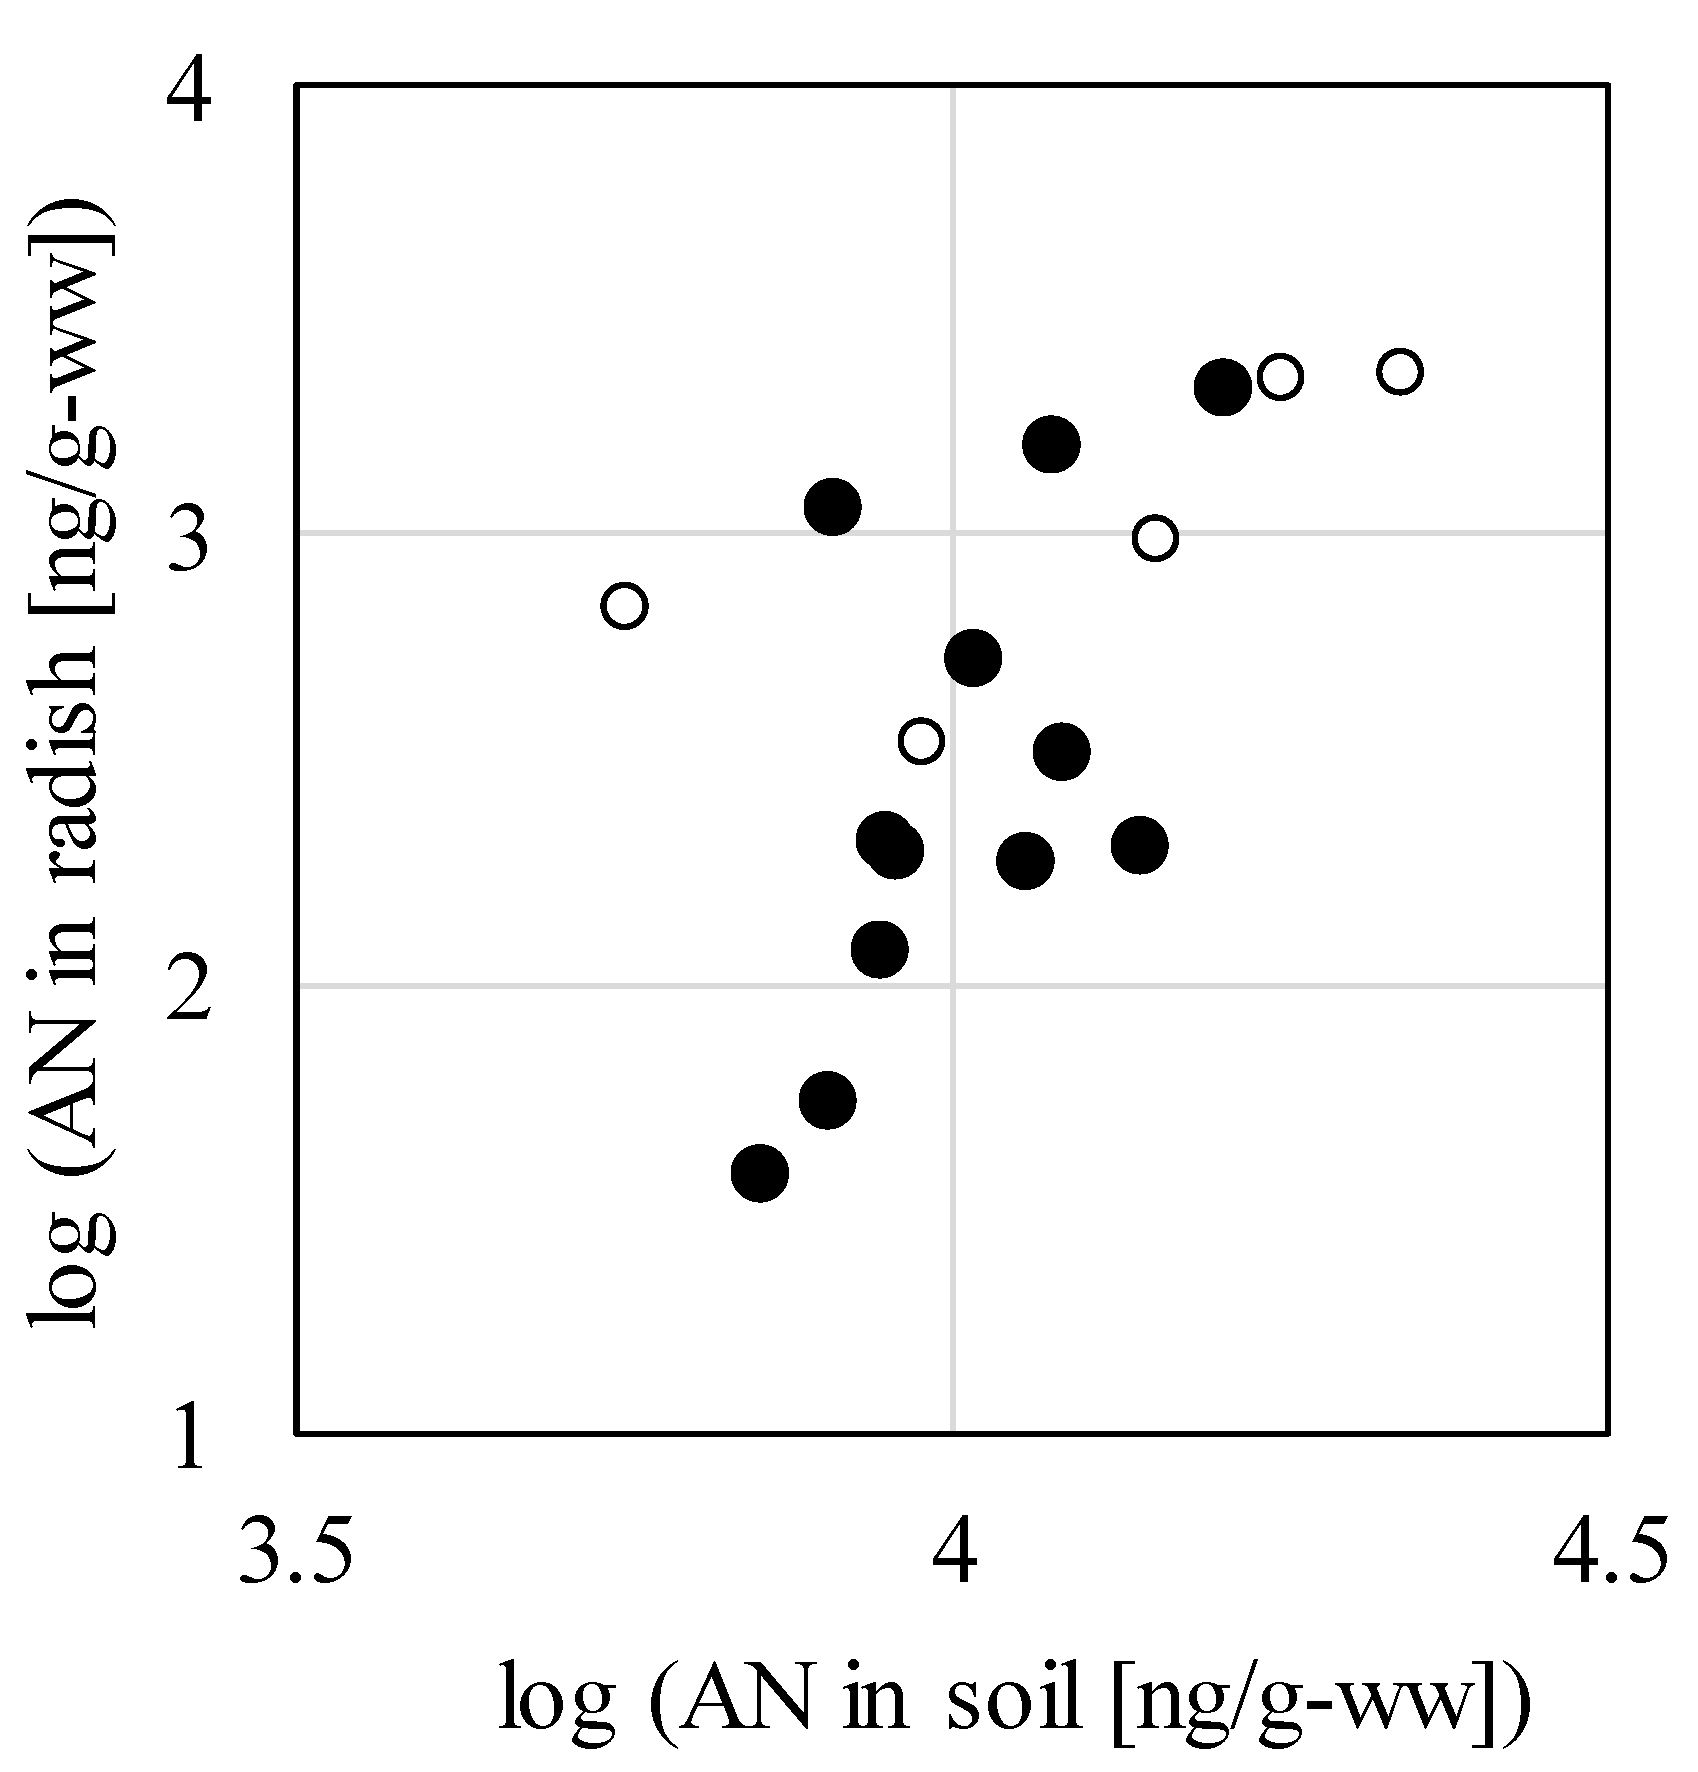
Figure 4.
Days after AN exposure versus Cr/Cs.
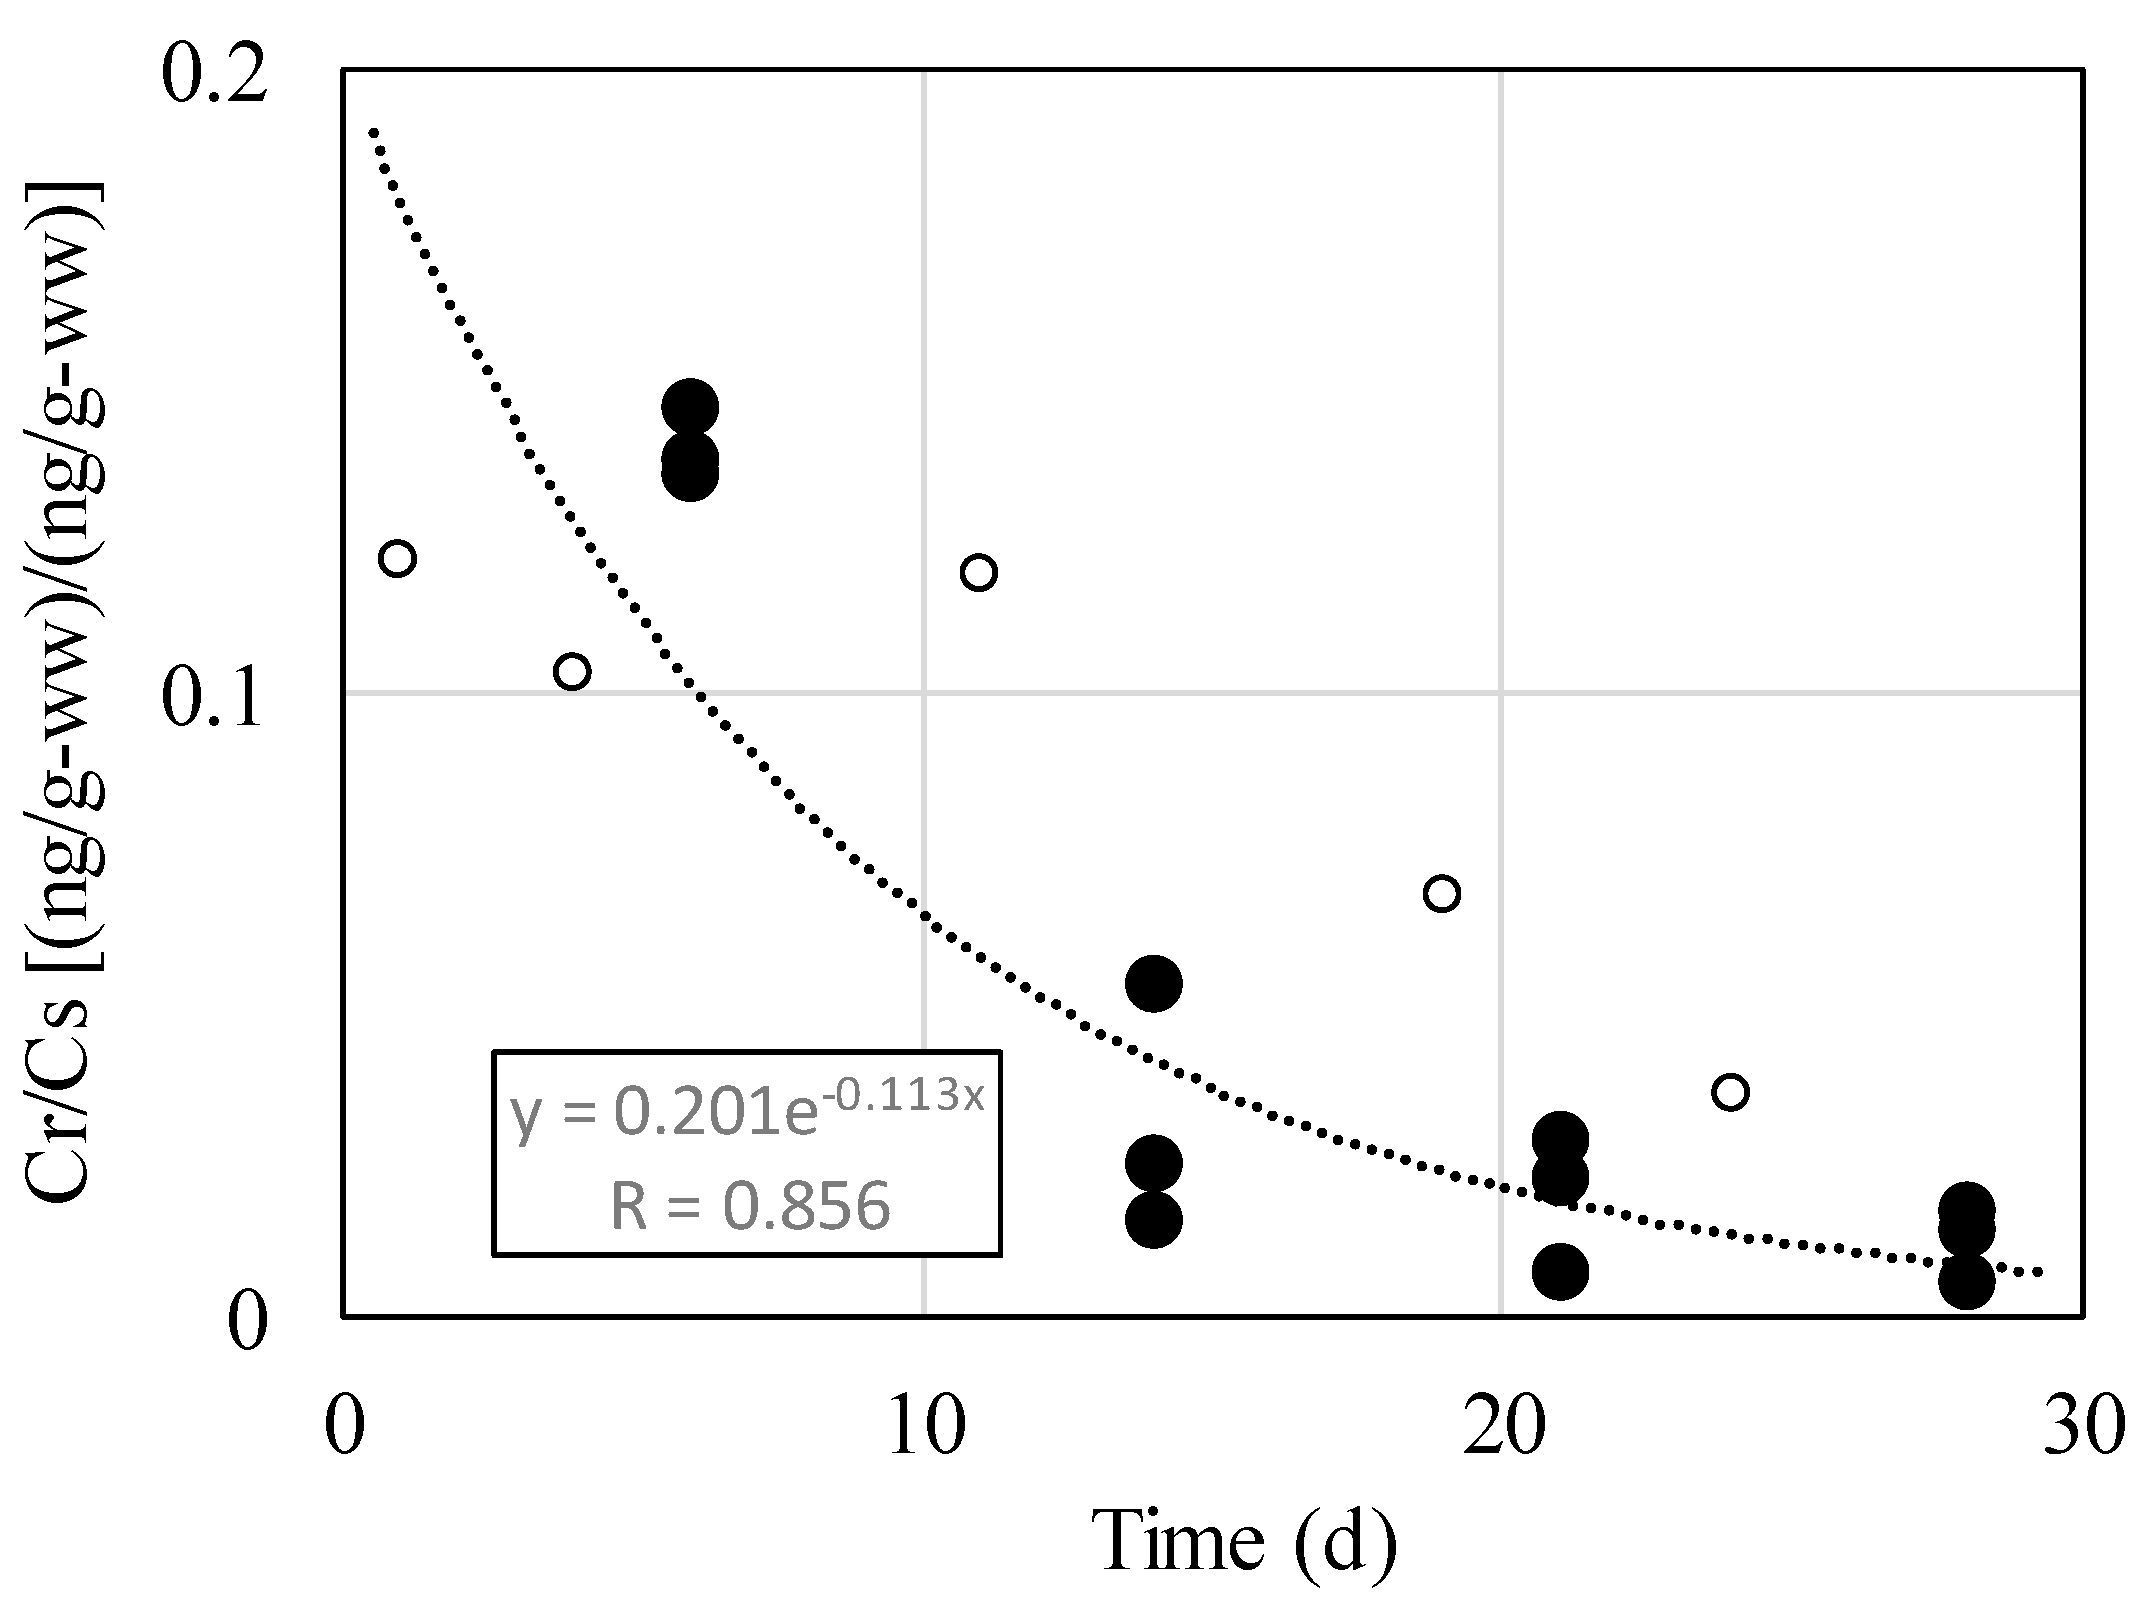
Figure 5.
Time series of part-specific AN concentration ratios (P4).
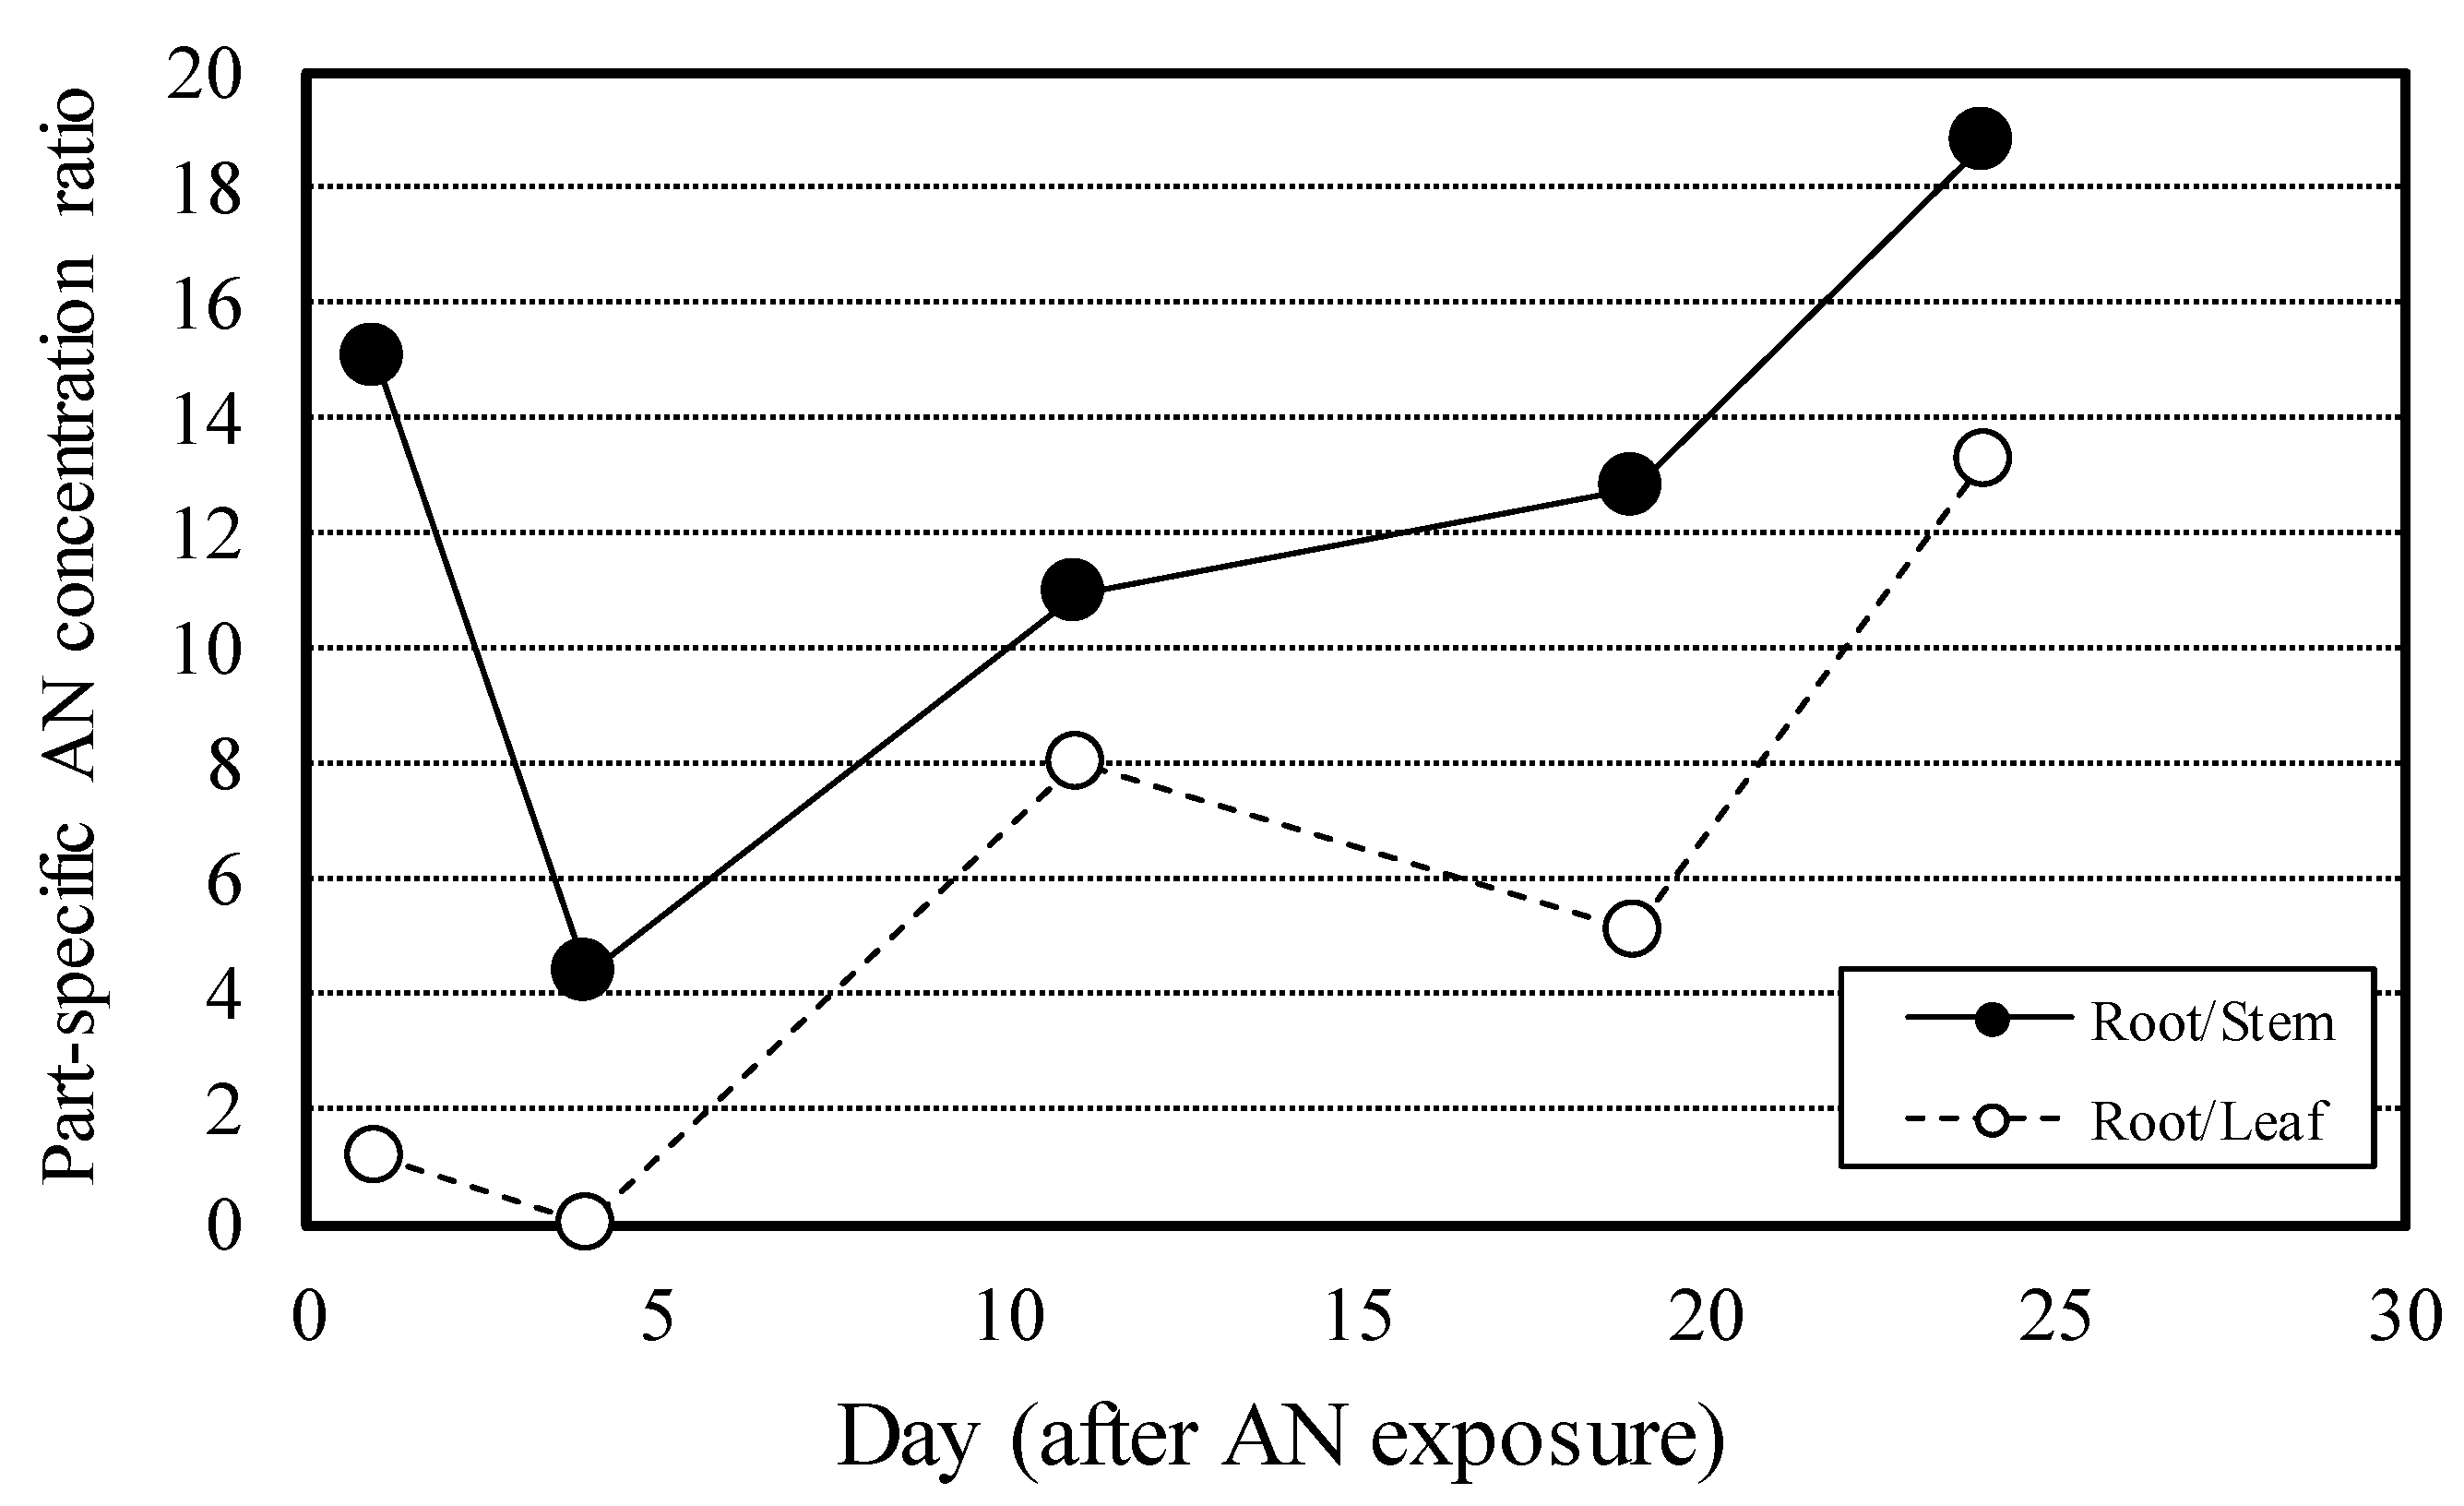
Figure 6.
Time series of relative AN content by part.
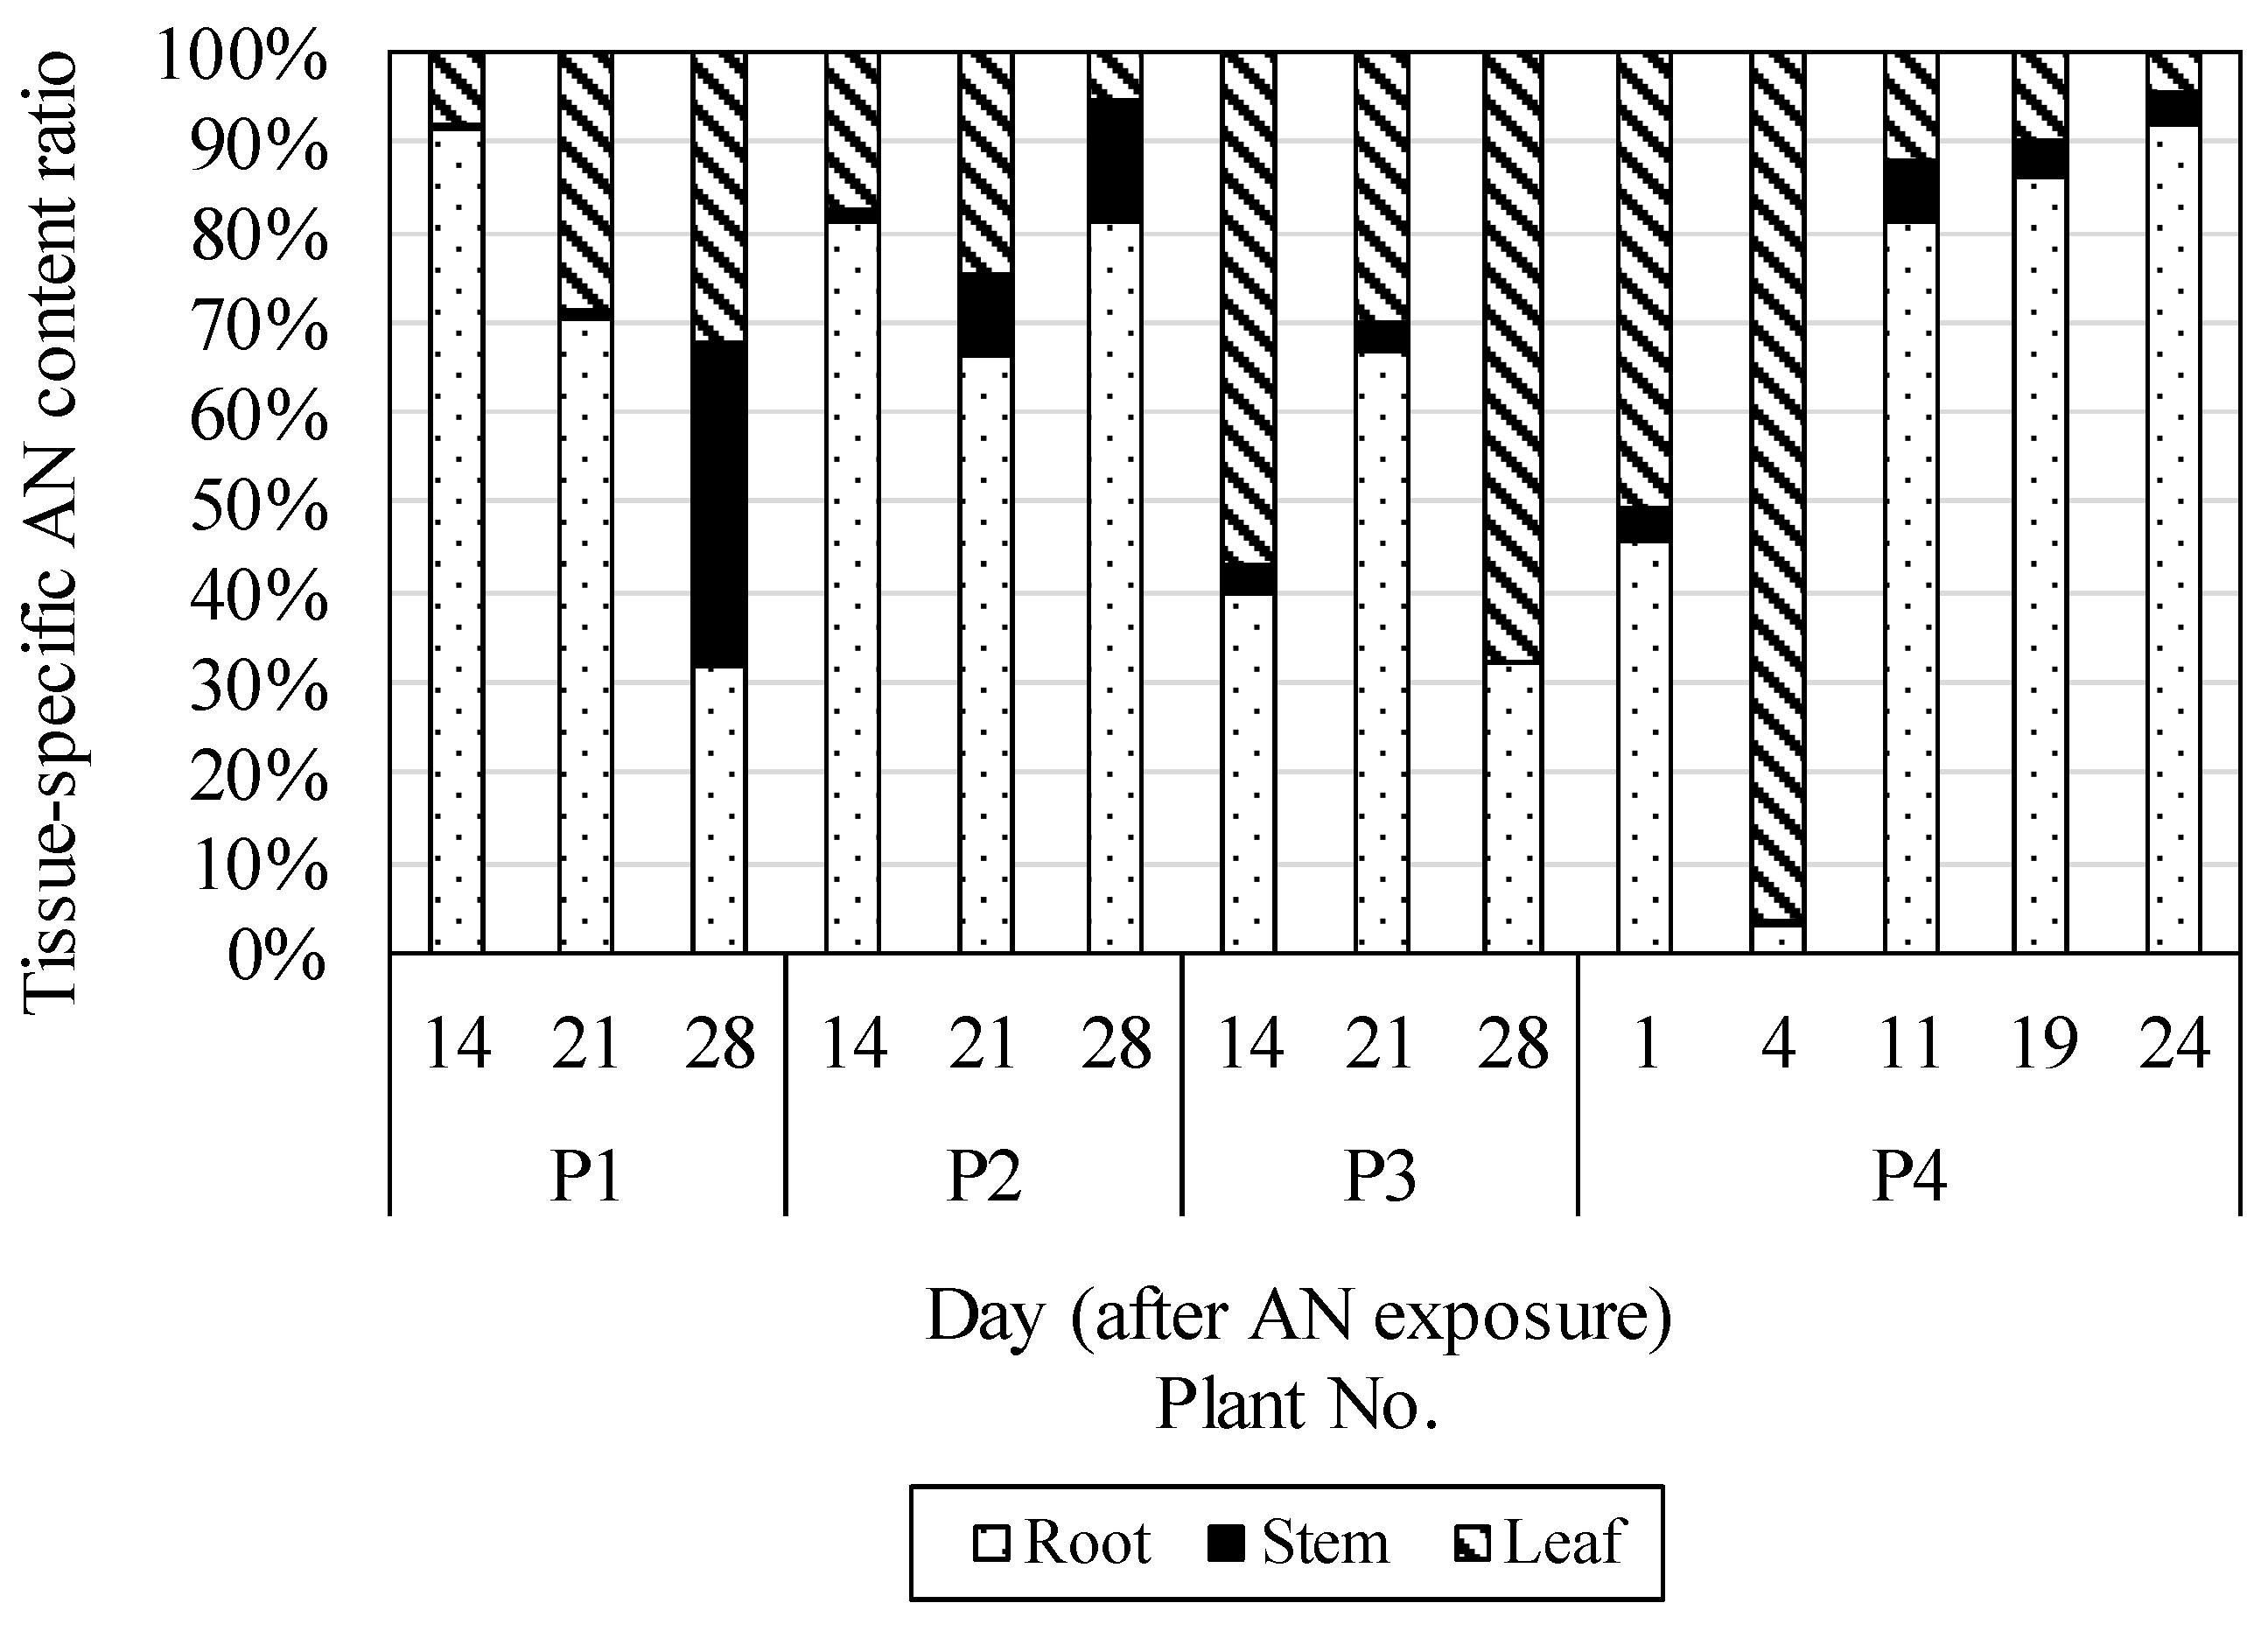

Table 1.
Experimental conditions.
| Planter No. | Growing period | Air temperature | Soil temperature |
| P1 | 3 Jun – 1 Jul, 2019 | 24.0 (26.7) | 25.9 |
| P2 | 3 Jun – 1 Jul, 2019 | 24.0 (26.7) | 26.9 |
| P3 | 2 Jun – 30 Jul, 2019 | 26.7 (28.2) | 28.9 |
| P4 | 1 Jun – 22 Jul, 2019 | 25.3 (27.6) | 26.5 |
Note: Air temperature (°C): Average of daily mean values of outdoor air temperatures during the radish growing period for the area measured by the JMA; parenthetical values are mean actual temperatures measured inside the growing site during the same period (during sprinkling water, between 0800-1000 each day). Soil temperature (°C): Average of five measurements (center and four corners of planter; measured during sprinkling water).
Table 2.
AN concentrations in soil and radishes in experiments under growth in contaminated soil from sowing onward.
Table 2.
AN concentrations in soil and radishes in experiments under growth in contaminated soil from sowing onward.
| Planter | AN | Sample type | Day (after seeding) | ||||
| 0 | 6 | 14 | 21 | 28 | |||
| P1 | 0.05g | Soil | 12500 | 8040 | 8840 | 7980 | 7140 |
| Radish | 1170 | 214 | 55.4 | 38.2 | |||
| (5.16g) 23* |
(14.1g)v17* | (24.6g) 5* |
(45.2g) 3* |
||||
| Root | 2030 | 374 | 31.8 | ||||
| (1.37g) | (2.57g) | (17.3g) | |||||
| Stem | 2.28 | 1.29 | 47.2 | ||||
| (5.32g) | (9.86g) | (13.1g) | |||||
| Leaf | 33.2 | 32.3 | 37.8 | ||||
| (7.43g) | (12.2g) | (14.8g) | |||||
| P2 | 0.10g | Soil | 23300 | 11900 | 10300 | 9020 | 8770 |
| Radish | 1620 | 547 | 200 | 122 | |||
| (6.29g) 27* |
(13.2g) 14* |
(26.6g) 6* |
(48.0g) 3* |
||||
| Root | 4410 | 2580 | 305 | ||||
| (1.33g) | (1.37g) | (15.6g) | |||||
| Stem | 22.7 | 41.2 | 52.9 | ||||
| (4.72g) | (11.6g) | (15.1g) | |||||
| Leaf | 174 | 96.5 | 18.3 | ||||
| (7.18g) | (13.6g) | (17.3g) | |||||
| P3 | 0.20g | Soil | 36300 | 16000 | 13800 | 12000 | 11300 |
| Radish | 2160 | 207 | 337 | 189 | |||
| (3.87g) 20* |
(9.09g) 10* |
(19.4g) 6* |
(26.3g) 3* |
||||
| Root | 853 | 3630 | 250 | ||||
| (0.88g) | (1.20g) | (6.38g) | |||||
| Stem | 16.8 | 24.9 | 2.05 | ||||
| (3.31g) | (8.25g) | (7.40g) | |||||
| Leaf | 219 | 198 | 268 | ||||
| (4.90g) | (10.0g) | (12.5g) | |||||
Note: Units are ng/g-ww, unless otherwise noted. Blank cells show that there is no measurement at that point in time. AN concentrations and weights were determined each part of a plant for root, stem, and leaf samples. “Radish” denotes AN measured data for the whole plant: concentration was multiplied by weight for each part, the products added together, and the total divided by the sum of weight. Upper numerical data in each cell are concentrations (ng/g-ww); middle parenthetical numerical data are masses (g); lower values with asterisk (*) are the number of radish sample measured. Upper values for root, stem, and leaf measurements are concentrations (ng/g-ww); lower parenthetical numerical data are masses (g).
Table 3.
AN concentrations in soil and radishes under late exposure experiments.
| Planter | Sample type | Day (after seeding) | |||||
| 0* (27) | 1* (28) | 4* (31) | 11* (38) | 19* (46) | 24* (51) | ||
| P4 | Soil | N.D. | 17900 | 22100 | 5670 | 14400 | 9560 |
| Radish | N.D. | 2180 | 2270 | 879 | 967 | 342 | |
| (17.1g) | (13.9g) | (34.1g) | (35.6g) | (52.8g) | |||
| Root | N.D. | 3470 | 228 | 2230 | 1820 | 742 | |
| (4.92g) | (4.03g) | (11.0g) | (16.3g) | (22.4g) | |||
| Stem | N.D. | 230 | 52.2 | 182 | 143 | 39.5 | |
| (5.80g) | (4.55g) | (10.2g) | (9.87g) | (15.7g) | |||
| Leaf | N.D. | 2960 | 5750 | 283 | 356 | 55.9 | |
| (6.34g) | (5.28g) | (13.0g) | (9.46g) | (14.7g) | |||
Note: Units are ng/g-ww, unless otherwise noted. N.D. indicates ‘not detected’. Asterisks (*) show the number of days after AN was buried; parenthetical numerical data show the number of days after seeding. AN concentrations and weights were measured each part of a plant for root, stem, and leaf samples. “Radish” denotes AN measured data for the whole plant: concentration was multiplied by weight for each part, the products added together, and the total divided by the sum of weight. Upper numerical data in each cell are concentrations (ng/g-ww); lower parenthetical numerical data are masses (g).
Disclaimer/Publisher’s Note: The statements, opinions and data contained in all publications are solely those of the individual author(s) and contributor(s) and not of MDPI and/or the editor(s). MDPI and/or the editor(s) disclaim responsibility for any injury to people or property resulting from any ideas, methods, instructions or products referred to in the content. |
© 2024 by the authors. Licensee MDPI, Basel, Switzerland. This article is an open access article distributed under the terms and conditions of the Creative Commons Attribution (CC BY) license (http://creativecommons.org/licenses/by/4.0/).
Copyright: This open access article is published under a Creative Commons CC BY 4.0 license, which permit the free download, distribution, and reuse, provided that the author and preprint are cited in any reuse.


