
Submitted:
04 January 2024
Posted:
04 January 2024
You are already at the latest version
Abstract
Measurements of complex magnetic permeability, μ(f,H)=μ′(f,H)-iμ″(f,H) and dielectric permittivity ε(f,H)=ε′(f,H)-iε″(f,H), in the frequency range, f of (0.4-7) GHz, and polarizing field, H of (0–135) kA/m, were performed, for a kerosene-based ferrofluid with magnetite nanoparticles. Based on these measurements, the phenomenon of ferromagnetic resonance was highlighted and some microwave propagation parameters of the ferrofluid were determined: the attenuation constant, α(f,H), and the reflection coefficient, R(f,H), at the air-material interface. Knowing these parameters we proposed a theoretical model establishing for the first time a new equation that allows the calculation of the overall reflection coefficient, Rw(f,H), of a ferrofluid with thickness d, deposited on a totally reflective support, following multiple internal reflections of the electromagnetic wave in the material. The results show that by increasing both, H, and d, the parameter, Rw(f,H) presents a minimum that decreases from 0.90 (for d=2mm) to 0.64 (for d=10 mm), at frequency f=5 GHz, which indicates an increase in the absorption of the electromagnetic wave by the ferrofluid. The obtained results are useful in the study of some materials that could be used as electromagnetic absorbers in the microwave range, by the determination of the overall reflection coefficient, Rw(f,H), controlled both by the thickness, d , of the absorber and by the external applied field, H.
Keywords:
ferrofluid
; complex dielectric permittivity
; complex magnetic permeability
; the attenuation con-stant
; the reflection coefficient
; absorbing properties.
1. Introduction
Ferrofluids are colloidal systems of single-domain magnetic nanoparticles, having a distribution of sizes between (3-15) nm being dispersed in a carrier liquid and coated with a surfactant to prevent their agglomeration [1]. Each particle can be in a state of uniform magnetization with the magnetic moment, m=MSVm, where MS is the spontaneous magnetization of the bulk material from which the particles come, and Vm is the magnetic volume of the particle.
It is known that, due to anisotropy, single-domain particles can have more than one axis of anisotropy, but the particle presents a minimum energy along a preferential axis called the principal axis. As a result, in the theoretical investigations of the magnetic properties of ferrofluids, it is assumed that the single-domain particles in a ferrofluid have uniaxial anisotropy [1] and the effective anisotropy constant, Keff, is the result of the combination of magnetocrystalline, shape or surface anisotropy [2,3]. For the single-domain particle with uniaxial anisotropy, the anisotropy field, HA is given by the relation [2,4]:
where μ0 is the magnetic permeability of free space.
Measurements of the complex magnetic permeability, μ(f, H) in the microwave range and in presence of a polarizing magnetic field H, allow the determination of the real μʹ(f, H) and imaginary μʺ(f, H) components [5,6,7], which are very useful both for highlighting the phenomenon of ferromagnetic resonance and for evaluating the anisotropy field HA, and other magnetic parameters of nanoparticles in ferrofluids. Starting from the Landau–Lifshitz equation [4], which describes the movement of the magnetic moment m of the particle, in a magnetic field H, for a strong polarizing magnetic field (H>>HA), the resonance condition is written in the form [8]:
This equation shows a linear dependence between the resonant frequency, fres and H, whose slope is γ, (called the gyromagnetic ratio of the particle), and is given by the following relation:
In Equation (3), g is the spectroscopic splitting factor; γe=8.791x10¹⁰ s-1T-1 is the electronic gyromagnetic ratio and αL is the damping parameter of the Landau–Lifshitz equation [4]. In the ferromagnetic resonance range, knowing these parameters of the nanoparticles in the ferrofluid is very important in some microwave applications [9]. Among the practical applications based on microwaves, we can mention the wireless connection, through radio waves, global positioning system (GPS), radar and mobile telephony, and with the progress made in these applications, the problem of electromagnetic interference appears, thus requiring the finding of materials with electromagnetic absorbing properties [10], which are very necessary in the field of electromagnetic shielding [11]. At the same time, the increased use of electronic devices leads to significant pollution with electromagnetic waves, so that the study of electromagnetic wave absorbers (EMAs) is appropriate [12,13,14]. The results reported in [15] clearly show that composite materials are effective in reducing electromagnetic interference (EMI) pollution, with special attention being paid to the development of new nanocomposite materials with high electromagnetic absorbing properties.
Ferrofluids are considered to be nanocomposite systems and may show special electromagnetic properties which differ from the typical properties of the individual constituent components [16]. To design devices with specific microwave properties, such as the electromagnetic absorbers [15,17], it is necessary to undertake an analysis regarding the propagation of the electromagnetic waves in ferrofluids and the determination of propagation parameters correlated with possible absorbing properties of the ferrofluid in the microwave field.
It is known that in the case of plane wave propagation [18] through an electromagnetic medium along the Oz axis, the complex temporal expressions of the electric () and magnetic () components of the electromagnetic field are given by the relations:
where, and are unit vectors on the Ox and Oy axes and ; (ωt-βz) represents the phase of the electromagnetic wave, β being the phase constant and ω the angular frequency. Also, E0e-αz and (E0/Zm)e-αz are the amplitudes of the electric and magnetic components of the electromagnetic wave, where α and Zm represent the attenuation constant and the intrinsic impedance of the propagation medium, respectively, which are given by the relations [19]:
In these relations, f is the frequency of electromagnetic wave; c=3x10⁸ m/s is the speed of electromagnetic waves in free space and Z0=(μ0/ε0)1/2=377 Ω is the intrinsic impedance of free space (ε0 being the dielectric permittivity of free space). Considering the complex form of the relative magnetic permeability, as well of the relative dielectric permittivity, , the following expression for calculating the intrinsic impedance of the medium is obtained from Equation (7):
Let’s assume that an electromagnetic wave comes from medium 1 and is reflected on the surface of medium 2 (Figure 1).
It is known that the modulus of the reflection coefficient R, on the reflection surface, is defined as the ratio between the complex amplitude of the reflected wave and the complex amplitude of the incident wave [15,20], and in the case of the field perpendicular to the plane of incidence, the reflection coefficient, R, is given by the relation [20]:
Considering the definition of the intrinsic impedance of a medium (Equation (7)), R can be written as:
where Zm1 and Zm2 are the intrinsic impedances of the medium 1 and medium 2 respectively.
The absorbing properties of the propagation medium can be highlighted both by the attenuation constant, α and by the reflection coefficient R. As a result, the aim of the work presented here, was to investigate the microwave absorption properties of a ferrofluid sample, by determining the parameters α, and R, at different H values and sample thicknesses d. For this, we performed measurements of μ(f,H) and ε(f,H), in the microwave range (0.4 - 7) GHz and at different values H, (0 - 135) kA/m, for a ferrofluid sample. At the same time we proposed a theoretical model for computing the overall reflection coefficient, Rw(f, H) of a plane wave absorber with a single layer supported by a perfect conductor, following multiple internal reflections, valid for any material/composite system that has absorbing properties in microwave range, applied to the investigated ferrofluid sample.
2. Theoretical model of the overall reflection coefficient
Another important parameter relating to electromagnetic absorbers is the overall reflection coefficient, Rw, of a material with thickness d, through which an electromagnetic wave propagates. To define Rw, consider a thin layer of an absorbent material (having the attenuation constant α and reflection coefficient R), deposited on a metal support (total reflective support) (Figure 2). We consider that the incident wave (Ei) comes from medium 1 (air) and on the air-material interface, at point A, is reflected (R1 wave) and simultaneously, is transmitted (Et wave) in the material (medium 2).
The absorption of the wave is performed during its passage through medium 2, both before and after total reflection on the reflective support, at point B. By returning to the interface air–material, at point C, both reflection in material (medium 2) and transmission in air (medium 1) of the wave (see Figure 2) occurs. Similarly, at point C, there will be several internal reflections of the wave in the absorbing medium, followed by its return to medium 1. All reflected waves and re-reflections at the interface air-absorbing material, which reach medium 1 (air) (see Figure 2), will thus determine the overall reflection coefficient, Rw, of the absorbing material.
It is known that the modulus of the transmission coefficient, T, in absorbent material, is defined as the ratio between the complex amplitude of the transmitted wave and the complex amplitude of the incident wave [15,20]. At the same time, the reflection (R) and transmission (T) coefficients at the air-material interface are related by the relation, T+R=1 [15]. Keeping these definitions in mind, both the wave reflected and transmitted through the material at point A can be written mathematically with the relations:
where, with ER1(A) and Et(A), are the reflected and transmitted wave respectively, at point A (see Figure 2).
The Et(A) wave travels through the absorbent material and will arrive, attenuated at point B on the total reflective metallic support, and is then reflected. As a result,
Due to the total reflection on the reflective metallic support, the reflected wave, Er2(B)=Ei2(B), will then travel through the absorbing material (medium 2) and will arrive attenuated at point C (Ei3(C) wave), on the air-absorbing material incident surface (see Figure 2); Ei3(C) being expressed by the relation:
where Equation (13) was considered.
At point C, the incident wave Ei3(C) will be reflected in medium 2 and at the same time will be transmitted in medium 1 (air) (Figure 2). On incident surface at the point C, the transmission coefficient T, will be the same as at point A, so that the following relation can be written for the transmitted wave Et3(C):
Considering relation (14), Equation (15) becomes:
Following the same reasoning, we determined the expressions of the re-reflected waves in medium 1 (air), T5, T7, T9,……(see Figure 2). Result:
As a result, on the incident surface (air-absorbent material), after the repeated passes of the wave through the material and returning to medium 1 (air), the following relation can be written:
where,
represents the sum of all reflected waves and re-reflections from medium 1, after the electromagnetic wave has been totally reflected an infinite number of times, on the metal support by passing through the absorbing medium. Considering relations (12), (14), (17)–(21), the overall reflection coefficient Rw, at normal incidence is given by the following equation:
Unlike other papers [21,22], relation (22) represents a new equation that allows a much more precise determination of the overall reflection coefficient Rw, which takes into account the multiple total reflections of the electromagnetic wave on the reflective metal support, when the wave passes through absorbent material, being valid for any material/composite system that has electromagnetic wave absorption properties.
3. Sample and experimental setup
The investigated sample was a ferrofluid with magnetite nanoparticles dispersed in kerosene and stabilized with oleic acid using the new technique of hydrophobization in the absence of the dispersion medium [23]. The obtained magnetic material was dispersed in kerosene and then filtered in a magnetic field gradient in order to remove aggregates and large particles [23,24].
The static magnetization curve of the ferrofluid sample (Figure 3) was determined using an inductive method [25] and it shows a Langevin-type dependence [1]. Based on the magneto-granulometric analysis of Chantrell [26] and the M(H) dependence from Figure 3, we have determined the following parameters for the ferrofluid sample, assuming the particles to be of spherical shape: the saturation magnetization of the ferrofluid, Msat=22.47 kA/m; the mean magnetic diameter of a particle, dm=8.03 nm; the particles concentration, n=12.44·1022 m-3 and initial susceptibility χin=1.048.
μ(f,H) and ε(f,H), of the sample were measured using the short-circuited (SC) or open-circuited (OC) coaxial transmission line technique [27,28], over the frequency range (0.4–7) GHz and at values of H, between 0 to 135 kA/m. For this, we have used a Hewlett Packard (HP) 50W coaxial line incorporating a coaxial cell, containing the ferrofluid sample, in conjunction with the HP 8753C network analyzer [28]. The coaxial cell was placed between the poles of an electromagnet, the axis of cell being perpendicular to the polarizing magnetic field.
4. Results and discussions
Figure 4 shows the dependence on frequency f, and magnetic field H, of the components εʹ(f,H) and εʺ(f,H) of the complex dielectric permittivity and Figure 5 shows the dependence on frequency f and magnetic field H of the components of μʹ(f, H) and μʺ(f, H) of the complex magnetic permeability of the investigated ferrofluid sample.
As can be seen from Figure 4, for a constant frequency f, the real component εʹ(f) increases between (2.2 -2.5) with increasing H, and the imaginary component εʺ(f) decreases with the increase of H. At the same time, ε"(f) displays a maximum in the frequency range between (3-5) GHz, for each H value of the magnetic polarizing field, which indicates a relaxation process attributed to the interfacial polarization mechanism [29]. Also, the maximum amplitude of the imaginary component εʺ(f), of the complex dielectric permittivity increases with the magnetic field for the first seven values of H, and then, for the next 3 values, it decreases with H, this behavior being characteristic of the formation of the particle agglomerations in the ferrofluid sample [30].
From Figure 5, it is observed that the investigated ferrofluid sample presents the ferromagnetic resonance phenomenon, highlighted by the transition of the real part of the complex magnetic permeability, μʹ(f), from a superaunit value to a subunit value at the resonant frequency, fres [8,28]. By increasing the polarizing magnetic field H, the fres frequency moves to higher values from 1.245 GHz (for H=0) to 6.170 GHz (at H=135.45 kA/m). At the same time, from Figure 5 it is observed that the imaginary component, μʺ(f), has a maximum at the frequency fmax, very close to the fres frequency, named the maximum absorption frequency, which moves to higher values with increasing H, from 0.942 GHz (for H = 0) to 6.048 GHz (for H=135.45 kA/m).
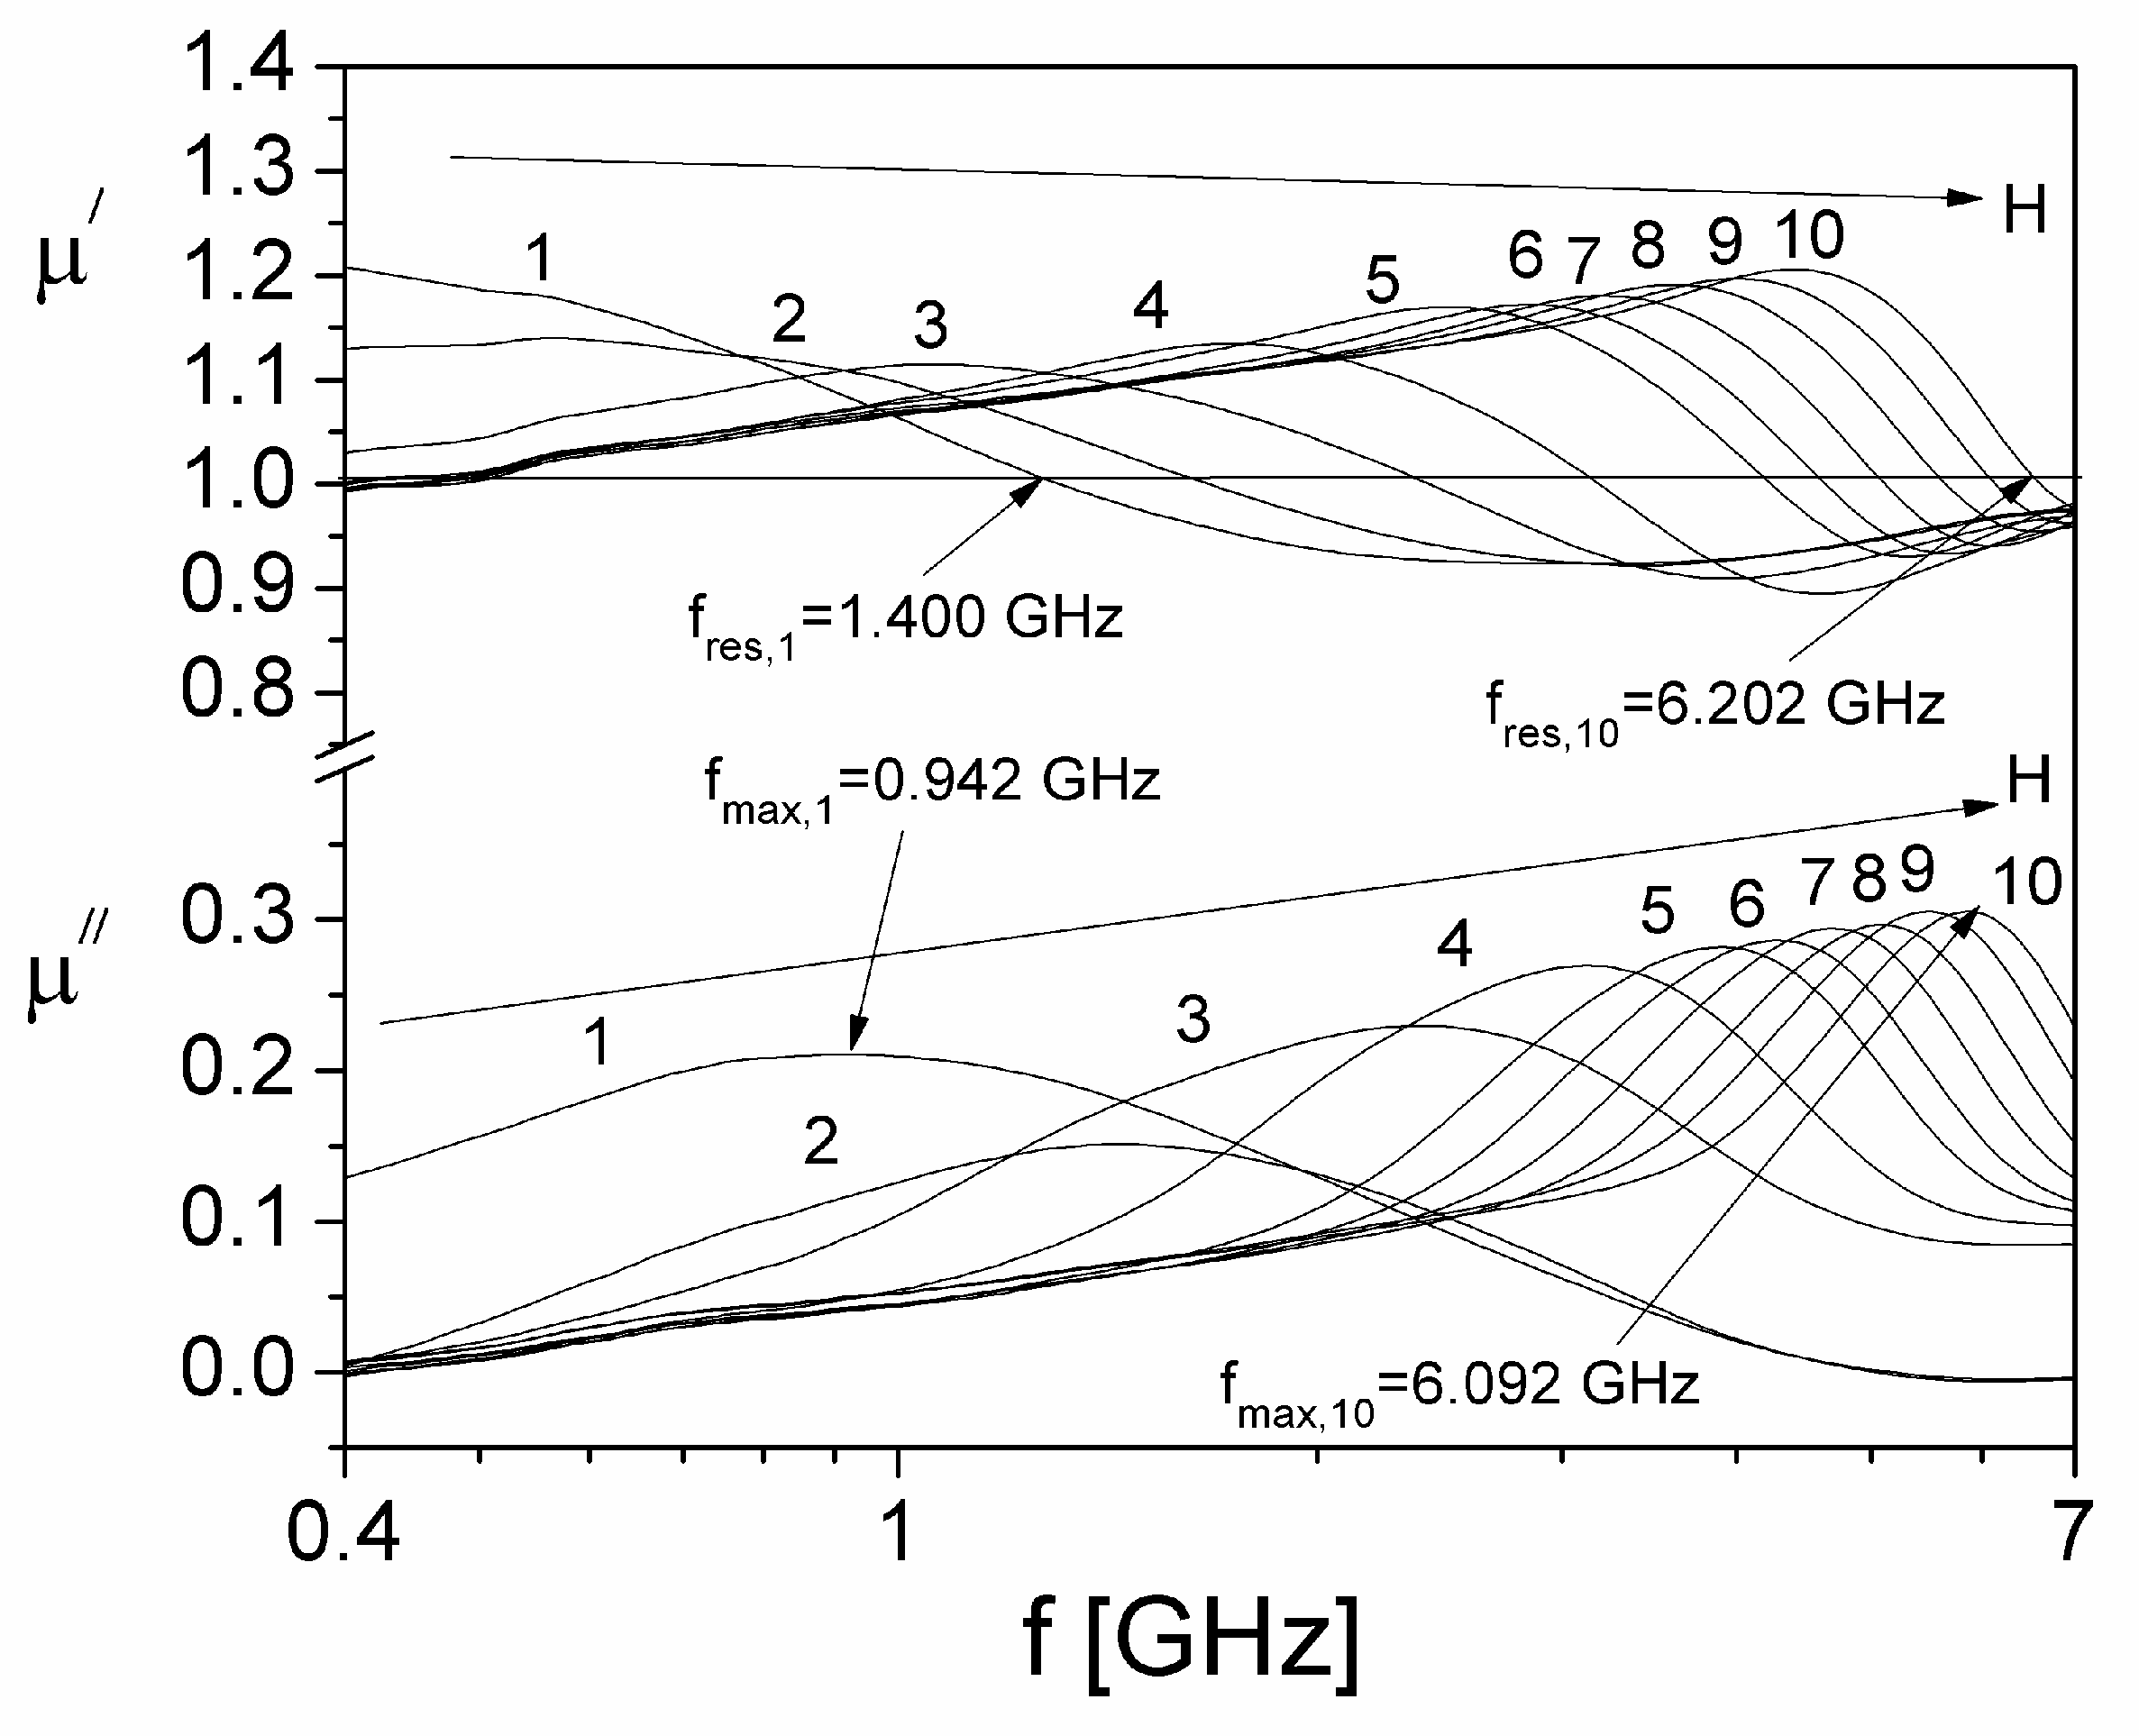
Figure 5.
The frequency dependence of the complex magnetic permeability components of the ferrofluid sample, for 10 different values of polarizing field, H, corresponding to, (1) H = 0; (2) H=15.24 kA/m; (3) H=35.28 kA/m; (4) H=57.07 kA/m; (5) H=79.33 kA/m; (6) H=90.66 kA/m; (7) H=102.40 kA/m; (8) H=113.43 kA/m; (9) H=124.47 kA/m; (10) H=135.45 kA/m.
Knowing the values of the fres, corresponding to each H value, from Figure 5, we were able to obtain the dependence of fres on H, which is linear, as can be seen in Figure 6, being in accordance with Equation (2).
By fitting with a straight line, the experimental dependence fres(H) from Figure 6, we were able to determine the anisotropy field HA and the gyromagnetic ratio of the particle γ; the values obtained being: HA=38.75 kA/m and γ=2.25x10⁵ s-1A-1m. From Eq (1), we determine that the effective anisotropy constant, which agrees with the values obtained in the literature [31,32] for magnetite particles. Taking into account both the value obtained for γ, and the relation (3) valid for high values of the magnetic field H>HA, we were able to determine the damping parameter of the Landau–Lifshitz equation αL, and using the value g=2, specific to a kerosene-based ferrofluid with magnetite particles [5,8,33], we obtained the value, αL=0.194. As shown in the paper [34], high values obtained for the αL parameter (αL>0.1) can be due either to the polydispersity of the nanoparticle systems [35], or to the interactions between the particles [36], in presence of a high polarizing magnetic field.
Based on the experimental values obtained for εʹ(f,H) and εʺ(f,H) (Figure 4) and components μʹ(f,H) and μʺ(f,H) (Figure 5), the frequency dependence of the attenuation constant of the electromagnetic wave, α(f) at different values of magnetic field H, was computed using the Equation (6). The results are presented in Figure 7.
From Figure 7 it is observed that the attenuation constant α, at microwave frequencies in a ferrofluid sample, has a maximum at a frequency fm, for each value of H, which shifts from 1.764 GHz (for H=0) to 6.164 GHz (for H=135.45 kA/m). For frequencies less than 1.764 GHz, the attenuation constant α decreases with increasing H and for a frequency greater than 6 GHz, the α increases with increasing H.
Figure 8 shows the dependence of α, on H, at four frequencies, f, of the electromagnetic field, in the range (1–6) GHz. From Figure 8 it is observed that α presents a maximum at a value of Hmax, which moves to higher values from 40 kA/m (at f=2 GHz) to 109 kA/m (at f=5 GHz), over the frequency range of (1.764–6) GHz. Also, for H >Hmax, α decreases with increasing H (Figure 8). This result is very useful in magnetically controlled electromagnetic absorbers applications because it provides information on the maximum limit of the magnetic field applied for control of α, at different frequencies.
Using the Equations (8) and (10) and experimental values of the components εʹ(f,H) and εʺ(f,H) of (Figure 4) and components μʹ(f,H) and μʺ(f,H) of (Figure 5), the frequency dependence of the reflection coefficient at the interface air-ferrofluid, R, at different values of magnetic field H, was computed and the results are presented in Figure 9.
As can be seen from Figure 9, for the reflection coefficient at the interface air–ferrofluid for normal incidence R(f,H), two regions of interest for applications are distinguished: the first region corresponding to frequencies lower than 0.65 GHz when R(f,H) increases with the increase of the H field and the second region in the domain of ferromagnetic resonance (4.2 -5.5 GHz), in which R(f,H) decreases with the increase of H. Knowing the values of R(f,H) at the interface air–ferrofluid for normal incidence (Figure 9) and the attenuation constant α(f, H) at microwaves in ferrofluid sample (Figure 7), based on Equation (22) we calculated the overall reflection coefficient Rw(f, H) for 3 values of the thickness d of the ferrofluid sample: 2mm, 5mm and 10 mm. For the third term in Equation (22), in Reff's calculation, we considered only the terms corresponding to k=1 and k=2, because for , the calculated values decrease very quickly, tending towards zero, being thus negligible. The calculation relations for the third term in Equation (22) corresponding to the values k=1, 2, 3, 4 are as follow:
In Table 1, the values computed with relations (23)–(26), for k=1, 2, 3, 4 corresponding to the frequencies of 2 GHz, 4 GHz and 5 GHz, both in zero field (H=0) and in the presence of the magnetic field (H=135.45 kA/m), are listed, for the three considered thicknesses d of the sample.
From Table 1 it can be seen that the terms T3(3) and T3(4), corresponding to k=3 and k=4 respectively, are much smaller than the terms T3(1) and T3(2), corresponding to k=1 and respectively k=2, for all frequencies f and all thicknesses d considered, of the sample, both in the zero field and in the presence of the H field. At the same time, as the thickness of the sample d increases, the value of the terms T3(3) and T3(4), becomes very small close to zero, so that the contribution to the calculation of the Reff parameter, with Equation (22) of all terms starting with , was neglected.
Based on the computations, the overall reflection coefficient Rw, for 3 values of the thickness d of the ferrofluid sample, 2mm, 5mm and 10 mm, the frequency and magnetic field dependencies of the overall reflection coefficient, Rw(f,H), of the ferrofluid deposited on a totally reflective support, for normal incidence, are presented in Figure 10 a), b) and c).
From Figure 10 a), b) and c), it can be observed that for all three thicknesses d of the investigated ferrofluid sample, the coefficient Rw(f,H) decreases with the increase of the magnetic field at frequencies higher than 5.9 GHz, while at frequencies below approximately 1 GHz, the overall reflection coefficient, Rw(f,H) increases with increasing H.
Figure 11 shows the dependence of the overall reflection coefficient Rw, on the magnetic field H, at three frequencies, f, of the electromagnetic field, in the range (1–6) GHz, for the three considered thicknesses d of the ferrofluid sample deposited on a totally reflective support, for normal incidence.
For each frequency f, of the electromagnetic field (2 GHz, 4 GHz and 5 GHz), from Figure 11 it can be observed that with increasing magnetic field, H, the overall reflection coefficient Rw presents a minimum that is accentuated by increasing the thickness d, of the ferrofluid sample. Thus, at f=2 GHz, the minimum of Rw appears at the same value of the polarizing magnetic field, Hmin,(2 GHz)=40 kA/m, decreasing from the value 0.93 (for d=2 mm) to 0.87 (for d=10 mm), while at f=5 GHz the minimum of Rw appears at the constant value of the field, Hmin,(5 GHz)=109 kA/m, decreasing from the value 0.90 (for d=2 mm) to 0.64 (for d=10 mm) (see Figure 11). At the same time, for H>Hmin, Rw increases with increasing H (Figure 11)), for any value d of the sample thickness. As a result, obtaining a value as low as possible for the overall reflection coefficient Rw, indicates that the investigated material is a good absorber of the electromagnetic wave. The obtained result is useful in the study of some materials/composite systems with possible absorbing properties in microwaves, by determination of the overall reflection coefficient Rw(f, H) controlled both by the thickness d of the absorber and by the external field H applied, at different frequencies from the range (1-6) GHz.
5. Conclusions
Based on the complex magnetic permeability and complex dielectric permittivity measurements in the microwave frequency range (0.4-7) GHz and in presence of a polarizing magnetic field, H of (0-135) kA/m, for a kerosene-based ferrofluid with magnetite nanoparticles, the ferromagnetic resonance phenomenon was highlighted and the most important propagation parameters of the electromagnetic wave through ferrofluid, were determined: namely the attenuation constant, α(f,H) and the reflection coefficient, R(f,H) at the air-material interface. The dependence α(H) at different frequencies, f, in the range (1–6) GHz shows that the parameter α, presents a maximum at a value of polarizing magnetic field, Hmax, which moves to higher values from 40 kA/m (at f=2 GHz) to 109 kA/m (at f=5 GHz), while for H >Hmax, α decreases with increasing H. The obtained result is very important in applications of electromagnetic absorbers because it provides information on the maximum limit of the magnetic field H, for control of attenuation constant α, at different frequencies. Also, in this paper, we defined another parameter, namely the overall reflection coefficient, Rw, of a ferrofluid with thickness d and the attenuation constant α, through which the electromagnetic wave propagates. For this, we proposed a theoretical model for computing the overall reflection coefficient, Rw(f,H) of a plane wave absorber with a single layer deposited on a perfect conductor, following multiple internal reflections, valid for any material/composite system that has absorbing properties in the microwave range. Using this model, we established for the first time a new equation for the computation of Rw(f,H) for 3 values of the thickness d of the ferrofluid sample: 2 mm, 5 mm and 10 mm, which takes into account, the multiple total reflections of the electromagnetic wave on the reflective metal support, when the wave passes through the ferrofluid. The dependence of Rw(H) at different frequencies, f, in the range (1–6) GHz shows that the parameter Rw presents a minimum at a value of polarizing magnetic field, Hmin, which moves to higher values from 40 kA/m ( at f=2 GHz) to 113 kA/m (at f=5 GHz), for all values d of thickness of sample, while for H >Hmin, Rw increases with increasing H. On the other hand, at a fixed frequency, such as f=5 GHz, the minimum of Rw decreases from 0.90 (for d=2 mm) to 0.64 (for d=10 mm) which shows an increase in the absorption of the electromagnetic wave in the ferrofluid. The result is very useful in the study of some materials/composite systems that could be used as electromagnetic absorbers in microwave range.
Author Contributions
Conceptualization, I.M., C.N.M. and P.C.F.; methodology, I.M. and C.N.M.; measurements, P.C.F. and I.M.; supervision: P.C.F.; formal analysis, C.N.M.; investigation, I.M. and P.C.F.; writing-original draft preparation, I.M.; writing—review and editing, I.M., C.N.M. and P.C.F. All authors have read and agreed to the published version of the manuscript.
Funding
This research received no external funding.
Data Availability Statement
The data presented in this study are available upon request from the corresponding author.
Conflicts of Interest
The authors declare no conflict of interest.
References
- Rosensweig, R.E. Ferrohydrodynamics; Cambridge University Press: Cambridge, 1985. [Google Scholar]
- Yu, L.R.; Shliomis, M.I. Relaxation Phenomena in Condensed Matter. Adv. Chem. Phys. 1994, 87, 595–751. [Google Scholar]
- Fannin, P.C.; Marin, C.N.; Malaescu, I.; Stefu, N. An Investigation of the Microscopic and Macroscopic Properties of Magnetic Fluids. Physica B 2007, 388(1–2), 87–92. [Google Scholar] [CrossRef]
- Landau, L.D.; Lifshitz, E.M.; Sovjetunion, P.Z. Reprinted in Collected Works of Landau; 1935. 153–169. Pergamon Press: London, 1965, no. 18. Vol. 8.
- Fannin, P.C. Use of Ferromagnetic Resonance Measurements in Magnetic Fluids. J. Mol. Liquids 2004, 114(1–3), 79–87. [Google Scholar] [CrossRef]
- Fannin, P.C. Wideband Measurement and Analysis Techniques for the Determination of the Frequency-dependent, Complex Susceptibility of Magnetic Fluids. Adv. Chem. Phys. 1998, 104, 181–292. [Google Scholar] [CrossRef]
- Dubreuil, J.; Bobowski, J.S. Ferromagnetic Resonance in the Complex Permeability of an Fe3O4-based Ferrofluid at Radio and Microwave Frequencies. J. Magn. Magn. Mater 2019, 489, 165387(7p). [Google Scholar] [CrossRef]
- Fannin, P.C.; Marin, C.N.; Malaescu, I. The Influence of Particle Concentration and Polarizing Field on the Resonant Behaviour of Magnetic Fluids. J. Phys. Cond. Matter. 2003, 15(27), 4739–4750. [Google Scholar] [CrossRef]
- Fannin, P.C.; Yu, L.R.; Giannitsis, A.T.; Charles, S.W. Investigation of the Influence Which Material Parameters Have on the Signal-to-noise Ratio of Nanoparticles. J. Magn. Magn. Mater. 2002, 252(1–3), 114–116. [Google Scholar] [CrossRef]
- Mishra, G.R.; Nath, G.; Paikaray, R. Synthesis and characterization of microwave absorbing material. Indian J. Phys. 2020, 94, 1749–1757. [Google Scholar] [CrossRef]
- Bhattacharje, Y.; Bose, S. Coreeshell nanomaterials for microwave absorption and electromagnetic interference shielding: a review. ACS Appl. Nano. Mater. 2021, 4(2), 949–972. [Google Scholar] [CrossRef]
- Yan, J.; Huang, Y.; Yan, Y.; Ding, L.; Liu, P. High-performance electromagnetic wave absorbers based on two kinds of nickel-based MOF-derived NiC microspheres. ACS Appl. Mater. Inter. 2019, 11, 40781–40792. [Google Scholar] [CrossRef]
- Zhang, H.; Jia, Z.; Feng, A.; Zhou, Z.; Chen, L.; Zhang, C.; Wu, G. In situ deposition of pitaya-like Fe3O4 and C magnetic microspheres on reduced graphene oxide nanosheets for electromagnetic wave absorber. Compos. Part B: Eng. 2020, 199, 108261. [Google Scholar] [CrossRef]
- Zhou, X.; Han, H.; Wang, Y.; Zhang, C.; Lv, H.; Lou, Z. Silicon-coated fibrous network of carbon nanotube/iron towards stable and wideband electromagnetic wave absorption. J. Mater. Sci. Technol. 2022, 121, 199–206. [Google Scholar] [CrossRef]
- Madiha, F.E.; Raba'ah, S.A.; Ismayadi, I.; Farah, D.M. A review on electromagnetic microwave absorption properties: their materials and performance. J. Mat. Res. Techn 2022, 20, 2188–2220. [Google Scholar] [CrossRef]
- Marin, C.N.; Malaescu, I.; Sfirloaga, P.; Teusdea, A. Electric and magnetic properties of a composite consisting of silicone rubber and ferrofluid. J. Ind. Eng. Chem. 2021, 101, 405–413. [Google Scholar] [CrossRef]
- Akinay, Y.; Gunes, U.; Çolak, B.; Cetin, T. Recent progress of electromagnetic wave absorbers: A systematic review and bibliometric approach. Chem. Phys. Mater. 2023, 2, 197–206. [Google Scholar] [CrossRef]
- Jackson, J.D. Classical Electrodynamics, 2nd edition, John Wiley, New York, 1975.
- Yakovenko, O.S.; Matzui, L.Yu.; Vovchenko, L.L.; Oliynyk, V.V.; Zagorodnii, V.V.; Trukhanov, S.V.; Trukhanov, A.V. Electromagnetic Properties of Carbon Nanotube/BaFe12−xGaxO19/Epoxy Composites with Random and Oriented Filler Distributions. Nanomaterials. 2021, 11, 2873. [Google Scholar] [CrossRef]
- Fannin, P.C.; Malaescu, I.; Marin, C.N.; Stefu, N. Microwave propagation parameters in magnetic Fluids. Eur. Phys. J. E. 2009, 29, 299–303. [Google Scholar] [CrossRef]
- Fannin, P.C.; Marin, C.N.; Malaescu, I.; Stefu, N.; Vlăzan, P.; Novaconi, S.; Popescu, S. Effect of the concentration of precursors on the microwave absorbent properties of Zn/Fe oxide nanopowders. J. Nanopart. Res. 2011, 13, 311–319. [Google Scholar] [CrossRef]
- Fannin, P.C.; Marin, C.N.; Malaescu, I.; Stefu, N.; Vlazan, P.; Novaconi, S.; Sfirloaga, P.; Popescu, S.; Couper, C. Microwave absorbent properties of nanosized cobalt ferrite powders prepared by coprecipitation and subjected to different thermal treatments. Mater. and Design 2011, 32, 1600–1604. [Google Scholar] [CrossRef]
- Gabor, L.; Minea, R.; Gabor, D. RO Patent, 1994, 108851.
- Malaescu, I.; Gabor, L.; Claici, F.; Stefu, N. Study of some magnetic properties of ferrofluids filtered in magnetic field gradient. J. Magn. Magn. Mater. 2000, 222, 8–12. [Google Scholar] [CrossRef]
- Ercuta, A. Sensitive AC hysteresigraph of extended driving field capability. IEEE Trans. Instrum. Measur. 2020, 69(4), 1643–1651. [Google Scholar] [CrossRef]
- Chantrell, R.W.; Popplewell, J.; Charles, S.W. Measurements of particle size distribution parameters in ferrofluids. IEEE Trans. Magn. 1978, 14(5), 975–977. [Google Scholar] [CrossRef]
- Fannin, P.C.; Relihan, T.; Charles, S.W. Investigation of Ferromagnetic Resonance in Magnetic Fluids by Means of the Short-circuited Coaxial Line Technique. J. Phys. D: Appl. Phys. 1995, 28(10), 2003–2006. [Google Scholar] [CrossRef]
- Fannin, P.C.; MacOireachtaigh, C.; Couper, C. An Improved Technique for the Measurement of the Complex Susceptibility of Magnetic Colloids in the Microwave Region. J. Magn. Magn. Mater. 2010, 322(16), 2428–2433. [Google Scholar] [CrossRef]
- Couper, C.; Marin, C.N.; Fannin, P.C. Biasing field effect on the microwave dielectric properties of magnetic fluids. Phys. Proc. 2010, 9, 58–62. [Google Scholar] [CrossRef]
- Marin, C.N.; Fannin, P.C.; Raj, K.; Socoliuc, V. Magnetodielectric spectroscopy of magnetic fluids. Magnetohydrodynamics. 2013, 49(3–4), 270–276. [Google Scholar] [CrossRef]
- Fannin, P.C.; Marin, C.N.; Couper, C. The Resonance Decay Function Method in the Determination of the Pre-factor of the Neel Relaxation Time of Single-domain Nanoparticles. J. Magn. Magn. Mater. 2011, 323(10), 1242–1245. [Google Scholar] [CrossRef]
- Bickford, L.R. Ferromagnetic Resonance Absorption in Magnetite Single Crystals. Phys. Rev. 1950, 78(4), 449–457. [Google Scholar] [CrossRef]
- Teusdea, A.; Fannin, P.C.; Malaescu, I.; Marin, C.N. The effect of a polarizing magnetic field on the dynamic properties and the specific absorption rate of a ferrofluid in the microwave range. Soft Materials 2022, 20(S1), S19–S29. [Google Scholar] [CrossRef]
- Shliomis, M.I.; Raikher, Y.L. Experimental Investigations of Magnetic Fluids. IEEE Trans. Magn. Magn. 1980, 16(2), 237–250. [Google Scholar] [CrossRef]
- Raikher, Y.L.; Stepanov, V.I. Intrinsic Magnetic Resonance in Nanoparticles: Landau Damping in the Collision Less Regime. J. Magn. Magn. Mater. 2002, 242 part 2, 1021–1023. [Google Scholar] [CrossRef]
- Fannin, P.C.; Marin, C.N.; Socoliuc, V.; Istratuca, G.M.; Giannitsis, A.T. The Effect of Colloidal Stabilization upon Ferrimagnetic Resonance in Magnetic Fluids in the Presence of a Polarizing Magnetic Field. J. Phys. D: Appl. Phys. 2003, 36(11), 1227–1235. [Google Scholar] [CrossRef]
Figure 1.
Schematic representation of the reflected and transmitted wave, on the separation surface between two electromagnetic media.
Figure 1.
Schematic representation of the reflected and transmitted wave, on the separation surface between two electromagnetic media.
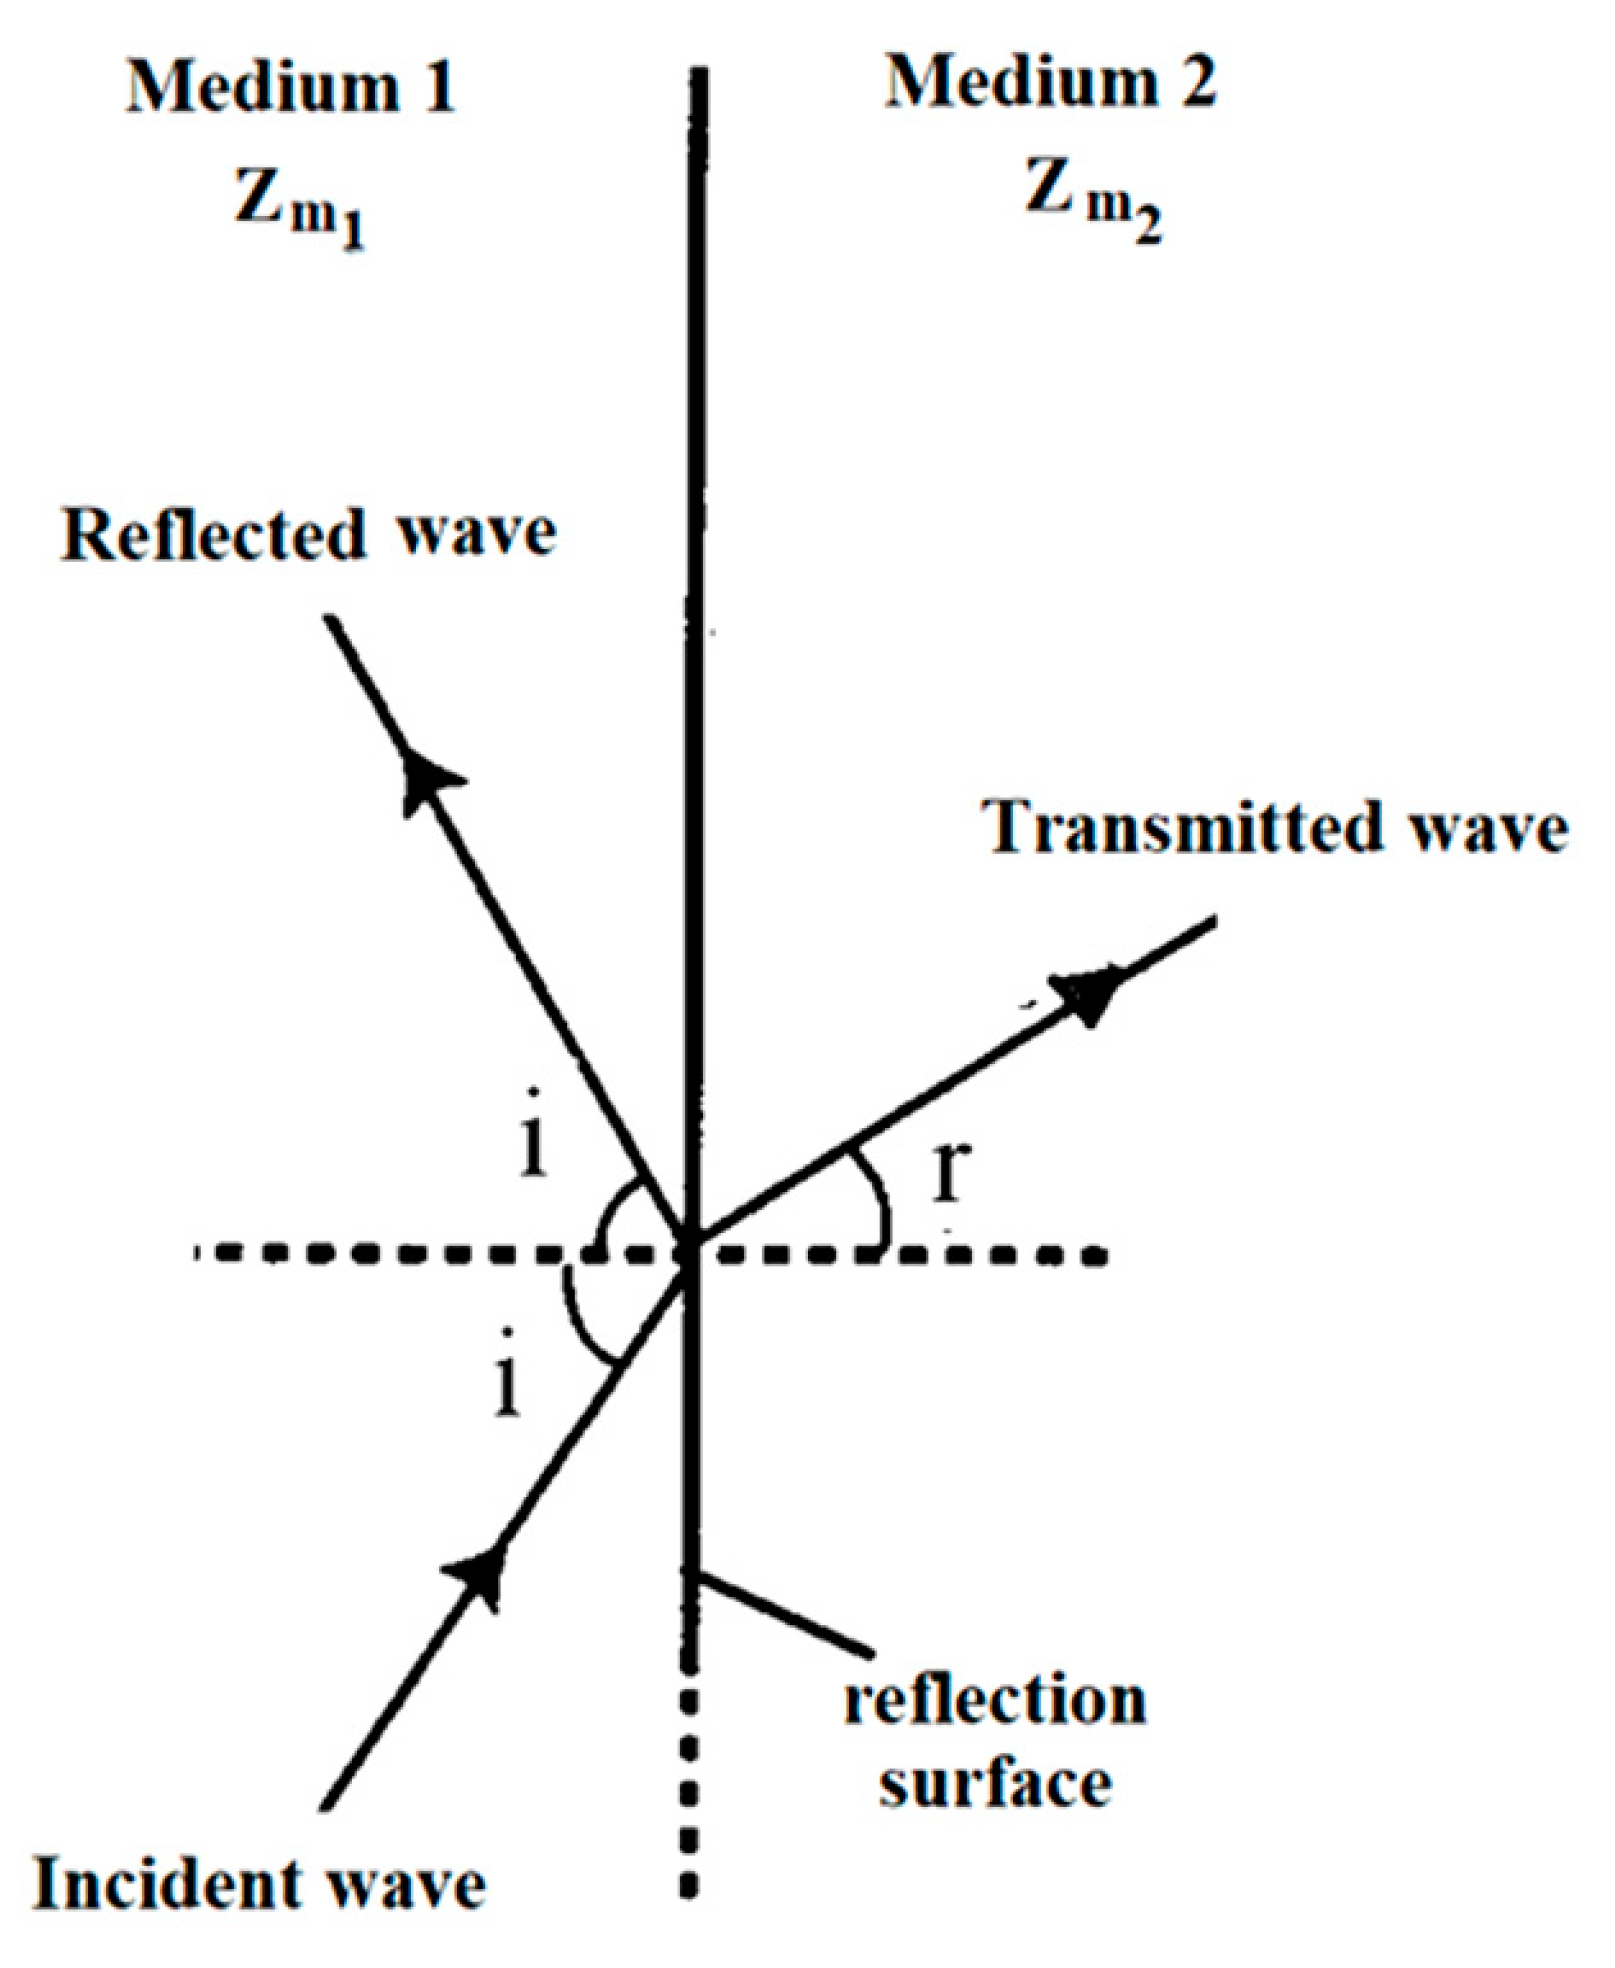
Figure 2.
Schematic representation of the electromagnetic wave absorption and reflection through an absorbent material deposited on a total reflective support.
Figure 2.
Schematic representation of the electromagnetic wave absorption and reflection through an absorbent material deposited on a total reflective support.
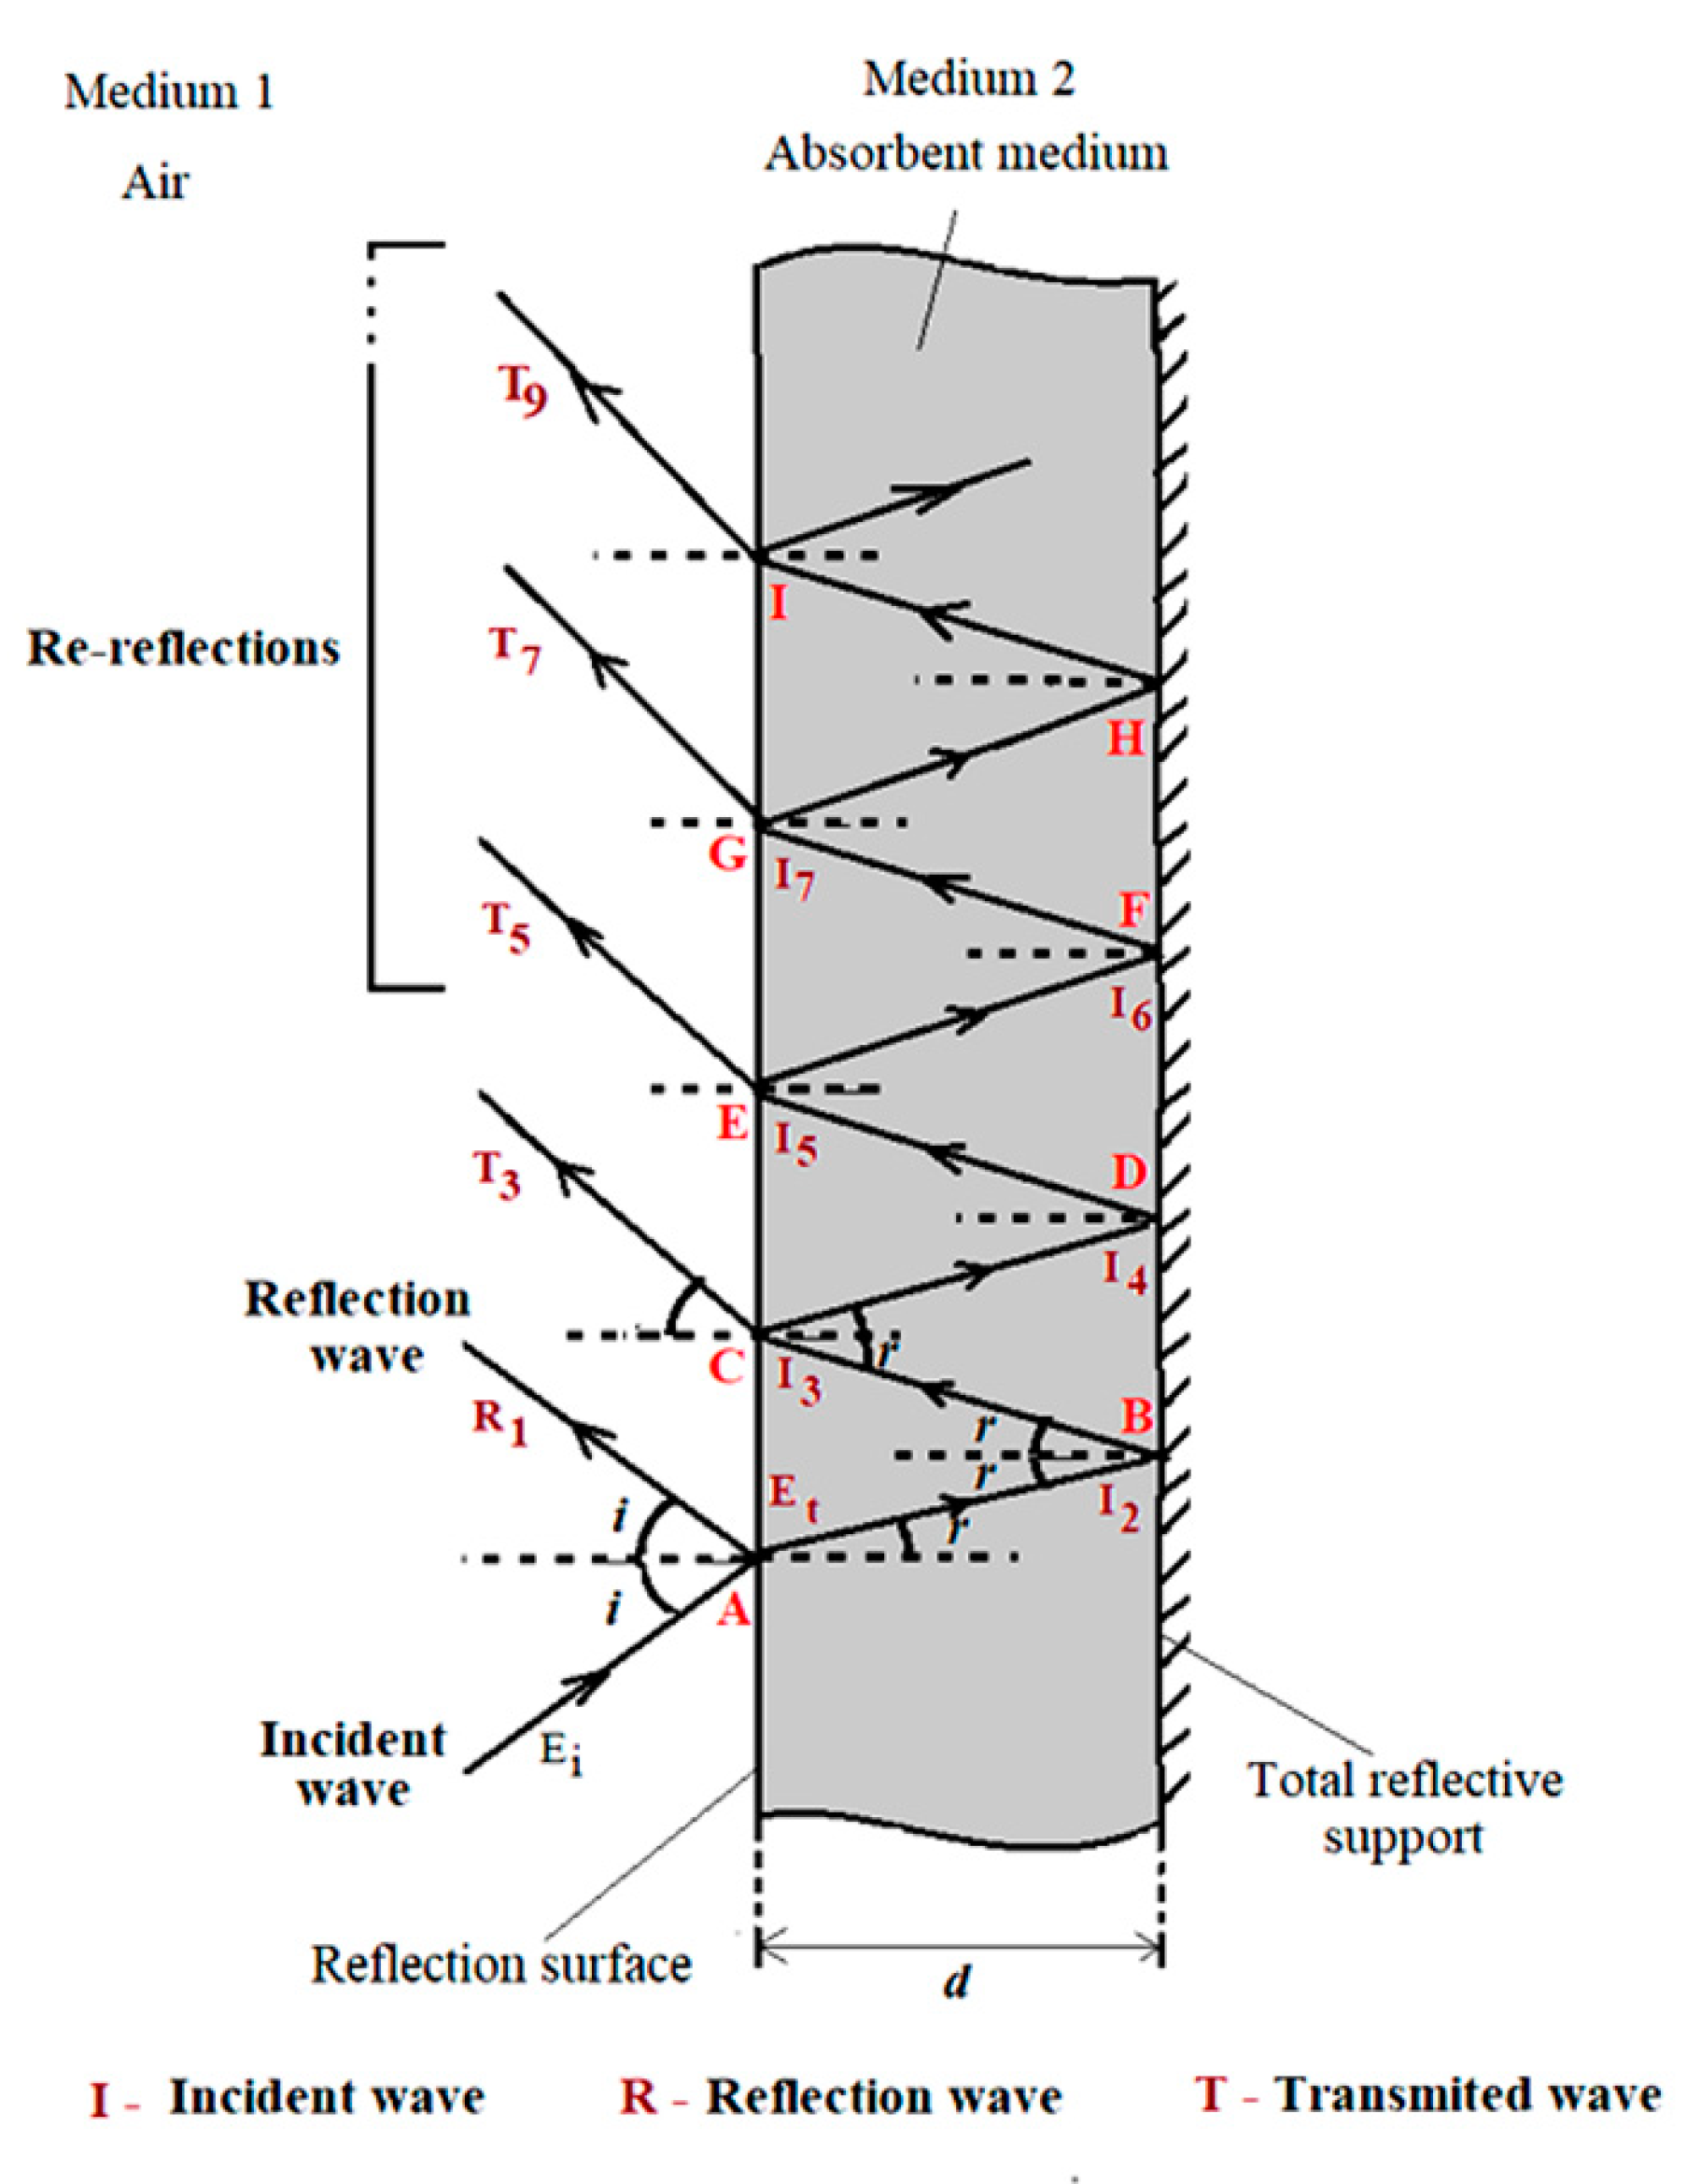
Figure 3.
Magnetization curve of the ferrofluid sample.
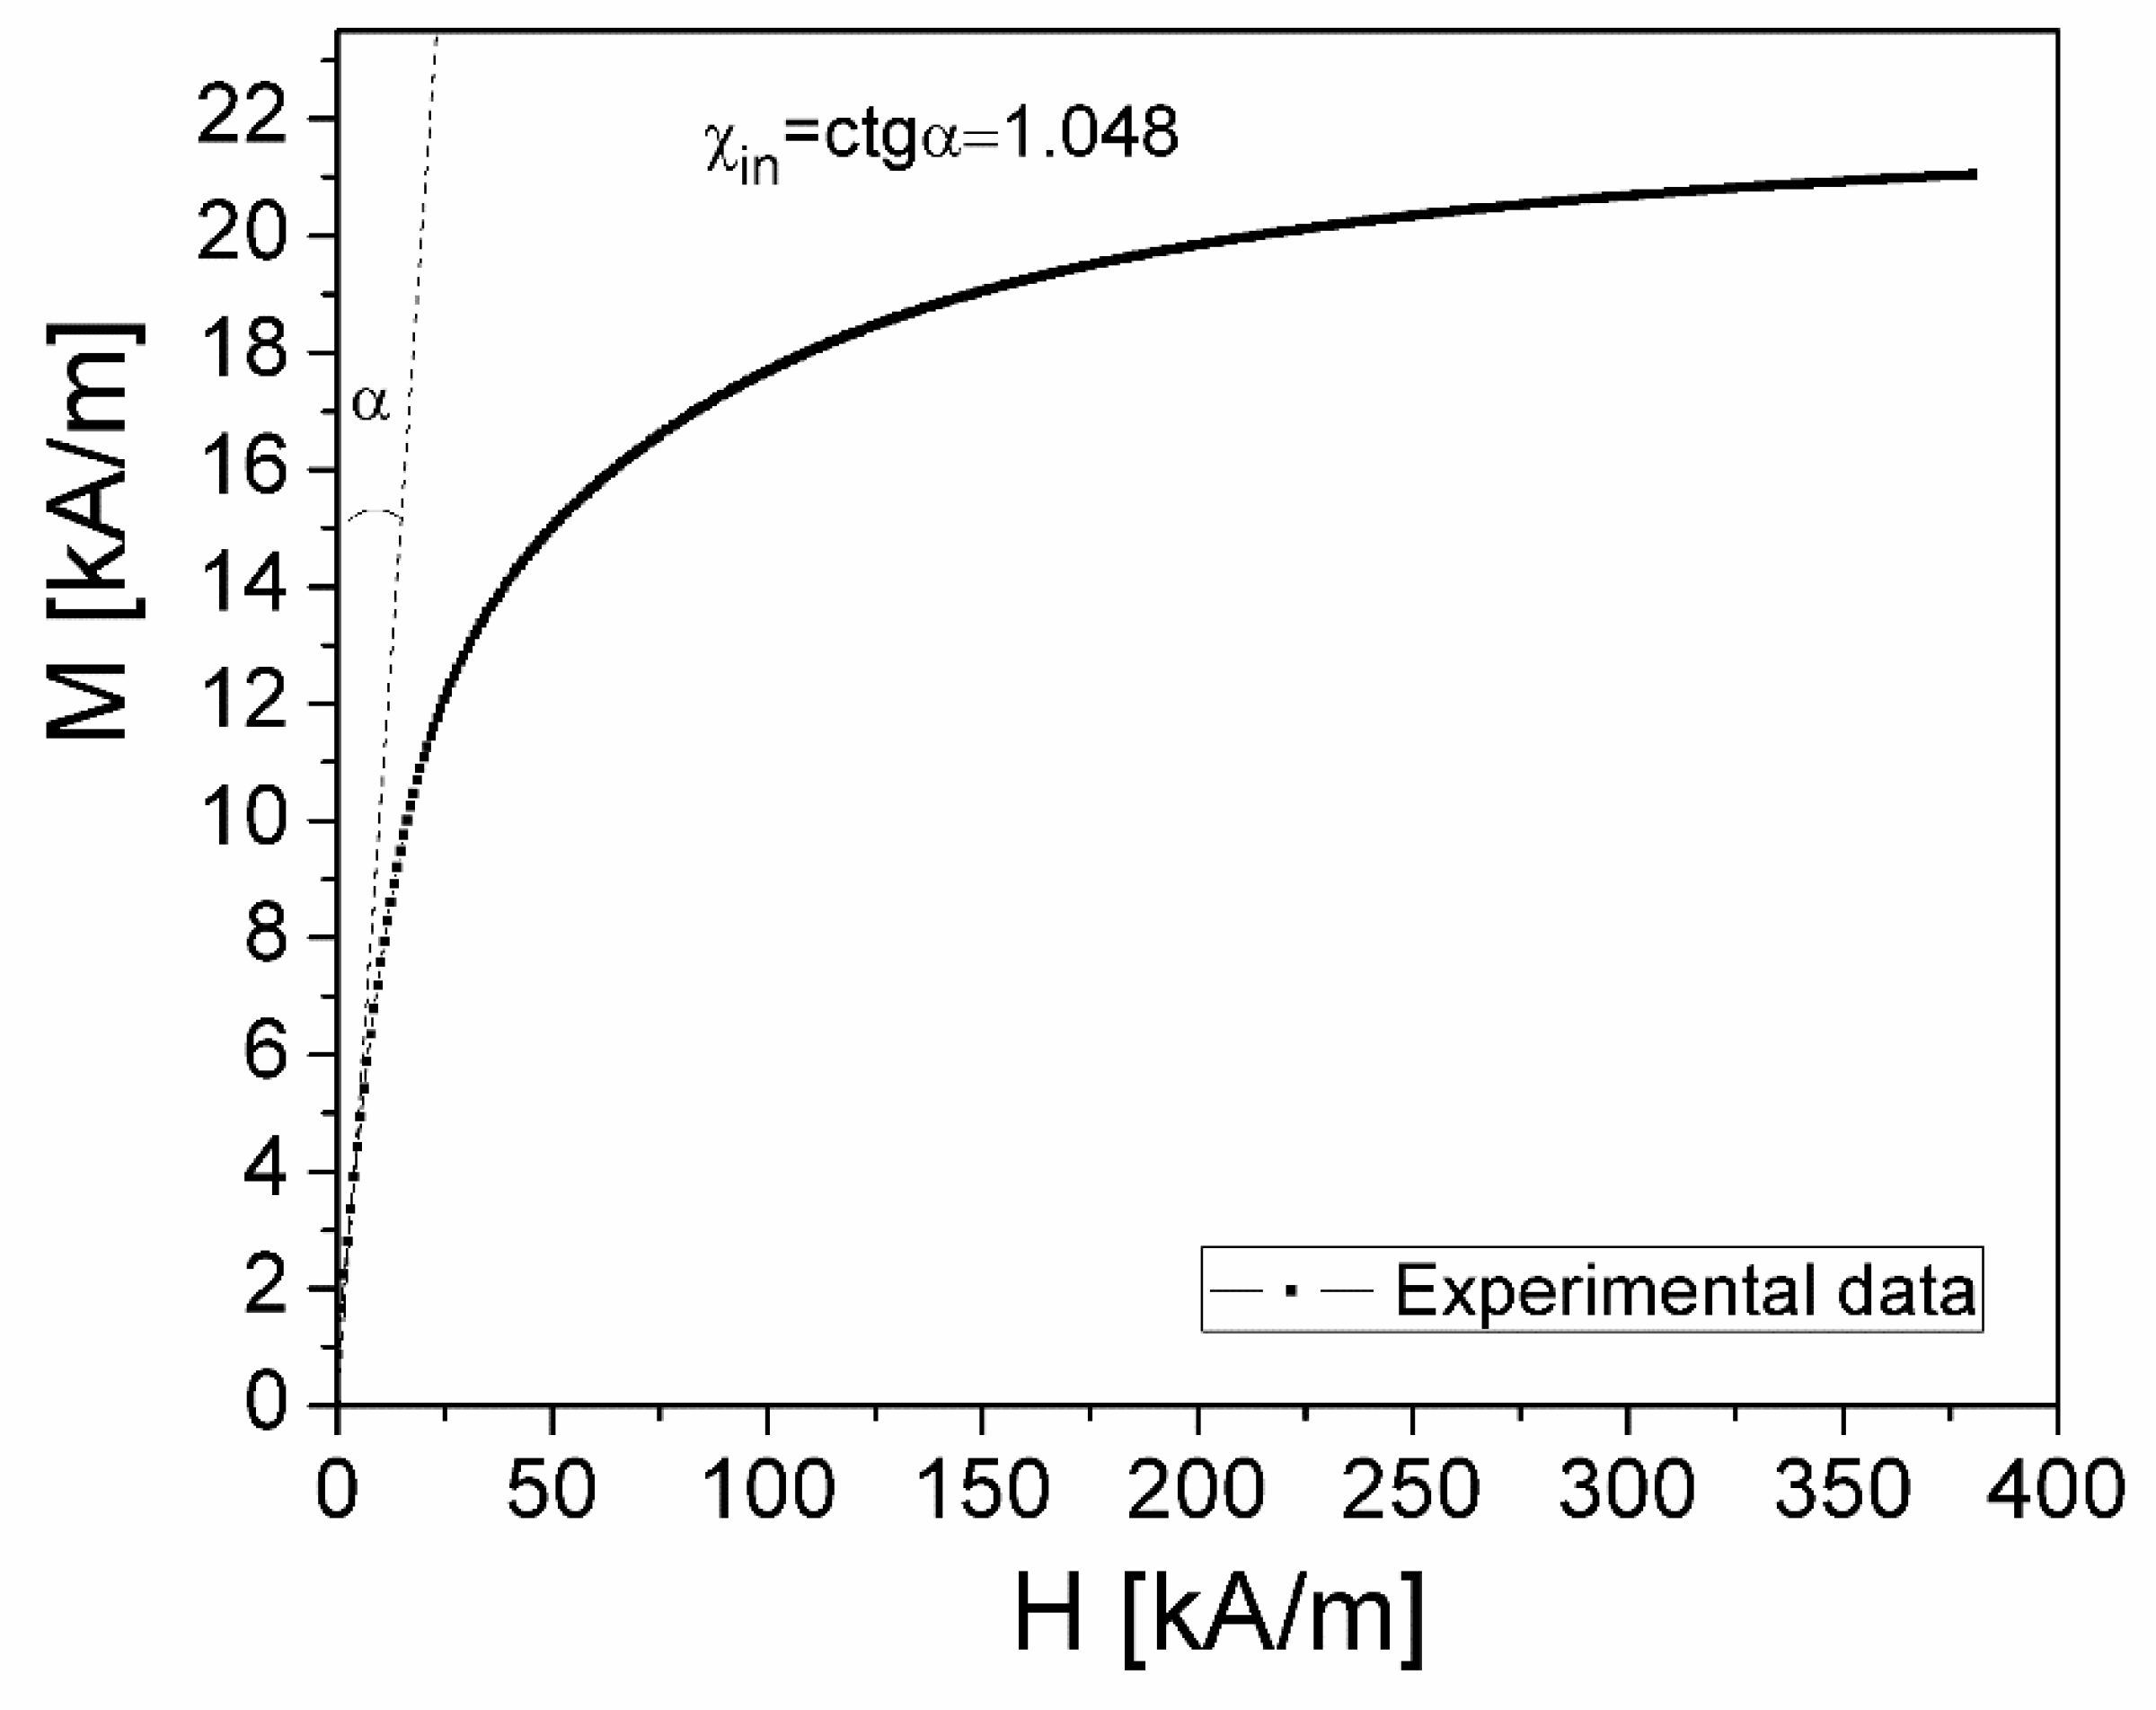
Figure 4.
The frequency dependence of the complex dielectric permittivity components of the ferrofluid sample, for 10 different values of polarizing magnetic field, H.
Figure 4.
The frequency dependence of the complex dielectric permittivity components of the ferrofluid sample, for 10 different values of polarizing magnetic field, H.
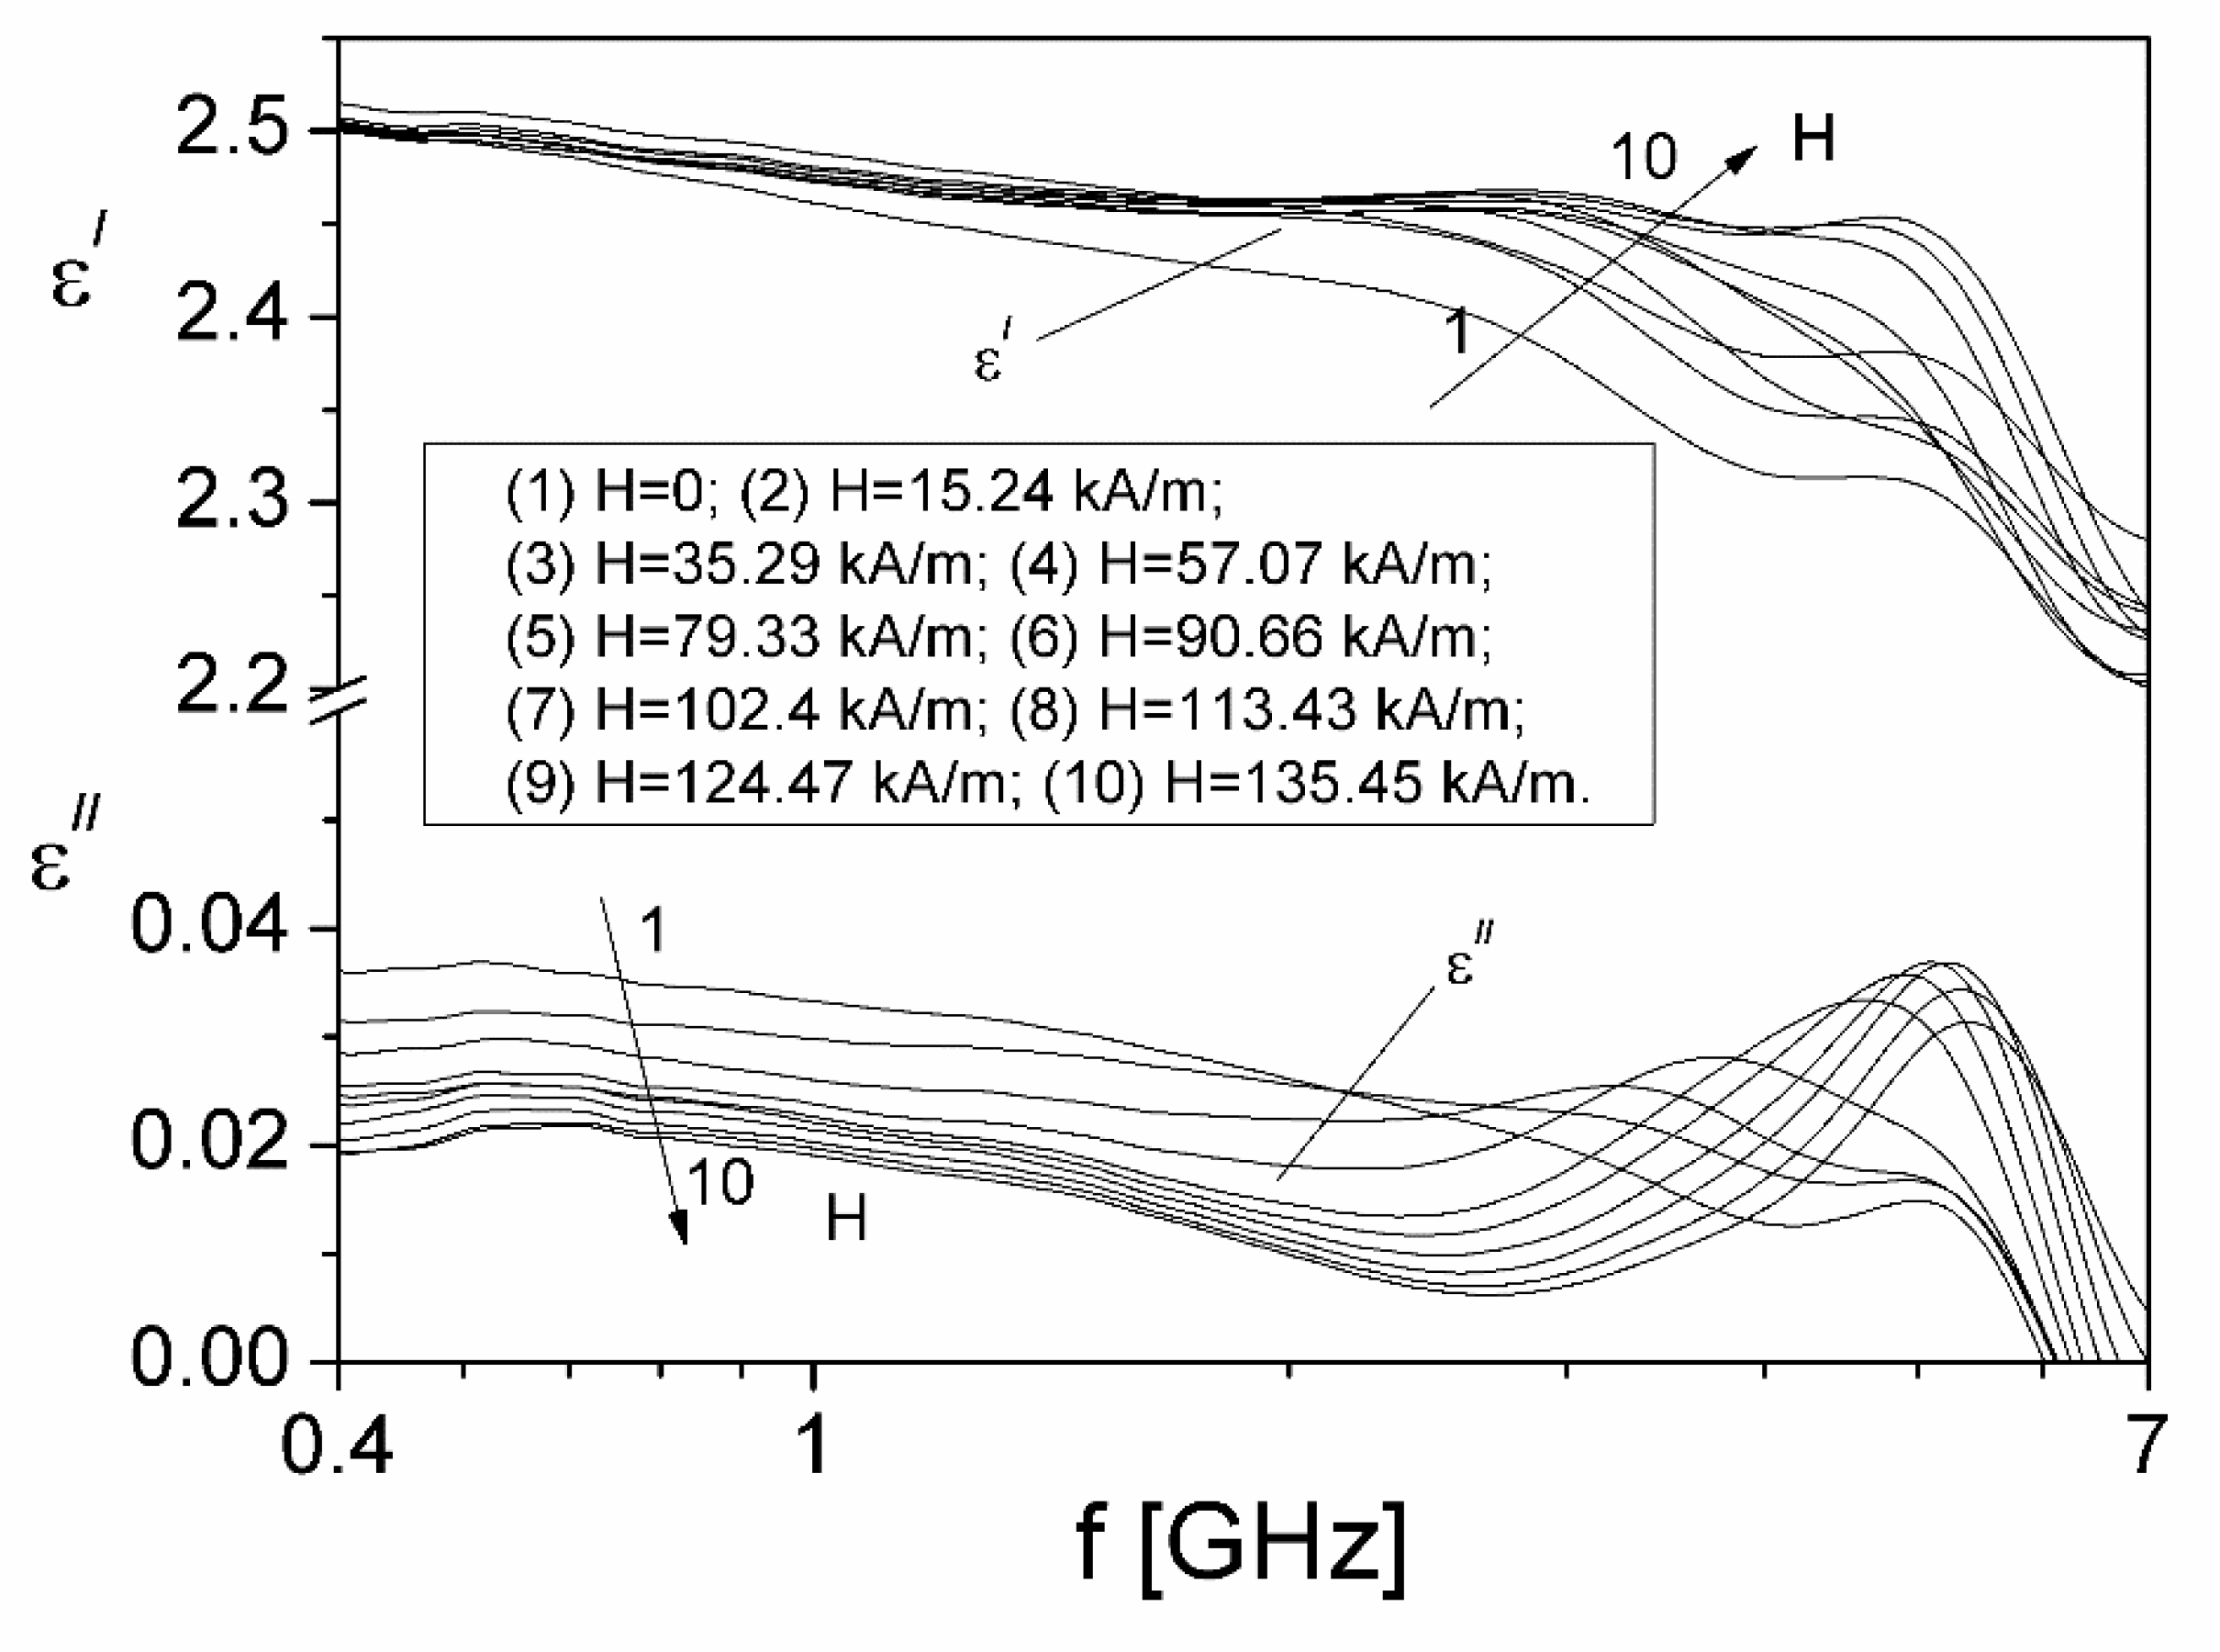
Figure 6.
The polarizing magnetic field dependence, of the resonance frequency fres(H), for ferrofluid sample.
Figure 6.
The polarizing magnetic field dependence, of the resonance frequency fres(H), for ferrofluid sample.

Figure 7.
Frequency dependence of the attenuation constant α at different values of polarizing magnetic field, H.
Figure 7.
Frequency dependence of the attenuation constant α at different values of polarizing magnetic field, H.
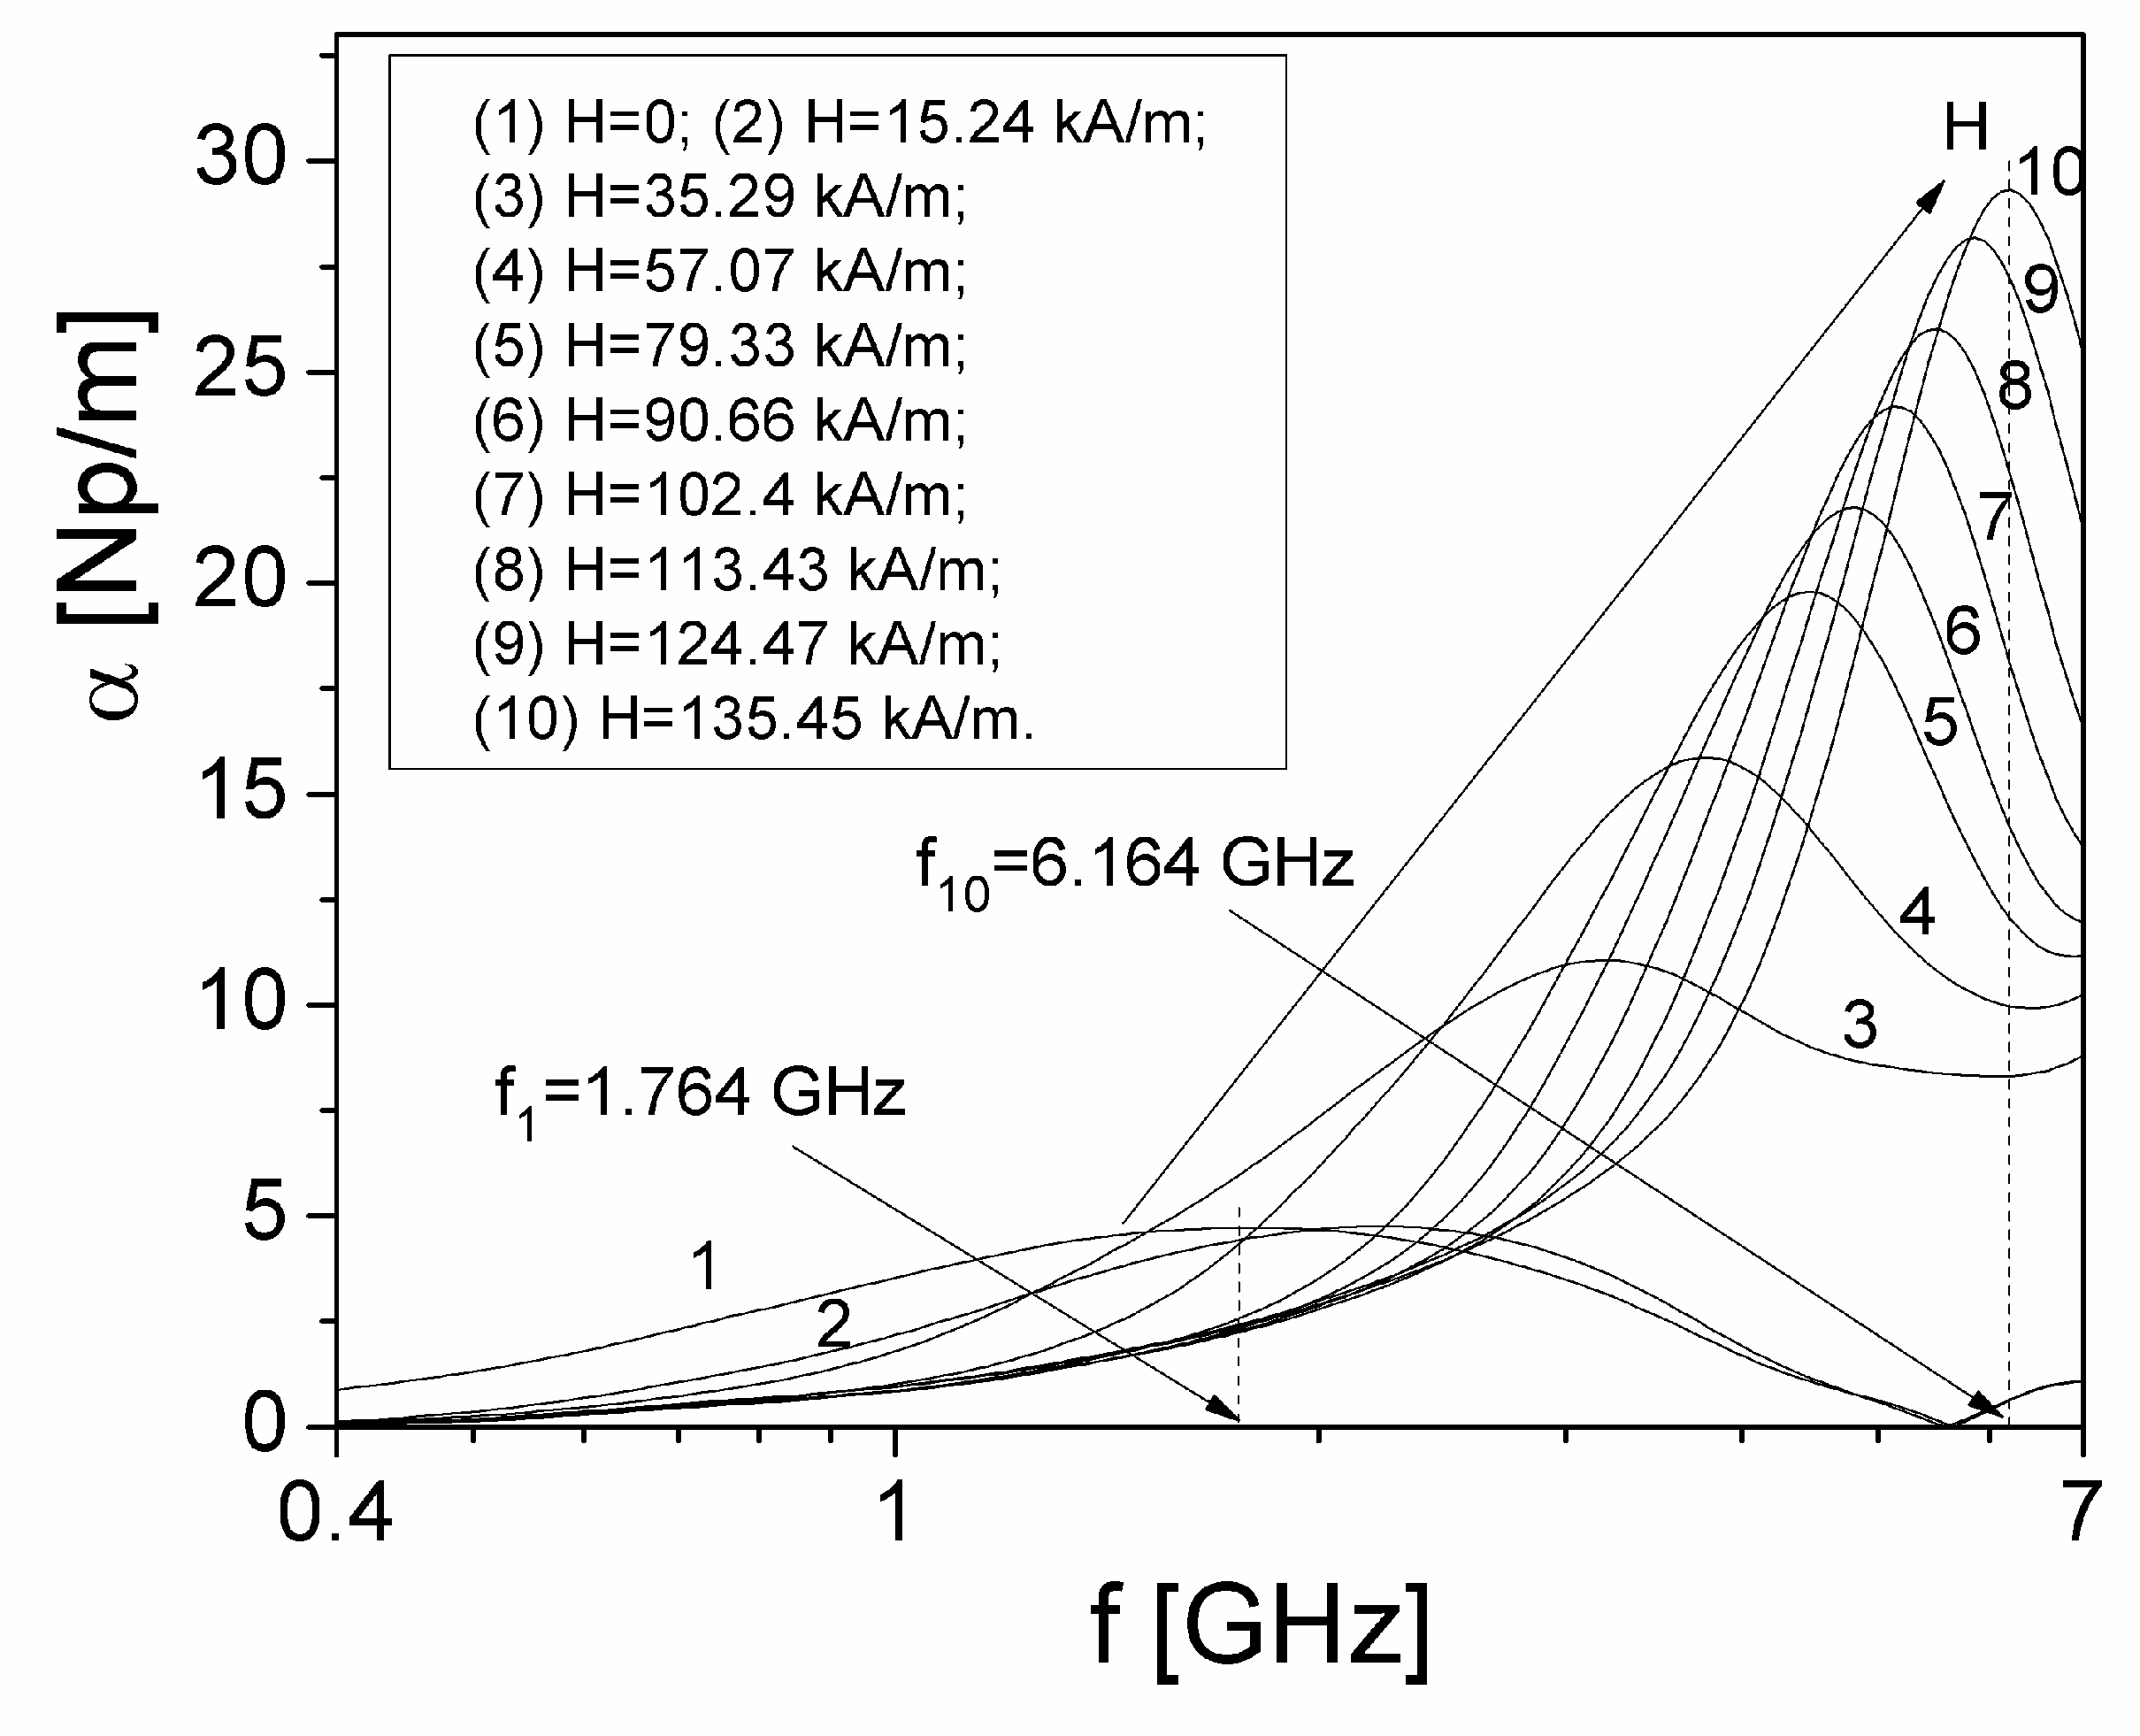
Figure 8.
A plot of the attenuation constant α of microwaves in ferrofluid, against the polarizing magnetic field, H, at different frequencies.
Figure 8.
A plot of the attenuation constant α of microwaves in ferrofluid, against the polarizing magnetic field, H, at different frequencies.
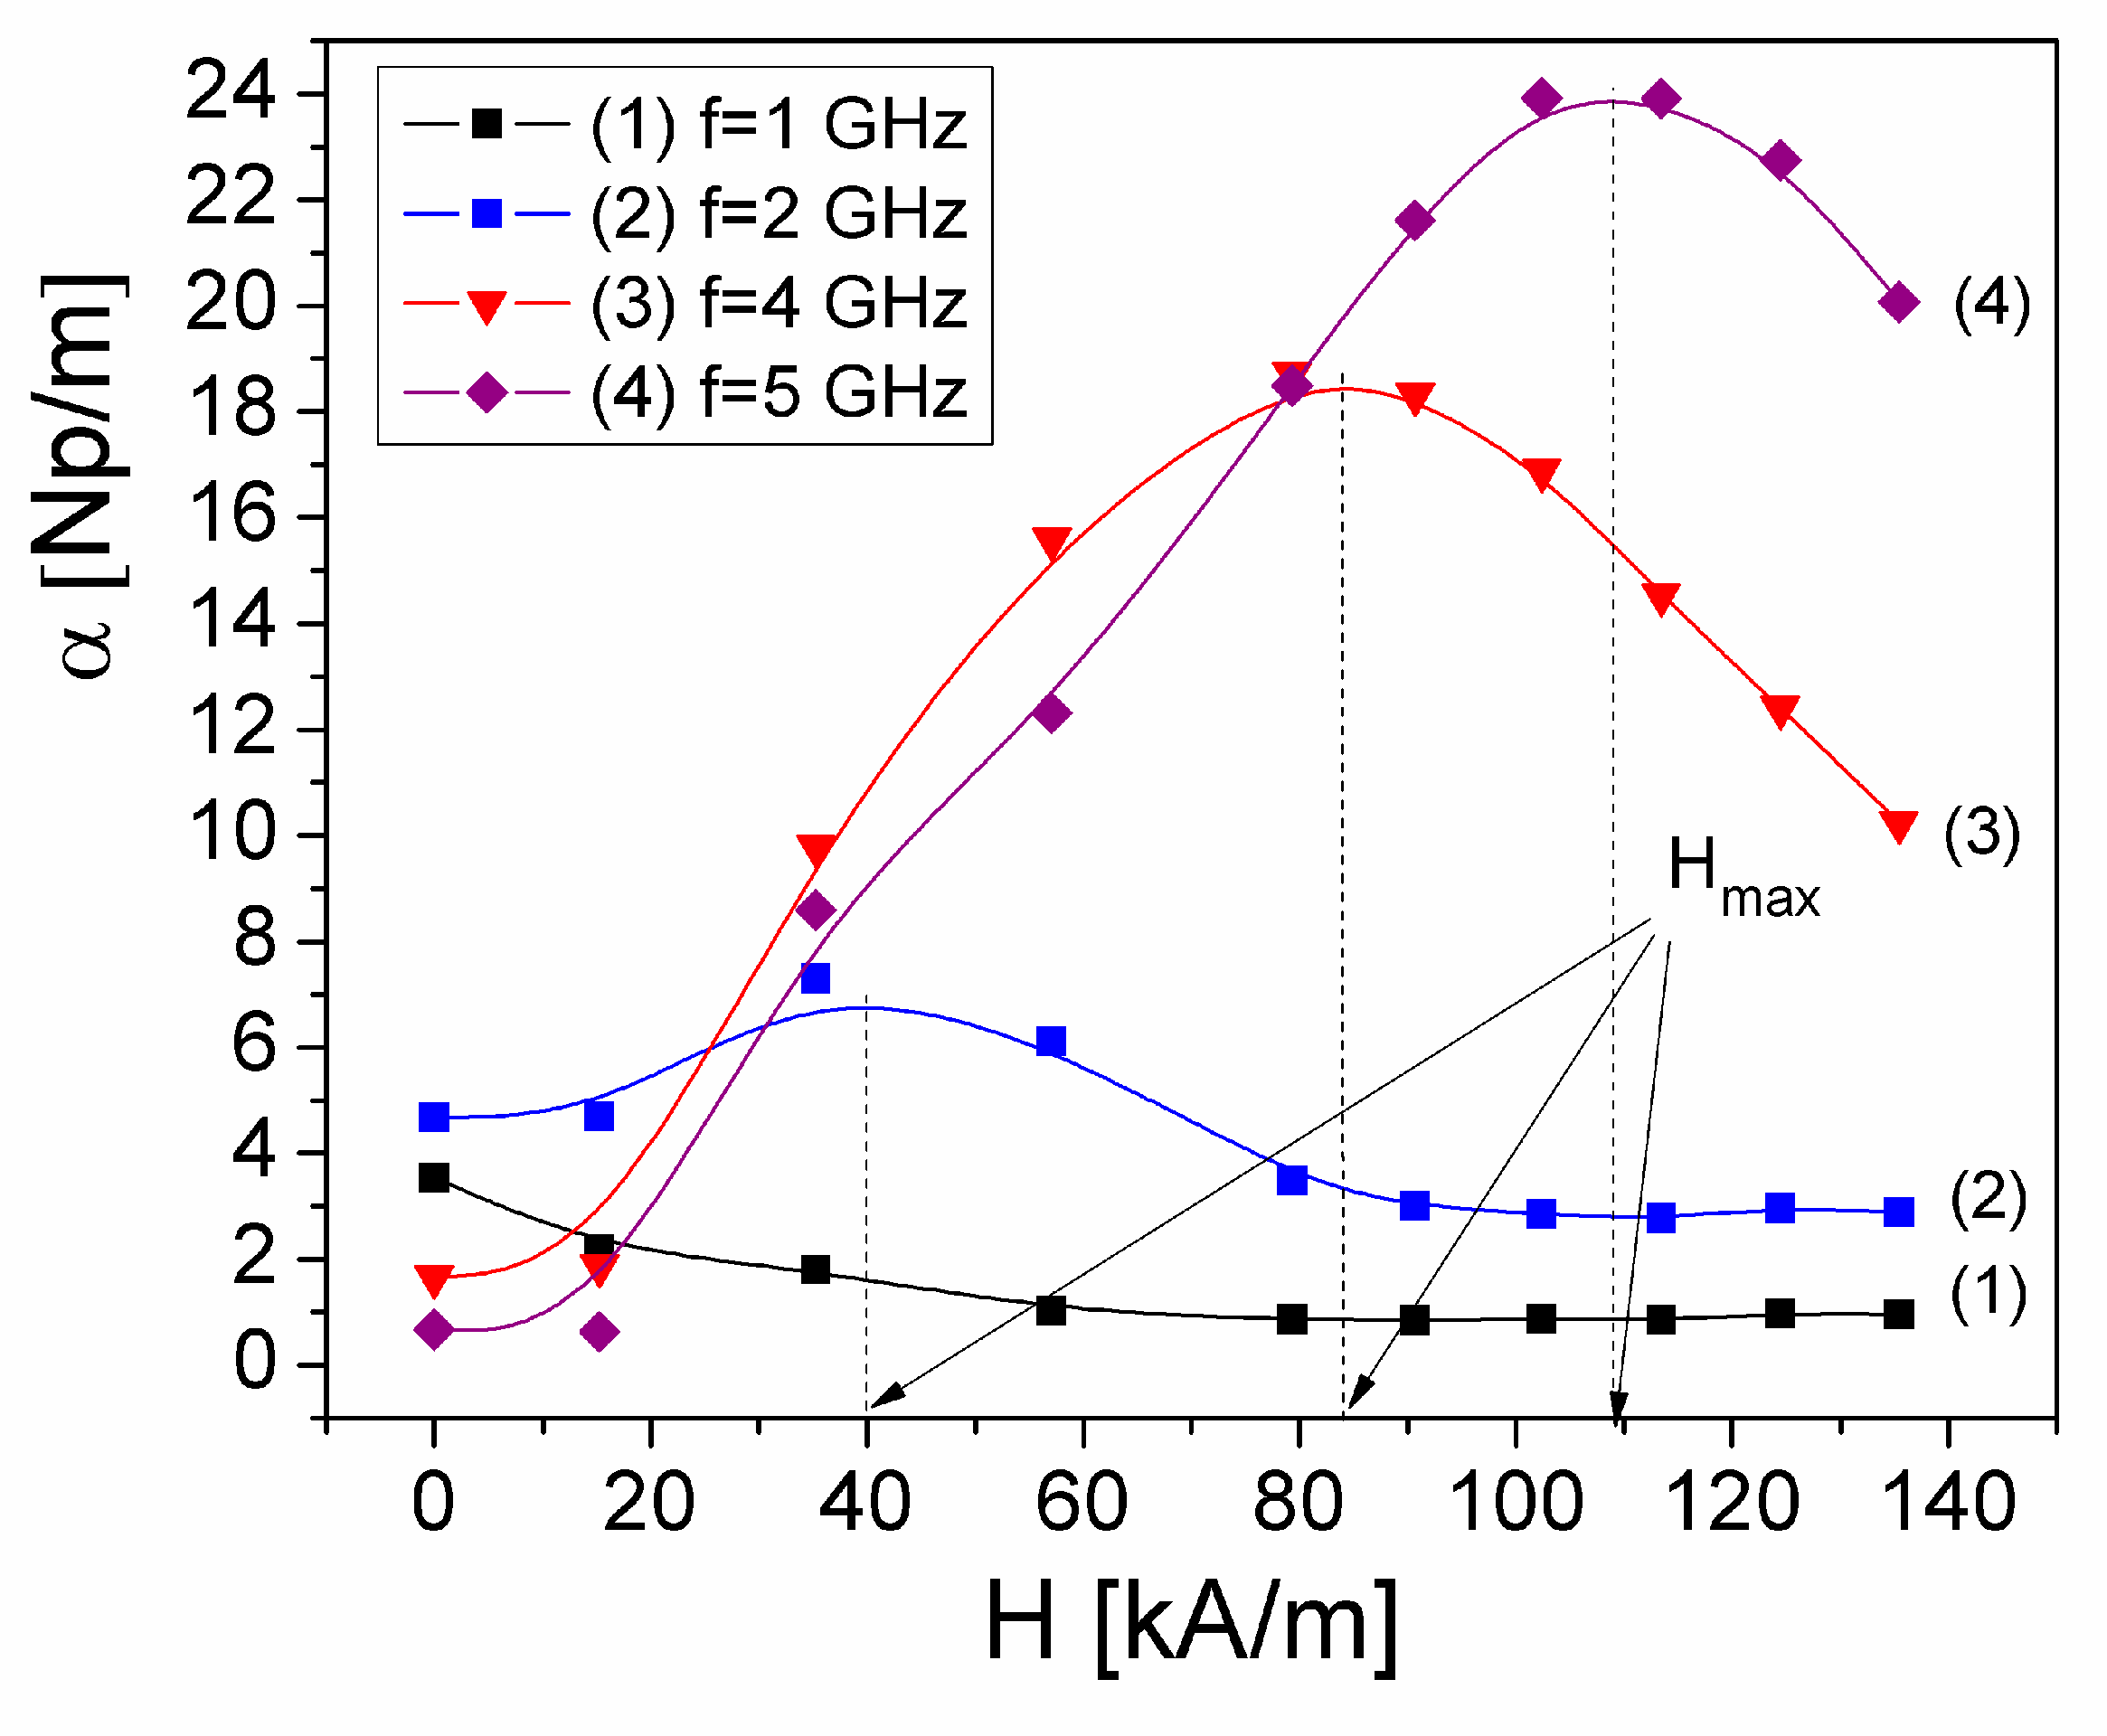
Figure 9.
Frequency dependence of the reflection coefficient R at the interface air–ferrofluid for normal incidence at various magnetic field values: (1) 0 kA/m, (2) 15.24 kA/m, (3) 35.29 kA/m, (4) 57.07 kA/m, (5) 79.33 kA/m, (6) 90.66 kA/m, (7) 102.4 kA/m, (8) 113.43 kA/m, (9) 124.47 kA/m, (10) 135.45 kA/m.

Figure 10.
Frequency dependence of the overall reflection coefficient, Rw, at various magnetic field H values for a thickness of ferrofluid, d=2 mm (a), d=5mm (b) and d=10mm (c).
Figure 10.
Frequency dependence of the overall reflection coefficient, Rw, at various magnetic field H values for a thickness of ferrofluid, d=2 mm (a), d=5mm (b) and d=10mm (c).
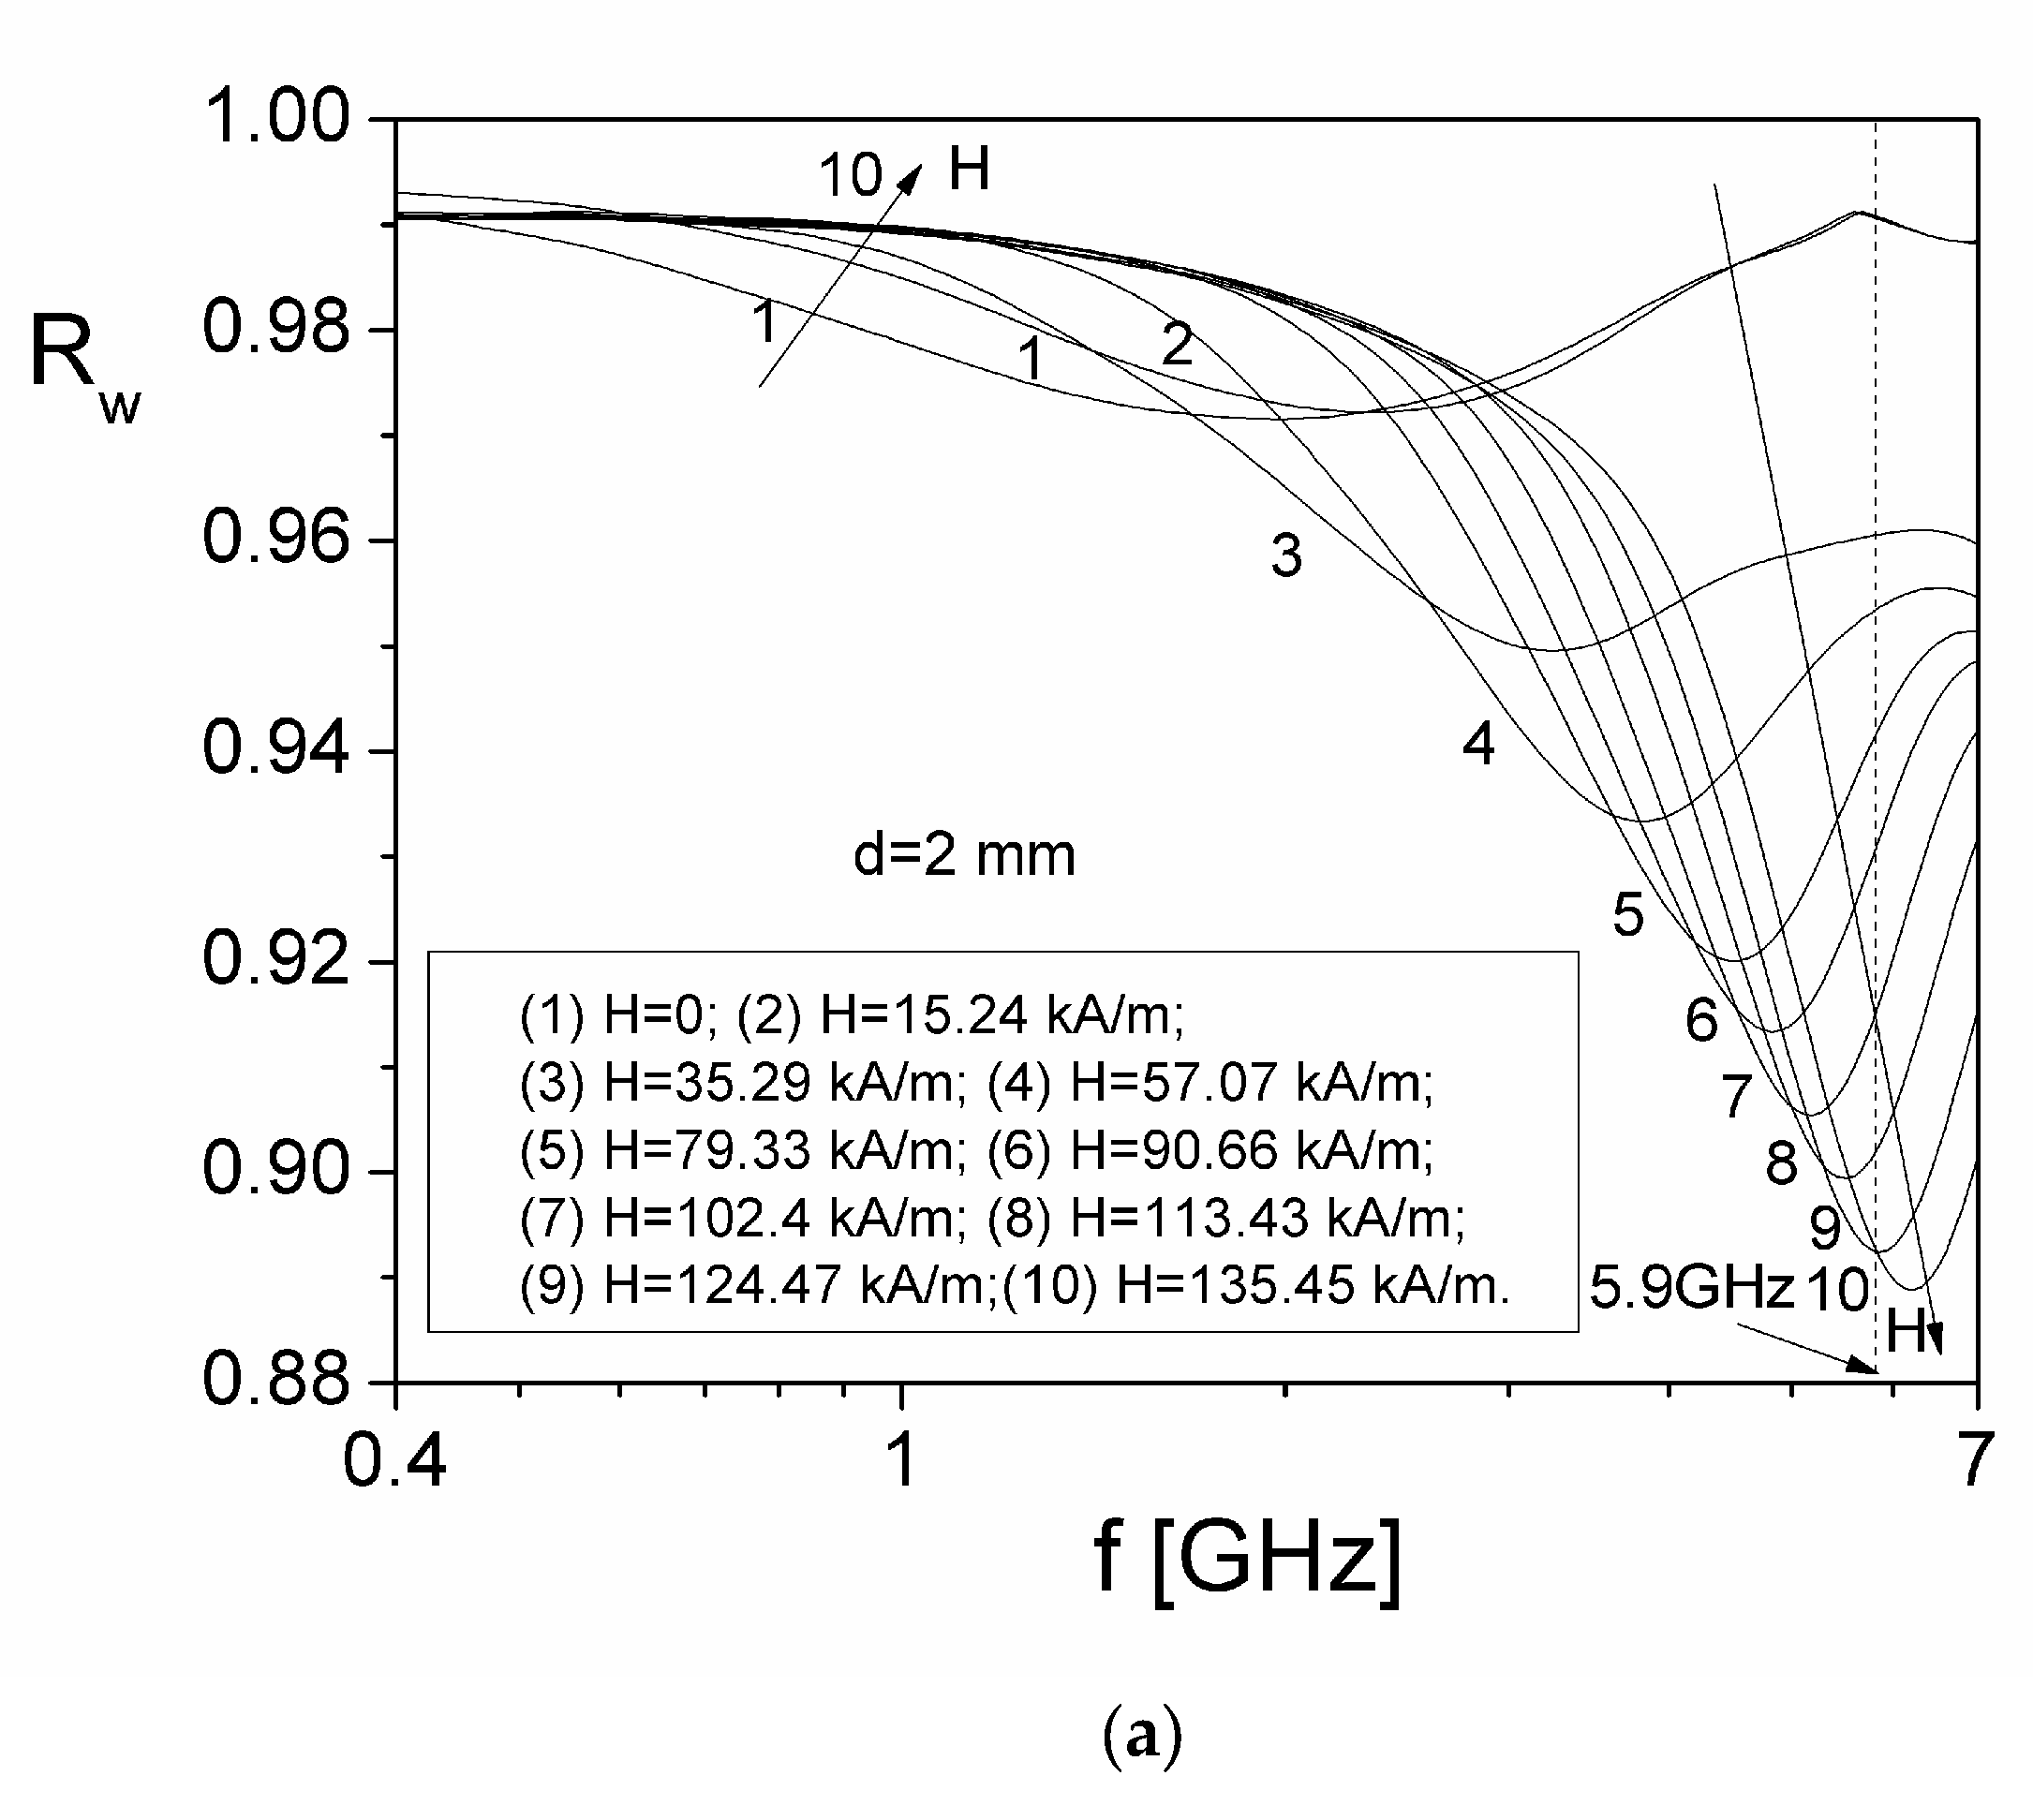
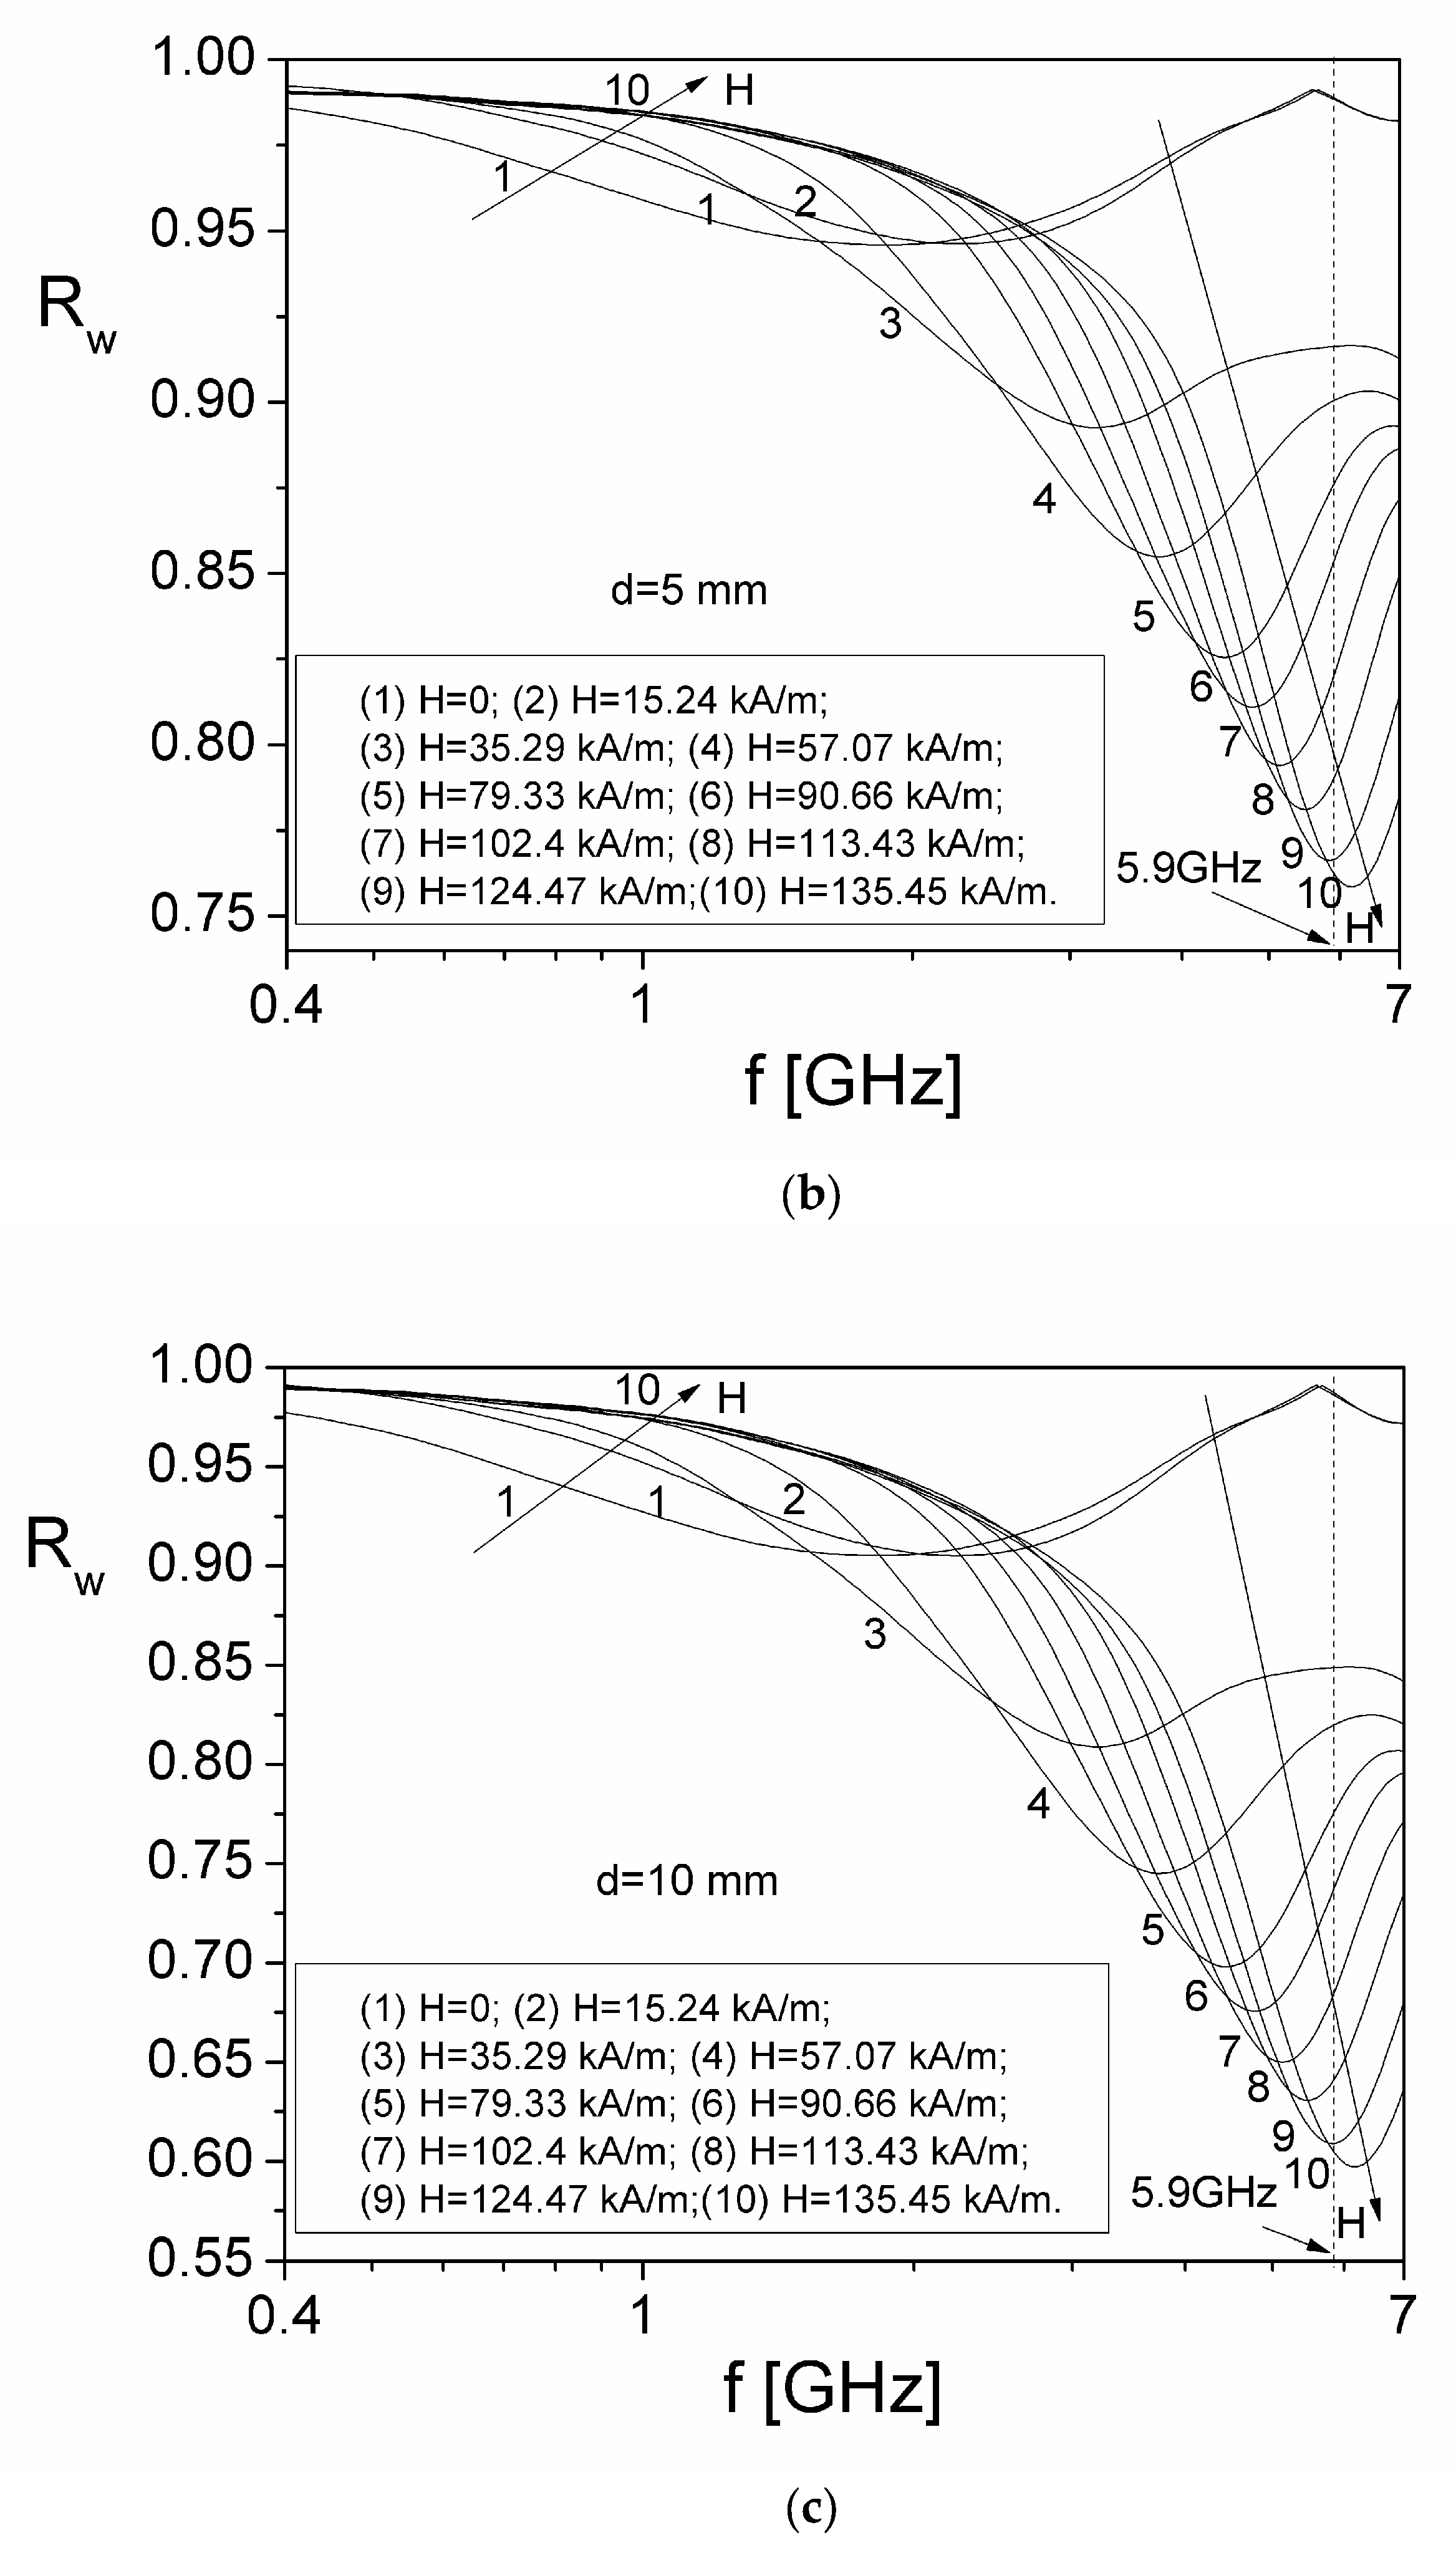
Figure 11.
The plot of the overall reflection coefficient, Rw(f, H), against the polarizing magnetic field H, at different frequencies f.
Figure 11.
The plot of the overall reflection coefficient, Rw(f, H), against the polarizing magnetic field H, at different frequencies f.
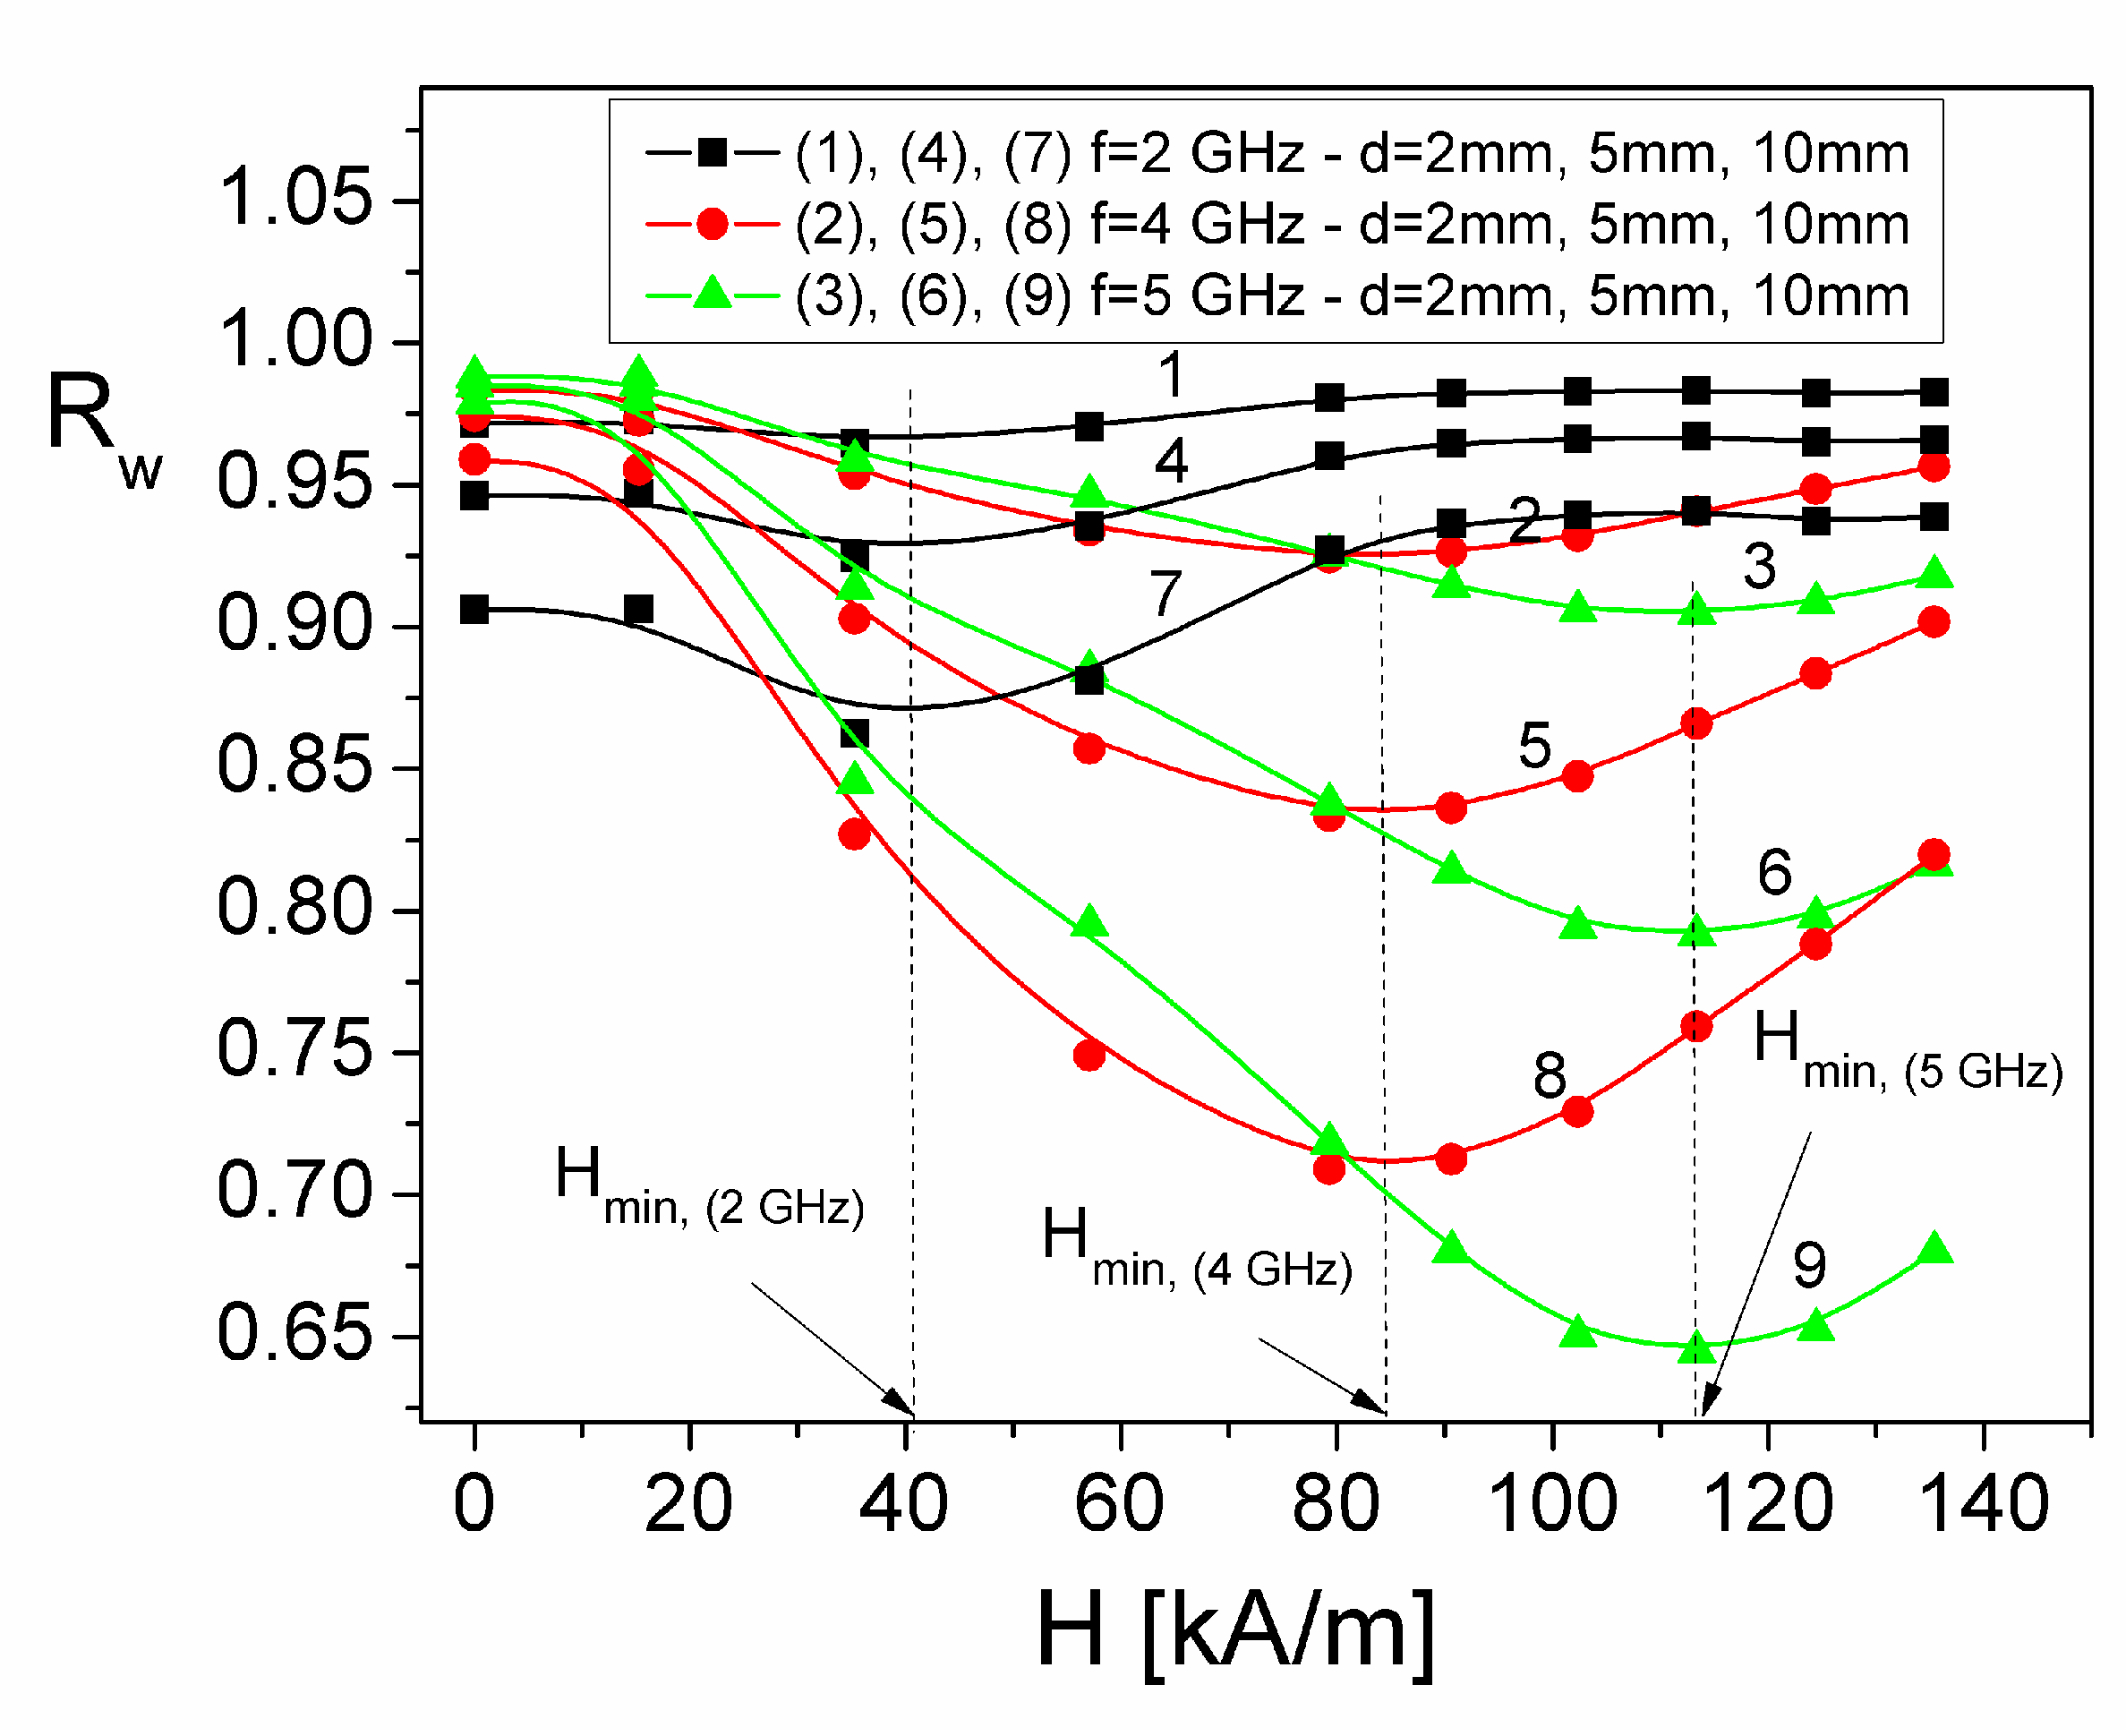

Table 1.
The values computed with Equations (23)–(26) of the terms T3(1), T3(2), T3(3) and T3(4).
| Thickness d | 2 mm | 5 mm | 10mm | ||||||
|---|---|---|---|---|---|---|---|---|---|
| Frequency f [GHz] | 2 | 4 | 5 | 2 | 4 | 5 | 2 | 4 | 5 |
|
T3(1) for H=0 |
0.13418 |
0.13597 |
0.13582 |
0.12687 |
0.13329 |
0.13483 |
0.11557 |
0.12895 |
0.1332 |
| T3(1) for H=135.45 kA/m |
0.12291 |
0.10942 |
0.10053 |
0.11862 |
0.09676 |
0.07818 |
0.1118 |
0.07884 |
0.05141 |
|
T3(2) for H=0 |
0.03203 |
0.03189 |
0.03123 |
0.02945 |
0.03096 |
0.03089 |
0.0256 |
0.02946 |
0.03033 |
| T3(2) for H=135.45 kA/m |
0.0235 |
0.01829 |
0.01612 |
0.02228 |
0.01521 |
0.01106 |
0.02039 |
0.01118 |
0.0059 |
|
T3(3) for H=0 |
0.00764 |
0.00748 |
0.00718 |
0.00683 |
0.00719 |
0.00708 |
0.00567 |
0.00673 |
0.00691 |
| T3(3) for H=135.45 kA/m |
0.00449 |
0.00306 |
0.00259 |
0.00419 |
0.00239 |
0.00156 |
0.00372 |
0.00159 |
0.00067 |
|
T3(4) for H=0 |
0.00182 |
0.00175 |
0.00165 |
0.00159 |
0.00167 |
0.00162 |
0.00126 |
0.00154 |
0.00157 |
| T3(4) for H=135.45 kA/m |
0.00444 |
0.00293 |
0.00238 |
0.00406 |
0.00216 |
0.00127 |
0.0035 |
0.00129 |
0.00044 |
Disclaimer/Publisher’s Note: The statements, opinions and data contained in all publications are solely those of the individual author(s) and contributor(s) and not of MDPI and/or the editor(s). MDPI and/or the editor(s) disclaim responsibility for any injury to people or property resulting from any ideas, methods, instructions or products referred to in the content. |
© 2024 by the authors. Licensee MDPI, Basel, Switzerland. This article is an open access article distributed under the terms and conditions of the Creative Commons Attribution (CC BY) license (http://creativecommons.org/licenses/by/4.0/).
Copyright: This open access article is published under a Creative Commons CC BY 4.0 license, which permit the free download, distribution, and reuse, provided that the author and preprint are cited in any reuse.


