
Submitted:
02 January 2024
Posted:
03 January 2024
You are already at the latest version
Abstract
In the northern Patagonian region of Argentina, there exist some of the largest bentonite deposits. Four bentonite samples (B1, B2, B3, and B4) from two deposits were thoroughly characterized and evaluated as potential adsorbents of anthocyanins extracted from red cabbage. Anthocyanins (ACy) are natural colourants obtained from fruits and plants and have shown excellent antioxidant properties that have promising applications in health. The adsorption of ACy onto bentonites enhances their stability relative to that observed in aqueous solutions. Material characterization showed that three of the samples are sodium bentonites (Na-bentonites: B2, B3, and B4), while the fourth exhibits a large quantity of magnesium and calcium in its interlayer, classifying it as a Mg-Ca-Na-bentonite (B1). Na-bentonites demonstrated higher ACy adsorption capacities, occurring through cation exchange while Mg-Ca-Na-bentonite adsorption occurs by another kind of interaction and a cooperative adsorption mechanism, resulting in the lowest ACy adsorption. The highest adsorption capacity was for B3, characterized by the highest smectite content, cation exchange capacity, and proportion of monovalent cations in its interlayer. Under the conditions studied, sodium smectites proved to be capable of retaining red cabbage ACy, there by introducing a novel avenue for potential applications of regional materials with potential implications for health-related uses.
Keywords:
bentonites
; anthocyanins
; adsorption from water
1. Introduction
During recent years, Argentina has been the second largest producer of bentonites in South America, exporting this product to more than a dozen countries [1]. The largest bentonite deposit is located in the Patagonia region where the Rio Negro province has the highest extraction and industrial activities. In this region, sodium, or mixtures of sodium and calcium bentonites (Na/Ca) are commonly mined. They are considered to be materials of a high purity due to their high smectite content [2], [3]. The regional bentonites are used mostly for typical industrial applications, such as additives to molding sands, drilling fluid thickeners in the oil industry, clarifiers for wines, juices and cooking oils, and as additives in pet food. Due to their low cost, abundance, and environmental compatibility, bentonites from North Patagonia have been studied and showed to be good adsorbents in water for different organic and inorganic species [4]–[9]. Despite the wide use of different clay minerals as excipients and active principles in the pharmaceutical and cosmetic industry, in addition to their applications in drug-carrying and release, and pelotherapy [10]–[12] there are only a few studies related to the potential use of regional bentonites [13], [14]. Anthocyanins (ACy) are the pigments that are responsible for the blue, purple and red colour of many plants, fruits, and vegetables. These organic compounds are natural dyes and due to their easy extraction, non-toxicity and water-solubility, they have been studied as possible substitutes for synthetic dyes in the food industry [15], [16]. Additionally, anthocyanins have also been shown to have biological activities associated with health benefits such as antioxidant, antidiabetic, and cardioprotective properties, among others [16]–[20]. Chemically, ACy are flavonoids and their structures contain some cyanidin, delphinidin and pelargonidin nuclei, or their methylated derivates. Usually, anthocyanins are glycosides of anthocyanidins and of the many ACy reported only a few are present in fruits and vegetables [16], [20], [21]. The anthocyanins present in red cabbage have acquired special attention due to their potential applications associated with their physiological functions. The amount of ACy in red cabbage is higher than other vegetables and depends on the variety, crop type, and maturation time [16], [20], [22]. In an aqueous solution, ACy are compounds, which are extremely sensitive to changes in the media pH producing at least five different colours and behaving as natural pH indicators [15], [23]–[27]. The exceptional behaviour of ACy as a pH indicator is limited by their stability, which depends on pH, temperature, and light intensity. The latter has generated studies to identify solid ACy supports, which could enable them to maintain their properties and improve their stability [15], [23]–[27]. Amongst the different solids studied, clay minerals have been shown to be good supports for improving ACy stability and enabling the development of new applications [25]–[27].
In the present work, four samples from two different bentonite deposits located in the Argentine Patagonian region were characterized and assessed as possible solid supports for ACy extracted from red cabbage. The adsorption studies were focused on identifying the best material for use in potential novel applications.
2. Materials and Methods
2.1. Bentonite samples
Four cretaceous bentonites from the Patagonian region were analysed and designated as B1, B2, B3, and B4. The first was collected from the Cerro Valcheta site in the Río Negro province belonging to the Neuquén Group (NG) [28], [29]. The other three were collected from different locations in the Allen Formation (AF), B2 from near the town of Catriel, and B3 and B4 from deposits in Lake Pellegrini, their locations are shown in Figure 1.
2.2. Anthocyanis properties and extraction
Chemically, anthocyanins belong to the flavonoid family sharing the same nucleus of phenolic rings but differing in their substituent groups. Usually, an extract taken from natural sources will contain a mix of ACy, which in the case of red cabbage exhibited more than 30 different components. All the ACy present in red cabbage derive from the main component: cyanidin-3-diglucoside-5-glucoside (Figure 2), where the acyl groups act as protectors of the flavylium cation, thus avoiding its degradation and generating unusual stability under different media pH [16], [17]. The chromophore responsible for the anthocyanin dye is the flavylium cation, which changes the colour of the solution depending on the substituents present in their structure and the source of ACy [17]. In the case of red cabbage, four species are possible depending on the media pH. At pH values lower than 3 the solution becomes red due to the flavylium cation present and its hydration, at pH values between 3 and 9 it generates a carbinol pseudobase and quinoidal bases and the colour of the solution changes from violet to blue. The last species has a chalcone pseudobase and its presence turns the colour of the solution to yellow. The latter is associated with the rupture of the anthocyanin chromophore and its degradation, which is generated by pH values higher than 9, or at high temperatures [16], [17], [20], [22].
A red cabbage extract was prepared by simple extraction with water. The system was prepared with 500 g of washed, cleaned and crushed red cabbage, with distilled water in a ratio of 0.8:1 g mL-1, it was covered and heated to boiling point for 45 minutes. After filtering, the supernatant was adjusted to pH 3 with hydrochloric acid (0.1 mol L-1) and was kept covered from light and frozen until use. The anthocyanin concentration wasmeasured using a T60 UV-VIS spectrophotometer and following the methodology proposed by Giusti and Wrolstad (2001) [30].
2.3. Characterization of bentonite samples
2.3.1. Mineralogical, chemical and structural characterization
Mineralogical analysis of the four samples was carried out by means of X-ray diffraction (XRD) in a Bruker D8 with Lynxeye XE-T detector equipment, using CuKα radiation (40 kV, 20 mA) and a scanning speed of 1° 2θ/min. The powdered whole-rock samples were used to determine bulk mineralogy. After clay fraction separation (< 2 µm), sample mounts were prepared from suspensions oriented on glass slides. The identification of clay minerals was carried out on the samples air-dried (AD) with ethylene glycol solvation (EG), and heated at 550 ˚C. The mineral intensity factors (MIF) method was applied to XRD reflection intensity ratios normalized to 100 % with calibration constants for the quantitative estimation of mineral content [31]. To establish the relative ordering ‘crystallinity’ of smectite, the FWHM (Full Width at Half Maximum) parameter was measured on the (001) reflection on the ethylene glycol oriented mount [32]. The crystallite size was calculated using the Scherrer equation.
In addition to the X-ray diffraction technique (XRD), the mineralogical analysis was complemented with infrared spectroscopy (FTIR), thermal analysis (DTA-TGA), and nuclear magnetic resonance analysis (NMR). The thermal analysis (DSC/DTA/TGA Q600 of TA Instruments) of the four samples was performed using 10 mg powdered clay sample in a Pt sample holder at an average heating rate of 10 °C/min with an alumina reference. The infrared spectroscopy (FTIR) (Bruker IFS 66v standard) spectra of the same four representative samples were recorded with a spectral resolution of 2 cm−1 in transmission mode in the region 400-4000 cm-1. The samples were examined in KBr pellets (3 mg/300 mg KBr). Nuclear magnetic resonance analysis 27Al (NMR) (Bruker Av 400WB) of the clay fraction was also carried out. The 27Al MAS NMR spectra were recorded with pi/12 excitation pulses to obtain a response as uniform as possible for both octahedral and tetrahedral aluminium [33].
Chemical analyses of the four whole-rock bentonites were carried out using sample fusion and inductively coupled plasma atomic emission spectroscopy (ICP-AES and MS) for major and trace elements at the ACTLABS laboratory (Canada). The detection limits for analyses were between 0.01 and 0.001 wt. % for major elements.
2.3.2. Physical and physicochemical properties
The physical and physicochemical properties of the bentonite samples, such as cation exchange capacity, swelling, water content, granulometry, and colour were studied. The cation exchange capacity (CEC) was measured using the copper triethylenetetramine [Cu(trien)]2+ method [34] where 0.025 g of mineral previously dried was suspended in 5 mL distilled water and a solution 0.01 mol L-1 [Cu(trien)]2+ was used for the exchange at pH 7. The swelling capacity was determined according to the ASTM 5890 rule. The water content was gravimetrically measured whereby 0.25 g mineral was dried at 60 °C under a controlled air atmosphere until a constant weight was achieved. The sample colour was determined using a Minolta CR 400 photocolourimeter. The grain size distribution of the samples was determined using a laser diffraction analyzer (Malvern Mastersizer3000) in the 0.01-1000 µm range. The statistical parameters considered were the mode, median (Dv50), volume mean diameter D[4,3] and Dv90 percentiles.
2.4. Anthocyanins adsorption assays
The adsorption experiments were conducted by mixing 0.02 g adsorbent with 8 mL ACy solution in 10 mL tubes and stirring at 20 °C until equilibrium time was reached. The relationship adsorbent/solution was selected based on previous studies [7]. After adsorption, the supernatants were separated using a Sorvall RC 5C centrifuge at 8000 rpm for 20 min. The ACy equilibrium concentrations were measured using a T60 UV-VIS spectrophotometer following the methodology proposed by Giusti and Wrolstad (2001) [30]. All samples were measured in duplicate and the average value present in the results. The quantity of adsorbed ACy was calculated according to Equation 1:
where: V is the ACy solution volume (L), Ci and Ce are initial and equilibrium ACy concentrations (mmol L-1) and w is the mass of adsorbent (g).
Different authors have reported the low stability of ACy solutions at pH values higher than 6, and therefore this pH range was not studied [15], [35]. The first test was carried out on all samples in contact with 0.75 mM ACy solution at pH 3 and stirring for 24 h. From these results, the sample that showed the greatest adsorption was selected to evaluate the effect of pH on adsorption using a 0.5 mM ACy solution adjusted to pH values between 3 and 6 with either HCl or NaOH, and stirring at 20 °C for 24 h. Following this kinetic experiments were conducted with an ACy solution at 0.38 mM and varying the contact times between 0.5 and 24 h. Taking into account all the previous results, the adsorption isotherms were carried out by selecting from 0.12 to 1.3 mM at pH 3 for ACy solutions and a 5 h contact time. The experimental results for the adsorption kinetics were fitted to both the pseudo-first-order (PFM) and pseudo-second-order models (PSM) and the adsorption isotherm data were fitted to Langmuir, Freundlich, and Sips isotherm models to evaluate the adsorption mechanism of ACy on the bentonites [36], [37].
3. Results and Discussion
3.1. Material characterization
3.1.1. Mineralogical, chemical and structural characterization
Mineralogical results from the four samples analysed are shown in Figure 3 and Table 1. Phyllosilicates were dominant (88-95 %) with a mean value of 93 %. The minerals quartz (tr-3 %), feldspar (plagioclase and/or potassium feldspar) (tr-2 %), and gypsum (0-4 %), occurred as minor phases. In sample B1 trydimite (10 %) was also identified.
The clay fraction (< 2µm) was mainly composed of smectite (> 88%), which was the only clay mineral present. The oriented clay samples B2, B3 and B4 showed the presence of dioctahedral Al-smectite (d060=0.1498-0.1499 nm) with Na as the main interlayer cation (d001 = 1.224-1.247 nm). In sample B1 the dioctahedral Al-smectite (d060=0.1498 nm) had mostly divalent cations as interlayer cations (d001= 1.456 nm). The characteristic basal d-spacings of ethylene glycol solvated samples were: 1.663-1.691 nm (001), 0.841-0.848 nm (002), 0.559-0.563 nm (003), 0.421-0.424 nm (004), and 0.335-0.338 nm (005). The FWHM parameter of the ethylene glycolated smectites was variable in the bentonite samples ranging from 0.40 to 0.49, corresponding to crystallite sizes between 18 and 21 nm. The Greene-Kelly test corroborates the presence of an octahedral high charge smectite of the montmorillonite type [38].
The chemical composition of the bentonites is shown in Table 2. The samples showed major element contents consistent with the identified mineralogy. Significant differences were observed between the analysis of B1 and the other samples. The sample formed by smectite with Na in the interlayer (B2, B3 and B4), presented a lower SiO2 content (54.14-55.19 %) and MgO (2.59-2.78 %) but a higher Al2O3 content (16.78-17.62 %), Fe2O3 (4.18-4.38 %), CaO (1.11-2.21 %), Na2O (2.21-2.68 %), K2O (0.28-0.36 %) and TiO2 (0.20-0.52 %). The SiO2/Al2O3 and Na2O/MgO molar ratios were different, with B1 reaching 6.81 and 0.19, respectively. In the remaining samples a lower SiO2/Al2O3 (5.30-5.48), but higher Na2O/MgO (0.51-0.67) molar ratio was observed. In addition to the observed difference in the interlayer cations and the absence of gypsum in B1, it is obvious that there is a genetic factor that would justify the compositional differences. The average structural formulae of analysed bentonites is presented in Table 2, corroborating that in all samples smectite is montmorillonite.
Figure 4 shows the FTIR spectra for the samples. All spectra showed montmorillonite characteristic signals, which are summarized in Table 3 and compared with the Wyoming bentonite as a reference [39].
The bands observed with the highest wavenumber were associated with the O-H stretching and bending vibrations of the water molecules adsorbed on the inner and outer montmorillonite surfaces. Additionally, all spectra showed bands assigned to stretching Si-O bonds and Si-O-Si stretching vibration for dioctahedral smectites and the bands associated with the presence of aluminium in the tetrahedral sheets (δ Al-O-Si and δ Al-O-Si). The OH bending of Al-(or Mg)-OH and Al-OH-Al were identified and associated with the presence of octahedral cations presence. In the case of B1, both the slight displacement of the 3620 cm-1 band towards a lower wavenumber and the absence of the 885 cm-1 band (stretching Fe-Al-OH) are characteristic of Mg-Ca montmorillonite, in agreement with the DRX and the chemical results [39]–[41].
The TGA curves of the samples were typical for Al-smectite [42] showing very similar thermal behaviour (Figure 5). Two characteristic weight loss ranges were obtained for all the samples and are summarized in Table 1. The first one appeared between 20 and 200 °C and is related to the loss of physisorbed water. All the samples showed two peaks below 200 °C, in the case of B2, B3, and B4 the peak observed at 53 °C is associated with the sample humidity, and the peak at 105 °C suggests the prevalence of monovalent interlayer cations. Sample B1 showed the highest weight loss in this range (9.21 %) and the temperature for the second peak was at 130 °C providing evidence that this sample has a greater amount of ab-adsorbed water. This is due to the presence of divalent cations in the clay interlayer which have a greater polarizing power than monovalent cations and therefore retain water more strongly [39], [43], [44]. The second weight loss range was between 200 and 1000 °C and has been assigned to the incipient dehydroxylation of calcium and sodium montmorillonites which can appear at different temperatures according to the interlayer cation. In this range, the TGA of B1 and B2 showed one peak at 642 and 660 °C, respectively whereas B3 and B4 exhibited two peaks around 570 and 650 °C all of which are associated with the removal of structural OH in the clay mineral structure. Usually, this behaviour is also associated with the presence of iron in the samples and is commonly related to their deposit genetic type [39], [43].
The NMR Spectra in the Solids provide unique information about the structure and dynamics of the materials under study. The 27Al MAS spectra of bentonites had a large peak at around 0.86 ppm in B1, but ranged between 2.89 and 3.92 ppm in B2 and B4, indicating that much of the aluminium is in the octahedral Al environments [45], corroborating the montmorillonite composition of the smectite in both the Mg-Ca and Na bentonites. In sample B4 one subordinated resolved peak at around 58.17 ppm has been attributed to minor four-coordinate tetrahedral Al core. The results obtained for FTIR, TGA and NMR were in agreement with the chemical analyses shown above.
3.1.2. Physical and physicochemical properties
Table 4 summarizes the results of the cation exchange capacity determination, water content, swelling index, and colour parameters for four bentonites. The CEC values obtained are consistent with the high montmorillonite content and are similar to the values that were previously reported for materials from nearby sites [2], [3], [7]. Considering that three of the samples belong to the Allen Formation (AF) and the other to the Neuquén group (GN), only two: B1 (GN) and B3 (FA), were chosen to determine the type of cations present. The results are shown in Figure 6 and indicate that B1 has a preponderance of divalent cations (Mg2+ and Ca2+) while sample B3 is mostly monovalent (Na+ and K+) where the predominant cation is sodium. These results are in accordance with those obtained by XRD and enable the identification of samples B2, B3 and B4 as Na-bentonites and sample B1 as the Mg-Ca-Na-bentonite.
The values obtained for the swelling index suggested that two different types of behaviour could be considered and are associated with the deposit region. B1 is the bentonite with the least expansion capacity which could be due to the presence of a divalent cation in the interlayer region keeping the clay sheets together with a greater force and requiring more energy for the layer expansion. The swelling values obtained for B3 and B4 are similar to those reported in previous research and are consistent with the fact that sodium is the main cation in their interlayer [14]. In the case of B2, despite being a sodium bentonite, it has a low swelling percentage, which could suggest that this sample had a higher proportion of divalent cations in the interlayer than the other Na-bentonites. Further studies will be necessary to corroborate this. The values for water content were similar for all the samples and indicated that the water content is more weakly bound to the clay mineral surface. These values could be associated with the porosity of the samples, which for the montmorillonites must be mesoporosity.
Figure 7 shows the cumulative volume and particle size distribution and Table 4 summarizes the main values obtained for four bentonites using gravimetric studies. The results showed that B1 had the highest percentage of clay and the lowest percentage of silt, while the Na-bentonites that originated from the Lake Pellegrini deposit had similar compositions of silt and clay, and B2 had the lowest proportion of clay which could be due its region of origin (Figure 7A). In all cases, the amount of clay present in each sample had a directly proportional relationship with quantity of smectite shown above (Table 1). The four samples had mostly unimodal particle size distributions with a particle size of less than 200 μm, according to the results previously shown (Figure 7B). Additionally, the values for Dv50, Dv90 and the D[4,3] indicate that B1 and B2 are the minerals with the largest particle size, while B3 and B4 showed lower values and this may be explained by the region from which each sample originated (Table 4).
The colour of the minerals was directly associated with their chemical and mineralogical composition and is a relevant parameter when minerals are used in applications associated with health because the colour is an important factor in their acceptability by people. The colour of the bentonites are variable, ranging from blue-gray, olive, brown, and, rarely white. White bentonites are very rare in occurrence and are more valuable in many applications that desire a white colour [46]. The colour parameters of the samples are shown in Table 4 where L*, a*, and b* parameter were measured. L* represents brightness (0 = black, and 100 = white), the a* scale indicates the chromaticity axis ranging from green (−) to red (+), and the b* axis ranges from blue (−) to yellow (+) [47]. High values of L* indicate a greater capacity to reflect light, while low values represent a greater capacity to absorb electromagnetic radiation. The L values obtained for the samples indicate a scale of capacity to reflect increasing radiation in the order B4 < B1 < B3 << B2. The first three samples are more similar to each other, while B2 differs markedly. With regard to parameter a*, B3 presented chromaticity closer to green while B2 tended more towards red, while for chromaticity parameter b*, all samples tended more towards yellow, with sample B3 having the highest value.
3.2. Anthocyanins adsorption
Figure 8 shows the adsorption results when all the materials were probed as ACy adsorbents at pH 3, as mentioned above, the pH was chosen taking into consideration the stability of the ACy solutions [15]. The results showed that the amount adsorbed by the samples was in the order: B3 > B4 > B2 > B1, suggesting that Na-bentonites have a higher ACy adsorption capacity than the Mg-Ca-Na-bentonite. This can be explained by considering that the adsorption mechanism reported for natural clays is by cation exchange, and a monovalent cation such as sodium is more easily displaced than a divalent cation such as calcium or magnesium. Thus, the flavylium cation present in the solution does not have enough sufficient strength to displace the divalent cations present in B1, decreasing its adsorption under these conditions.
Taking these results into account and to evaluate the pH required to carry out the kinetic and adsorption experiments, the sample B3 was chosen and the results of adsorption vs pH are shown in Figure 9. This figure shows that the highest adsorption capacity was obtained at pH 3, and as the pH values increased, the adsorption decreased significantly. These results may be explained by the fact that the clay has a net negative structural charge throughout the pH range and the main ACy species in solution is the flavylium cation, which implies that the amount adsorbed will be greater at the lowest mean pH. This behaviour is associated with the adsorption mechanism of the cationic exchange of the flavylium cation by the cations in the natural material, which is well known. As the pH of the media increases due to the proportion of uncharged ACy molecule (quinoidal base) increasing, so the adsorption is gradually reduced. Taking these results into account, the pH selected for the kinetic studies was pH 3.
Considering that the kinetics studies showed similar results for the sodic bentonites Figure 10 shows the adsorption kinetics obtained for the B1 and B3 samples and their corresponding fit to the pseudo-second-order model. The results proved that the system quickly tends to equilibrium in the Na-bentonite reaching equilibrium after that 1 h contact. Conversely, in the case of B1, the time necessary for the system to reach equilibrium was 4 h. Both results support the fact that the adsorption of ACy under these working conditions occurs by cation exchange because this type of mechanism has fast kinetics.
The experimental data obtained were fitted to the pseudo-first order and pseudo-second order models. Table 5 shows the kinetic parameters calculated through non-linear regression and exhibits a good fit for both models. However, considering the system under study, the most appropriate is the pseudo-second order model because it is based on the adsorption capacity of the solid and the controlling stage of the adsorption process is the change generated in the system either by some chemical or electrostatic process. The latter would be the case of the adsorption of the flavylium cation through cation exchange.
Figure 11 shows the adsorption isotherms of ACy on all minerals at pH 3 and 20 °C. According to the classification by Giles et al. (1974) [48], the B1 isotherm can be classified as Type S (sigmoidal), suggesting that at the beginning of the adsorption process, the ACy molecule has low affinity for the clay surface but once the adsorbate is retained in the solid there could be new adsorption sites for other molecules. Samples B2 and B4 show Type L (Langmuir) isotherms, which suggests that there is a considerable affinity of the ACy species in solution towards the adsorbent, reaching a maximum adsorption value under the conditions studied. Finally, the isotherm obtained for B3 can be classified as Type H (high affinity) showing that at low concentrations of ACy a significant increase in adsorption occurs, proving that the affinity of the adsorbate for the adsorbent is considerably higher than the other samples [48]–[50]. Type L and Type H isotherms are associated with the adsorption of ionic solutes where there is no competition between the solute and the solvent for adsorption sites. These results support those previously proposed where the ACy species interacts electrostatically with the surface of the materials B2, B3, and B4 through a cationic exchange mechanism. In the case of sample B1, a higher concentration of ACy is required to begin adsorption and this could be because the one positive charge of the flavylium cation does not have sufficient strength to displace the divalent cations present in the interlayer of this material. Additionally, the latter is in agreement with the cooperative adsorption mechanism proposed for ACy adsorption on B1.
The experimental data were fitted to the Langmuir, Freundlich, and Sips models, and their corresponding fitting parameters are summarized in Table 6. In all cases, the experimental data exhibited their best fit to the Sips model, suggesting that the adsorption systems present heterogeneity, which can be explained if it is considered that ACy is being adsorbed in sites with different energy on the surface of the minerals, or it could be due to the presence of different species of ACy in the solution. These observations are in agreement with the parameters obtained and are shown in Table 6 where it can be seen that the maximum anthocyanin adsorption capacity obtained was 0.02, 0.08, 0.12, and 0.07 mmol g-1 for samples B1, B2, B3, and B4, respectively. As in the kinetic studies, the sample with the highest adsorption capacity was B3, and the sample with the lowest adsorption capacity B1. Among the Na-bentonites, B3 has a CEC comparable to the others, so the greater adsorption obtained could suggest that the other samples have higher contributions of other divalent cations such as calcium or magnesium in their structure than B3, thus decreasing their adsorption capacities. This is in accordance with that observed in the chemical analyses of bentonites.
In order to investigate whether the adsorption of ACy on the bentonites was by cationic exchange in all cases, the adsorption complexes of ACy on the four samples were analyzed. For this, adsorption was carried out under the same conditions as previously described, the supernatant was separated and the solids were dried at room temperature and FTIR and XRD analyses were obtained for each of the samples. Figure 12 shows the diffractograms of the ACy-Bentonite complexes obtained. The results show that for B2, B3, and B4 an increase of 1.2 to 1.4 nm in the basal spacing 𝑑001 was observed. It is well known that sodium montmorillonites have a hydration layer of the sodium cation and are identified by the presence of a 𝑑001 that appears in the vicinity of 1.26 nm, a value that includes the thickness of a TOT sheet (0.96 nm) plus the interlaminar space that will vary depending on the interlayer cation and its hydration [51]. Because the laminar structure of the mineral is not modified during the adsorption process, the increase in the basal space demonstrate that the anthocyanin molecules were adsorbed in the interlaminar space of the sodium bentonites, which concurs with similar results reported for other ACy-clay systems [23], [25], [27], [52]. Likewise, the width of the peaks obtained suggests a higher disorder in the interlayer of the complexes obtained than the natural material, which could be explained by the contribution made by different interlaminar spaces generated by different orientations of the anthocyanin molecule adsorbed in the interlayer of the material. In the case of B1, it was observed that the basal spacing decreased from 1.46 nm, which is characteristic of bentonites with a predominance of divalent cations, towards a value of 1.22 nm, which could indicate that the anthocyanin was adsorbing in a position such that it occupies the smallest possible space, or it is adsorbed outside the interlayer through other types of interactions. The latter could be because the ACy molecule adsorbs on the non-charged surface sites on B1, such as the siloxane surface, and through hydrophobic interactions, which would explain the cooperative adsorption mechanism proposed.
A possible explanation for the results obtained for the XRD of the ACy-bentonite complexes derived from analysing the structure and dimensions of the ACy molecule is shown in Figure 13. This figure show that there is a fraction of the molecule made up of the aromatic rings, which is flat (flavylium cation), while the glucoside substituents, due to their characteristic boat-shaped structure, generate a region of greater spatial distribution. From this it could be inferred that, in the case of the sodium bentonites, the molecule gets into the interlaminar space in the conformation represented as B, where the aromatic rings of the flavylium cation in the ACy molecule remain parallel to the internal surface resulting in a basal spacing that is the sum of the thickness of the ACy molecule (0.46 nm) and the TOT sheet (0.96 nm). The latter is in agreement with previous reports that suggest that molecules with aromatic rings can orient themselves in the interlayer of the clay mineral and interact through hydrophobic interactions with the siloxane surface of the tetrahedral sheet and with the previously proposed cation exchange mechanism [25]. However, it can be seen that the maximum quantity of adsorbed anthocyanin is low compared to the CEC of each of the bentonites. A possible explanation for this fact would be to consider the molecular size of the anthocyanin and that once the molecule is adsorbed the neighbouring adsorption sites are blocked, preventing the entry of any new ACy molecules into the structure. In the case of B1, and as mentioned above, the molecule may be adsorbed mostly on the external surface of siloxane and, after that it becomes an adsorption site for other molecules, favouring cooperative adsorption.
The FTIR spectra obtained for the ACy-bentonite complex show the same signals and are illustrated in Figure 14. The absorption peaks at 3620, 3430, and 1030 cm-1 are characteristic of montmorillonites and correspond to the stretching of the O-H bonds located between the tetrahedral and octahedral sheets of the mineral, the vibration of the O-H bonds of the water molecules and the stretching of Si-O, respectively [41], [53]. These results showed that the structure of the mineral did not suffer modifications following the adsorption process of ACy on the surface (see Figure 14 A). Conversely, in Figure 14 B, the absorption observed at 2928 cm-1 is associated with the scissor bending of the -CH2- groups in the cyclohexanes while the bands between 1736 cm-1 and 1697 cm-1 refer to the out-of-plane bending of the C-H bonds. These bands may appear superimposed on the broadband that appears around 1600 cm-1 related to the hydration water of the clay mineral. Finally, the set of bands between 1585-1543 cm-1 and 1508 cm-1 are associated with the conjugated diene groups and this may be due to the interaction of this fraction of the molecule with the natural material [21], [54].
The last adsorption probe was to evaluate the material that showed the highest adsorption capacity at a pH value higher than 3, pH 4.5 was chosen due to the instability of the ACy. Figure 15 shows the adsorption isotherms of ACy on B3 at pH 3 and 4.5. The isotherm obtained at pH 3, was previously analysed and classified as Type L according to the classification proposed by Giles et al. [48] where the adsorption is the result of the cation exchange of the flavylium cation present in the solution. The isotherm obtained at pH 4.5, is a sigmoidal type isotherm (Type S) indicating cooperative adsorption, similar to that observed for B1 at pH 3. This could be explained by changes in the pH of the medium, which as it increases, the concentration of the flavylium cation decreases and the neutral species (carbinol pseudobase) appear [55], [56]. In this case, the adsorption generated by cation exchange will be considerably lower, and the species present could be adsorbing through other types of mechanisms, such as van der Waals type interactions or hydrogen bonding, among others, which is consistent with the cooperative adsorption previously proposed [25], [57].
The experimental data were fitted to the Langmuir, Freundlich, and Sips models, their corresponding fitting parameters are summarized in Table 7. In both cases, the best fit was obtained by applying the Sips model, suggesting that adsorption occurs in a system that presents more heterogeneity and this could be associated with the fact that in the solution different ACy species coexist and could interact in different adsorption sites on the clay surface [56], [58]. The results obtained are according to those obtained and shown previously.
4. Conclusions
In the present work, four bentonites from the northern Patagonian region were thoroughly characterized and evaluated as possible adsorbents of a natural dye present in red cabbage (ACy).
The results showed that three of these samples, belonging to the Allen Formation, can be considered Na-bentonites due to their composition and physicochemical properties while the fourth belonging to the Neuquén Group, contained an important proportion of divalent cations in its structure, in particular magnesium and calcium, which allowed it to be characterized as Mg-Ca-Na-bentonite.
The ACy adsorption studies carried out on the four materials demonstrated that Na-bentonites are better ACy adsorbents than Mg-Ca-Na-bentonite under the conditions studied, demonstrating that the charge of the cation present in the interlayer and the species of ACy present in the solution considerably influence the quantity of ACy that the material can retain. The material with the highest ACy adsorption capacity was B3, which is among the Na-bentonites that showed the highest CEC and proportion of smectite in its composition.
The analysis of ACy-bentonite adsorption complexes confirmed the presence of ACy in the interlayer of Na-bentonites, indicating that ACy was adsorbed through a cationic exchange mechanism while on Mg-Ca-Na-bentonite was exclusively adsorbed through other types of interactions. These results are significant given that there are previous reports regarding the adsorption of ACy extracted from other natural sources that suggest that once ACy was adsorbed in the interlayer of smectite, its stability is considerably increased compared to that observed in aqueous solution. The latter is an extremely interesting result given that it represents a potentially new field of application for regional materials that has not been evaluated until now.
Author Contributions
Conceptualization: V.R.A. and M.E.R.J.; methodology: V.R.A. and A.M.; formal analysis: V.R.A, M.B.G and M.E.R.J.; investigation: V.R.A, M.B.G, M.E.R.J., P.M.N. and M.P.; resource: M.E.R.J., P.M.N. and M.P.; data curation: V.R.A, M.B.G, A.M.; writing—original draft preparation: V.R.A, M.P. and M.E.R.J.; writing—review and editing: V.R.A, M.P. and M.E.R.J.; project administration: M.E.R.J. and M.P.; funding acquisition: M.P. and M.E.R.J. All authors have read and agreed to the published version of the manuscript.
Funding
This research was support from the National University of Comahue under the auspices of Project I04-249, titled "Natural and Modified Clay Minerals for Applications in Health and Environment," within the Faculty of Engineering.
Institutional Review Board Statement
Not applicable.
Informed Consent Statement
Not applicable.
Data Availability Statement
Data will be made available on request.
Acknowledgments
The authors gratefully acknowledge National University of Comahue (UNCo), PROBIEN-CONICET-UNCo, and Autonomous University of Madrid for providing technology and financial support.
Conflicts of Interest
The authors declare no conflict of interest.
References
- Brown, T.J.; Idoine, N.E.; Raycraft, E.R.; Shaw, R.A.; Hobbs, S.F.; Everett, P.; Deady, E.A.; Bide, T. World Mineral Production 2012 - 2016. Br. Geol. Surv. 2018. [Google Scholar]
- Musso, T.B.; Roehl, K.E.; Pettinari, G.; Vallés, J.M. Assessment of smectite-rich claystones from Northpatagonia for their use as liner materials in landfills. Appl. Clay Sci. 2010, 48, 438–445. [Google Scholar] [CrossRef]
- Lombardi, B.; Baschini, M.; Torres Sánchez, R.M. Bentonite deposits of Northern Patagonia. Appl. Clay Sci. 2003, 22, 309–312. [Google Scholar] [CrossRef]
- Parolo, M.E.; Avena, M.J.; Pettinari, G.R.; Baschini, M.T. Influence of Ca2+ on tetracycline adsorption on montmorillonite. J. Colloid. Interface Sci. 2012, 368, 420–426. [Google Scholar] [CrossRef]
- Parolo, M.E.; Savini, M.C.; Vallés, J.M.; Baschini, M.T.; Avena, M.J. Tetracycline adsorption on montmorillonite: pH and ionic strength effects. Appl. Clay Sci. 2008, 40, 179–186. [Google Scholar] [CrossRef]
- Parolo, M.E.; Avena, M.J.; Pettinari, G.; Zajonkovsky, I.; Valles, J.M.; Baschini, M.T. Antimicrobial properties of tetracycline and minocycline-montmorillonites. Appl. Clay Sci. 2010, 49, 194–199. [Google Scholar] [CrossRef]
- Roca Jalil, M.E.; Baschini, M.; Sapag, K. Influence of pH and antibiotic solubility on the removal of ciprofloxacin from aqueous media using montmorillonite. Appl. Clay Sci. 2015, 114, 69–76. [Google Scholar] [CrossRef]
- Roca Jalil, M.E.; Vieira, R.S.; Azevedo, D.; Baschini, M.; Sapag, K. Improvement in the adsorption of thiabendazole by using aluminum pillared clays. Appl. Clay Sci. 2013, 71, 55–63. [Google Scholar] [CrossRef]
- Lombardi, B.; Baschini, M.; Torres Sánchez, R.M. Optimization of parameters and adsorption mechanism of thiabendazole fungicide by a montmorillonite of North Patagonia, Argentina. Appl. Clay Sci. 2003, 24, 43–50. [Google Scholar] [CrossRef]
- Carretero, M.I.; Pozo, M. Clay and non-clay minerals in the pharmaceutical industry. Part I. Excipients and medical applications. Appl. Clay Sci. 2009, 46, 73–80. [Google Scholar] [CrossRef]
- Carretero, M.I.; Pozo, M. Clay and non-clay minerals in the pharmaceutical and cosmetic industries Part II. Active ingredients. Appl. Clay Sci. 2010, 47, 171–181. [Google Scholar] [CrossRef]
- Moraes, J.D.D.; Bertolino, S.R.A.; Cuffini, S.L.; Ducart, D.F.; Bretzke, P.E.; Leonardi, G.R. Clay minerals: Properties and applications to dermocosmetic products and perspectives of natural raw materials for therapeutic purposes—A review. Int. J. Pharm. 2017, 534, 213–219. [Google Scholar] [CrossRef]
- Roca Jalil, M.E.; Sanchez, M.; Pozo, M.; Soria, C.; Vela, L.; Gurnik, N.; Baschini, M. Assessment of natural and enhanced peloids from the Copahue thermal system (Argentina): Effects of the drying procedure on lidocaine adsorption. Appl. Clay Sci. 2020, 196. [Google Scholar] [CrossRef]
- Iborra Viseras, C.; Cultrone, G.; Cerezo, P.; Aguzzi, C.; Baschini, M.T.; Vallés, J.; López-Galindo, A. Characterisation of northern Patagonian bentonites for pharmaceutical uses. Appl. Clay Sci. 2006, 31, 272–281. [Google Scholar] [CrossRef]
- Pourjavaher, S.; Almasi, H.; Meshkini, S.; Pirsa, S.; Parandi, E. Development of a colorimetric pH indicator based on bacterial cellulose nanofibers and red cabbage (Brassica oleraceae) extract. Carbohydr. Polym. 2017, 156, 193–201. [Google Scholar] [CrossRef]
- Ghareaghajlou, N.; Hallaj-Nezhadi, S.; Ghasempour, Z. Red cabbage anthocyanins: Stability, extraction, biological activities and applications in food systems. Food Chem. 2021, 365. [Google Scholar] [CrossRef]
- McDougall, G.J.; Fyffe, S.; Dobson, P.; Stewart, D. Anthocyanins from red cabbage - stability to simulated gastrointestinal digestion. Phytochemistry 2007, 68, 1285–1294. [Google Scholar] [CrossRef]
- Saluk, J.; Bijak, M.; Kołodziejczyk-Czepas, J.; Posmyk, M.M.; Janas, K.M.; Wachowicz, B. Anthocyanins from red cabbage extract - evidence of protective effects on blood platelets. Cent. Eur. J. Biol. 2012, 7, 655–663. [Google Scholar] [CrossRef]
- Benvenuti, S.; Bortolotti, E.; Maggini, R. Antioxidant power, anthocyanin content and organoleptic performance of edible flowers. Sci. Hortic. 2016, 199, 170–177. [Google Scholar] [CrossRef]
- Wiczkowski, W.; Szawara-Nowak, D.; Topolska, J. Red cabbage anthocyanins: Profile, isolation, identification, and antioxidant activity. Food Res. Int. 2013, 51, 303–309. [Google Scholar] [CrossRef]
- Li, S. E.; Mu, B.; Ding, J.; Zhang, H.; Wang, X.W.; Wang, A.Q. Fabrication of anthocyanin/ montmorillonite hybrid pigments to enhance their environmental stability and application in allochroic composite films. Clays Clay Min. 2021, 69, 142–151. [Google Scholar] [CrossRef]
- Amogne, N.Y.; Ayele, D.W.; Tsigie, Y.A. Recent advances in anthocyanin dyes extracted from plants for dye sensitized solar cell. Mater. Renew. Sustain. Energy 2020, 9. [Google Scholar] [CrossRef]
- Kohno, Y.; Yasushi, K.; Shibata, M.; Fukuhara, C.; Maeda, Y.; Tomita, Y.; Kobayashi, K. Enhanced stability of natural anthocyanin incorporated in Fe-containing mesoporous silica. Microporous Mesoporous Mater. 2015, 203, 232–237. [Google Scholar] [CrossRef]
- Kohno, Y.; Haga, E.; Yoda, K.; Shibata, M.; Fukuhara, C.; Tomita, Y.; Maeda, Y.; Kobayashi, K. Adsorption behavior of natural anthocyanin dye on mesoporous silica. J. Phys. Chem. Solids 2014, 75, 48–51. [Google Scholar] [CrossRef]
- Kohno, Y.; Kinoshita, R.; Ikoma, S.; Yoda, K.; Shibata, M.; Matsushima, R.; Tomita, Y.; Maeda, Y.; Kobayashi, K. Stabilization of natural anthocyanin by intercalation into montmorillonite. Appl. Clay Sci. 2009, 42, 519–523. [Google Scholar] [CrossRef]
- Silva, G.T.M.; Silva, C.P.; Gehlen, M.H.; Oake, J.; Bohne, C.; Quina, F.H. Organic/inorganic hybrid pigments from flavylium cations and palygorskite. Appl. Clay Sci. 2018, 162, 478–486. [Google Scholar] [CrossRef]
- Kohno, Y.; Hoshino, R.; Matsushima, R.; Tomita, Y.; Kobayashi, K. Stabilization of Flavylium Dyes by Incorporation in the Clay Interlayer. J. Jpn. Soc. Colour. Mater. 2007, 80, 6–12. [Google Scholar] [CrossRef]
- Caminos, R.; Chernicoff, C.J.; Fauqué, L.; Franchi, M. Hoja Geológica 4166-I Valcheta. 2001.
- Johanis, P.; Dalponte, M.; Juárez, P.; Giacosa, R. Recursos minerales industriales, rocas de aplicación y gemas de la provincia de Río Negro. Ser. Contrib. Técnicas Recur. Miner. N° 2022, 49, 1–97. [Google Scholar]
- Giusti, M.; Wrolstad, R. Characterization and Measurement of Anthocyanins by UV-Visible Spectroscopy. Food Anal. Chem. 2001. [Google Scholar] [CrossRef]
- Schultz, L.G. Quantitative Interpretation of Mineralogical Composition from X-ray and Chemical Data for the Pierre Shale. Geol. Surv. Prof. Pap. 1964.
- Moore, D.M.; Reynolds, R.C. X-Ray Diffraction and the Identification and Analysis of Clay Minerals, Second Edition. Oxford University Press, Oxford, 1997, pp. 378.
- Massiot, D.; Bessada, C.; Coutures, J.P.; Taulelle, F. A quantitative study of 27Al MAS NMR in crystalline YAG. J. Magn. Reson. 1990, 2, 231–242. [Google Scholar] [CrossRef]
- Meier, L.P.; Kahr, G. Determination of the Cation Exchange Capacity (CEC) of Clay Minerals Using the Complexes of Copper (II) Ion with Triethylenetetramine and Tetraethylenepentamine. Clays Clay Min. 1999, 47, 386–388. [Google Scholar] [CrossRef]
- Mohd, P.; Khan, A.; Farooqui, M. Analytical Applications of Plant Extract as Natural pH Indicator: A Review. 2011.
- Vareda, J.P. On validity, physical meaning, mechanism insights and regression of adsorption kinetic models. J. Mol. Liq. 2023, 376. [Google Scholar] [CrossRef]
- Wang, J.; Guo, X. Adsorption isotherm models: Classification, physical meaning, application and solving method. Chemosphere 2020, 258. [Google Scholar] [CrossRef] [PubMed]
- Greene-Kelly, R. The identification of montmorillonoids in clays. Journal of soil science 1953, 4, 232–237. [Google Scholar] [CrossRef]
- Tabak, A.; Afsin, B.; Aygun, S.F.; Koksal, E. Structural characteristics of organo-modified bentonites of different origin. J. Therm. Anal. Calorim. 2007, 87, 377–382. [Google Scholar] [CrossRef]
- Komadel, P.; Madejová, J. Chapter 7.1 Acid Activation of Clay Minerals. Dev. Clay Sci. 2006, 1, 263–287. [Google Scholar] [CrossRef]
- Madejová, J. FTIR techniques in clay mineral studies. Vib. Spectrosc. 2003, 31, 1–10. [Google Scholar] [CrossRef]
- Guggenheim, S.; Koster van Groos, A.F. Baseline studies of the clay minerals society source clays: Thermal analysis. Clays Clay Min. 2001, 49, 433–443. [Google Scholar] [CrossRef]
- Sorieul, S.; Allard, T.; Wang, L.; Grambin-Lapeyre, C.; Lian, J.; Calas, G.; Ewing, R. Radiation-stability of smectite. Env. Sci. Technol. 2008, 42, 8407–8411. [Google Scholar] [CrossRef]
- Önal, M.; Sarıkaya, Y. Thermal behavior of a bentonite. J Therm Anal Calorim. 2007, 90, 167–172. [Google Scholar] [CrossRef]
- Woessner, D.E. Characterization of clay minerals by 27 Al nuclear magnetic resonance spectroscopy. Am. Mineral. 1989, 74, 203–215. [Google Scholar]
- Murray, H.H. Chapter 2: Structure and Composition of the Clay Minerals and their Physical and Chemical Properties. Developments in Clay Science 2006, 2, 7–31. [Google Scholar] [CrossRef]
- Sette, P.; Fernandez, A.; Soria, J.; Rodriguez, R.; Salvatori, D.; Mazza, G. Integral valorization of fruit waste from wine and cider industries. J. Clean. Prod. 2020, 242. [Google Scholar] [CrossRef]
- Giles, C.H.; Smith, D. A General Treatment and Classification of the Solute Adsorption Isotherm. J. Colloid. Interface Sci. 1974, 47, 755–765. [Google Scholar] [CrossRef]
- Limousin, G.; Gaudet, J.P.; Charlet, L.; Szenknect, S.; Barthès, V.; Krimissa, M. Sorption isotherms: A review on physical bases, modeling and measurement. Appl. Geochem. 2007, 22, 249–275. [Google Scholar] [CrossRef]
- Saadi, R.; Saadi, Z.; Fazaeli, R.; Fard, N.E. Monolayer and multilayer adsorption isotherm models for sorption from aqueous media. Korean J. Chem. Eng. 2015, 32, 787–799. [Google Scholar] [CrossRef]
- Brigatti, M.F.; Galán, E.; Theng, B.K.G. Structure and Mineralogy of Clay Minerals. Dev. Clay Sci. 2013, 5, 21–81. [Google Scholar] [CrossRef]
- Cunha, R.; Trigueiro, P.; Orta-Cuevas, M.; Medina-Carrasco, S.; Duarte, T.; Honório, L.; Damacena, D.; Fonseca, M.G.; da Silva-Filho, E.; Osajima, J. The Stability of Anthocyanins and Their Derivatives through Clay Minerals: Revising the Current Literature. Minerals 2023, 13, 1–20. [Google Scholar] [CrossRef]
- Elkhalifah, A.; Murugesan, T.; Azmi-Bustam, M. Characterization of different cationic forms of montmorillonite by FTIR, XRD and TGA techniques. Natl. Postgrad. Conf. 2011, 1–6. [Google Scholar]
- Silverstein, R.M.; Bassler, G.C. Spectrometric identification of organic compounds, 1962, 39.
- Chigurupati, N.; Saiki, L.; Gayser, C.; Dash, A.K. Evaluation of red cabbage dye as a potential natural color for pharmaceutical use. Int. J. Pharm. 2002, 241, 293–299. [Google Scholar] [CrossRef]
- Fenger, J.A.; Moloney, M.; Robbins, R.J.; Collins, T.M.; Dangles, O. The influence of acylation, metal binding and natural antioxidants on the thermal stability of red cabbage anthocyanins in neutral solution. Food Funct. 2019, 10, 6740–6751. [Google Scholar] [CrossRef]
- Lima, E.; Martínez-Ortiz, M.J.; Fregoso, E.; Méndez-Vivar, J. Capturing natural chromophores on natural and synthetic aluminosilicates. Stud. Surf. Sci. Catal. 2007, 170, 2110–2115. [Google Scholar] [CrossRef]
- Chigurupati, N.; Saiki, L.; Gayser, C.; Dash, A.K. Evaluation of red cabbage dye as a potential natural color for pharmaceutical use. Int. J. Pharm. 2002, 241, 293–299. [Google Scholar] [CrossRef]
Figure 1.
A. Northpatagonic region in Argentine. B. Sampling location in Rio Negro Province where B1 (Cerro Valcheta), B2 (Catriel), B3 and B4 (Pellegrini Lake).
Figure 1.
A. Northpatagonic region in Argentine. B. Sampling location in Rio Negro Province where B1 (Cerro Valcheta), B2 (Catriel), B3 and B4 (Pellegrini Lake).
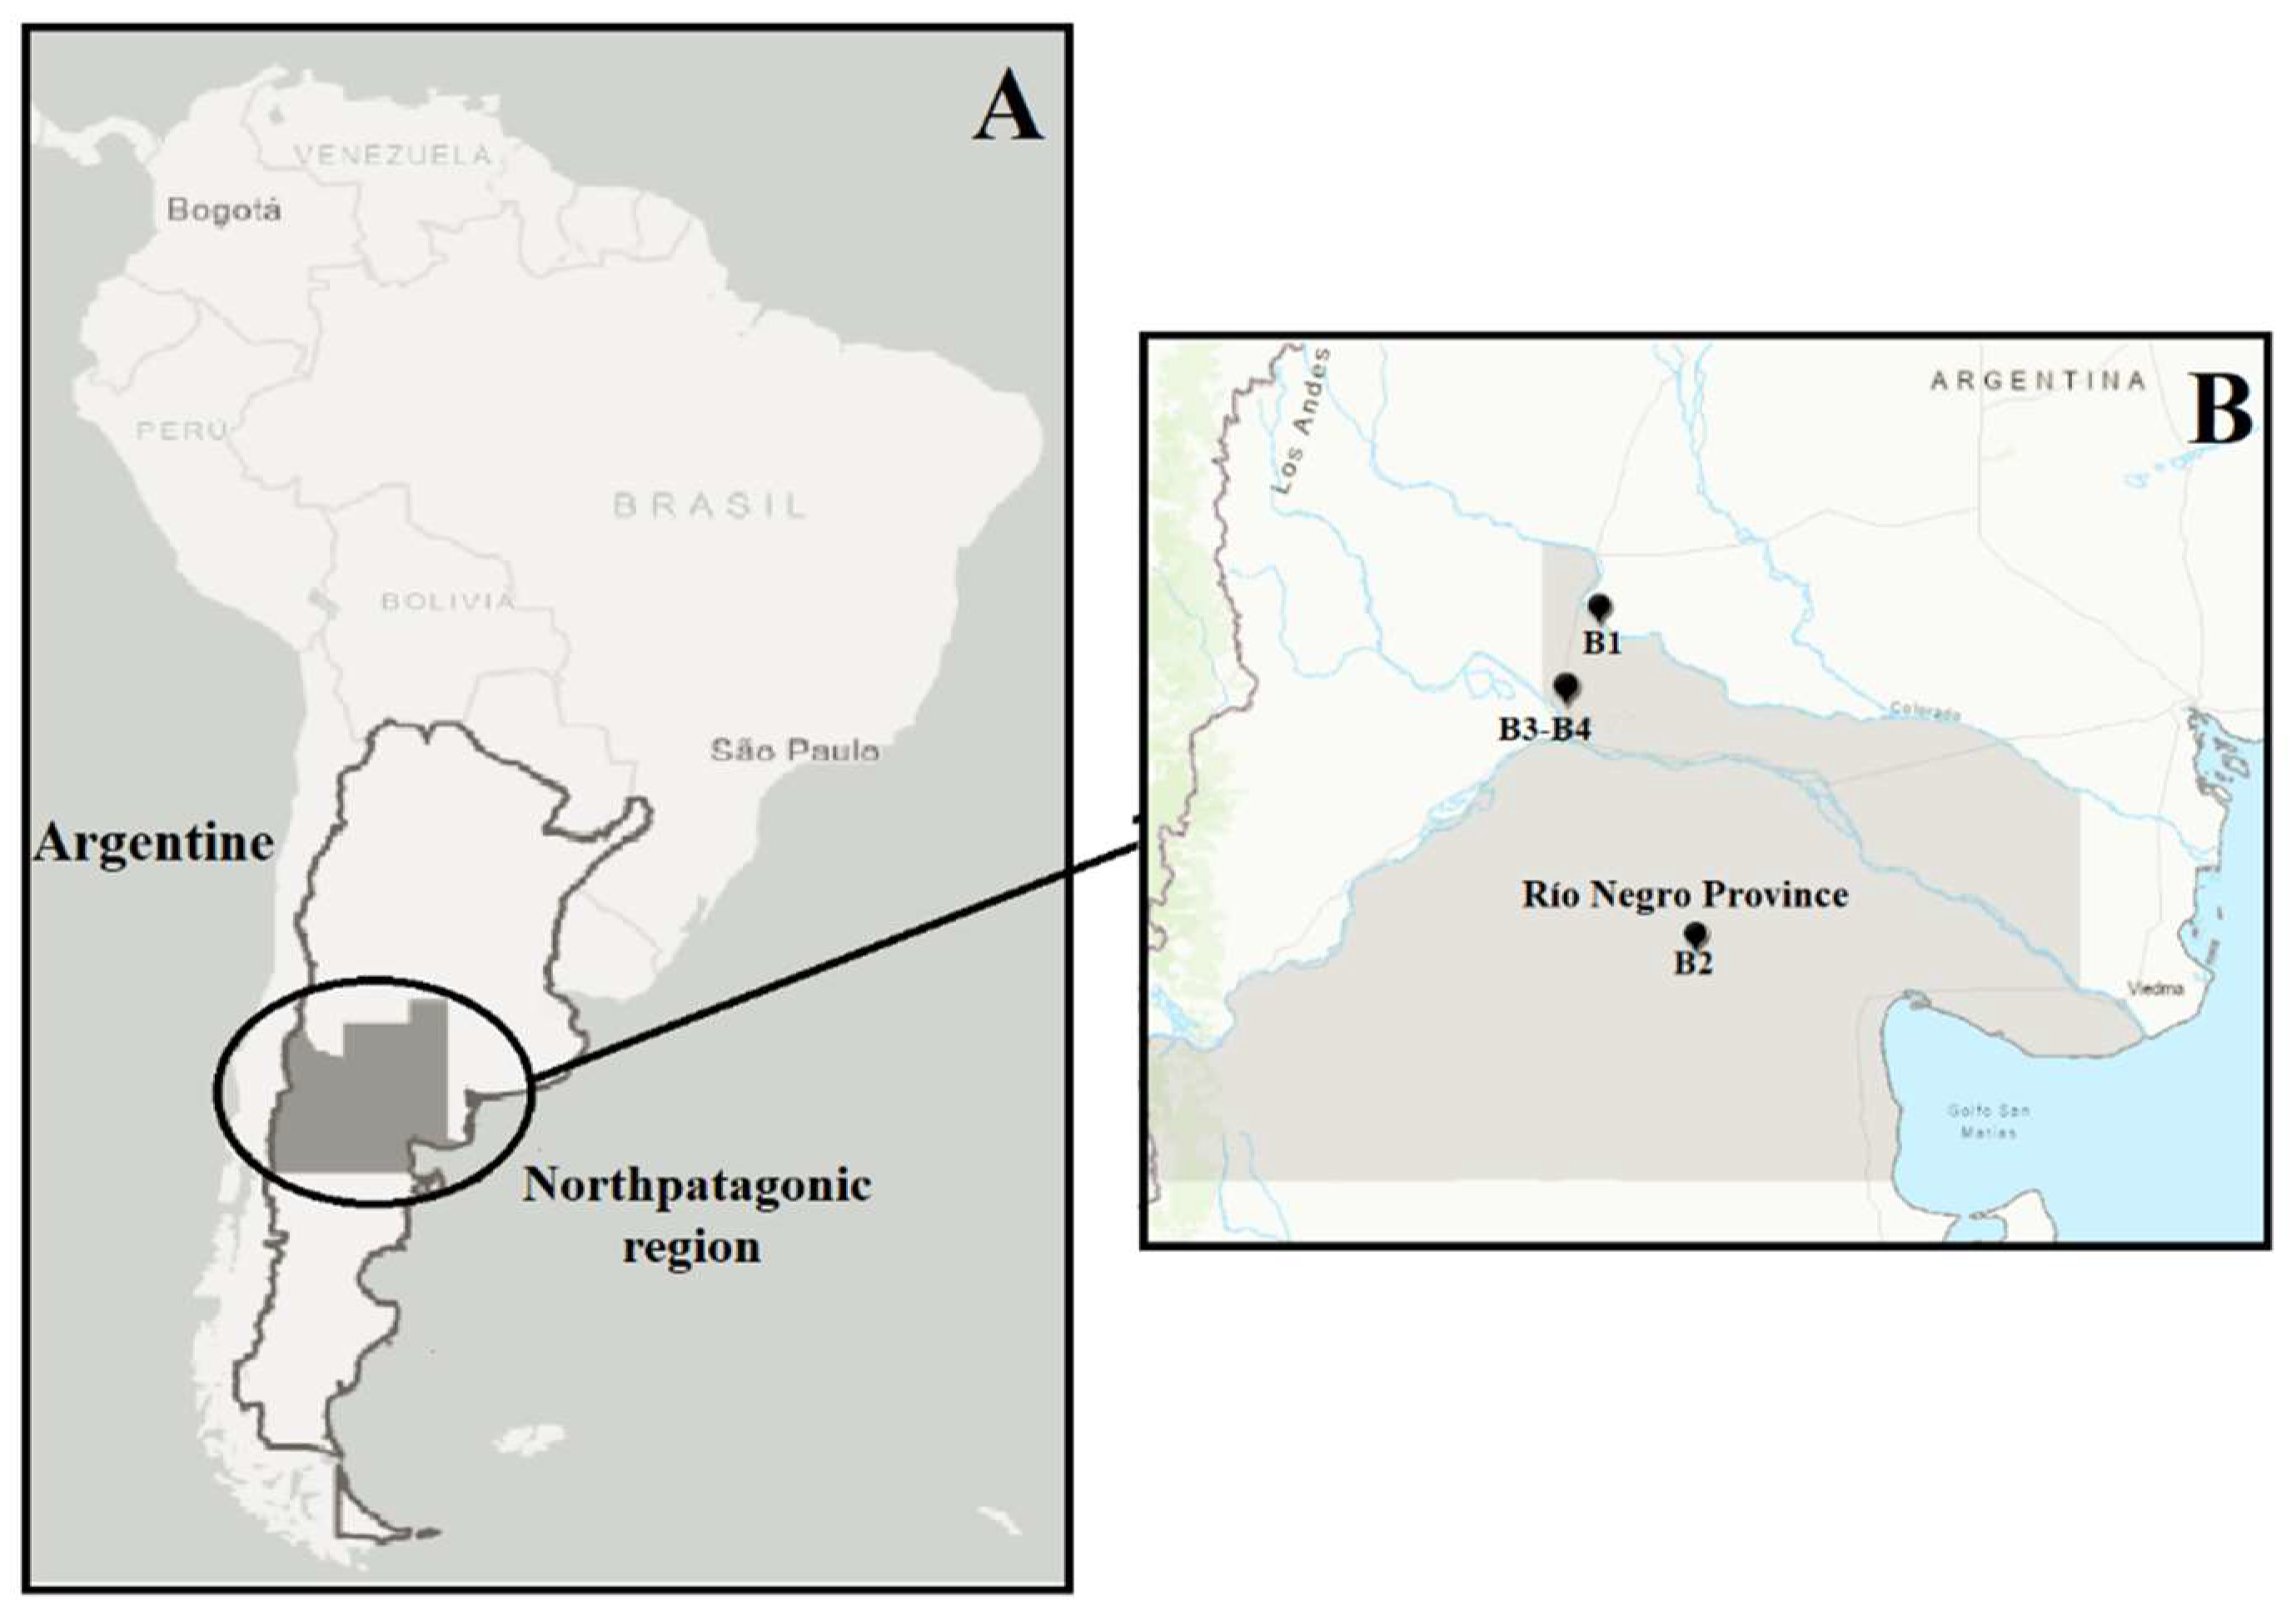
Figure 2.
Chemical structure of cyanidin-3-diglucoside-5-glucoside.
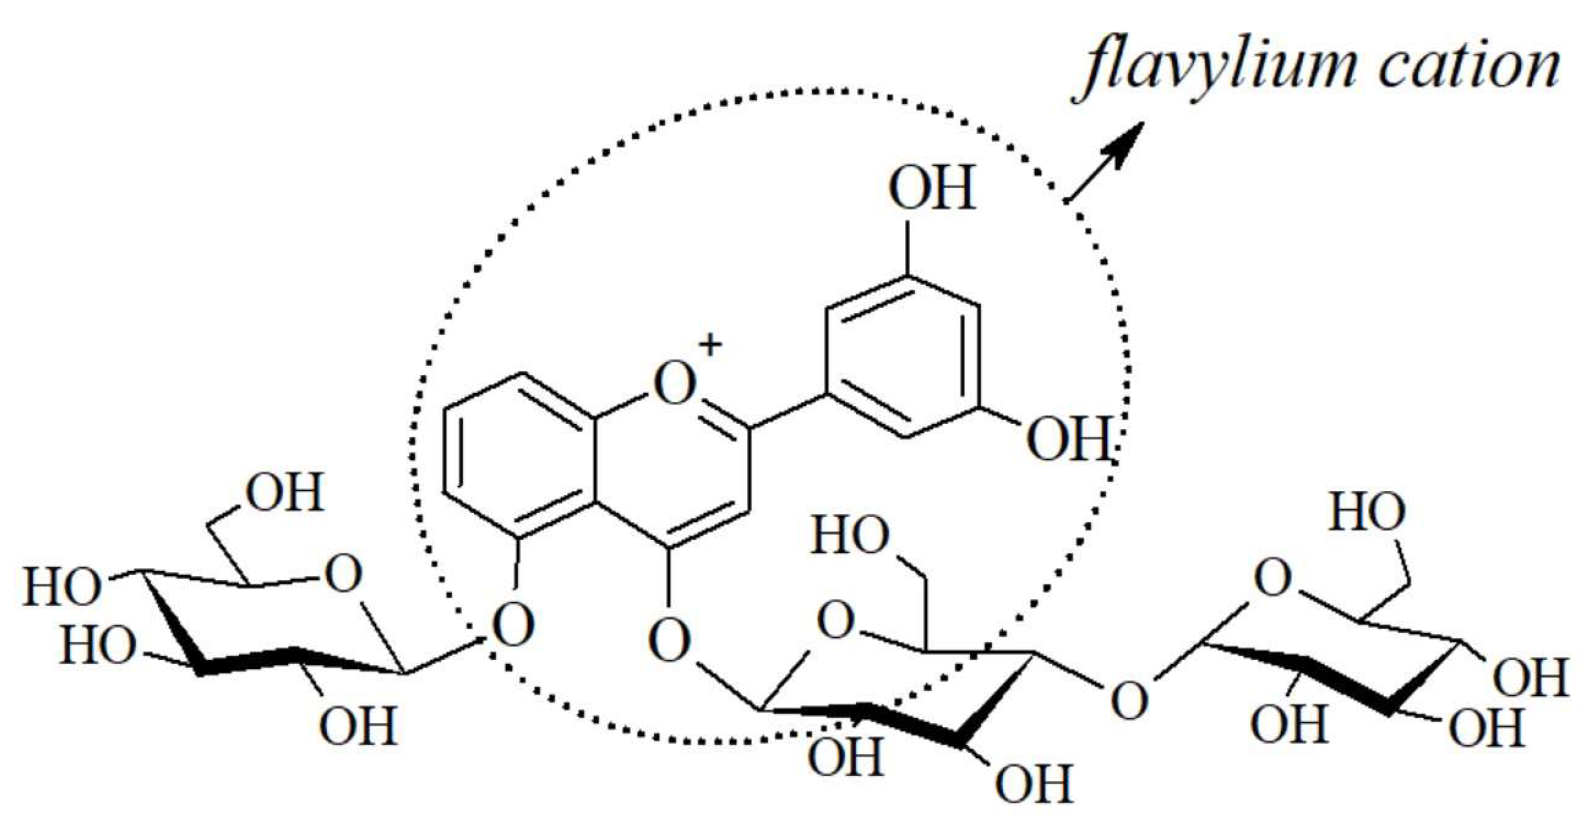
Figure 3.
A. Representative powder X-ray pattern of the bentonites where Sm: smectite, Q; quartz; Pl: plagioclase; F: potassic feldespars; G: gypsum. B. Diffractograms <2 μm grain-size fraction for bentonites, solid lines represent samples air-dried (AD) and dot lines represent after ethylene glycol solvation (EG).
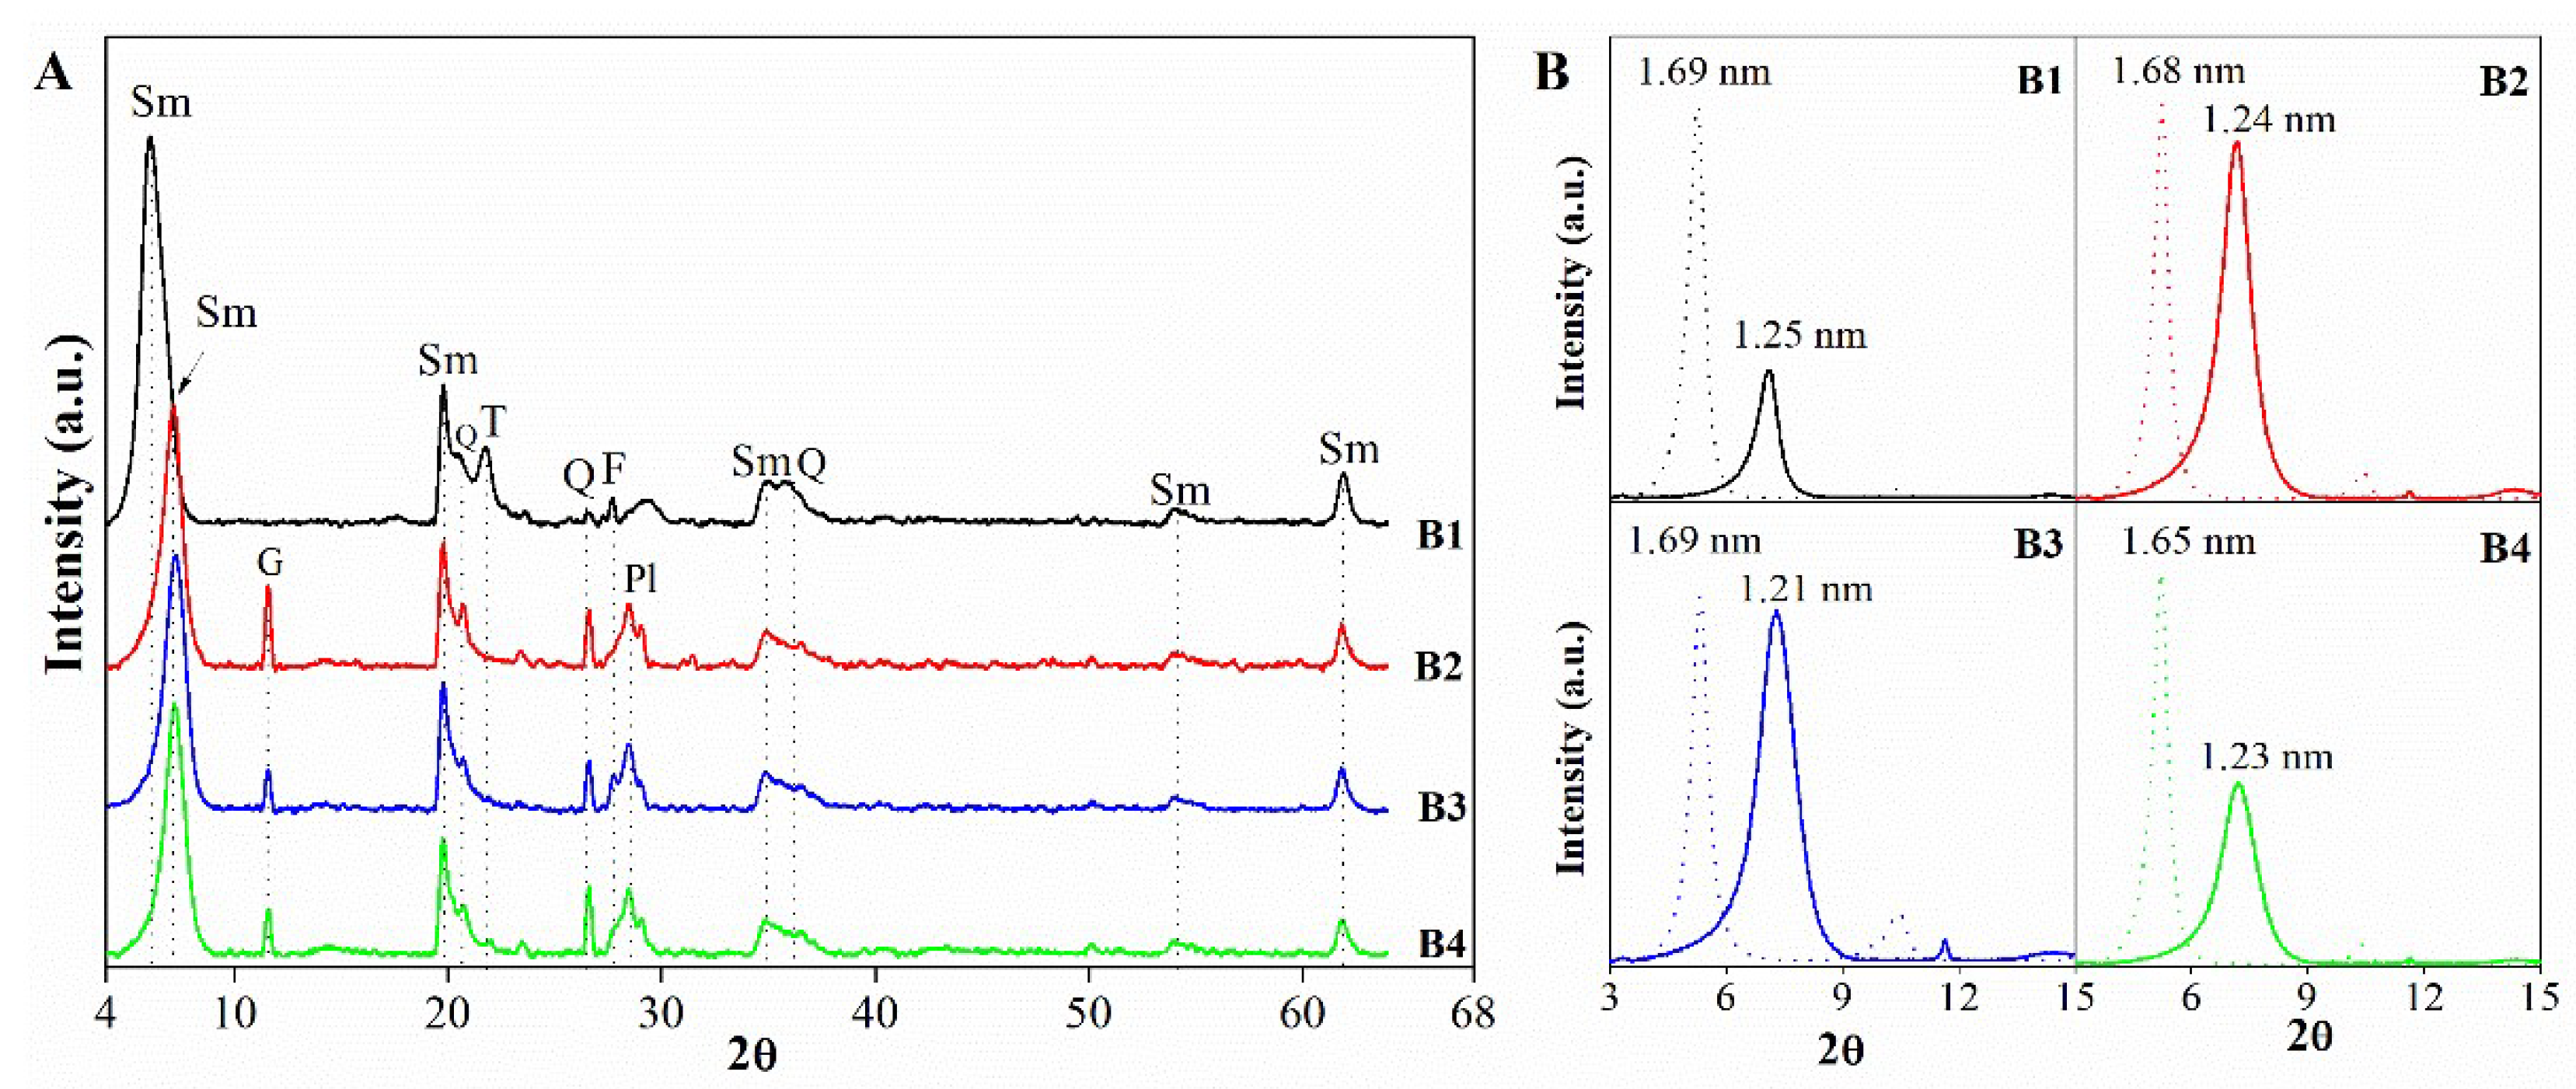
Figure 4.
FTIR spectra for the four bentonites.
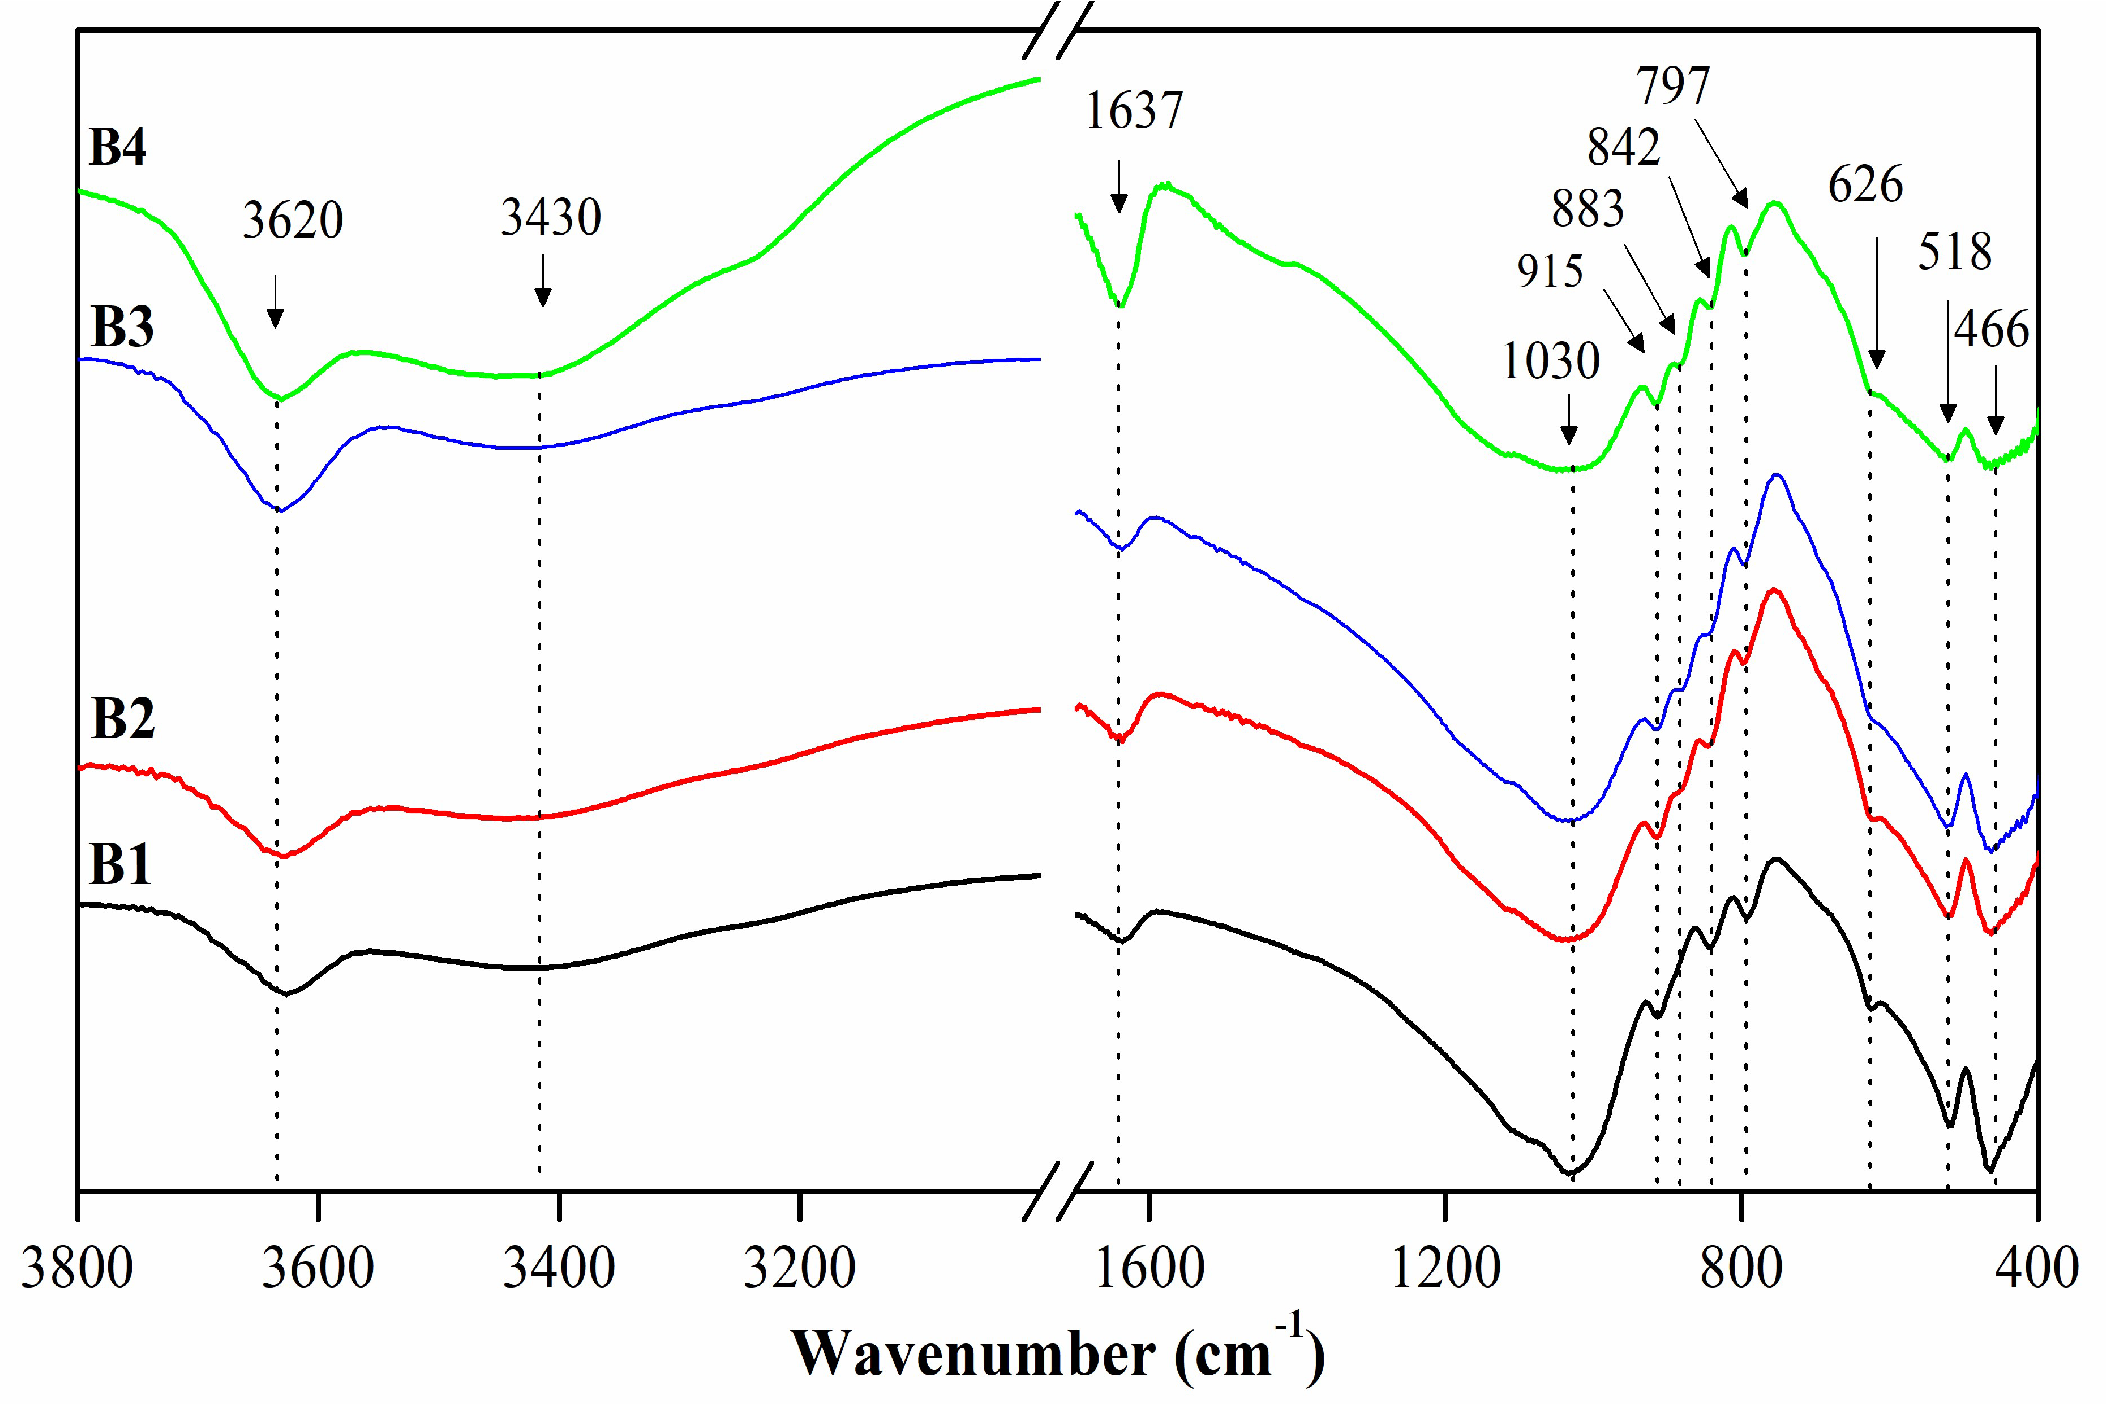
Figure 5.
TGA and DTG for the four bentonites and the percentage of weight loss in the different ranges.
Figure 5.
TGA and DTG for the four bentonites and the percentage of weight loss in the different ranges.
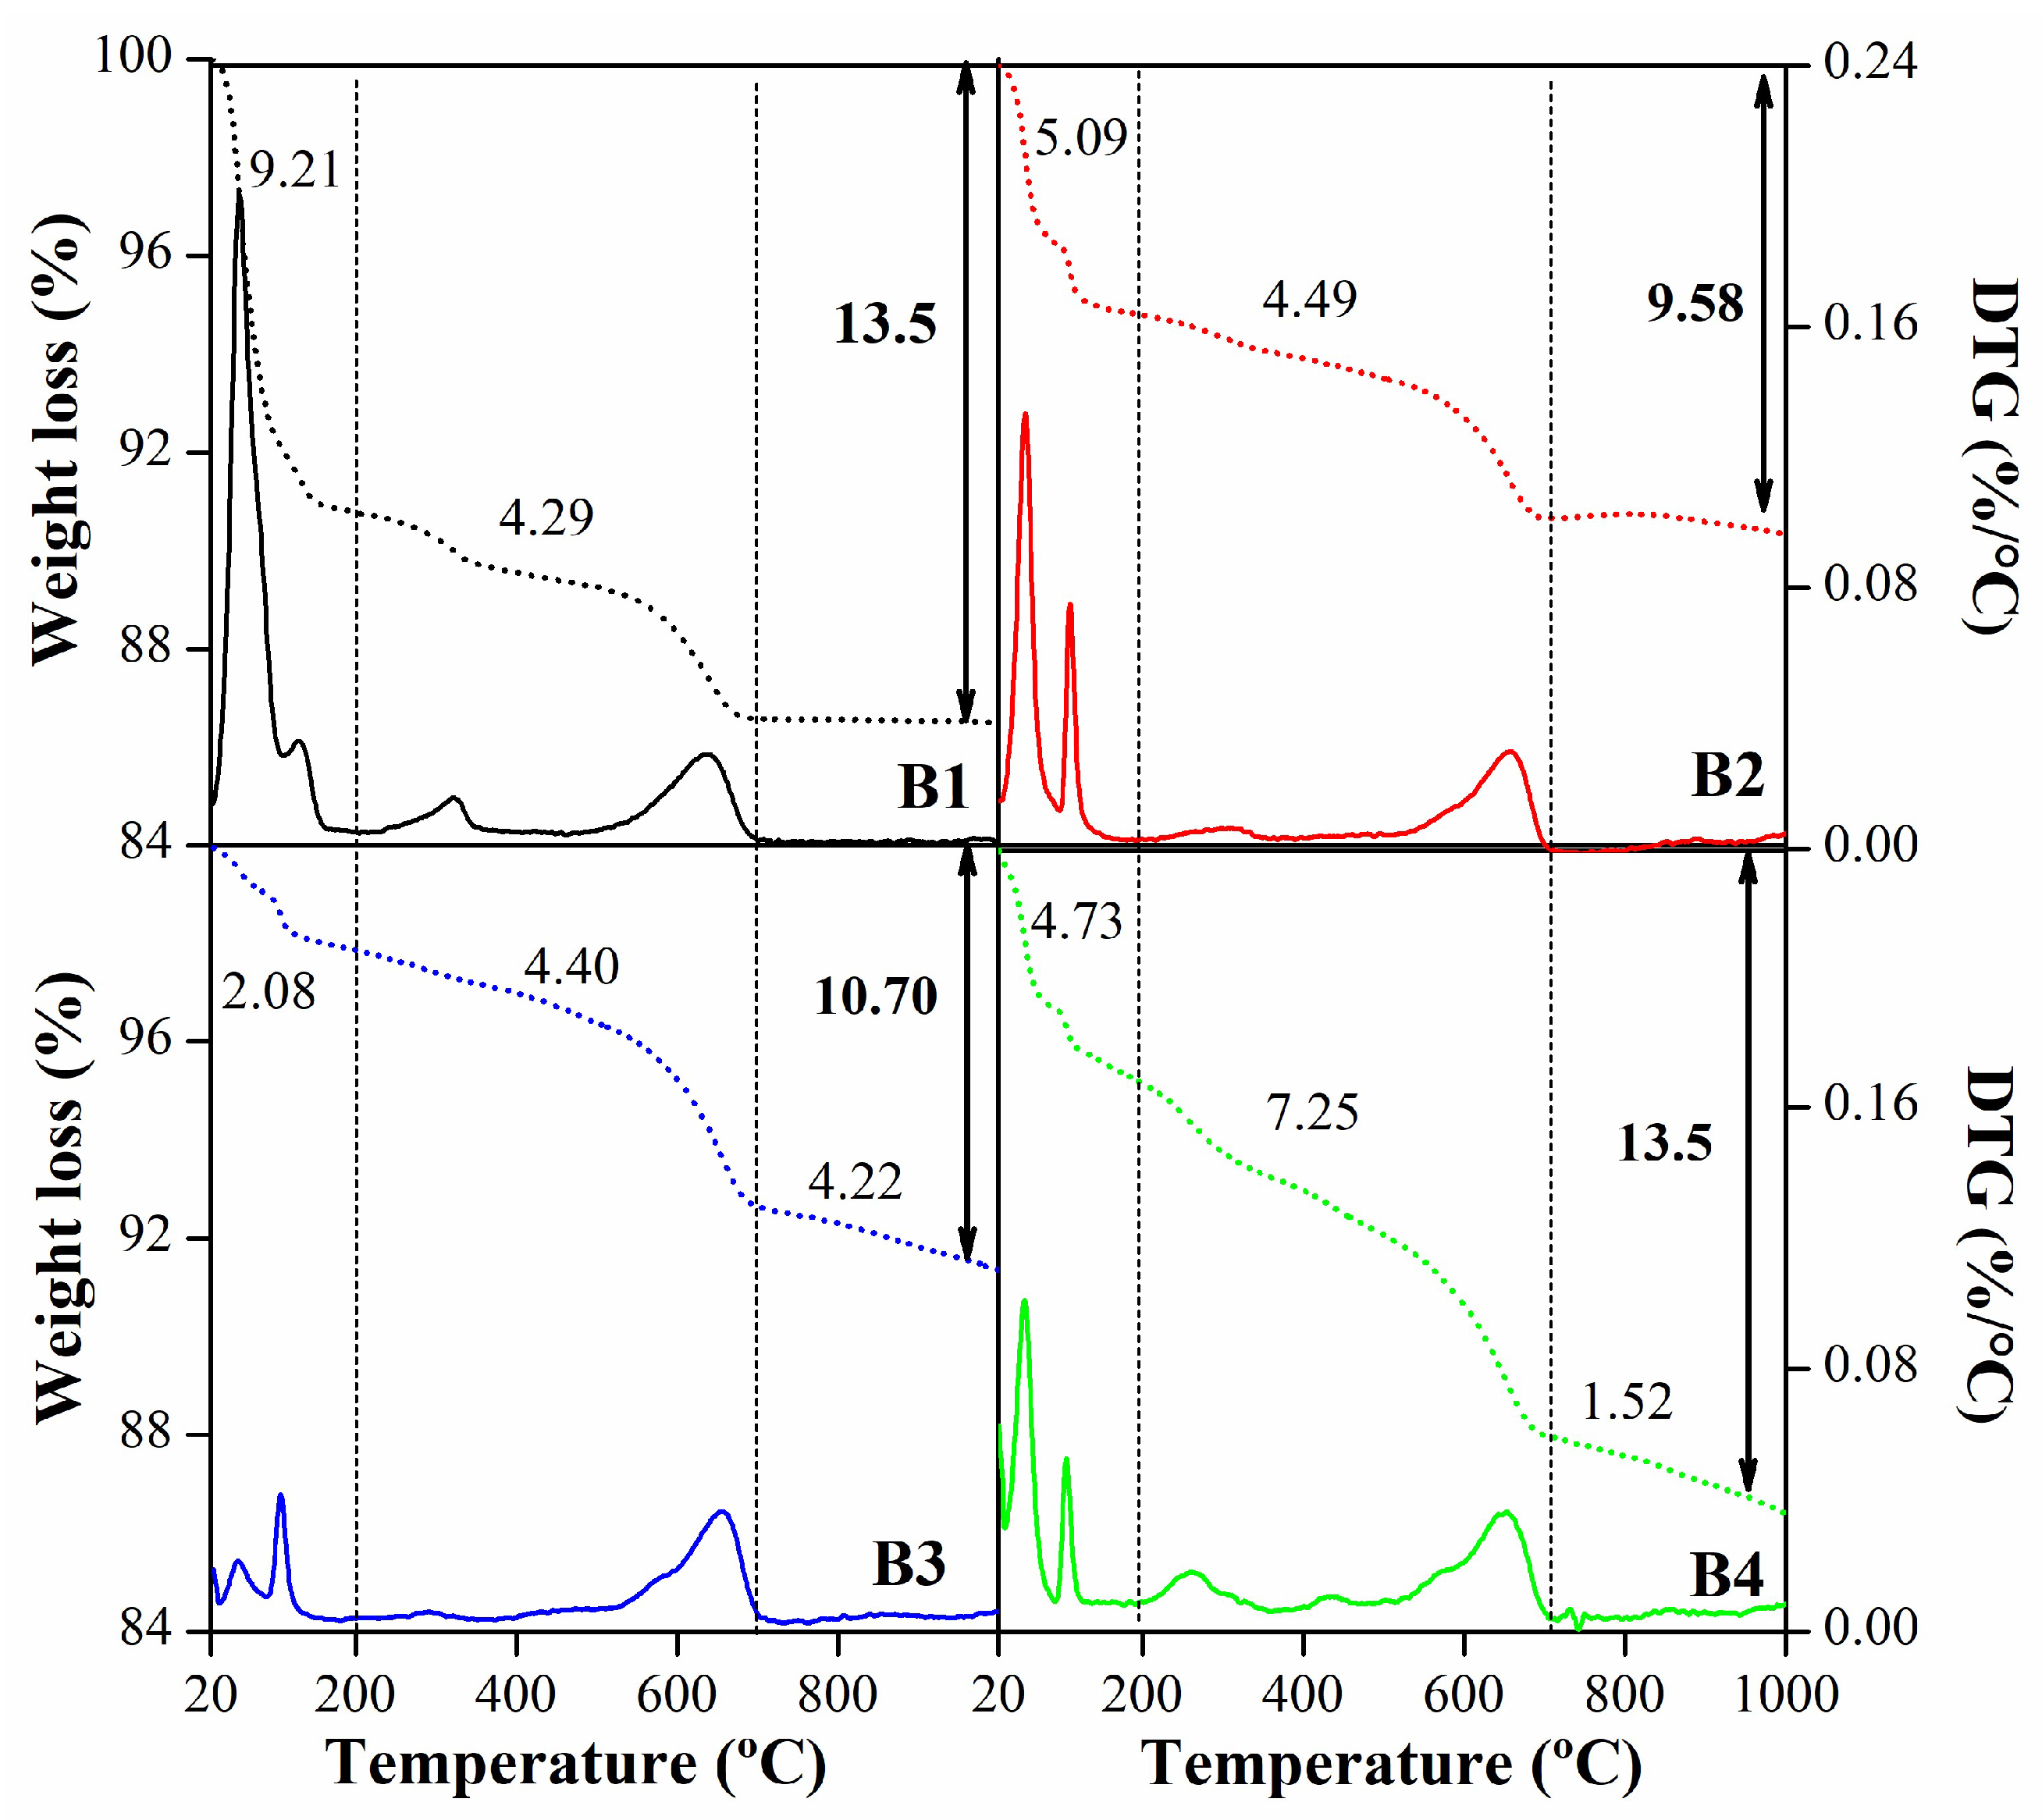
Figure 6.
Percentage of divalent and monovalent cations in samples B1 (NG) and B3 (AF).
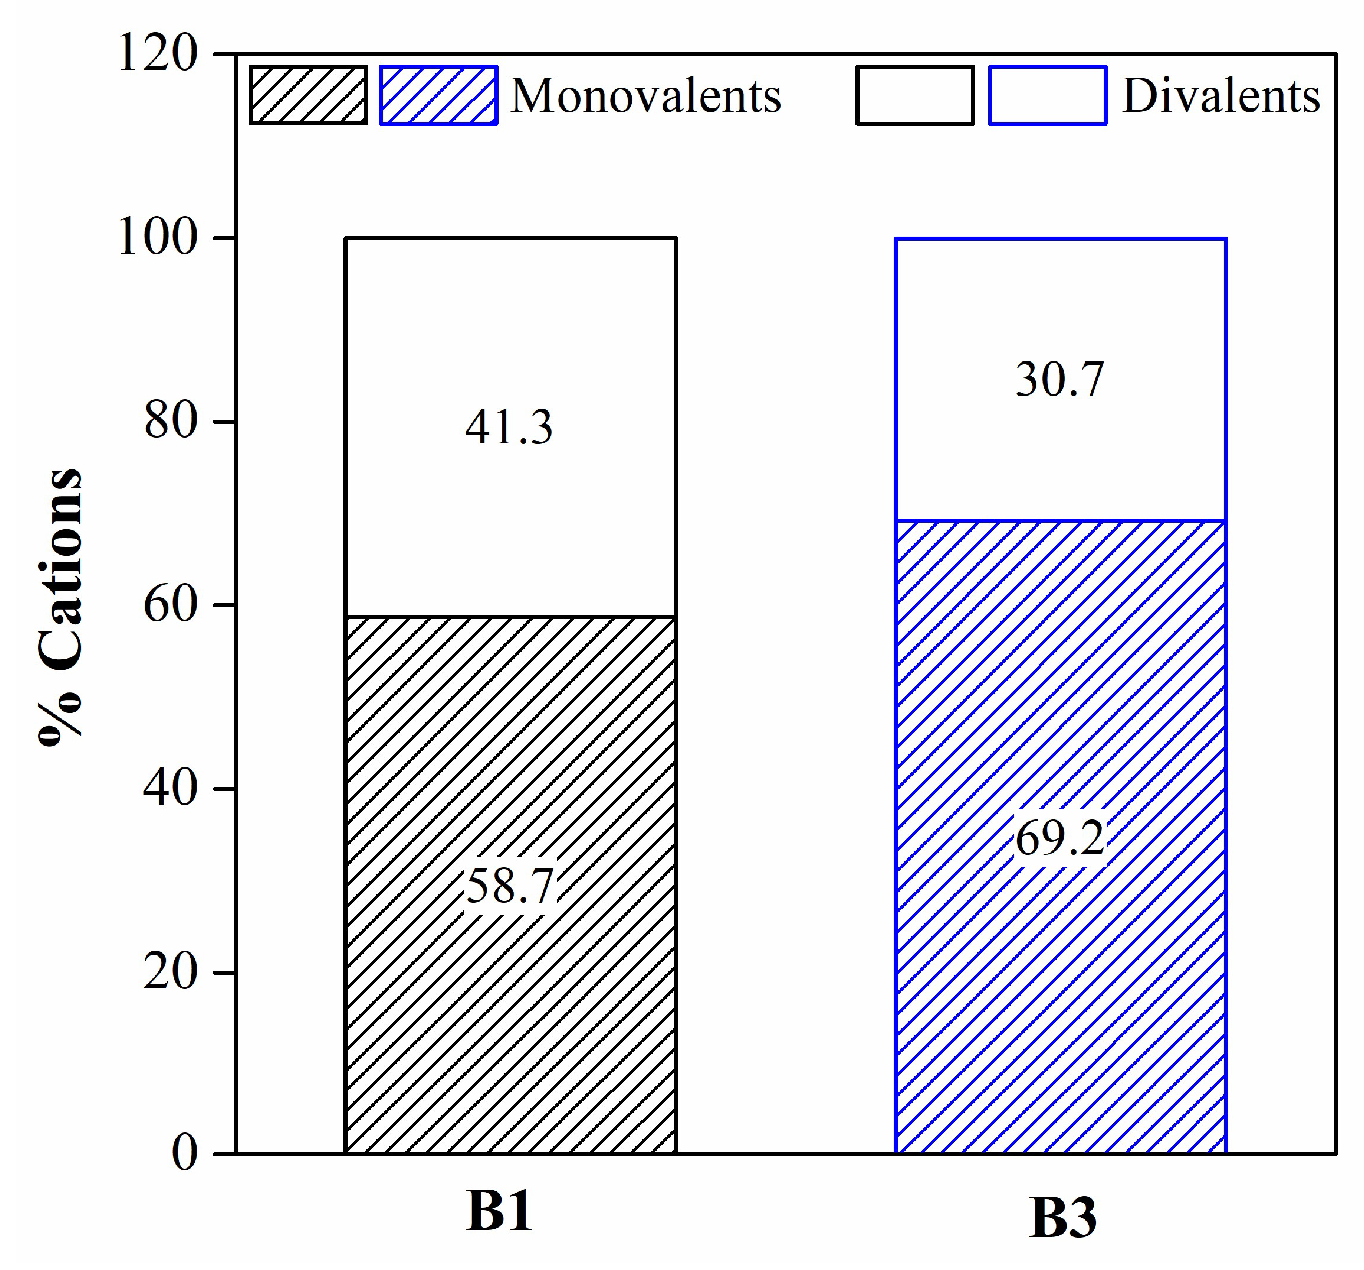
Figure 7.
A. Cumulative percentage. B. Particle size distribution for bentonites.
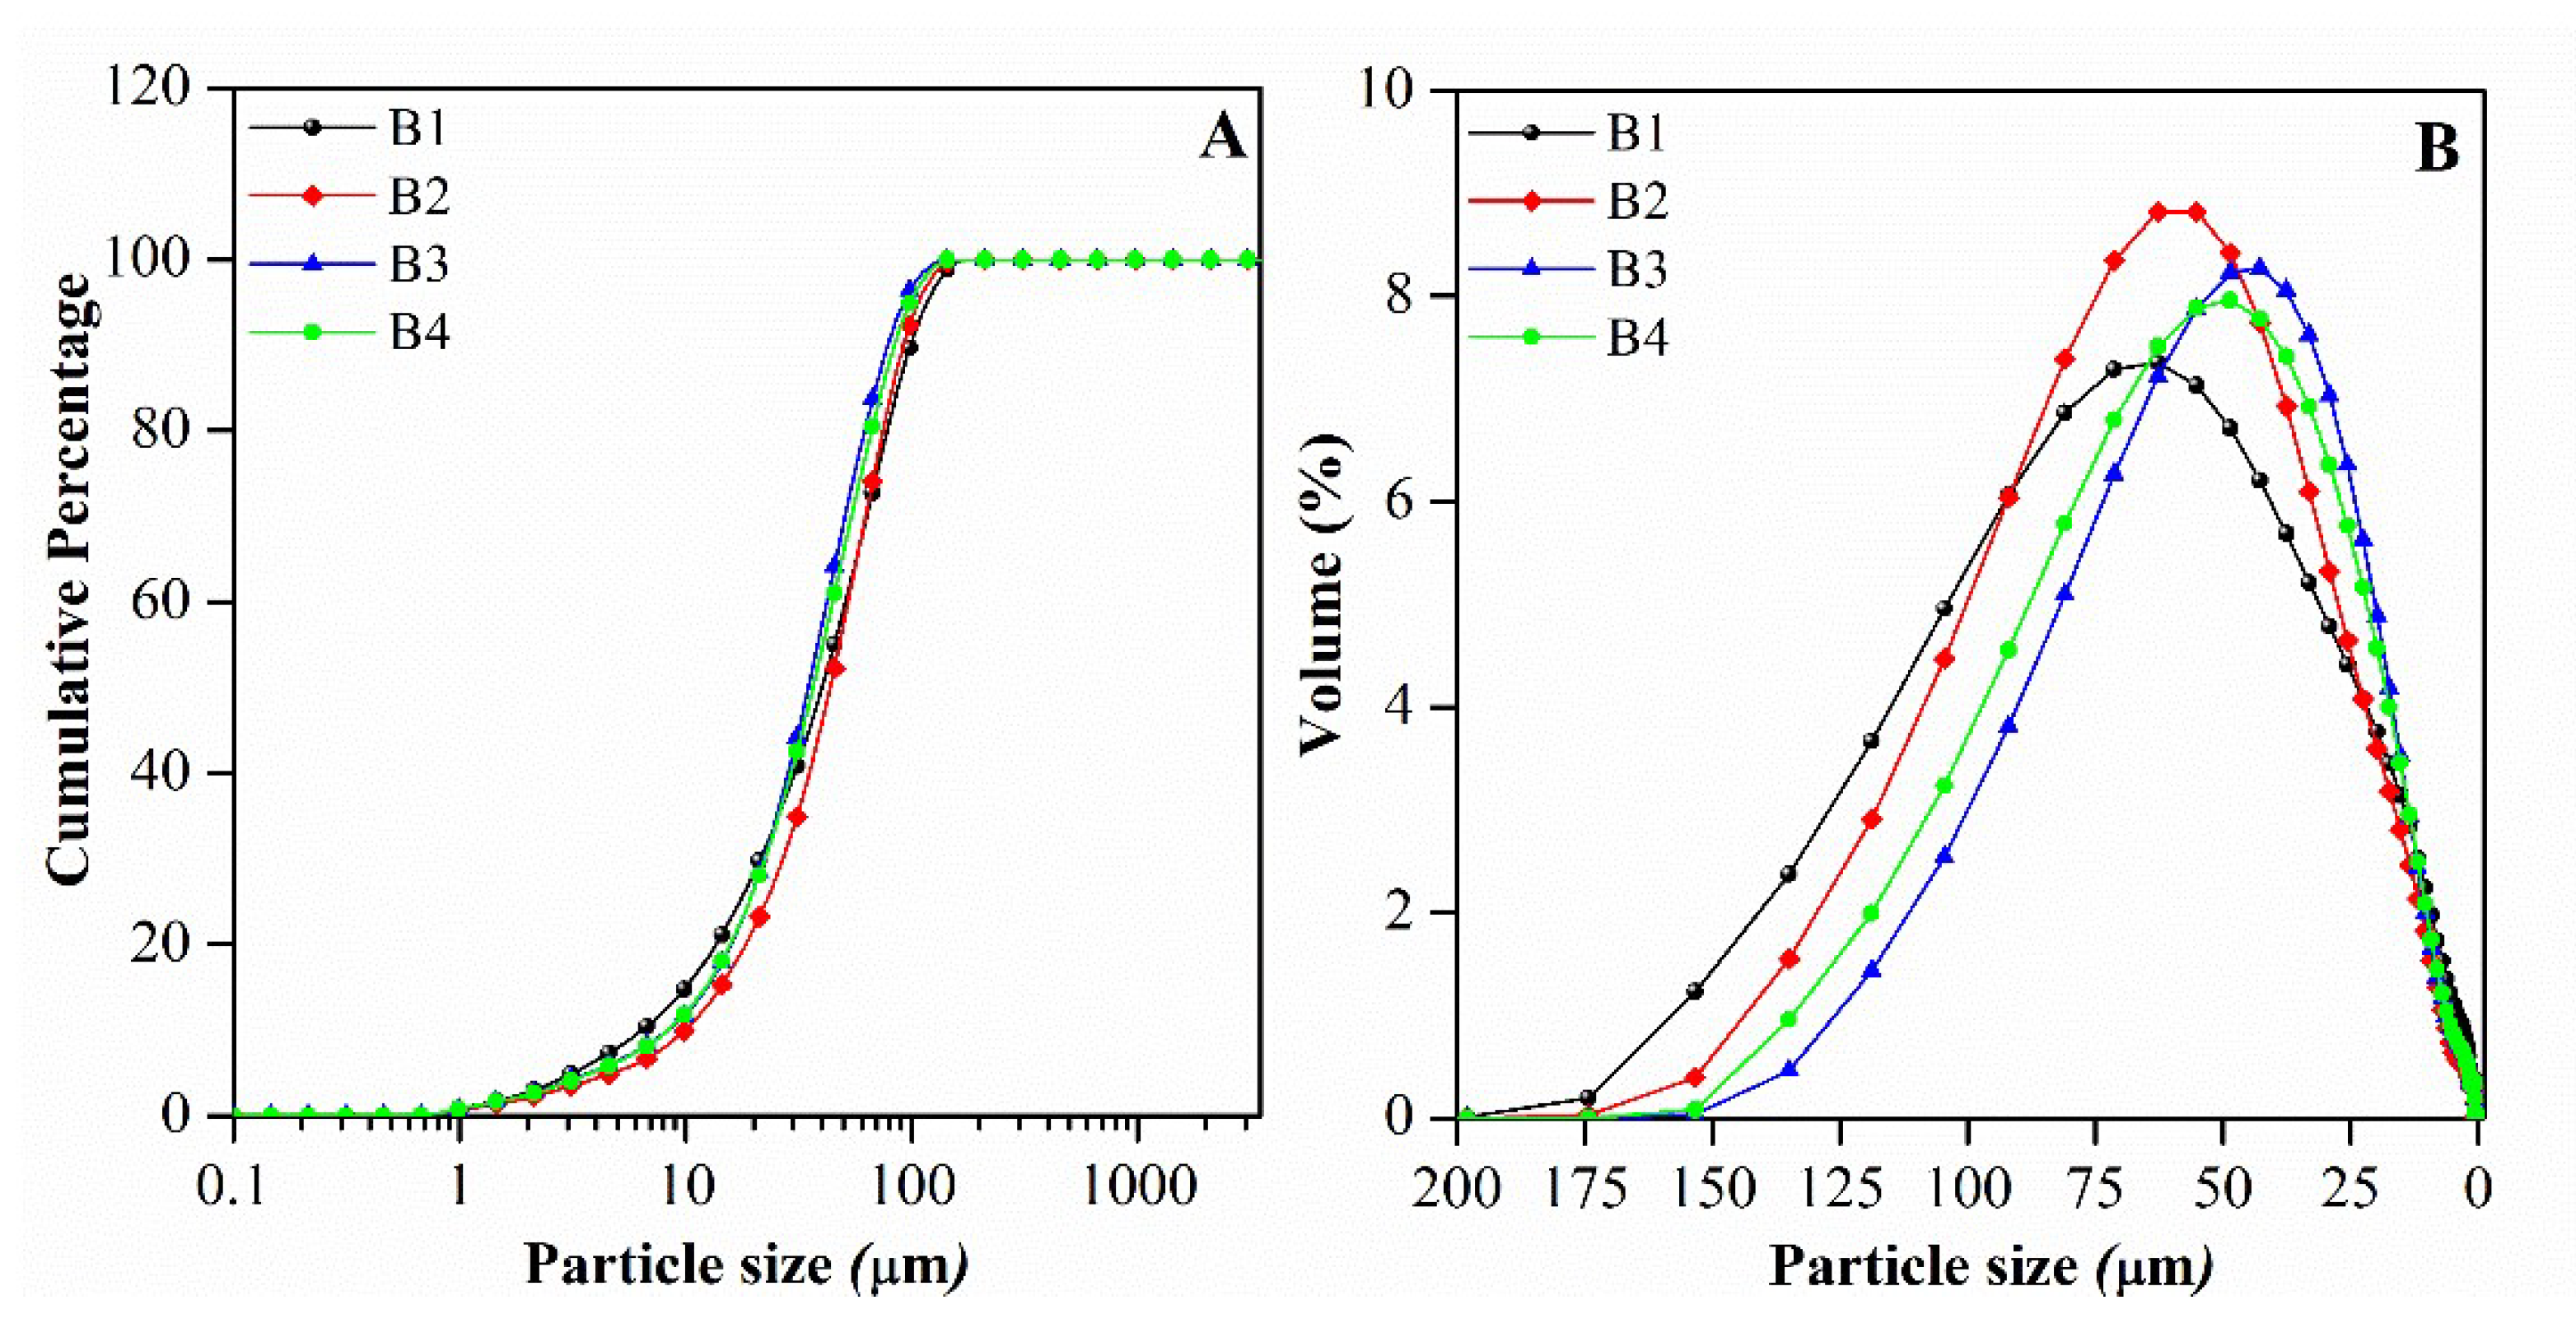
Figure 8.
Adsorption of ACy on four bentonites.
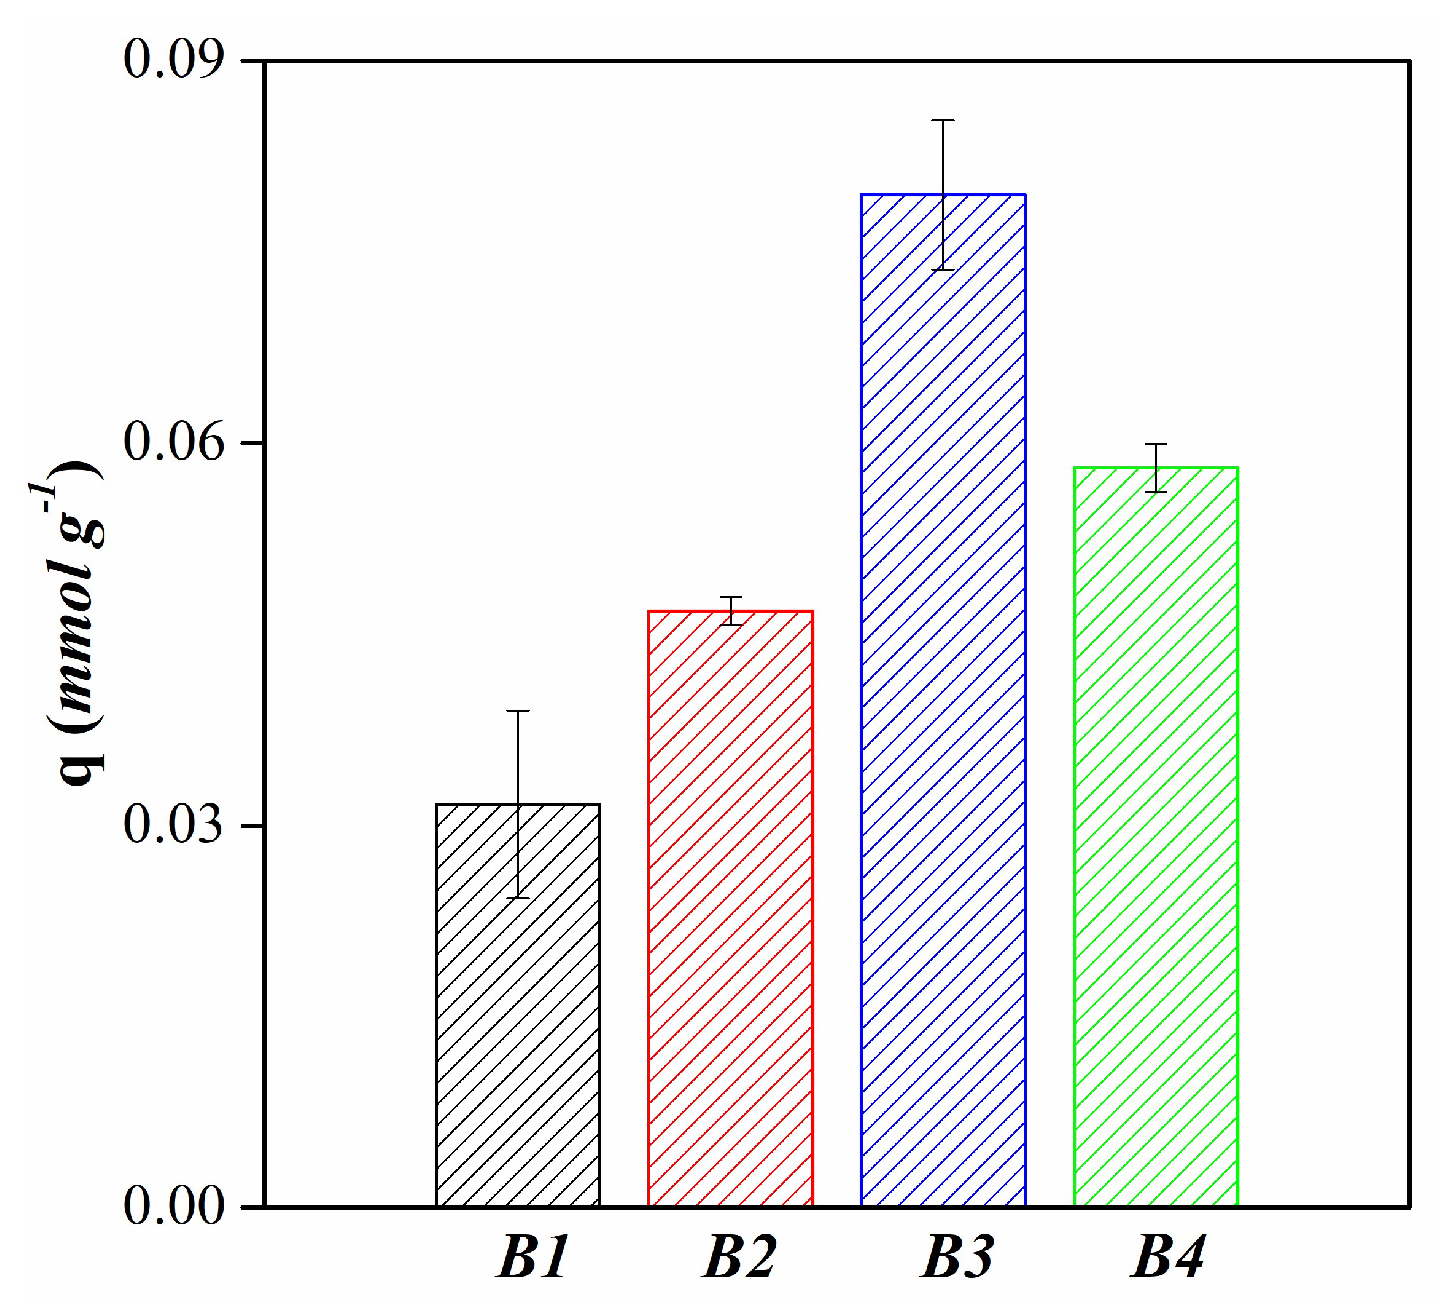
Figure 9.
Adsorption of ACy on B3 vs pH media.
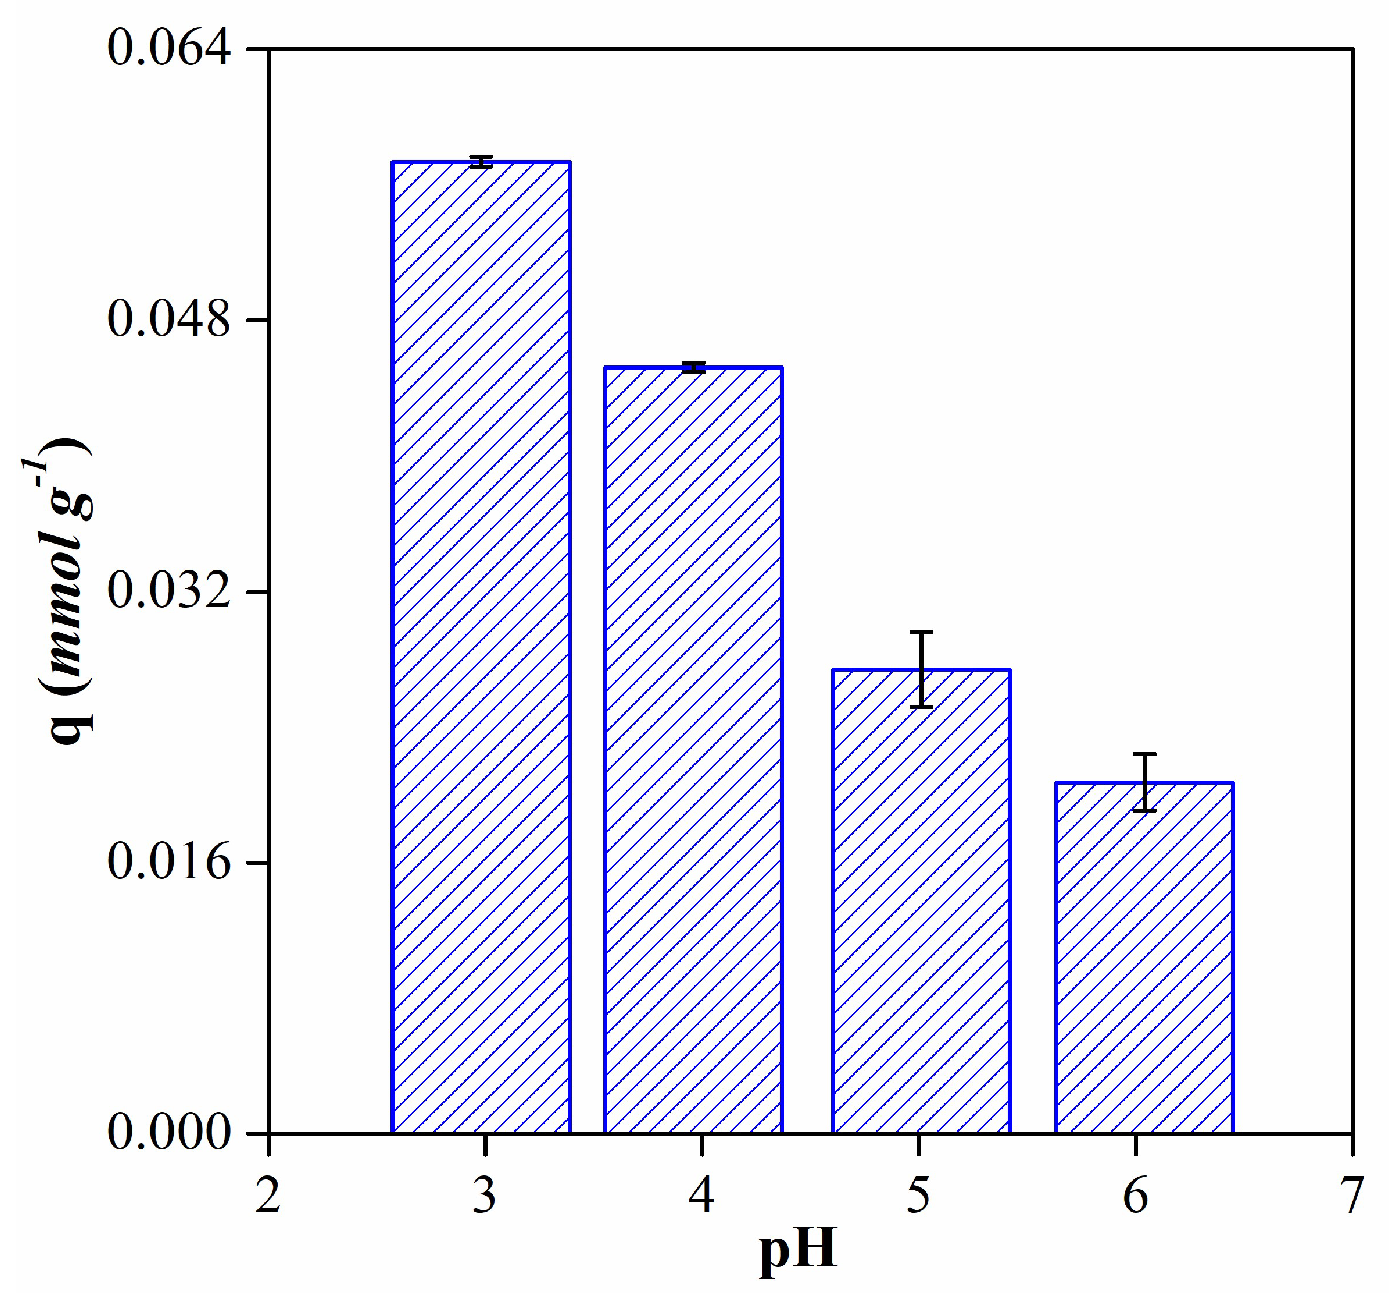
Figure 10.
Kinetic adsorption data for ACy on B1 and B3 and their best adjustments.
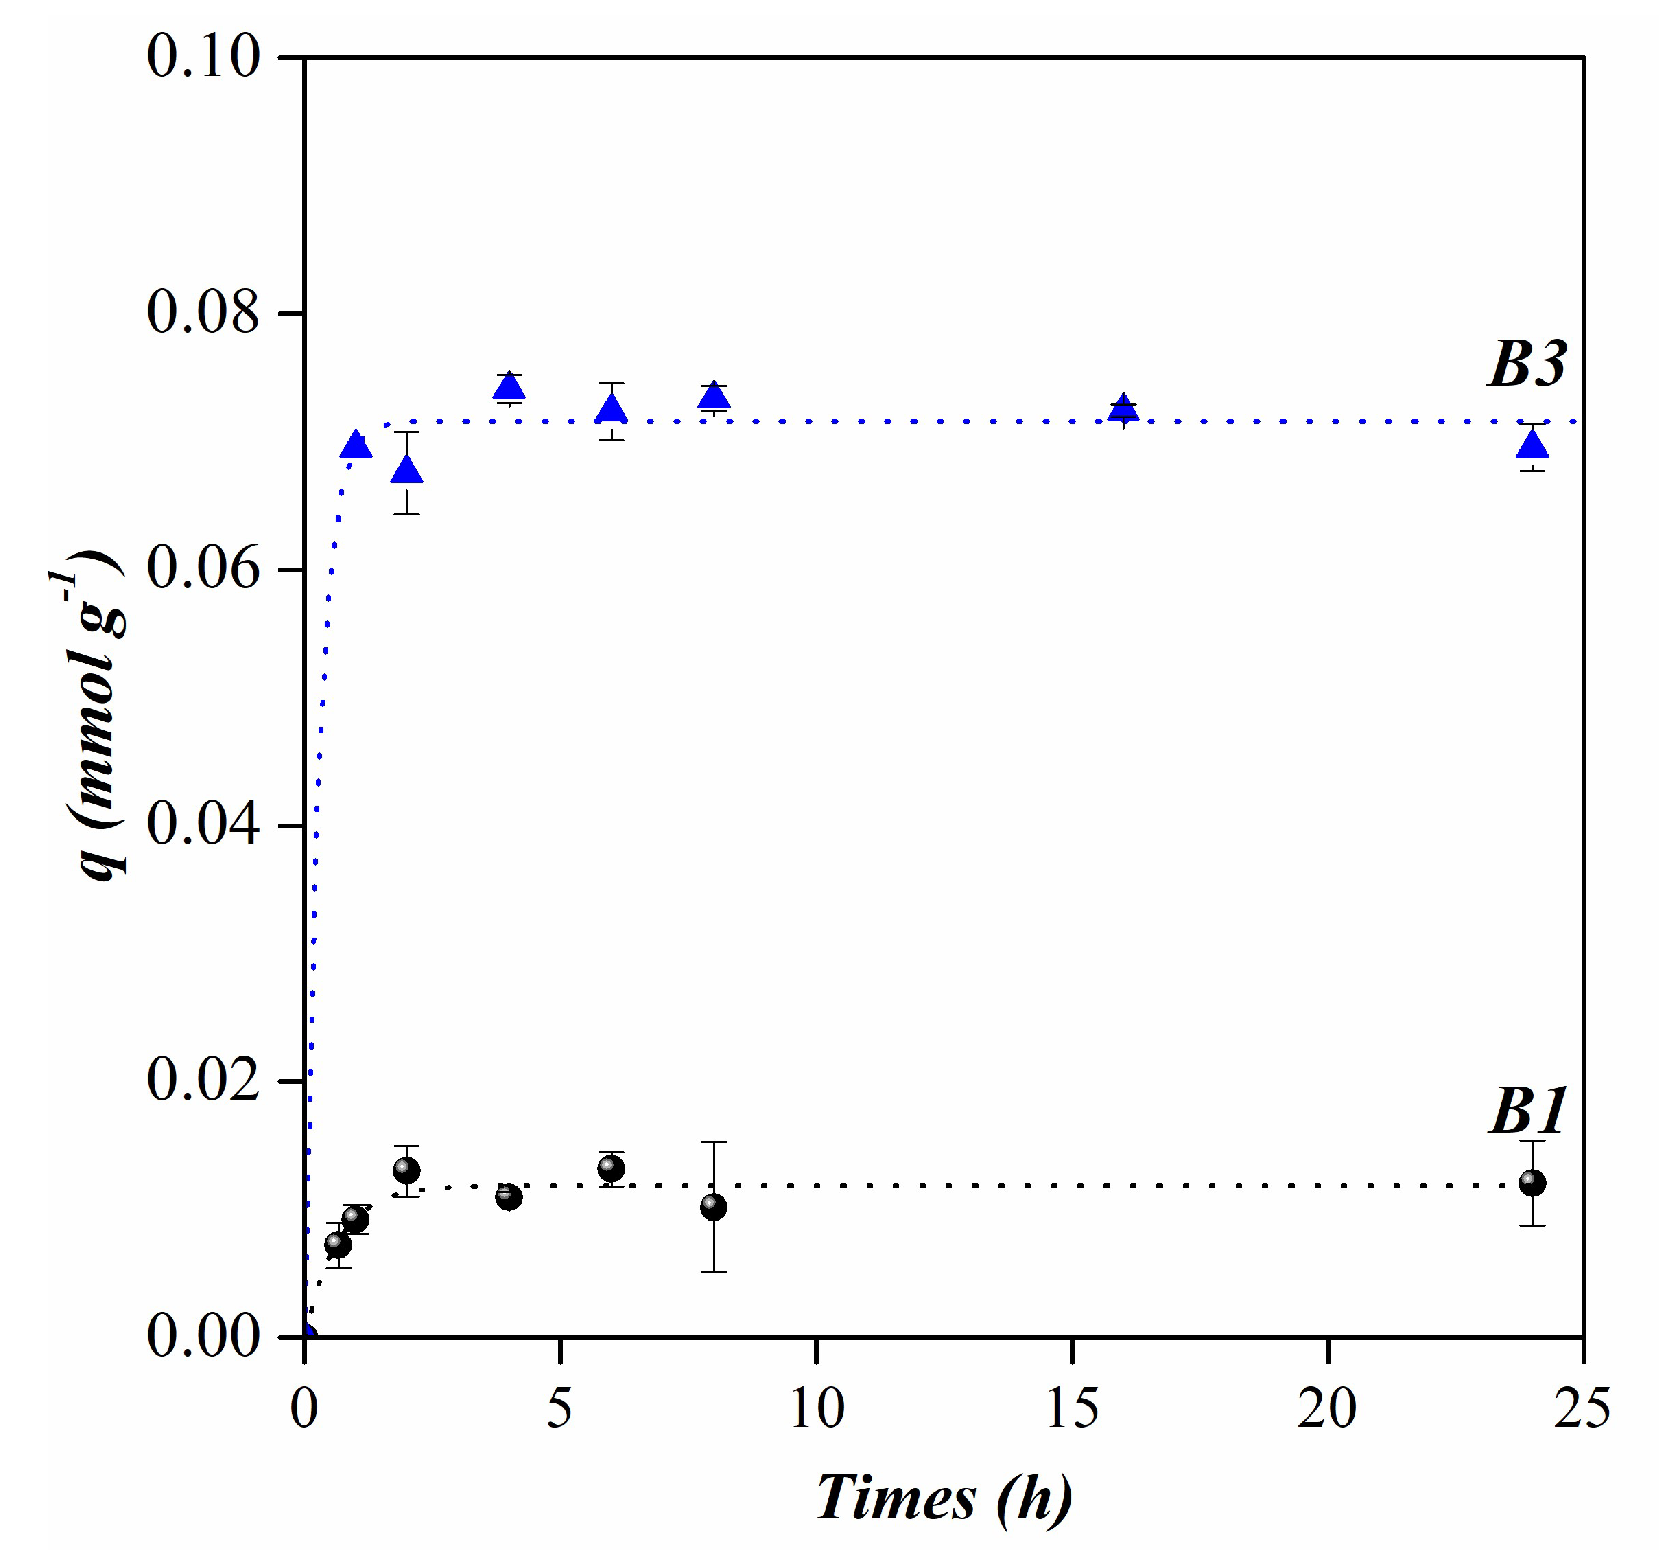
Figure 11.
Experimental isotherms (symbols) and their best adjustments for the equilibrium adsorption data of ACy on four bentonites at pH 3 and 20 °C.
Figure 11.
Experimental isotherms (symbols) and their best adjustments for the equilibrium adsorption data of ACy on four bentonites at pH 3 and 20 °C.
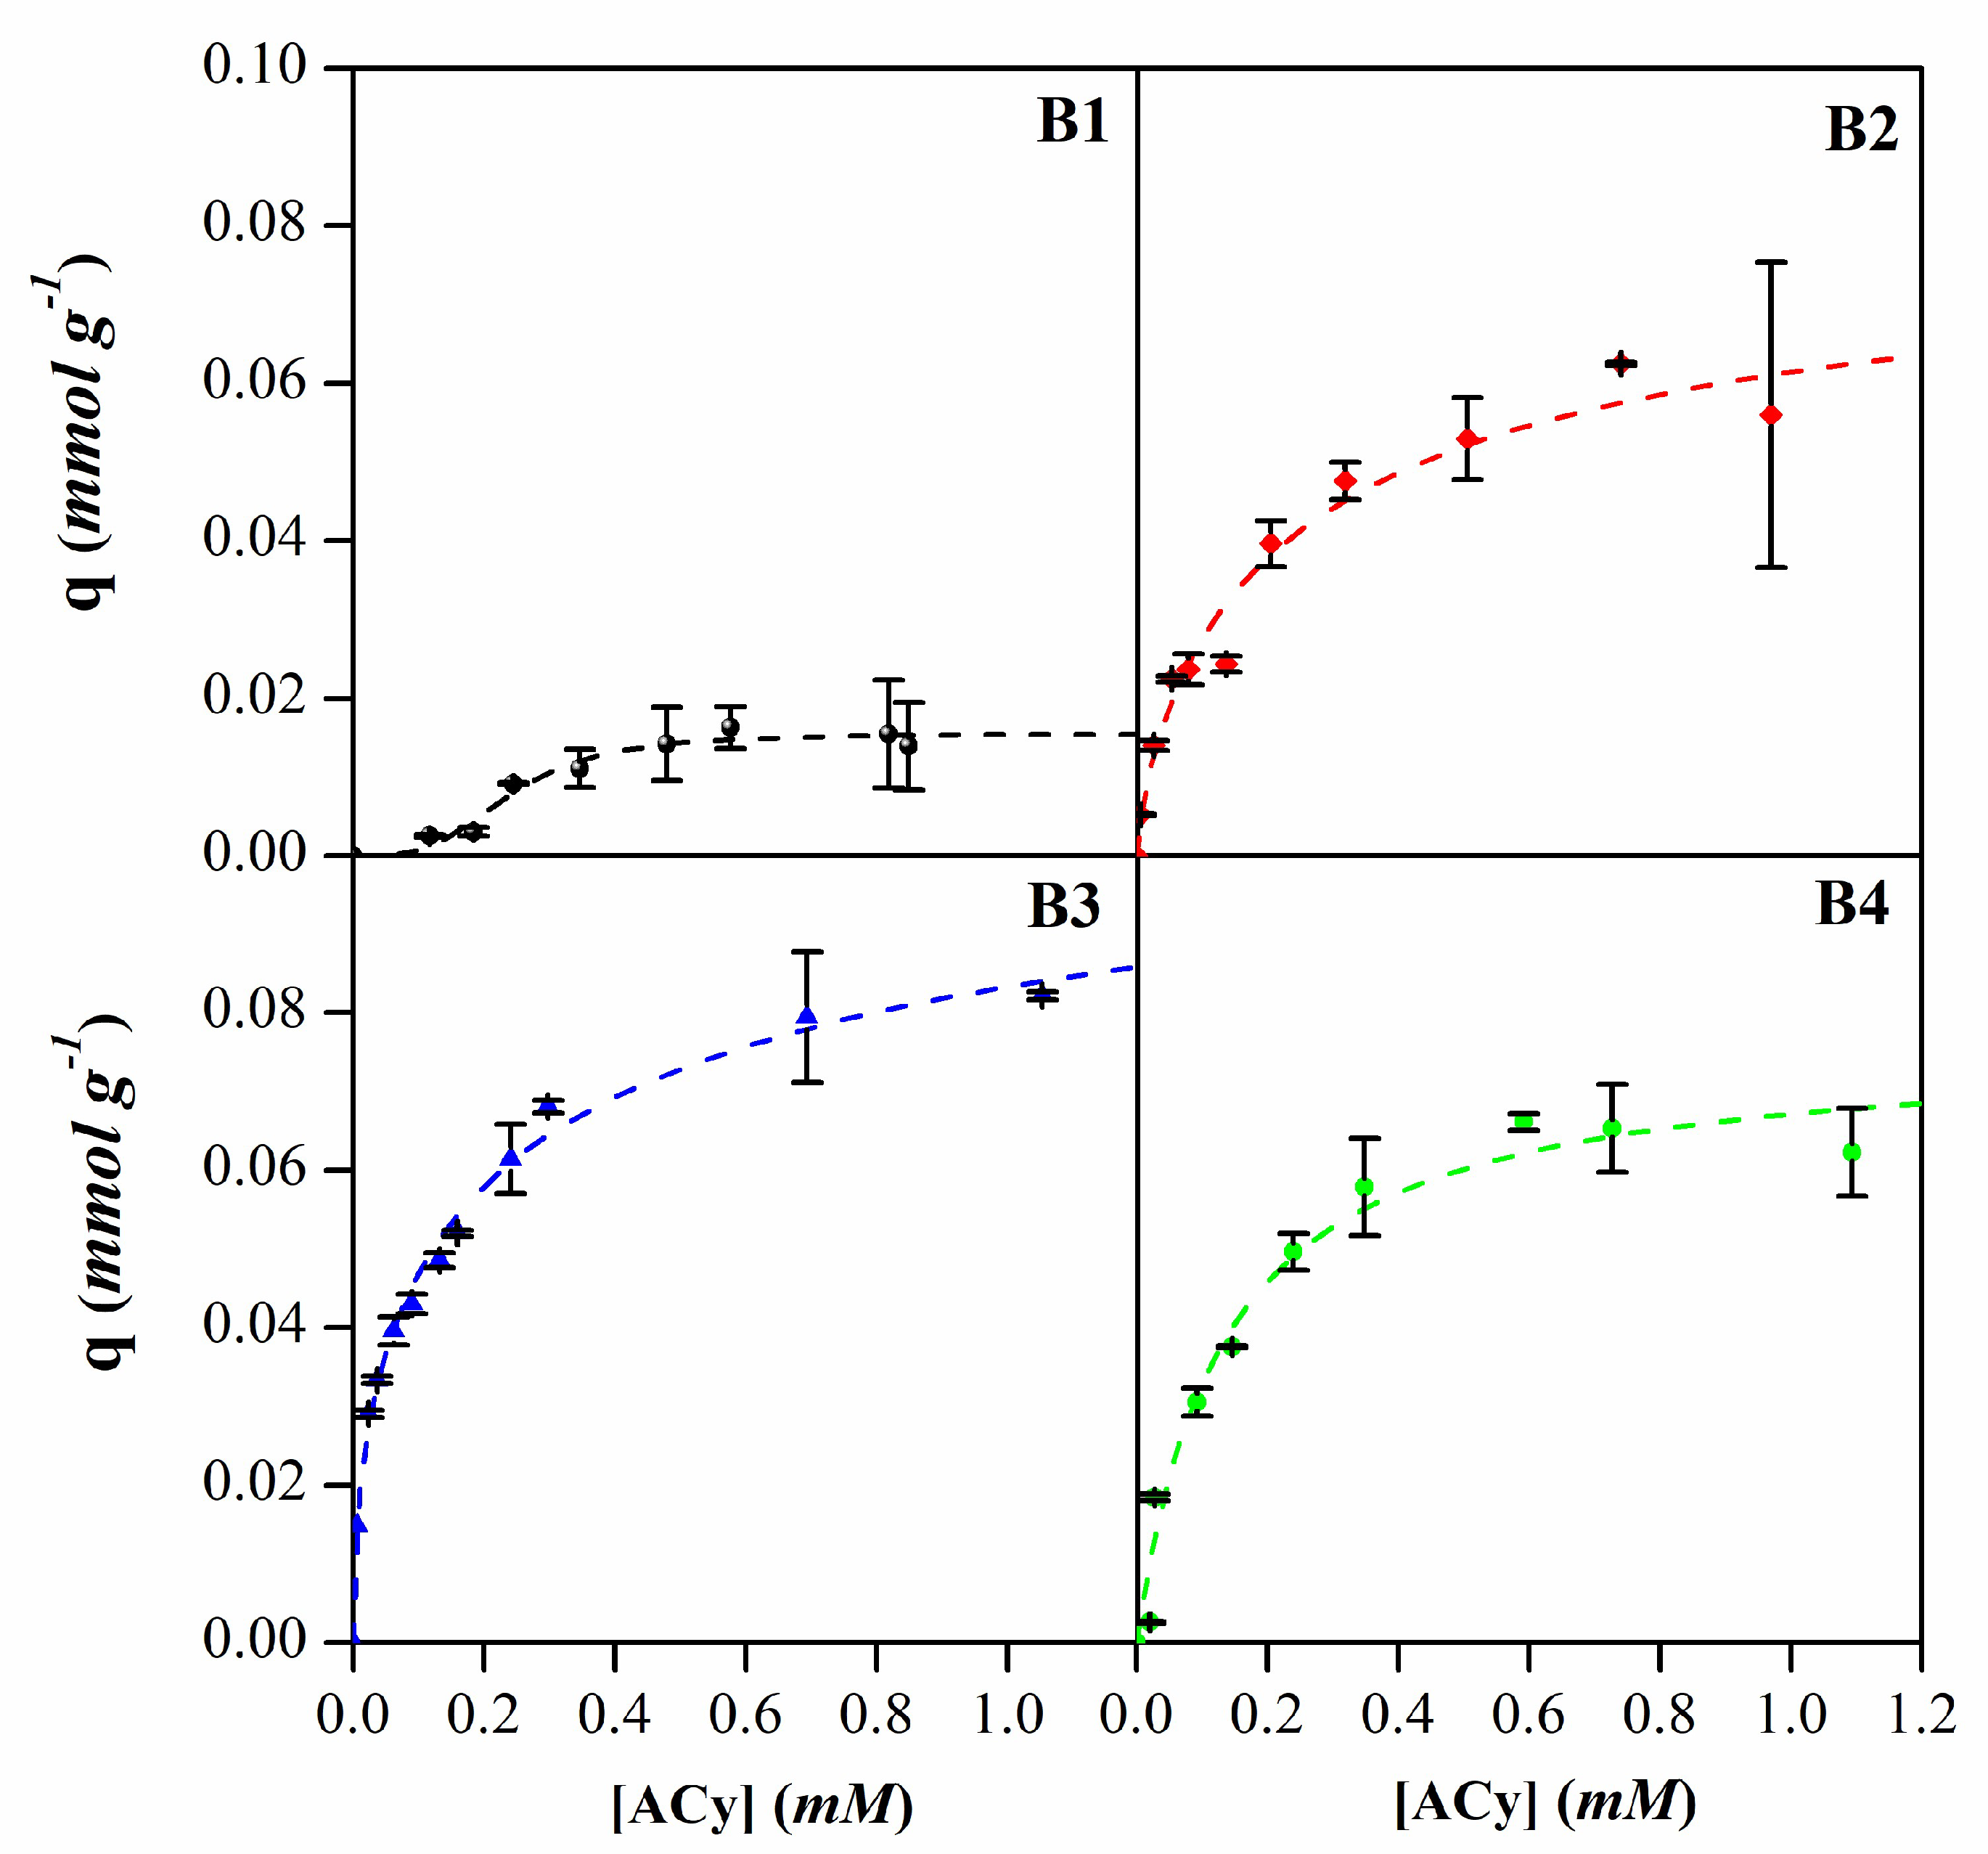
Figure 12.
ACy-Bentonites complex diffractograms and raw materials.
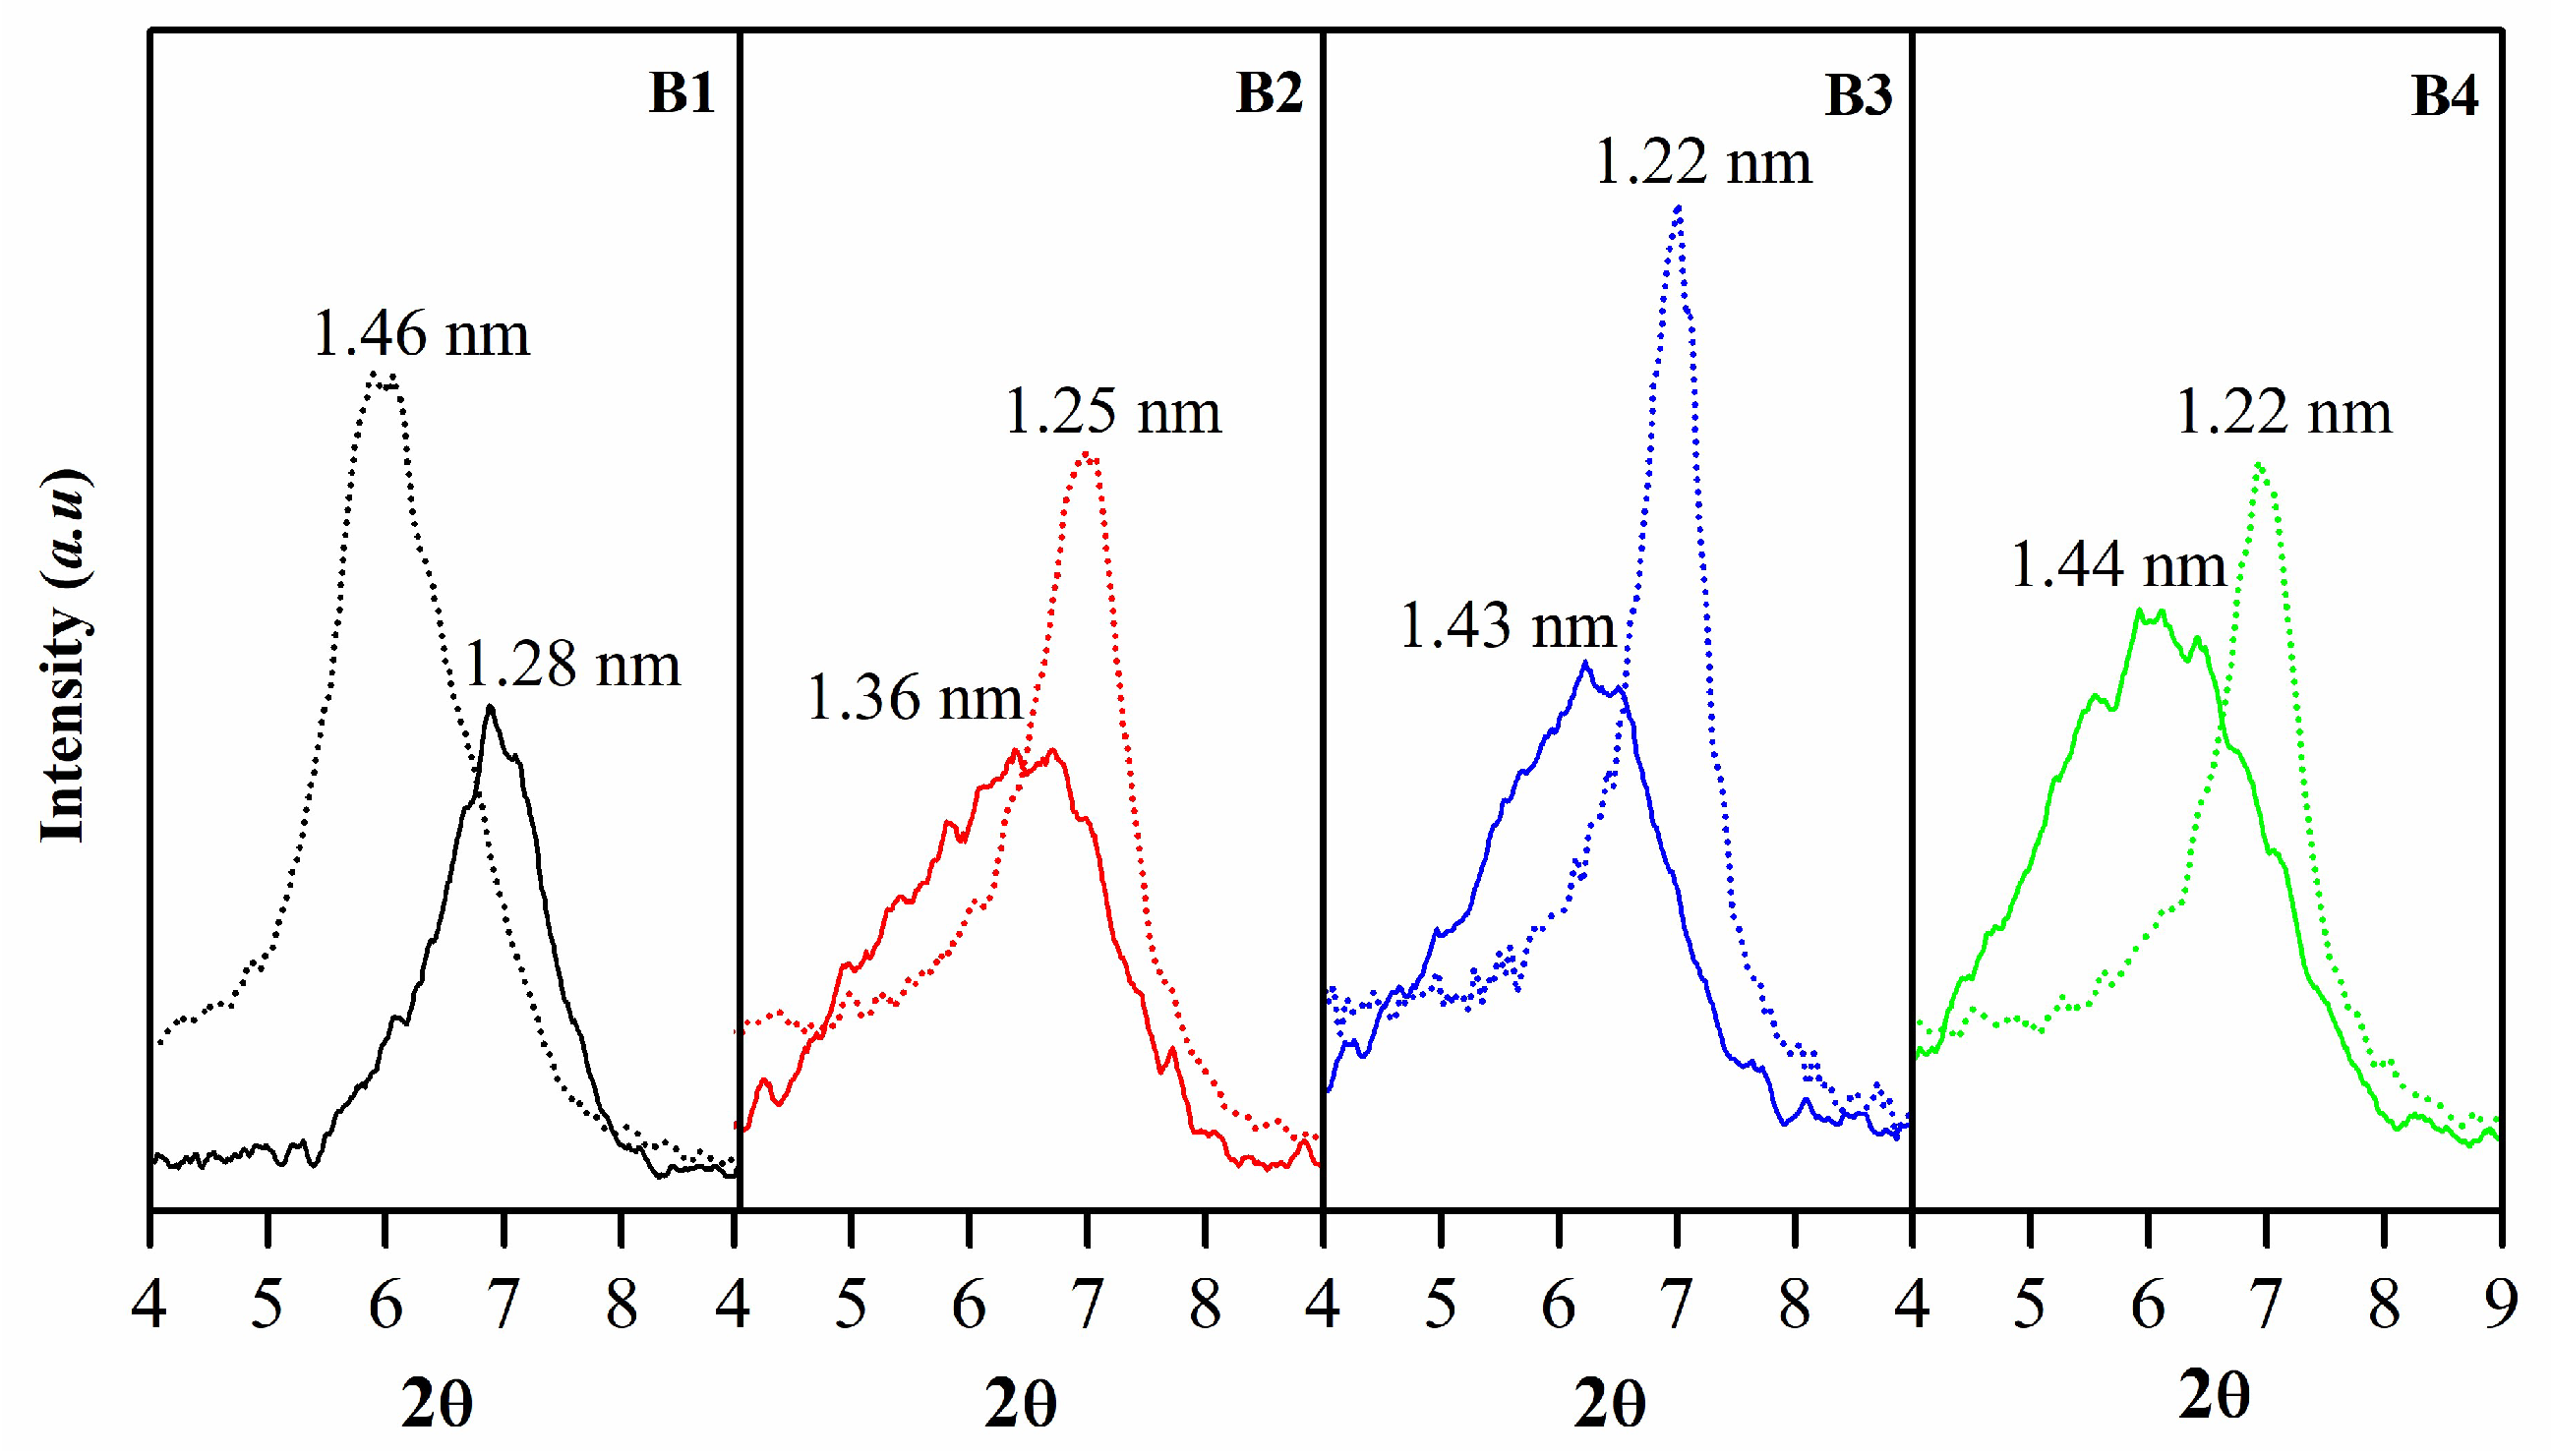
Figure 13.
Spatial representation and dimensions of the cyanidin-3-diglucoside-5-glucoside molecule.
Figure 13.
Spatial representation and dimensions of the cyanidin-3-diglucoside-5-glucoside molecule.
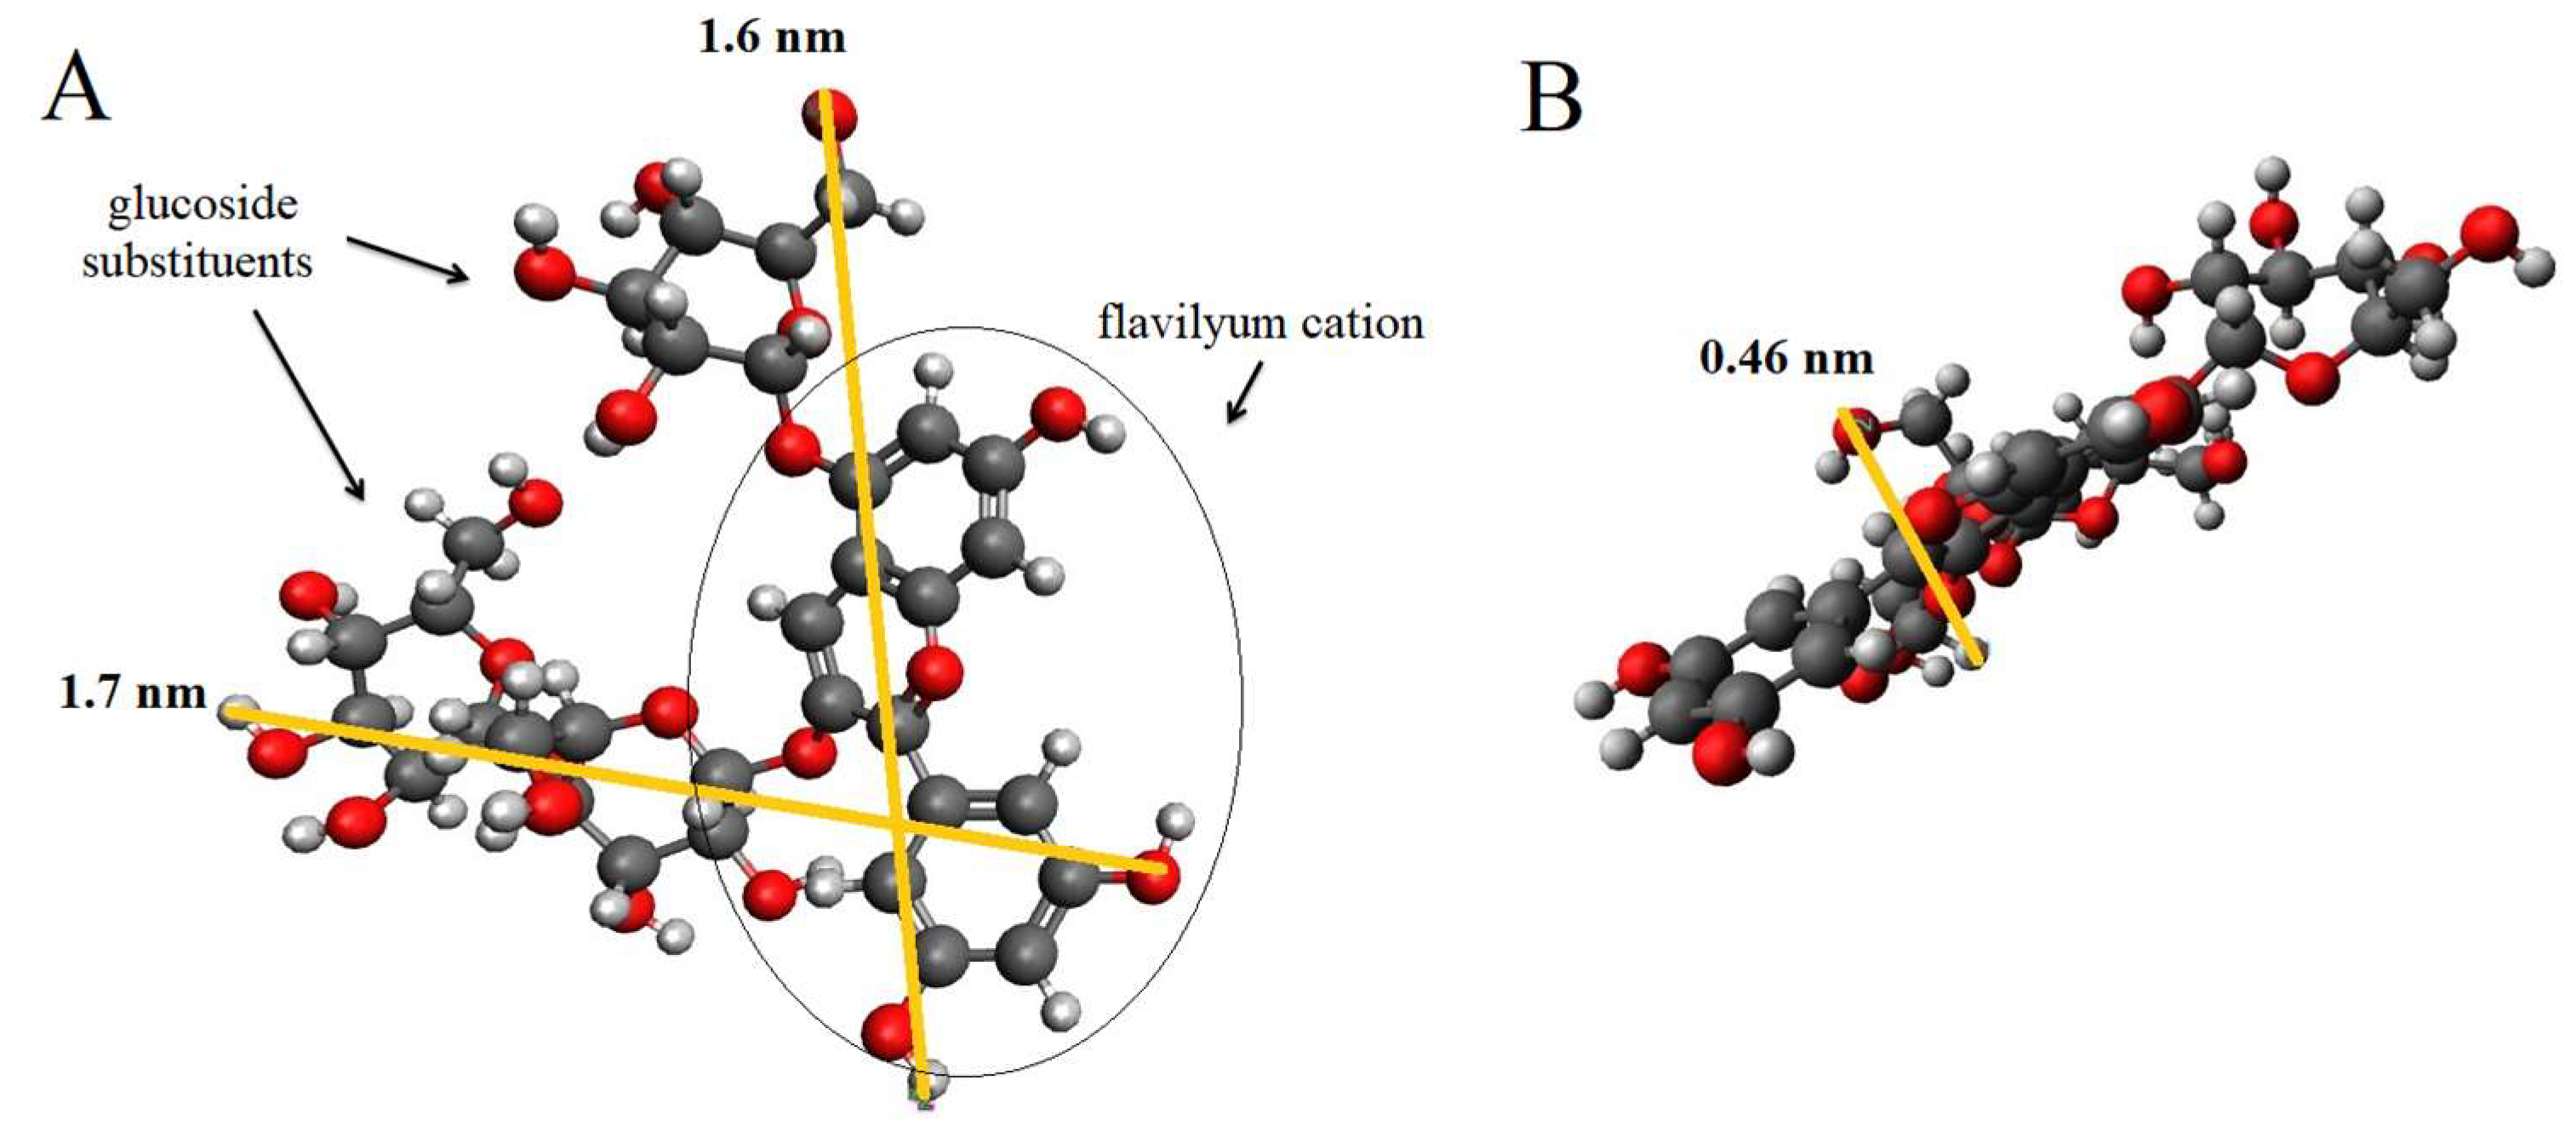
Figure 14.
FTIR spectra ACy-bentonites complex.
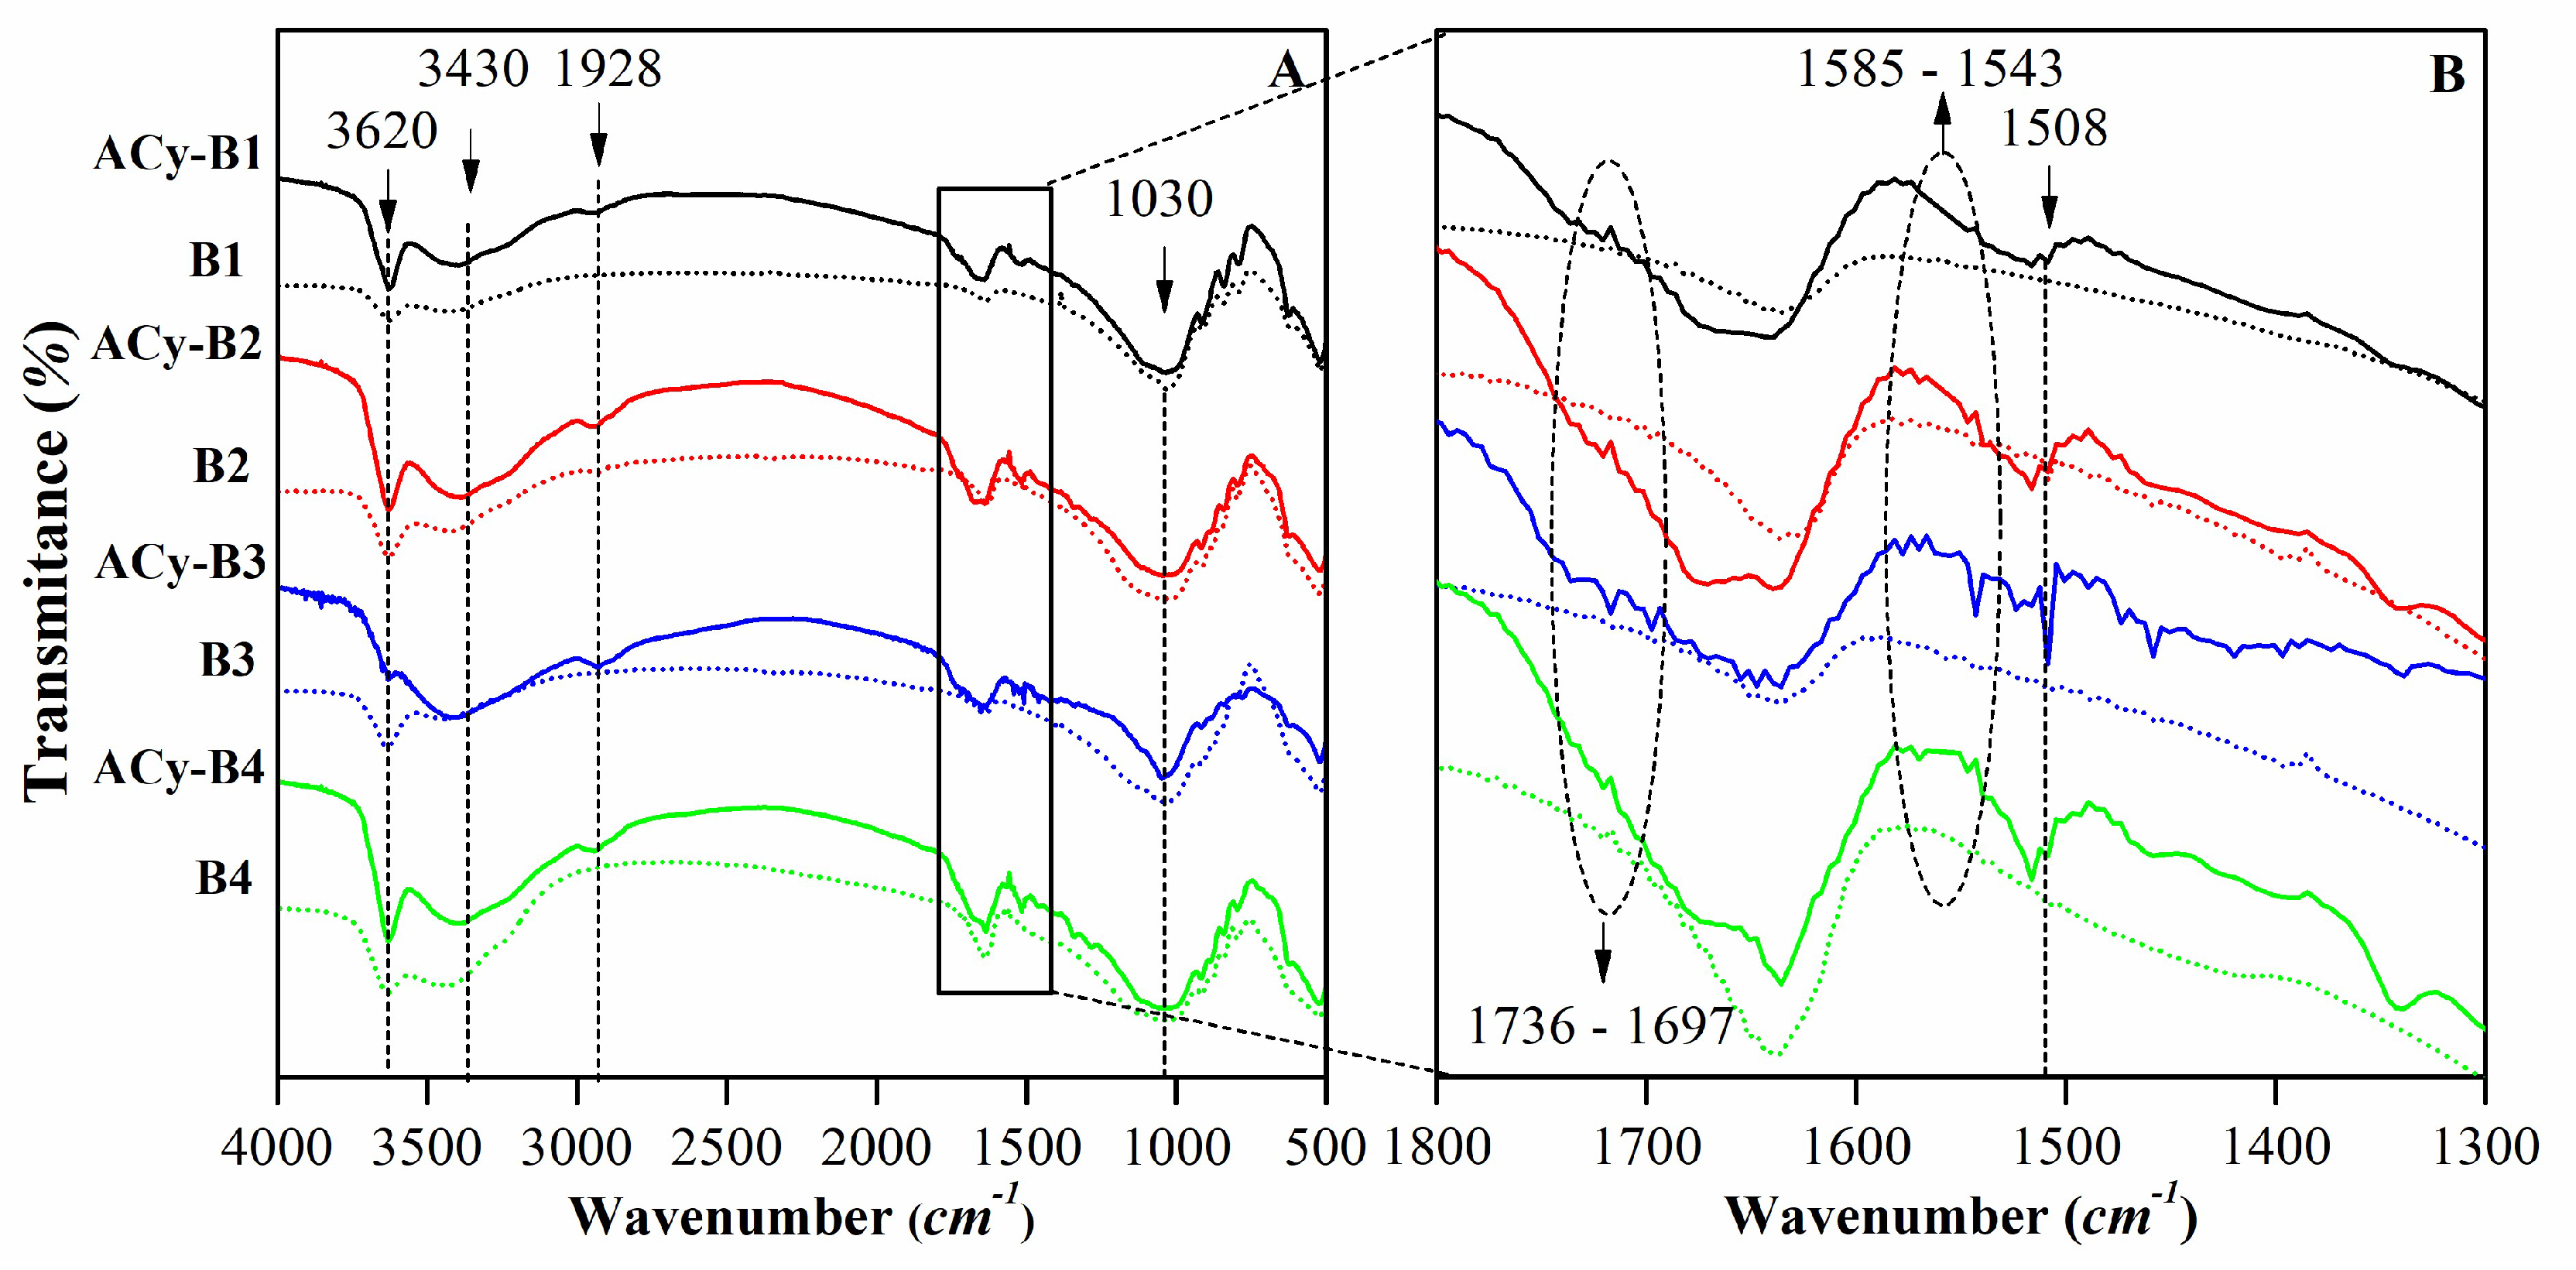
Figure 15.
Experimental isotherms (symbols) and their best equations adjustments for the equilibrium adsorption data of ACy on B3 at pH 3 and 4.5.
Figure 15.
Experimental isotherms (symbols) and their best equations adjustments for the equilibrium adsorption data of ACy on B3 at pH 3 and 4.5.
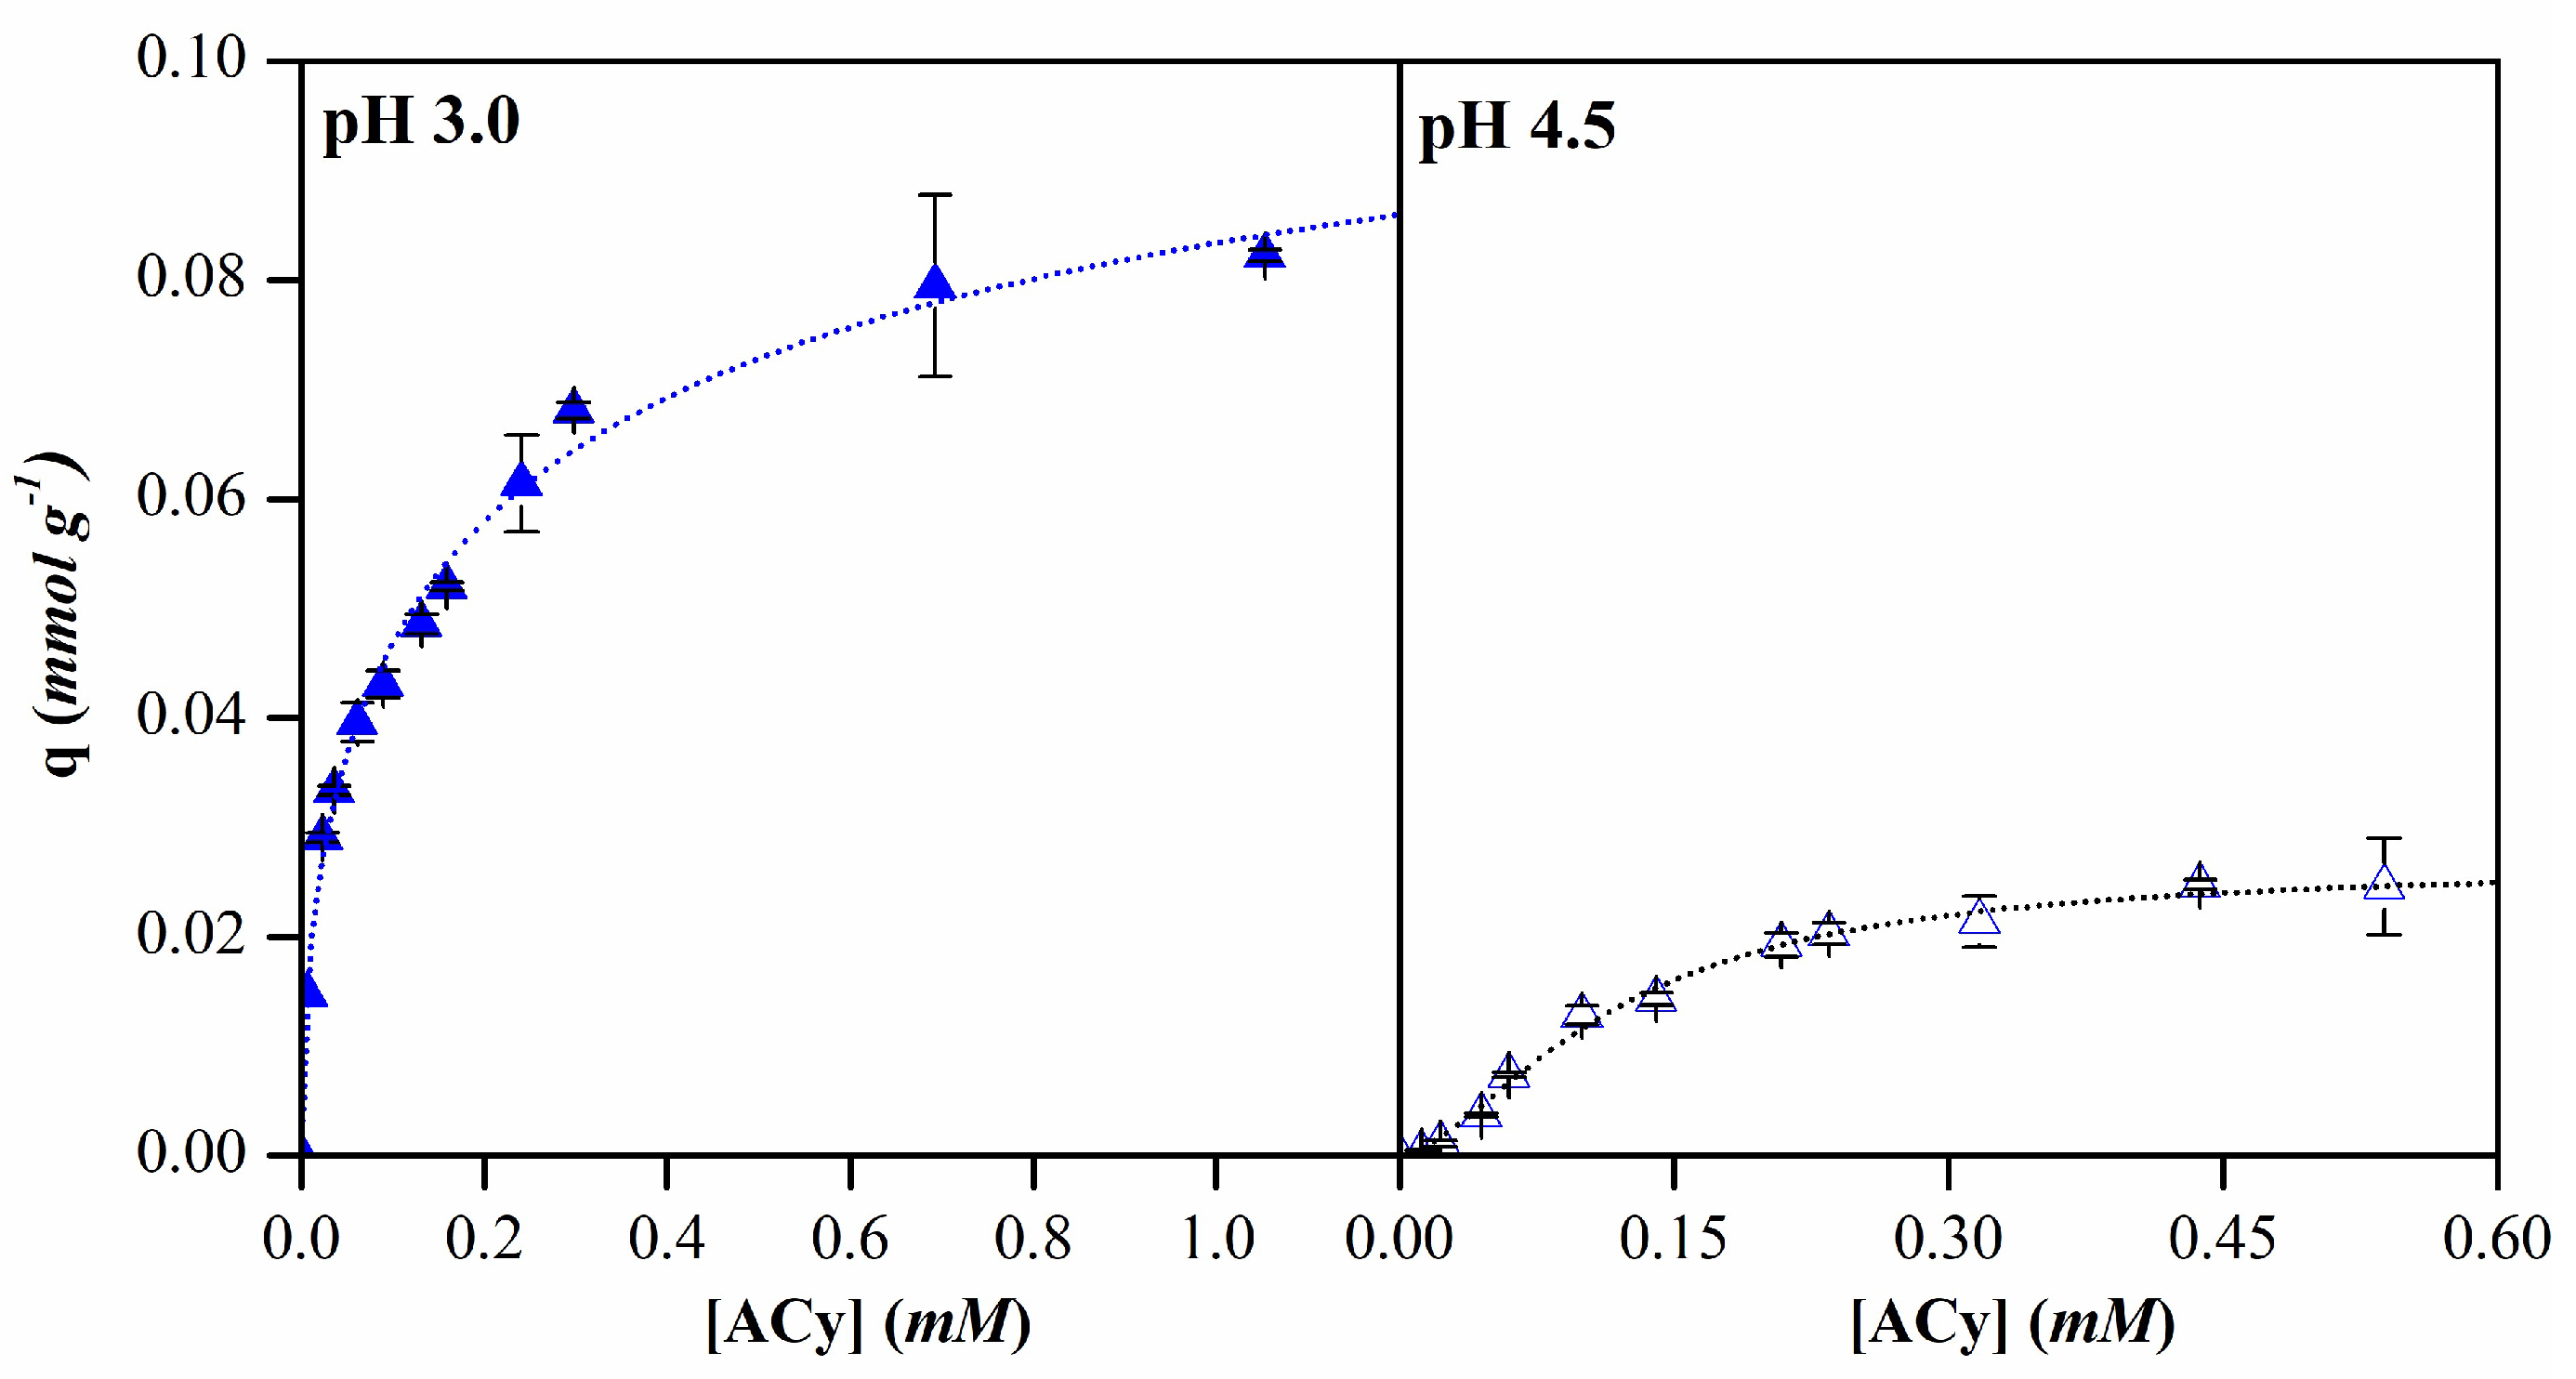

Table 1.
Bentonite mineralogy determined by XRD (% w/w), characteristic basal spaces (d001 and d060), FWHM values (◦2θ), crystallite sizes (Cr) (nm) and weight loss from TGA are also shown. (Tr<0.1%).
Table 1.
Bentonite mineralogy determined by XRD (% w/w), characteristic basal spaces (d001 and d060), FWHM values (◦2θ), crystallite sizes (Cr) (nm) and weight loss from TGA are also shown. (Tr<0.1%).
| Mineralogy (%w/w) | Basal d-spacing (nm) | Smectite crystallinity | Weight loss (%) | |||||||||||
|---|---|---|---|---|---|---|---|---|---|---|---|---|---|---|
| Sm | Gy | Qz | Try | F | d001 | d060 | FWHM | Cr | 20-200°C | 200-1000°C | Total | |||
| B1 | 88 | 0 | Tr. | 10 | 2 | 1.456 | 0.1498 | 0.47 | 18 | 9.21 | 4.20 | 13.42 | ||
| B2 | 94 | 4 | 2 | 0 | Tr. | 1.247 | 0.1499 | 0.40 | 20 | 5.01 | 4.50 | 9.51 | ||
| B3 | 95 | 2 | 2 | 0 | 1 | 1.224 | 0.1498 | 0.49 | 17 | 1.97 | 6.31 | 8.28 | ||
| B4 | 95 | 2 | 3 | 0 | Tr. | 1.224 | 0.1498 | 0.44 | 18 | 4.19 | 9.00 | 13.20 | ||
*Sm: Smectite, Gy: Gypsum, Qz: Quartz; Try: Trydimite, F: feldespars.
Table 2.
Chemical composition (% w/w of each major element oxide) and structural formulae of samples.
Table 2.
Chemical composition (% w/w of each major element oxide) and structural formulae of samples.
| % Sample |
SiO2 | Al2O3 | Fe2O3 | MnO | MgO | CaO | Na2O | K2O | TiO2 | P2O5 | LOI |
|---|---|---|---|---|---|---|---|---|---|---|---|
| B1 | 58.49 | 14.58 | 1.09 | 0.031 | 4.19 | 1.09 | 1.28 | 0.26 | 0.158 | < 0.01 | 17.41 |
| B2 | 54.14 | 16.78 | 4.38 | 0.017 | 2.78 | 1.79 | 2.21 | 0.36 | 0.526 | 0.19 | 15.42 |
| B3 | 55.29 | 17.62 | 4.18 | 0.043 | 2.67 | 1.11 | 2.68 | 0.28 | 0.198 | 0.06 | 15.15 |
| B4 | 54.56 | 16.99 | 4.26 | 0.044 | 2.59 | 2.21 | 2.67 | 0.30 | 0.257 | 0.08 | 14.76 |
| B1 (Si8)IV(Al2.80Fe0.14Mg1.10Mn0.005Ti0.02)VIO20(OH)4,M+0.96 B2(Si7.92 Al0.08)IV(Al2.81Fe0.48Mg0.61Mn0.002Ti0.06)VIO20(OH)4 M+0.72 B3(Si7.93 Al0.07)IV(Al2.88Fe0.46Mg0.51Mn0.005Ti0.02)VIO20(OH)4M+0.79 B4(Si7.87Al0.13)IV(Al2.76Fe0.46Mg0.56Mn0.005Ti0.03)VIO20(OH)4 M+1.02 | |||||||||||
Table 3.
FTIR spectral data for the samples and Wyoming bentonite as reference [39].
Table 3.
FTIR spectral data for the samples and Wyoming bentonite as reference [39].
| Assignment | Sample (cm-1) | ||||
|---|---|---|---|---|---|
| B1 | B2 | B3 | B4 | Wy | |
| υ Al(or Mg)-O-H | 3623 | 3620 | 3620 | 3620 | 3631 |
| υ H-O-H | 3430 | 3430 | 3430 | 3430 | 3442 |
| δ H-O-H | 1637 | 1637 | 1637 | 1637 | 1640 |
| υ Si-O | 1030 | 1030 | 1030 | 1030 | 1045 |
| δ Al-Mg-OH | 915 | 915 | 915 | 915 | 919 |
| δ Fe-Al-OH | --- | 883 | 883 | 883 | --- |
| δ Al-Al-OH | 845 | 845 | 849 | 845 | 843 |
| υ Si-O | 791 | 797 | 797 | 797 | 798 |
| δSi-O and Al-O | 626 | 626 | 626 | 626 | --- |
| δ Al-O-Si | 525 | 525 | 525 | 525 | --- |
| δ Si-O-Si | 463 | 463 | 463 | 463 | 463 |
Table 4.
Physical and physicochemical properties of clay minerals.
|
CEC (cmol kg-1) |
Swelling (mL g-1) | Water content (%) | Color parameters | Silt (%) | Clay (%) | Dv50 (m) | Dv90 (m) | D[4,3] (m) | |||
|---|---|---|---|---|---|---|---|---|---|---|---|
| L* | a* | b* | |||||||||
| B1 | 99.56 | < 5.00 | 7.16 | 79.44 | 0.36 | 7.18 | 83.70 | 3.60 | 40.30 | 99.00 | 47.30 |
| B2 | 92.83 | 6.75 | 7.43 | 88.95 | 0.55 | 3.96 | 86.10 | 2.70 | 43.60 | 92.50 | 47.90 |
| B3 | 98.16 | 15.00 | 6.93 | 80.40 | -0.39 | 11.1 | 97.10 | 3.20 | 35.00 | 78.50 | 39.90 |
| B4 | 94.79 | 15.75 | 6.50 | 78.53 | 0.14 | 12.9 | 93.40 | 3.10 | 36.60 | 84.00 | 42.10 |
Table 5.
Pseudo-first and pseudo-second order parameters calculated for ACy adsorption on B1 and B3 at pH 3 and 20 °C.
Table 5.
Pseudo-first and pseudo-second order parameters calculated for ACy adsorption on B1 and B3 at pH 3 and 20 °C.
| B1 | B3 | ||
|---|---|---|---|
| Pseudo- first order | qe (mmol g-1) | 0.01 | 0.07 |
| k1 (min-1) | 0.03 | 0.06 | |
| R2 | 0.92 | 0.99 | |
| Pseudo- second order | qe (mmol g-1) | 0.01 | 0.07 |
| k2 (g⸳(mmol min)-1) | 3.86 | 3.35 | |
| R2 | 0.89 | 0.99 |
Table 6.
Freundlich, Langmuir and Sips parameters for ACy adsorption on bentonites at pH 3 and 20 °C.
Table 6.
Freundlich, Langmuir and Sips parameters for ACy adsorption on bentonites at pH 3 and 20 °C.
| B1 | B2 | B3 | B4 | ||
|---|---|---|---|---|---|
| Langmuir | qm (mmol g-1) | 0.03 | 0.07 | 0.08 | 0.07 |
| k (L mmol-1) | 1.64 | 6.53 | 14.32 | 7.60 | |
| R2 | 0.87 | 0.96 | 0.95 | 0.97 | |
| Freundlich | kf (L g-1) | 0.02 | 0.07 | 0.09 | 0.07 |
| n | 1.62 | 2.61 | 3.53 | 2.82 | |
| R2 | 0.83 | 0.95 | 0.98 | 0.89 | |
| Sips | qm (mmol g-1) | 0.02 | 0.08 | 0.12 | 0.07 |
| b (L mmol-1)1/n | 4.17 | 3.90 | 3.96 | 8.67 | |
| n | 0.29 | 1.32 | 1.88 | 0.84 | |
| R2 | 0.96 | 0.96 | 0.99 | 0.97 |
Table 7.
Freundlich, Langmuir and Sips parameters for ACy adsorption on B3 at pH 3 and 4.5.
| pH 3.0 | pH 4.5 | ||
|---|---|---|---|
| Langmuir | qm (mmol g-1) | 0.08 | 0.04 |
| k (L mmol-1) | 14.32 | 4.51 | |
| R2 | 0.95 | 0.98 | |
| Freundlich | kf (L g-1) | 0.09 | 0.04 |
| n | 3.53 | 1.76 | |
| R2 | 0.98 | 0.93 | |
| Sips | qm (mmol g-1) | 0.12 | 0.03 |
| b (L mmol-1)1/n | 3.96 | 8.57 | |
| n | 1.88 | 0.61 | |
| R2 | 0.99 | 0.99 |
Disclaimer/Publisher’s Note: The statements, opinions and data contained in all publications are solely those of the individual author(s) and contributor(s) and not of MDPI and/or the editor(s). MDPI and/or the editor(s) disclaim responsibility for any injury to people or property resulting from any ideas, methods, instructions or products referred to in the content. |
© 2024 by the authors. Licensee MDPI, Basel, Switzerland. This article is an open access article distributed under the terms and conditions of the Creative Commons Attribution (CC BY) license (http://creativecommons.org/licenses/by/4.0/).
Copyright: This open access article is published under a Creative Commons CC BY 4.0 license, which permit the free download, distribution, and reuse, provided that the author and preprint are cited in any reuse.


