
Submitted:
31 December 2023
Posted:
02 January 2024
You are already at the latest version
Abstract
Oncostatin M (OSM), an inflammatory cytokine belonging to interleukin-6 superfamily, is recognized as an essential factor secreted by osteal macrophages to orchestrate bone remodelling. Osteoprotegerin (OPG) produced by osteoblasts regulates osteoclastogenesis. We previously demonstrated that bone morphogenetic protein-4 (BMP-4) stimulates OPG synthesis in osteoblast-like MC3T3-E1 cells, and that SMAD1/5/8(9), p38 mitogen-activated protein kinase (MAPK), and p70 S6 kinase positively regulates the OPG synthesis. The present study is aimed to investigate the effect of OSM on BMP-4-stimulated OPG synthesis in osteoblasts. OSM suppressed the release and the mRNA expression of OPG upregulated by BMP-4 in MC3T3-E1 cells. Neither the BMP-4-induced phosphorylation of SMAD1/5/9 nor that of p38 MAPK affected by OSM. On the other hand, the BMP-4-stimulated phosphorylation of p70 S6 kinase was considerably suppressed by OSM. These results strongly suggest that OSM suppresses the BMP-4-stimulated OPG synthesis via inhibition of the p70 S6 kinase-mediated pathway in osteoblasts.
Keywords:
oncostatin M
; bone morphogenetic protein-4
; osteoprotegerin
; p70 S6 kinase
; osteoblast
1. Introduction
Bone metabolism is a continuous regenerative process composed of resorption and formation of bone tissue [1]. The process, also recognized as bone remodelling, is performed by two types of antagonistic functional cells: bone-resorbing osteoclasts derived from macrophages and bone-forming osteoblasts originated from mesenchymal stem cells [2]. These functions are finely coordinated by numerous humoral factors such as hormones and autacoids, and direct cell-to-cell contacts maintain the quantity and the quality of bone adequately [2]. Thus, the disruption of bone remodelling, i.e., the dysregulation for functions of osteoclasts and osteoblasts, can cause metabolic bone diseases such as osteoporosis and fracture healing distress [3]. On the other hand, evidence is accumulating that macrophages located onto bone remodelling surface distinct from osteoclast precursors, called osteal macrophages, vitally participate in bone metabolism in addition to the bone cells [4]. As professional phagocytes, osteal macrophage engulf apoptotic osteoblasts, which are thought more than 50% of initially located osteoblasts at remodelling cites [4]. Besides the remove of apoptotic cells called efferocytosis, osteal macrophages can secrete osteogenic factors such as transforming growth factor-β (TGF-β), which facilitates bone remodelling by inducing differentiation of the progenitor cells to osteoblasts [4]. Oncostatin M (OSM), an inflammatory cytokine belonging to interleukin-6 (IL-6) superfamily, is a product of macrophage activating osteoblasts [5,6]. It has been reported that osteal macrophage-secreted OSM is overexpressed to support osteoblastic bone formation during a process of fracture healing in tibia injury model of mouse [7]. OSM is recognized to act via two types of receptor complexes, i.e., OSM receptor (OSMR):gp 130 and leukemia inhibitory factor receptor (LIFR):gp 130 [8]. OSM acts on osteoblast precursors via OSMR to promote the differentiation, and to increase the expression of receptor activator of NF-κB (RANK) ligand (RANKL) on osteoblasts, leading to osteoclasts differentiation, while OSM also acts on osteocyte via LIFR to inhibit sclerostin secretion, resulting in the increase of bone formation by osteoblasts [9]. Thus, OSM plays an important role in bone remodelling as an osteal macrophage-derived regulator of osteoblast functions.
Physiological bone remodelling is started by osteoclastic bone resorption [10], however; the differentiation from osteoclast precursors to mature functional osteoclasts is conducted by osteoblasts, on which receptors of bone resorptive hormones and autacoids such as parathyroid hormone, vitamin D and prostaglandins (PGs) are expressed [2]. In response to bone resorption stimuli, RANKL expressed on the surface of osteoblasts increases and induces osteoclast differentiation and activation by the binding to RANK on the myeloid lineage distinct from osteal macrophages in corporation with macrophage colony-stimulating factor (M-CSF) [11]. On the other hand, osteoprotegerin (OPG), which belongs to tumour necrosis factor receptor family, is mainly produced by osteoblasts and functions as the decoy receptor for RANKL to prevent the binding to RANK on osteoclast precursor cells, in turn, the braker of osteoclastic bone resorption [12]. In vivo, the knock-out of OPG considerably expresses severe osteoporosis in mice [13]. Thus, osteoblast-producing OPG is established as a key player for bone remodelling to regulate the resorption [14]. In terms of the relationship between OSM and OPG, it has been reported that OSM increases the expression of OPG in addition to RANKL and RANK in mouse calvariae [15]. In addition, we have recently reported that OSM upregulates the PGD2-induced syntheses of OPG and IL-6 in osteoblast-like MC3T3-E1 cells [16]. However, the mechanism underlying the OSM effect on OPG synthesis in osteoblasts remains to be clarified.
Bone morphogenetic proteins (BMPs), multifunctional cytokines belonging to TGF-β superfamily, induce the proliferation and the differentiation of osteoblasts and bone formation [17]. As for the intracellular signalling mechanism, SMAD (SMAD1/5/8(9))-dependent pathway, called canonical pathway, is established to be dominant [18], however; SMAD-independent pathways known as non-canonical pathways such as mitogen-activating protein kinase (MAPK) superfamily members are also involved in the signalling of BMPs [19,20]. In terms of OPG synthesis induced by BMP-4, we have reported that SMAD1/5/8(9) as well as p38 MAPK and p70 S6 kinase are involved in the synthesis in osteoblast-like MC3T3-E1 cells [21,22,23,24], leading to speculate that OSM could have a point to affect in the signalling.
We here investigated the effect of OSM on the BMP-4-induced OPG synthesis in osteoblast-like MC3T3-E1 cells, and the underlying mechanism. Our findings strongly suggest that OSM suppressed the BMP-4-stimulated synthesis of OPG via inhibition of p70 S6 kinase in osteoblasts.
2. Results
2.1. Effect of OSM on the BMP-4-induced OPG release in MC3T3-E1 cells
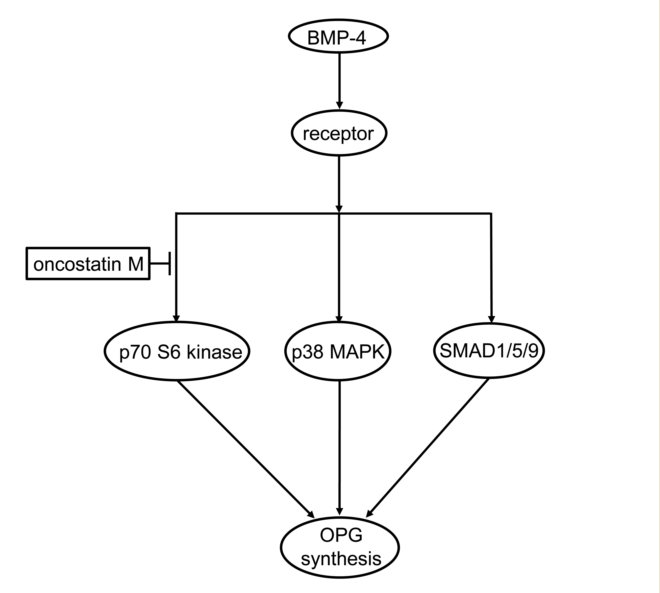
We previously reported that BMP-4 stimulates the synthesis of OPG in osteoblast-like MC3T3-E1 cells [21]. To investigate the involvement of OSM on osteoblasts, we first examined the effect of OSM on BMP-4-induced OPG release in these cells. OSM significantly attenuated the BMP-4-stimulated OPG release in a time-dependent manner up to 48 h (Figure 1). In addition, the suppressing effect of OSM was dose dependent within a range between 1 and 50 ng/ml, although OSM by itself did not affect OPG release (Figure 2). The maximum effect of OSM observed at 50 ng/ml was approximately 80% attenuation of the BMP-4 effect.
2.2. Effects of OSM on the mRNA expression of OPG in MC3T3-E1 cells
To evaluate whether the OSM attenuation for the release of OPG stimulated by BMP-4 was mediated via transcriptional events or not, we examined the effect of OSM on the BMP-4-induced expression of OPG mRNA with RT-qPCR in osteoblast-like MC3T3-E1 cells. As previously demonstrated [21], BMP-4 significantly increased the levels of OPG mRNA expression (Figure 3). OSM, which by itself did not have any significant effect on the expression of OPG mRNA, significantly down-regulated the levels of OPG mRNA increased by BMP-4 (Figure 3).
2.3. Effect of OSM on the BMP-4-induced phosphorylation of SMAD 1/5/9 in MC3T3-E1 cells
Regarding the intracellular signaling pathway of BMP-4 in osteoblasts, we have shown that SMAD1/5/8(9) acts as a positive regulator in the BMP-4-stimulated OPG synthesis in osteoblast-like MC3T3-E1 cells [24]. In order to investigate whether OSM modulates the activation of SMAD 1/5/9, we next examined the effects of OSM on the BMP-4-induced SMAD1/5/9 phosphorylation induced by BMP-4 in osteoblast-like MC3T3-E1 cells. As previously demonstrated, BMP-4 significantly stimulated the phosphorylation of SMAD1/5/9 (Ser-463/Ser-465) (Figure 4). However, OSM, which alone did not affect the levels of SMAD1/5/9 phosphorylation, had little effect on the BMP-4 stimulated phosphorylation of SMAD1/5/9 (Figure 4).
2.4. Effects of OSM on the BMP-4-induced phosphorylation of p38 MAPK in MC3T3-E1 cells
We previously reported that p38 MAPK is involved in the BMP-4-stimulated OPG synthesis in osteoblast-like MC3T3-E1 cells [21]. In order to clarify whether OSM modulates the activation of p38 MAPK or not, we next examined the effects of OSM on the levels of the p38 MAPK phosphorylation induced by BMP-4 in osteoblast-like MC3T3-E1 cells. As previously shown, BMP-4 significantly induced the phosphorylation of p38 MAPK (Figure 5). OSM, which by itself hardly affected the phosphorylation, had little effect on the BMP-4-stimulated p38 MAPK phosphorylation (Figure 5).
2.5. Effects of OSM on the BMP-4-induced phosphorylation of p70 S6 kinase in MC3T3-E1 cells.
We previously indicated that p70 S6 kinase is also involved in the BMP-4-stimulated OPG synthesis in osteoblast-like MC3T3-E1 cells [22,23]. Therefore, we further examined the effects of OSM on the levels of the p70 S6 kinase phosphorylation induced by BMP-4 in these cells. As previously reported, BMP-4 significantly induced the phosphorylation of p70 S6 kinase (Figure 6). OSM, which by itself had little effect on the levels of p70 S6 kinase phosphorylation, significantly suppressed the BMP-4-induced p70 S6 kinase phosphorylation (Figure 6).
3. Discussion
In the present study, we investigated the effect of OSM on the OPG synthesis induced by BMP-4 in osteoblast-like MC3T3-E1 cells. We found that the BMP-4-stimulated OPG release was remarkably suppressed by OSM. We also found that that OSM considerably reduced the levels of OPG mRNA expression. From these results, it is likely that the suppression by OSM of BMP-4-stimulated OPG release is mediated through the transcriptional events. Therefore, OSM seems to inhibit the OPG synthesis induced by BMP-4 in osteoblast-like cells. This is probably the first report which indicates clearly that OSM can suppress OPG synthesis stimulated by BMP-4 in osteoblasts, as far as we know.
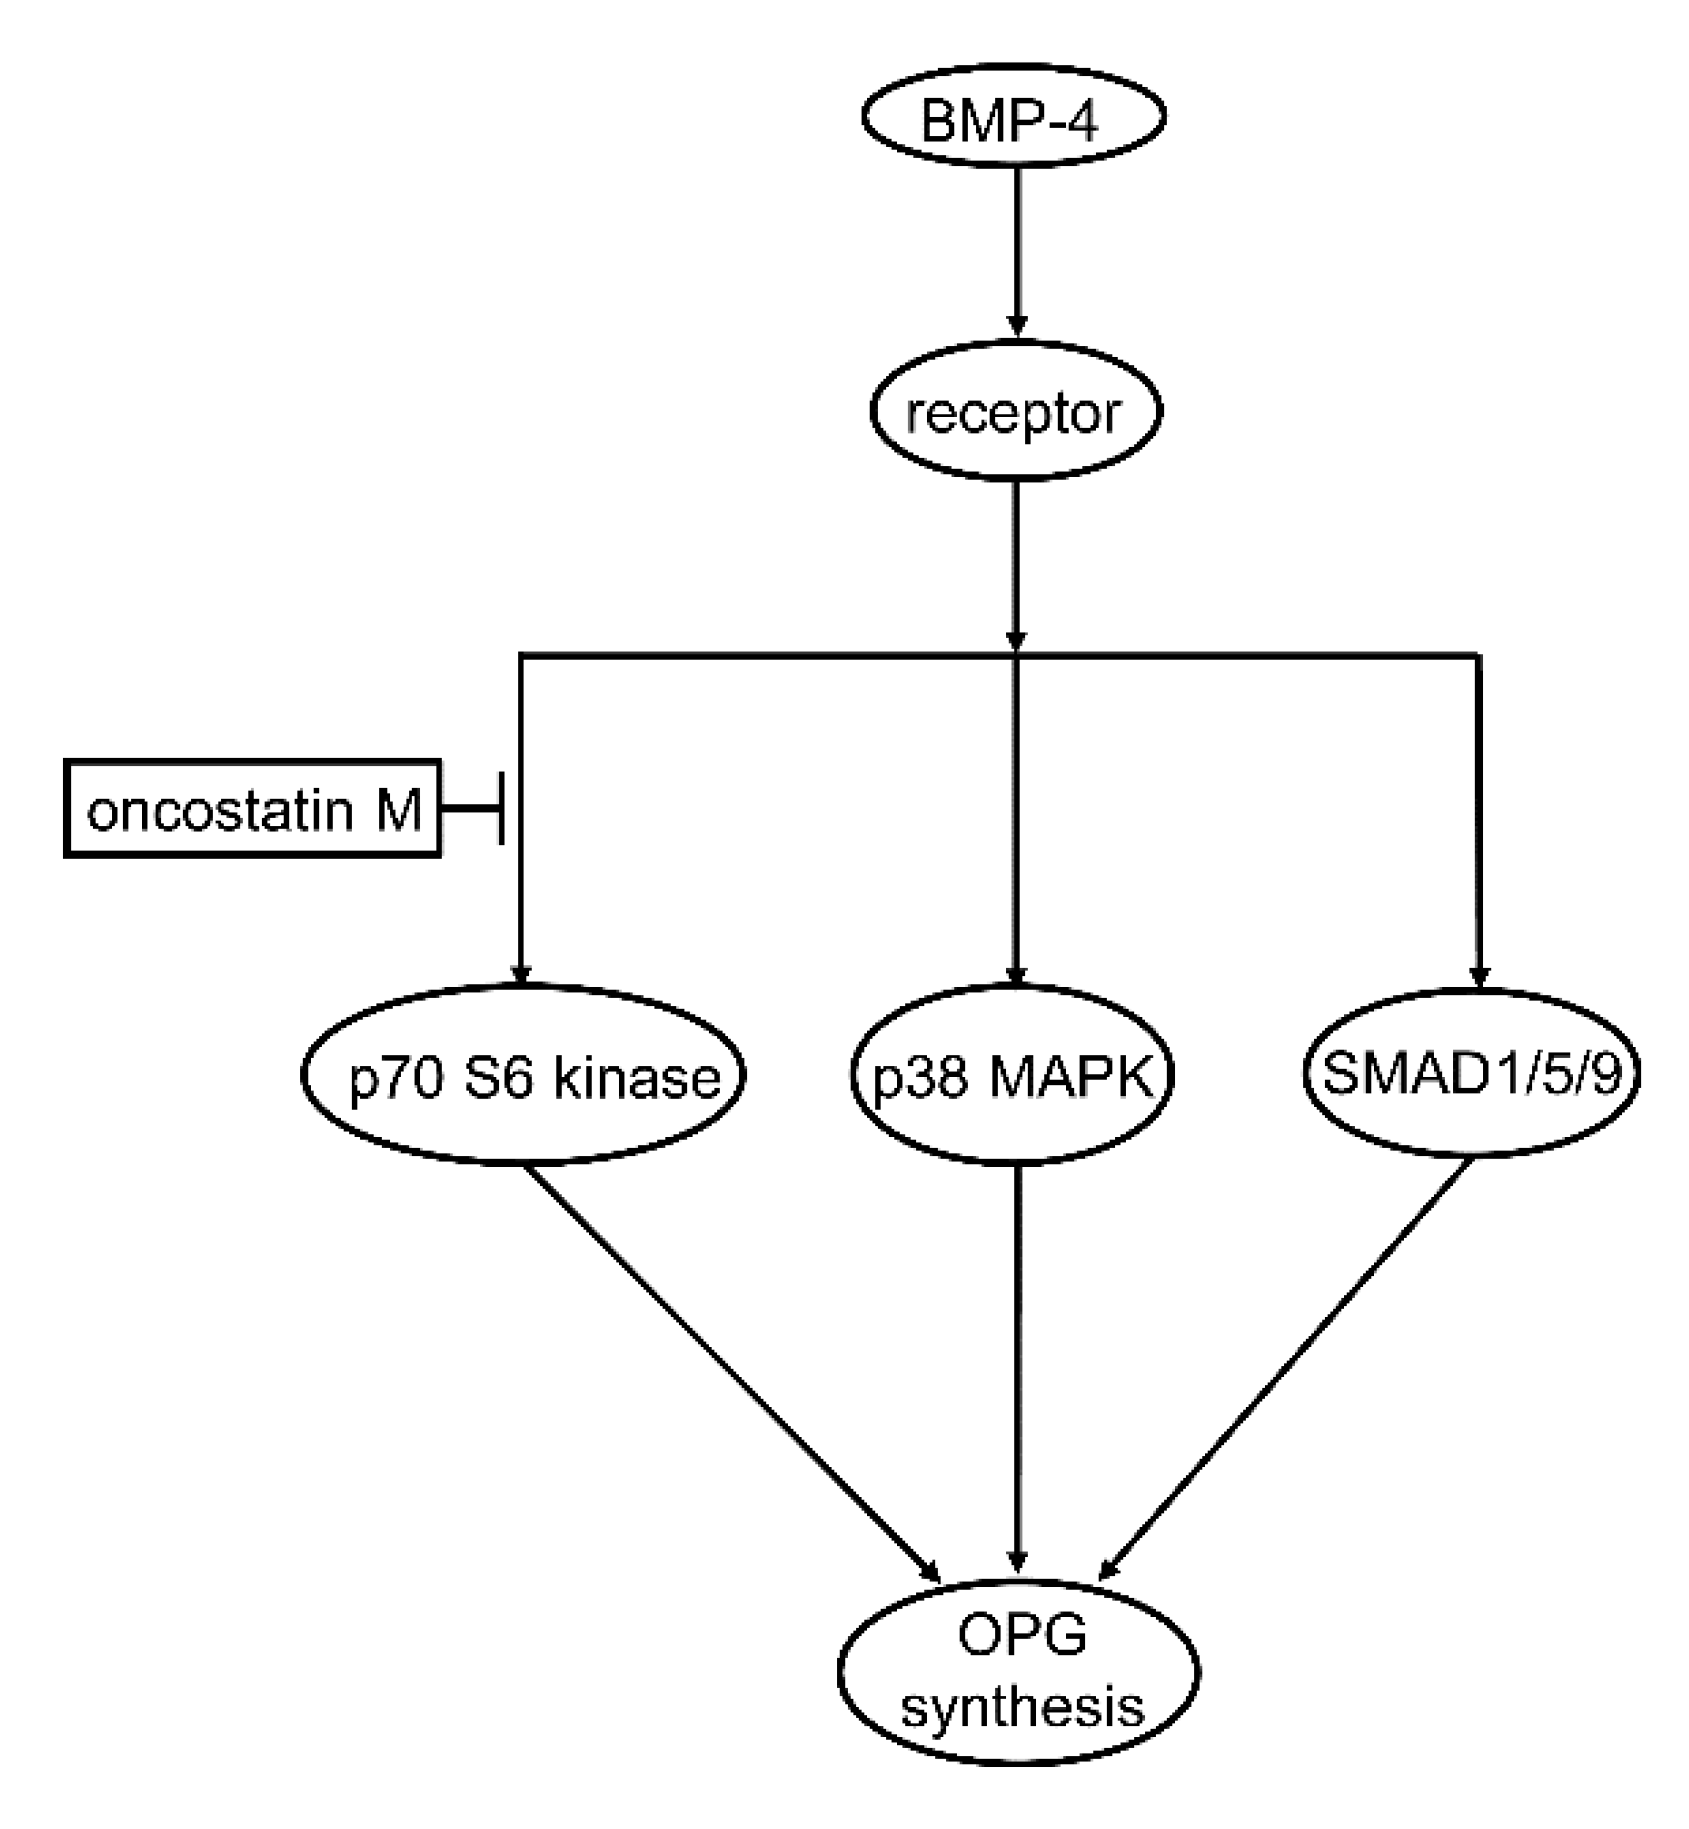
Regarding the intracellular signal transduction mechanism, we have previously reported that BMP-4 stimulates OPG synthesis involved SMAD1/5/8(9), p38 MAPK, and p70 S6 kinase as positive regulators in osteoblast-like MC3T3-E1 cells [21,22,23,24]. Thus, we first examined the effect of OSM on the phosphorylation of SMAD1/5/9 stimulated by BMP-4 in these cells. We found that the phosphorylation was hardly affected by OSM, suggesting unlikely that the BMP-4 stimulated SMAD1/5/9 activation could be modulated by OSM in osteoblast-like cells. We next examined the effect of OSM on the phosphorylation of p38 MAPK stimulated by BMP-4 in these cells, and found that OSM had no effect on the phosphorylation, i.e., the BMP-4-induced activation of p38 MAPK. It is likely that neither p38 MAPK nor SMAD1/5/9 is affected by OSM in BMP-4-stimulated osteoblast-like MC3T3-E1 cells. We thus examined the effect of OSM on the BMP-4-induced phosphorylation of p70 S6 kinase, and finally found that the phosphorylation was considerably suppressed by OSM in these cells. It seems that OSM can downregulate the p70 S6 kinase activity in the BMP-4-stimulated osteoblast-like cells, resulting in the reduction of OPG synthesis. Taking into account of these findings, it is most likely that OSM suppresses the OPG synthesis induced by BMP-4 in osteoblasts, and that the inhibitory effect is exerted at a point upstream of p70 S6 kinase. The potential mechanism underlying the effect of OSM on the OPG synthesis stimulated by BMP-4 is summarized and presented as Figure 7.
As for OPG synthesis in osteoblasts, we have recently reported that OSM increases OPG synthesis in osteoblast-like cells stimulated by PGD2 [16], which is opposed to the present findings. BMP-4 used here is known to be an essential osteogenic factor involved in the process of bone formation [12], whereas PGD2 is recognized to play a role as a modulator on the stage of accelerated bone remodelling [25]. It seems likely that OSM can regulate osteoblast-producing OPG, a crucial regulator of RANKL-RANK pathway as the decoy receptor for RANKL, in turn, osteoclastiogenesis, in response to the progress of bone remodelling process adequately. On the other hand, it has been recently reported that OSM also stimulates RANKL expression on osteoblasts [26]. Thus, it is likely that OSM produced by osteal macrophage might orchestrate osteoclastgenesis through the osteoblast functional regulation of RANKL/RANL/OPG axis in the process of bone remodelling. In addition, we have recently demonstrated that OSM suppresses the synthesis of M-CSF stimulated by TGF-β or tumor-necrosis factor α in osteoblast-like MC3T3-E1 cells [27,28]. M-CSF is established as an essential factor for the differentiation from osteoclast precursor cells to mature osteoclasts, which promotes osteoclastic bone resorption cooperatively with RANKL-RANK pathway [11]. Therefore, it is likely that OSM produced by osteal macrophage can regulate osteoblast functions, the synthesis of OPG and M-CSF, to modulate osteoclastic bone resorption during the process of bone remodelling. On the other hand, it has been reported that BMP-4 signaling as well as BMP-2 via BMP type I receptor (BMPR1A) in osteoblast could promote osteoclastogenesis via suppression of Wnt/β-catenin signaling to reduce endogenous bone mass [29,30,31]. Although it was limited in non-canonycal pathway p70 S6 kinase, the downregulation of BMP-4 signaling by OSM shown here might also antagonize osteoclastogenesis, opposed to OPG decrease effect, which might function as a negative feedback mechanism for bone remodeling to be adequate. The limitation of this study is using clonal osteoblast-like cells. Further investigations including primary cultured osteoblasts and co-cultured with macrophages would be required to clarify the details behind OSM-effects on bone metabolism.
4. Materials and Methods
4.1. Materials
Recombinant mouse OSM, recombinant BMP-4, and ELISA kits of mouse OPG were obtained from R&D Systems, Inc. (Minneapolis, MN, USA). Phospho-specific SMAD1/5/9 antibodies, SMAD1/5/9 antibodies, phospho-specific p38 MAPK antibodies, p38 MAPK antibodies, phospho-specific p70 S6 kinase antibodies, and p70 S6 kinase antibodies were purchased from Cell Signaling Technology, Inc. (Beverly, MA, USA). GAPDH antibodies were obtained from Proteintech Inc. (Rosemont, IL, USA). The ECL Western blot detection system was purchased from GE Healthcare Life Sciences (Buckinghamshire, UK). Secondary antibodies, peroxidase-labeled goat anti-rabbit immunoglobulin G were purchased from Seracare (Milford, MA, USA). Other materials and chemicals involved in the study were obtained from commercial sources.
4.2. Cell culture
Clonal osteoblast-like MC3T3-E1 cells derived from newborn mouse calvariae [32] were maintained as previously described [33]. Briefly, MC3T3-E1 cells were cultured in α-minimum essential medium (α-MEM) (Sigma-Aldrich Co., St-Louis, MO, USA) supplemented with 10% fetal bovine serum (FBS) (Gibco; Thermo Fisher Scientific, Inc., Heysham, Lancashire, UK) at 37°C in a humidified atmosphere with 5% CO2/95% air. The cells were seeded onto 35-mm diameter dishes (5 x 10⁴ cells/dish) for ELISA and RT-PCR analysis, or 90-mm diameter dishes (2 x 10⁵ cells/dish) for Western blot analysis in α-MEM supplemented with 10% FBS. After 5 days, the medium was replaced with α-MEM supplemented with 0.3% FBS. After 48 h, the cells were utilized for experiments [21].
4.3. Assay for OPG
The cultured cells were pretreated with indicated doses of OSM or vehicle for 60 min at 37°C, and then stimulated with 30 ng/ml of BMP-4 or vehicle in 1 ml α-MEM supplemented with 0.3% FBS for 0, 12, 24, 36, 48 h at 37°C. The conditioned medium was then collected, and the concentrations of OPG were measured using the mouse OPG ELISA kit, according to the manufacturer’s protocol [21].
4.4. Real-time RT-PCR
The cultured cells were pretreated with 50 ng/ml of OSM or vehicle for 60 min at 37°C, and then stimulated with 30 ng/ml of BMP-4 or vehicle in α-MEM, containing 0.3% FBS for 3 h. Total RNA was isolated, and reverse transcribed into complementary DNA using TRIzol reagent (Ambion; Thermo Fisher Scientific, Inc., Heysham, Lancashire, UK) and Omniscript Reverse Transcriptase kit (Qiagen Inc., Valencia, CA), respectively. RT-PCR was performed in capillaries using a LightCycler system with the LightCycler FastStart DNA Master SYBR Green I (Roche Diagnostic, Basel, Switzerland). Sense and antisense primers for mouse OPG mRNA (primer set ID: MA0256526) were purchased from Takara Bio Inc. (Tokyo, Japan). Sense and antisense primers for mouse GAPDH mRNA were synthesized based on the report of Simpson et al. [34]. The amplified products were determined using melting curve analysis. The mRNA levels of OPG were normalized to those of GAPDH mRNA [21].
4.5. Western blot analysis
The cultured MC3T3-E1 cells were pretreated with indicated doses of OSM for 60 min at 37°C, and then stimulated with 30 ng/ml of BMP-4 or vehicle in 4 ml of α-MEM containing 0.3% FBS for the indicated periods. Thereafter, the cells were lysed, homogenized, and sonicated in a lysis buffer containing 62.5 mM Tris/HCl, pH 6.8, 2% SDS, 50 mM dithiothreitol, and 10% glycerol. SDS-PAGE was performed according to the method of Laemmli using 10% polyacrylamide gels [35]. The proteins were fractionated and transferred onto an Immuno-Blot PVDF membrane (Bio-Rad, Hercules, CA, USA). The membranes were blocked with 5% fat-free dry milk in Tris-buffered saline-Tween (TBS-T; 20 mM Tris-HCl, pH 7.6, 137 mM NaCl, 0.1% Tween 20) for 1 h before incubation with primary antibodies. Western blot analysis was performed as described previously [21] using phospho-specific SMAD1/5/9 antibodies, SMAD1/5/9 antibodies, phospho-specific p38 MAPK antibodies, p38 MAPK antibodies, phospho-specific p70 S6 kinase antibodies, p70 S6 kinase antibodies, or GAPDH antibodies as primary antibodies; peroxidase-labeled antibodies raised in goat against rabbit IgG were used as secondary antibodies. The primary and secondary antibodies were diluted to optimal concentrations with 5% fat-free dry milk in TBS-T. The peroxidase activity on the PVDF sheet was visualized on X-ray film using an ECL Western blotting detection system.
4.6. Densitometric analysis
A densitometric analysis of the Western blots was performed using a scanner and image analysis software program (Image J version 1.48; National Institutes of Health, Bethesda, MD). The phosphorylation levels were calculated as follows: the background-subtracted signal intensity of each phosphorylation signal was normalized to the respective intensity of total protein and plotted as the fold-increase compared to that of control cells treated without stimulation [21].
4.7. Statistical analysis
The data were analyzed by an analysis of variance (ANOVA) followed by Bonferroni method for multiple comparisons between pairs, and p < 0.05 was statistically significant. The data are presented as means ± SEM of triplicate determinations from independent cell preparations [21].
5. Conclusions
In conclusion, our findings strongly suggest that OSM reduces BMP-4-stimulated synthesis of OPG in osteoblasts, and the suppressive effect of OSM is exerted at a point upstream of p70 S6 kinase.
Author Contributions
Conceptualization, O.K. and H.T.; methodology, T.H., O.K. and H.T.; software, T.H. and R.M-N; validation, O.K. and H.T.; formal analysis, T.H., J.T., R.M-N, H.I. and H.T.; investigation, T.H., J.T., R.M-N, H.I. and H.T.; resources, O.K. and H.T.; data curation, T.H., O.K. and H.T.; writing—original draft preparation, T.H., O.K. and H.T.; writing—review and editing, T.H., O.K. and H.T.; visualization, T.H. and H.T.; supervision, H.I., O.K. and H.T.; project administration, O.K. and H.T.; funding acquisition, O.K. and H.T. All authors have read and agreed to the published version of the manuscript.
Funding
This research was supported in part by Grant-in-Aid for Scientific Research (22K09438) from the Ministry of Education, Culture, Sports, Science and Technology of Japan, and the Research Funding for Longevity Sciences (21-1) from National Center for Geriatrics and Gerontology, Japan.
Institutional Review Board Statement
Not applicable.
Informed Consent Statement
Not applicable.
Data Availability Statement
The data underlying this article will be shared on reasonable request to the corresponding author.
Acknowledgments
We are very grateful to Mrs. Yumiko Kurokawa for her skillful technical assistance.
Conflicts of Interest
The authors declare no conflicts of interest.
References
- Kular, J.; Tickner, J.; Chim, S.M.; Xu, J. An overview of the regulation of bone remodeling at the cellular level. Clin. Biochem. 2012, 45, 863–873. [Google Scholar] [CrossRef]
- Karsenty, G.; Wagner, E.F. Reaching a genetic and molecular understanding of skeletal development. Dev. Cell 2002, 2, 389–406. [Google Scholar] [CrossRef]
- Su, P.; Tian, Y. Yang, C.; Ma, X.; Wang, X; Pei, J.; Qian A. Mesenchymal stem cell migration during bone formation and bone diseases therapy. Int. J. Mol. Sci. 2018, 19, 2343. [Google Scholar] [CrossRef] [PubMed]
- Michalski, M.N.; McCauley, L.K. Macrophages and skeletal health. Pharmacol. Ther. 2017, 174, 43–54. [Google Scholar] [CrossRef]
- Zarling, J.M.; Shoyab, M.; Marquardt, H.; Hanson, M.B.; Lioubin, M.N.; Tadaro, G.J. Oncostatin M: a growth regulator produced by differentiated histiocytic lymphoma cells. Proc. Natl. Acad. Sci. U. S. A. 1986, 83, 9739–9743. [Google Scholar] [CrossRef]
- Jay, P.R.; Centrella, M.; Lorenzo, J; Bruce, A.G.; Horowitz, M.C. Oncostatin-M: a new bone active cytokine that activates osteoblasts and inhibits bone resorption. Endocrinology 1996, 137, 1151–1158. [CrossRef]
- Guihard, P.; Boutet, M.A.; Royer, B.B.L.; Gamblin, A.L.; Amiaud, J.; Renaud, A.; Berreur, M.; Rédini., F.; Heymann, D.; Layrolle, P.; et al. Oncostatin M, an inflammatory cytokine produced by macrophages, supports intramembrane bone healing in a mouse model of tibia injury. Am. J. Pathol. 2015, 185, 765–775. [Google Scholar] [CrossRef]
- Sims, N.A.; Quinn, J.M. Osteoimmunology: oncostatin M as a pleiotropic regulator of bone formation and resorption in health and disease. Bonekey Rep. 2014, 3, 527. [Google Scholar] [CrossRef] [PubMed]
- Walker, E.C.; McGregor, N.E.; Poulton, I.J.; Solano, M.; Pompolo, S.; Fernandes, T.J.; Constable, M.J.; Nicholson, G.C.; Zhang, J.G.; Nicola, N.A.; et al. Oncostatin M promotes bone formation independently of resorption when signaling through leukemia inhibitory factor receptor in mice. J. Clin. Invest. 2010, 120, 582–592. [Google Scholar] [CrossRef] [PubMed]
- Sims, N.A.; Morris, H.A.; Moore, R.J.; Durbridge, T.C. Increased bone resorption precedes increased bone formation in the ovariectomized rat. Calcif. Tissue Int. 1996, 59, 121–127. [Google Scholar] [CrossRef]
- Theoleyre, S.; Wittrant, Y.; Tat, S.K.; Fortun, Y.; Redini, F.; Heymann, D. The molecular triad OPG/RANK/RANKL: involvement in the orchestration of pathophysiological bone remodeling. Cytokine Growth Factor Rev. 2004, 15, 457–75. [Google Scholar] [CrossRef] [PubMed]
- Simonet, W.S.; Lacey, D.L.; Dunstan, C.R.; Kelley, M.; Chang, M.S.; Lüthy, R.; Nguyen, H.Q.; Wooden, S.; Bennett, L.; Boone, T.; et al. Osteoprotegerin: a novel secreted protein involved in the regulation of bone density. Cell 1997, 89, 309–319. [Google Scholar] [CrossRef] [PubMed]
- Bucay, N.; Sarosi, I.; Dunstan, C.R.; Morony, S.; Tarpley, J.; Capparelli, C.; Scully, S.; Tan, H.L.; Xu, W.; Lacey, D.L.; et al. Osteoprotegerin-deficient mice develop early onset osteoporosis and arterial calcification. Genes Dev. 1998, 12, 1260–1268. [Google Scholar] [CrossRef] [PubMed]
- Boyce, B.F.; Xing, L. The RANKL/RANK/OPG pathway. Curr. Osteoporos. Rep. 2007, 5, 98–104. [Google Scholar] [CrossRef]
- Palmqvist, P.; Persson, E.; Conaway, H.H.; Lerner, U.H. IL-6, leukemia inhibitory factor, and oncostatin M stimulate bone resorption and regulate the expression of receptor activator of NF-kappa B ligand, osteoprotegerin, and receptor activator of NF-kappa B in mouse calvariae. J. Immunol. 2002, 169, 3353–3362. [Google Scholar] [CrossRef]
- Kuroyanage, G.; Hioki, T.; Tachi, J.; Matsushima-Nishiwaki, R.; Iida, H.; Kozawa, O.; Tokuda, H. Oncostatin M stimulates prostaglandin D2-induced osteoprotegerin and interleukin-6 synthesis in osteoblasts. Prostaglandins Leukot. Essent. Fatty Acids 2023, 192, 102575. [Google Scholar] [CrossRef] [PubMed]
- Krause, C.; de Gorter, D.J.J.; Karperien, M.; ten Dijke, P. Chapter 2: Signal transduction cascades controlling osteoblast differentiation. Primer on the Metabolic Bone Diseases and Disorders of Mineral Metabolism, 7th ed.; Rosen, C.J., Ed.; John Wiley & Sons, Inc.: Washington, DC, USA, 2008; Volume 7, pp. 10–16. [Google Scholar] [CrossRef]
- Miyazono, K.; Kamiya, Y.; Morikawa, M. Bone morphogenic protein receptors and signal transduction. J. Biochem. 2010, 147, 35–51. [Google Scholar] [CrossRef]
- Moustakas, A.; Heldin, C.H. Non-Smad TGF-beta signals. J. Cell Sci. 2005, 118, 3573–3584. [Google Scholar] [CrossRef]
- Cai, J.; Pardali, E.; Sánchez-Duffhues, G.; ten Dijke, P.; et al. BMP signaling in vascular diseases. FEBS Lett. 2012, 586, 1993–2002. [Google Scholar] [CrossRef]
- Kuroyanagi, G.; Tokuda, H.; Yamamoto, N.; Matsushim-Nishiwaki, R.; Mizutani, J.; Kozawa, O.; Otsuka, T. Resveratrol amplifies BMP-4-stimulated osteoprotegerin synthesis via p38 MAPK in osteoblasts. Mol. Med. Rep. 2015, 12, 3849–3854. [Google Scholar] [CrossRef]
- Fujita, K.; Otsuka, T.; Yamamoto, N.; Kainuma, S.; Ohguchi, R.; Kawabata, T.; Sakai, G.; Kuroyanagi, G.; Matsushima-Nishiwaki, R.; Kozawa, O.; et al. (-)-Epigallocatechin gallate but not chlorogenic acid upregulates osteoprotegerin synthesis through regulation of bone morphogenetic protein-4 in osteoblasts. Exp. Ther. Med. 2017, 14, 417–423. [Google Scholar] [CrossRef]
- Kawabata, T.; Otsuka, T.; Fujita, K.; Kainuma, S.; Yamamoto, N.; Kuroyanagi, G.; Sakai, G.; Matsushima-Nishiwaki, R.; Kozawa, O.; Tokuda, H. Suppression by HSP90 inhibitors of BMP-4-stimulated osteoprotegerin synthesis in osteoblasts: attenuation of p70 S6 kinase. Mol. Med. Rep. 2017, 16, 8507–8512. [Google Scholar] [CrossRef] [PubMed]
- Tachi, J.; Onuma, T.; Yamaguchi, S.; Kim, W.; Hioki, T.; Matsushima-Nishiwaki, R.; Tanabe, K.; Tokuda, H.; Kozawa, O.; Iida, H. Duloxetine suppresses BMP-4-induced release of osteoprotegerin via inhibition of the SMAD signaling pathway in osteoblasts. Biochem. Cell Biol. 2021, 99, 578–586. [CrossRef] [PubMed]
- Hijiki, H.; Takato, T.; Shimizu, S.; Ishii, S. The roles of prostanoids, leukotrienes, and platelet-activating factor in bone metabolism and disease. Prog. Lipid Res. 2008, 47, 107–126. [Google Scholar] [CrossRef] [PubMed]
- de Souza, P.P.C.; Henning, P.; Lerner, U.H. Stimulation of Osteoclast Formation by Oncostatin M and the Role of WNT16 as a Negative Feedback Regulator. Int. J. Mol. Sci. 2022, 23, 3287. [Google Scholar] [CrossRef] [PubMed]
- Doi, T.; Hioki, T.; Tachi, J.; Ueda, K.; Matsushima-Nishiwaki, R.; Iida, H.; Ogura, S.; Kozawa, O.; Tokuda, H. Oncostatin M reduces the synthesis of macrophage-colony stimulating factor stimulated by TGF-β via suppression of p44/p42 MAP kinase and JNK in osteoblasts. Biomed. Res. 2022, 43, 41–51. [Google Scholar] [CrossRef] [PubMed]
- Hioki, T.; Kuroyanagi, G.; Matsushima-Nishiwaki, R.; Kozawa, O.; Tokuda, H. Oncostatin M attenuates tumor necrosis factor-α-induced synthesis of macrophage-colony stimulating factor via suppression of Akt in osteoblasts. Connect. Tissue Res. 2023, 64, 139–147. [Google Scholar] [CrossRef] [PubMed]
- Kamiya, N.; Ye, L.; Kobayashi, T.; Mochida, Y.; Yamauchi, M.; Kronenberg, H.M.; Feng, J.Q.; Mishina, Y. BMP signaling negatively regulates bone mass through sclerostin by inhibiting the canonical Wnt pathway. Development 2008, 135, 3801–3811. [Google Scholar] [CrossRef]
- Kamiya, N.; Kobayashi, T.; Mochida, Y.; Yu, P.B.; Yamauchi, M.; Kronenberg, H.M.; Mishina, Y. Wnt inhibitors Dkk1 and Sost are downstream targets of BMP signaling through the type IA receptor (BMPRIA) in osteoblasts. J. Bone Miner. Res. 2010, 25, 200–210. [Google Scholar] [CrossRef]
- Baud’huin, M.; Solban, N.; Cornwall-Brady, M.; Sako, D.; Kawamoto, Y.; Liharska, K.; Lath, D.; Bouxsein, M.L.; Underwood, K.W.; Ucran, J.; et al. A soluble bone morphogenetic protein type IA receptor increases bone mass and bone strength. Proc. Natl. Acad. Sci. U. S. A. 2012, 109, 12207–12212. [Google Scholar] [CrossRef]
- Sudo, H.; Kodama, H.A.; Amagai, Y.; Yamamoto, S.; Kasai, S. In vitro differentiation and calcification in a new clonal osteogenic cell line derived from newborn mouse calvaria. J. Cell Biol. 1983, 96, 191–198. [Google Scholar] [CrossRef] [PubMed]
- Kozawa, O.; Tokuda, H.; Miwa, M.; Kotoyori, J.; Oiso, Y. Cross-talk regulation between cyclic AMP production and phosphoinositide hydrolysis induced by prostaglandin E2 in osteoblast-like cells. Exp. Cell Res. 1992, 198, 130–134. [Google Scholar] [CrossRef] [PubMed]
- Simpson, D.A.; Freeney, S.; Boyle, C.; Stitt, A.W. Retinal VEGF mRNA measured by SYBR green I fluorescence: a versatile approach to quantitative PCR. Mol. Vis. 2000, 6, 178–183. www.molvis.org/molvis/v6/a24/. [PubMed]
- Laemmli, U.K. Cleavage of structural proteins during the assembly of the head of bacteriophage T4. Nature 1970, 227, 680–685. [Google Scholar] [CrossRef]
Figure 1.
Effect of OSM on the BMP-4-induced OPG release in MC3T3-E1 cells. The cultured cells were pretreated with 50 ng/ml of OSM (●,○) or vehicle (▴,▵) for 60 min, and subsequently stimulated by 30 ng/ml of BMP-4 (●,▴) or vehicle (○,▵) for the indicated periods. The concentrations of OPG in the culture medium were determined with corresponding enzyme-linked immunosorbent assay (ELISA). Each value is the mean ± standard error of mean (SEM) of triplicate determinations from three independent cell preparations. *p < 0.05, compared to the value of control. **p < 0.05, compared to the value of BMP-4 alone.
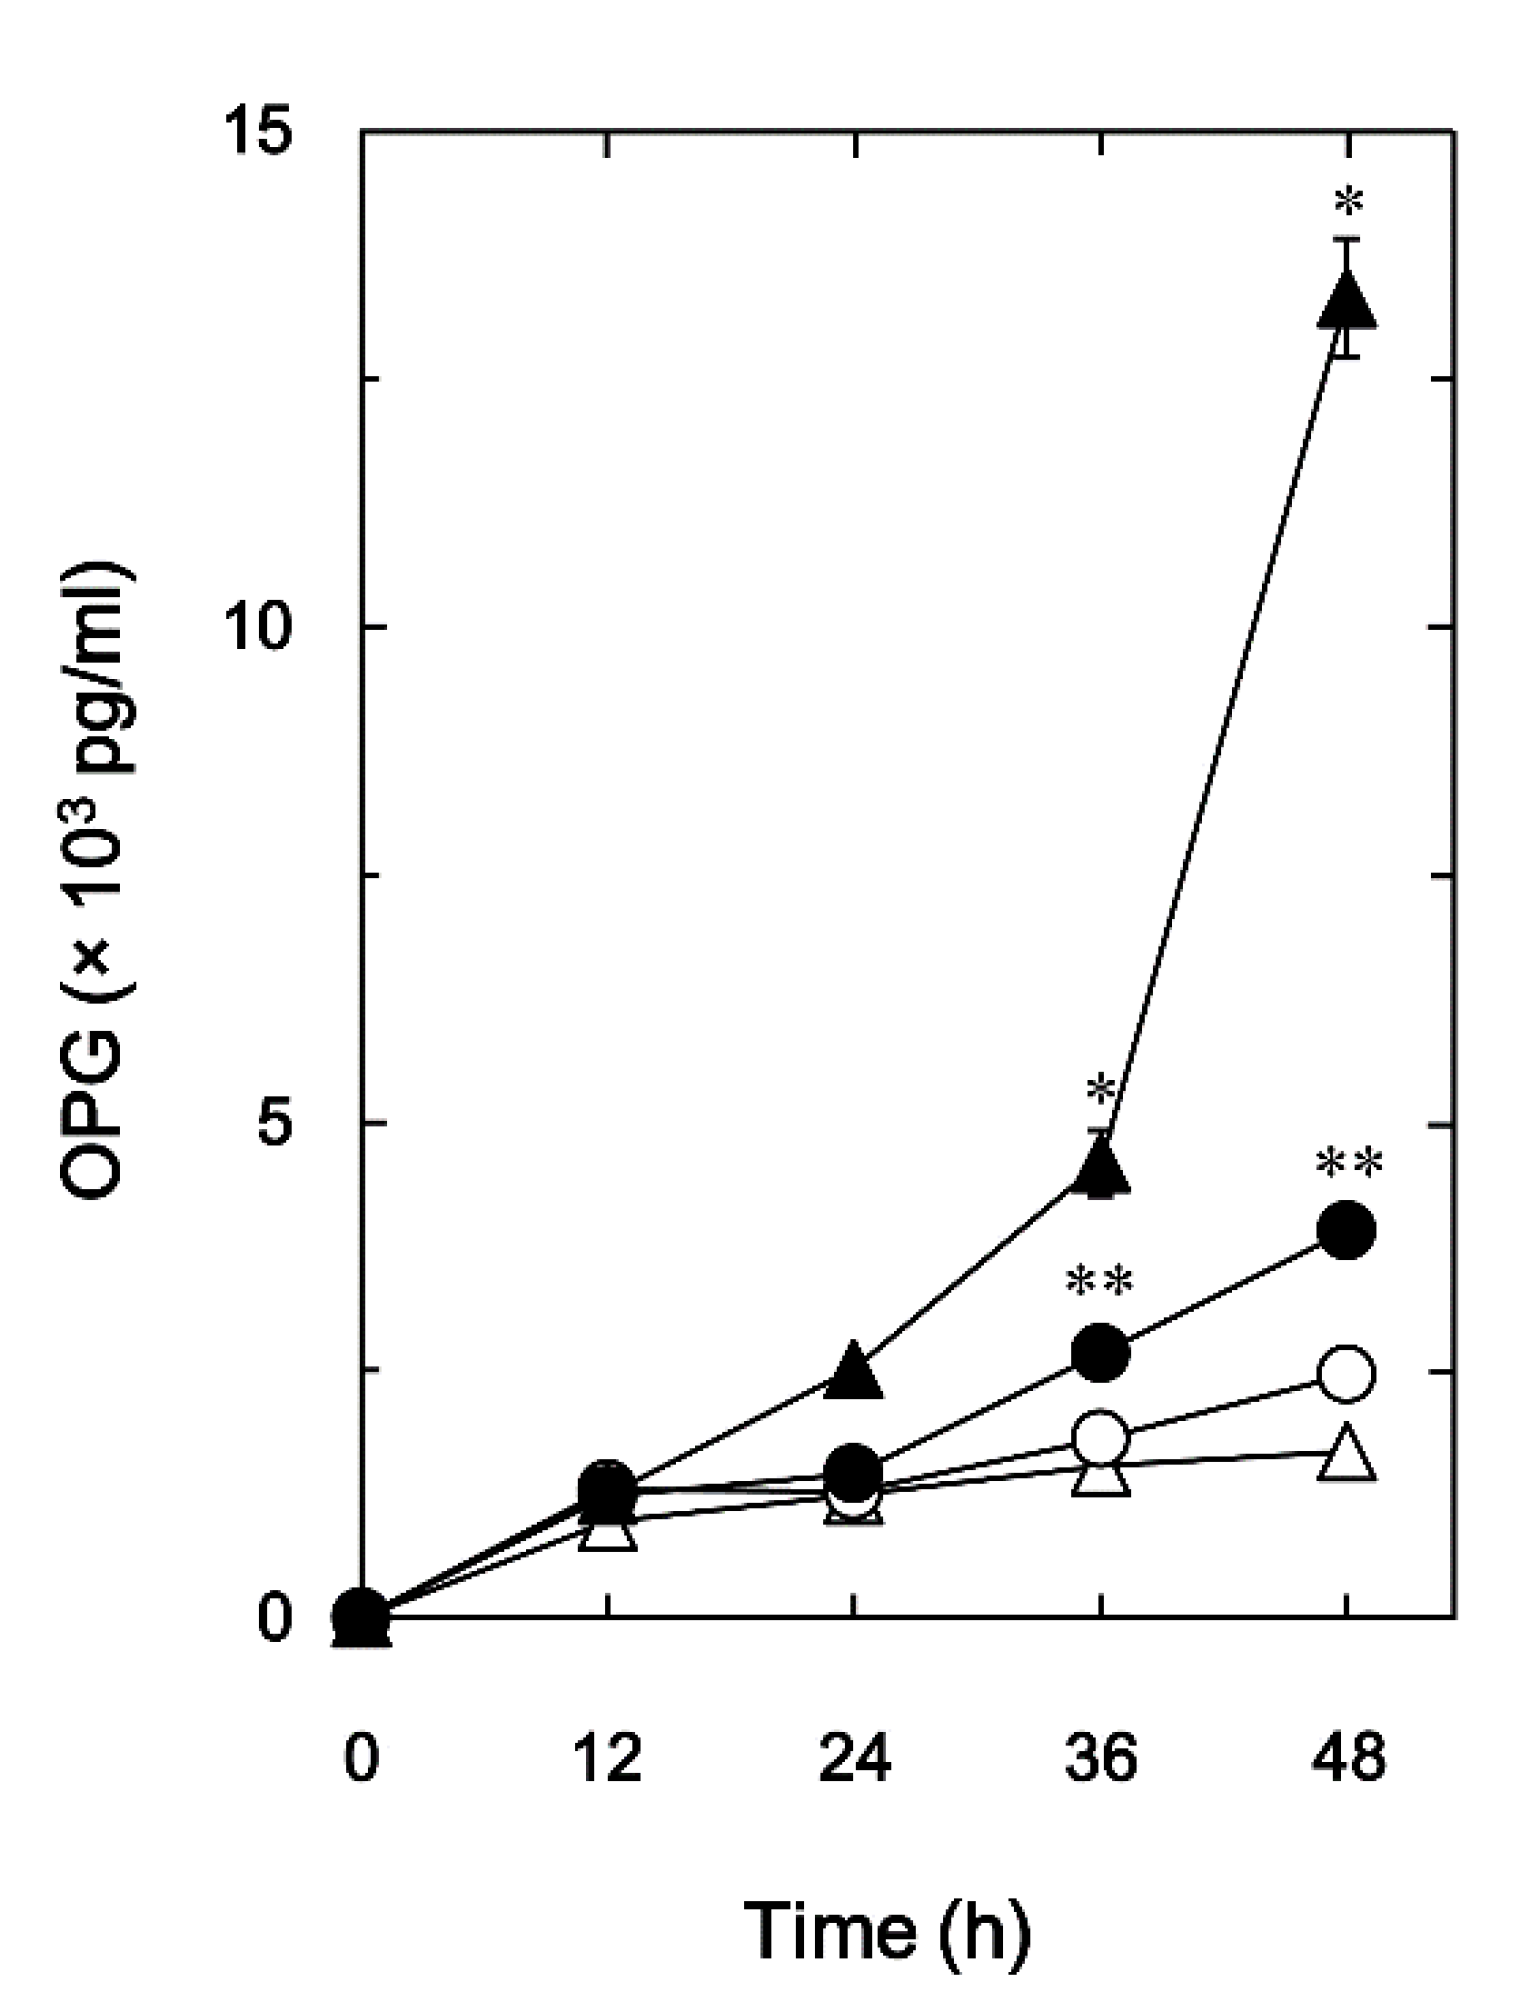
Figure 2.
Effect of OSM on the BMP-4-induced OPG release in MC3T3-E1 cells. The cultured cells were pretreated with 0, 1, 3, 10, 30, 50 ng/ml of OSM for 60 min, and subsequently stimulated by 30 ng/ml of BMP-4 (●) or vehicle (○) for 48 h. The concentrations of OPG in the culture medium were determined with corresponding ELISA. Each value is the mean ± SEM of triplicate determinations from three independent cell preparations. *p < 0.05, compared to the value of BMP-4 alone.
Figure 3.
Effect of OSM on the expression of BMP-4-induced OPG mRNA in MC3T3-E1 cells. The cultured cells were pretreated with 50 ng/ml of OSM or vehicle for 60 min, and subsequently stimulated by 30 ng/ml of BMP-4 or vehicle for 3 h. The respective total RNA was subsequently isolated and transcribed into cDNA. The expression of OPG mRNA and Glyceraldehyde-3-phosphate dehydrogenase (GAPDH) mRNA were quantified by RT-PCR. The levels of OPG mRNA were normalized to those of GAPDH mRNA. Each value is the mean ± SEM of triplicate determinations from three independent cell preparations. *p < 0.05, compared to the value of control. **p < 0.05, compared to the value of BMP-4 alone.
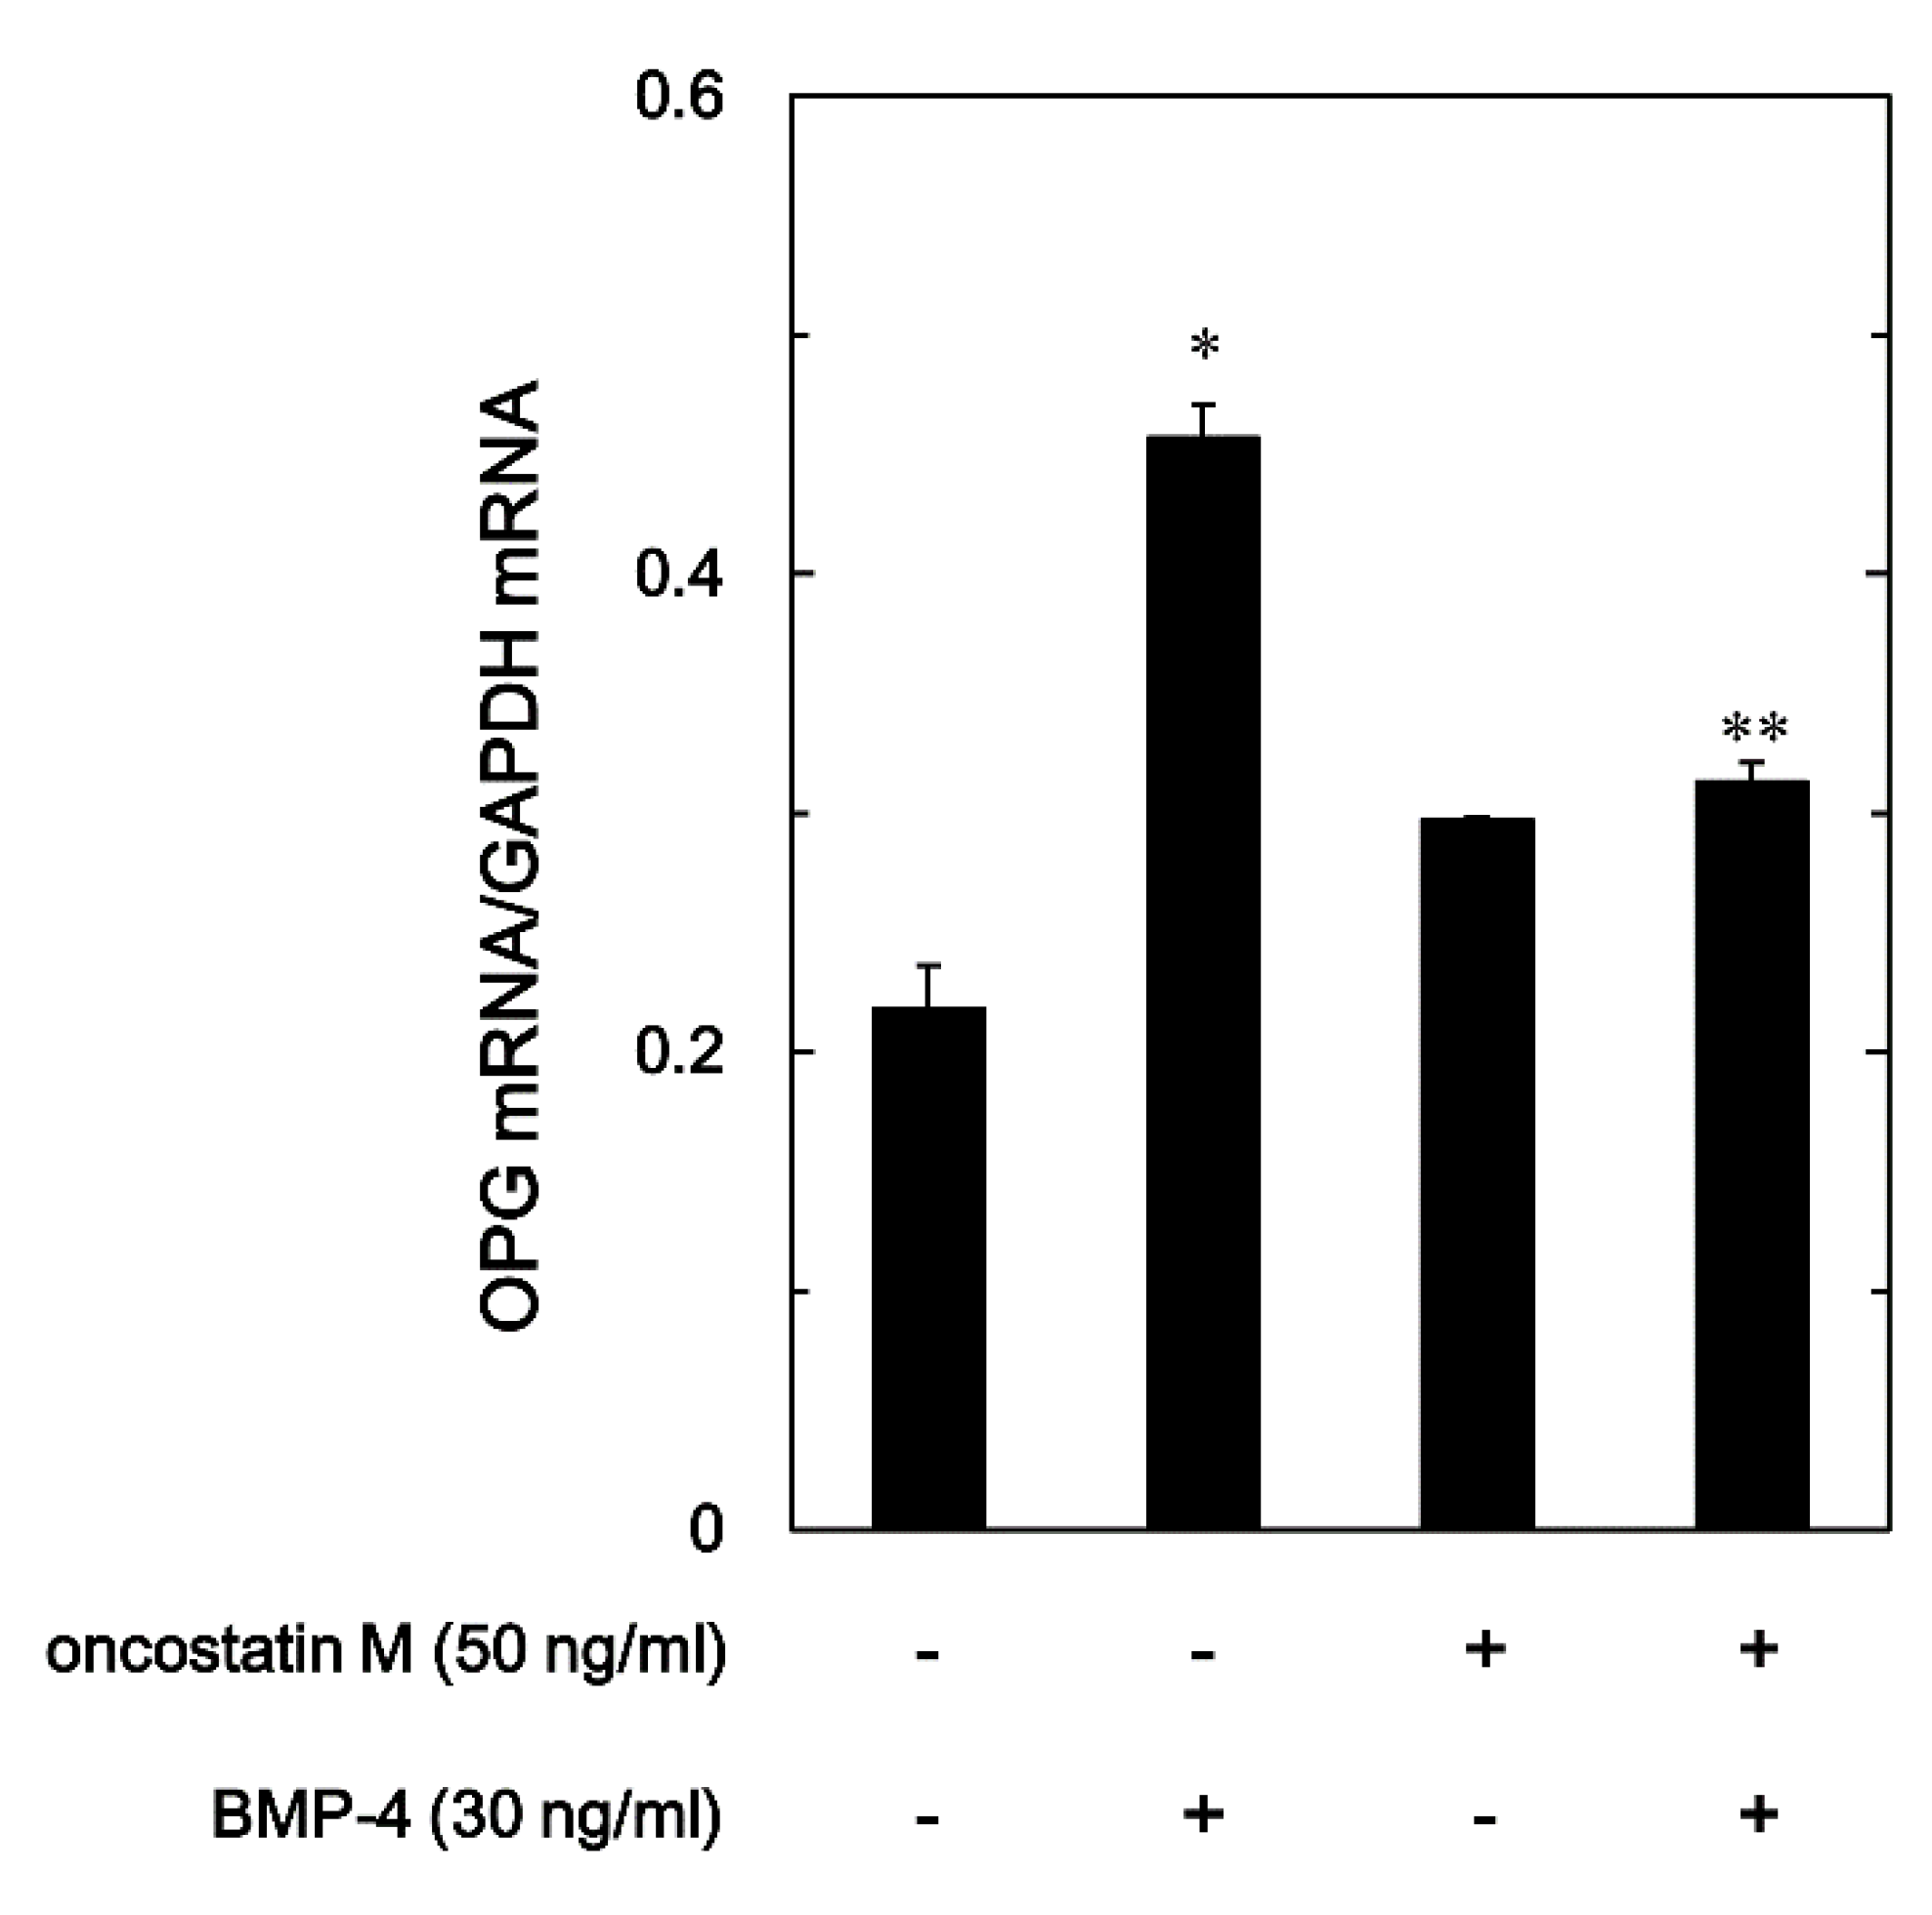
Figure 4.
Effect of OSM on the BMP-4-induced phosphorylation of SMAD1/5/9 in MC3T3-E1 cells. The cultured cells were pretreated with 30 ng/ml of OSM or vehicle for 60 min, and then stimulated by 30 ng/ml of BMP-4 or vehicle for 45 min. The cell extracts were then subjected to SDS-PAGE and subsequent Western blot analysis with antibodies against phospho-specific SMAD1/5/9, SMAD1/5/9, and GAPDH. The histogram shows the quantitative representations of the levels of phosphorylated SMAD1/5/9 after normalization with respect to with respect to SMAD1/5/9 (upper panel) or GAPDH (lower panel) obtained from laser densitometric analysis. The levels were expressed as the fold-increase with respect to the basal levels presented in lane 1. Each value represents the mean ± SEM of triplicate determinations from three independent cell preparations. *p < 0.05, compared to the value of the control. N.S, designates no significant difference between the indicated pairs.
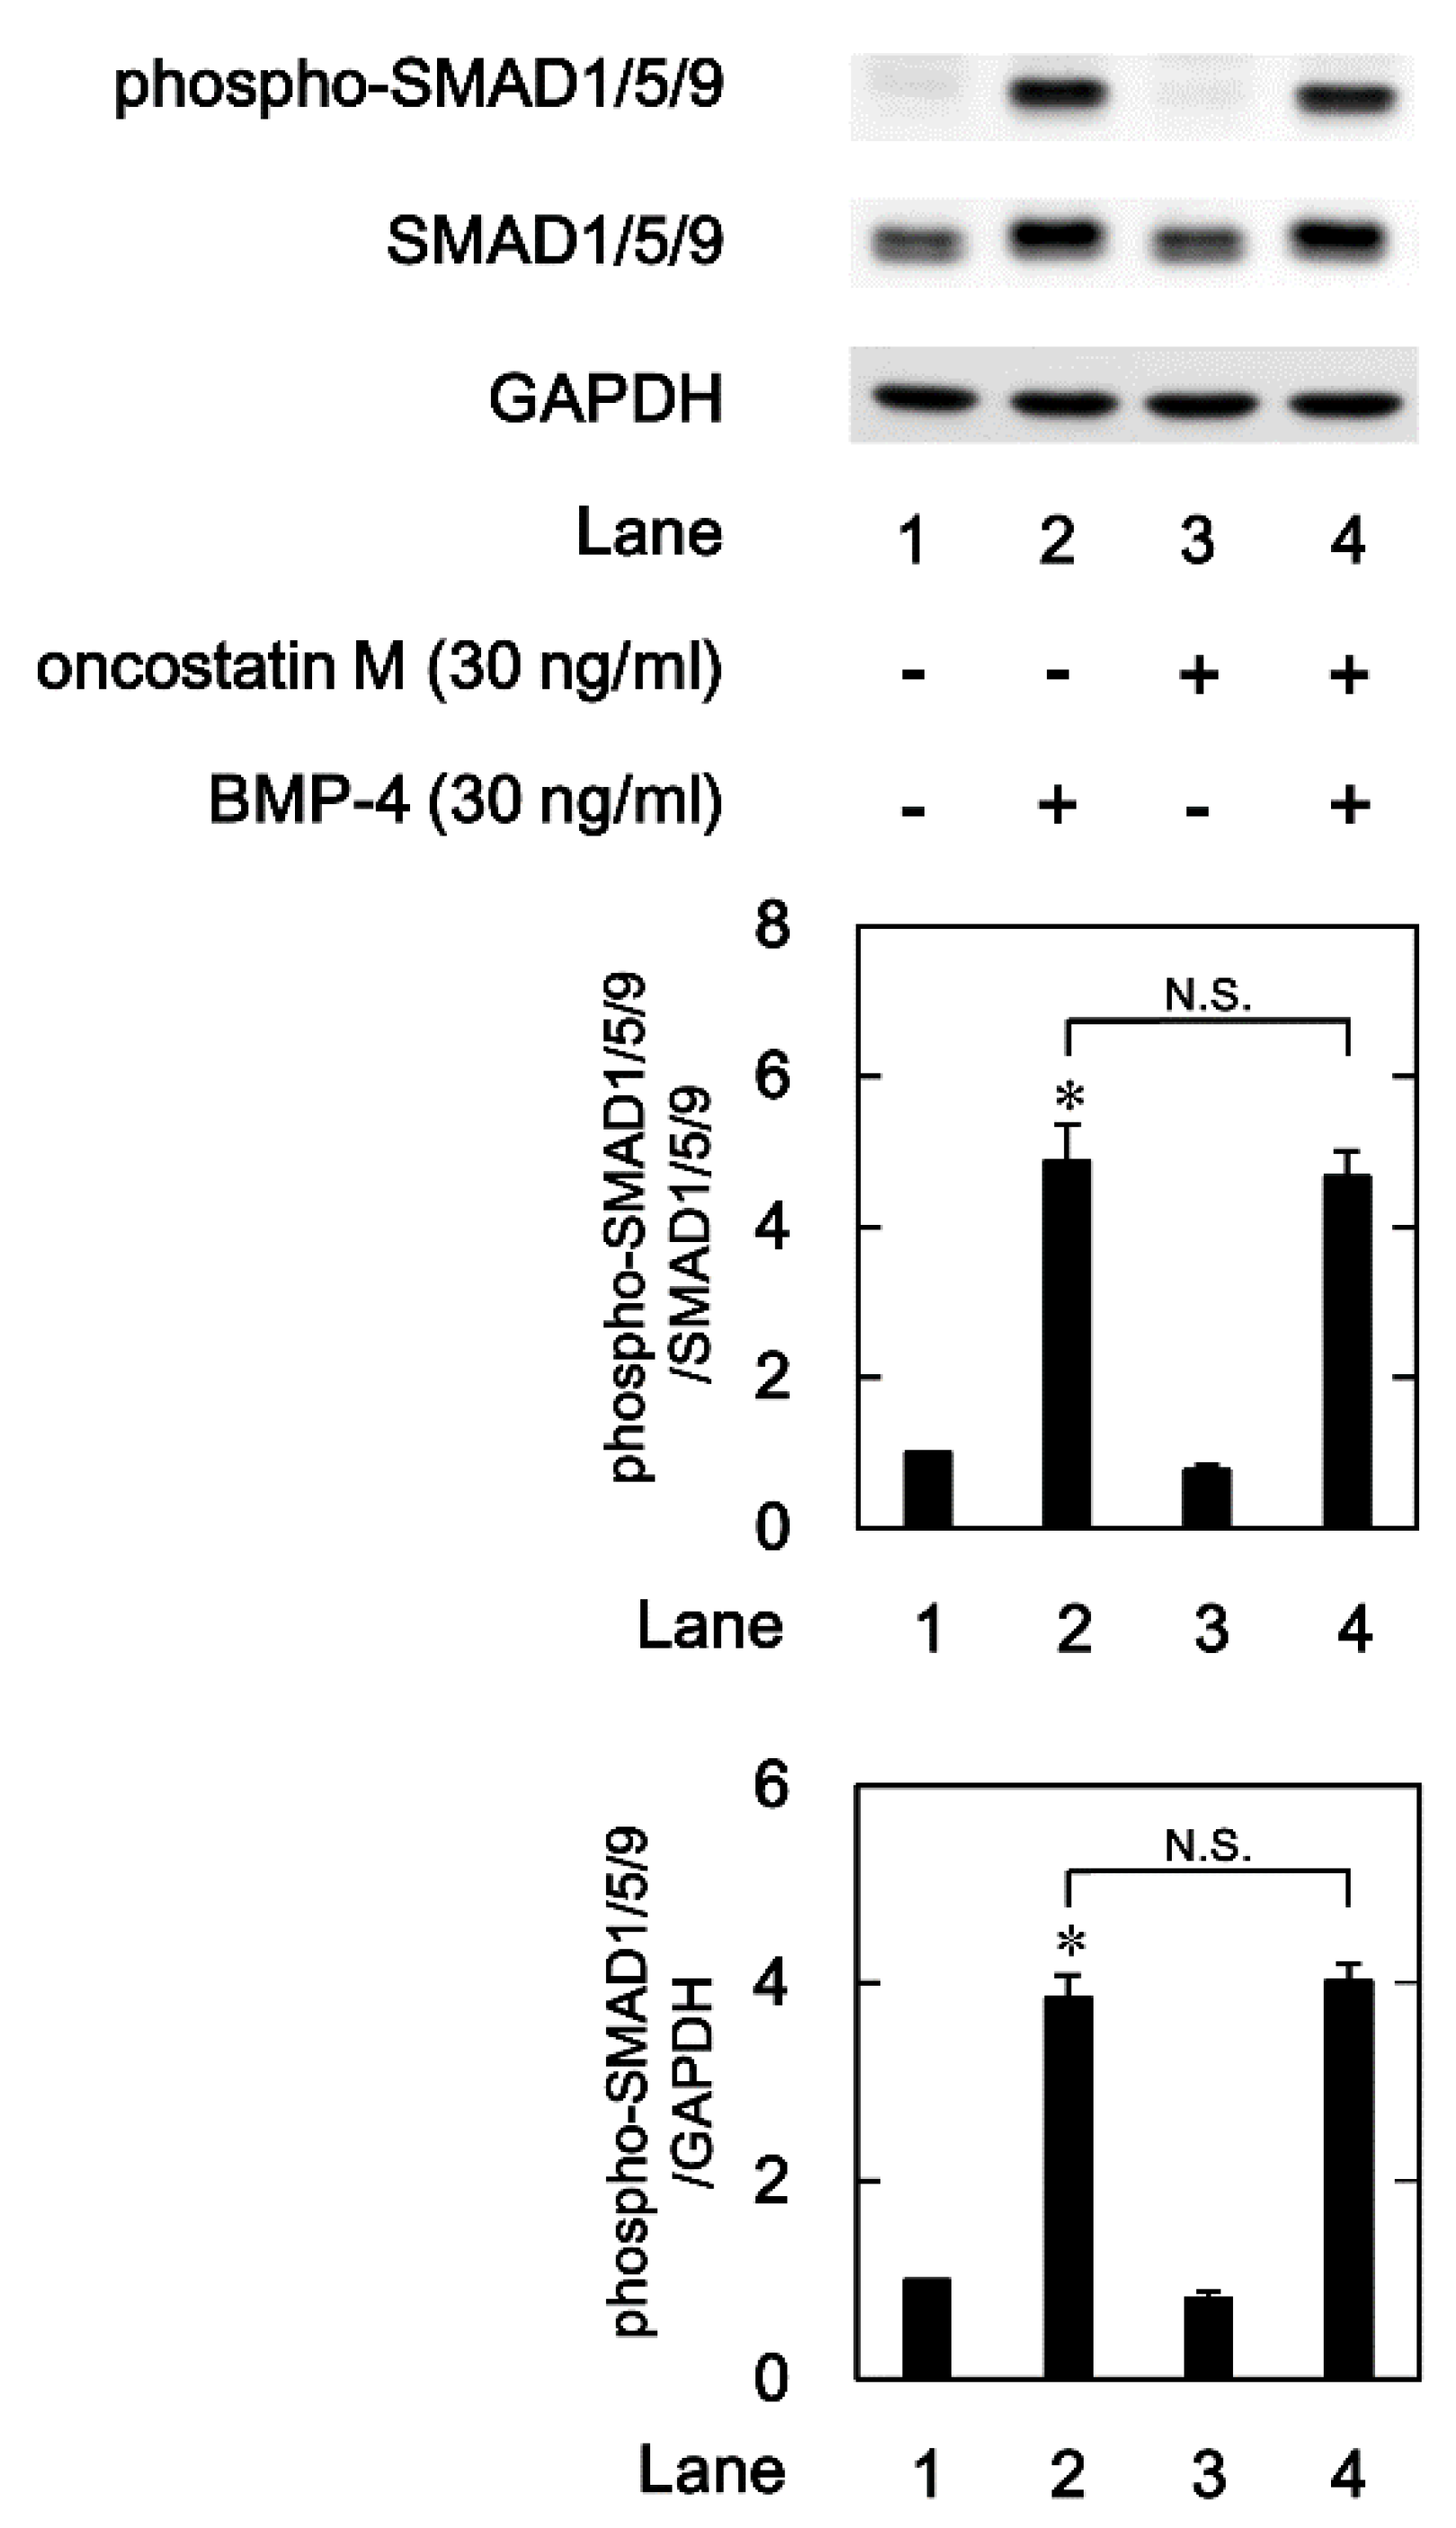
Figure 5.
Effect of OSM on the BMP-4-induced phosphorylation of p38 MAPK in MC3T3-E1 cells. The cultured cells were pretreated with 30 ng/ml of OSM or vehicle for 60 min, and then stimulated by 30 ng/ml of BMP-4 or vehicle for 90 min. The cell extracts were then subjected to SDS-PAGE and subsequent Western blot analysis with antibodies against phospho-specific p38 MAPK, p38 MAPK, and GAPDH. The histogram shows the quantitative representations of the levels of phosphorylated p38 MAPK after normalization with respect to with respect to p38 MAPK or GAPDH (lower panel) obtained from laser densitometric analysis. The levels were expressed as the fold-increase with respect to the basal levels presented in lane 1. Each value represents the mean ± SEM of triplicate determinations from three independent cell preparations. *p < 0.05, compared to the value of the control. N.S, designates no significant difference between the indicated pairs.
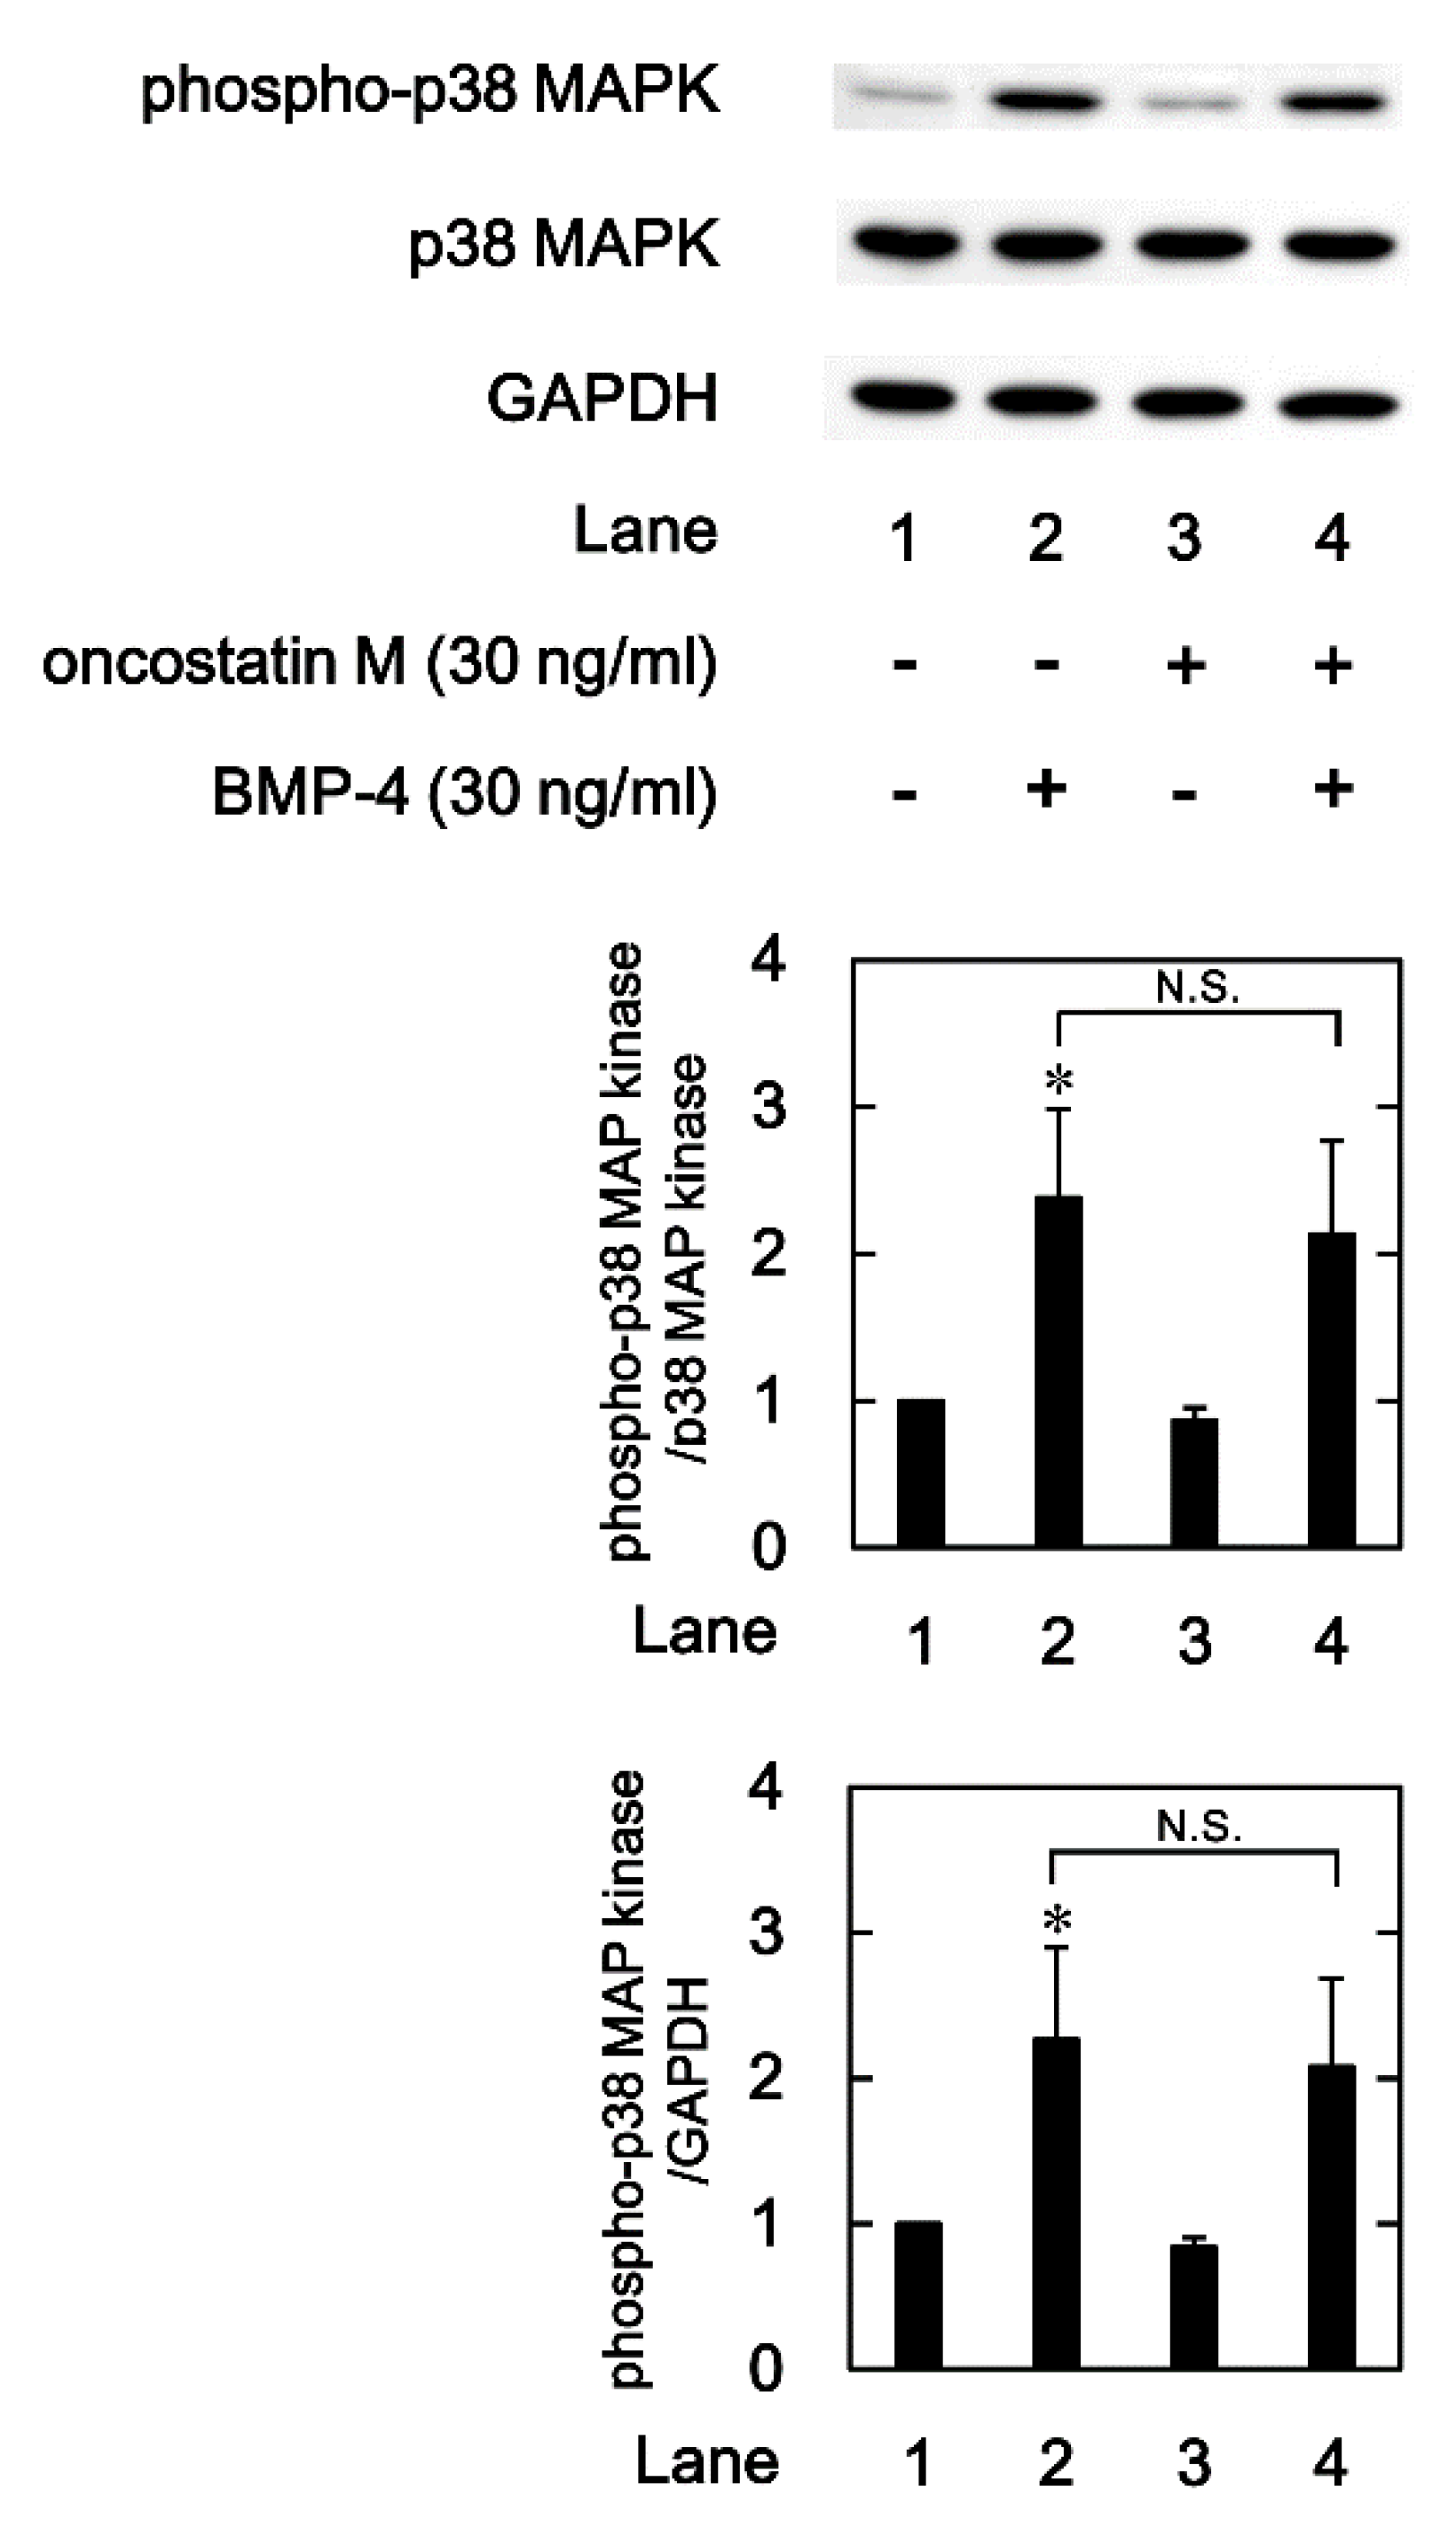
Figure 6.
Effect of OSM on the BMP-4-induced phosphorylation of p70 S6 kinase in MC3T3-E1 cells. The cultured cells were pretreated with 30 ng/ml of OSM or vehicle for 60 min, and then stimulated by 30 ng/ml of BMP-4 or vehicle for 120 min. The cell extracts were then subjected to SDS-PAGE and subsequent Western blot analysis with antibodies against phospho-specific p70 S6 kinase, p70 S6 kinase, and GAPDH. The histogram shows the quantitative representations of the levels of phosphorylated p70 S6 kinase after normalization with respect to with respect to p70 S6 kinase or GAPDH (lower panel) obtained from laser densitometric analysis. The levels were expressed as the fold-increase with respect to the basal levels presented in lane 1. Each value represents the mean ± SEM of triplicate determinations from three independent cell preparations. *p < 0.05, compared to the value of the control. **p < 0.05, compared to the value of BMP-4 alone.
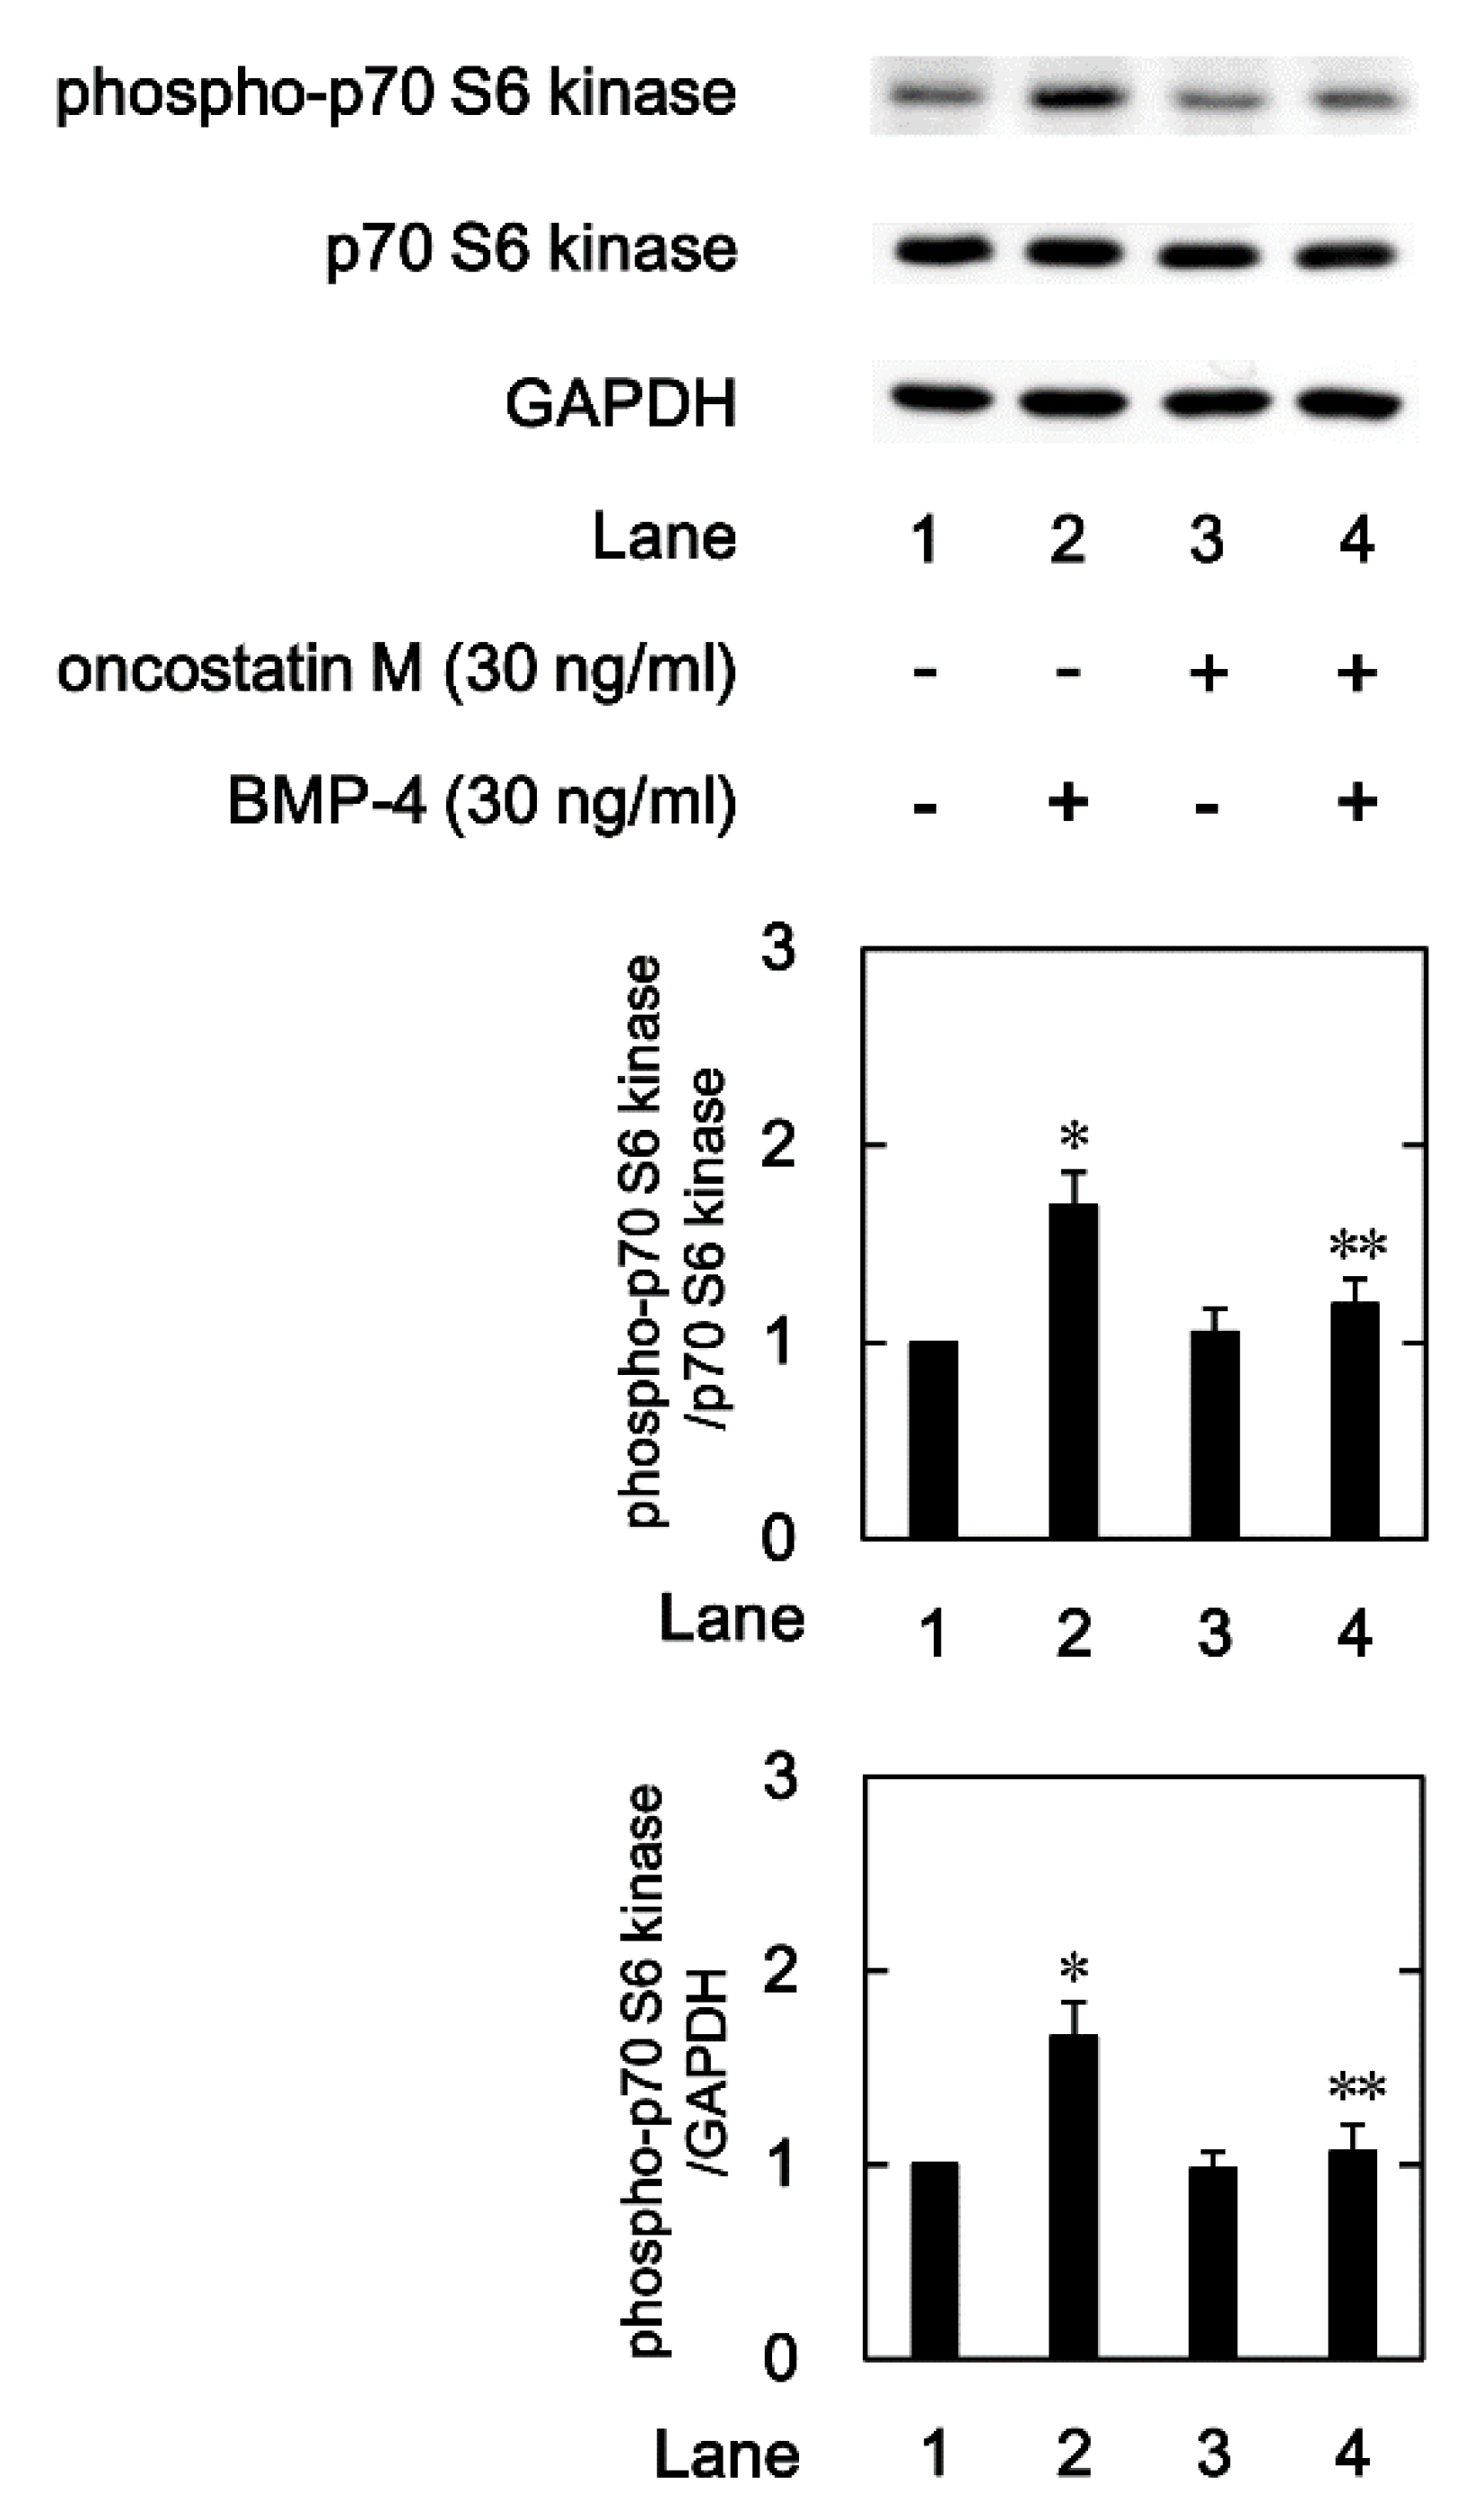
Figure 7.
Schematic illustration of the mechanism underlying suppressive effect of OSM on the BMP-4-induced OPG synthesis in osteoblast-like cells. OSM can suppress BMP-4-induced OPG synthesis in osteoblast-like cells, which is exerted at a point upstream of p70 S6 kinase. BMP-4, bone morphogenic protein-4; MAPK, mitogen-activated protein kinase; OPG, osteoprotegerin.
Disclaimer/Publisher’s Note: The statements, opinions and data contained in all publications are solely those of the individual author(s) and contributor(s) and not of MDPI and/or the editor(s). MDPI and/or the editor(s) disclaim responsibility for any injury to people or property resulting from any ideas, methods, instructions or products referred to in the content. |
© 2024 by the authors. Licensee MDPI, Basel, Switzerland. This article is an open access article distributed under the terms and conditions of the Creative Commons Attribution (CC BY) license (http://creativecommons.org/licenses/by/4.0/).
Copyright: This open access article is published under a Creative Commons CC BY 4.0 license, which permit the free download, distribution, and reuse, provided that the author and preprint are cited in any reuse.


