
Submitted:
29 December 2023
Posted:
30 December 2023
You are already at the latest version
Abstract
Printed circuit boards (PCBs) make up 3 to 5% of all electronic waste. The metal content of spent PCBs can reach 40%. They usually contain valuable metals - Ag, Au, Pd, as well as other metals such as Cu, Sn, Pb, Cd, Cr, Zn, Ni and Mn. However metallic part of whole PCB is 40-60% including Cu layers between the fiberglass-polymer layers. The paper describes economics of the the valuable metals (Ag, Au, Pd) containing concentrate preparation from raw PCB. Considered the influence of pre-treatment method of PCB before the extraction of valuable metals on the extraction self-cost change. The disintegration method is based on the high-energy impact of the particles of the material to be ground, thus causing the separation of the metallic components of the PCB. In the course of the work, single and double direct grinding by the method of disintegration was studied. For the calculation the test batch 10’000 kg of two types of PCB were taken for estimation of the self costs and potential profit in case of complete valuable metals (Ag, Au, Pd) plus Cu extraction. Is shown that from 10’000 kg of studied PCB is possible to obtain 1144 and 1644 kg of metal-rich concentrate, which further should be subjected to electro-hydrochlorination for metals leaching. The main findings shows, that despite of high content of Cu in studied PCB, the commercial value is insignificant in total income from the Ag, Au and Pd sale. Was established correlation of the self-cost decrease after separative disintegration of PCB by metal content increase (by specific metals such as Au, Ag, Pd and also Cu) with the metal potential yield after extraction.
Keywords:
waste printed circuit boards
; PCB
; recycling
; disintegrator milling
; separation
; precious metals
; recovery
; self-costs
1. Introduction
This, 2023 year, it is estimated that the worldwide amount of waste electronic and electrical equipment (WEEE) will reach 57.4 million metric tons [1]. From these, waste printed circuit boards (PCBs) represent the most economically attractive portion and account for about 3% of the total E-waste [2]. The Global E-waste Monitor 2020 reported that in 2019, approximately 53.6 million metric tons of WEEE were generated, showing a 21% increase over a five-year period since 2014. If this trend continues, it is predicted that e-waste will reach 74 million metric tons by 2030. This indicates an annual growth of 2 million metric tons, or around 3 to 4% annually. The problem is largely attributed to higher rates of electronic consumption, increasing by about 3% each year, along with shorter product lifecycles and limited repair options [3].
In Europe, where e-waste is extensively studied, it is estimated that an average household has 11 out of 72 electronic items that are either no longer in use or broken. Additionally, each European citizen hoards another 4 to 5 kilograms of unused electrical and electronic products annually before eventually discarding them. These figures highlight the scale of the e-waste problem within Europe and the need for proper management and disposal of electronic devices [4]. In our rapidly advancing world of science and technology, the proliferation of electronic products has increased significantly. However, this trend has also contributed to the accelerated obsolescence of these products, resulting in a substantial amount of electronic waste (e-waste) [5]. Currently, e-waste production worldwide stands at 40-50 million tons per year, with an annual increase of 5 million tons [6]. Waste printed circuit boards (WPCBs), which constitute 4-7% of the total e-waste mass, play a critical role in electronic products [7]. Unfortunately, WPCBs are also the most complex and hazardous components of e-waste, containing toxic heavy metals (such as Pb, Cr, Cd, Hg) and toxic organic substances (such as brominated flame retardants and polycyclic aromatic hydrocarbons) [8,9]. The accumulation and persistence of these substances in the environment pose a significant threat to both ecosystems and human health [10,11]. Without proper treatment, these pollutants can cause severe environmental damage.
However, WPCBs also present an opportunity for resource recovery, as they contain valuable metals like copper (Cu), tin (Sn), iron (Fe), nickel (Ni), and zinc (Zn), as well as precious metals like gold (Au) and silver (Ag). The metal content in WPCBs, particularly precious metals, exceeds that of primary mineral resources, making their recycling economically, socially, and environmentally beneficial [12]. The complex composition and structure of WPCBs make their recycling challenging. The process typically involves the pretreatment of WPCBs, separating the electronic components (ECs) from the boards, and then subjecting both the ECs and waste PCBs to various recycling processes, such as mechanical-physical methods, hydrometallurgy, and pyrometallurgy [13,14,15,16].
While there is ample research on the recycling of WPCBs and waste PCBs, less attention has been paid to the specific recycling of waste ECs. Waste PCBs contain hundreds of ECs, like IC chips, resistors, and capacitors, many of which retain their functionality despite the overall loss of function of the PCB. Even though WPCBs no longer serve their primary function, a significant number of waste ECs are still usable. This is because the average lifespan of ECs is around 20,000 hours, which is less than 5% of their intended lifespan of 500,000 hours [12]. These waste ECs still hold recycling value, with some chips having higher value than tons of WPCBs. Moreover, certain waste ECs house a significant portion of the rare metal resources found in WPCBs. For example, tantalum capacitors consist of 30-40 wt% of tantalum, while multilayer ceramic capacitors are enriched with palladium (Pd), and memory chips contain predominantly gold (Au) [17,18,19]. However, the composition of waste ECs is more complex than that of waste PCBs, often containing toxic substances, and thereby requiring specialized treatment processes.
To determine whether the concept of in-situ utilization is applicable universally or not, this article aims to address these questions through a comprehensive analysis and economical modelling, based on real cases. The analysis is based on a thorough review of relevant studies obtained from reputable databases including Web of Science, Scopus, and Google Scholar. The search for relevant studies was conducted using specific keywords such as e-waste, waste ECs, dismantling, sorting, WPCB, pollutant release, and recycling. After carefully reviewing the articles, we are noticed, that no significant attention was paid to pretreatment methods economics assement. Furthermore, we have also taken into consideration recent review articles on the topic of waste ECs recycling. However, we found that only two review articles were available, both of which primarily focused on pretreatment methods - dismantling techniques and metal separation technologies [20,21]. Unfortunately, other critical aspects of EC recycling, such as pollutant release and treatment, high-value recycling, environmental and economic analyses, and typical pilot recycling processes, have not been thoroughly reviewed in the existing literature. This highlights the need for a comprehensive review that covers these underexplored areas in order to provide a more holistic perspective on waste EC recycling.
This emphasizes the necessity of conducting a thorough investigation into the pretreatment of PCB and conducting economic assessments of this particular aspect. By addressing this relatively unexplored area, we will be able to offer a comprehensive and well-rounded approach to waste EC recycling. This research will contribute to a better understanding and implementation of efficient recycling methods in the future.
1.1. Precious metals price tendency
Over the past three years, the prices of precious metals, such as silver (Ag), gold (Au), and palladium (Pd), have experienced varying trends. From 2019 to early 2020, the price of silver remained relatively stable, with some minor fluctuations (Figure 1). However, in March 2020, as a result of the global pandemic and economic uncertainties, the price of silver experienced a significant decline. Following this drop, silver steadily increased in value throughout the rest of 2020 and into 2021, reaching new highs driven by increased industrial demand, investor interest, and inflation concerns.
Gold, on the other hand, showed a generally upward trend over the past three years Figure 2. In 2019, gold had a modest price increase, reaching new highs in mid-2020 due to the pandemic-induced economic uncertainties. The metal continued to perform well throughout 2020, driven by low-interest rates, a weaker US dollar, and safe-haven demand. However, as the global economy began recovering in 2021, gold experienced some price corrections, but it still maintained strong investor interest as a hedge against inflation and a store of value.
Palladium had a remarkable price surge over the past three years. In 2019, the metal experienced a significant increase in value, driven by increasing demand from the automotive industry for catalytic converters Figure 3. This trend continued into 2020, with palladium reaching all-time highs due to supply deficits and stringent emission regulations. However, in 2021, palladium faced some price corrections as automakers looked for alternatives and supply constraints eased. This impacts prices more significantly in 2023 – the price rapidly decreased from 75 to 35 Euro per gram Figure 3. Nonetheless, palladium remains a valuable and sought-after precious metal.
It's important to note that the prices of precious metals are influenced by a variety of factors, including economic conditions, geopolitical events, supply and demand dynamics, and investor sentiment. Therefore, these trends provide a general overview of their price tendencies but analyzing the long-term tendency in a 10-year period is clearly shows almost double price growth in comparison with 2013.
1.2. Electronic Waste Composition and Statistics
In 2020 the E-waste monitor reported that estimated 53.6 Mt of WEEE was generated in year 2019 in the world, out of which only about 9.29 Mt were documented for recycling [25]. The EU generated around 12 Mt of WEEE in the same year, out of which only 5.1 Mt or 42.5% on average was documented for recycling.
In 2019, the majority of electronic waste was generated in Asia, amounting to 24.9 million metric tons. On the other hand, Europe had the highest per capita e-waste generation rate, with each person contributing 16.2 kilograms of e-waste [26]. These figures represent 9.4% and 8.8% of the global total, respectively. Interestingly, Africa, despite ranking last in overall e-waste generation, had the highest documented formal e-waste collection and recycling rate at 42.5% [26]. This indicates that African countries have implemented effective systems for collecting and recycling e-waste, even with lower overall generation levels. In contrast, on all other continents, the amount of e-waste that is officially collected and recycled is significantly lower than the estimated volume of e-waste generated. For example, in Asia, only 11.7% of the e-waste was formally collected and recycled in 2019 [26]. Similarly, the Americas and Oceania had relatively low rates, standing at 0.9%. It's important to understand that e-waste statistics can vary substantially across different regions due to various factors. These factors include income levels, policy frameworks, and the structure of waste management systems, among others.
Figure 4.
The percentage of e-waste per appliance type in the EU by BYCC 4.0 [27].
Figure 4.
The percentage of e-waste per appliance type in the EU by BYCC 4.0 [27].
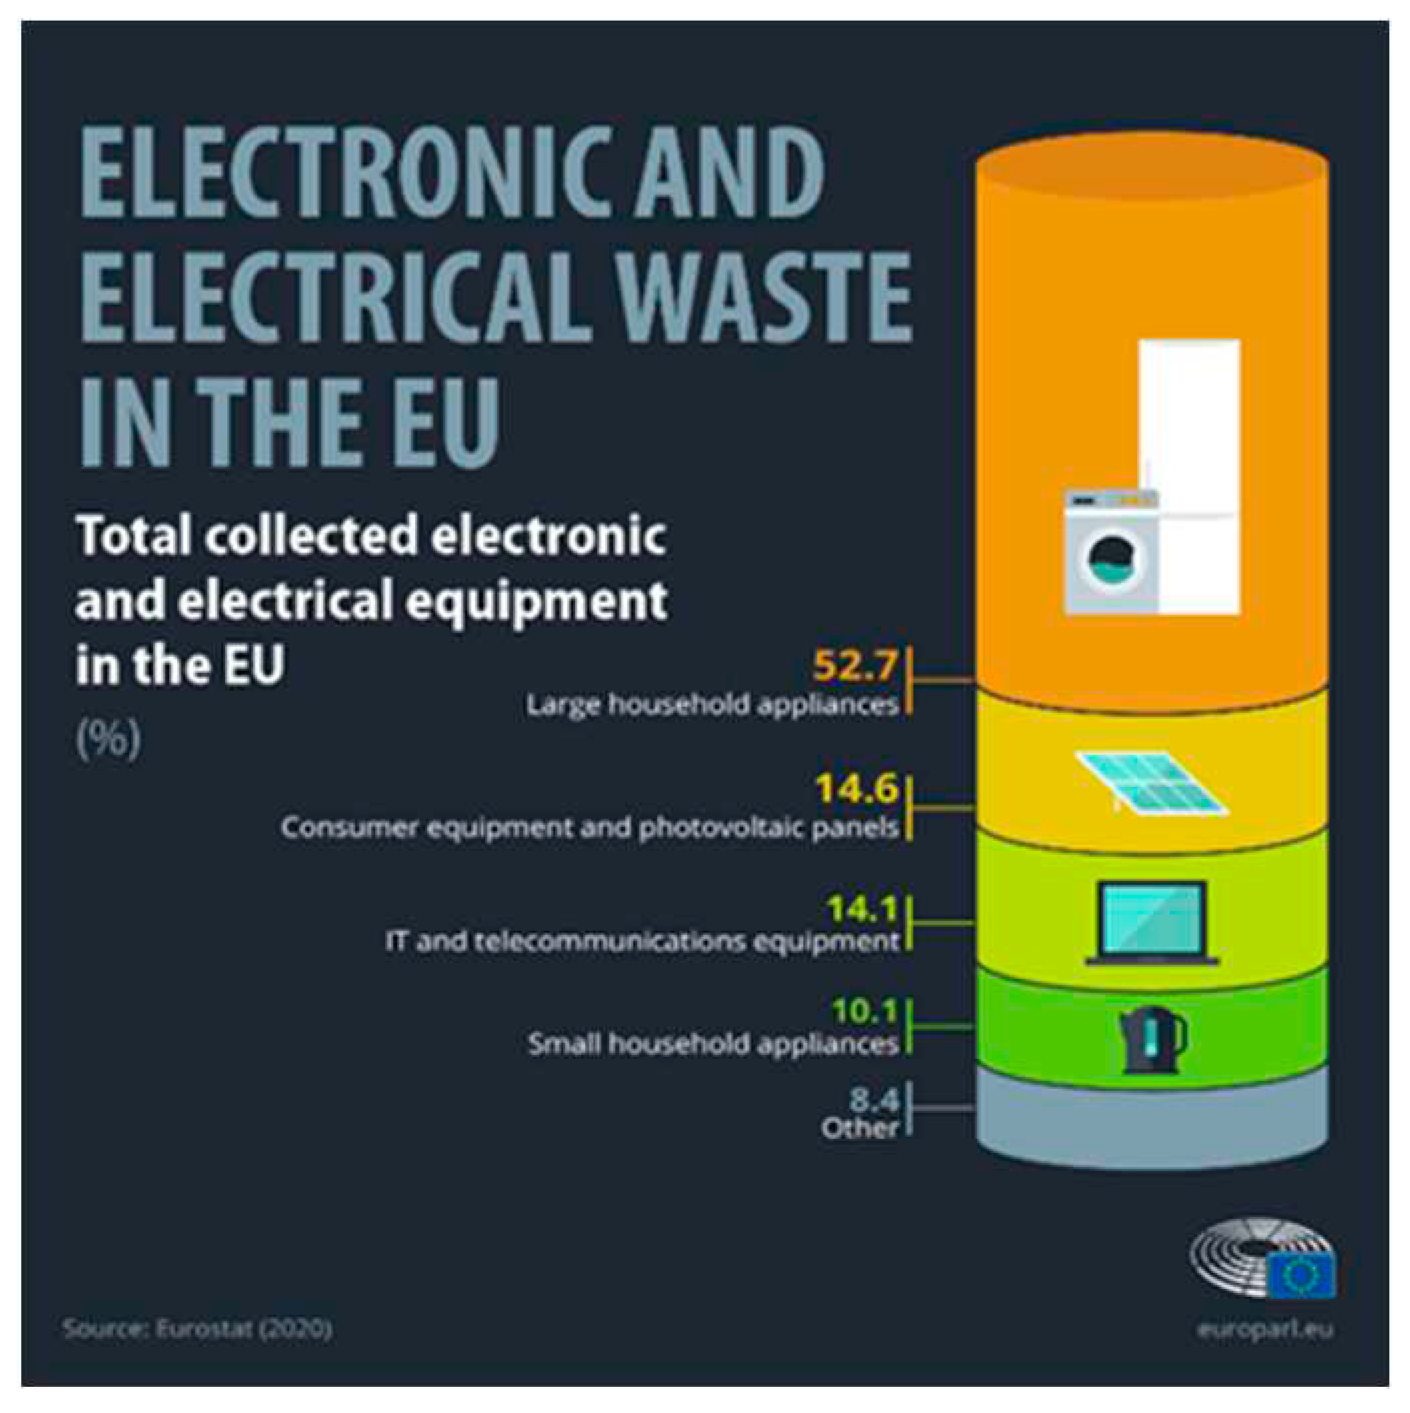
According to EU E-waste directive (2012/19/EU) [28], the E-waste is represented in 6 categories:
1. Temperature exchange equipment;
2. Screens, monitors, and equipment containing screens having a surface greater than 100 cm2;
3. Lamps;
4. Large equipment
5. Small equipment (no external dimension more than 50 cm)
6. Small IT and telecommunication equipment (no external dimension more than 50 cm)
Among the most priced components in WEEE are the waste PCB (WPCB) rich in rare and precious metals (RPMs) as well as base metals [29]. The WPCB in WEEE constitutes about 4%-7% from total WEEE weight, according to B. Gonzalez et al [30]. A detailed overview by elements of small IT and telecommunication equipment is given in Table 1. Higher-grade mines have densities of 8.0 to 10.0 g/t, while lower-grade mines have densities of 1.0 to 4.0 g/t. As follows from Table 1, Au concentration in the electronic waste (type 6) is for two-three orders of magnitude higher than in ores, reaching up to 1740 g·t–1. Moreover, this source of valuable metals is accumulated in industrial zones (cities) and does not need to move to extraction factories or a building new (in case of rich deposition). Use of waste for the recovery of valuable elements is known as urban mining [31].
1.3. Recovery Technologies
Recovering precious metals such as silver (Ag), gold (Au), and palladium (Pd) from PCB is an essential process in electronic waste recycling. Various technologies are employed to extract these valuable metals from PCBs. One common method is mechanical processing, where PCBs are shredded, crushed, and ground into fine particles. This allows for the separation of different components, including precious metal-bearing parts.
Mechanical processing is often considered one of the stages of pre-processing after preliminary disassembling, dismantling, and further recovery of valuable materials/metals. Mechanical processing includes chopping, shredding, crushing, milling, etc. These are followed by various separation methods based on the difference in properties between metallic and non-metallic components, such as magnetic separation, eddy current separation, separation based on density and electrical conductivity, etc. [33,34,35,36]. In addition, the use of selective flotation can be a good alternative to traditional separation methods, especially for the separation of plastic components in electronic waste [37].
Subsequently, hydrometallurgical techniques such as leaching are employed to dissolve the metals from the PCB materials. Acid or cyanide-based solutions are often used to selectively extract the precious metals. Once the metals are in solution, they can be further purified and recovered through processes like precipitation, electrolysis, or ion exchange. Advanced methods, such as bioleaching using microorganisms, have also shown potential for precious metal recovery from PCBs. These technologies contribute to the efficient and sustainable utilization of precious metals, reducing the need for primary mining and minimizing environmental impacts associated with. Table 2 summaries most spread pre- treatments methods and associated with advantages and disadvantages.
By authors understanding, summarizing the literature data and practical experience by EIT RawMaterials ”RENEW: recycling of epoxies from e-waste” project implementation proposed end-of life EEE and WEEE materials flow chart by stages (Figure 5).
The whole sequence can be segmented into five stages (gates 0-4):
- Gate 4 – 0 (consumers market);
- Gate 0-1 End-of-Life (EoL) consumers goods collection and sorting into EoL Electronic and Electric Equipment (EEE) for reuse and WEEE for recycling (or disposal);
- Gate 1-2 WEEE pre-treatment and disassembly to its basic components, removing hazardous and directing recyclable components to materials (metals, plastics, etc.) recovery.
- Gate 2-3 E-scrap feedstock pre-treatment generally performed either at WEEE pre-treatment facilities or at raw materials recovery facilities (e.g. metallurgy). At this stage the components are being break down to the basic materials and sorted into fractions (concentrates).
- Gate 3-4 Secondary raw materials recovery (re-, up-, downcycling) through metallurgy, plastics remelting or ceramics recycling, etc.
1.4. Electronic Waste availability (accumulated quantity) by markets
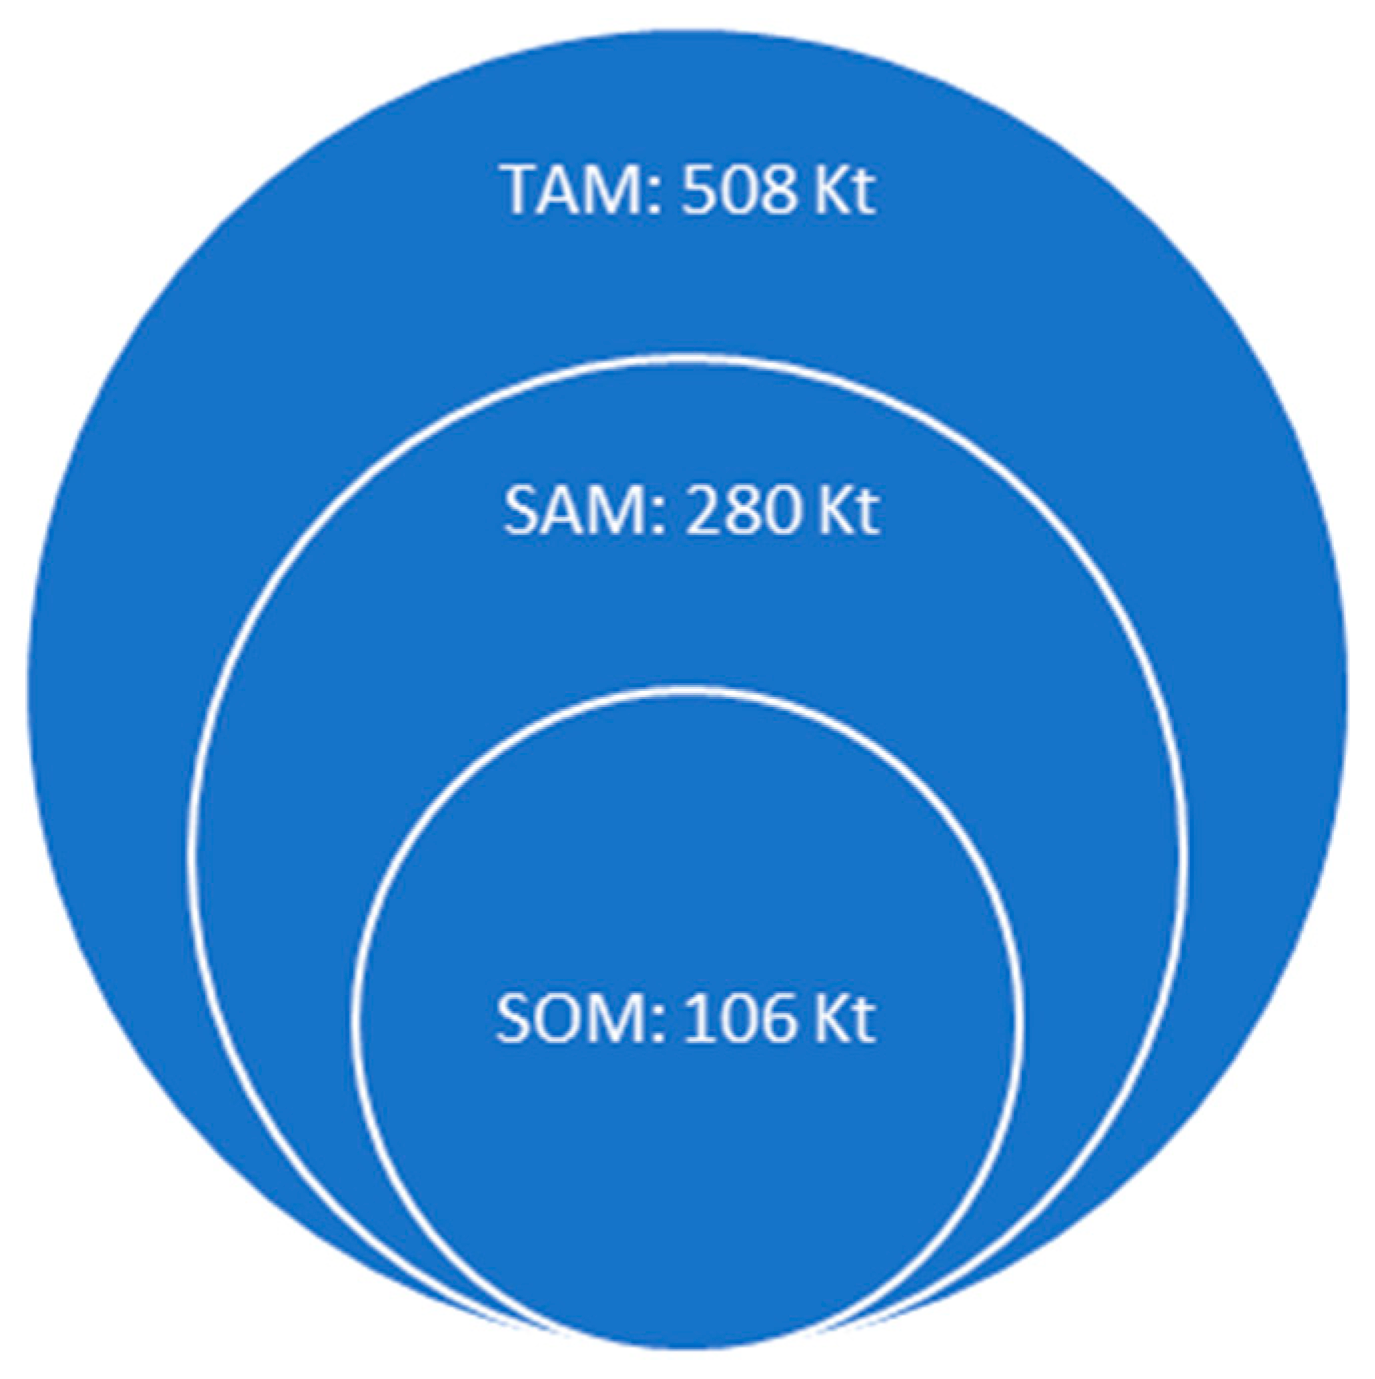
Market segmentation for the WPCB pre-treatment for further metals recovery utilizing pyro- and hydrometallurgical means:
Figure 6.
Assuming WPCBs form 4-7% (5.5% average) from total WEEE collected for recycling weight. TAM: World WPCBs e-scrap; SAM: EU WPCBs e-scrap; SOM: Baltic sea region (Nordics, Baltics, Germany, Poland) [26].
Figure 6.
Assuming WPCBs form 4-7% (5.5% average) from total WEEE collected for recycling weight. TAM: World WPCBs e-scrap; SAM: EU WPCBs e-scrap; SOM: Baltic sea region (Nordics, Baltics, Germany, Poland) [26].
In this research, we have used a literature review to collect data on existing methods of PCB recycling, identifying the capacity of the market, types of PSBs and recycling methods. Based on the collected data we have made our own case study on PCB pre-treatment. This qualitative research method can provide valuable insights and real-world examples. This investigation seeks to bridge the knowledge gap and provide valuable in-sights that will facilitate a more profound understanding of the intricacies involved in efficient recycling methods. Ultimately, the outcomes of this research hold the potential to not only enhance our comprehension but also to drive the practical implementation of sustainable and economically viable recycling solutions in the future.
It is very important to note that in the article , the authors examine metal concentrates that accumulate in fine metal-rich fractions (less than 350 microns), which are obtained by disintegratingthe PCB. Attention was paid to the economy of extraction of precious metals by electrochemical methods in combination with disintegration as pre-treatment. However, it is worth considering that simultaneously with this process, the accumulation and concentration of metal components occurs in coarse fractions, which were separated and were not further studied here. In addition to precious metals, these large fractions also contain a number of other valuable elements, such as non-ferrous metals (Cu, Ni, Zn, Pb, Sn, etc.), the extraction and return of which to the market will increase the added value of PCB processing and, accordingly, the attractiveness of their processing. The main goal of the paper is to estimate total energy consumption for developed technology (milling and leaching) and determine the reasonability of further research and development. The novelty of this research lies in the fact that a technical and economic analysis has been carried out on a newly developed combined technology for processing electronic waste. Which includes mechanical processing and electrochemical leaching with the help of active chlorine that is formed in-situ. The real (not specially selected or prepared) wast PCB were used for the process economic efficiency evaluation.
2. Materials and Methods
In this work, the authors consider only the cost of electricity, labor costs for PCB pre-treatment- valuable metals leachate preparation. When calculating the full estimate of the cost of such processing, it will also be necessary to add the cost of repairing the rotors (compensation for wear of milling impact bodies/impact elements).
The cost of repairing rotors depends on many factors, such as the finger material (hard alloy, hard-alloy surfacing), metal concentration in the PCBs, impact velocities, etc.) This issue will require additional research, selection of the optimal grinding-separation process, and is a topic for a future article.
For the self-cost estimation of the innovative approach, PCB complex pre-treatment, which includes selective disintegration [49] and electrochemical metal leaching - electro-hydro-chlorination (alternating current action in hydrochloric acid electrolytes) [50,51], was used previously approved and in detail described in the studies [49,50,51]. PCBs are subjected to disintegration once as raw materials. Obtained particles smaller than 2.8 mm were subjected to a metal analysis study and designated as X1 (Figure 7). Subsequently, particles bigger than 2.8 mm were subjected to repeated milling and designated as X1(>2.8)+X2 (see Figure 7). Figure 7 represents the PCB milling scheme. The Figure 8 and Figure 9 show studied PCB P3 and P4 as supplied and after milling.
To establish metal content the chemical treatment (leaching) of three representative samples (0,500 g each) was carried out. The electrochemical hydrochlorination was carried out according to developed technology, where active chlorine is generated in situ during the alternate current electrolysis [49,50]. ICP-OES was used for the quantitative determination of metal content in electrolyte solutions obtained as a result of electrochemical leaching. Based on the results of the analysis, an average concentration of each metal under study was calculated.
3. Results
Valuable metal content strongly depends on the raw PCB nature (type of the electronics, year of it’s production and other). To analyze expected economic effect authors analyzed two cases of the different PCB type. First -a computer mother boards and a second -a mixed PCB (Figure 8 and Figure 9).
According to our previous research [49,50] using pretreatment - a mechanical disintegration of the PCB, and using for the valuable metals extraction fractions with its highest concentrations - > 90, 90-180 and 180-350 um particles size. The fractions, fractions content to whole PCB (Raw PCBs) and metal content in wt.% are given by fractions and fraction part from initial PCB amount in the Table 1. For the one industrial batch simulation 10000 kg of raw PCB was taken for estimation. P3-1, P3-2, P4-1 and P4-2 correspond to PCB P3 and P3 for primary and secondary milling respectively.

Table 3.
The Ag, Au, Pd and Cu content in P3 and P4 concentrate in mass % and absolute amount in kg for the industrial batch simulation of 10000 kg of raw PCB.
Table 3.
The Ag, Au, Pd and Cu content in P3 and P4 concentrate in mass % and absolute amount in kg for the industrial batch simulation of 10000 kg of raw PCB.
| Raw material powder P3-1 (Motherboard, single crushing) | ||||||||||
| Fraction size, µm | Fraction from raw PCB, % | Metal content in the fraction, % | Metal content in kg in test batch of 10000 kg | |||||||
| Ag | Au | Pd | Cu | Ag | Au | Pd | Cu | |||
| ˂90 | 7.100 | 0.086 | 0.0016 | 0.0002 | 1.796 | 0.6106 | 0.01136 | 0.0014 | 12.752 | |
| 90-180 | 0.900 | 0.0824 | 0.0002 | 0.0004 | 8.382 | 0.0742 | 0.00018 | 0.0004 | 7.544 | |
| 180-350 | 1.400 | 0.0682 | 0.0002 | 0.001 | 16.836 | 0.0955 | 0.00028 | 0.0014 | 23.570 | |
| 0.780 | 0.012 | 0.003 | 43.866 | Totall P3-2, kg | ||||||
| Raw material powder P3-2 (Motherboard, double crushing) | ||||||||||
| Fraction size, µm | Fraction from raw PCB, % | Metal content in the fraction, % | Metal content in kg in test batch of 10000 kg | |||||||
| Ag | Au | Pd | Cu | Ag | Au | Pd | Cu | |||
| ˂90 | 0.795 | 0.076 | 0.003 | 0 | 0.407 | 0.060 | 0.0024 | 0 | 0.324 | |
| 90-180 | 0.409 | 0.116 | 0.003 | 0.001 | 5.476 | 0.047 | 0.0012 | 0.00041 | 2.240 | |
| 180-350 | 0.841 | 0.127 | 0.001 | 0.002 | 14.837 | 0.107 | 0.0008 | 0.00168 | 12.478 | |
| 0.215 | 0.004 | 0.002 | 15.041 | Totall P3-2, kg | ||||||
| 0.995 | 0.016 | 0.005 | 58.907 | Sum of P3-1 and P3-2, kg | ||||||
| Raw material powder P4-1 (Mixed PCBs, single crushing) | ||||||||||
| Fraction size, µm | Fraction from raw PCB, % | Metal content in the fraction, % | Metal content in kg in test batch of 10000 kg | |||||||
| Ag | Au | Pd | Cu | Ag | Au | Pd | Cu | |||
| ˂90 | 3.600 | 0.97 | 0.1 | 0.17 | 1.75 | 3.492 | 0.360 | 0.612 | 6.300 | |
| 90-180 | 2.100 | 0.56 | 0.02 | 0.1 | 2.69 | 1.176 | 0.042 | 0.210 | 5.649 | |
| 180-350 | 3.200 | 0.51 | 0.01 | 0.04 | 6.1 | 1.632 | 0.032 | 0.128 | 19.52 | |
| 6.300 | 0.434 | 0.950 | 31.469 | Totall P4-1, kg | ||||||
| Raw material powder P4-1 (Mixed PCBs, double crushing) | ||||||||||
| Fraction size, µm | Fraction from raw PCB, % | Metal content in the fraction, % | Metal content in kg in test batch of 10000 kg | |||||||
| Ag | Au | Pd | Cu | Ag | Au | Pd | Cu | |||
| ˂90 | 3.145 | 0.46 | 0.03 | 0.02 | 2.06 | 1.447 | 0.094 | 0.063 | 6.479 | |
| 90-180 | 1.501 | 0.45 | 0.01 | 0.01 | 4.29 | 0.675 | 0.015 | 0.015 | 6.438 | |
| 180-350 | 2.900 | 0.09 | 0 | 0 | 6.84 | 0.261 | 0 | 0 | 19.839 | |
| 2.383 | 0.109 | 0.078 | 32.757 | Totall P4-2, kg | ||||||
| 8.683 | 0.543 | 1.028 | 64.26 | Sum of P4-1 and P4-2, kg | ||||||
For the price estimation as example were taken 10 metric tons (10 000 kg) of PCB. For the pre-treatment of 10 t of PCB is necessary spent for the first stage of milling (P3-1 and P4-1), by formula (1):
Where is M – treated material quantity, in tonnes; Emil – milling specific energy, in kWh/t; Eabs – absolute milling energy, in kWh. For 10 tones it’s results 160 kWh. By current price 0.16 Euro/kWh including VAT 21% (local energy provider ENEFIT Ltd.) will gives (160 kWh x 0.16 Euro/kWh) 25.60 Euro. For the second stage of the milling (P3-2 and P4-2), the 9.2 tons (0,8 t was separated) of material after first milling by formula (1) it is results (9.2 t x 16 kWh/t) = 144 kWh. In current price it will gives (144 kWh x 0.16 Euro/kWh) 23.04 Euro. Additionally, are added to this a conveyor 0.64 kWh/t and screening (1.15 kWh/t) energy consumption (0.64+1.15) x (10 t + 9.2 t) = 34.36 kWh, or 5.50 Euro.
M × Emil = Eabs
According to the gained experimentally data, extrapolating it to 10 tons of raw PCB, after milling and separation for further extraction is separated 1144,0 kg (form P3 sample) and 1644,0 kg (from P4 sample) of concentrated milled PCB will be prepared.
The next stage is elctro-hydrochlotination of milled PCB in electro-chemical for metal transferring into soluble salts (leaching) at two conditions set: a) time 2 h, I = 120 A, U=8 V, m PCBs = 0.250 kg, and b) time 1 h, I = 135 A, U=12 V, m PCBs = 0.250 kg. According to formula (2):
where I - current strength in A; U – voltage in V; T – process time in hours; M – treated material mass in kg and Eh-Cl – specific energy spent for the elctro-hydrochlotination process in Wh/kg. For the first case spent energy is 7.68 kWh/kg and for the second is 6.48 kWh/kg. The second case is more beneficial due to twice shorter processing time, but it leads to extensive heat emitting of the electrolyte and needs intensive cooling. Therefore, further efficiency estimation was taken first case - 7.68 kWh/kg. According to the formula (3):
where is M – treated material quantity, in kg; Ee-Cl – specific energy spent for the elctro-hydrochlotination process in kWh/t; Eabs – absolute energy in kWh spent for process. For the electro-chemical treatment process will consume: for P3-1+P3-2 is 7.68 kWh/kg x 1140 kg = 8755 kWh; or 1400 Euro. For P4-1+P4-2 is 7.68 kWh/kg x 1644 kg = 12626 kWh or 2020 Euro.
( I × U × T ) / M = Eh-Cl,
M × Eh-Cl = Eabs,
However, in further scale-up of the process is clearly seen the tendency of the decreasing of the electricity consumption per 1 kg: for the lab scale (time 2 h, m PCBs = 3 g, I = 8 A, U = 9.4 V) was noted 50 kWh/kg, but for 250 g of PCB it is for an order of magnitude is lower. Further electrolytic cell development and optimisation - electrode geometry optimisation and working volume geometry optimisation will lead to electric current consumption and overall price cost decrease.
The total self-cost of electricity for the PCB transferring into leachate will be 1445.14 Euro for P3 and 2074.14 Euro for P4.
Additionally, human resource: 2 men-working days for mechanical treatment (200 €) and 4 men-working days for electro-hydro-chlorination process (400-600 €).
Table 4 provide an estimation of theoretically possible metals market value in pure form obtained by developed technology.
Challenges and Obstacles:
As can be seen from Table 4 in case of 100% (in real cases it is 85-95%) of metal extraction is possible to recover valuable metals for 2199 Euro in case of P3 and for 72632 Euro in case of P4 PCB. Taking into account that potential income, the preparation of leachate concentrate self-cost only slightly covered by potential metal selling price: 1645€ vs 2199€. In case of use this of this material it will give a negative economic effect from the company-recycler. In contrast with PCB P4 example, were is sales price is greater for 27 times higher than leachate preparation self-cost: 2674 vs 72632€.
As can be seen at Table 3, the amount of Cu amount in the concentrate is gignificant, as in wt. % as in absolute amount - 471.26 and 513.81 kg for P3 and P4 respectively. However, analysing the possible income (Table 4) form Cu sales it is not a significant weigh (513.81 € or 0.7%) from potential income (72632.59 €) in case P4, which is commercially reasonable. In case of P3 it is 21%, but as was discussed above, use of P3 type raw material is commercially unfavorable.
Taking into account that this research and technology validation for the moment finished at metal-rich leachate obtain, without further separation ant metal purification. The final product is metal-rich leachate, which couldn’t be sold by pure metal prise. The general calculation of the return on investment of the studied technology, was carried out.
Our main assumptions: as a base scenario the selling precious metals concentrate price is a 50% of their market value in pure form. Table 5 provide an estimation of theoretically possible key parameter. For the calculation was taken raw material similar to P4 (Table 4)
The main assumption is that precious metals concentrate is 50% of their market value in pure form. Taking into account that the price of the extracted metals can fluctuate, we have provided the graph on possible profit/loss scenarios if extracted materials price drops from 50% to 20% from the market price. Increasing of the selling price for +20% from base scenario, reaching 70 % from pure metal price significantly increases a profit (Figure 10), or could shrink the payback period.
As can be seen, in case of price drop till 30% the profit goes to zero, lower than 30% it will be negative.
Market Estimation and Future Outlook:
E-waste is a rapidly growing waste stream due to the increasing use of electronic devices. The continuous expansion of technology in various sectors, including consumer electronics, healthcare, and transportation, is expected to contribute to a substantial increase in e-waste. As the global demand for precious metals such as gold, silver, and palladium remains high, concerns about resource scarcity are growing. E-waste recycling plays a crucial role in the circular economy, offering a sustainable and environmentally responsible means to recover and reuse these valuable metals.
Our research has unveiled substantial potential in the field of PCBs pre-treatment methods, presenting an opportunity for the reclamation of precious materials. With the capacity to process a minimum of 30% of the total PCBs, equivalent to approximately 75,000 metric tons annually, the potential recovery of precious metals holds an estimated value of 545 million euros.
In total E-waste recycling has the potential to reduce the pressure on primary mining operations for precious metals. A steady supply of recycled precious metals can help stabilize the market, decrease price volatility, and mitigate geopolitical risks associated with mining operations.
5. Conclusions
In conclusion, this research underscores the crucial importance of delving into the pre-treatment of PCB and conducting in-depth economic assessments within this specific domain. By dedicating attention to this relatively unexplored facet of electronic waste recycling, we are taking a significant step towards offering a more holistic and inclusive approach to managing waste electronic components.
As we unlock the untapped potential in this field, we move closer to realising a more sustainable and responsible management of electronic waste on a global scale.
The results from research further suggested that the roadmap of physical pre-treatment and electro-chemical reclamation could have potential financial benefits and, hence, a business opportunity.
Approved by technical-economical estimation, developed technology which combines disintegration pre-treatment in combination with electro-chemical hydrochlorination, is economically justified fro selling price of metal-rich concentrate till 30% from it market price in pure form in condition of 2 year of return of investment. Mandatory condition for the process positive outcome is high-enough valuable metal content.
!!!With a single separation plant capable of producing around 5704 t/year of metal concentrates containing precious metals worth 41.5 M€ just waiting to be reclaimed.
The optimisation of the hydrochlorination allows to cut operational costs in a long-term by 20-30%.
The use of physical separation as a pre-treatment allows to increase the electro-chemical reclamation process capacity by approximately 40-60%.
Meanwhile, physical separation ensures the hazardous substances are contained accordingly and further utilized utilised without part taking in the reclamation process, as provided in RoHS Directive 2011/65/EU on the regulation of the hazardous substances in electronic and electric wastes.
Author Contributions
Conceptualization E.B., K.M. and A.S.; methodology D.G., K.M. and A.S (Andrei Shishkin); validation V.P., K.M. and J.B.; formal analysis A.K., A.Z. ; investigation E.B., V.S. and D.G.; resources, E.B., V.P. and V.S; data curation J.B., V.A. and A.Z.; writing—original draft preparation E.B., A.S., K.M., J.B. and D.G.; writing—review and editing V.S., J.B. and A.K.; visualization A.K., V.A., and J.B.; supervision, E.B., and A.S.; project administration E.B. and V.P.; funding acquisition, E.B., .P.V. and D.G. All authors have read and agreed to the published version of the manuscript.
Funding
This research was supported by ERDF project Nr. 1.1.1.1/20/A/139 “Development of sustainable recycling technology of electronic scrap for precious and non-ferrous metals extraction”. The article is published with the financial support from the Riga Technical University Research Support Fund. This work was also supported by the EIT RawMaterials grant ”RENEW: recycling of epoxies from e-waste” project; “P.A. 21021” and by the Environmental Investment Centre Foundation co-funding grant KIK22014. ISSP UL as the Center of Excellence is supported through the Framework Program for European universities, Union Horizon 2020, H2020-WIDESPREAD-01-2016-2017-TeamingPhase2, under Grant Agreement No. 739508, CAMART2 project.
Conflicts of Interest
The authors declare no conflict of interest.
Projects synergy
This research is synergy of the two independent research grants: Latvian ERDF project Nr. 1.1.1.1/20/A/139 and EIT RawMaterials grant P.A. 21021”RENEW”. Each grant team worked independently using his own resources and work force. In this joint research the both projects results merged to complimentary fulfil each other: two innovative approaches (selective disintegration milling and electro-hydrochlorination leaching) successfully could be merged in future industrial solution to strengthen European recycling industry. ISSP UL as the Center of Excellence is supported through the Framework Program for European universities, Union Horizon 2020, H2020-WIDESPREAD-01-2016-2017-TeamingPhase2, under Grant Agreement No. 739508, CAMART2 project.
References
- International E-Waste Day: 57.4M Tonnes Expected in 2021. Available online: https://weee-forum.org/ws_news/international-e-waste-day-2021/ (accessed on 15 October 2023).
- Mori de Oliveira, C.; Bellopede, R.; Tori, A.; Marini, P. Study of Metal Recovery from Printed Circuit Boards by Physical-Mechanical Treatment Processes. In Proceedings of the International Conference on Raw Materials and Circular Economy; MDPI: Basel Switzerland, 18 March 2022; p. 121. [Google Scholar]
- Romagnoli, V.; de Bruijne, E.; Drapeau, P.; Ollion, L.; Anaëll’e Chretien. Study on Options for Return Schemes of Mobile Phones, Tablets and Other Small Electrical and Electronic Equipment in the EU; Brussels, 2022. [Google Scholar]
- European Commision Waste Statistics - Electrical and Electronic Equipment. Available online: https://ec.europa.eu/eurostat/statistics-explained/index.php?title=Waste_statistics_-_electrical_and_electronic_equipment#Electrical_and_electronic_equipment_.28EEE.29_put_on_the_market_and_WEEE_processed_in_the_EU (accessed on 15 October 2023).
- Shittu, O.S.; Williams, I.D.; Shaw, P.J. Global E-Waste Management: Can WEEE Make a Difference? A Review of e-Waste Trends, Legislation, Contemporary Issues and Future Challenges. Waste Management 2021, 120. [Google Scholar] [CrossRef]
- Gautam, P.; Behera, C.K.; Sinha, I.; Gicheva, G.; Singh, K.K. High Added-Value Materials Recovery Using Electronic Scrap-Transforming Waste to Valuable Products. J Clean Prod 2022, 330. [Google Scholar] [CrossRef]
- Li, H.; Eksteen, J.; Oraby, E. Hydrometallurgical Recovery of Metals from Waste Printed Circuit Boards (WPCBs): Current Status and Perspectives – A Review. Resour Conserv Recycl 2018, 139. [Google Scholar] [CrossRef]
- Lin, S.; Chen, X.W.; Cai, Z.; Shi, J.; Fu, J.; Jiang, G.; Wong, M.H. Remediation of Emerging Contaminated Sites Due to Uncontrolled E-Waste Recycling. Chemical Engineering Journal 2022, 430. [Google Scholar] [CrossRef]
- Peng, Z.; Wang, J.; Zhang, X.; Yan, J.; Shang, W.; Yu, J.; Zhu, G.; Rao, M.; Li, G.; Jiang, T. Enrichment of Heavy Metals from Spent Printed Circuit Boards by Microwave Pyrolysis. Waste Management 2022, 145. [Google Scholar] [CrossRef]
- Cai, K.; Song, Q.; Yuan, W.; Ruan, J.; Duan, H.; Li, Y.; Li, J. Human Exposure to PBDEs in E-Waste Areas: A Review. Environmental Pollution 2020, 267. [Google Scholar] [CrossRef] [PubMed]
- Ma, S.; Lin, M.; Tang, J.; Liu, R.; Yang, Y.; Yu, Y.; Li, G.; An, T. Occurrence and Fate of Polycyclic Aromatic Hydrocarbons from Electronic Waste Dismantling Activities: A Critical Review from Environmental Pollution to Human Health. J Hazard Mater 2022, 424. [Google Scholar] [CrossRef] [PubMed]
- Wang, J.; Xu, Z. Disposing and Recycling Waste Printed Circuit Boards: Disconnecting, Resource Recovery, and Pollution Control. Environ Sci Technol 2015, 49. [Google Scholar] [CrossRef] [PubMed]
- Hao, J.; Wang, Y.; Wu, Y.; Guo, F. Metal Recovery from Waste Printed Circuit Boards: A Review for Current Status and Perspectives. Resour Conserv Recycl 2020, 157. [Google Scholar] [CrossRef]
- Jha, R.; Rao, M.D.; Meshram, A.; Verma, H.R.; Singh, K.K. Potential of Polymer Inclusion Membrane Process for Selective Recovery of Metal Values from Waste Printed Circuit Boards: A Review. J Clean Prod 2020, 265. [Google Scholar] [CrossRef]
- Mir, S.; Dhawan, N. A Comprehensive Review on the Recycling of Discarded Printed Circuit Boards for Resource Recovery. Resour Conserv Recycl 2022, 178. [Google Scholar] [CrossRef]
- Qiu, R.; Lin, M.; Qin, B.; Xu, Z.; Ruan, J. Environmental-Friendly Recovery of Non-Metallic Resources from Waste Printed Circuit Boards: A Review. J Clean Prod 2021, 279. [Google Scholar] [CrossRef]
- Niu, B.; Chen, Z.; Xu, Z. Method for Recycling Tantalum from Waste Tantalum Capacitors by Chloride Metallurgy. ACS Sustain Chem Eng 2017, 5. [Google Scholar] [CrossRef]
- Fontana, D.; Pietrantonio, M.; Pucciarmati, S.; Torelli, G.N.; Bonomi, C.; Masi, F. Palladium Recovery from Monolithic Ceramic Capacitors by Leaching, Solvent Extraction and Reduction. J Mater Cycles Waste Manag 2018, 20. [Google Scholar] [CrossRef]
- Lu, Y.; Xu, Z. Recycling Non-Leaching Gold from Gold-Plated Memory Cards: Parameters Optimization, Experimental Verification, and Mechanism Analysis. J Clean Prod 2017, 162. [Google Scholar] [CrossRef]
- Wu, C.; Awasthi, A.K.; Qin, W.; Liu, W.; Yang, C. Recycling Value Materials from Waste PCBs Focus on Electronic Components: Technologies, Obstruction and Prospects. J Environ Chem Eng 2022, 10. [Google Scholar] [CrossRef]
- Maurice, A.A.; Dinh, K.N.; Charpentier, N.M.; Brambilla, A.; Gabriel, J.C.P. Dismantling of Printed Circuit Boards Enabling Electronic Components Sorting and Their Subsequent Treatment Open Improved Elemental Sustainability Opportunities. Sustainability (Switzerland) 2021, 13. [Google Scholar] [CrossRef]
- Silver Price in EUR per Troy Ounce for Last 10 Years. Available online: https://www.bullionbypost.eu/silver-price/10-year-silver-price/ (accessed on 15 October 2023).
- Gold Price in EUR per Gram for Last 10 Years. Available online: https://www.bullionbypost.eu/gold-price/10-year-gold-price-per-gram/ (accessed on 15 October 2023).
- Palladium Price in EUR per Troy Ounce for Last 10 Years. Available online: https://www.bullionbypost.eu/palladium-price/10year/ounces/EUR/ (accessed on 15 October 2023).
- 25. a WEEE Forum International E-Waste Day: 57.4M Tonnes Expected in 2021. Available online: https://weee-forum.org/ws_news/international-e-waste-day-2021/ (accessed on 15 October 2023).
- Forti Vanessa; Peter Baldé Cornelis; Kuehr Ruediger; Bel Garam. The Global E-Waste Monitor 2020: Quantities, Communications Systems. From Broadband Networks to Cutting-Edge Wireless Technologies, Flows and the Circular Economy Potential; Bonn/Geneva/Rotterdam, 2020. [Google Scholar]
- European Parliament E-Waste in the EU: Facts and Figures (Infographic). Available online: https://www.europarl.europa.eu/news/en/headlines/society/20201208STO93325/e-waste-in-the-eu-facts-and-figures-infographic (accessed on 15 October 2023).
- European Parliament and of the Council. DIRECTIVE (EU) 2018/849 OF THE EUROPEAN PARLIAMENT AND OF THE COUNCIL; L150; Brussels, 2018. [Google Scholar]
- Wang, M.; Tan, Q.; Chiang, J.F.; Li, J. Recovery of Rare and Precious Metals from Urban Mines—A Review. Front Environ Sci Eng 2017, 11. [Google Scholar] [CrossRef]
- Gonzalez Baez, A.; Pantoja Muñoz, L.; Garelick, H.; Purchase, D. Characterization of Industrially Pre-Treated Waste Printed Circuit Boards for the Potential Recovery of Rare Earth Elements. Environ Technol Innov 2022, 27. [Google Scholar] [CrossRef]
- Botelho Junior, A.B.; Martins, F.P.; Cezarino, L.O.; Liboni, L.B.; Tenório, J.A.S.; Espinosa, D.C.R. The Sustainable Development Goals, Urban Mining, and the Circular Economy. Extr Ind Soc 2023, 16, 101367. [Google Scholar] [CrossRef]
- Pietrelli, L.; Francolini, I.; Piozzi, A.; Vocciante, M. Metals Recovery from Printed Circuit Boards: The Pursuit of Environmental and Economic Sustainability. Chem Eng Trans 2018, 70, 271–276. [Google Scholar] [CrossRef]
- Tembhare, S.P.; Bhanvase, B.A.; Barai, D.P.; Dhoble, S.J. E-Waste Recycling Practices: A Review on Environmental Concerns, Remediation and Technological Developments with a Focus on Printed Circuit Boards. Environ Dev Sustain 2022, 24, 8965–9047. [Google Scholar] [CrossRef]
- Ashiq, A.; Kulkarni, J.; Vithanage, M. Hydrometallurgical Recovery of Metals From E-Waste. Electronic Waste Management and Treatment Technology 2019, 225–246. [Google Scholar] [CrossRef]
- Rene, E.R.; Sethurajan, M.; Kumar Ponnusamy, V.; Kumar, G.; Bao Dung, T.N.; Brindhadevi, K.; Pugazhendhi, A. Electronic Waste Generation, Recycling and Resource Recovery: Technological Perspectives and Trends. J Hazard Mater 2021, 416, 125664. [Google Scholar] [CrossRef]
- Ahirwar, R.; Tripathi, A.K. E-Waste Management: A Review of Recycling Process, Environmental and Occupational Health Hazards, and Potential Solutions. Environ Nanotechnol Monit Manag 2021, 15, 100409. [Google Scholar] [CrossRef]
- Zhang, Y.; Jiang, H.; Wang, H.; Wang, C. Flotation Separation of Acrylonitrile-Butadiene-Styrene and Polystyrene in WEEE Based on Oxidation of Active Sites. Miner Eng 2020, 146, 106131. [Google Scholar] [CrossRef]
- Kaya, M. Electronic Waste and Printed Circuit Board Recycling Technologies; Springer International Publishing: Cham, 2019; ISBN 978-3-030-26592-2. [Google Scholar]
- Ning, C.; Lin, C.S.K.; Hui, D.C.W.; McKay, G. Waste Printed Circuit Board (PCB) Recycling Techniques. Top Curr Chem 2017, 375, 43. [Google Scholar] [CrossRef] [PubMed]
- Asghari, I.; Mousavi, S.M.; Amiri, F.; Tavassoli, S. Bioleaching of Spent Refinery Catalysts: A Review. Journal of Industrial and Engineering Chemistry 2013, 19, 1069–1081. [Google Scholar] [CrossRef]
- Syrmakezis, K.C.; Tsakalakis, K.G.; Sammas, I.P. Valorisation of Base Metals Contained in Fine Particles of End-of-Life Printed Circuit Boards with the Use of Column Flotation Process. Sustain Chem Pharm 2023, 33, 101062. [Google Scholar] [CrossRef]
- Yao, Y.; Zhou, K.; He, J.; Zhu, L.; Zhao, Y.; Bai, Q. Efficient Recovery of Valuable Metals in the Disposal of Waste Printed Circuit Boards via Reverse Flotation. J Clean Prod 2021, 284, 124805. [Google Scholar] [CrossRef]
- Chen, L.; He, J.; Zhu, L.; Yao, Q.; Sun, Y.; Guo, C.; Chen, H.; Yang, B. Efficient Recovery of Valuable Metals from Waste Printed Circuit Boards via Ultrasound-Enhanced Flotation. Process Safety and Environmental Protection 2023, 169, 869–878. [Google Scholar] [CrossRef]
- Dai, G.; Han, J.; Duan, C.; Tang, L.; Peng, Y.; Chen, Y.; Jiang, H.; Zhu, Z. Enhanced Flotation Efficiency of Metal from Waste Printed Circuit Boards Modified by Alkaline Immersion. Waste Management 2021, 120, 795–804. [Google Scholar] [CrossRef] [PubMed]
- Ghosh Sadhan Kumar. Urban Mining and Sustainable Waste Management; Ghosh, S.K., Ed.; Springer Singapore: Singapore, 2020; ISBN 978-981-15-0531-7. [Google Scholar]
- Li, K.; Xu, Z. A Review of Current Progress of Supercritical Fluid Technologies for E-Waste Treatment. J Clean Prod 2019, 227, 794–809. [Google Scholar] [CrossRef]
- Silveira, A.V.M.; Cella, M.; Tanabe, E.H.; Bertuol, D.A. Application of Tribo-Electrostatic Separation in the Recycling of Plastic Wastes. Process Safety and Environmental Protection 2018, 114, 219–228. [Google Scholar] [CrossRef]
- Martino, R.; Iseli, C.; Gaydardzhiev, S.; Streicher-Porte, M.; Weh, A. Electro Dynamic Fragmentation of Printed Wiring Boards as a Preparation Tool for Their Recycling. Miner Eng 2017, 107, 20–26. [Google Scholar] [CrossRef]
- Blumbergs, E.; Serga, V.; Shishkin, A.; Goljandin, D.; Shishko, A.; Zemcenkovs, V.; Markus, K.; Baronins, J.; Pankratov, V. Selective Disintegration–Milling to Obtain Metal-Rich Particle Fractions from E-Waste. Metals (Basel) 2022, 12. [Google Scholar] [CrossRef]
- Serga, V.; Zarkov, A.; Shishkin, A.; Elsts, E.; Melnichuks, M.; Maiorov, M.; Blumbergs, E.; Pankratov, V. Study of Metal Leaching from Printed Circuit Boards by Improved Electrochemical Hydrochlorination Technique Using Alternating Current. Metals (Basel) 2023, 13. [Google Scholar] [CrossRef]
- Serga, V.; Zarkov, A.; Blumbergs, E.; Shishkin, A.; Baronins, J.; Elsts, E.; Pankratov, V. Leaching of Gold and Copper from Printed Circuit Boards under the Alternating Current Action in Hydrochloric Acid Electrolytes. Metals (Basel) 2022, 12, 1953. [Google Scholar] [CrossRef]
Figure 1.
Silver Price in EUR per Gram for Last 10 Years [22].
Figure 1.
Silver Price in EUR per Gram for Last 10 Years [22].
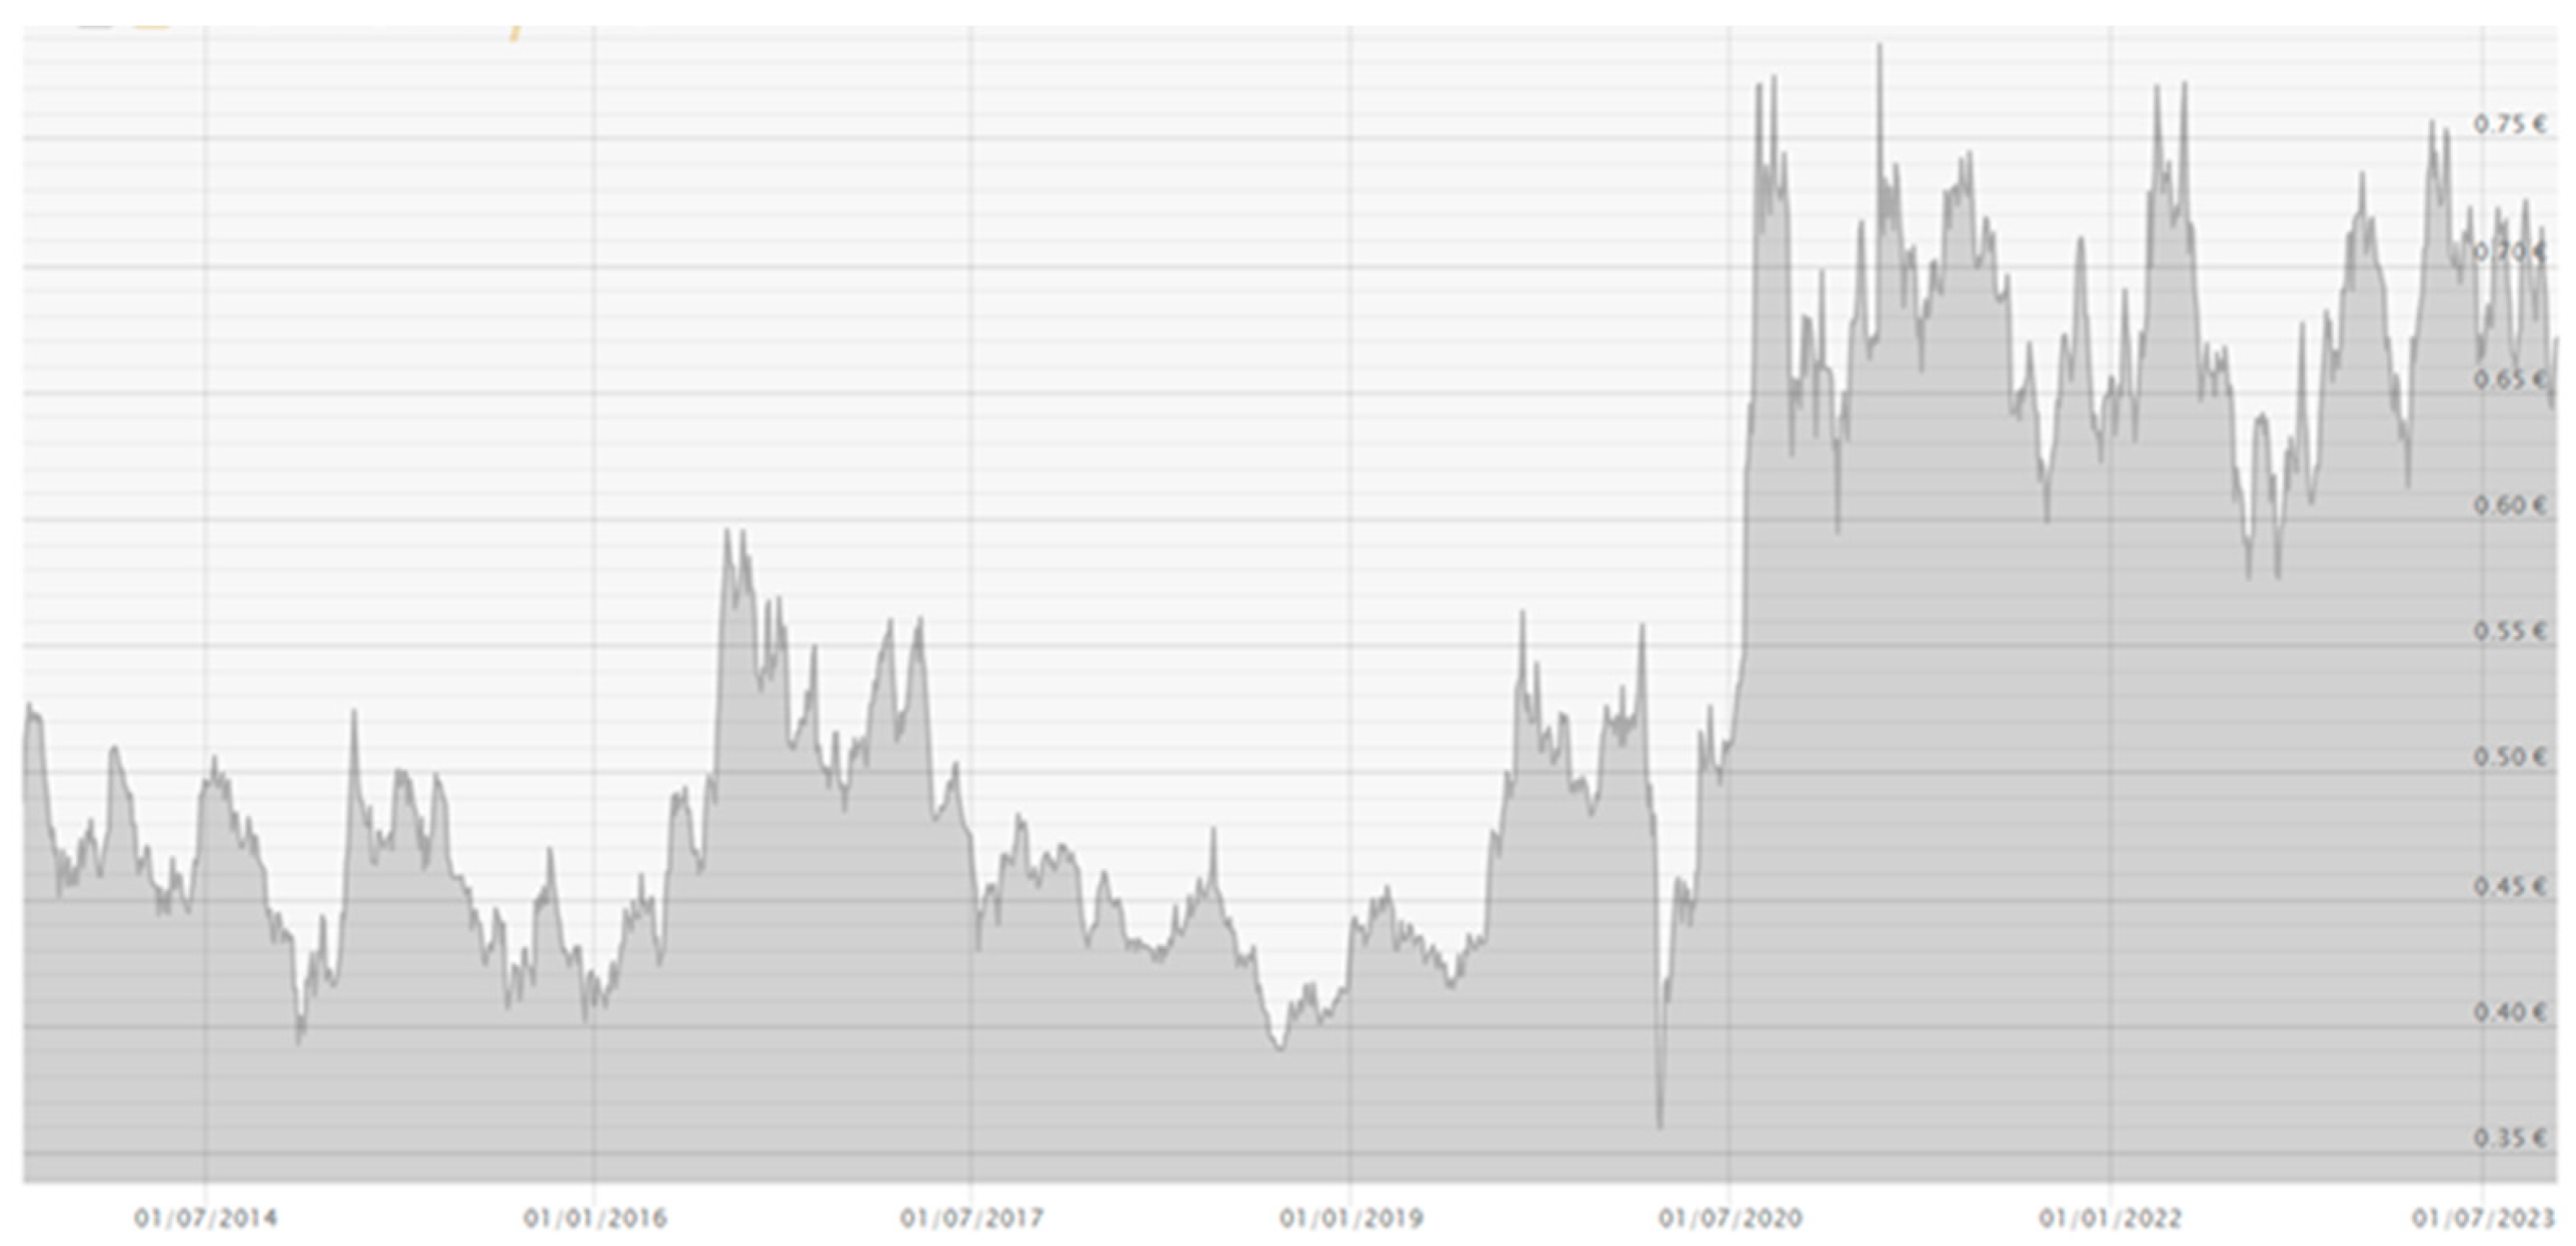
Figure 2.
Gold Price in EUR per Gram for Last 10 Years [23].
Figure 2.
Gold Price in EUR per Gram for Last 10 Years [23].
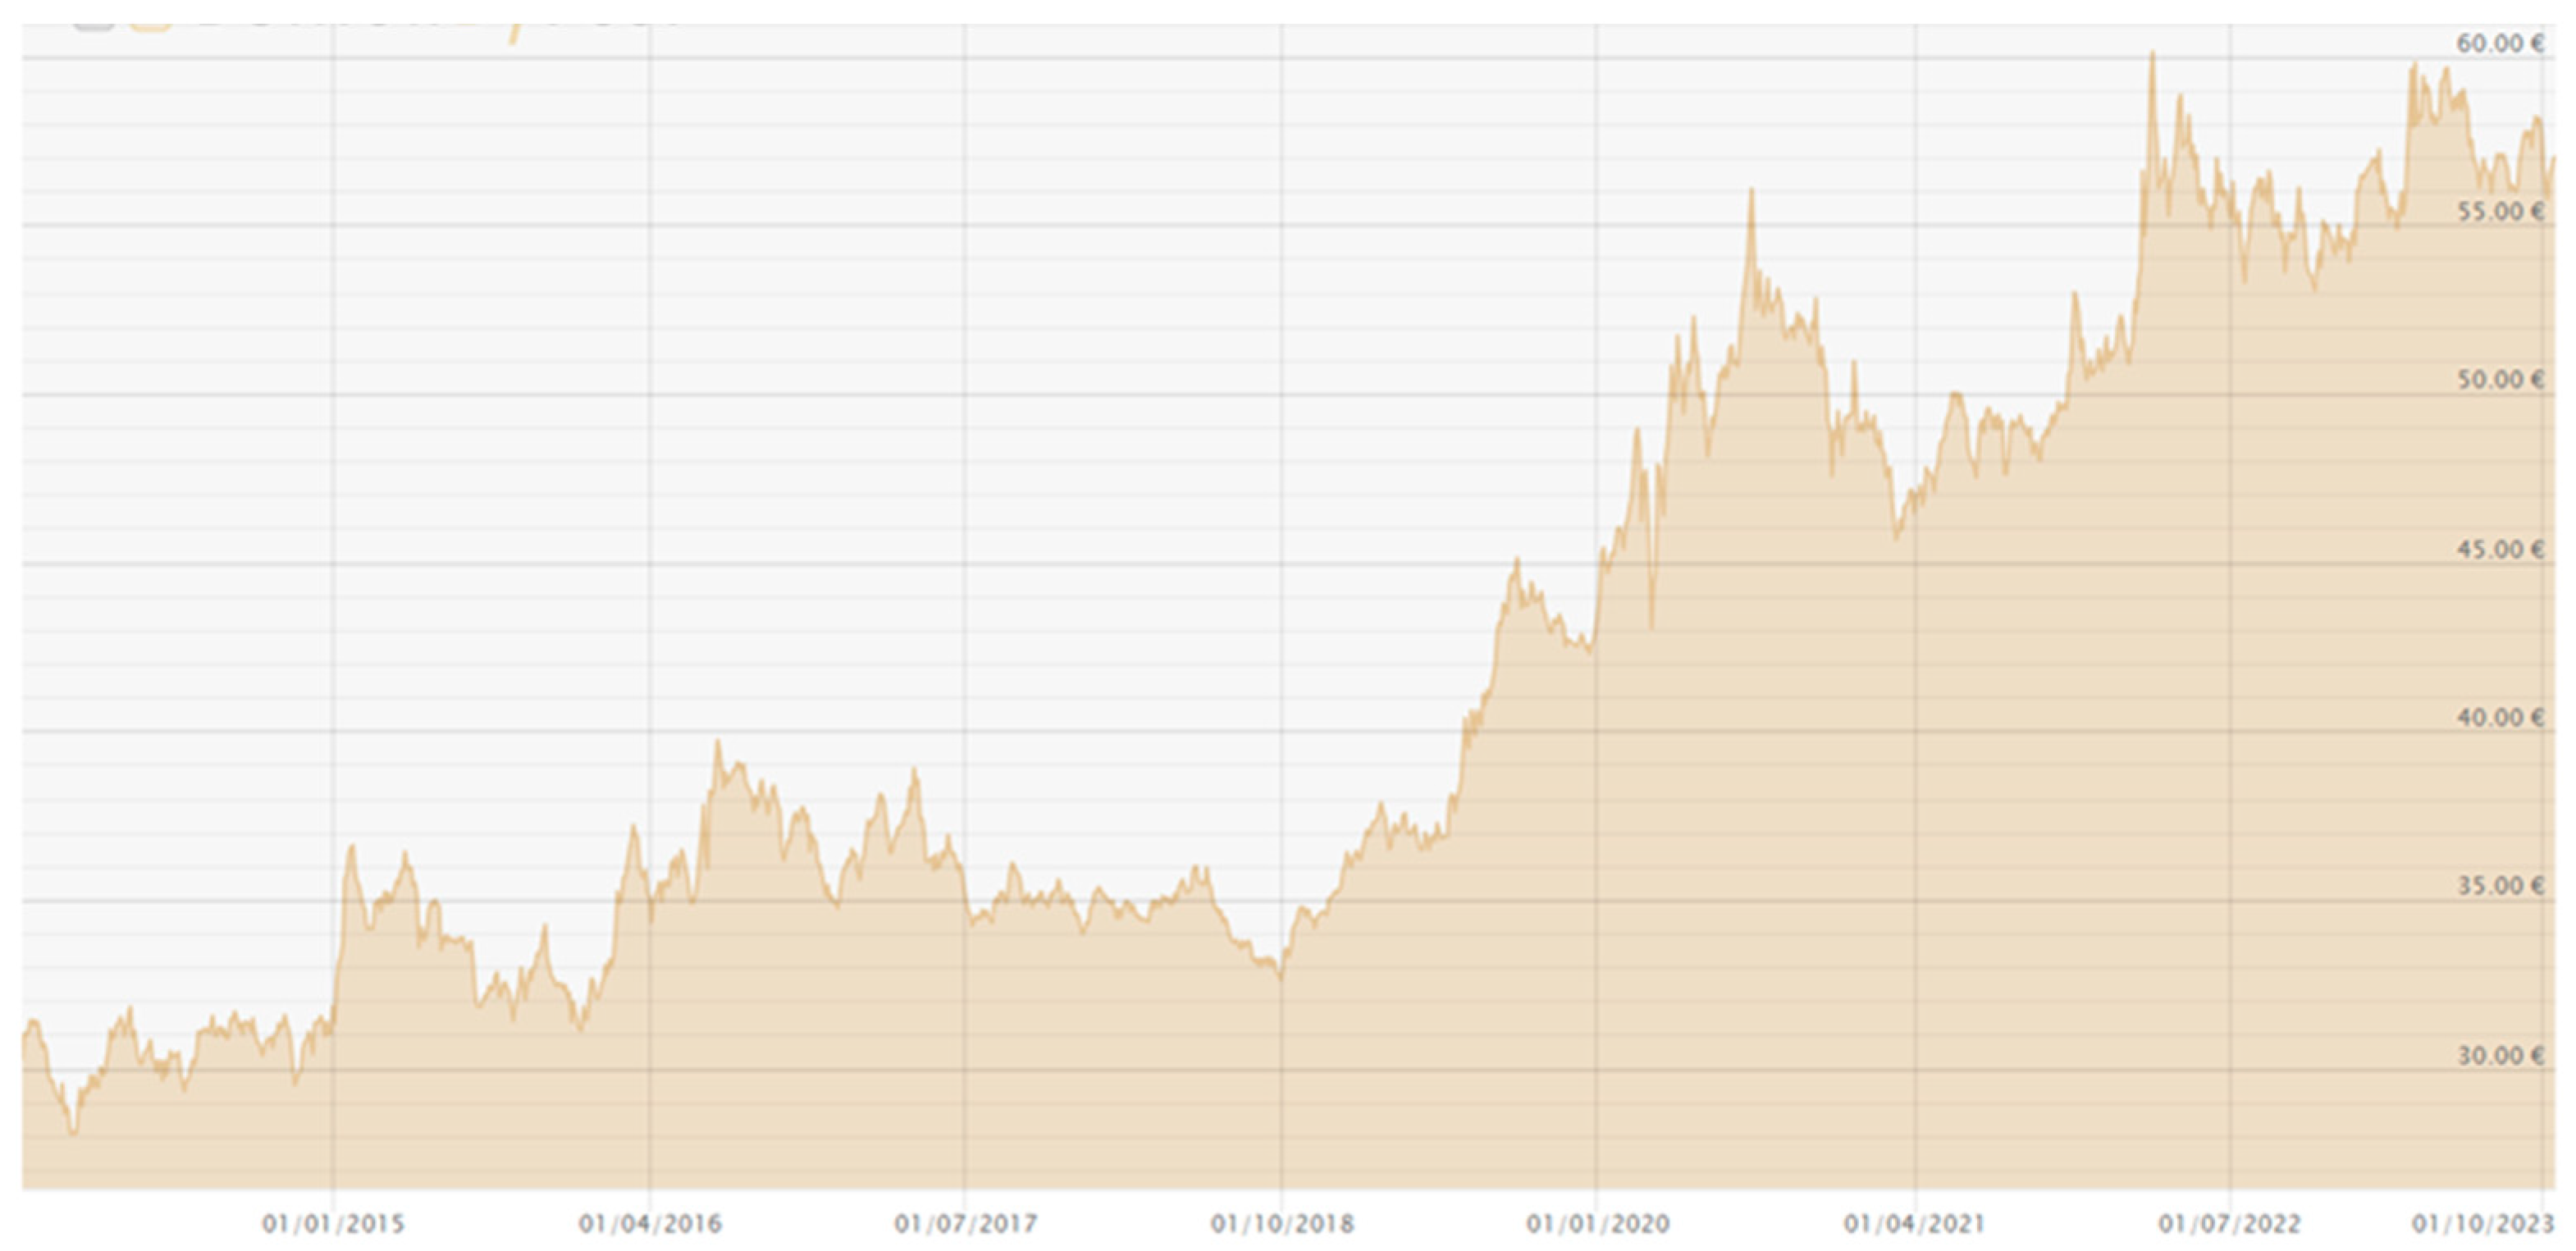
Figure 3.
Palladium Price in EUR per Gram for Last 10 Years [24].
Figure 3.
Palladium Price in EUR per Gram for Last 10 Years [24].
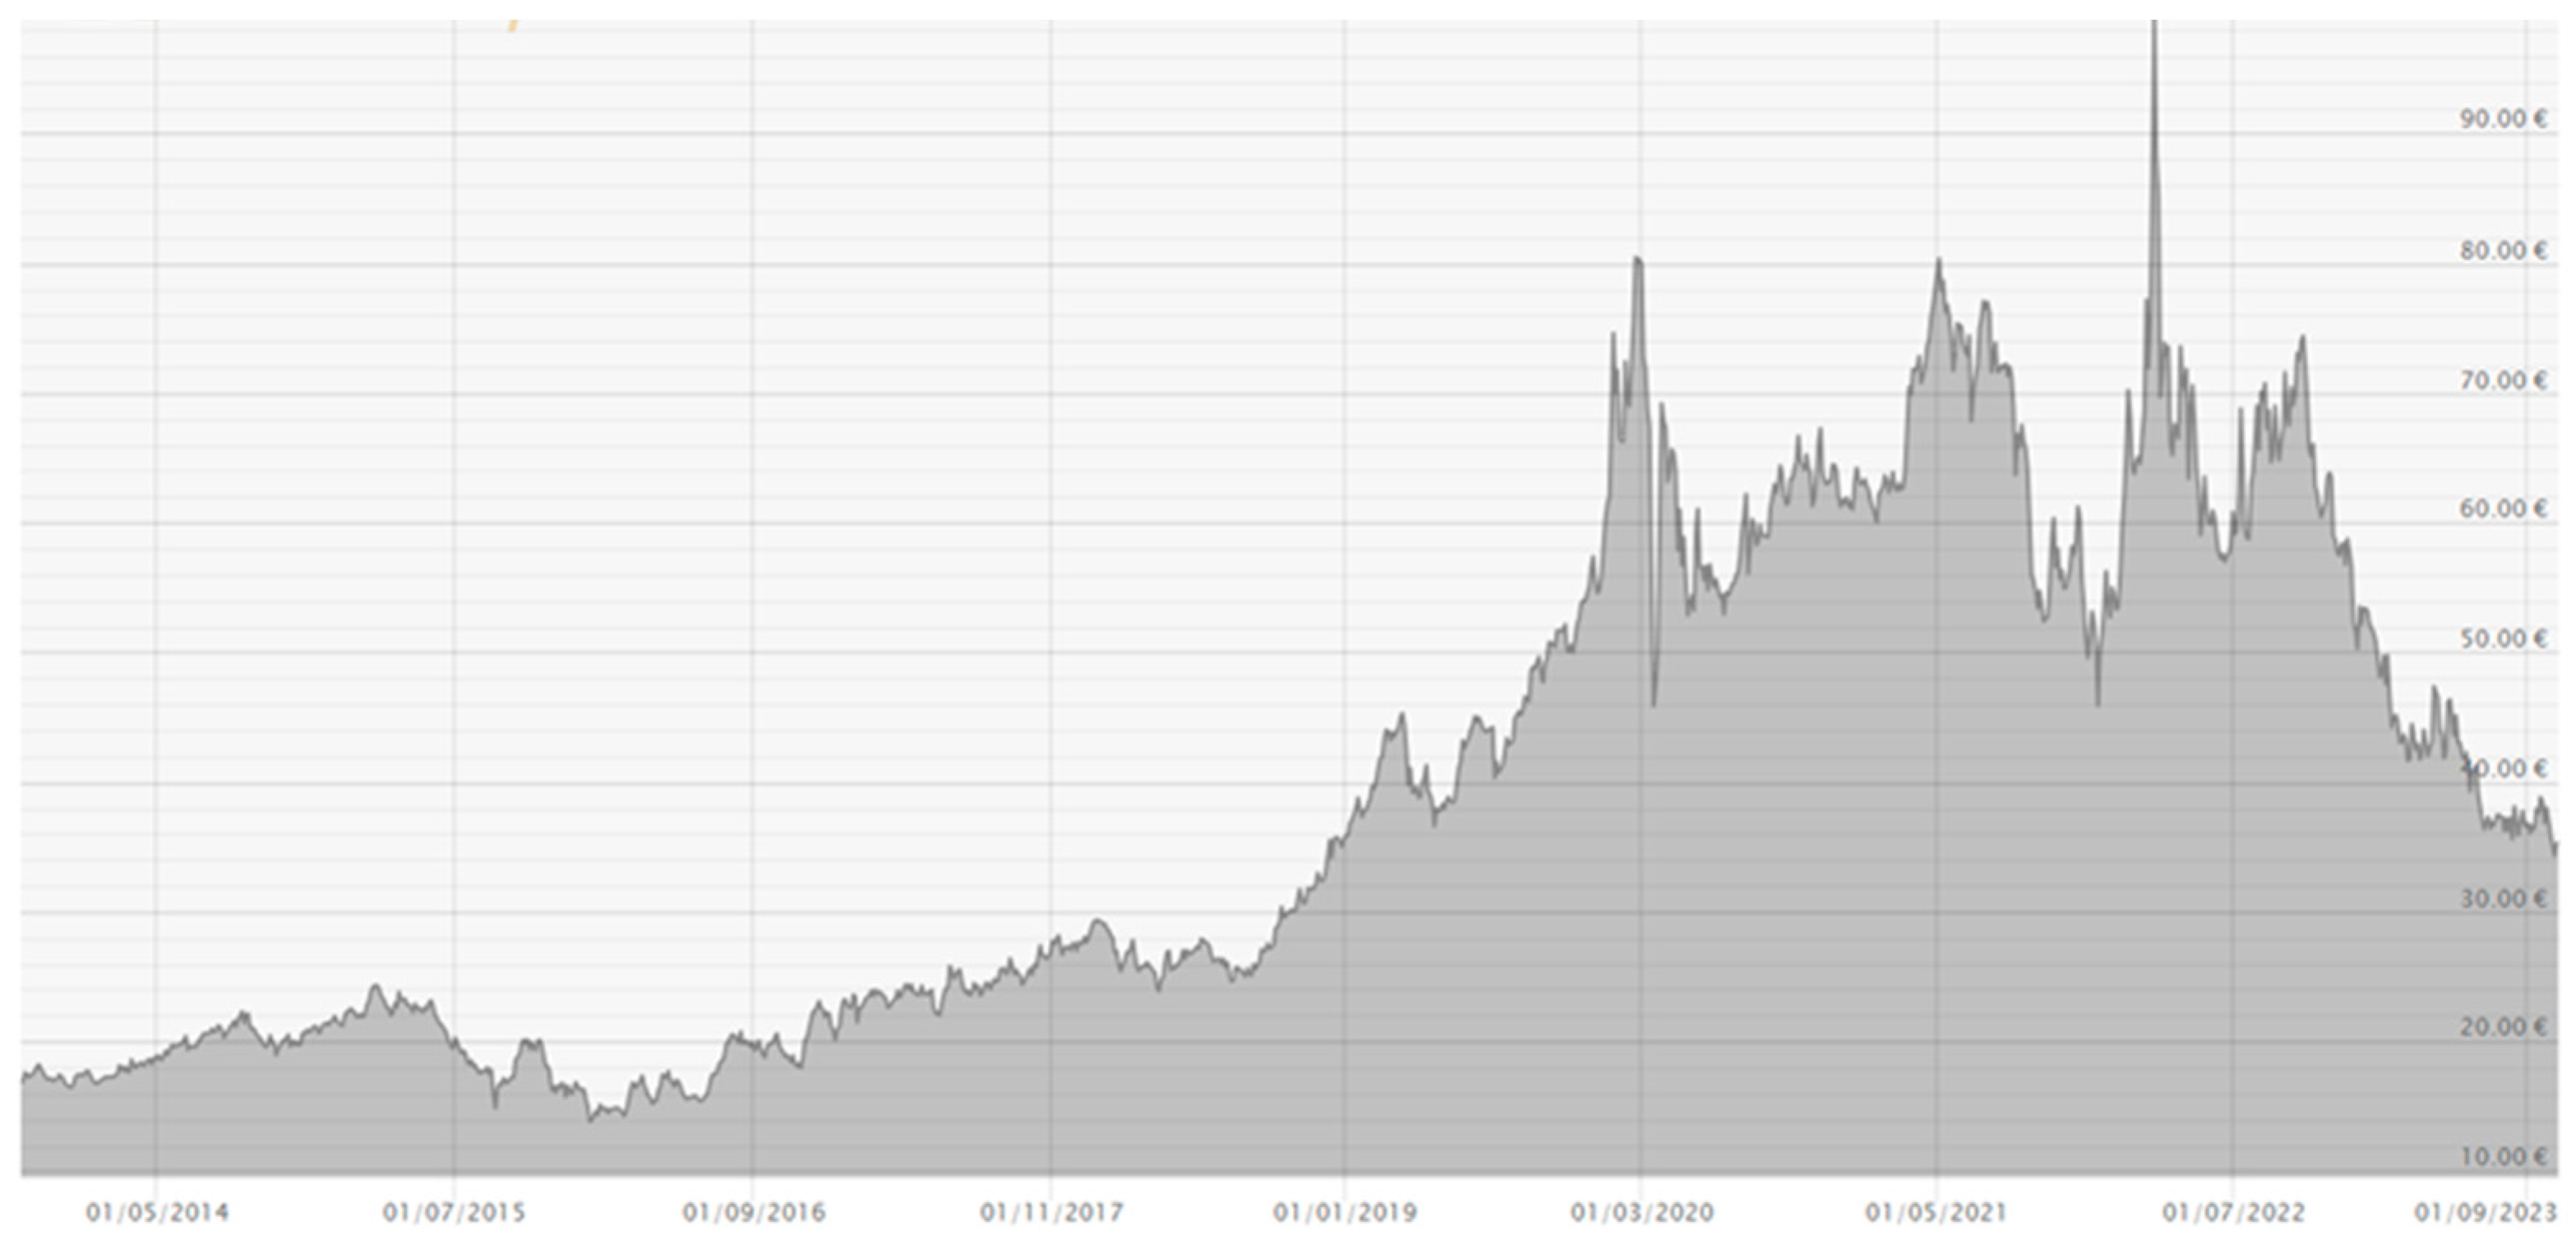
Figure 5.
End-of life EEE and WEEE materials flow chart by stages. Scheme proposed by authors.
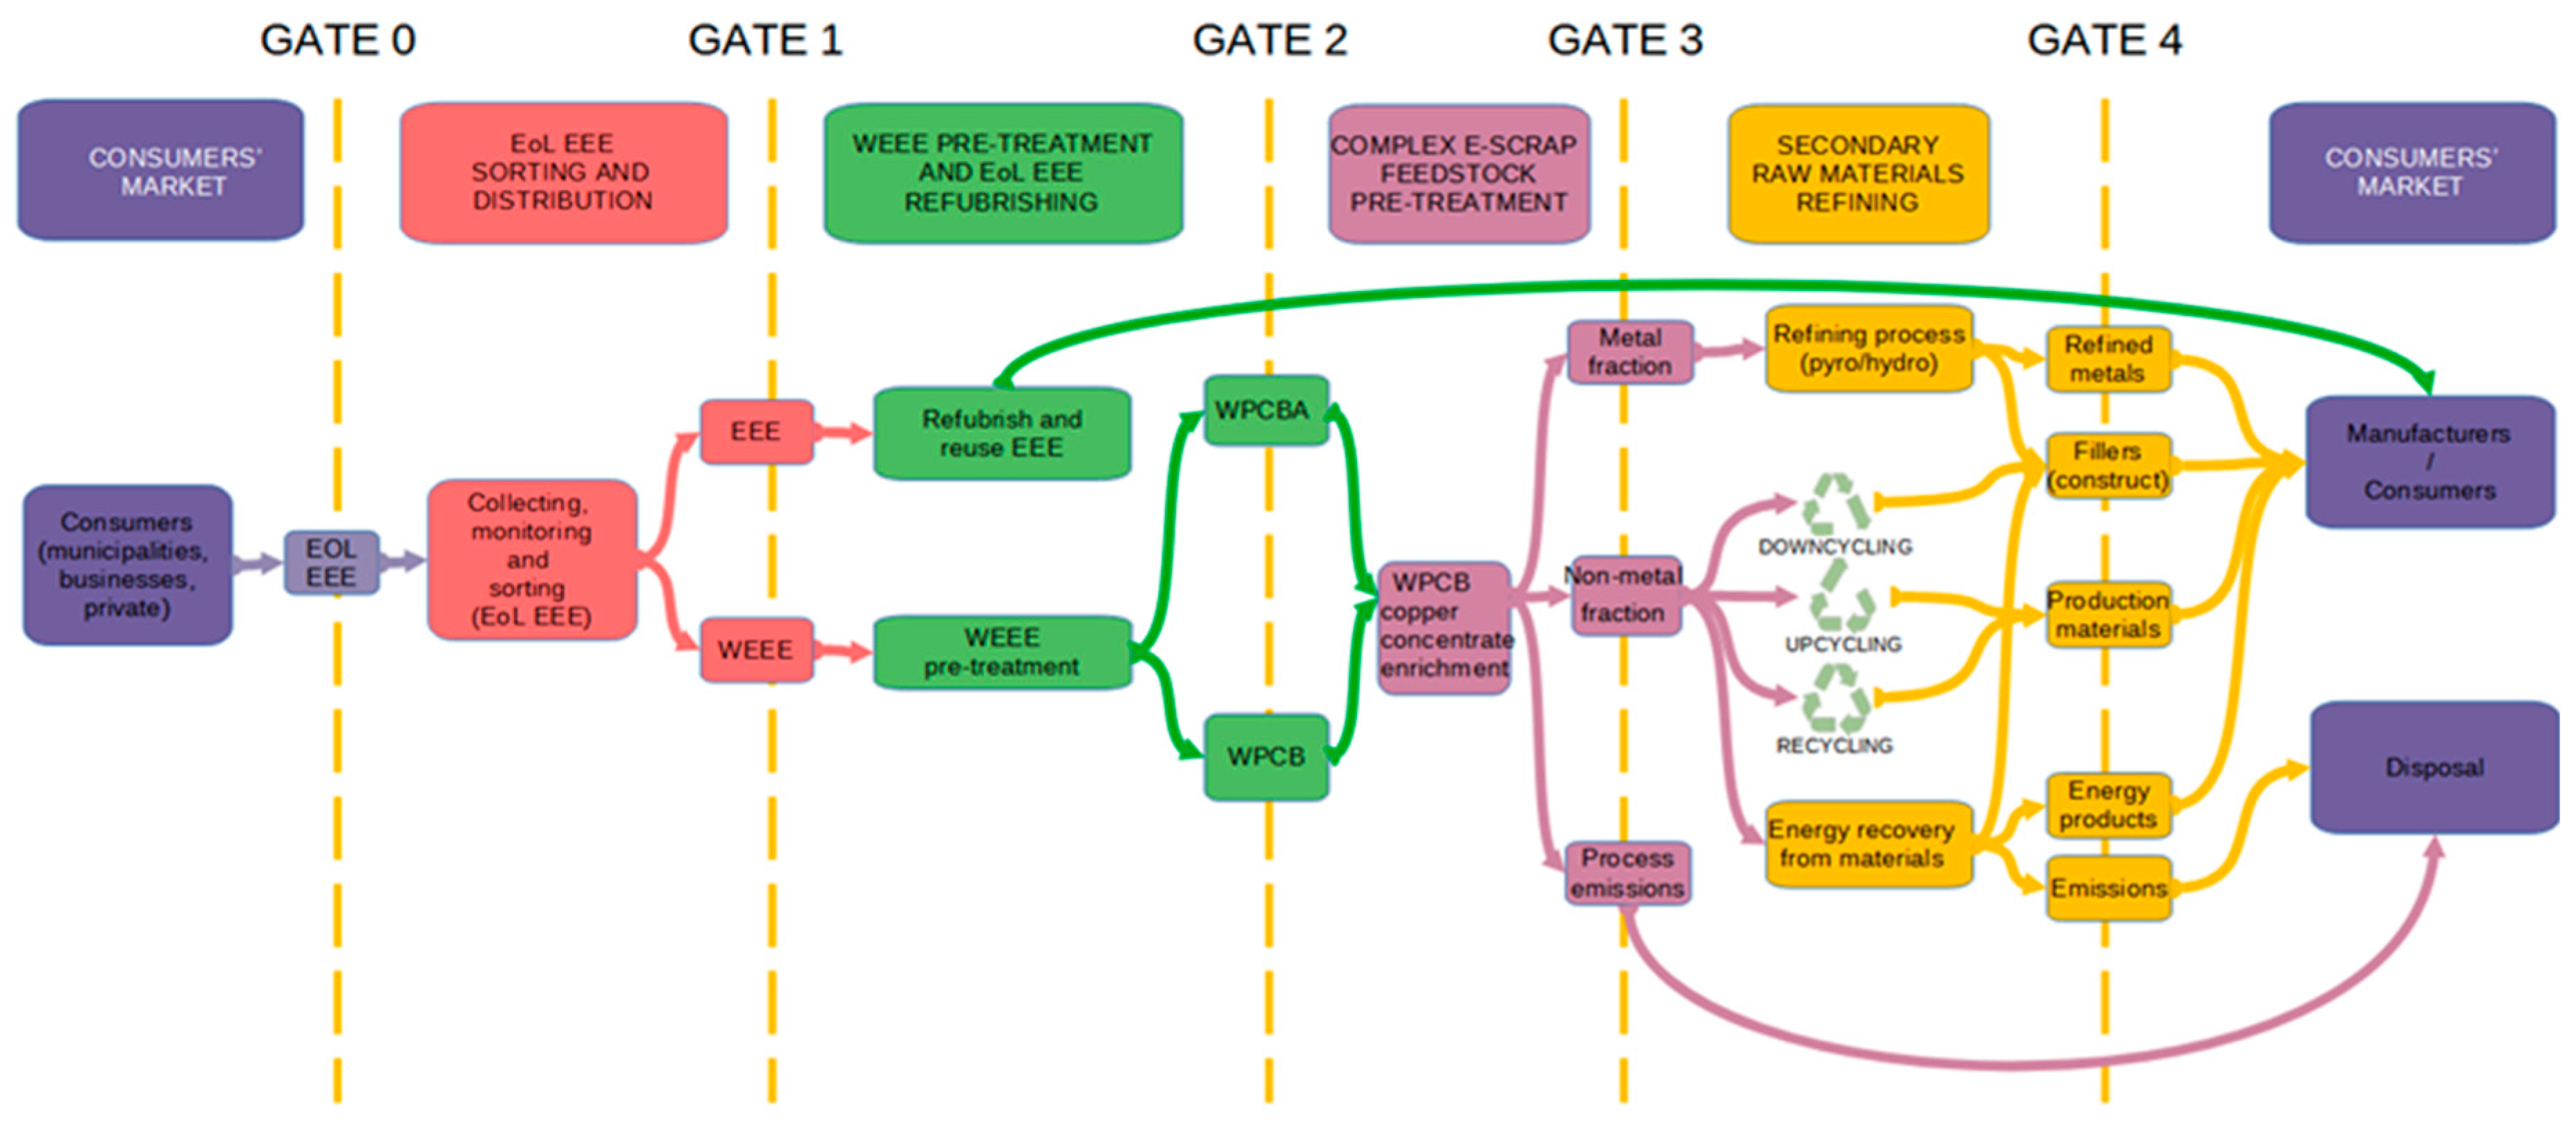
Figure 7.
The disintegration-milling, sieving, and testing scheme of PCB pre-treatment for metal concentrate obtain by one-step (X1) and double-step (X1(>2.8)+X2) disintegration-milling [49][1. Reprinted on CC BY 4.0 open access basis.
Figure 7.
The disintegration-milling, sieving, and testing scheme of PCB pre-treatment for metal concentrate obtain by one-step (X1) and double-step (X1(>2.8)+X2) disintegration-milling [49][1. Reprinted on CC BY 4.0 open access basis.

Figure 8.
Image of studied PCB “P3” (computer motherboard without processor) (a) and optical image at magnification ×200 of disintegrator-crushed metal concentrate (fraction < 90 µm) (b) [50]. Reprinted on CC BY 4.0 open access basis.
Figure 8.
Image of studied PCB “P3” (computer motherboard without processor) (a) and optical image at magnification ×200 of disintegrator-crushed metal concentrate (fraction < 90 µm) (b) [50]. Reprinted on CC BY 4.0 open access basis.
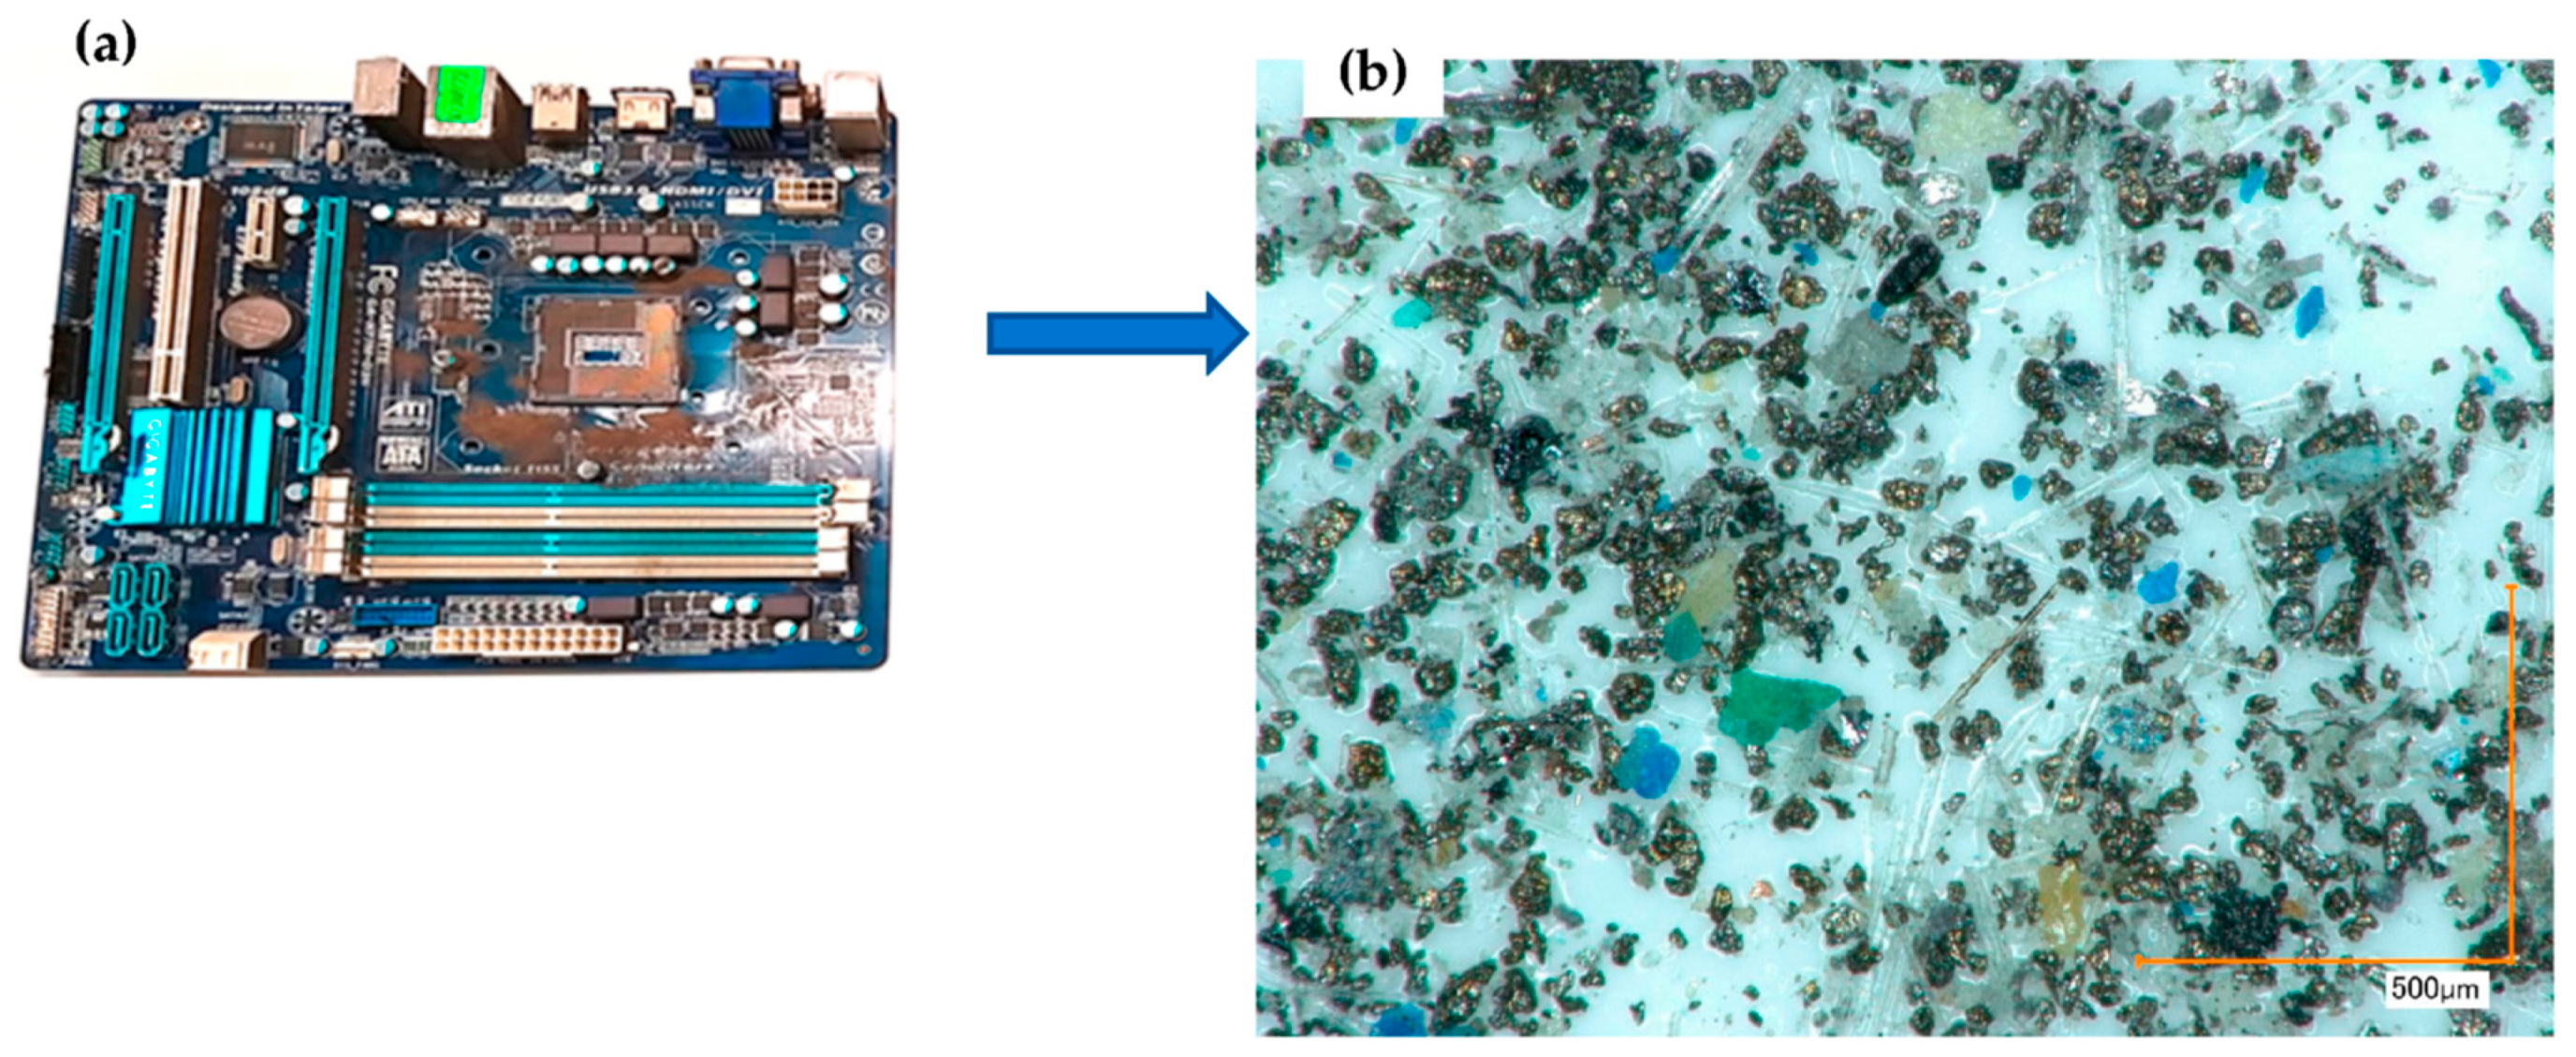
Figure 9.
Image of studied PCB “P4” (mixed PCB with microchips) (a) and optical image at magnification ×200 of disintegrator-crushed metal concentrate (< 90 µm) (b).
Figure 9.
Image of studied PCB “P4” (mixed PCB with microchips) (a) and optical image at magnification ×200 of disintegrator-crushed metal concentrate (< 90 µm) (b).
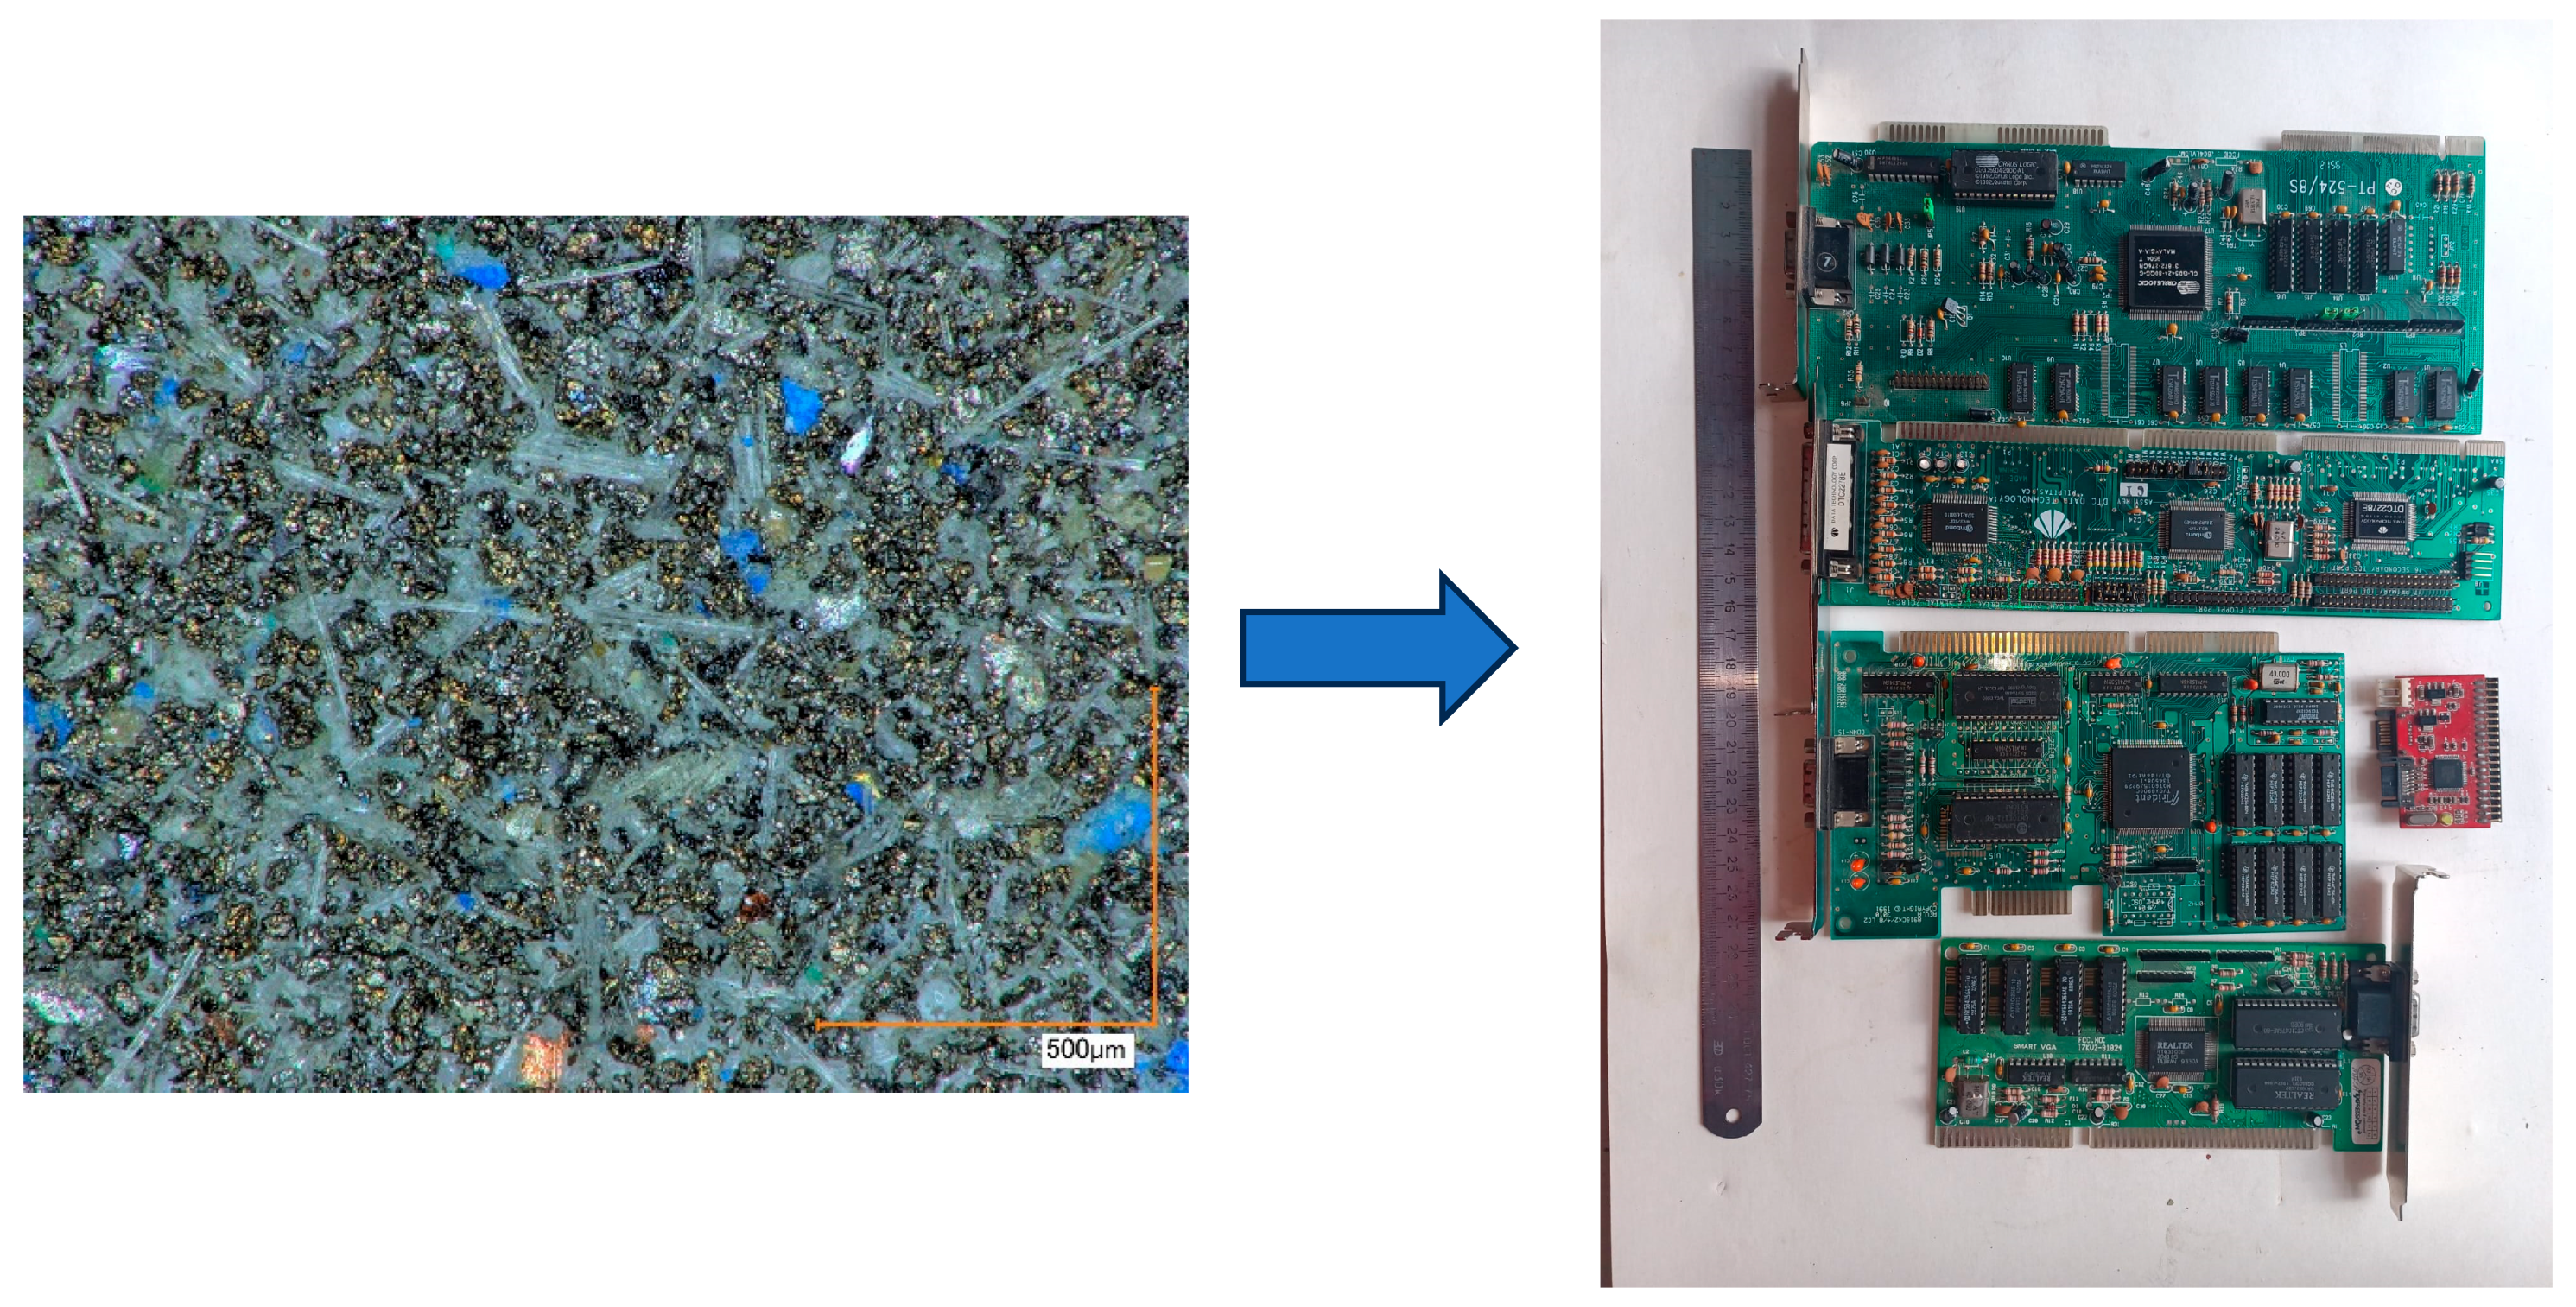
Figure 10.
Chart of the possible profit/loss depending on extracted material price from market.
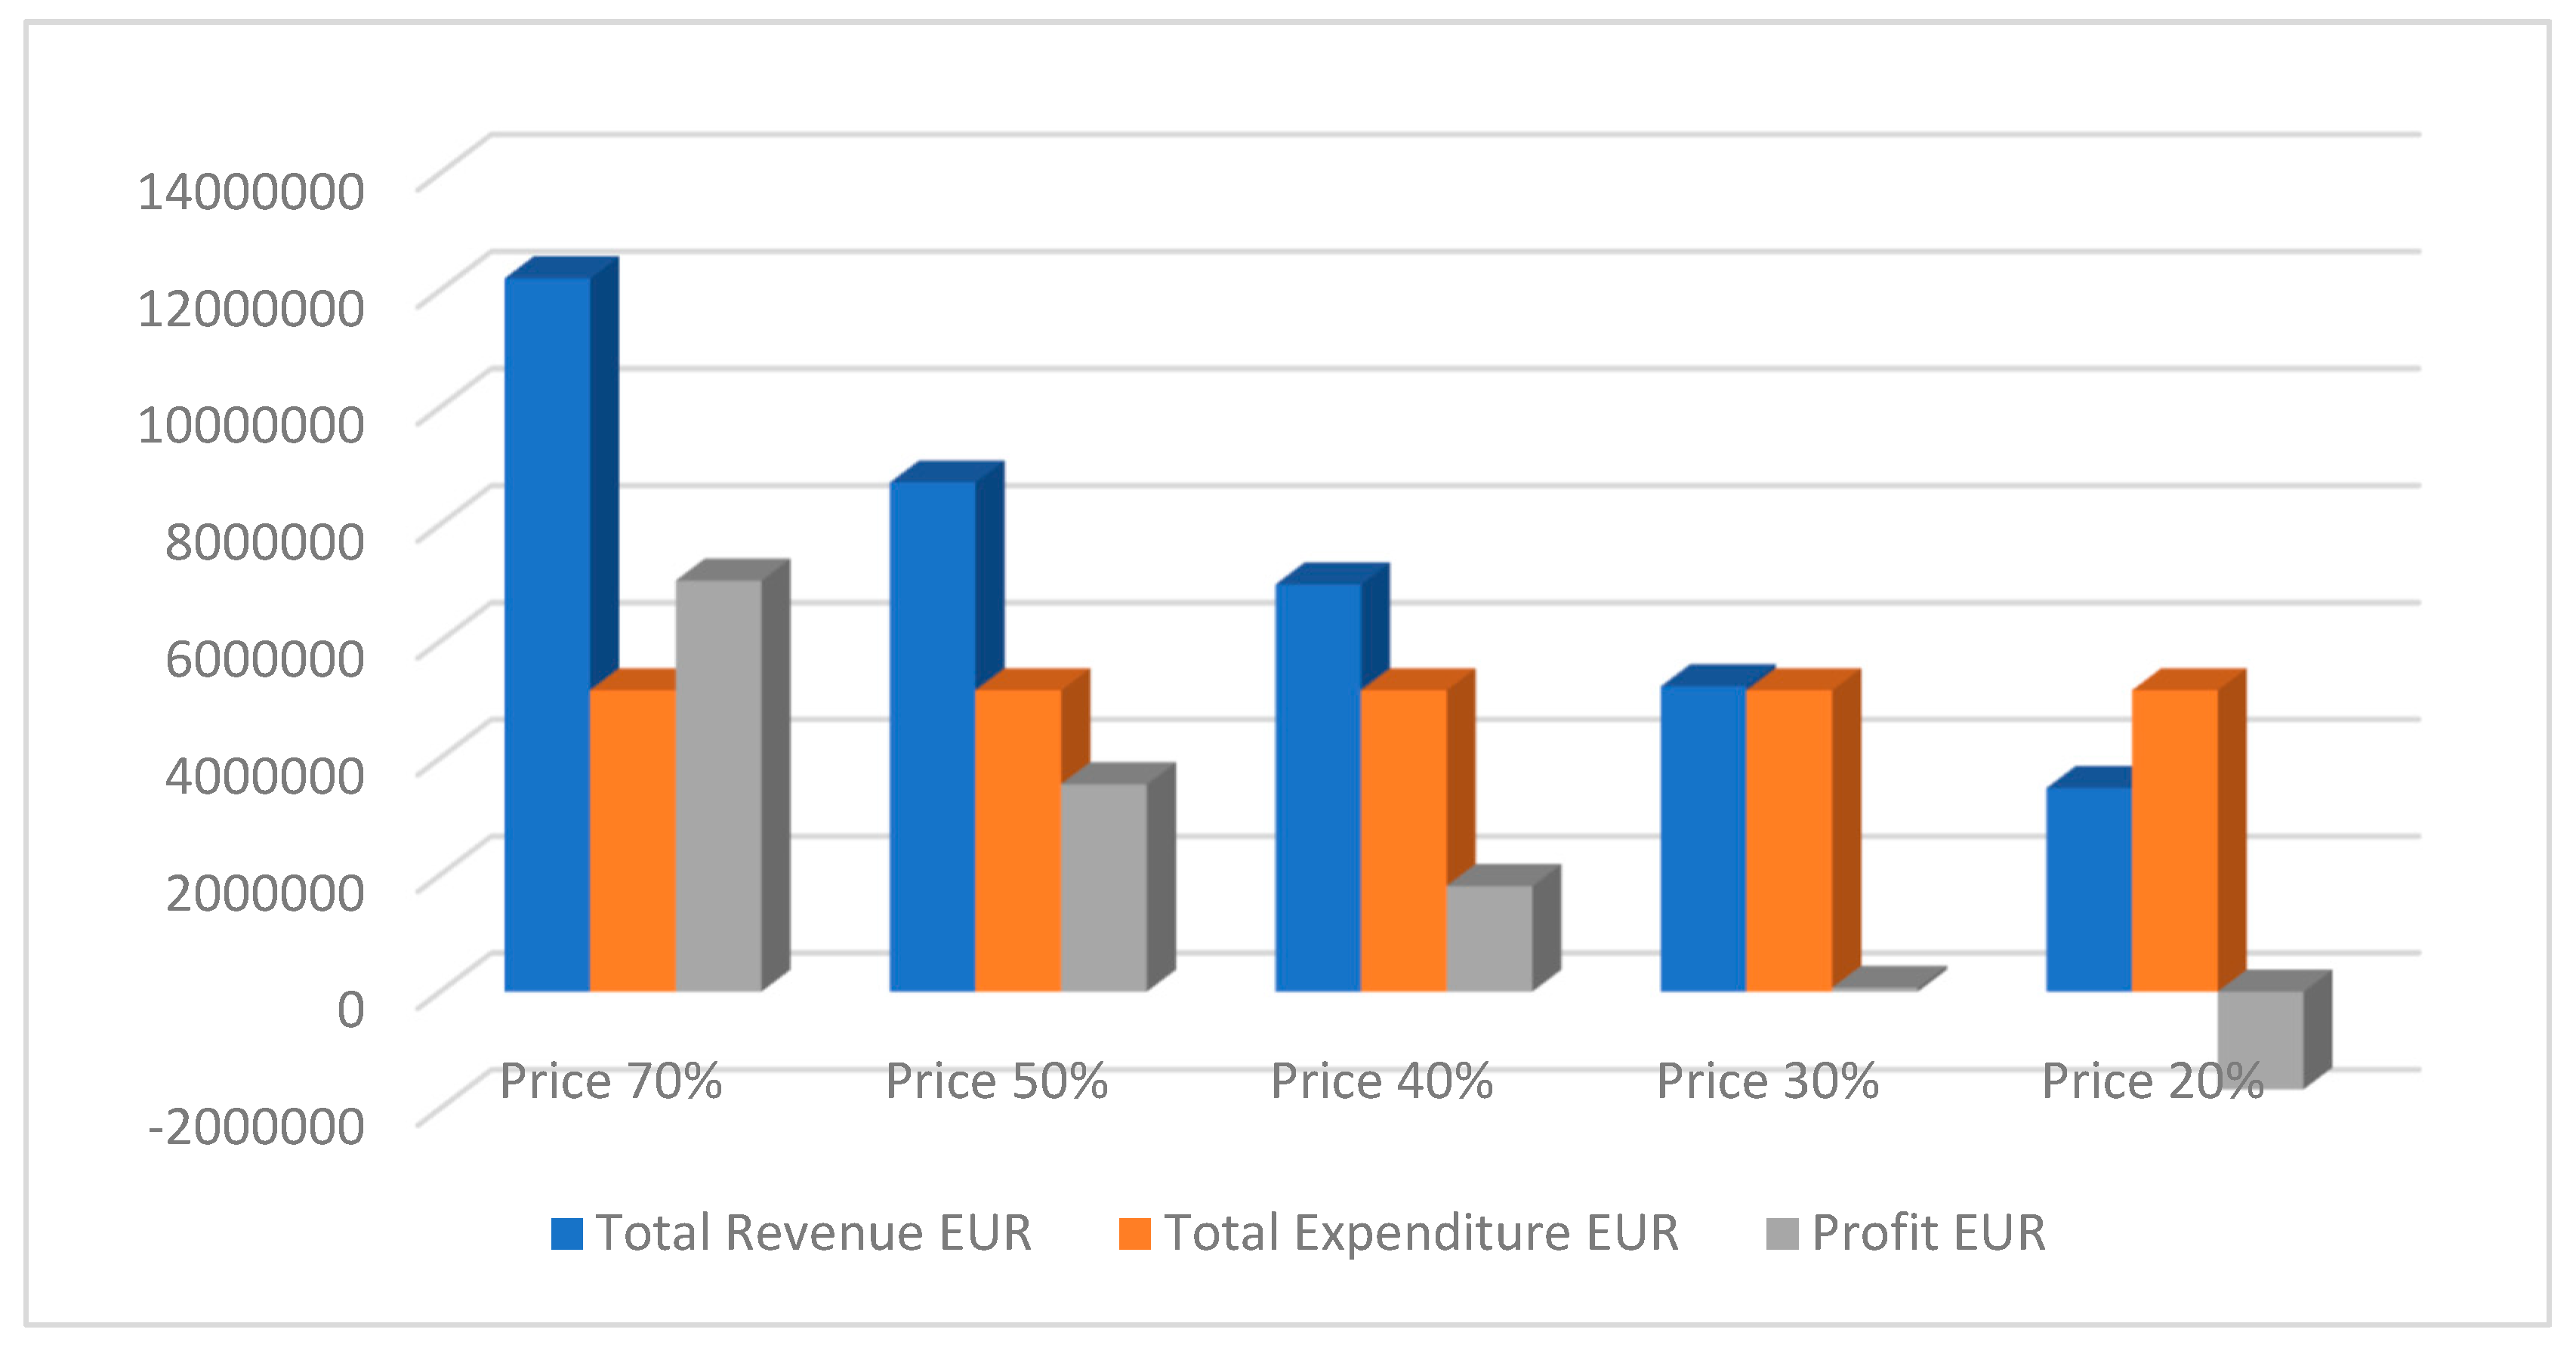
Table 1.
Content of valuable metals in PCBs (g·t-1). MP = mobile phone, M = modem, MB = motherboard, CPU = Central process unit, MIX = mixed PCBs. - = not analyzed; n.i. = not included adopted from [32].
Table 1.
Content of valuable metals in PCBs (g·t-1). MP = mobile phone, M = modem, MB = motherboard, CPU = Central process unit, MIX = mixed PCBs. - = not analyzed; n.i. = not included adopted from [32].
| Element | MP | M | MB | CPU | MIX | Element | MP |
|---|---|---|---|---|---|---|---|
| Cu | 290’120 | 164’950 | 211’380 | 166’333 | 287’300 | Cu | 290’120 |
| Zn | 4’680 | 11’820 | 670 | - | 502 | Zn | 4’680 |
| Cd | 31 | 360 | 130 | - | 360 | Cd | 31 |
| Ni | 15’740 | 14’140 | 2’810 | 78’237 | 6’143 | Ni | 15’740 |
| Pb | 14’450 | 29’010 | 18’030 | - | 27’342 | Pb | 14’450 |
| Fe | 31’610 | 57’580 | 1’810 | - | 9’900 | Fe | 31’610 |
| Cr | 1’310 | 250 | 70 | - | 3’620 | Cr | 1’310 |
| Si | 96’610 | 134’600 | 103’430 | - | 110’000 | Si | 96’610 |
| Al | 19’810 | 36’230 | 18’980 | - | 10’200 | Al | 19’810 |
| Au | 1’740 | 21 | 120 | 3,270 | 853 | Au | 1’740 |
| Ag | 1’210 | 1’760 | 660 | 1 | 425 | Ag | 1’210 |
| Sn | 28’540 | 62’160 | 33’410 | 1 | 55’500 | Sn | 28’540 |
| Sb | - | - | - | - | 1’067 | Sb | - |
| Mn | 13 | - | - | - | 33 | Mn | 13 |
| Pd | 125 | - | - | - | 250 | Pd | 125 |
| Pt | 7 | - | - | - | 12 | Pt | 7 |
Table 2.
Most spread WPCB/WPCBA pre-treatment methods and associated with advantages and disadvantages.
Table 2.
Most spread WPCB/WPCBA pre-treatment methods and associated with advantages and disadvantages.
| WPCB/WPCBA pre-treatment methods | Example(-s) | Output(-s) | Advantages | Disadvantages |
|---|---|---|---|---|
| Manual dismantling [38,39,40] |
Manual disassembly work (individual or chain) | WPCB/A in their initial state EC |
Low investment cost Utilize simple tools Job creation for low educated workers Can be performed selectively/simultaneously Highest recovery efficiency (well preserved WPCB/A) Small scale Suitable for developing countries Selective dismantling |
Lowest copper concentrate quality Low speed Health issues Labor intense High recovery efficiency Small scale Highest OPEX per tonne of concentrate Ergonomically limited |
| Traditional methods [38,39,40] |
(Incineration) | Dioxins COx,NOx; SOx PBDEs HBCDs |
Short process time Simple No investment required No equipment is required No pre-treatment is required No capacity limitation (hill size fire) |
Banned in the EU High toxicity High impact on environment and health Low concentrate quality Risk of losing control over reaction Only metals recovered Low/ none energy conversion rate (energy is lost) |
| Physical [38,39,40] |
Milling, Shredding, Electrostatic separation, Air, inertial, centrifugal, gravity Flotation (water solutions) |
Metal dry concentrate Non-metal dry concentrate Dust fraction (K, Br, Cl) Odor (Cl, Br, etc.) Water residues (only in wet separation) |
Simplicity (does not require dedicated training) Relatively high production rates Selective (can target specific group of materials) |
Lowest concentrate purity - lower only is manual |
| Flotation: -reverse, - alcaly [41,42,43,44] |
Physical separation of non-metal parts by flotation method | Metal wet concentrate (sink part). Non-metal wet concentrate (float part) | Increase recovery efficiency of base metals (Cu, Al, Zn) and Ag [42] | Methods generates significant amount of waste water. Contaminated by flotation agents (laurylamine, diesel oil, other active components). Not efficient for Au, Pd and Pt extraction increasing. Float and sink part contaminated by floating media |
| Bioleaching [38,40,45] |
Biomining using microbes: Autotrophs Heterotrophs Mesophilic thermophilic |
Copper foils Gasses (CO2, CH4, etc.) Glass fibres, ceramics Liquor CO2 |
Weak organic acids are used Eco-friendly (green technology) Suitable for both base and precious metals extraction Low temperature and energy requirement Clean nonmetal product Low investment/operating cost Cost-effective Selective recovery Less natural gas and water required |
Difficulty in microorganism isolation Difficulty in microorganism reproduction/culture Requires nutrients for microorganisms Selective to specific metals Vulnerability to heavy metals (needs selective pre-treatment?) Small scale (scalability constraints) Bacteria toxicity Low leaching speed Slow leaching kinetics Long process time (48–245 h) |
| Chemical [38,46] |
SCF (super critical fluids), Leaching, Ions exchange, etc. |
Copper concentrate Liquor emissions (e.g., HNO3, HClO4 - based) Water solutions (residues) |
Highest quality of end-products (metals recovered) Selective in terms of target materials (e.g. dedicated gold recovery), Lower gaseous emissions compared to thermal treatment (in case of SCF could even consume COx for reactions). |
Corrosive; Requires reagents and their subsequent recycling; Often requires pre-treatment and concentration for the input (e.g. mechanical or thermal); Often energy consuming (SCF case); Cannot recover non-metals |
| Chemical (mechanical pre-treatment) [38,45] |
Leaching/ SCF and physical pre-treatment. |
Physical and chemical combined | Physical and chemical combined | Physical and chemical combined |
| Electro-mechanical [38,45,47,48] |
(HVF, HVP) | Liquor (waster residues from the peeling of the epoxies, etc.), Copper clad, |
Highest ration of powder size / purity among mechanical and combined methods (98% at +3.0 mm size) Low risk of losing precious/ noble metals (the Au, Pt, Pd, etc.) coating remains mostly intact |
Relatively high electric energy consumption (5 times average mechanical size reduction) Relatively low process capacity |
| Thermal [38,39,45] |
(Pyrolysis, smelting, microwave, etc.) | Copper matte Solid by-products (e.g. iron-silica, fly ash, etc.) Gaseous emissions (COx, NOx, SOx, BrO, etc.) |
Quality/ speed ratio for enrichment is the best among all. Incinerated fraction can be converted to heat/el. energy |
Highest amount of emissions High CAPEX High OPEX Requires dedicated training Requires more operational permissions Recovery of plastics is not possible Fe and Al oxides end up in slags Lightweight dust fraction containing metals could be burned before reaching metal bath |
| Thermal-mechanical [38,39,45] |
Desoldering (IR, bath, etc.) pre-heating and physical separation | Electrical components (chipsets, resistors, etc.) Substrate plate (copper clad laminate) Solder Emissions (COx, NOx, etc) |
Accurate recovery of ECs Better homogenization of the separation process input -> less materials’ losses and emissions Allows to partially re-use ECs |
About 20% higher OPEX than fully physical pre-treatment due to thermal depopulation Lower production speed (desoldering is generally slow ~150 kg/h) Thermal treatment leads to epoxy evaporation and odor generation in higher pace |
Table 4.
possible metals market value in pure form obtained from P3 and P4 raw materials.
| Metals amount, kg in 10000 kg of raw PCB | Market price Price € per kg | Market value in Euro | |||
|---|---|---|---|---|---|
| Metal | Source P3 | Source P4 | Source P3 | Source P4 | |
| Ag | 0.995 | 8.683 | 660 | 656.7 | 5730.78 |
| Au | 0.016 | 0.543 | 56000 | 896 | 30408 |
| Pd | 0.005 | 1.028 | 35000 | 175 | 35980 |
| Cu | 58.907 | 64.226 | 8 | 471.256 | 513.808 |
| Total | 2198.956 | 72632.588 | |||
Table 5.
KPIs of production theoretical model.
| Parameter | Value |
|---|---|
| WPCB processed | 2400 mt/year |
| Extraction efficiency | 14% |
| CAPEX | 6 mil |
| OPEX | 5,2 mil EUR/year |
| Average total revenue | 8,3 mil EUR/year |
| Unit revenue | 3456 EUR/mt |
| Annual profit | 3,2 mil EUR |
| Payback period | 2 years |
Disclaimer/Publisher’s Note: The statements, opinions and data contained in all publications are solely those of the individual author(s) and contributor(s) and not of MDPI and/or the editor(s). MDPI and/or the editor(s) disclaim responsibility for any injury to people or property resulting from any ideas, methods, instructions or products referred to in the content. |
© 2023 by the authors. Licensee MDPI, Basel, Switzerland. This article is an open access article distributed under the terms and conditions of the Creative Commons Attribution (CC BY) license (http://creativecommons.org/licenses/by/4.0/).
Copyright: This open access article is published under a Creative Commons CC BY 4.0 license, which permit the free download, distribution, and reuse, provided that the author and preprint are cited in any reuse.


