
Submitted:
29 December 2023
Posted:
30 December 2023
You are already at the latest version
Abstract
The widespread use of hydrophilic intraocular lenses (IOL) in eye surgery, fabricated by poly-2- (hydroxyethylmethacrylic acid) (PHEMA), has highlighted their calcification as a serious problem, which implies their surgical explantation a rather risky process. The field of biomaterials has been developing rapidly in recent years with research interest turning to the development of novel ma-terials which involve either copolymers of PHEMA or protective functional coatings. Graphene coatings are particularly attractive because of the respective unique properties. In the present work we present the results of the investigation of the development of graphene coatings on hydrophilic IOLs and their subsequent performance with respect to calcification opacification. Hydrophilic IOL with water content of 18% by weight, were coated with graphene oxide (GO) by equilibration with GO suspensions in water. The concentrations of the suspensions ranged 1x10⁻⁴ to 20x10-4 % w/v. The GO suspensions were equilibrated with the IOLs for 5 days at constant temperature, 37°C, rotated in 30 mL tubes end over end. This treatment, resulted in the formation of a uniform coating of GO on the IOLs verified by scanning electron microscopy (SEM) and other physicochemical methods. The contact angle of the GO coated IOLs decreased significantly in comparison with the uncoated. The GO-coated IOLs exhibited higher tendency to calcify in supersaturated solutions simulating aqueous humor (SAH). The growth rate of hydroxyapatite (Ca5(PO4)3OH, HAP) on GO-coated IOLs was higher, in comparison with the respective untreated IOLs. The conversion of the GO coating by reduction with phenyl hydrazine resulted in the formation of reduced graphene (rGO) surface film, identified by Raman and XPS spectroscopy. of the rGO film was hydrophobic (contact angle 100 o) and did not calcify in supersaturated calcium phosphate solutions.
Keywords:
Hydrophilic
; Intraocular lenses (IOLs)
; Calcification mechanism of
; Protective coatings
; Gra-phene oxide
; reduced graphene oxide
1. Introduction
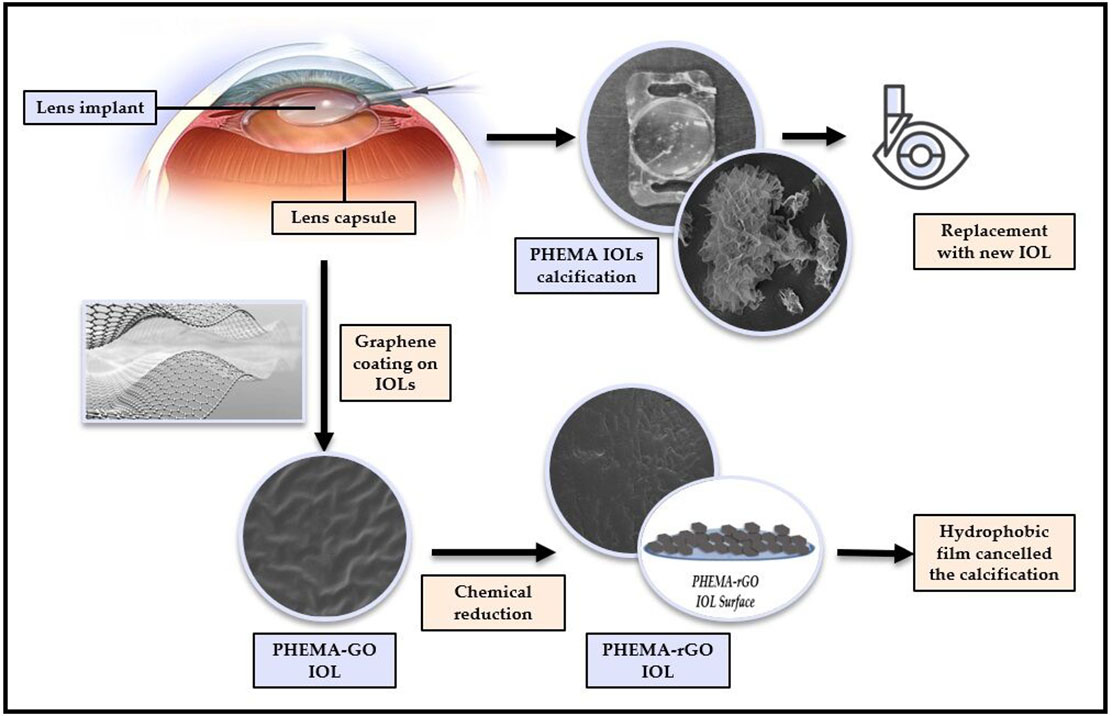
Intraocular lenses (IOLs) are implanted surgically replacing opacified cataractous lenses. A range of materials are used at present for IOLs, including collamer lenses, hydrophobic acrylic, hydrophilic acrylic, PHEMA copolymer, polymethylmethacrylate (PMMA), and silicone [1]. Polymers of exceptional quality, characterized by unique physical and optical properties, have been developed for the manufacture of intraocular lenses (IOLs). These materials adhere to the highest quality standards in the market, meeting the specific requirements of medical applications [2]. PMMA and Poly (2-hydroxyethyl methacrylate) (PHEMA) are the dominant materials used currently for cataract treatment. In the last two decades, instances of calcification have been reported for hydrophilic intraocular lenses (IOLs). Consequently, several of these IOLs have been explanted [3,4,5,6]. The calcification response following intraocular lens (IOL) implantation depends on both the composition of the aqueous humor (AH) and the material used in the fabrication of the IOLs. Reports [3] of post-operative formation of calcium phosphate deposits on intraocular lenses, attributed the formation of mineral salts to the use of viscoelastic material, specifically hyaluronic acid, during the surgical procedure. However, the mineral deposit, was not adequately and convincingly identified. It has also been reported that silicon-based intraocular lenses (IOLs), are favorable substrates for the development of calcific deposits, the composition of which was identified with physicochemical methods [5]. It appears that the sulfate and carboxylic functional groups of the viscoelastic materials used in cataract IOL surgery, , play important role promoting the nucleation and subsequent growth of calcium phosphates [6]. The formation of calcium phosphate on implanted biomaterials is the result of heterogeneous nucleation and subsequent crystal growth of the mineral phase. According to classical nucleation theory, two critical factors come into play: the aqueous humor (AH) being supersaturated with respect to calcium phosphate crystal phases, and the substrate on which heteronuclei form—specifically, on the intraocular lens (IOL) material in our case of interest [7]. The hydrophilic polymeric substrates provide favorable sites for initiation of HAP growth, in contrast with hydrophobic IOLs, which do not calcify. It may be suggested that there is a correlation between the material composition of IOLs and the formation and further growth of calcium phosphate, potentially impacting vision and posing challenges for replacement [8,9]. The most frequently used polymer for the fabrication of hydrophilic IOLs is PHEMA, a hydrophilic polymer, which can absorb significant amounts of water. Hydrogels of this type are extensively used for the fabrication of biomaterials. Recent studies suggested that PHEMA promotes nucleation and growth of hydroxyapatite (Ca5(PO4)3OH, HAP) upon contact with solutions supersaturated with respect to HAP [10,11,12].
Next generation of biomaterials suitable for the fabrication of IOLs, fulfill requirements of biocompatibility, refractive index and prevention of posterior capsular opacification. Copolymers of hydrophobic and hydrophilic polymers are now the dominant materials in the IOL market [2]. Surface-treated polymers are novel materials, which have found useful applications in microfluidics textiles, electronics, water treatment and energy industries [13,14,15]. Surface modification of polymers by chemical treatment has been used for specific applications. Most of the chemical surface treatment methods, employ wet processes in which polymers are immersed, coated, or sprayed with specific chemical substances, which modify the polymer’s surface properties. Polymers surface modification with graphene and its derivatives, has attracted considerable research interest [16]. Polymeric biomaterials are processed with graphene oxide (GO) or graphene, for bone scaffolds [17]. Graphene has been deposited in contact lenses providing protection from radiation [18]. GO is a 2-D material obtained by oxidation of graphite with strong oxidizing agents [19]. In contrast to graphene, GO is hydrophilic because of the excess oxygen content and high surface-to-volume ratio [20]. A significant advantage of GO is that it is amenable to surface modification. The chemical structure of GO renders it appealing for various biomedical applications, including tissue engineering, drug delivery, wound healing, and the development of medical devices [21]. The oxidized form of graphene, consists of carbon, oxygen, and hydrogen, featuring carbonyl, carboxyl, hydroxyl, and epoxy groups. The composition of GO allows the formation of stable water dispersions [22,23]. While the surface of GO sheets exhibits some defects, the fundamental structure of the material closely resembles that of pure graphene [24]. The flexibility and hydrophilicity of GO facilitates cell growth and imparts antibacterial and antimicrobial properties. It is important to note that high concentrations of GO can potentially lead to reduced biocompatibility [25,26]. However, the presence of functional groups enables GO combination with fully biocompatible, non-toxic polymeric materials.
In this study, we have tested the hypothesis of the relationship between surface hydrophilicity and induction of nucleation and growth of HAP on PHEMA which was modified with layers of hydrophilic graphene oxide (GO). Hydrophobic reduced GO (rGO) coatings on PHEMA hydrophilic IOLs were developed by the reduction of GO with phenylhydrazine at room temperature. Both GO and rGO treated IOLs were tested for their ability to induce nucleation and crystal growth of HAP by heterogeneous nucleation upon immersion in stable calcium phosphate supersaturated solutions and by comparison of the respective crystal growth rates.
2. Materials and Methods
All solutions were prepared using triply distilled, deionized water. Stock calcium and phosphate solutions were prepared from crystalline calcium chloride (CaCl2·2H2O) and sodium dihydrogen phosphate (NaH2PO4) (Puriss. Merck KGaA, Darmstadt, Germany). Calcium chloride solutions were standardized with standard EDTA solutions (Merck) using calmagite indicator and by atomic absorption spectrometry (AAS, air-acetylene flame, Perkin Elmer AAnalyst 300, Norwalk, CT, USA). The phosphate stock solutions were standardized with potentiometric titrations with standard sodium hydroxide solutions (Titrisol®, Merck KGaA, Darmstadt, Germany) and by spectrophotometric analysis using the vanadomolybdate method spectrophotometrically (Perkin Elmer lambda 35, Norwalk, CT, USA) [27]. Sodium chloride stock solutions were prepared from the crystalline solid. The graphene oxide suspensions were prepared from concentrated aqueous suspension (0.4% w/v Graphenea S.A., San Sebastian, Pais Vasco, Spain) with appropriate dilutions with water.
2.1. Treatment of IOLs with Graphene Oxide
Hydrophilic IOLs (consisting mainly of PHEMA with 18% water content) were equilibrated with well mixed GO suspensions to deposit graphene oxide layers on their surface. The IOLs were introduced in 50 mL of GO suspensions in HDPE vials of various concentrations between 1 - 10x10-4 % w/v, prepared from the stock suspension of 0.4 g/l. The capped vials were rotated end over end to ensure homogeneity of the suspensions in a constant temperature chamber at 37oC (1st step, Figure 1) for a period of five days. The rotation speed was adjusted to 5 rpm, sufficient to keep the suspensions homogeneous. Past the equilibration time, the IOLs were carefully removed from the suspensions and were thoroughly rinsed with at least 500 mL of triply distilled, demineralized water. 6 IOLs were treated in each vial and they were used for the subsequent characterization (Fourier Transform Infrared spectroscopy (FTIR), Raman spectroscopy (RS), X-ray diffraction (XRD), X-ray photoelectron spectroscopy (XPS) and scanning electron microscopy (SEM). For the calcification tests, three of the treated IOLs were used, with a total geometric surface of 3.72 cm2. Past the first processing stage, the GO layer deposited on the IOLs was subjected to chemical reduction [28]. Specifically, GO coated IOL specimens were suspended in a solution of a strong reducing solution of phenylhydrazine, for three hours at 25 oC (2nd step, Figure 1). Next, the IOLs were removed carefully with plastic forceps to avoid surface scratches and they were rinsed thoroughly with triply distilled, demineralized water, before use in the mineralization experiments. The reduced IOLs were kept at room temperature. Following chemical reduction, were characterized and tested as the IOL-GO coated specimens.
2.2. Mineralization Experiments-Constant Composition Reactor (CCR)
Supersaturated solutions were prepared in a water-jacketed, double-walled borosilicate glass reactor, maintained at a constant temperature of 37.0 ± 0.1 °C by circulating water from a thermostat. Equal volumes (0.100 dm3 each) of calcium chloride and sodium dihydrogen phosphate solutions were simultaneously transferred in the reactor, volume totaling 0.220 dm3 under continuous stirring at ca. 200 rpm with a magnetic stirrer and a Teflon-coated stirring bar. The solution's pH was adjusted to 7.40 by adding standard sodium hydroxide solution. pH measurements were conducted using a combination glass ‖Ag |AgCl electrode, s standardized before and after each experiment with NIST standard buffer solutions [29]. The ionic strength of the supersaturated solutions, was adjusted with NaCl at 0.15 mol·dm-3 by the addition of the appropriate volume of the respective stock solutions. The final concentrations of total calcium (Cat) and total phosphate (Pt) were adjusted to levels ensuring that the driving force for the formation of calcium phosphates simulated that found in the aqueous humor healthy humans [10,30]. Before, during, and after adjusting the pH of the supersaturated solutions, an inert atmosphere was maintained by continuously bubbling pure water vapor saturated pure nitrogen gas through the solutions. Once the stability of the supersaturated solutions was confirmed, as suggested by the solution pH stability for at least two hours, hydrophilic IOLs or treated IOLs (3–5) were securely mounted on a special holder, made of TEFLON®, allowing exposure of both the anterior and posterior sides. The mounted IOLs were fully immersed in the supersaturated solutions. The pH of the solutions was continuously monitored and the pH measuring electrode was connected to the controller unit connected through the appropriate interface and software with a computer. A motorized stage, with a stepper motor capable of moving two mechanically coupled, calibrated precision borosilicate glass syringes, delivering volumes as small at 30 μL was controlled by the controller unit. The onset of precipitation was identified by a drop in the solution's pH, due to the proton release accompanying the formation of the solid precipitate. For HAP precipitation, the reaction is shown in Equation (1).
Drop of the solution's pH, approximately equal to the sensitivity limit of the electrode (around 0.005 pH units), prompted the addition of equal volumes of titrant solutions from the two syringes. The composition of the solutions in the syringes (in terms of calcium, phosphorous and hydroxide reactants) was calculated according to the stoichiometry of the precipitating solid Cat:Pt:OHt = 5:3:1 (subscript t stands for total) .The composition of the titrant solutions was calculated as shown in Equations (2) to (5).
Titrant solution A: Calcium chloride solution and sodium chloride represented as:
Titrant solution B: Sodium dihydrogen phosphate and sodium hydroxide as:
where [] denote analytical concentrations of the enclosed species, superscript R denotes the supersaturated solution, TA and TB denote the titrant solutions in the two syringes A and B respectively, m is an arbitrary constant determined by preliminary experiments and n is a constant such that .
The composition of the titrant solutions A and B was the proper to maintain the activities of the ion species in the supersaturated solutions throughout the precipitation of HAP. From a series of preliminary experiments, the value obtained for .
By monitoring the volume of titrants added as soon as the IOLs were immersed in the supersaturated solutions (time, t = 0), it was possible to precisely measure the induction time (elapsed time from t = 0 until the beginning of titrant addition) and to calculate the rates of precipitation of the salt forming on the introduced substrate. The rates are calculated from the slope of the corresponding volume-time profiles (moles HAP/s). The rates were moreover normalized per unit surface area of the substrate responsible for the formation of the precipitate selectively. The experimental setup used for the investigation of the kinetics of hydrophilic IOL mineralization is illustrated in Figure 2.
2.3. Characterization of the Solid Substrates and Precipitates
2.3.1. Thermogravimetric Analysis (TGA)
Thermogravimetric analysis was conducted with the analyzer TA Q50 (Newcastle, Delaware TA instruments / WATERS) in the temperature range 25 - 700 oC, nitrogen atmosphere and heating rate of 10 oC/min.
2.3.2. Contact Angle Measurements
Contact angle measurement of IOLs before and after treatment was carried out using an optical microscope (x4) and a camera. Photographs were taken for each IOL with or without treatment. The contact angle was measured using ImageJ® software.
2.3.3. UV-VIS Spectroscopy
UV-Vis absorption spectra of the modified IOLs were collected at room temperature using a UV-VIS spectrophotometer (Perkin Elmer, Model Lambda 35). The IOLs samples were placed in Teflon holders, specifically designed to fit in quartz cuvettes of 1 cm optical path, allowing UV radiation to reach the exposed specimens.
2.3.4. Raman Spectroscopy
A Raman spectrometer (iRaman Plus BWS465-785H, B&W Tek Inc., Newark, DE, USA) equipped with an optic microscope (B&W Tek Inc., Newark, DE, USA) and a laser with a 785 nm excitation line was used. An Olympus objective lens (20×) was used for focusing onto the IOLs surface. The system was equipped with a high quantum efficiency CCD array detector. The nominal power of the incident laser was 455 mW and 10% of the laser power was used for recording the Raman spectra of IOLs specimens. Each spectrum was recorded in the region of 200–2800 cm−1. Software BwSpec4® (B&W Tek Ink, Newark, DE, USA) used for spectra recording.
2.3.5. X-Ray Photoelectron Spectroscopy
The XPS measurements of the samples past the formation GO coatings and their reduction with phenyl hydrazine, were carried out in a UHV chamber with a SPECS LHS-10 hemispherical electron analyzer. An unmonochromatized Al Kα line at 1486.6 eV and an analyzer pass energy of 36 eV giving a full width at half-maximum (FWHM) of 0.9 eV for the Ag 3d5/2 peak were used. The analyzed area was a spot of 3 mm diameter. The XPS peaks were fitted by decomposing each spectrum into individual mixed Gaussian-Lorentzian peaks. For spectra collection and treatment, including fitting, the commercial software SpecsLab Prodigy (Specs GmbH, Berlin) was used.
2.3.6. Scanning Electron Microscopy
Scanning electron microscope (SEM) LEO SUPRA with Bruker 145 XS EDX microanalysis unit (Carl Zeiss, Jena, Germany) was used for the morphological analysis and the chemical microanalyses of the specimens. The specimens were gold sputtered.
2.3.7. Atomic Absorption Spectrometry (AAS)
Samples were withdrawn during mineralization experiments, filtered through membrane filters (0.2 μm Millipore) and the filtrates were acidified and then analyzed for calcium concentration with atomic absorption spectrometry (AAS, Perkin Elmer AAnalyst 300) using air-acetylene mix of gases and the appropriate hollow cathode lamp at 422.7 nm.
3. Results
3.1. Surface Modification of IOLs with GO
3.1.1. Thermogravimetric analysis
The results of TGA analyses obtained in N2 atmosphere for IOLs manufactured mainly of Poly (2-hydroxyethyl methacrylate) (PHEMA) before and after treatment by equilibration in GO suspensions and GO from the respective suspensions, are shown in Figure 3. The weight loss observed in the untreated IOL (approximately 20%) below 200 °C was associated with the removal of water from the hydrogel (18% of the IOL + humidity of the specimens). The next weight loss above 300 °C was attributed to the polymeric organic backbone combustion. The GO thermal decomposition profile, exhibited three distinct steps. The initial mass loss, below 100 °C, attributed to the removal of physically adsorbed water (ca. 1,5% weight loss), a more rapid decomposition in the range of 300-400 °C (22% weight loss) ascribed to the pyrolysis of labile oxygen-containing functional groups, such as carboxyl, anhydride, or lactone groups and the third decomposition step, between 450 and 600 °C, accompanied by approximately 20% mass loss, was attributed to the thermal decomposition of the carbon skeleton of GO, particularly involving the removal of more stable oxygen groups like phenol, carbonyl, and quinone. Examining three different hydrophilic IOL samples, coated with GO from suspensions with varying solid concentrations, the highest mass loss (80%) was observed in the temperature range of 300 to 400 °C for the PHEMA IOL treated with the most concentrated GO suspension tested (1x10⁻³ % w/v GO) (Figure 4). This finding was in agreement with the presence of higher concentration of carboxyl and/or lactone functional groups on the GO-coated samples.
As may be seen in Figure 4, the higher the surface coverage of the IOLs with GO the higher the mass loss in the temperature range between 350-4000C. Apparently, the higher the concentration in the suspended GO solids the more the quantity of GO deposition the IOL surfaces.
3.1.2. Air-Water Interface Contact Angles
The contact angles of the test materials were measured, before and after the deposition of GO on IOL. It was found that the value of contact angles decreased from 67° to 60°, which suggested that the deposition of GO rendered the surface of the hydrophilic IOLs more hydrophilic. The values of measured contact angles of the GO treated IOL-air-water interfaces, are presented in the graph in Figure 5.
Chemical reduction of the GO layer(s) deposited on the surface of IOLs following equilibration with the corresponding suspensions, resulted in composite materials with higher IOL-water contact angle values as may be seen in the graph shown in Figure 6.
Typical images of water drops deposited on the IOLs (untreated and treated) are shown in the Figure 7.
3.1.3. UV-Visible Spectroscopy
The UV-Vis spectra of the untreated and treated hydrophilic IOLs were studied over a wide range of wavelengths covering both the UV and visible domain in order to evaluate the optical characteristics of the IOLs both before treatment and after the formation of GO and rGO overlayers. as the spectra obtained are shown in Figure 8.
Each of the IOLs suspended in GO suspension with different concentration showed an absorption peak at ~240 nm due to the aromatic C-C bonds, in agreement with literature reports [31]. The higher the GO suspension concentration, used for the equilibration with the IOLs, which as shown by the TGA analysis resulted in thicker GO overlayers, the higher was the absorbance at 240 nm (Figure 8(a)). This finding is interesting since IOL manufacturers include in the copolymers, UV absorber monomers for eye protection since 80s already to provide protection from damaging radiation [32,33]. The deposition of GO and rGO apparently provide improved protection. Despite the fact that the thicker the coverage of the IOL the higher is the absorbance an optimization of the layer thickness should be applied to minimize light absorbance in the visible part of the light spectrum. Upon reduction with phenyl hydrazine the conversion of GO to rGO there was a relative decrease of the absorbance at 240 nm (Figure 8b), probably due to the elimination of functional groups of the GO and the restoration of the conjugated structure [34,35].
3.1.4. Raman Spectroscopy
Raman spectra were used for the comparison of the IOLs before and past the treatment with GO suspensions and past their conversion into rGO. The spectra obtained are shown in Figure 9. As may be seen, two main vibrations were found in the range of 1100 and 1700 cm-1 for GO and rGO, corresponding to D and G modes [36,37]. The D vibration band corresponds to ring breathing mode from sp2 carbon rings, can be seen at 1350 and 1347 cm-1 for GO and rGO, respectively. Further, G vibration band corresponds to scattering of phonons by sp2 carbon, appeared at 1600 cm-1 for GO and 1595 cm-1 for rGO.
Moreover, Raman intensity ratio, ID/IG was used to estimate structural disorder, which was found to increase from 0.92 to 1.02, during the reduction of GO to rGO. It may be suggested, that this change is due to the to the removal of functional groups attached to the GO surface, like oxygen groups, after reduction and the concomitant formation of defects [38]. Raman spectra for the hydrophilic IOLs goes treated by equilibration with GO suspensions (5x10⁻⁴ % w/v), past reduction with phenyl hydrazine, are shown in Figure 9. As may be seen sharp peaks and broad bands appeared as follows: 473 cm-1, deformation mode; 603 cm-1, νsCCO; 830 cm-1, νsCOC; 896 cm-1, νsCOC(H); 968 cm-1, ρCH3; 1089 cm-1, νasOCH2C, ρCH3, and ρCH2; 1204 cm-1, τCH2 and ωCH2; 1277 cm-1, τCH2 and ωCH2; 1452 cm-1, δCH2 and δCH3; and 1726 cm-1, νC=O [39]. The G and D bands may also be seen. These bands were attributed to the vibrations of the GO functional groups. On the other hand, the Raman spectra of the rGO coated IOLs, following the chemical reduction of the GO layers deposited by equilibration with the respective suspensions showed differences (Figure 10). The intensities of the characteristic PHEMA functional groups, which are the main chemical component of the hydrophilic IOLs, were lower, while the peaks corresponding to G and D modes were sharper. The ID/IG ratio was 0.81 and 0.93, for PHEMA-GO and PHEMA-rGO coated IOL specimens, respectively.
3.1.5. XPS Analysis
The formation of GO or rGO coatings on the surfaces of the hydrophilic IOLs, was demonstrated by X ray photoelectron spectroscopy (XPS) measurements. The XPS measurements of the GO coated hydrophilic IOLs and of those in which the GO layers were reduced chemically with phenyl hydrazine are shown in Figure 11. The deconvoluted C1s XPS peaks were analyzed into several components for PHEMA and GO or rGO and carbon-carbon bonds. In, Figure 12 the deconvoluted O1s XPS peaks analyzed into two components, for PHEMA and GO or rGO compounds, carbon-oxygen single and double bonds at binding energies 533.2 and 532.0 Ev, respectively are shown.
The % atomic concentration calculated from the intensity (peak area) of the XPS peaks C1s and O1s weighted with the corresponding relative sensitivity factors (RSF) derived from the Scofield cross-section taking into account the electron transport properties of the matrix, and the energy analyzer transmission function.

Table 1.
Atomic concentration (%) of carbon and oxygen (error=1%) calculated from XPS peaks.
| Samples | Atomic concentration (%) | |
|---|---|---|
| %C | %O | |
| PHEMA | 68.2 | 31.8 |
| PHEMA-GO | 69.9 | 30.1 |
| PHEMA-rGO | 75.9 | 24.1 |
The XPS analysis of atomic components concentration of hydrophilic IOLs treated with GO or r GO, were in agreement with the respective nominal values. GO consists, in general, of C-O and C=O bonds and the C:O percentage ratio is ca. 65:35. The PHEMA-GO XPS atomic concentration and carbon bonds components were close to the nominal. In rGO, the C-O bonds and the total oxygen were much lower than the corresponding of GO, in agreement with our results which prove unambiguously the conversion of GO to rGO on the hydrophilic IOLs [40].
3.1.6. Morphological Examination
Past equilibration with GO suspensions, the deposits on the IOLs were investigated with optical microscopy (OM) and SEM, (Figure 12). The morphology of IOLs following the deposition of GO by equilibrations with GO suspensions of concentrations 2x10⁻⁴ to 7x10⁻⁴ % w/v GO is shown in the pictures in Figure 13. As may be seen the surface coverage of the IOL was complete, and increased with increasing GO suspension concentration. The highest concentration was shown to lead to the formation of aggregates on the surface of the IOL. For the calcification tests, IOLs coated by GO upon equilibration with low concentration suspensions were selected.
The morphology of the coated hydrophilic IOLs past chemical reduction with phenyl hydrazine, is shown in the SEM pictures presented in Figure 14.
The mechanism we suggest for the mode of graphene oxide - PHEMA IOL interaction and the subsequent reduction to rGO is shown in Figure 15.
According to the mechanism described schematically in Figure 15, it is possible that there is some type of association between the predominantly ionized (at pH exceeding 4.5) -OH groups on the IOLs present in the predominant polymeric component PHEMA. It is suggested that hydrogen bonds develop between the carboxyl and carbonyl groups of GO and of the hydroxyl groups of PHEMA. Chemical reduction, although it results to the drastic reduction of carboxyl groups, does not eliminate them. The higher sp2 character of rGO on the other hand is expected to favor van der Waals interactions with PHEMA.
3.2. Mineralization Experiments
Hydrophilic IOLs coated upon equilibration with GO suspensions with GO (PHEMA-GO), before and after chemical reduction with phenyl hydrazine at room temperature (PHEMA-rGO) were tested with respect to their ability to induce heterogeneous nucleation and crystal growth of HAP. For comparison reasons, aged HAP crystals (10 mg, SSA = 70 m2·g-1) were equilibrated with GO suspensions in water of different concentrations (2-20x10-4 % w/v GO), were studied. Next, the suspension was filtered through membrane filters and the crystals on the filter were washed thoroughly with triply distilled water to ensure that there were no free GO particles. The GO coated HAP crystals were next dried and kept at room temperature. The dry, powdered solid was used to inoculate stable supersaturated solutions of calcium phosphate. In all cases, the growth of HAP on the crystals introduced in the supersaturated solutions started without the lapse of induction times, suggesting the absence of nucleation energy barrier. The crystal growth of the inoculating HAP crystals took place at constant supersaturation, as described in the experimental part (Section 2.2). In Figure 16, the graph of crystal growth rates of HAP, as a function of the GO suspensions concentration with which the HAP crystals were equilibrated is shown.
As may be seen, increasing GO concentration of the suspensions equilibrated with HAP, which resulted in higher GO retention by the crystals (confirmed by TGA analysis which showed proportionally higher mass loss at the temperature domain between 300-4500C) the crystal growth rate of hydroxyapatite (HAP) formation increased as well. The increase of the crystal growth rate up to equilibration with 10x10-4 % w/v concentration of GO suspension showed a tendency to level off, for the solid equilibrated with 20x10-4 % w/v GO suspension, the rate of crystal growth increased dramatically. It should be noted that the high concentration GO suspension resulted in much higher deposition of GO on HAP, and the concomitant growth rate of HAP was higher despite the fact that the specific surface area of the GO-HAP composite substrate was the same as that for HAP. The apparent conclusion is that the presence of GO on HAP crystals resulted in the enhancement of the active crystal growth sites, possibly by the contribution of the ionized carboxyl groups of GO.
The morphology of HAP crystals grown at constant supersaturation is shown in the SEM photos in Figure 17.
Next, hydrophilic IOLs modified by equilibration with GO suspensions, before and after reduction with phenyl hydrazine, were investigated. For the IOL specimens coated with GO, past equilibration with the respective suspensions, it was found that the crystal growth rate of HAP increased with increasing relative supersaturation. Moreover, the rate of HAP growth increased proportionally with the concentration of GO of the suspensions equilibrated with the hydrophilic IOLs (Figure 18). The HAP crystal growth rates in this case, were expressed with respect to the total geometrical surface area of IOLs specimens (3.72 cm2) which induced selectively on their surface the nucleation and crystal growth of HAP crystals.
GO coated PHEMA IOLs yielded higher HAP crystal growth rates in comparison with untreated HAP. The accelerated HAP growth was attributed to the carboxyl groups present on GO, which at pH 7.40 were ionized, and promoted nucleation and subsequent growth of HAP. It is suggested that the formation of surface complexes between the surface functional groups: -O- (from PHEMA) and -COO-, -O- (from GO) favored the formation of surface complexation with Ca2+ ions in the supersaturated solutions, thus increasing locally supersaturation to a significant extent in comparison with the corresponding in the bulk solution. Reports in the literature claim that the formation of the so called prenucleation clusters (which however have not been defined) are responsible for the onset of nucleation and crystal growth [41,42]. Further work on the dependence of the crystal growth rates on the fluid dynamics of the system is needed for the clarification of the exact mechanism.
The surface morphology of the HAP grown on IOLs modified with GO or rGO, as shown in the SEM pictures of Figure 19, consisted of plate-like nanocrystals, spread rather uniformly all over the surface of the IOLs.
There are several reports [43,44,45] suggesting that the interaction between Ca2+ ions and negatively charged residues of biomolecules, such as carboxylate and phosphorylated groups play a key role in HAP precipitation. A possible mechanism describe these interactions, responsible for higher rates of PHEMA-GO mineralization in comparison with PHEMA without treatment, is schematically shown in Figure 20.
Electrostatic attraction of Ca2+ at the negatively charged IOL surface consisting of -COOH functional groups, in the case of the GO coated IOL, contributes to the development of locally high supersaturation, which together with possible structural compatibility, allows to overcome the heterogeneous nucleation barrier and promote further crystal growth of HAP.
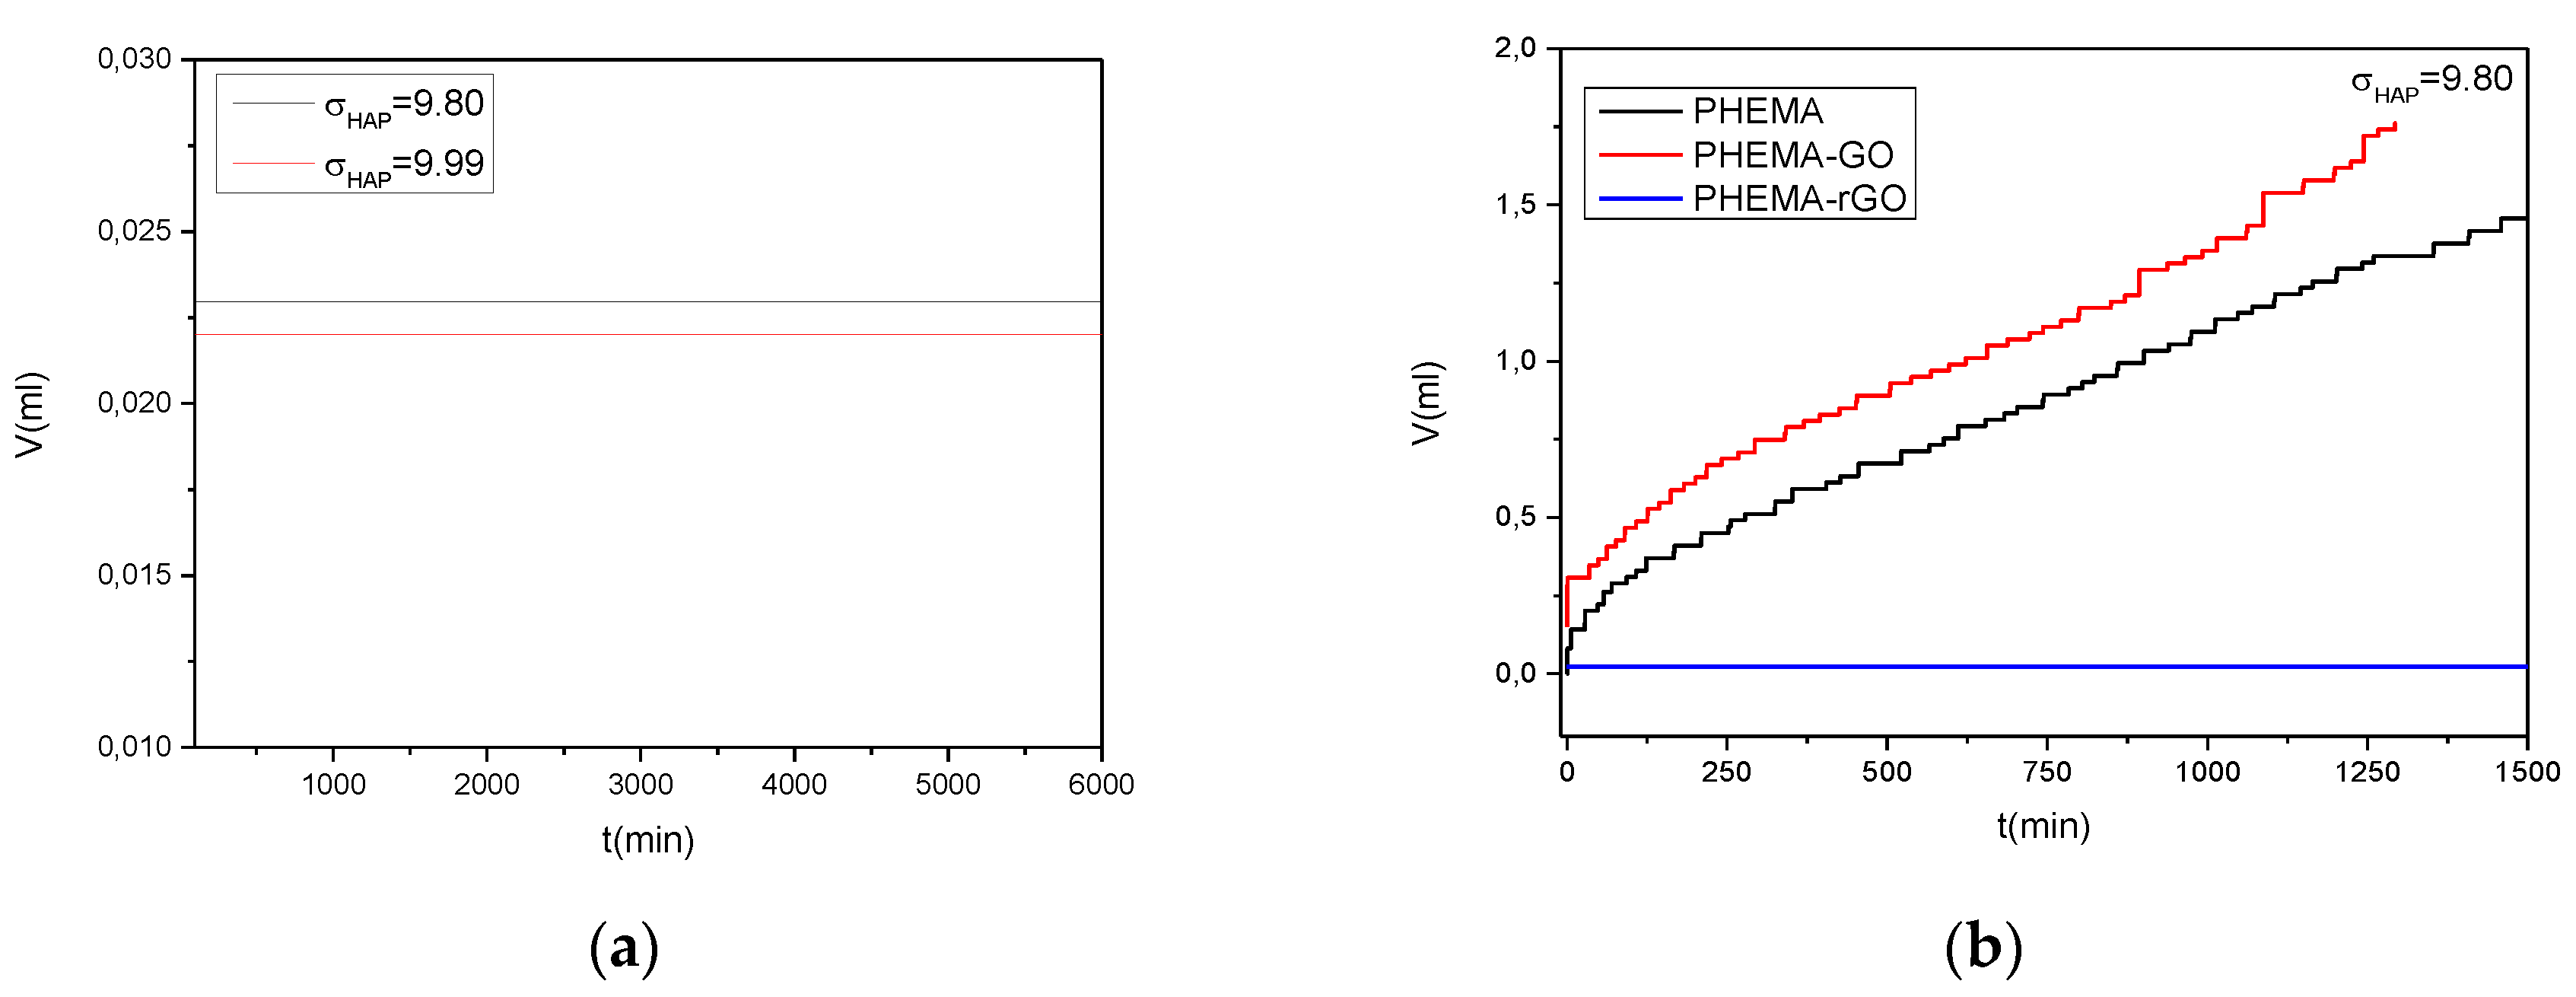
Crystal growth rate of HAP on rGO coated IOLs as a function of relative supersaturation, at constant supersaturation conditions, were also investigated. Added volume of the solutions necessary to maintain supersaturation, as a function of time, is shown in Figure 21(a). As may be seen no addition was done for at least 2 days. In Figure 21(b) a comparison of added volumes of titrant solutions as a function of time for the mineralization of hydrophilic IOLs without coating and with coatings of GO and for rGO are shown. It is interesting to note that the rates of HAP crystal growth on PHEMA IOLs were comparable (though lower) than the respective rates of the GO coated. These findings suggest that the important factor is the hydrophilicity rathe attributed to the polymer by the functional groups, than the type of the functional groups themselves.
The reduction of GO to graphene (rGO), resulted in the formation of a hydrophobic film on the surface of PHEMA substrate, which cancelled the calcification, possibly because of the absence of sufficient density of carboxyl and/or hydroxyl groups, which favor nucleation and growth of HAP providing the necessary active sites by surface complex formation with Ca2+ and/or PO43- ions [43]. The cancellation of HAP formation on the rGO coated hydrophilic IOLs suggested that heterogeneous nucleation and subsequent growth of HAP crystals responsible for the calcification opacification of IOLs depends strongly on the surface chemistry of the respective biomaterials used and in particular on the presence of ionized surface groups, which through surface complexation, provide the necessary active sites for crystal growth increasing locally the supersaturation with respect to the forming crystal phase.
4. Conclusions
Calcium phosphate biomineral deposits form heterogeneously on surfaces in contact with solutions supersaturated with respect to HAP, like the biological fluids. The calcification potential of IOL surfaces depends strongly on their hydrophilic character. Hydrophilic IOL surfaces containing functional groups, able to form surface complexes through electrostatic interactions with calcium ions, result to surface complexes formation and to the development of locally high supersaturation with respect to the HAP promoting its nucleation and further crystal growth. In the present work, hydrophilic IOLs, consisting mainly of PHEMA, were coated with graphene oxide by equilibration with GO suspensions. The GO coatings were converted to rGO by chemical reduction with phenyl hydrazine at room temperature. The GO coated IOLs favored HAP formation in supersaturated solutions. The rate of HAP formation was proportional to concentration of GO suspensions with which IOLs were equilibrated. Similar results were obtained with HAP crystals coated with GO in the same way. It is suggested that the interactions of Ca2+ from the supersaturated solutions at the GO coated IOL surface, containing -COOH functional groups, is important to overcome the heterogeneous nucleation barrier and promote further crystal growth of HAP. On the other hand, the chemical reduction and subsequent elimination of the -COOH functional groups resulting to the formation of hydrophobic rGO failed to induce HAP crystal growth, suggesting that the presence of ionizable groups on the surface is instrumental for the catalysis of mineral formation on the respective surface.
Author Contributions
P.D.N. was involved with the experimental investigation, methodology, data curation and writing-original draft preparation. L.S. was involved with the XPS analysis and methodology. M.K. was involved with conceptualization and data curation, P.S.G was involved with data curation and IOL examination, P.G.K. and S.P.G. was involved in conceptualization, supervision, ensuring resources and writing and editing of the work. All authors have read and agreed to the published version of the manuscript.
Funding
This research received no external funding.
Data Availability Statement
Not applicable.
Acknowledgments
The authors acknowledge the assistance of Professor Christos Kontoyannis and Pharmaceutical Analyst Stephanie Fertaki, University of Patras, Department of Pharmacy, for Raman analyses.
Conflicts of Interest
The authors declare that they have no known competing financial interest or personal relationships that could have appeared to influence the work reported in this paper.
References
- Zhang, Y.; Zhang, C.; Chen, S.; Hu, J.; Shen, L.; Yu, Y. Research Progress Concerning a Novel Intraocular Lens for the Prevention of Posterior Capsular Opacification. Pharmaceutics 2022, 14, 1343. [Google Scholar] [CrossRef]
- Vacalebre, M.; Frison, R.; Corsaro, C.; Neri, F.; Santoro, A.; Conoci, S.; Anastasi, E.; Curatolo, M.C.; Fazio, E. Current State of the Art and Next Generation of Materials for a Customized Intraocular Lens according to a Patient-Specific Eye Power. Polymers 2023, 15, 1590. [Google Scholar] [CrossRef]
- Suh, Y.; Oh, C.; Kim, H.M. Comparison of the long-term clinical results of hydrophilic and hydrophobic acrylic intraocular lenses. Korean J. Ophthalmol 2005, 19, 29–33. [Google Scholar] [CrossRef]
- Jensen, M.K.; Crandall, A.S.; Mamalis, N.; Olson, R.J. Crystallization on intraocular lens surfaces associated with the use of Healon GV. Arch. Ophthalmol. 1994, 112, 1037–1042. [Google Scholar] [CrossRef]
- Ursell, P.G.; Spalton, D.J.; Pande, M.V.; Hollick, E.J.; Barman, S.; Boyce, J.; Tilling, K. Relationship between intraocular lens biomaterials and posterior capsule opacification. J. Cataract Refract. Surg. 1998, 24, 352–360. [Google Scholar] [CrossRef] [PubMed]
- Bompastor-Ramos, P.; Póvoa, J.; Lobo, C.; Rodriguez, A.E.; Alió, J.L.; Werner, L.; Murta, J.N. Late postoperative opacification of ahydrophilic-hydrophobic acrylic intraocular lens. J. Cataract Refract Surg. 2016, 42, 1324–1331. [Google Scholar] [CrossRef]
- Guan, X.; Tang, R.; Nancollas, G.H. The potential calcification of octacalcium phosphate on intraocular lens surfaces. J. Biomed. Mater. Res. A 2004, 71, 488–496. [Google Scholar] [CrossRef]
- Rezaei-Kanavi, M.; Javadi, M.A.; Mirbabaei-Ghafghazi, F. Intraocular lens calcification; A clinicopathologic report. J. Ophthalmic Vis. Res. 2009, 4, 122–124. [Google Scholar] [CrossRef] [PubMed]
- Izak, A.; Werner, L.; Pandey, S.; Apple, D.J. Calcification of modern foldable hydrogel intraocular lens designs. Eye 2003, 17, 393–406. [Google Scholar] [CrossRef] [PubMed]
- Drimtzias EG, Rokidi S. G., Gartaganis S.P., Koutsoukos P.G., Experimental investigation on mechanism of hydrophilic acrylic intraocular lens calcification. Am J Ophthalmol 2011, 152, 824–833. [Google Scholar] [CrossRef]
- Koutsoukos P.G., Natsi P.D., Gartaganis S.P., Gartaganis P.S. Biological Mineralization of Hydrophilic Intraocular Lenses. Crystals 2022, 12(10):1418. [CrossRef]
- Gartaganis S.P., Kanellopoulou D.G., Mela E.K., Panteli V.S., Koutsoukos P.G. Opacification of hydrophilic acrylic intraocular lens attributable to calcification: investigation on mechanism. Am J Ophthalmol. 2008, 146(3), 395-403. [CrossRef]
- Sinton, D. Energy: The Microfluidic Frontier. Lab Chip 2014, 14(17), 3127–3134. [Google Scholar] [CrossRef]
- Menard E., Meitl M. A., Sun Y., Park J.-U., Shir D. J.-L., Nam Y.-S., Jeon S., Rogers J. A. Micro and Nanopatterning Techniques for Organic Electronic and Optoelectronic Systems. Chem. Rev. 2007, 107(4)1, 117-1160. 4). [CrossRef]
- Saqib, J., Aljundi, I. H. Membrane fouling and modification using surface treatment and layer-by-layer assembly of polyelectrolytes: State-of-the-art review. J.Water Proc. Engineering. 2016, 11, 68–87. [CrossRef]
- Park, S., Ruoff, R. S. Erratum: Chemical methods for the production of graphenes. Nature Nanotechnology 2009, 4, 217–224. [CrossRef]
- Wang G., He C., Yang W., Qi F., Qian G., Peng S., Shuai C. Surface-Modified Graphene Oxide with Compatible Interface Enhances Poly-L-Lactic Acid Bone Scaffold. Journal of Nanomaterials 2020,1-11, 5634096. [CrossRef]
- Lee S., Jo I., Kang S., Jang B., Moon J., Park J.B., Lee S., Rho S., Kim Y., Hong B.H. Smart Contact Lenses with Graphene Coating for Electromagnetic Interference Shielding and Dehydration Protection. ACS Nano 2017, 6, 5318–5324. [CrossRef]
- Cai, M.; Thorpe, D.; Adamson, D.H.; Schniepp, H.C. Methods of graphite exfoliation. J. Mater. Chem. 2012, 22, 24992–25002. [Google Scholar] [CrossRef]
- Borandeh S., Alimardani V., Abolmaali S. S., Seppälä J. Graphene Family Nanomaterials in Ocular Applications: Physicochemical Properties and Toxicity Chem. Res. Toxicol. 2021, 34, 6, 1386–1402. [CrossRef]
- Wang G., Shen X., Wang B., Yao J., Park J. Synthesis and characterization of hydrophilic and organophilic graphene nanosheets. Carbon. 2009, 47, 1359–1364. [CrossRef]
- Xu, Y., & Shi, G. Assembly of Chemically Modified Graphene: Methods and Applications. J. Mater. Chem. 2011, 21 ,10, 3311−3323. [CrossRef]
- Dave S.H., Gong C., Robertson A.W., Warner J.H., Grossman J. Chemistry and Structure of Graphene Oxide via Direct Imaging. ACS Nano 2016, 10 ,8 7515−7522. [CrossRef]
- Grant J.J., Pillai S.C., Hehir S., McAfee M., Breen A. Biomedical Applications of Electrospun Graphene Oxide. ACS Biomaterials Science & Engineering 2021, 7,4, 1278-1301. [CrossRef]
- Faraji S., Nowroozi N., Nouralishahi A., Shayeh J.S. Electrospun Poly-Caprolactone/Graphene Oxide/Quercetin Nanofibrous Scaffold for Wound Dressing: Evaluation of Biological and Structural Properties. Life Sci. 2020, 257, 118062. [CrossRef]
- Zhang Y., Ali S.F., Dervishi E., Xu Y., Li Z., Casciano D., Biris A.S. Cytotoxicity Effects of Graphene and Single-Wall Carbon Nanotubes in Neural Phaeochromocytoma-Derived PC12 Cells. ACS Nano 2010, 4,6, 3181−3186. [CrossRef]
- Nagul, E.A. The molybdenum blue reaction for the determination of orthophosphate revisited: Opening the black box. Anal. Chim. Acta 2015, 890, 60–82. [Google Scholar] [CrossRef]
- Chua C.K., Pumera M. Chemical Reduction of Graphene Oxide: A Synthetic Chemistry Viewpoint. Chem. Soc. Rev. 2014, 43,1, 291–312. ,1. [CrossRef]
- Bates, R.G. Revised Standard Values for pH Measurements from 0 to 95 ◦C. J. Res. N Bur. Stan. A-Phys. Chem. 1962; 66A, 179–184. [Google Scholar] [CrossRef]
- Kinsey, V.E. Comparative chemistry of aqueous humor in posterior and anterior chambers of rabbit eye. Its physiologic significance. A.M.A. Arch. Opthalm. 1953, 50, 401–417. [Google Scholar] [CrossRef] [PubMed]
- Zhang T., Zhu G.Y., Yu C.H., Xie Y., Xia M.Y., Lu B.Y., Fei X., Peng Q. The UV absorption of graphene oxide is size-dependent: possible calibration pitfalls. Microchimica Acta 2019, 186(3). [CrossRef]
- Blackmore S-W., Eperjesi F. Blue-light Filtering Intraocular Lenses. European Ophthalmic Review 2012, 6(2), 104–7. [CrossRef]
- Downes S., M. Ultraviolet or bluefiltering intraocular lenses: what is the evidence? Eye 2016, 30, 215–221. [Google Scholar] [CrossRef] [PubMed]
- Yang, S., Yue, W., Huang, D., Chen, C., Lin, H., & Yang, X. A facile green strategy for rapid reduction of graphene oxide by metallic zinc. RSC Advances 2012, 2(23), 8827. 23). [CrossRef]
- Emiru, T. F., & Ayele, D. W. (2017). Controlled synthesis, characterization and reduction of graphene oxide: A convenient method for large scale production. Egyptian Journal of Basic and Applied Sciences 2017, 4(1), 74–79. [CrossRef]
- Hidayah, N. M. S., Liu, W.-W., Lai, C.-W., Noriman, N. Z., Khe, C.-S., Hashim, U., & Lee, H. C. Comparison on graphite, graphene oxide and reduced graphene oxide: Synthesis and characterization. AIP Conference Proceedings 1892, 150002, 2017. [CrossRef]
- Zhang, Y., Ma, H.-L., Zhang, Q., Peng, J., Li, J., Zhai, M., Yu, Z.-Z. Facile synthesis of well-dispersed graphene by γ-ray induced reduction of graphene oxide. J. Mater. Chem 2012, 22(26), 13064. [CrossRef]
- Eigler, S., Dotzer, C., Hirsch, A. Visualization of defect densities in reduced graphene oxide. Carbon 2012, 50(10), 3666–3673. 10). [CrossRef]
- Sola D., Alamri S., Lasagni A. F., UV Direct Laser Interference Patterning of Diffraction Gratings in PolyHydroxyethyl-Methacrylate Ophthalmic Polymers. J. Laser. Micro. Nanoen., 2020, 15(3), 186–190. [CrossRef]
- Sygellou, L., Paterakis, G., Galiotis, C., Tasis, D. Work Function Tuning of Reduced Graphene Oxide Thin Films. J. Phys. Chem. C J PHYS CHEM C 2015, 120(1), 281–290. 1). [CrossRef]
- Cölfen H., Polymer-Mediated Growth of Crystals and Mesocrystals, In Methods in Enzymology, J. J. De Yoreo., Ed.; Academic Press: London U.K., 2013; Volume 532, pp. 277–304.
- Gebauer, D., Cölfen, H., Verch, A., & Antonietti, M., The multiple roles of additives in CaCO3 crystallization: A quantitative case study. Advanced Materials, 2009, 21(4), 435–439. [CrossRef]
- Liu H., Xi P., Xie G., Shi Y., Hou F., Huang L., Chen F., Zeng Z., Shao C., Wang J. Simultaneous Reduction and Surface Functionalization of Graphene Oxide for Hydroxyapatite Mineralization. J. Phys. Chem. C 2012, 116, 3334–3341. [CrossRef]
- Zhu P., Masuda Y., Koumoto K. The Effect of Surface Charge on Hydroxyapatite Nucleation. Biomaterials 25 2004, 3915–3921. [CrossRef]
- Tanahashi M.,Matsuda T. Surface Functional Group Dependence on Apatite Formation on Self assembled Monolayers in a Simulated Body Fluid. J. Biomed. Mater. Res. 1997, 34, 305–315. [CrossRef]
Figure 1.
Schematic outline of the preparation of GO and rGO coatings on hydrophilic, PHEMA IOLs.
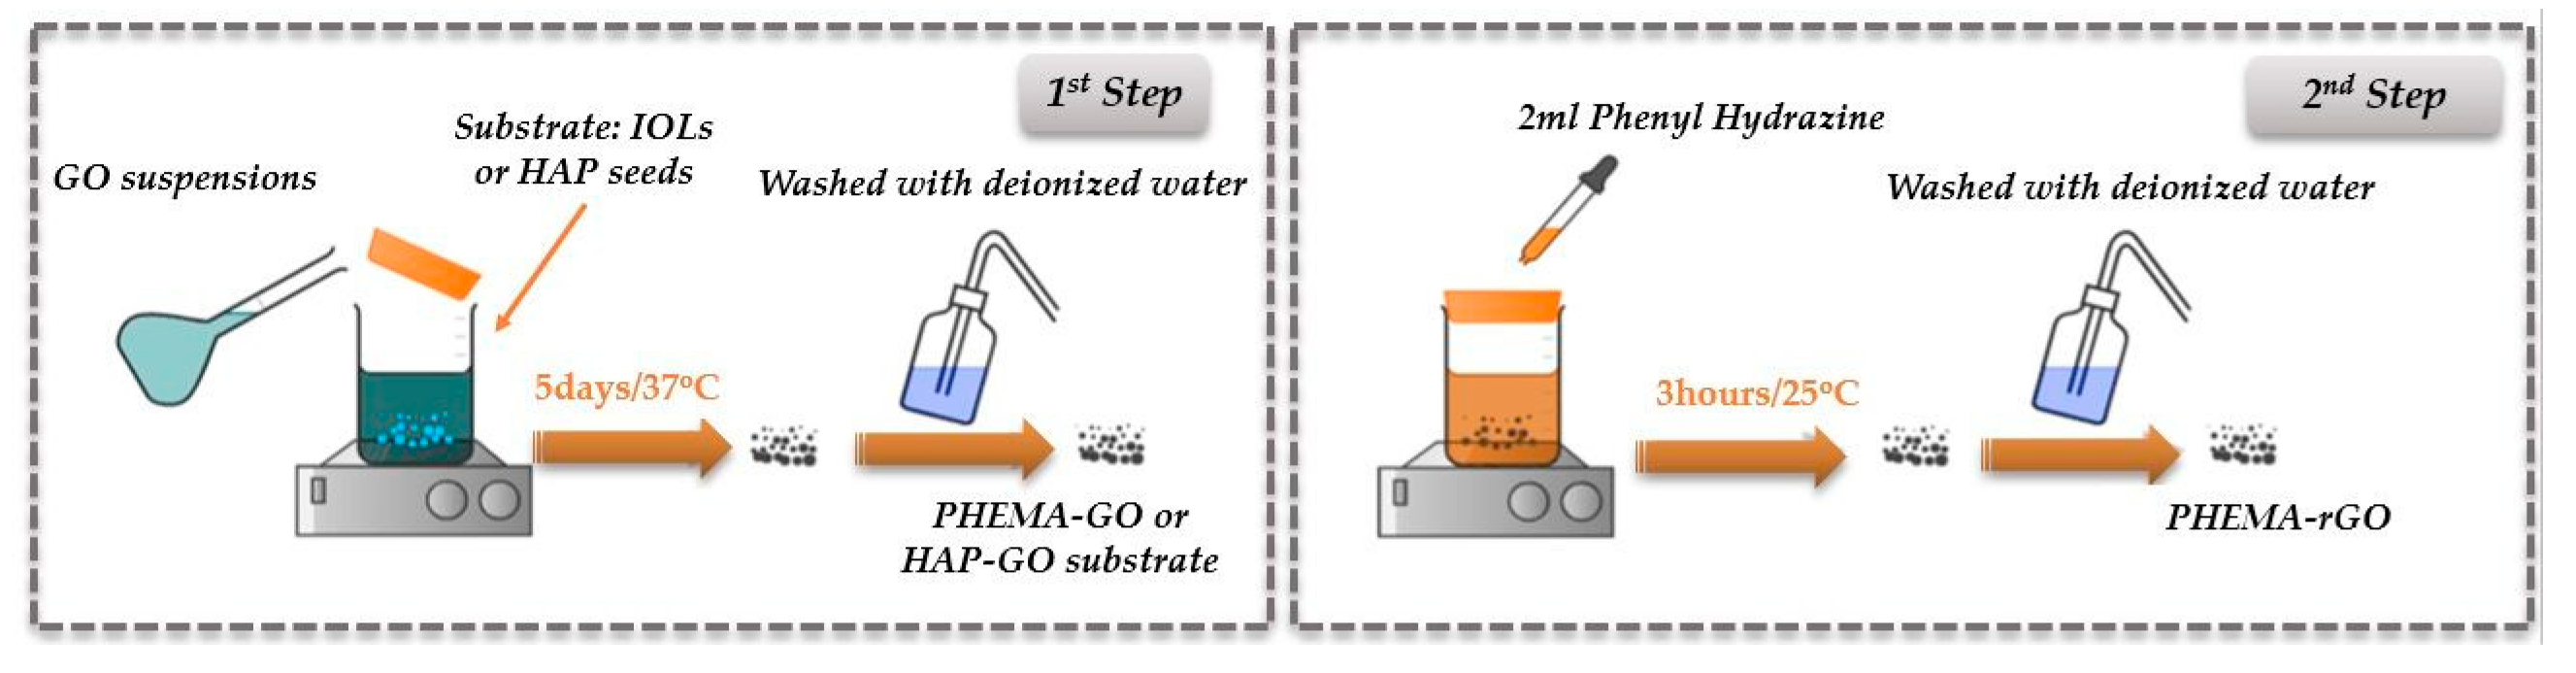
Figure 2.
Schematic representation of: (a) the experimental setup for the investigation of mineralization of hydrophilic IOLs and (b) photo of the IOLs mounting system.
Figure 2.
Schematic representation of: (a) the experimental setup for the investigation of mineralization of hydrophilic IOLs and (b) photo of the IOLs mounting system.
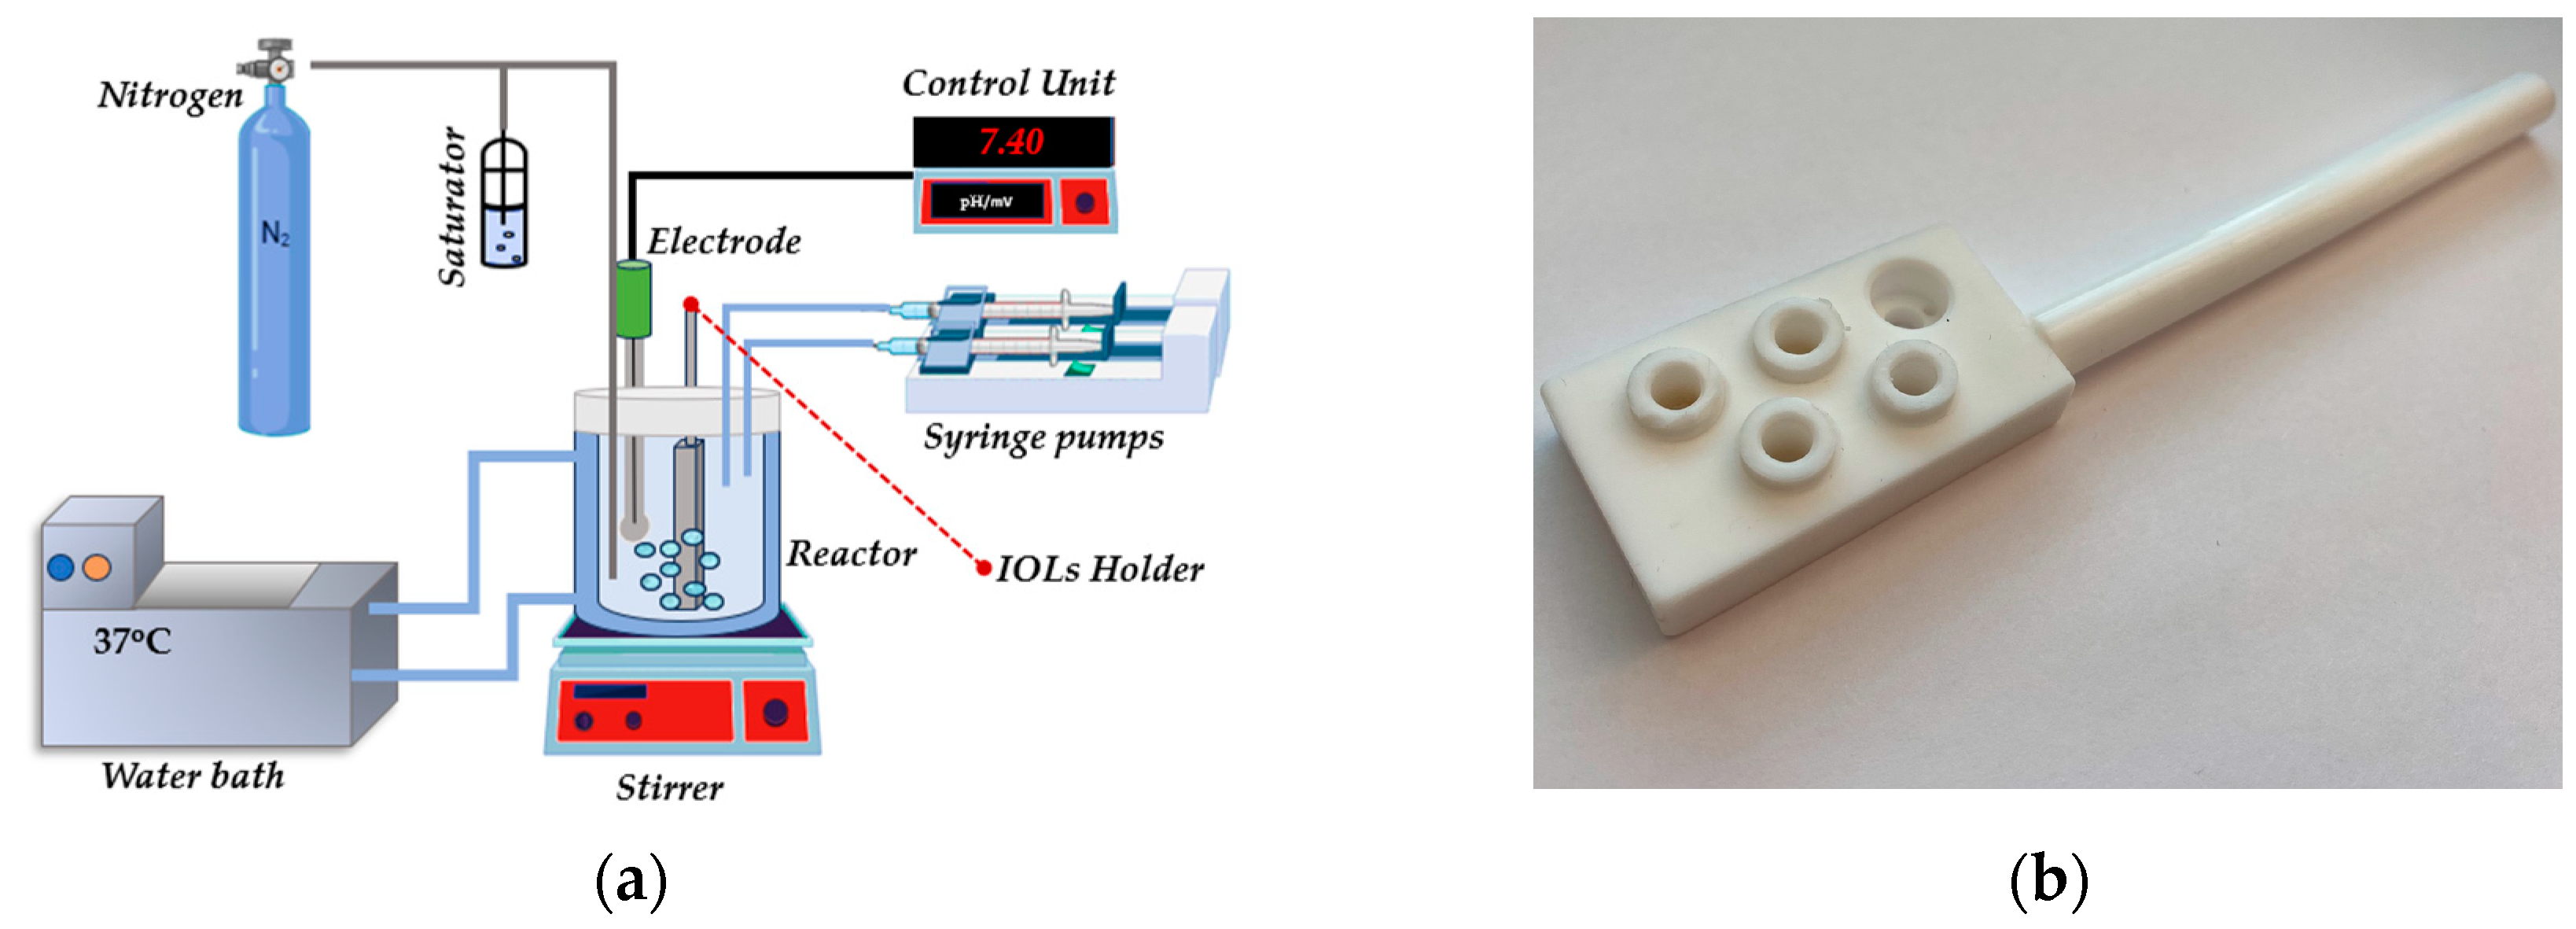
Figure 3.
Thermogravimetric analysis (TGA) profiles of IOLs before and after equilibration with GO suspensions and of GO flakes. (-) Hydrophilic IOL (PHEMA), (-) IOL treated with-GO suspension_1x10-4 % w/v, (-) GO. Mass change of the test material (%) as a function of temperature; nitrogen atmosphere, 10 oC/min.
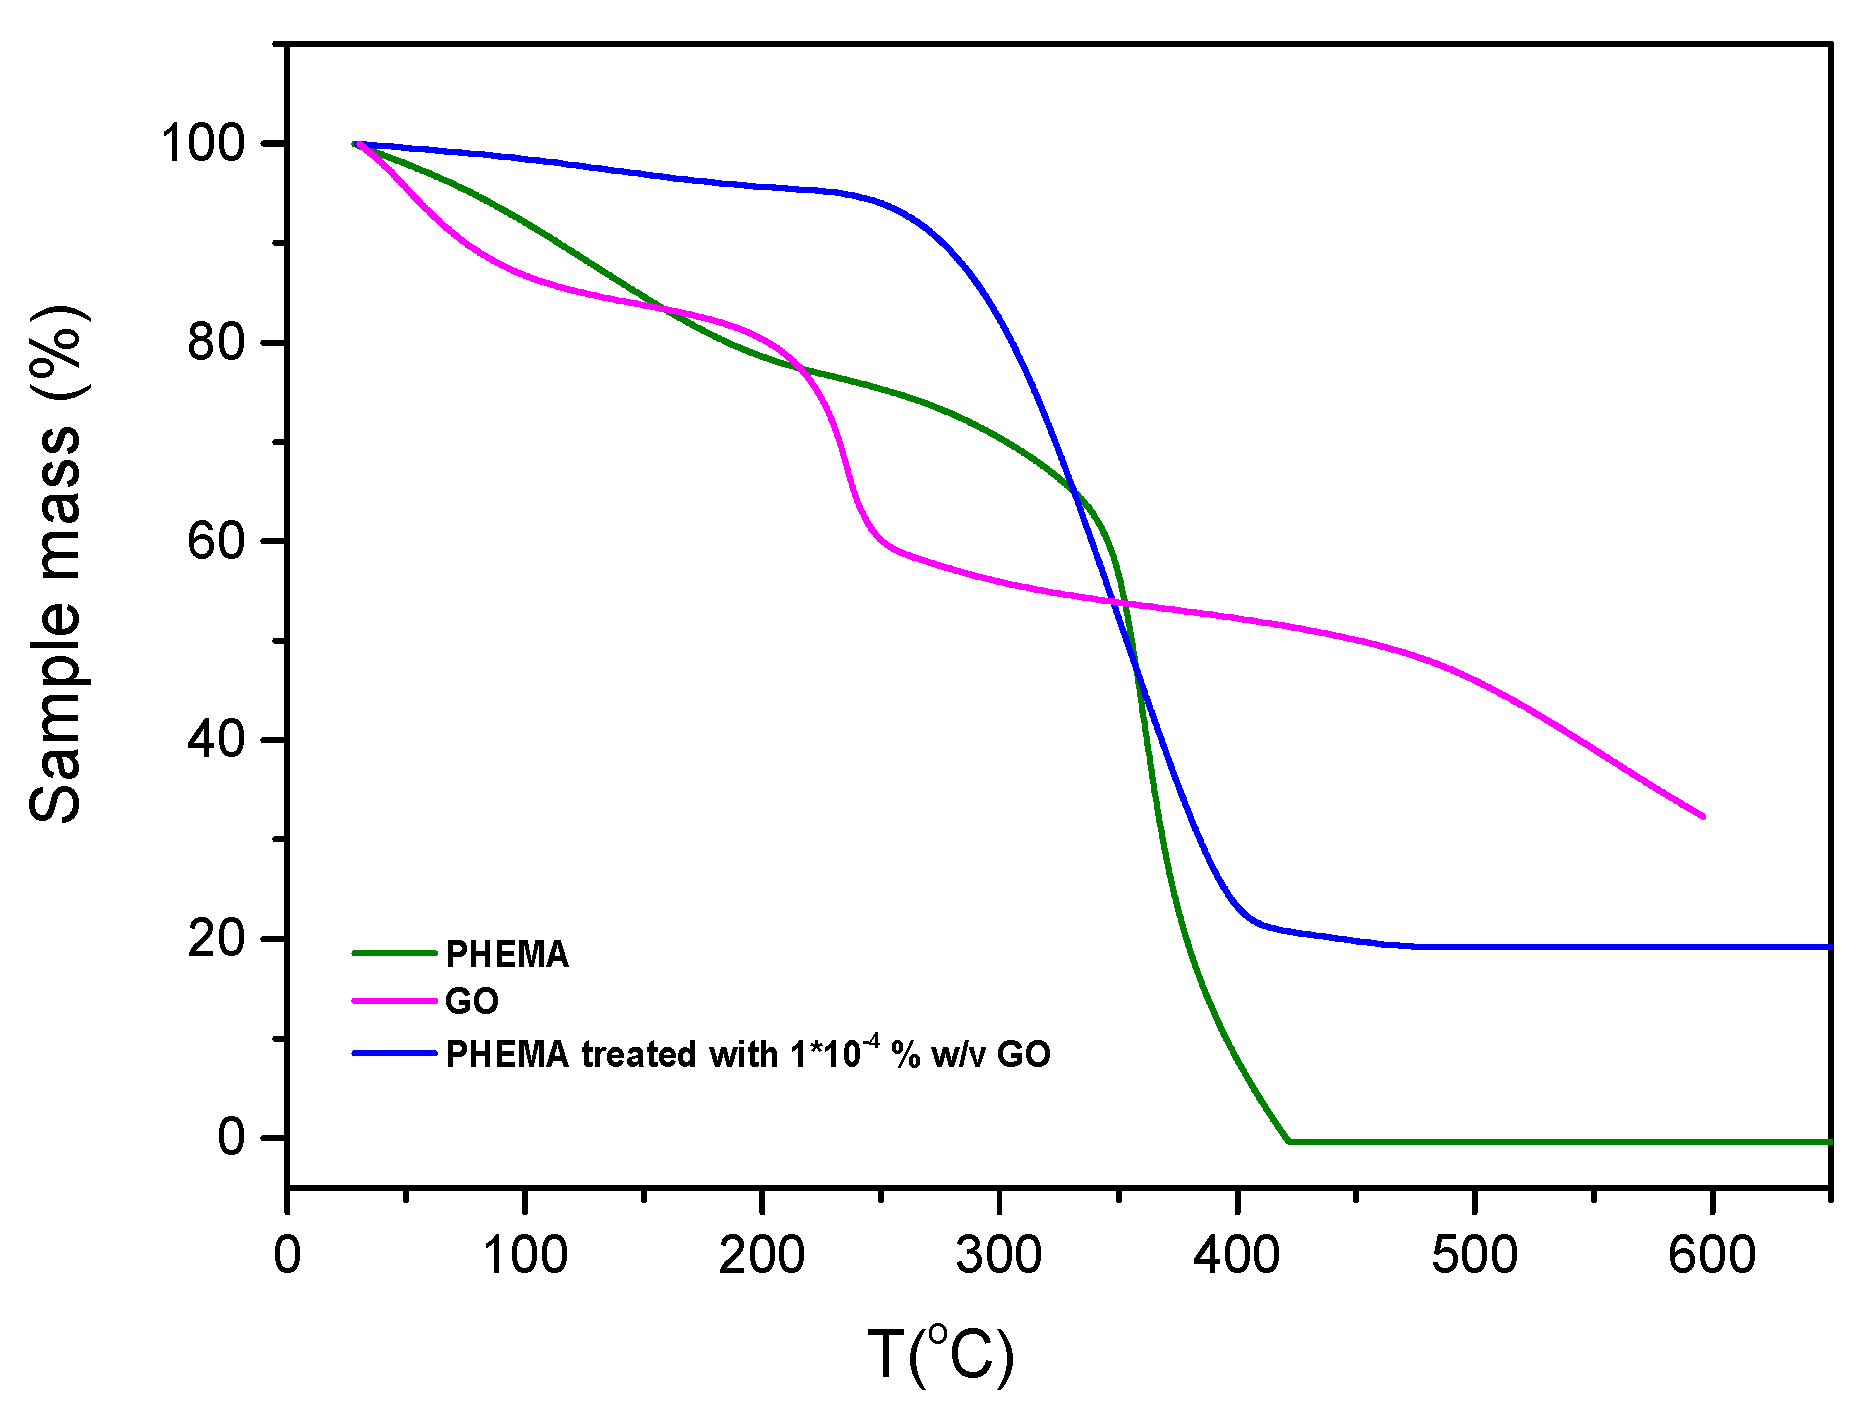
Figure 4.
Thermogravimetric analysis (TGA) of hydrophilic IOLs treated with GO suspensions: (-) 1x10⁻⁴ % w/v; (-)3x10⁻⁴ % w/v; (-) 1x10⁻³ % w/v; nitrogen atmosphere; 10 oC/min.
Figure 4.
Thermogravimetric analysis (TGA) of hydrophilic IOLs treated with GO suspensions: (-) 1x10⁻⁴ % w/v; (-)3x10⁻⁴ % w/v; (-) 1x10⁻³ % w/v; nitrogen atmosphere; 10 oC/min.
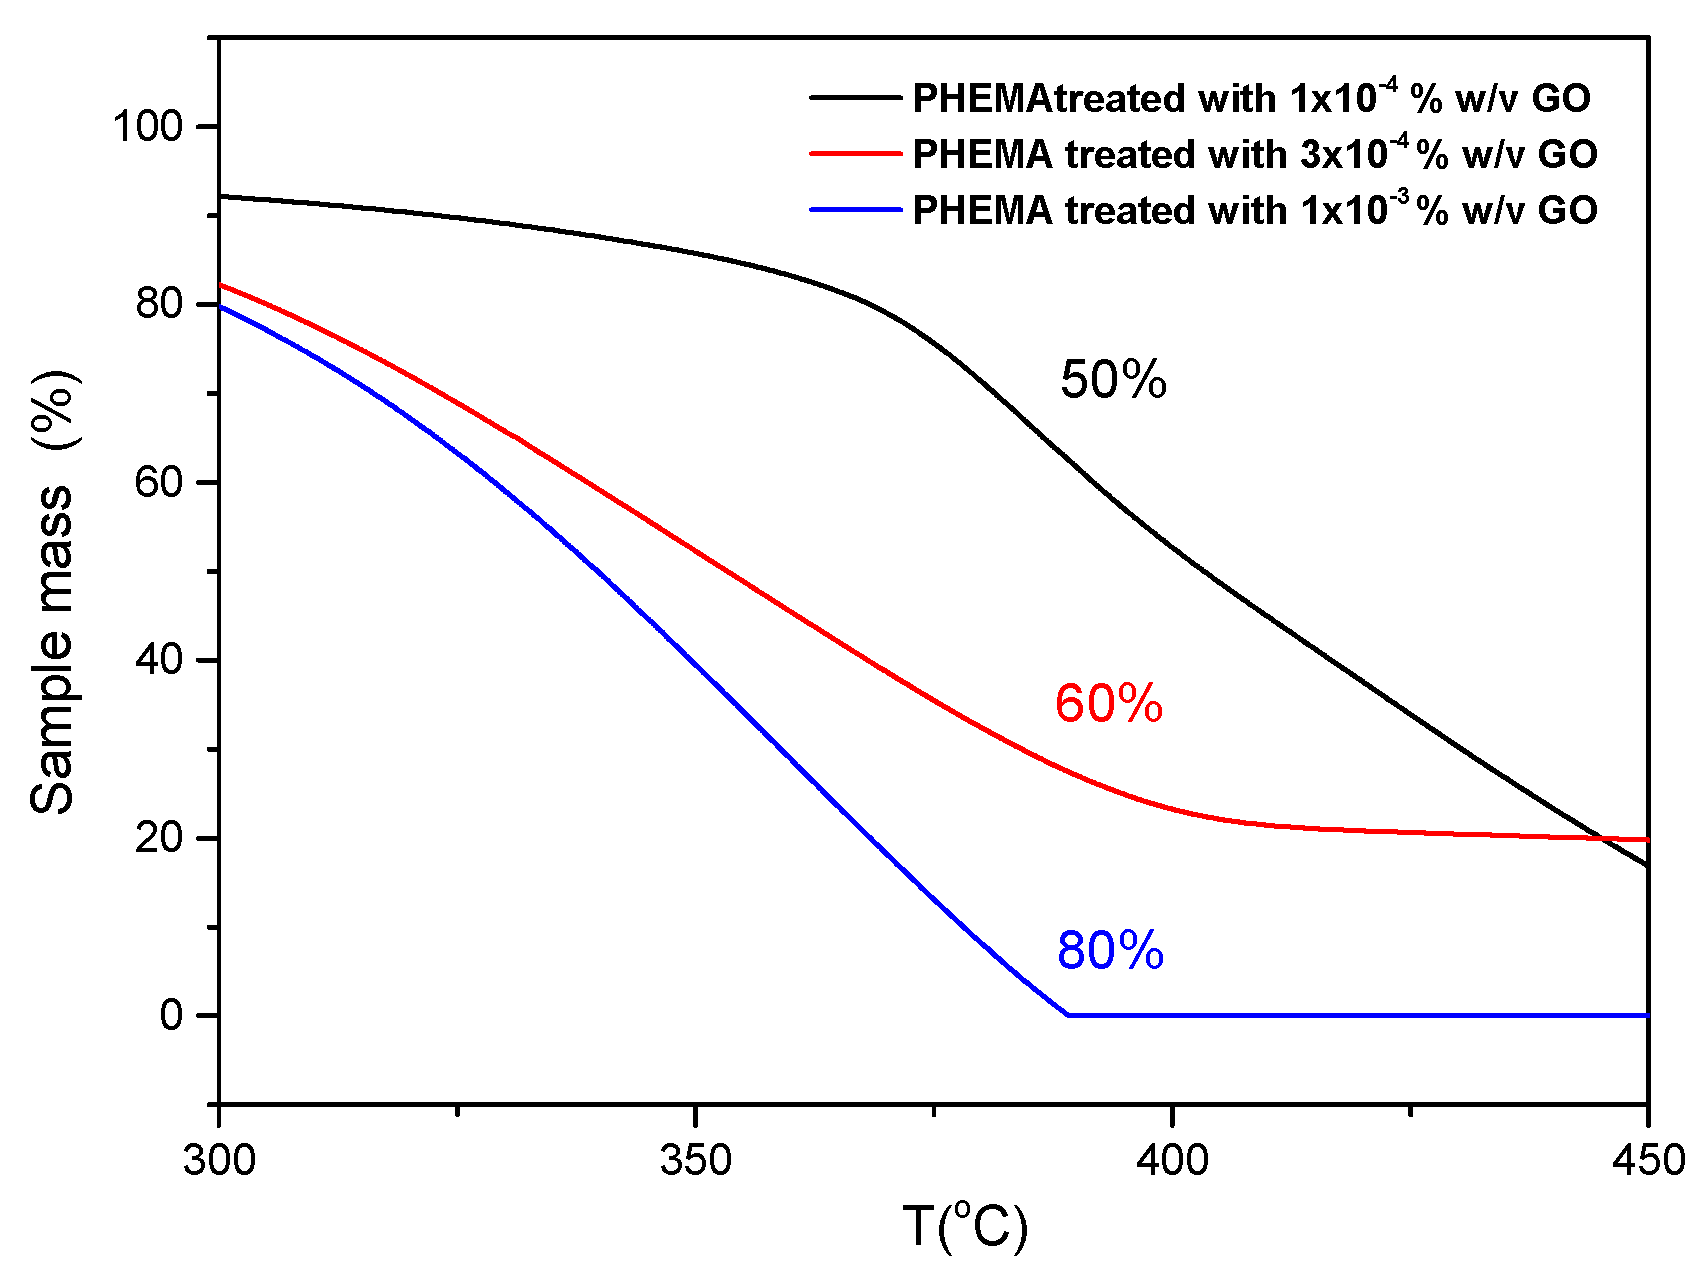
Figure 5.
IOL- water contact angle of IOLs treated with GO suspensions in water with different solid concentrations.
Figure 5.
IOL- water contact angle of IOLs treated with GO suspensions in water with different solid concentrations.
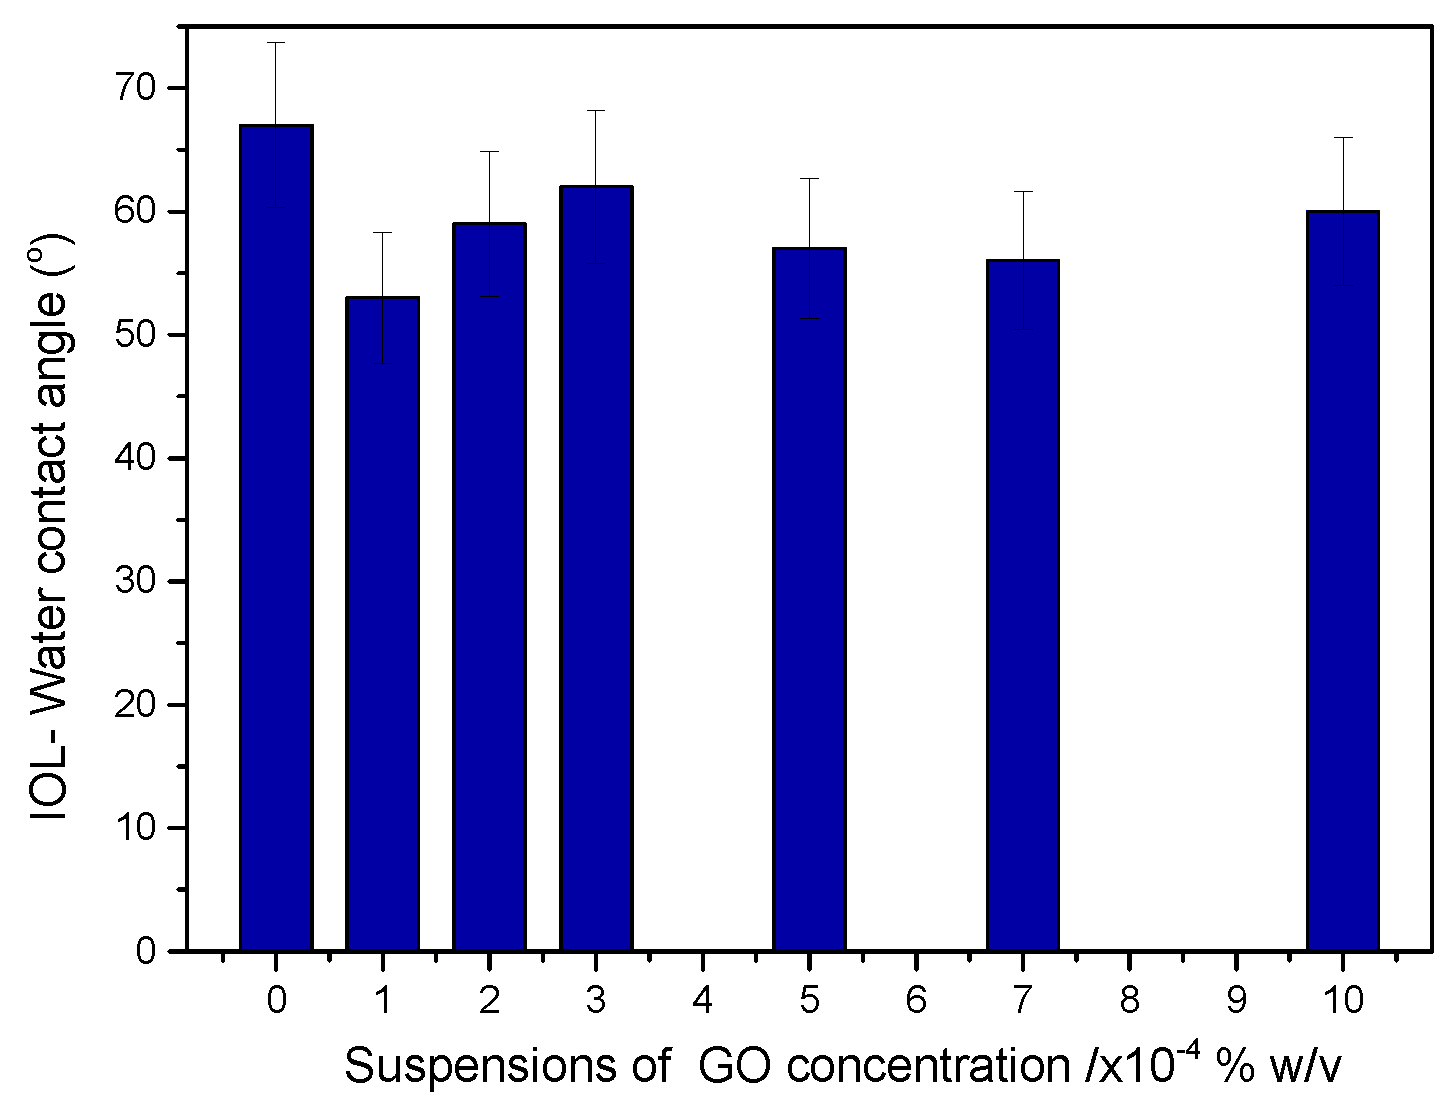
Figure 6.
IOL- water contact angles before and after treatment with GO suspensions (5x10⁻⁴ % w/v) and following treatment with phenyl hydrazine which converted GO into rGO.
Figure 6.
IOL- water contact angles before and after treatment with GO suspensions (5x10⁻⁴ % w/v) and following treatment with phenyl hydrazine which converted GO into rGO.
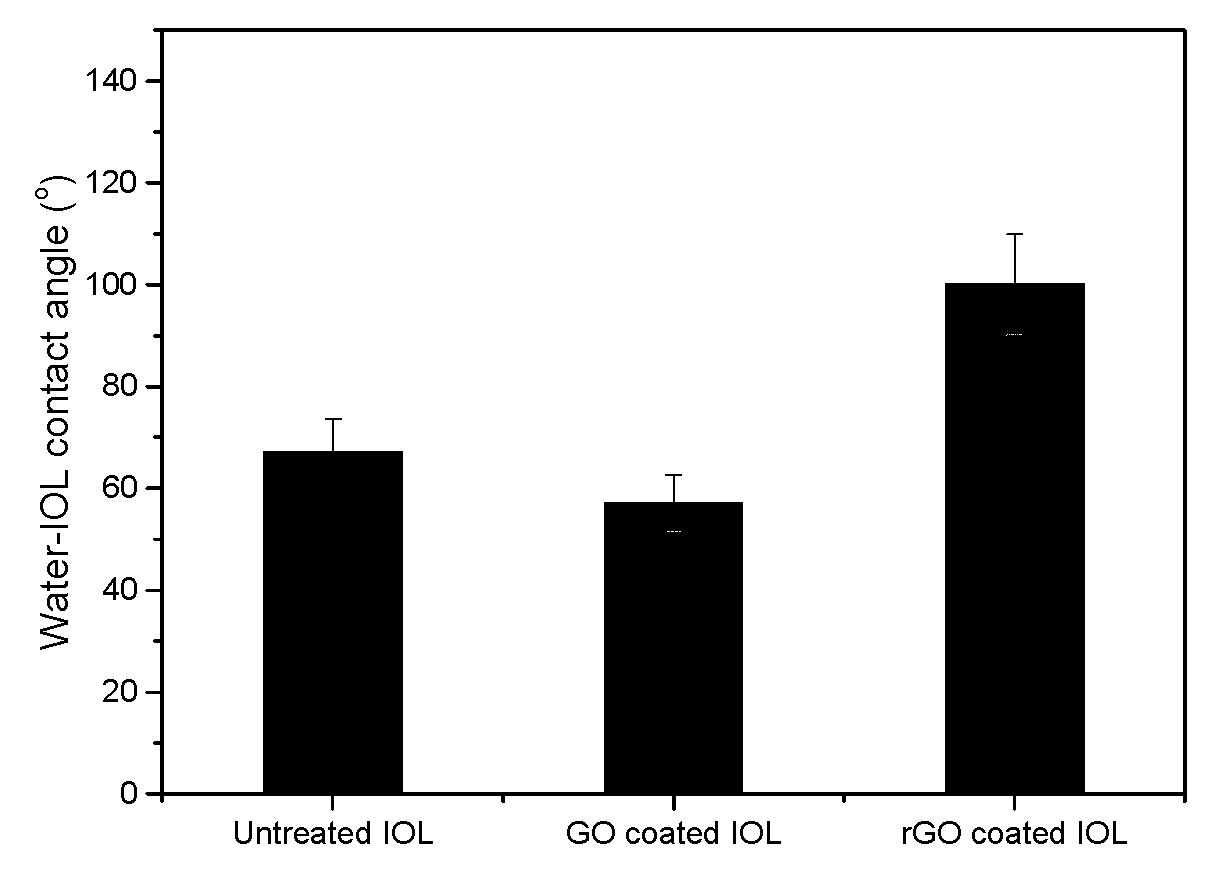
Figure 7.
Water drops on IOLs for the measurement of contact angles: (a) Untreated hydrophilic IOL; (b) Hydrophilic IOL following equilibration with GO suspensions (5x10⁻⁴ % w/v); (c) Hydrophilic IOL following reduction of the GO layer into rGO.
Figure 7.
Water drops on IOLs for the measurement of contact angles: (a) Untreated hydrophilic IOL; (b) Hydrophilic IOL following equilibration with GO suspensions (5x10⁻⁴ % w/v); (c) Hydrophilic IOL following reduction of the GO layer into rGO.
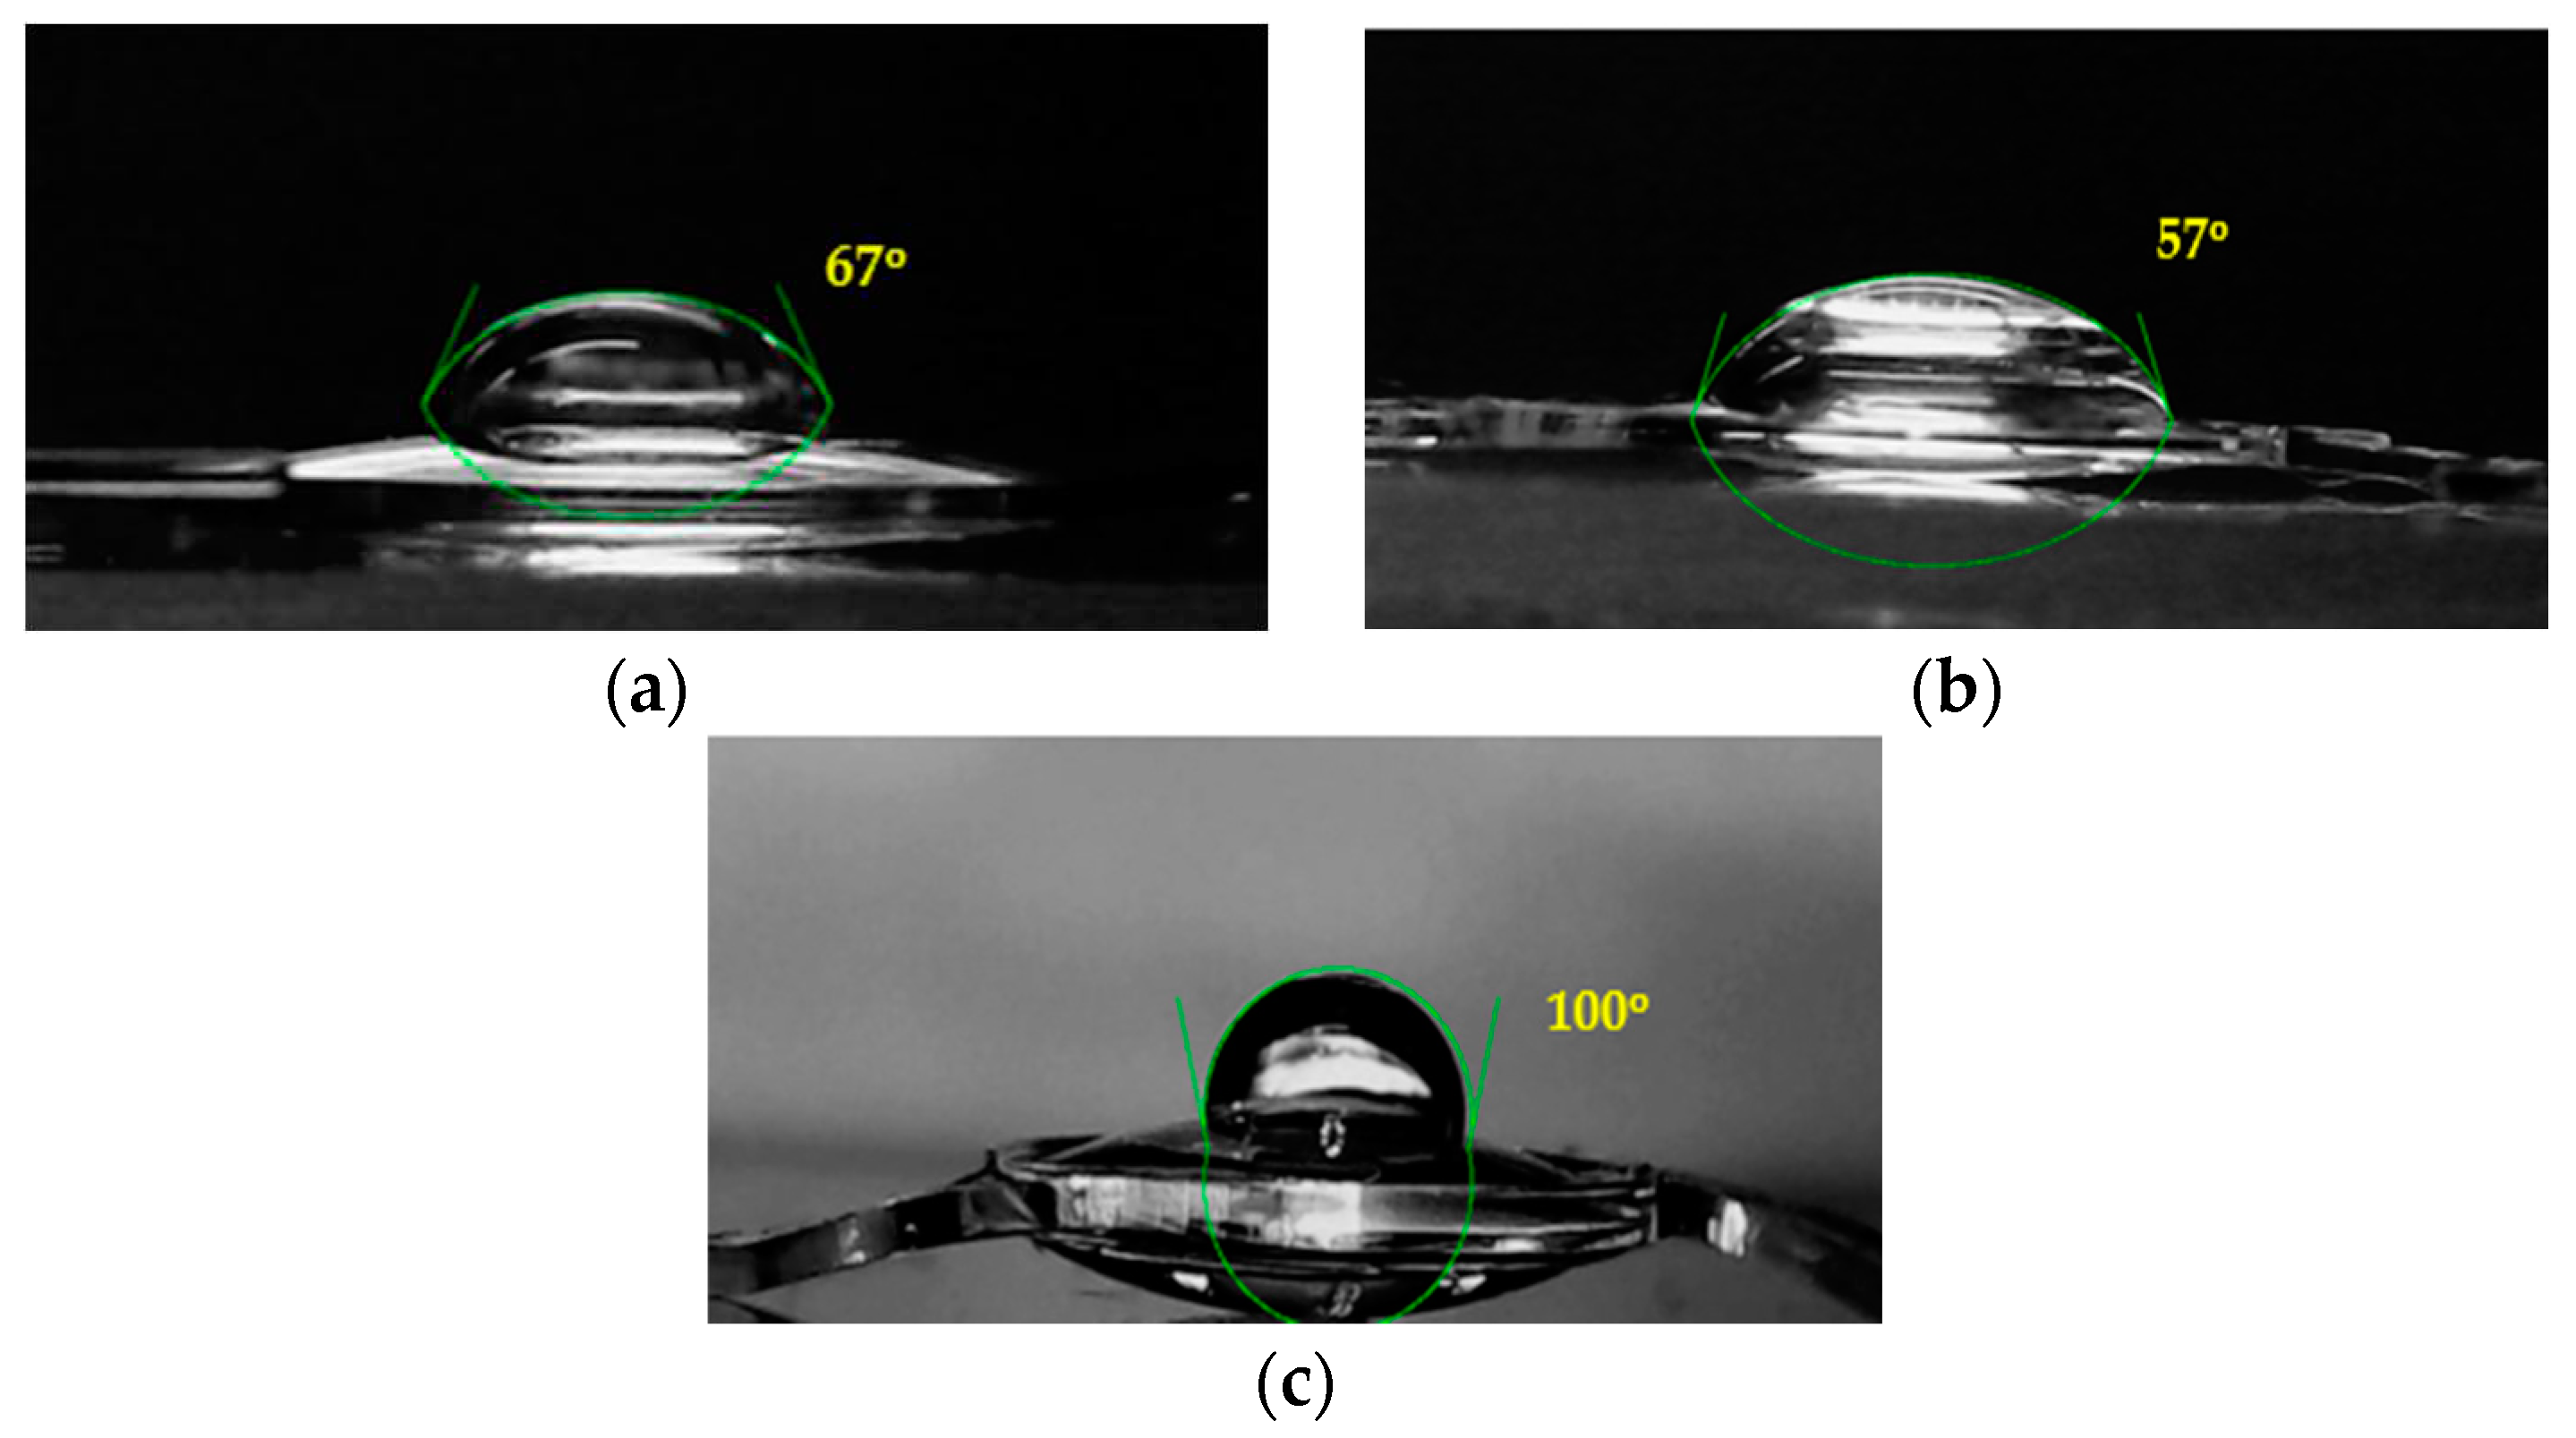
Figure 8.
UV-Vis spectra of IOLSs treated with GO suspensions; (a) (-) Untreated hydrophilic IOL; (-) Hydrophilic IOL treated with GO suspension 5x10⁻⁴ % w/v; (-) Hydrophilic IOL treated with GO suspension 7x10⁻⁴ % w/v; (-) Hydrophilic IOL treated with GO suspension 1x10⁻³ % w/v; (b) (-) Untreated hydrophilic IOL; (-) Hydrophilic IOL treated with GO suspension 5x10⁻⁴ % w/v; (-) Hydrophilic IOL treated with GO suspension 5x10⁻⁴ % w/v following reduction with phenyl hydrazine in which GO was converted to rGO.
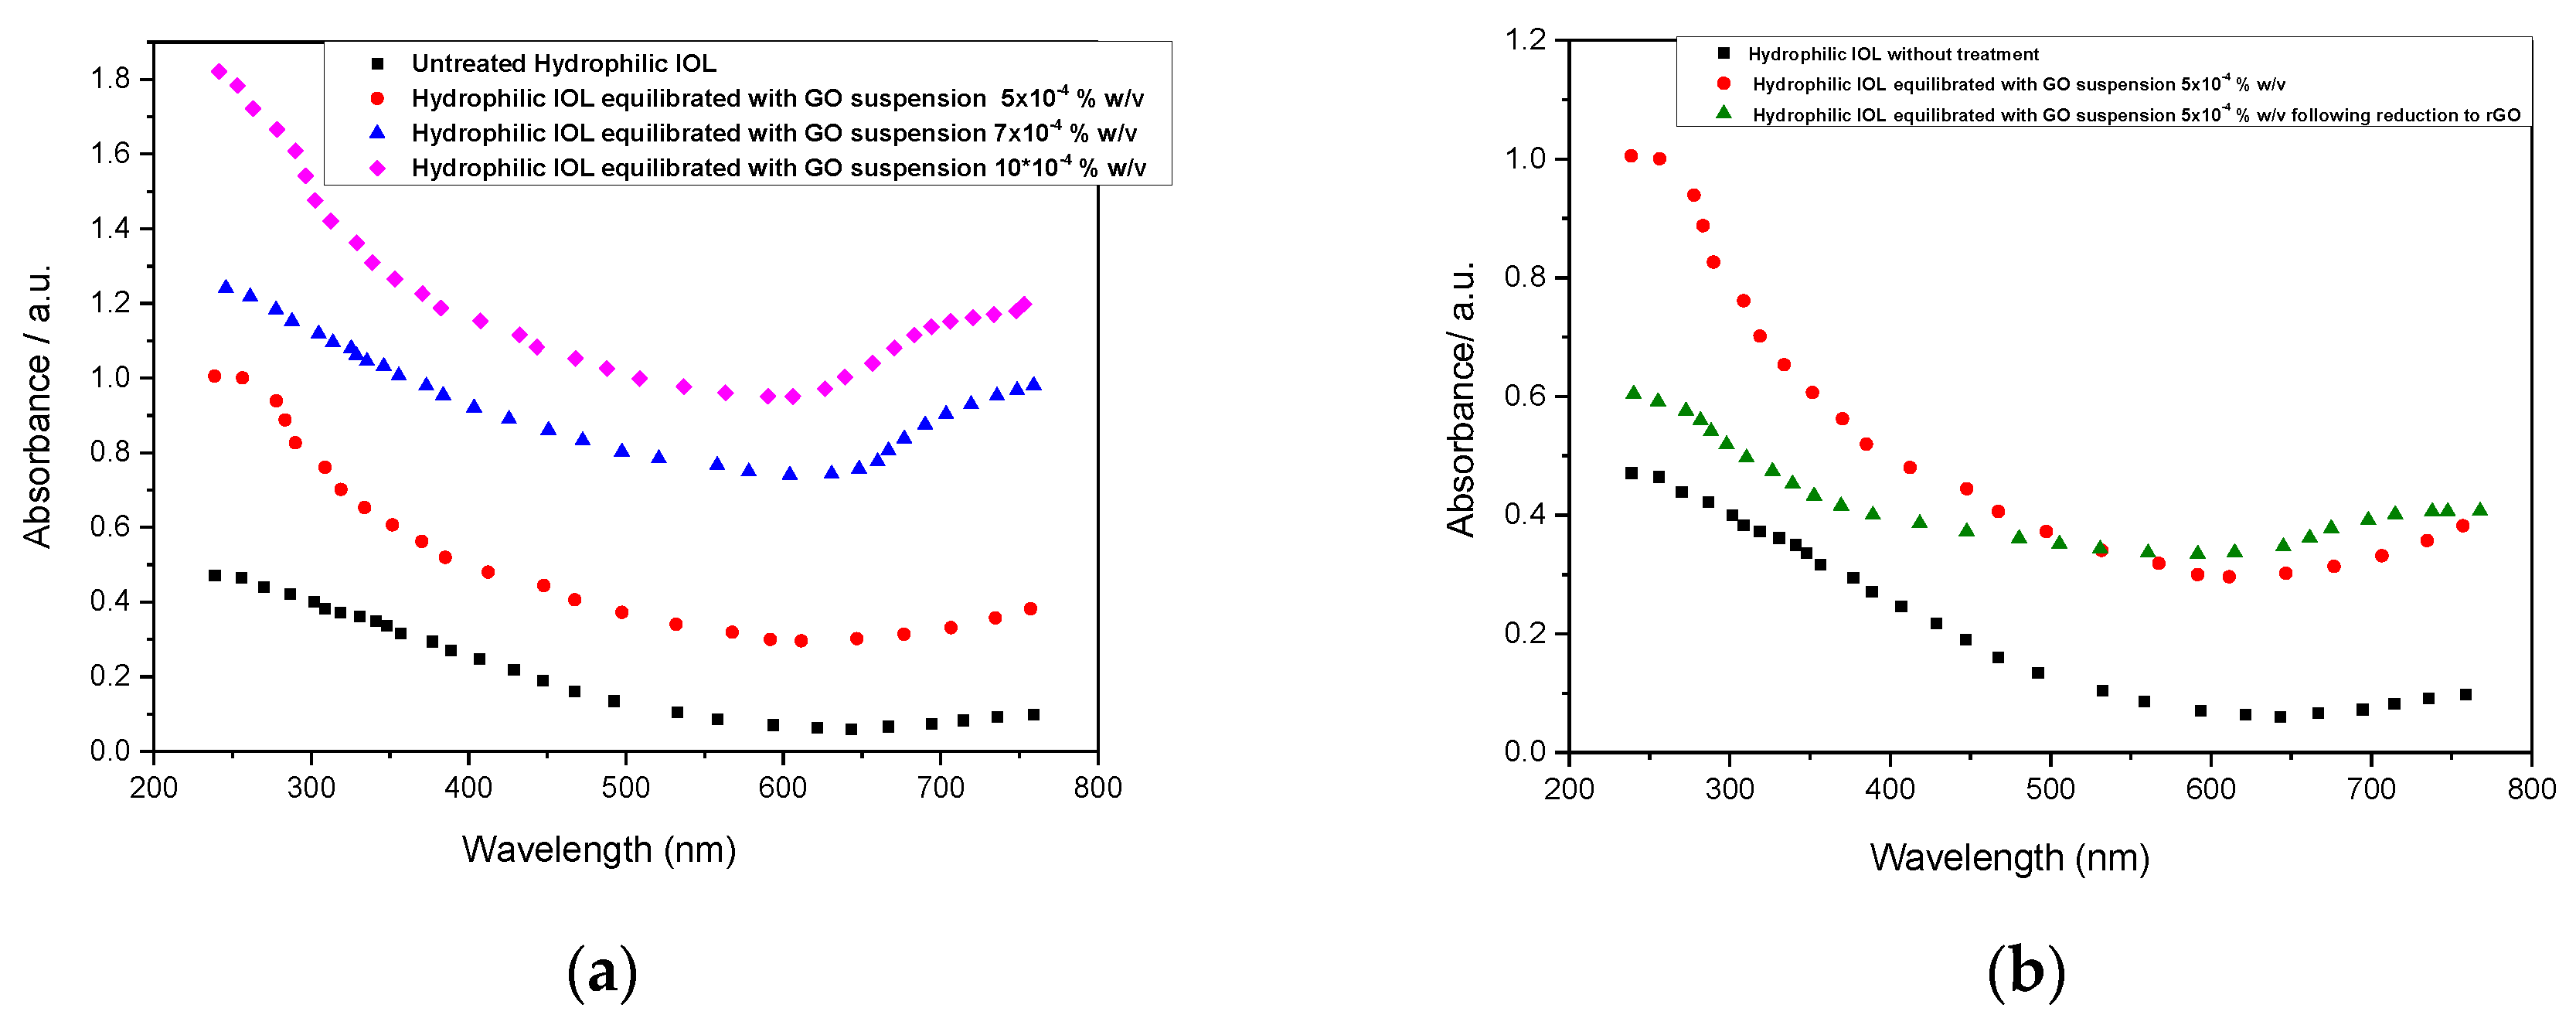
Figure 9.
Raman Spectra of Graphene oxide (GO) and Reduced Graphene Oxide (rGO) samples.
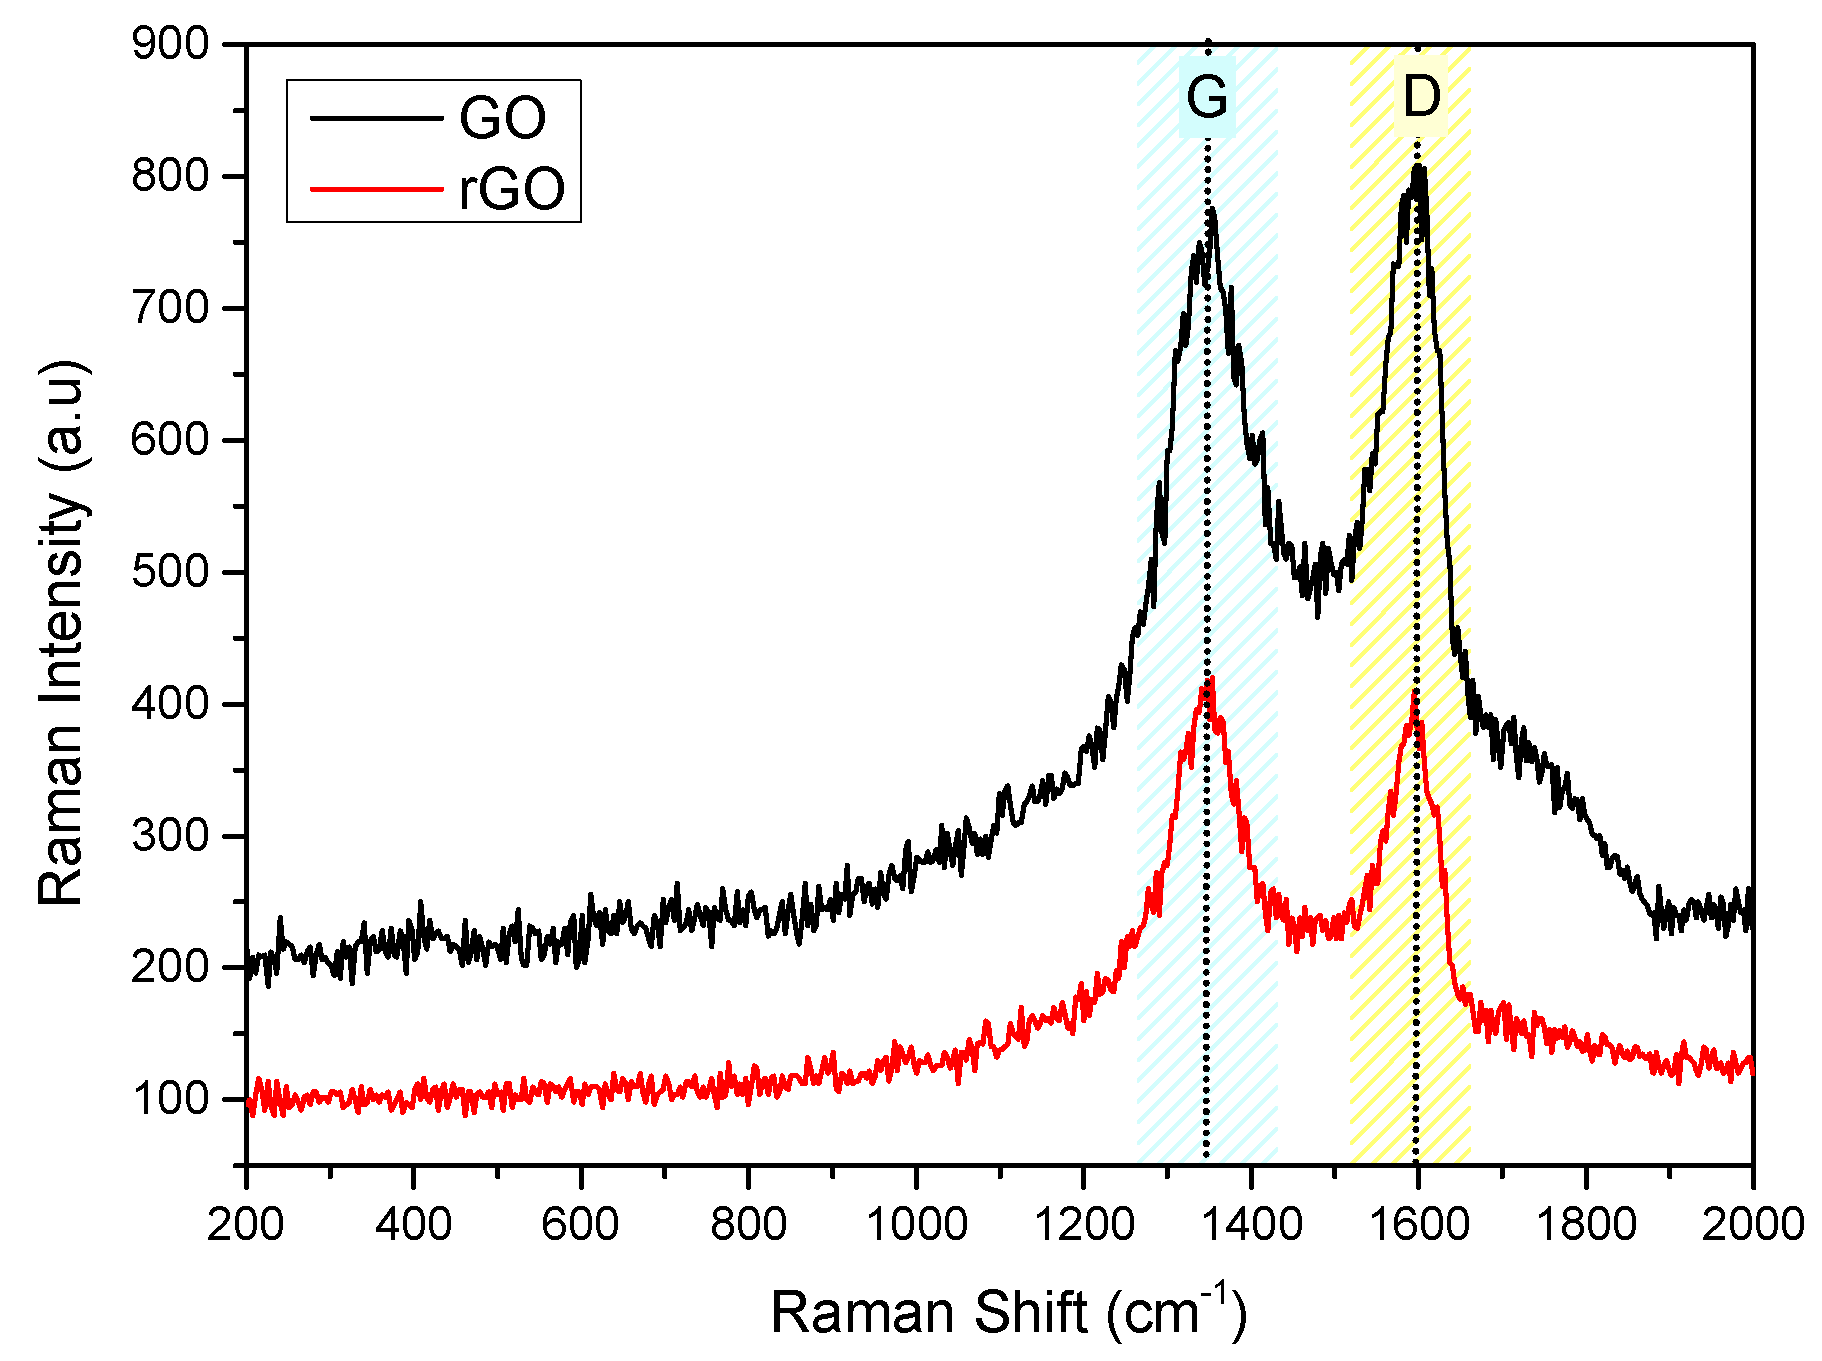
Figure 10.
Raman Spectra of hydrophilic IOLs coated with GO and rGO.
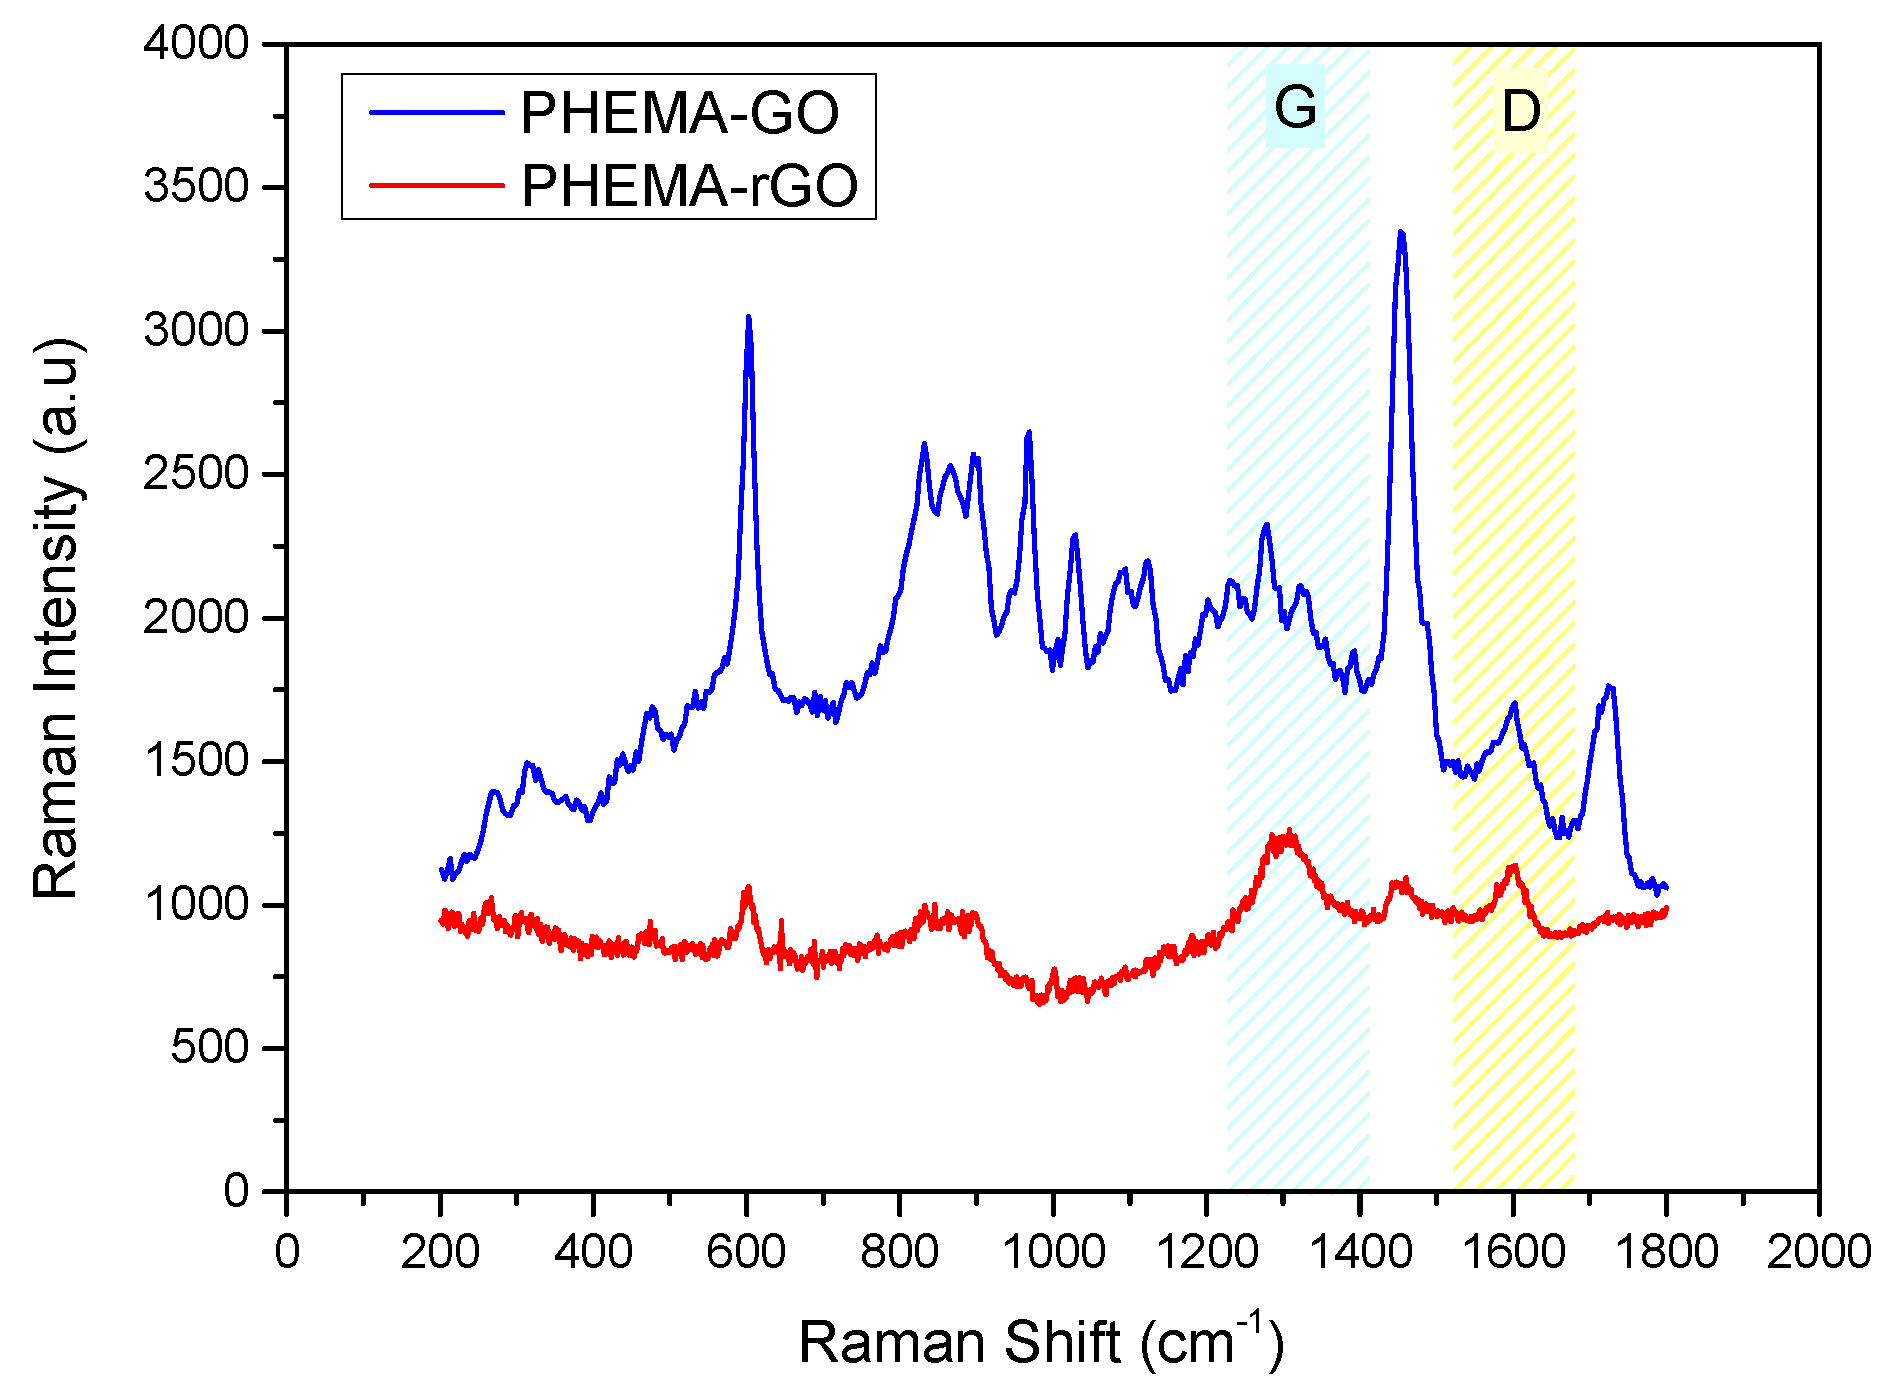
Figure 11.
Deconvoluted C1s XPS spectra of hydrophilic IOLs (PHEMA) after equilibration in GO suspensions (PHEMA-GO) and past reduction with phenyl hydrazine (PHEMA-rGO); (a) PHEMA, (b) GO coated PHEMA hydrophilic IOLs (PHEMA-GO) (c) rGO coated following reduction of the GO layers on the IOLs with phenyl hydrazine (PHEMA-rGO).
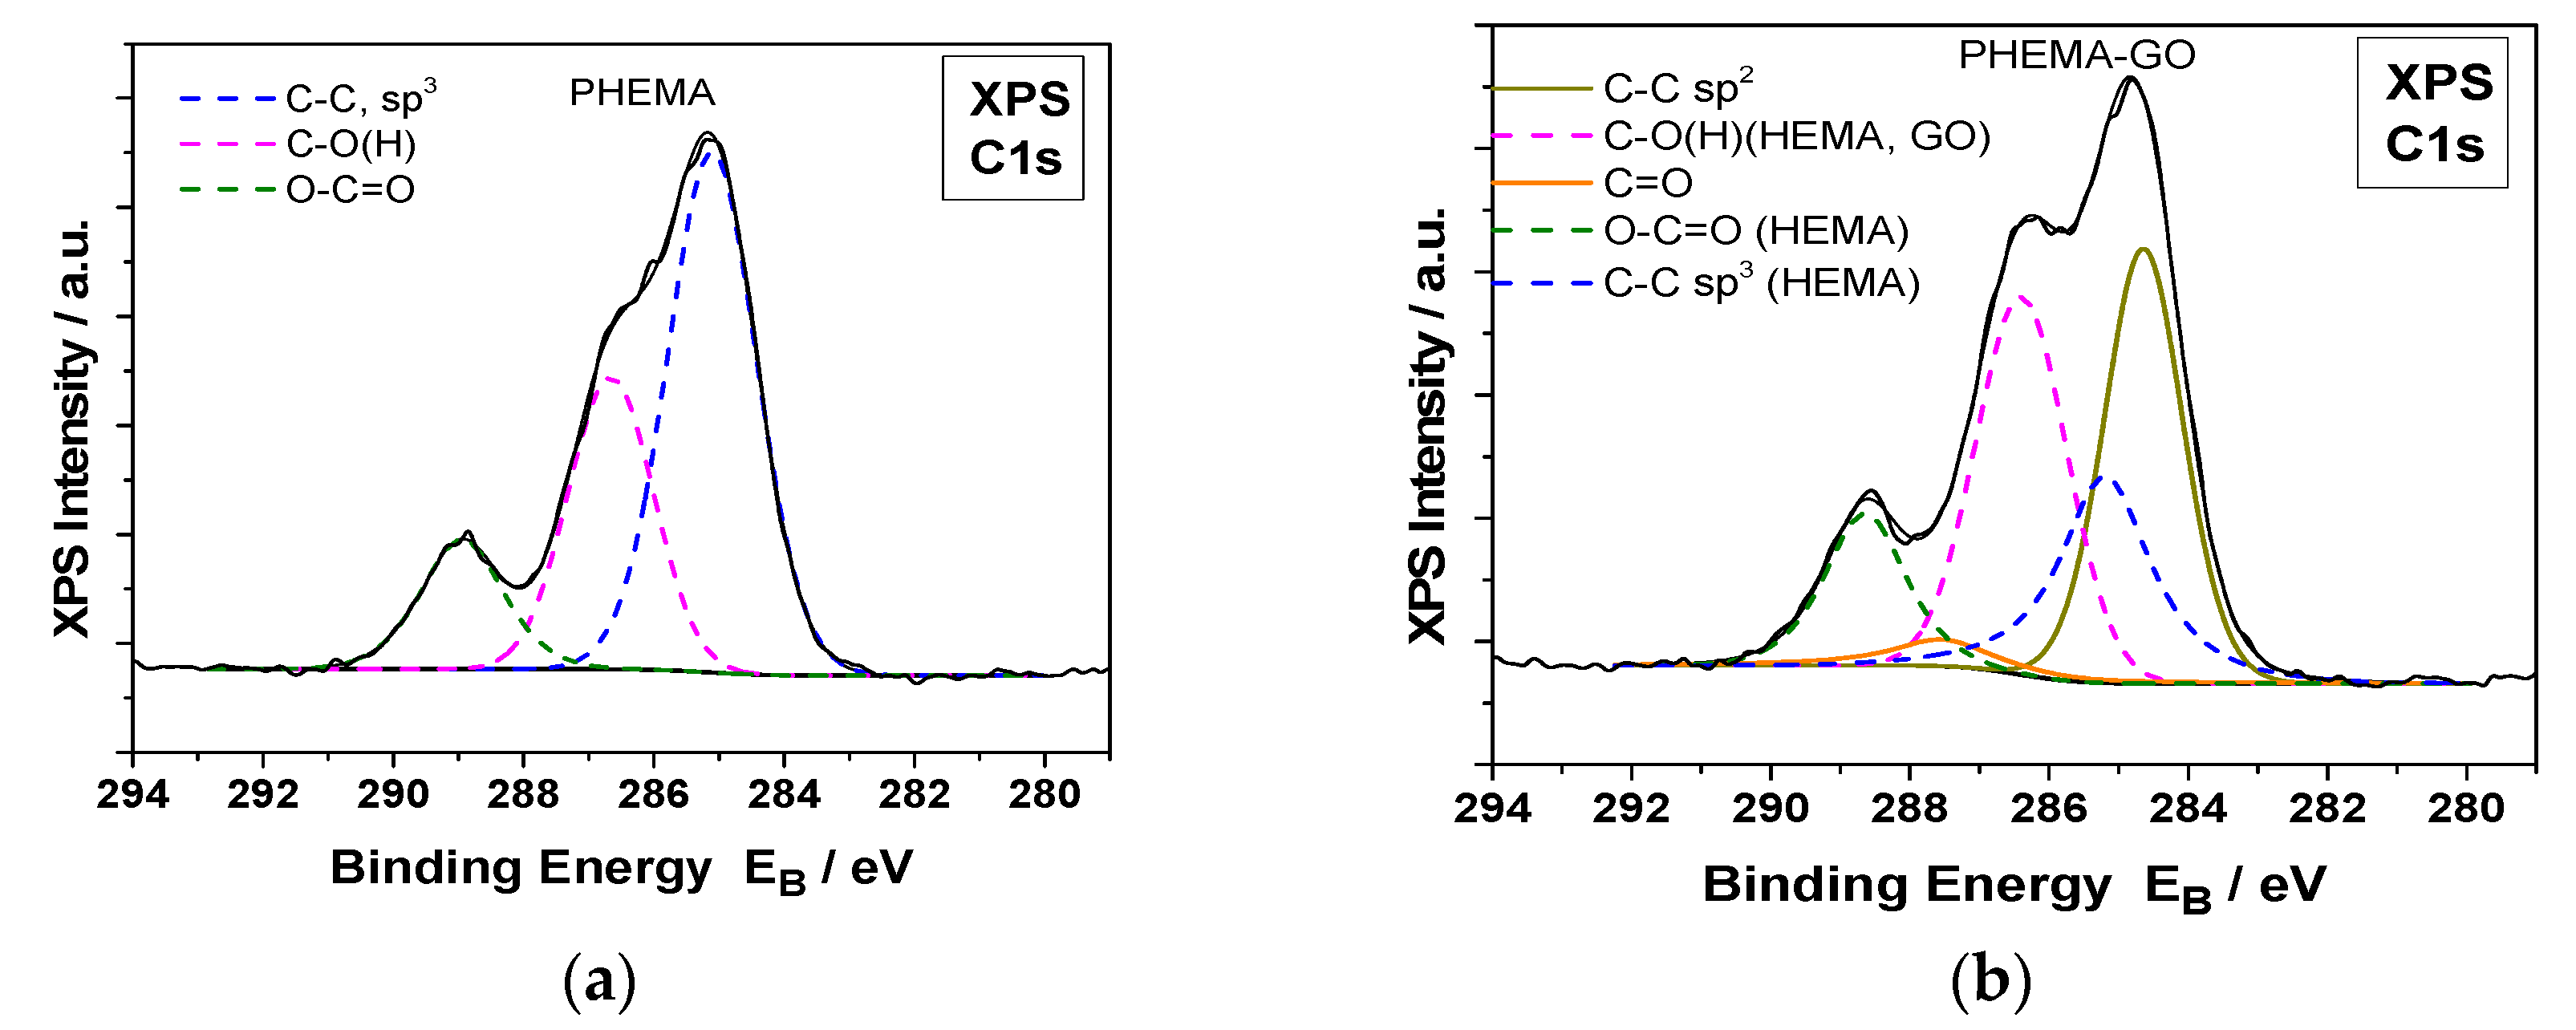
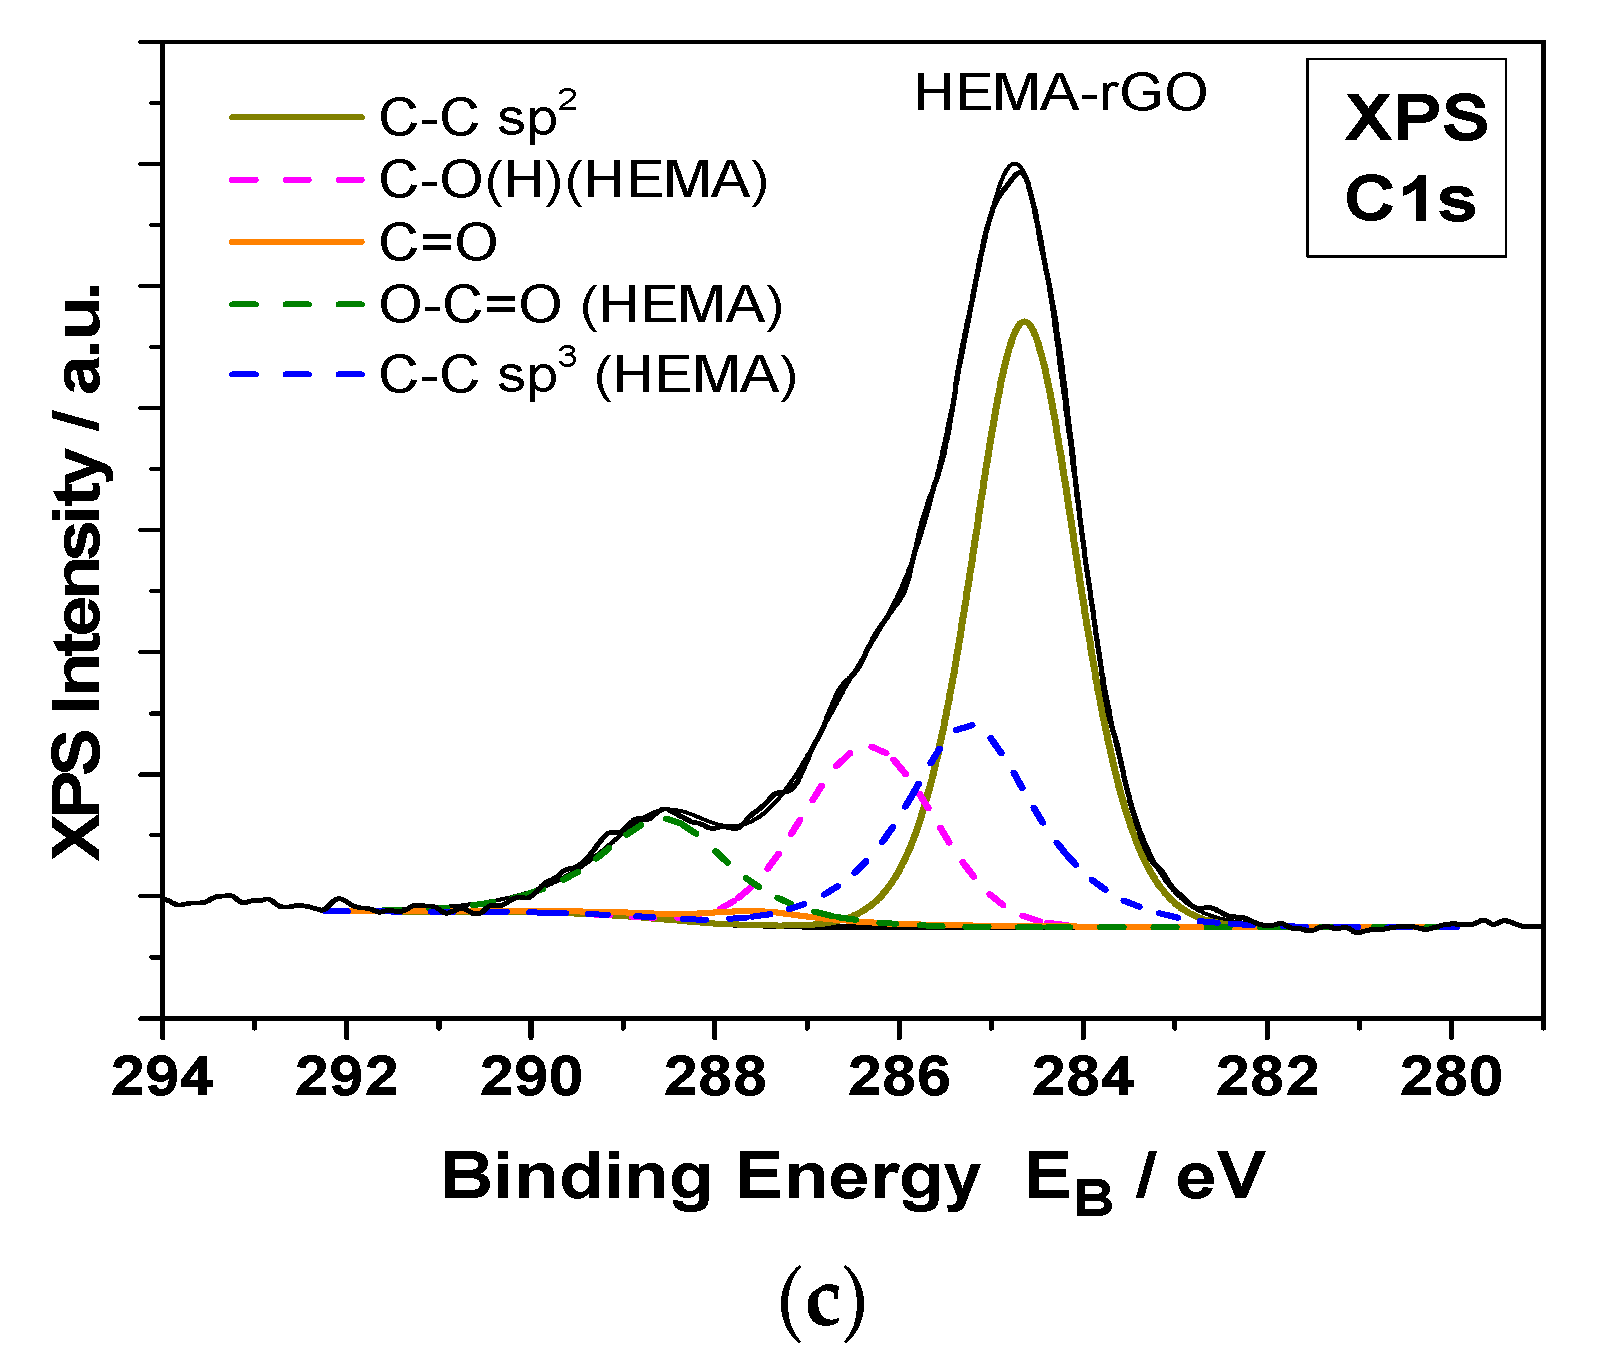
Figure 12.
Deconvoluted O 1s XPS spectra of hydrophilic IOLs past equilibration in GO suspensions and following reduction with phenyl hydrazine; (a) PHEMA, (b) PHEMA -GO and (c) PHEMA-rGO.
Figure 12.
Deconvoluted O 1s XPS spectra of hydrophilic IOLs past equilibration in GO suspensions and following reduction with phenyl hydrazine; (a) PHEMA, (b) PHEMA -GO and (c) PHEMA-rGO.
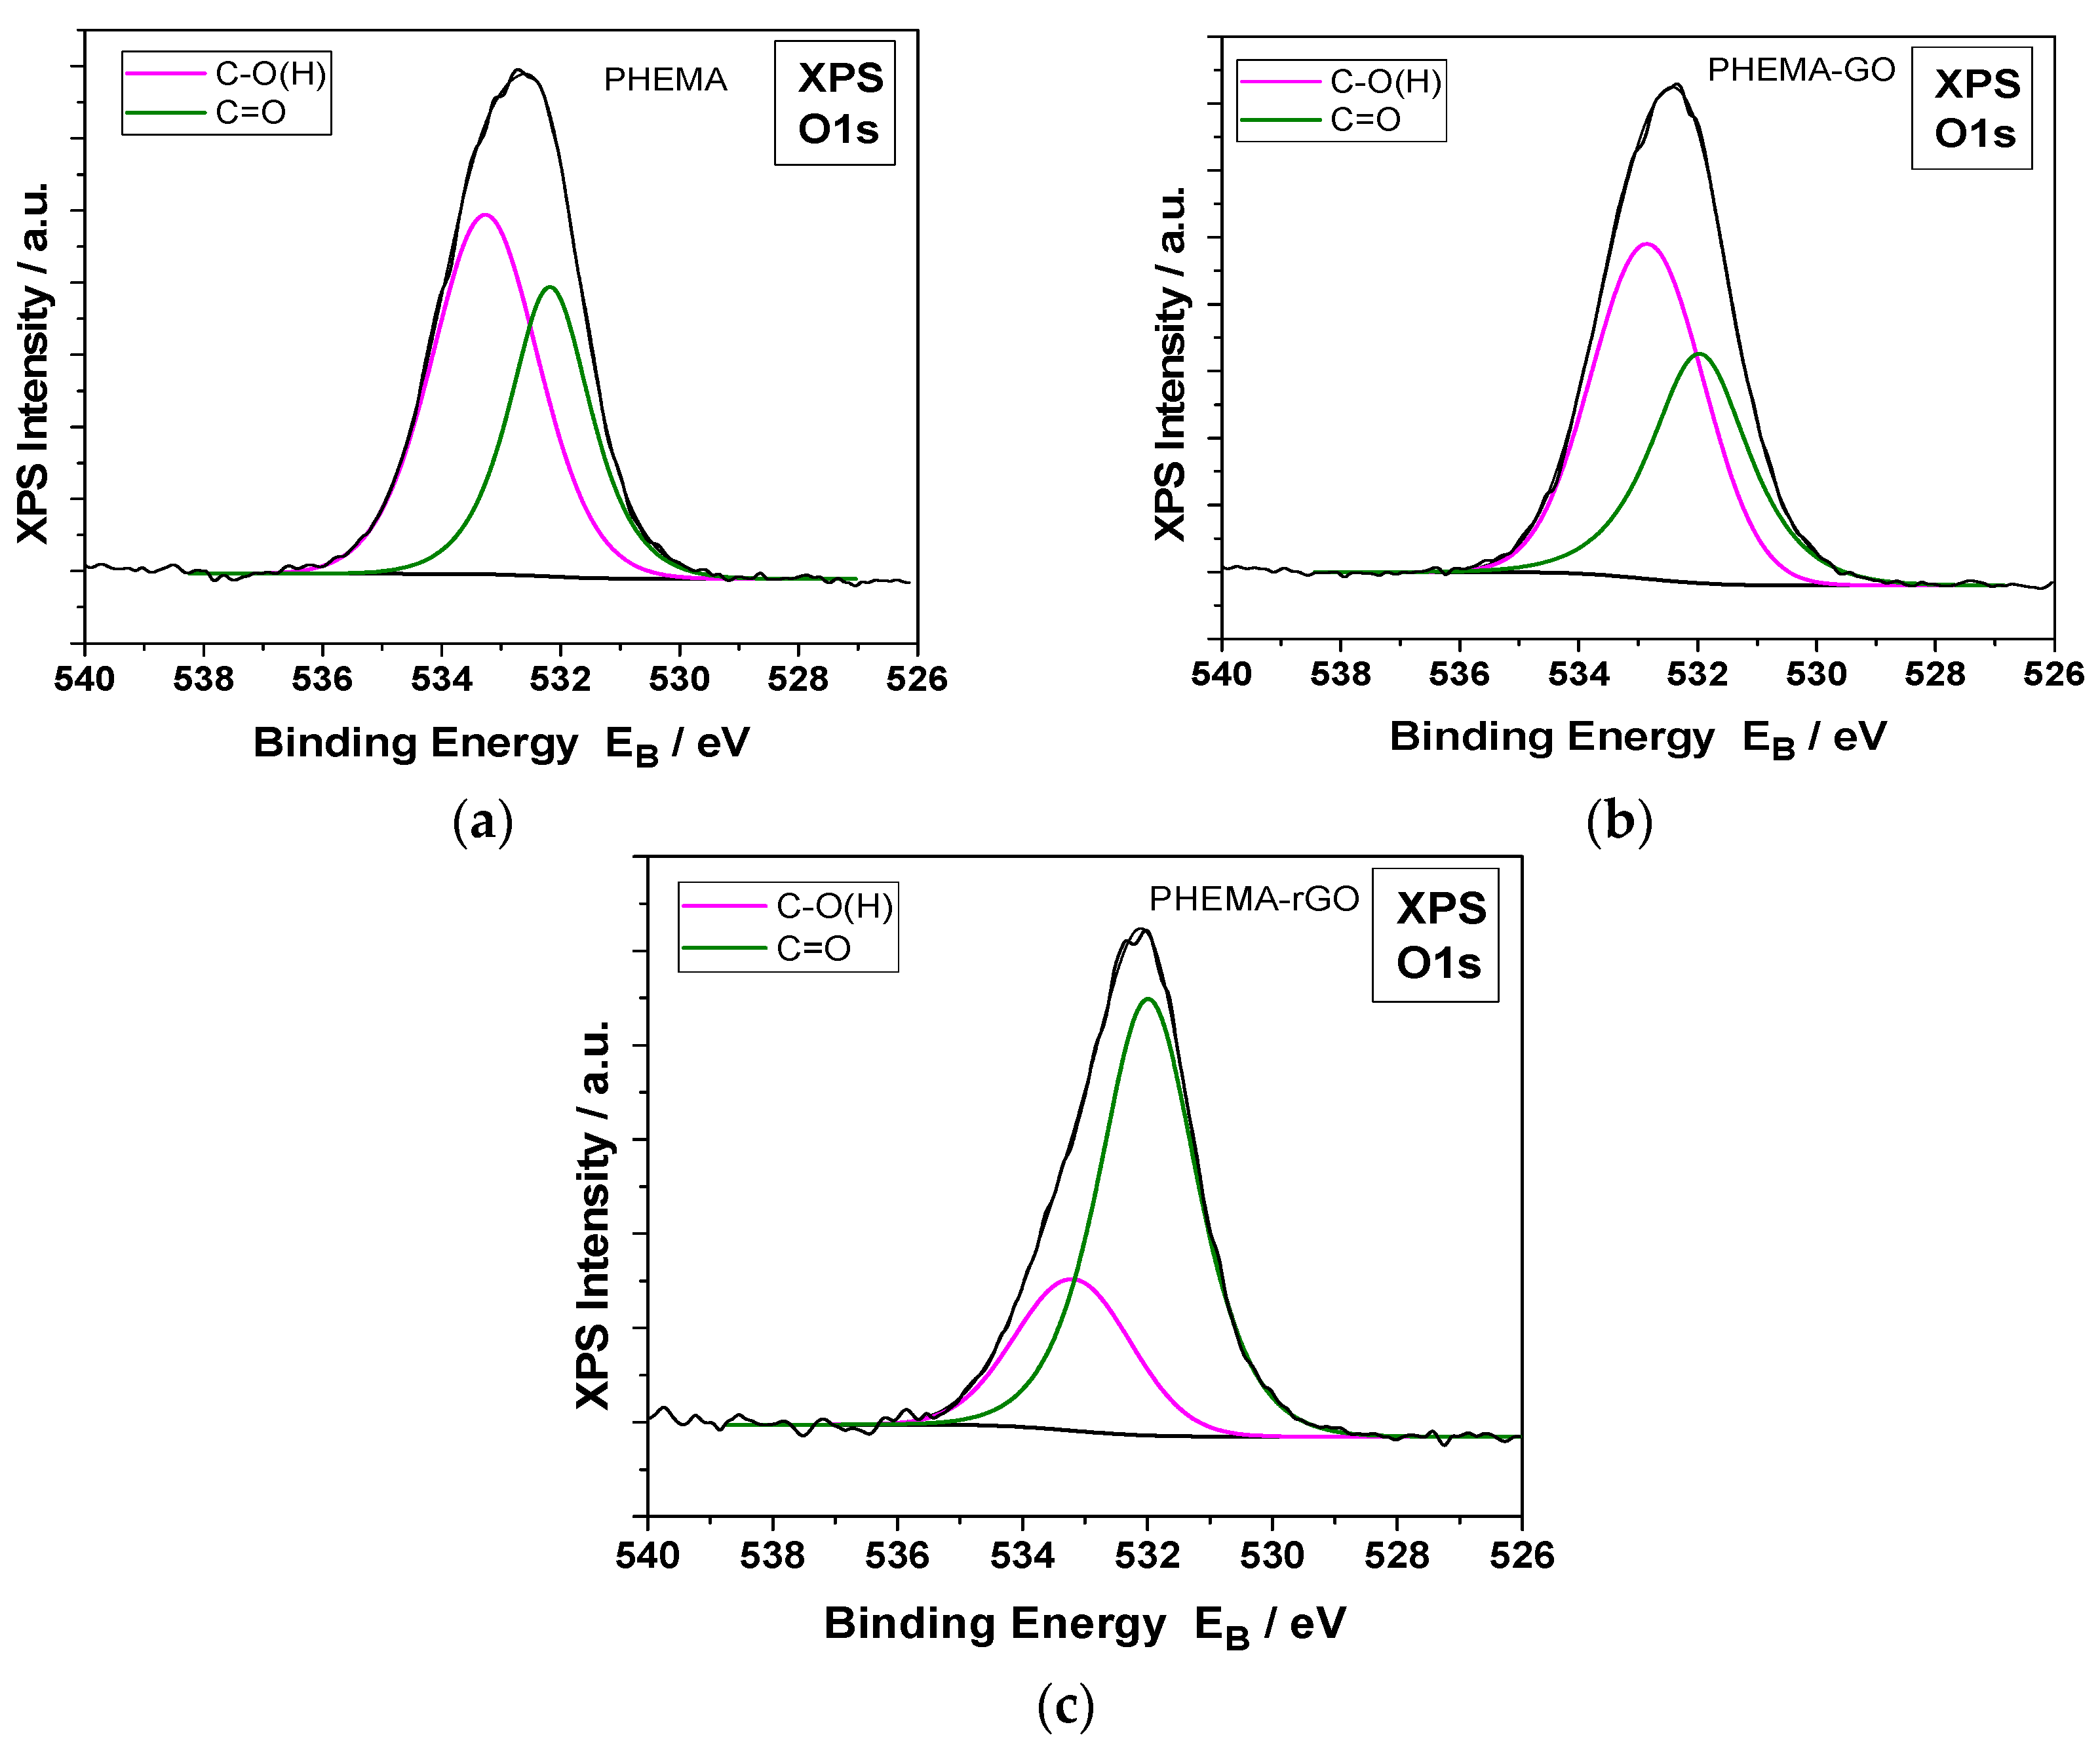
Figure 13.
Scanning electron microscope (SEM) photographs of IOLs past equilibration with GO suspensions (a)10x10-4 % w/v GO, (b) 2x10⁻⁴ % w/v GO, (c) 3x10⁻⁴ % w/v, (d) 5x10⁻⁴ % w/v GO, (e) 7x10⁻⁴ % w/v GO and (f) 10x10-4 % w/v GO.
Figure 13.
Scanning electron microscope (SEM) photographs of IOLs past equilibration with GO suspensions (a)10x10-4 % w/v GO, (b) 2x10⁻⁴ % w/v GO, (c) 3x10⁻⁴ % w/v, (d) 5x10⁻⁴ % w/v GO, (e) 7x10⁻⁴ % w/v GO and (f) 10x10-4 % w/v GO.
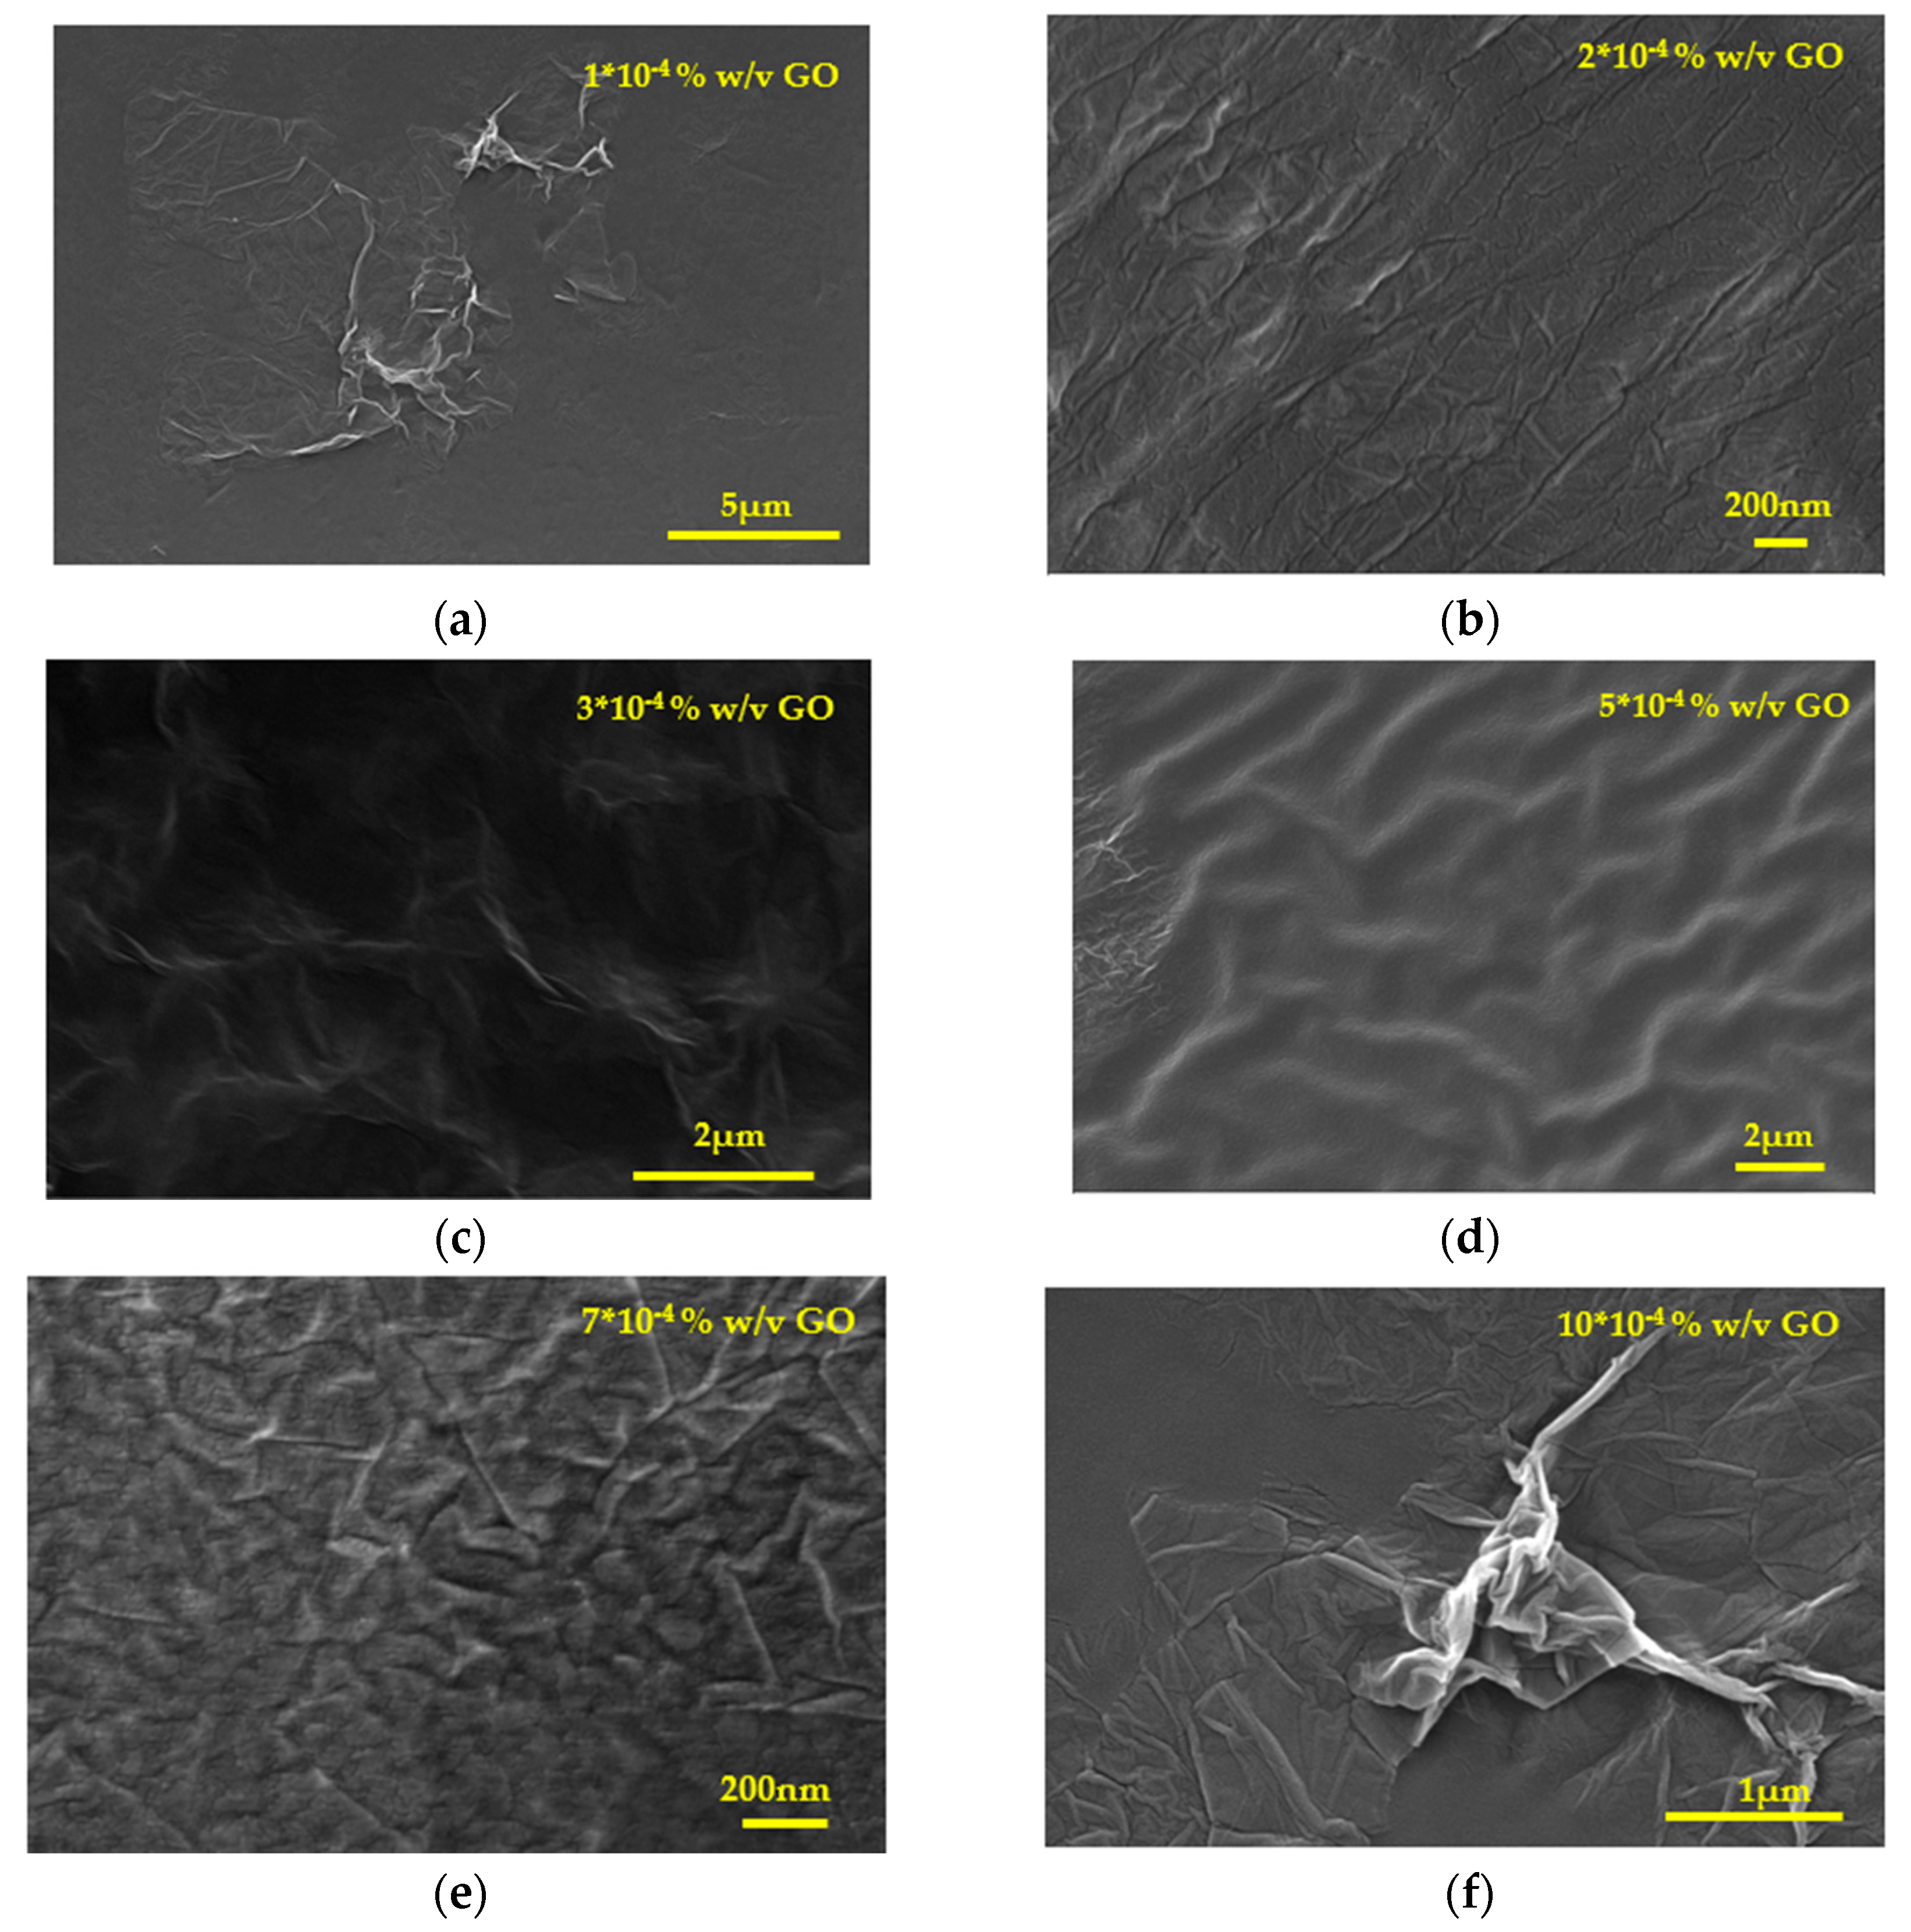
Figure 14.
Scanning electron microscope (SEM) photographs of hydrophilic IOLs coated with GO past their chemical reduction with phenyl hydrazine (a) Without treatment, (b) Coating developed after equilibration with 5x10⁻⁴ % w/v GO suspension and (c) Coating after chemical reduction of (b).
Figure 14.
Scanning electron microscope (SEM) photographs of hydrophilic IOLs coated with GO past their chemical reduction with phenyl hydrazine (a) Without treatment, (b) Coating developed after equilibration with 5x10⁻⁴ % w/v GO suspension and (c) Coating after chemical reduction of (b).
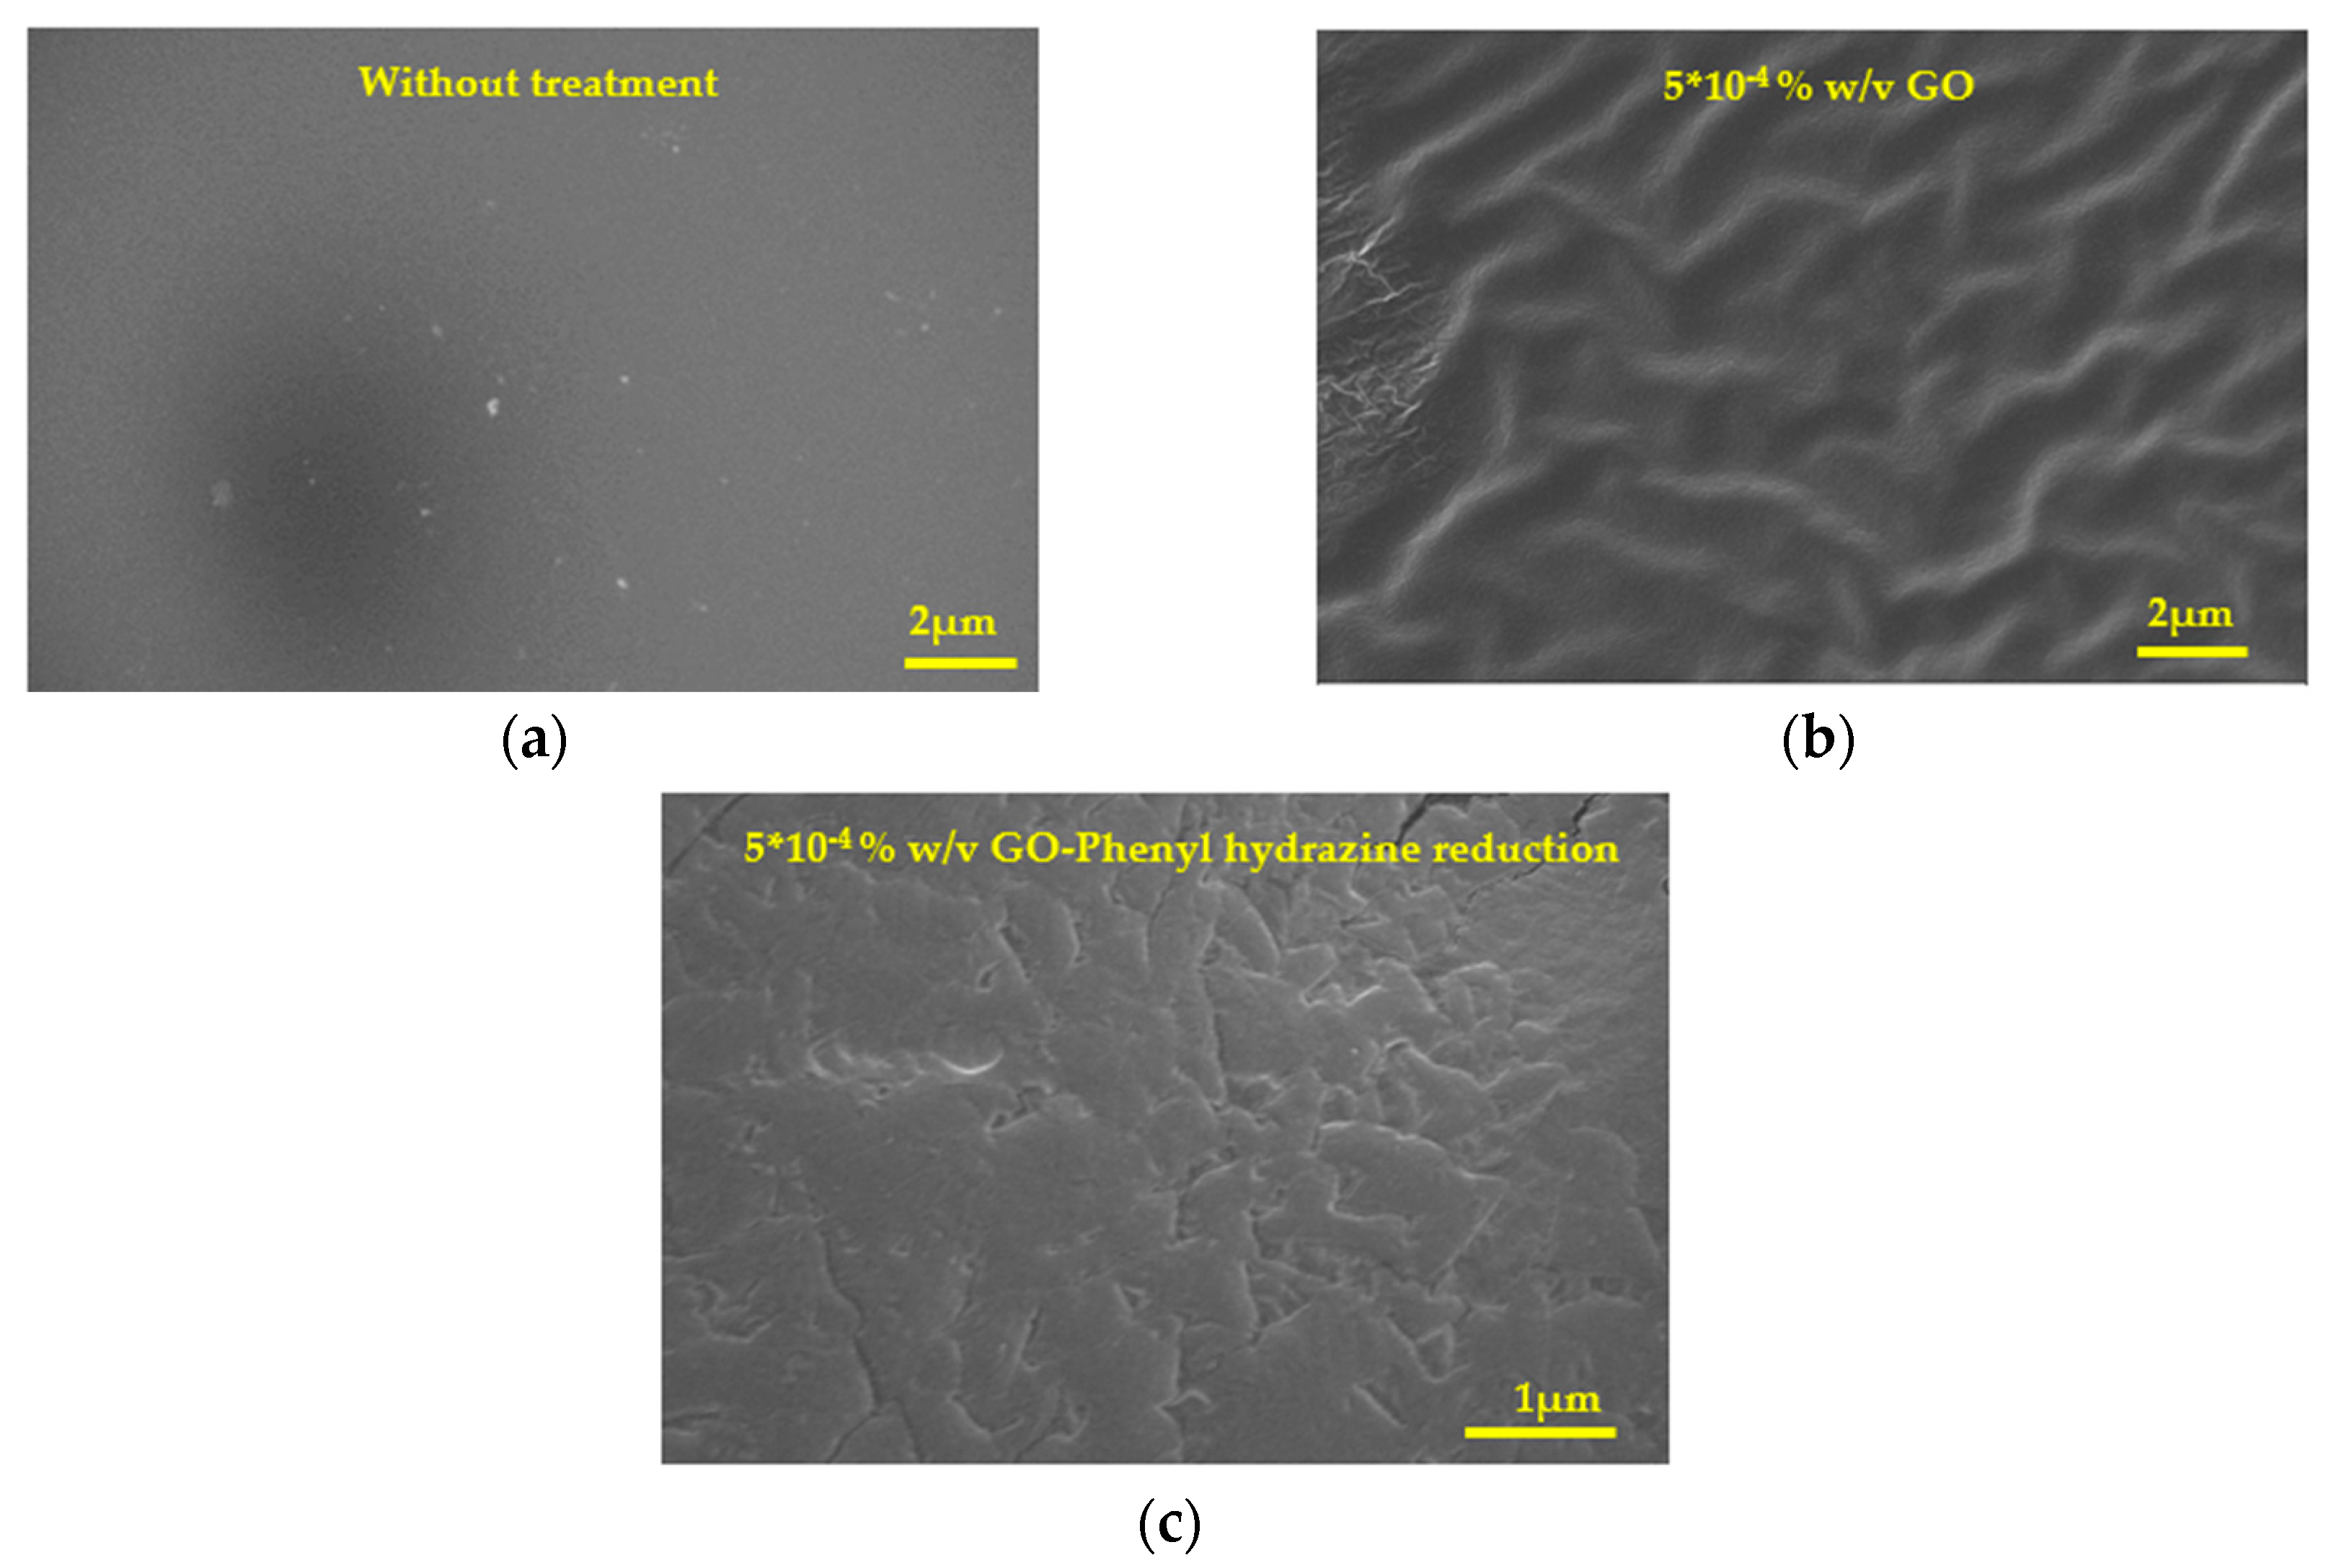
Figure 15.
Illustrations of possible mechanism of PHEMA and GO interaction (a) before and (b) after reduction of the GO coating with phenyl hydrazine.
Figure 15.
Illustrations of possible mechanism of PHEMA and GO interaction (a) before and (b) after reduction of the GO coating with phenyl hydrazine.
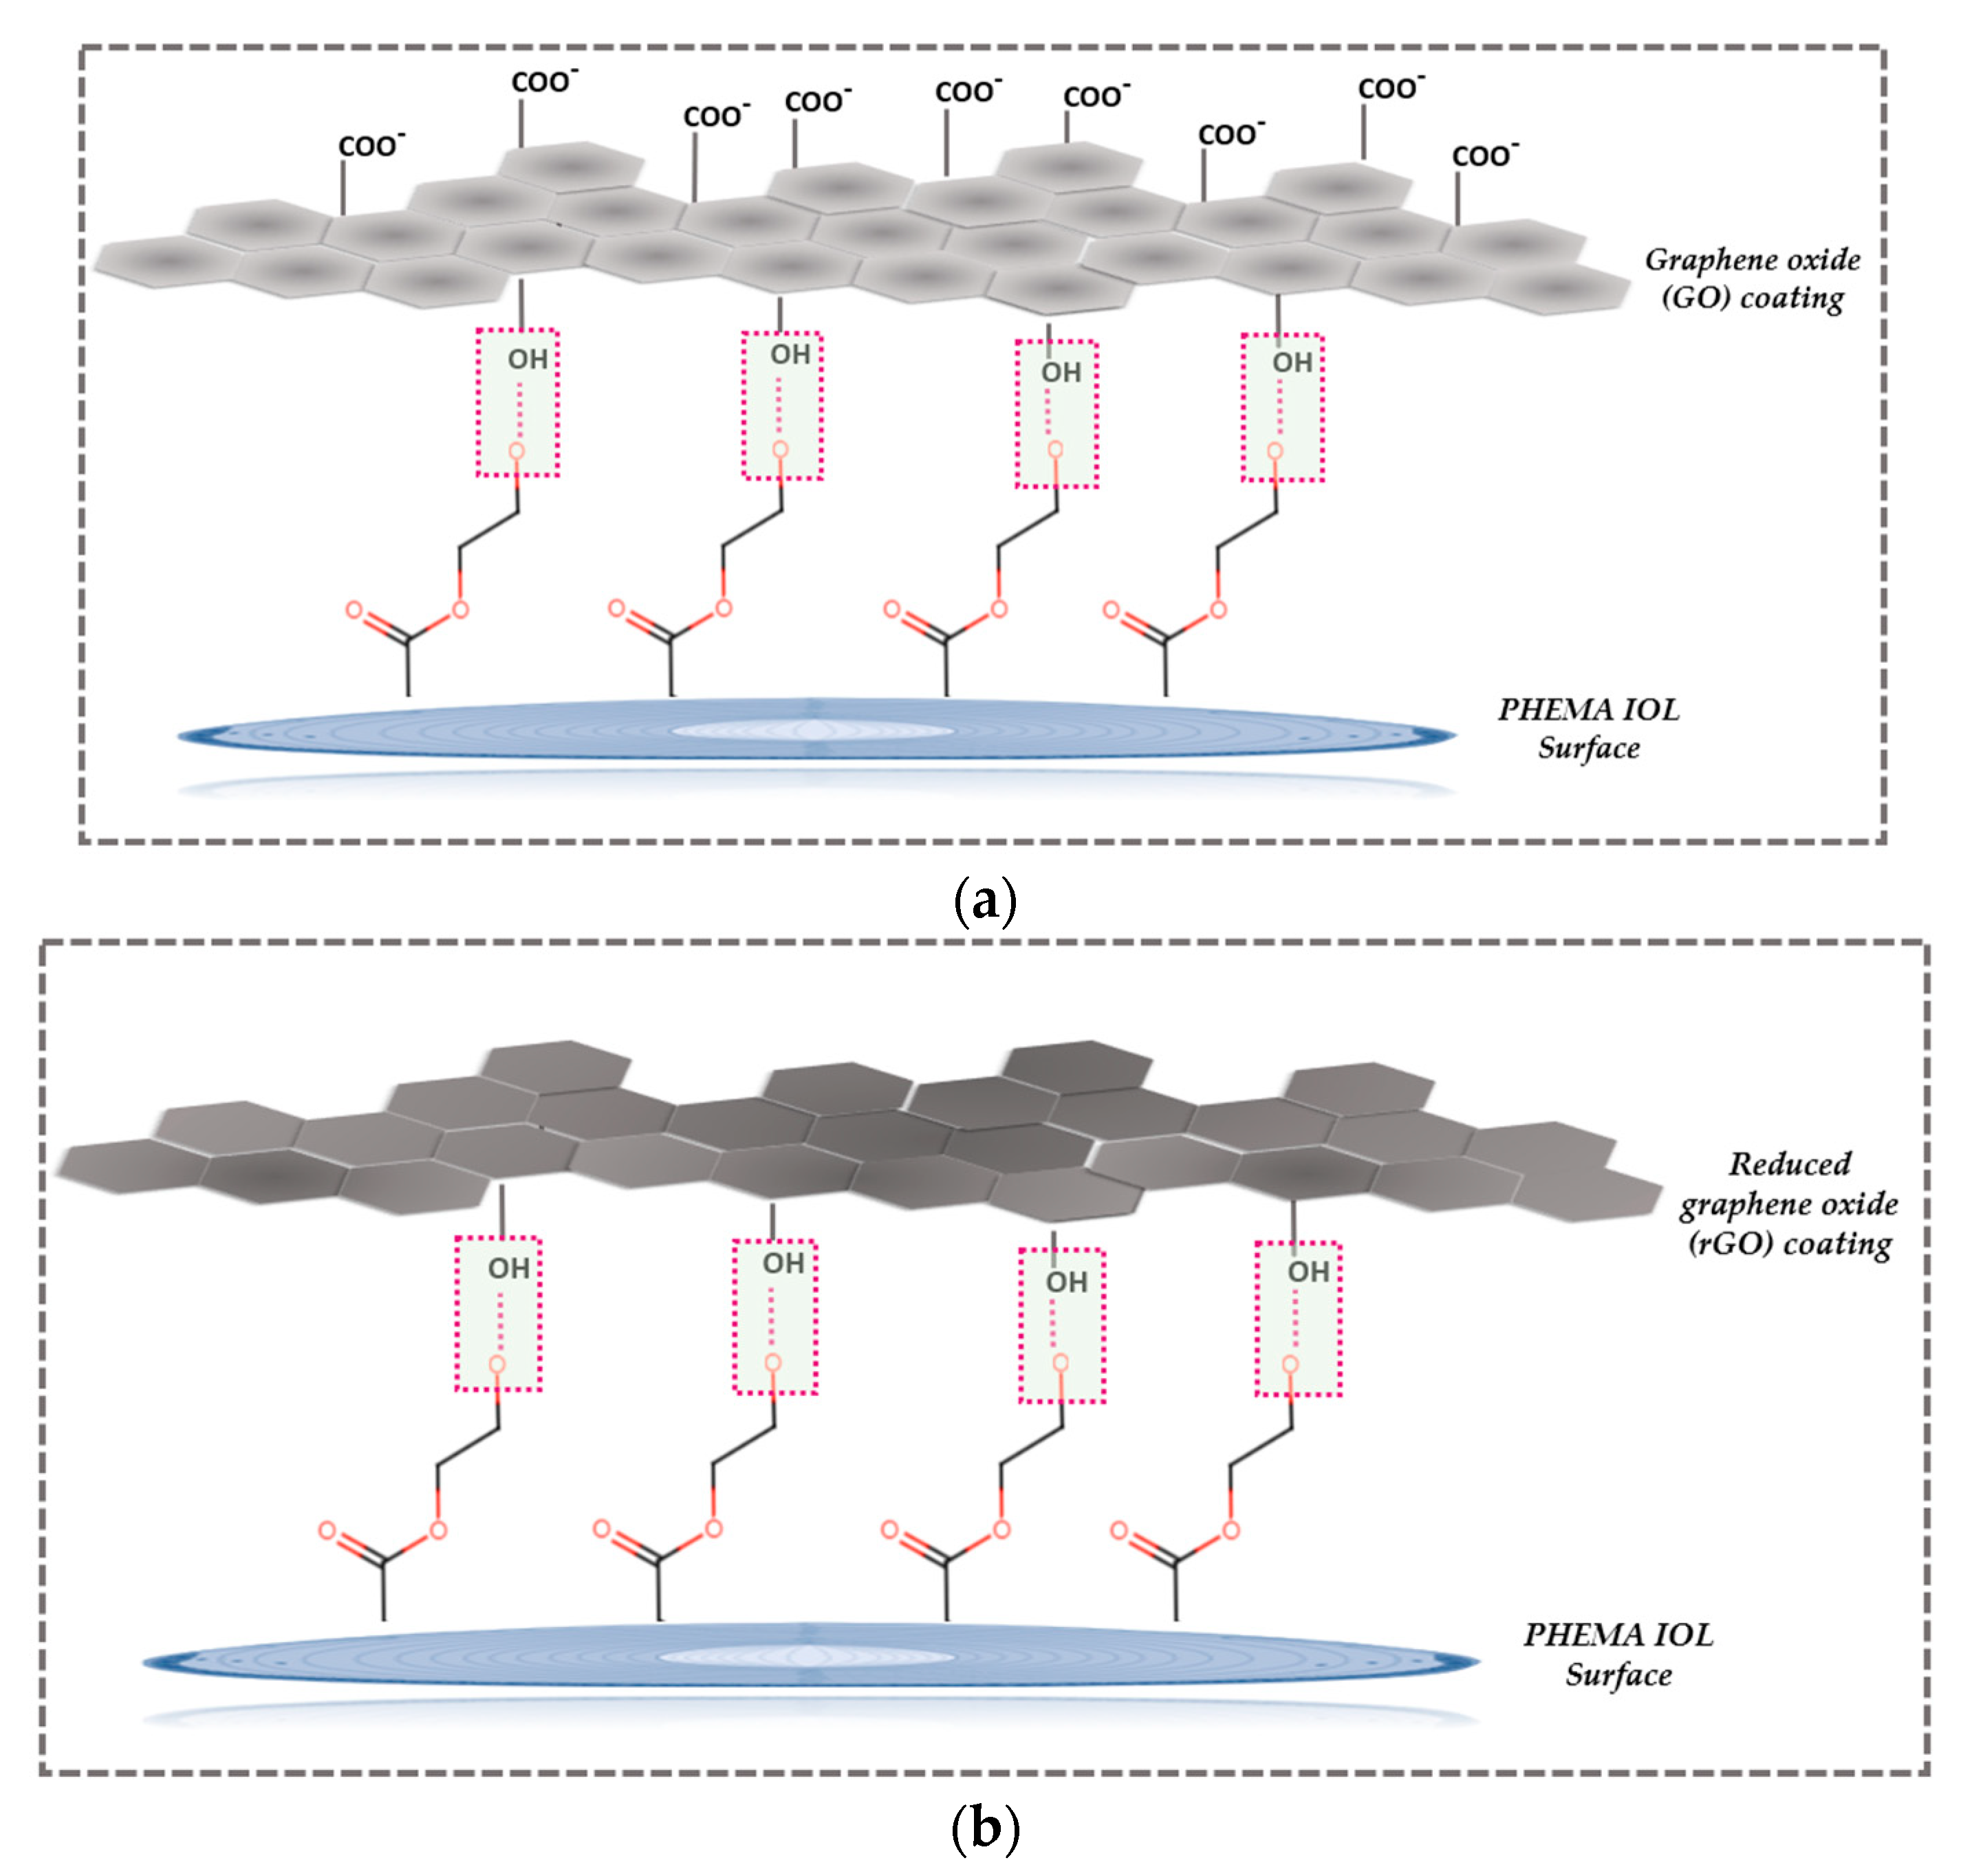
Figure 16.
Rates of HAP crystal growth on HAP crystals equilibrated with GO suspensions in water, as a function of the concentration of the GO suspensions, from supersaturated solutions. Relative solution supersaturation with respect to HAP, σHAP=9.99, pH 7.40, 0.15 M NaCl.
Figure 16.
Rates of HAP crystal growth on HAP crystals equilibrated with GO suspensions in water, as a function of the concentration of the GO suspensions, from supersaturated solutions. Relative solution supersaturation with respect to HAP, σHAP=9.99, pH 7.40, 0.15 M NaCl.
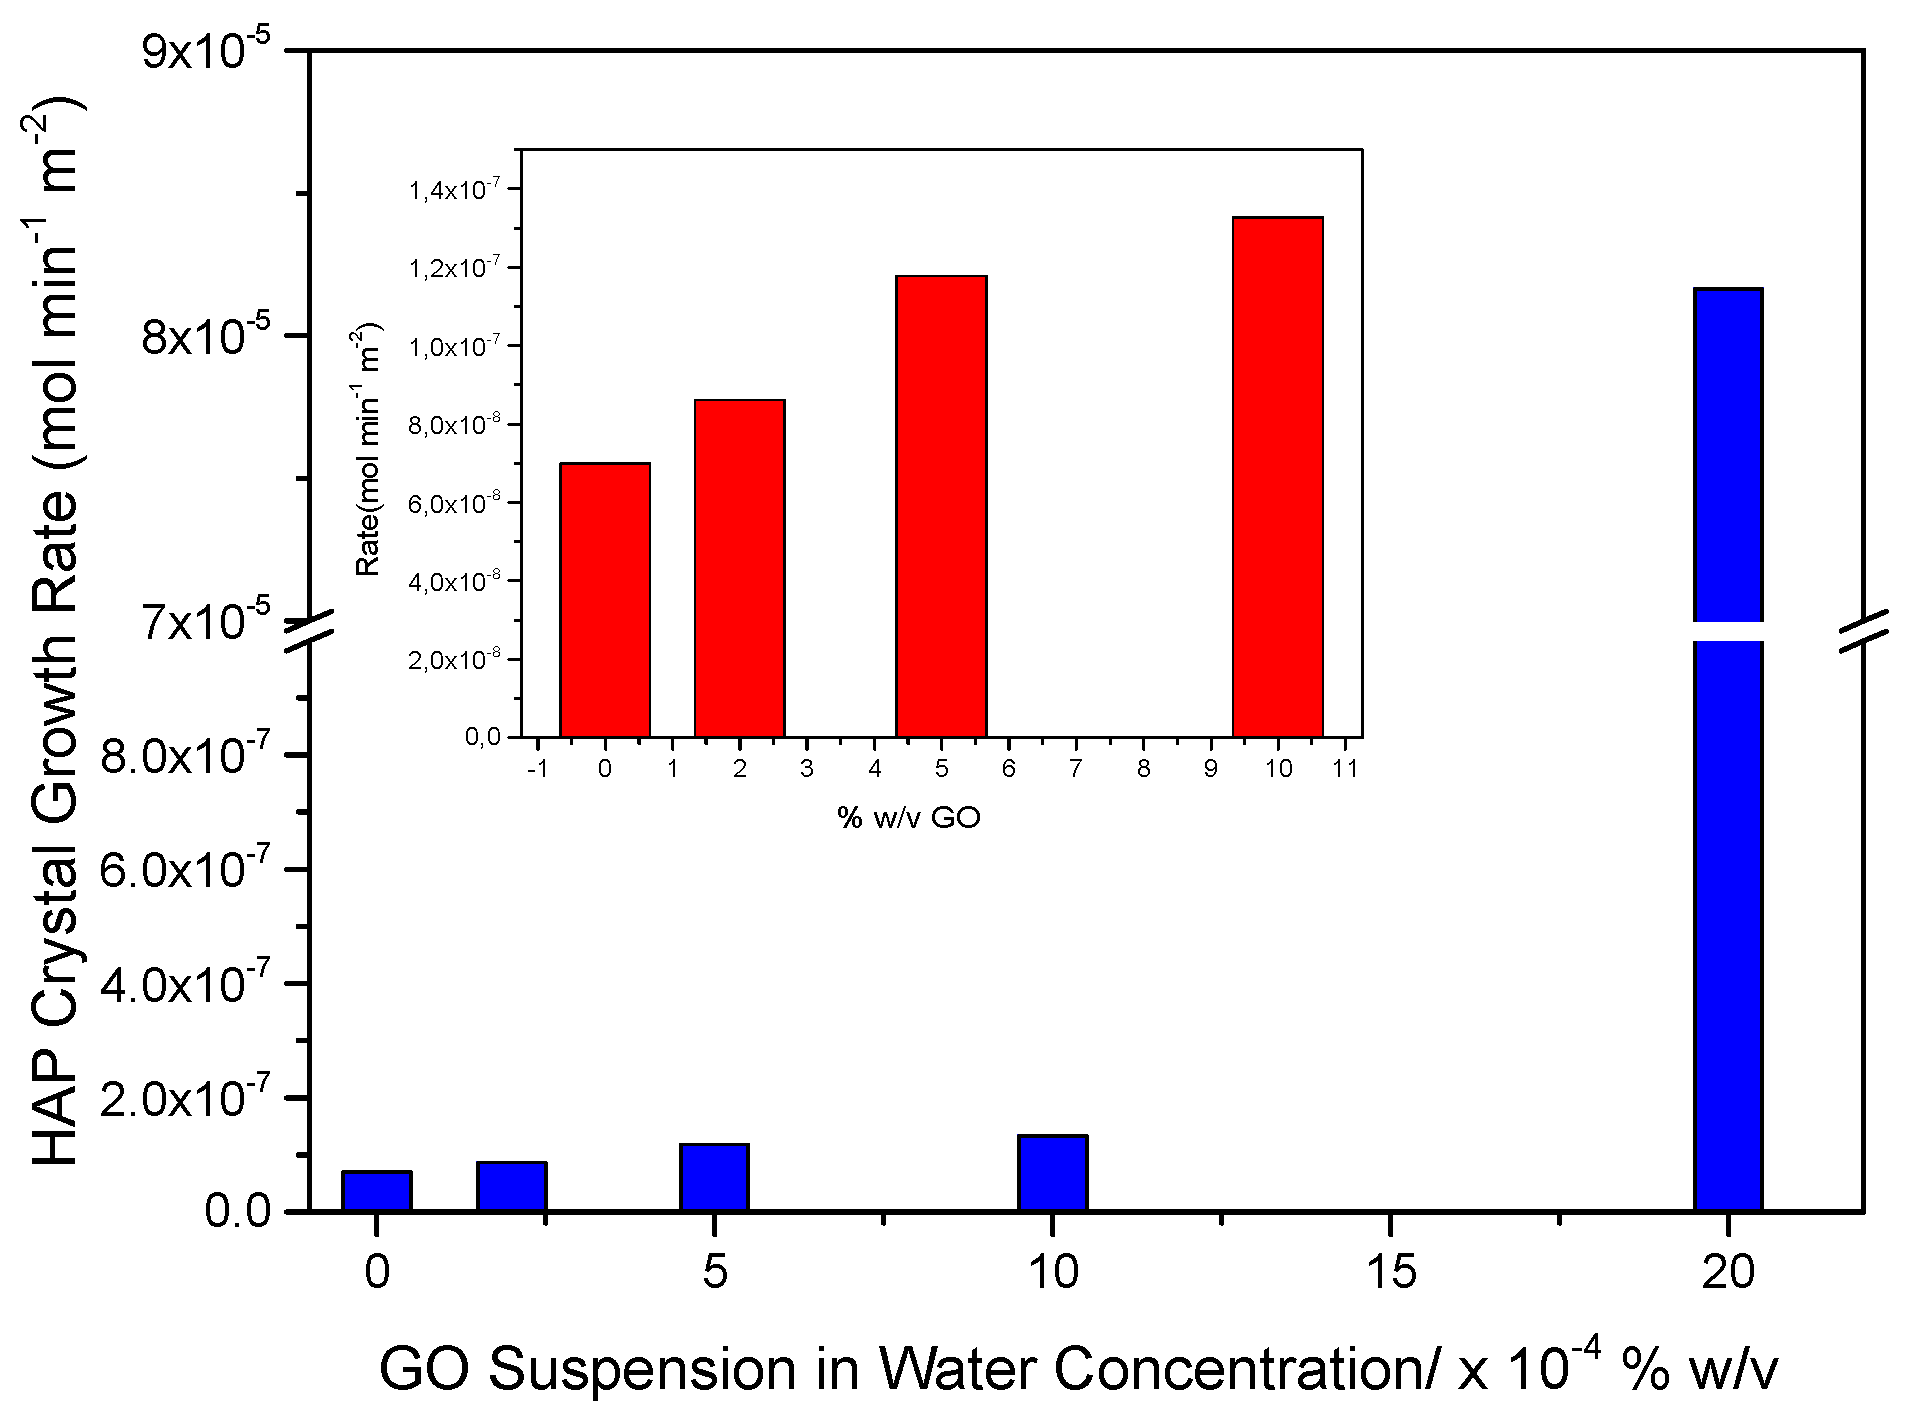
Figure 17.
Scanning electron microscope (SEM) photographs of HAP crystals grown at constant supersaturation on HAP seed crystals equilibrated with GO suspensions in water of different concentrations as shown on the individual frames; σHAP=9.99, 37oC, pH 7.4, 0.15 M.
Figure 17.
Scanning electron microscope (SEM) photographs of HAP crystals grown at constant supersaturation on HAP seed crystals equilibrated with GO suspensions in water of different concentrations as shown on the individual frames; σHAP=9.99, 37oC, pH 7.4, 0.15 M.
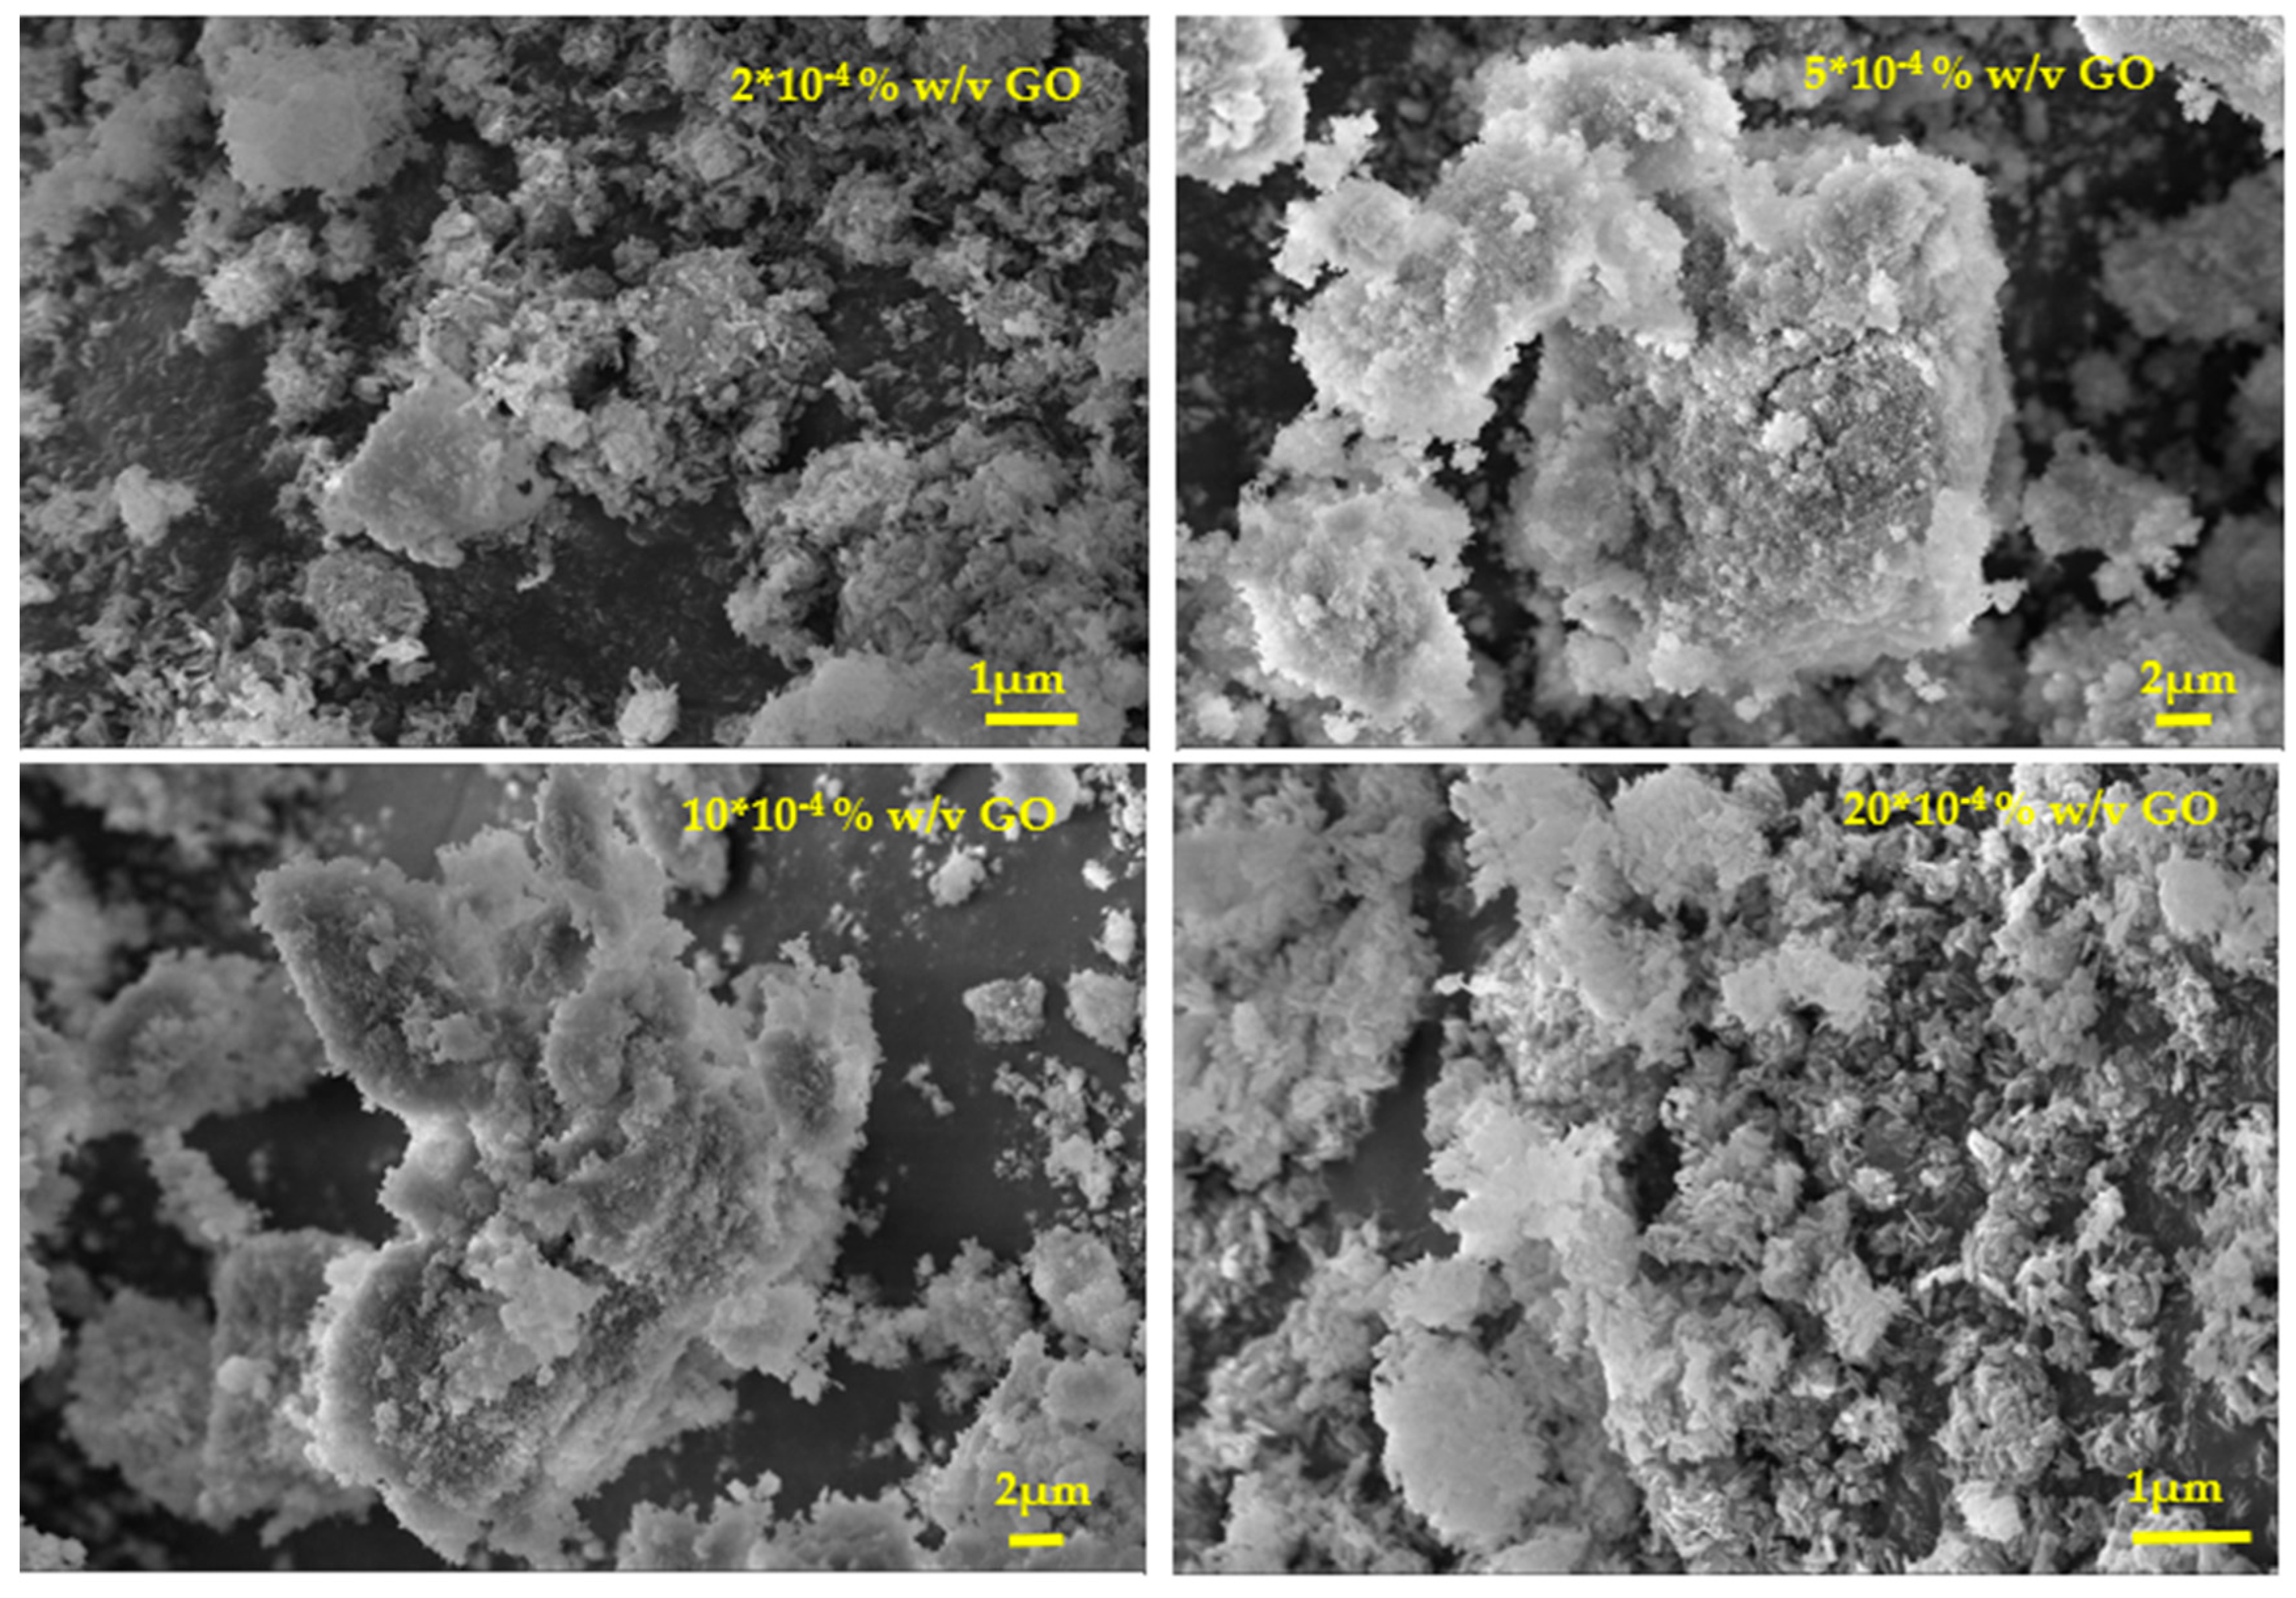
Figure 18.
HAP crystal growth rates on GO-coated IOLs as a result of their equilibration with aqueous suspensions of GO of various concentrations (2x10⁻⁴, 5 x10⁻⁴ and 7x10⁻⁴ %w/v GO), at different relative supersaturation values with respect to HAP; 37oC, pH 7.4, 0.15 M.
Figure 18.
HAP crystal growth rates on GO-coated IOLs as a result of their equilibration with aqueous suspensions of GO of various concentrations (2x10⁻⁴, 5 x10⁻⁴ and 7x10⁻⁴ %w/v GO), at different relative supersaturation values with respect to HAP; 37oC, pH 7.4, 0.15 M.
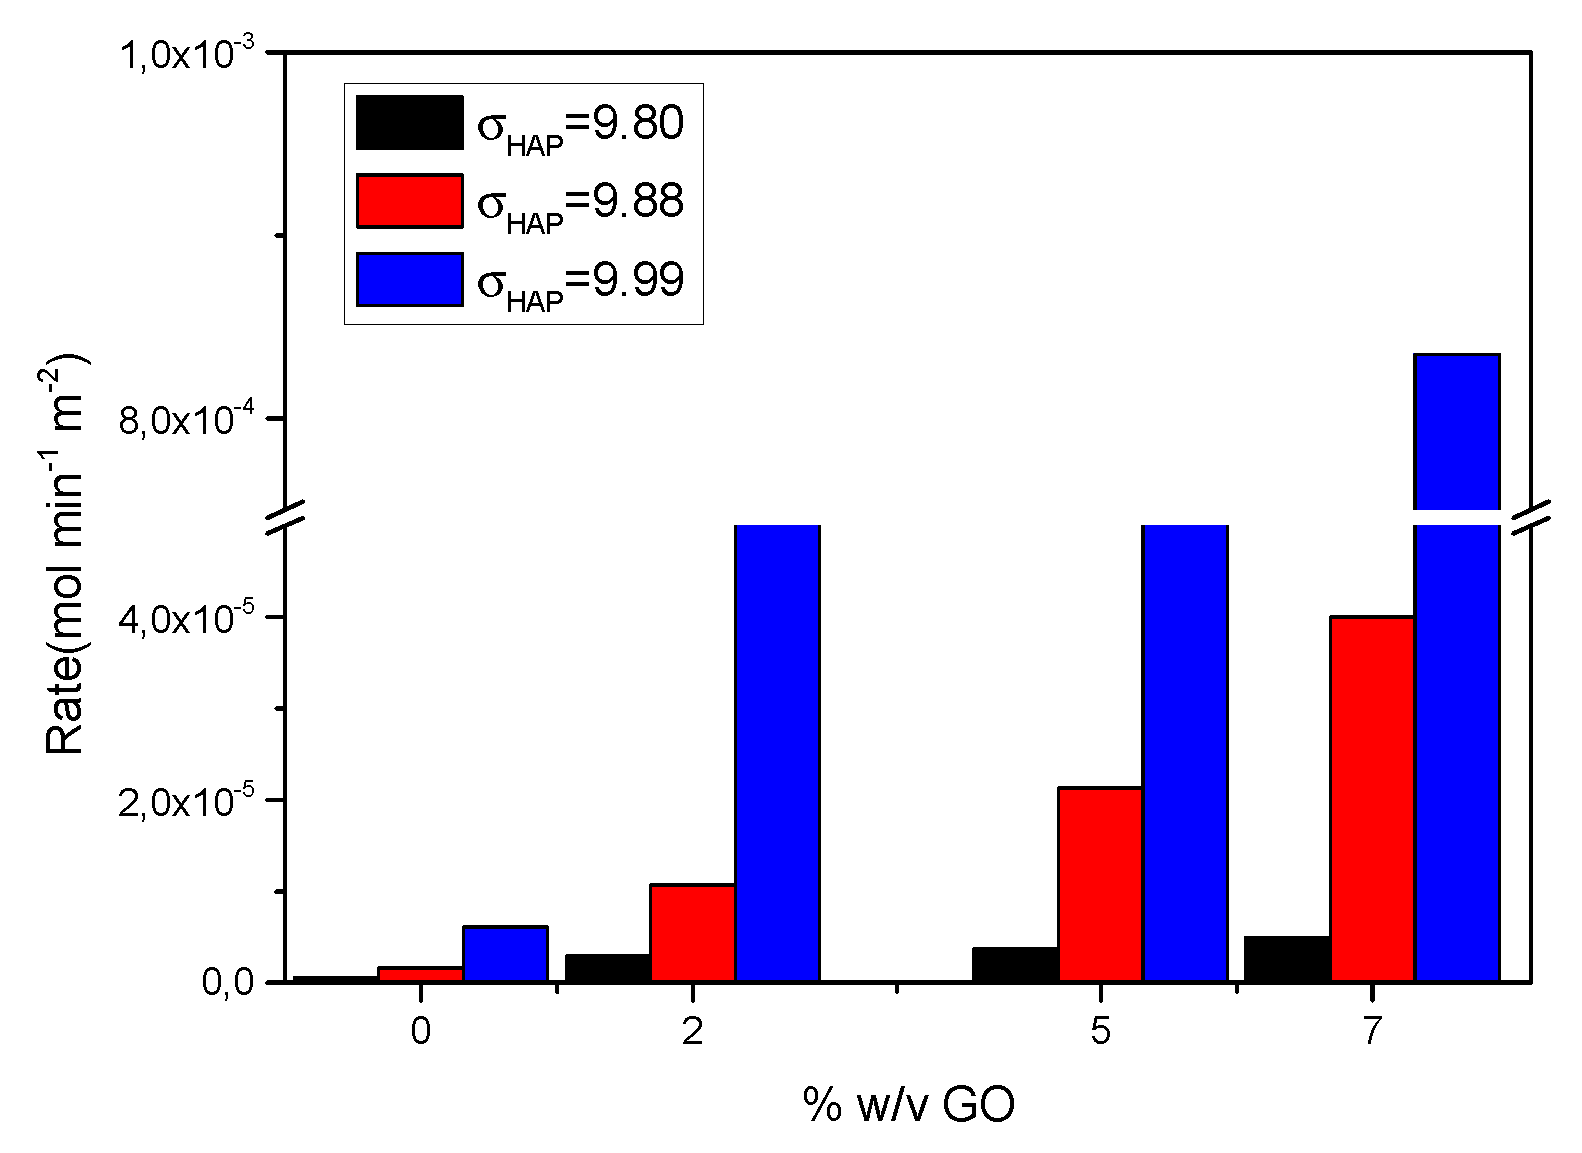
Figure 19.
Scanning electron microscope (SEM) photographs of HAP crystals grown from supersaturated solutions, of different relative supersaturation values with respect to HAP, on GO-coated IOLs (a) σHAΡ=9.80 (IOLs equilibrated with 2x10⁻⁴ % w/v GO suspension in water); (b) σHAP=9.88 (IOLs equilibrated with 5x10⁻⁴ % w/v GO suspension in water), (c) σHAP=9.99 (from IOLs equilibrated with 5x10⁻⁴ % w/v GO suspension in water); 37oC, pH 7.4, 0.15 M NaCl.
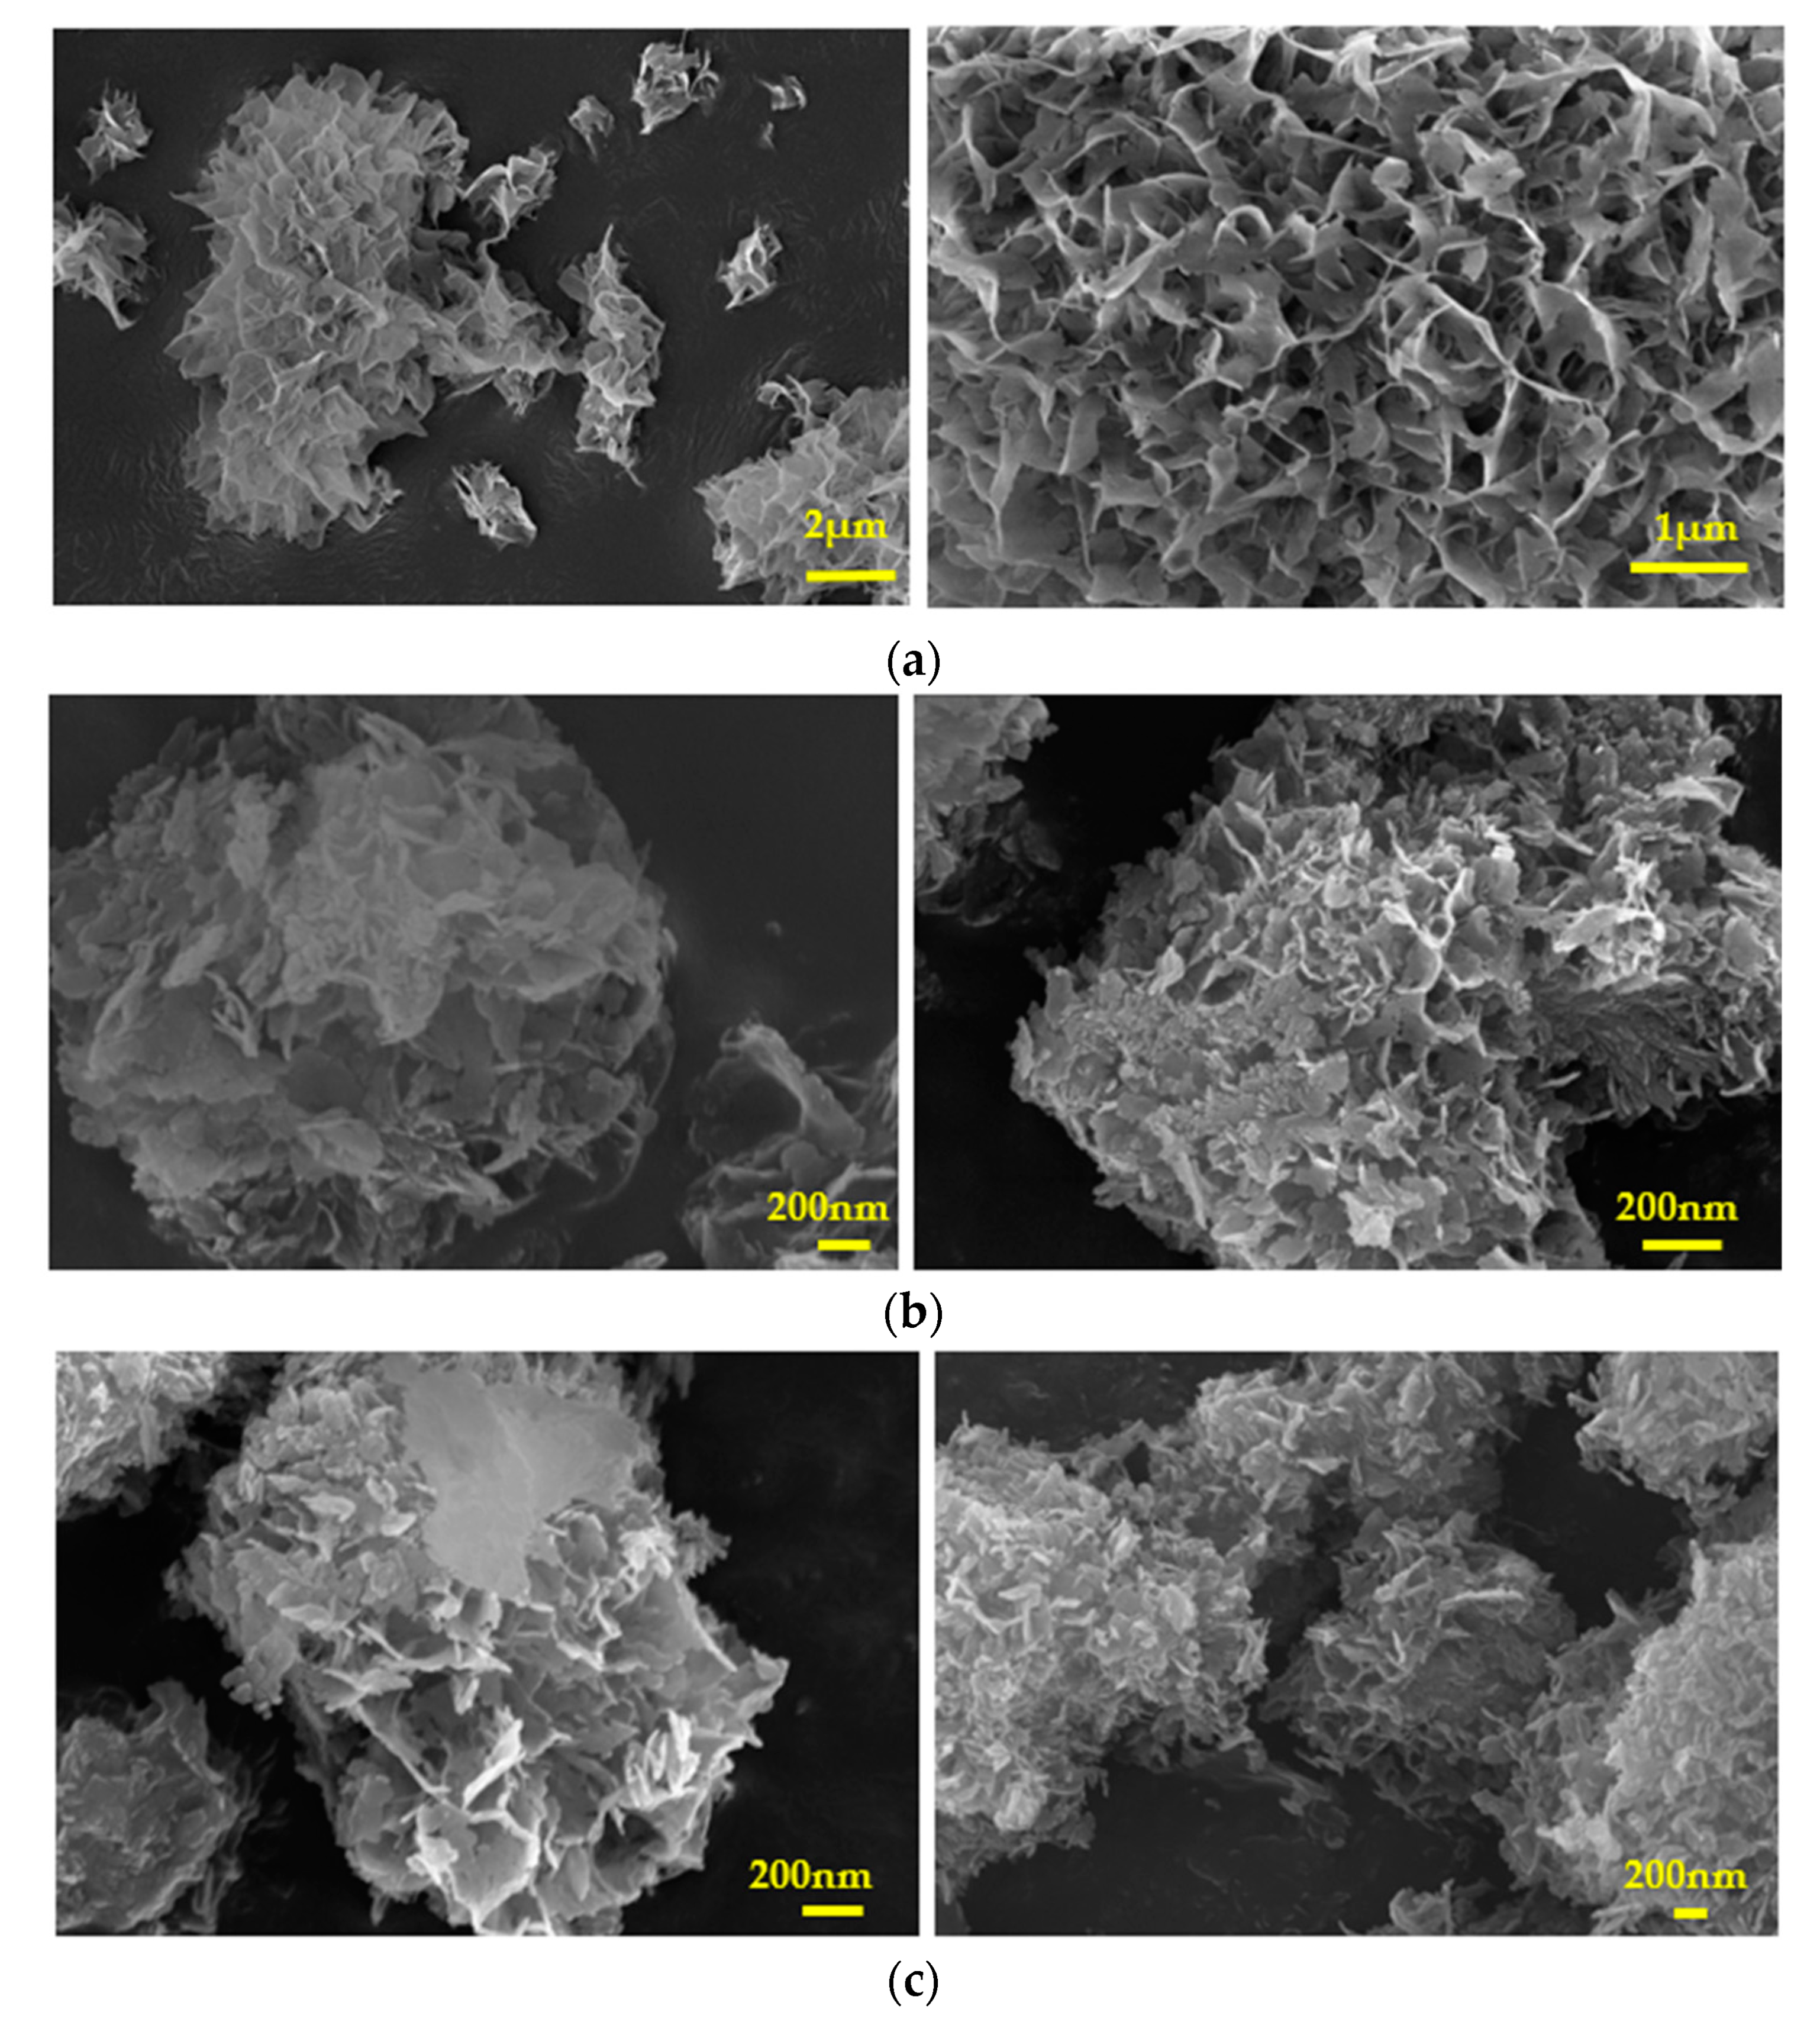
Figure 20.
HAP crystal nucleation and growth on hydrophilic, PHEMA IOLs with different types of functional groups on their surface (a) without treatment and (b) coated with graphene oxide.
Figure 20.
HAP crystal nucleation and growth on hydrophilic, PHEMA IOLs with different types of functional groups on their surface (a) without treatment and (b) coated with graphene oxide.
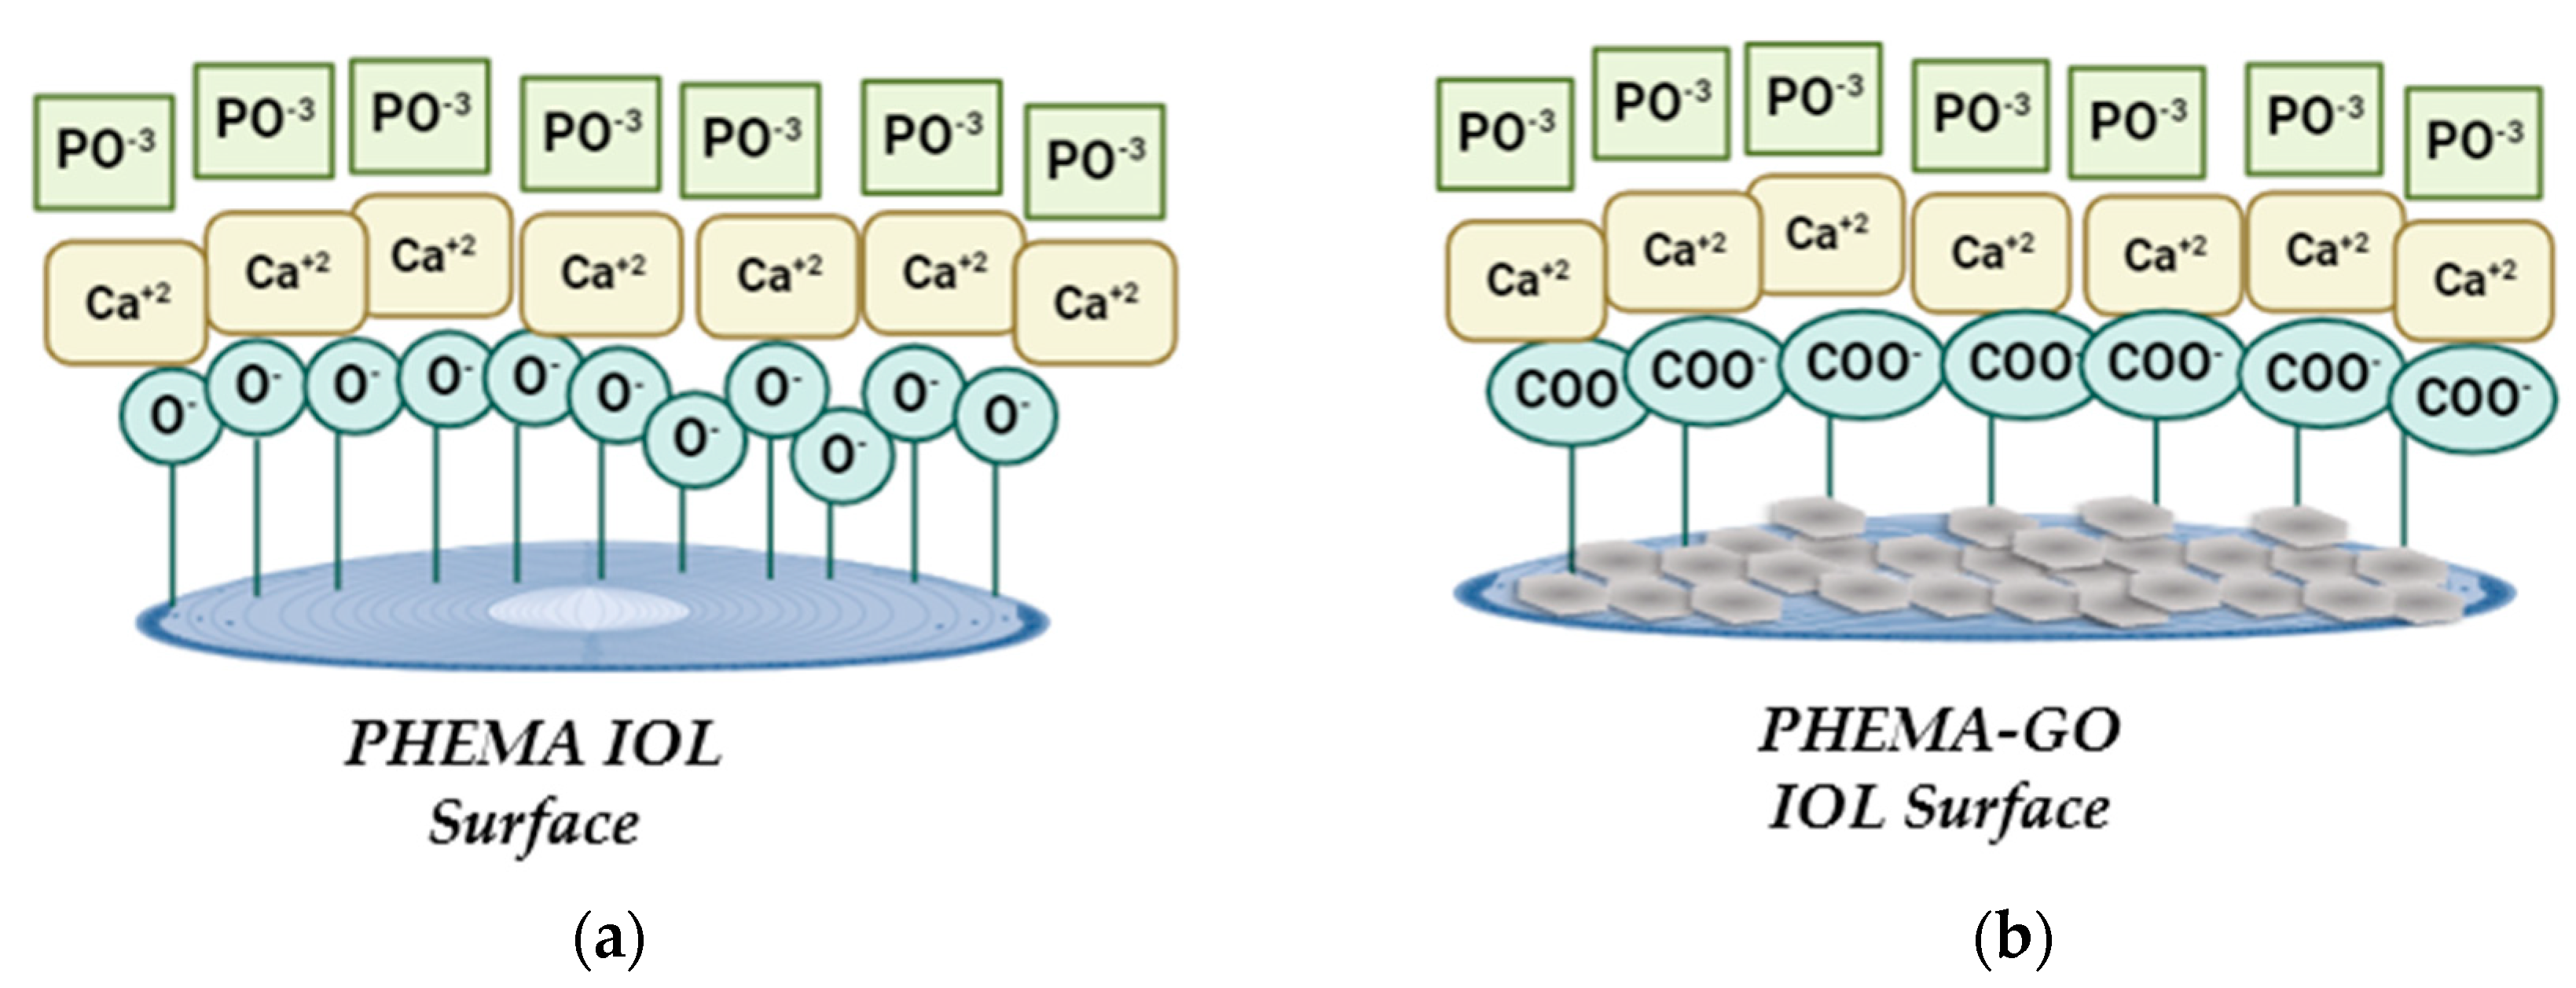
Figure 21.
Added volume of titrant solutions to maintain constant supersaturation, during HAP crystal growth in supersaturated solutions, induced by hydrophilic IOLs coated with rGO; (a) rGO coated hydrophilic IOLs; σHAP=9.80 and σHAP=9.99 (b) Coating free, GO coated and rGO coated hydrophilic IOLs, σHAP=9.80; 37oC, pH 7.4, 0.15 M NaCl.
Disclaimer/Publisher’s Note: The statements, opinions and data contained in all publications are solely those of the individual author(s) and contributor(s) and not of MDPI and/or the editor(s). MDPI and/or the editor(s) disclaim responsibility for any injury to people or property resulting from any ideas, methods, instructions or products referred to in the content. |
© 2023 by the authors. Licensee MDPI, Basel, Switzerland. This article is an open access article distributed under the terms and conditions of the Creative Commons Attribution (CC BY) license (http://creativecommons.org/licenses/by/4.0/).
Copyright: This open access article is published under a Creative Commons CC BY 4.0 license, which permit the free download, distribution, and reuse, provided that the author and preprint are cited in any reuse.


