
Submitted:
26 December 2023
Posted:
27 December 2023
You are already at the latest version
Abstract
This study explores the application of the Fully Convolutional Network (FCN) algorithm to the field of meteorology, specifically for the short-term nowcasting of severe convective weather events such as hail, convective wind gust (CG) and thunderstorms, short-term heavy rain(STHR) in Gansu. Training data comes from the European Center for Medium-Range Weather Forecasts (ECMWF) and real-time ground observations, the performance of the proposed FCN model based on 2017 to 2021 training datasets demonstrate a high prediction accuracy, with an overall error rate of 16.6%. Furthermore, the model exhibited an error rate of 18.6% across both severe and non-severe weather conditions when testing against the 2022 dataset. Operational deployment in 2023 has yielded an average Critical Success Index (CSI) of 24.3%, a Probability of Detection (POD) of 62.6%, and a False Alarm Ratio (FAR) of 71.2% for these convective events. It is noteworthy that the predicting performance for STHR was particularly effective with the highest POD and CSI, as well as the lowest FAR. CG and hail predictions had comparable CSI and FAR scores, although the POD for CG surpassed that for hail. The FCN model’s optimal performance for hail prediction occurred at the 4th, 8th, and 10th forecast hours, while for CG, the 6th hour was most accurate, and for STHR, the 2nd and 4th hours were most effective. These findings underscore the FCN model's ideal suitability for short-term forecasting of severe convective weather, presenting extensive prospects for the automation of meteorological operations in the future.
Keywords:
Severe convective weather classification
; FCN algorithm
; Short-term nowcasting
; Qinghai-Tibet Plateau
; Gansu
1. Introduction
This article reviews previous studies on hail weather classification and forecasting using radar products and the Random Forest algorithm, as well as severe convective weather classification recognized through the LightGBM algorithm (Liu et al., 2021). Models based on Random Forest and LightGBM have been established, leveraging a considerable amount of observational data from severe convective weather events and C-band radar products. These models have been validated and applied to rapidly and accurately identify and classify severe convective weather, demonstrating their practical applicability. Therefore, this paper further extends the scope of research by applying more advanced machine learning methods to forecast various types of severe convective weather, including hail, convective wind gusts (CG), and short-term heavy rain(STHR). Severe convective weather encompasses phenomena like lightning, hail with diameters of 5 mm or more, tornadoes of any intensity, convective wind gust (CG) of more than 17 m/s, and STHR exceeding 20 mm/h. These conditions pose a severe threat to life and property in most regions of the world (Zhou et al., 2019). Due to the rapid evolution of small-scale convective systems and their complex interactions with environmental characteristics, forecasting severe convective weather has become a challenging problem in operational meteorology today (Stensrud et al., 2009; Zheng et al., 2015). Gansu is located in the slope area of Qinghai-Tibet Plateau, and it is difficult to forecast severe convective weather due to its topography.
Given the meso- and micro-scale nature of severe convective systems, forecasts focus on monitoring and short-term nowcasting (Zhou et al., 2021). Sun et al. (2014) and Yu et al. (2020) have both provided clear and in-depth discussions on forecasting severe convective weather. In China, the forecasting service typically refers to the 0-2 hour range as nowcasting and 2-12 hours as short-term forecasting (Yu et al., 2012). Nowcasting primarily relies on empirical forecasting and the extrapolation of radar echoes and cloud images (Zheng et al., 2015; Guo et al., 2019; Yu and Zheng, 2020), while traditional short-term forecasting of severe convection mainly falls into two categories: pattern recognition (Miller, 1972; McNulty, 1995) and ingredient-based forecasting (Doswell et al., 1996; Moller, 2001). With the development of high-resolution numerical weather prediction models, the predictive capabilities of prognosticators have been challenged. . Forecasters should extract useful dynamic, moisture, energy, and topographical-related information that is conducive to severe convective weather from a huge amount of data to form a reliable forecast (Zhou et al., 2021). However, this approach has its limitations. For example, the significant climatic differences across regions make it difficult to accurately forecast severe convection in different areas using a unified threshold (Huang et al,2020;Qian et al., 2023; Wang et al., 2023; Tan et al., 2022; Mao et al., 2021). With the rapid development of numerical weather prediction and meteorological observation networks, the amount of available meteorological information has enormously proliferate, making it challenging for forecasters to detect and synthesize valuable data from the vast array.
In recent years, machine learning algorithms have been widely applied in meteorological detection and forecasting and then have achieved certain accomplishments (Zhu et al., 2021; Li et al., 2021; Han et al., 2021; Zhang et al., 2020; Tian et al. 2023). For instance, Chen et al. (2021) demonstrated that the hourly precipitation forecast corrected by the convolutional neural network significantly outperforms the frequency-matching method, and Zhou et al. (2021) established a short-term forecasting method for lightning strike areas using the LightningNet-NWP algorithm, which yielded better results than using multi-source observation data and high-resolution numerical model forecast data alone. Zang et al. (2023) proposed a deep learning model for nowcasting extreme precipitation events, integrating physical evolution laws and conditional learning methods into a neural network framework, which enhanced the forecasting ability for 0-3h extreme precipitation events. In general, deep neural networks have unmatched advantages in automatic high-level feature extraction and image classification (Yann et al., 2015; Maryam et al., 2015). Applying deep learning technology can effectively extract data features and improve classification accuracy (Zhang et al., 2019). With the development of deep learning, many neural network algorithms for semantic segmentation have been proposed, such as Fully Convolutional Network (FCN) (Shelhamer et al., 2015), Pyramid Scene Parsing Network (PSPNet) (Zhao et al., 2017), SegNet (Badrinarayanan et al., 2017), etc. Many scholars have introduced these algorithms into the meteorological field (Romero et al., 2016), such as the deep semantic segmentation model that extracts multi-source observation data sfrom satellites, radar, and lightning detectors Zhou et al. (2020). This model effectively achieves the integration of multi-source observation data, with good forecasting results for 0-1h lightning events. Li et al. (2023) established a satellite detection method for nighttime sea areas/low clouds over the Northwest Pacific based on the FCN-CRF algorithm, the performance of which surpassed the dual-channel interpolative method.
Classifying severe convection is essentially a semantic segmentation task. The exploration of how deep learning can effectively utilize multi-source observation data and high-resolution numerical model prediction data, thereby enhancing the accuracy of short-term forecasting for classified severe convection, particularly within the region of Gansu where severe convection samples are scarce. Furthermore, sample classes are imbalanced, which requires further elucidation through research findings. Therefore, based on the occurrence and development characteristics of severe convective systems, this study aims to establish a deep-learning semantic segmentation model suitable for Gansu by the utilization of multi-source observation data and high-resolution numerical model forecasts. The object of this paper is to extract effective convective forecast information to achieve more accurate short-term forecasting of classified severe convection, providing a reference for better utilizing these forecast products to enhance operational forecasting capabilities.
2. FCN Algorithm and Model Construction
Semantic segmentation is a technology that partitions a scene image into several meaningful image regions, and then assigns a class label to each pixel (Zhang et al., 2021). This technique can be applied to areas such as the classification of severe convective weather, transforming multi-source meteorological data into image product-like forms to capture meteorological characteristics of different severe convective weather events and the corresponding correlation analysis. In 2015, Long et al. first introduced the Fully Convolutional Network (FCN) (Shelhamer et al., 2015), which is capable of pixel-level semantic segmentation for images of any size. The advantages of the FCN model include accelerated training speed, reduced operational time, and enhanced classification accuracy (Maggiori et al., 2016), as illustrated in Figure 1. Below is a brief introduction to the main components of the FCN algorithm:
Convolutionalization: Traditional Convolutional Neural Networks (CNNs) typically use fully connected layers for classification at the end. The FCN, however, replaces this fully connected layer with a convolutional layer to enable direct pixel-level segmentation. Through five rounds of convolution and pooling, the image size is progressively reduced by factors of 2, 4, 8, 16, and 32, extracting the primary information and roughly determining the category of each region.
Upsampling: In the network process, multiple downsampling operations are conducted to reduce the size of the feature layer. To obtain a prediction layer that matches the size of the original image, a 32-fold upsampling operation is applied to the last layer. This ensures that the resolution of the prediction results matches that of the original image, similar to a deconvolution operation.
Skip Connections: Classification predictions are made using multi-layer information by interconnecting different levels of information. This maintains information from other layers while extracting the main information, which contributes to the enhancement of model performance.
The innovation of the FCN model lies in the utilization of traditional CNNs for pixel-level semantic segmentation tasks while implementing this goal through convolution alization, upsampling, and skip connections. These technical improvements not only enhance training speed and classification accuracy but also enable the model to process images of any size, which is of great significance in segmentation tasks. This technological advance is of vital importance for applications such as severe convective weather forecasting.
Model training typically includes five key steps (Figure 2): data collection, data processing, model training, cross-validation, and model evaluation. Data collection (Step 1) is a crucial step to ensure the model has sufficient information for training and prediction, involving the gathering of classified severe convective reality data (dependent variables), ground reality observations, and numerical model products during severe convective episodes (independent variables). Data processing (Step 2) involves selection and cleaning, i.e., removing samples with incomplete feature variables or containing outliers, to ensure data quality. It also includes normalizing sample data to ensure consistent scales between different features, aiding in the model's stable training. The model training step (Step 3) uses the processed dataset to establish and train the FCN model. Training typically involves multiple iterations where the model continuously tries to fit the data and adjusts weights and parameters through optimization algorithms. During cross-validation (Step 4), the ratio of model training samples to the cross-validation set is 8:2. The model is trained on the training samples and then evaluated on the validation set. This helps to verify if the model is overfitting or underfitting and provides guidance for hyperparameter tuning. Once the model is optimized, it will be assessed based on the cross-validation set and test set using common model evaluation algorithms (Step 5) to evaluate accuracy and generalization ability.
3. Data Used and Model Validation Methods
3.1. Introduction of Independent Variables for Modeling
Extensive research indicates that different categories of intense convection exhibit distinct environmental conditions and characteristic thresholds of physical quantities. (Zhang et al., 2020; Lü et al., 2020; Mo et al., 2020). Based on the characteristic features of categorized severe convective weather in Gansu Province, and the research by Huang et al. (2017), refined numerical forecast products from the European Centre for Medium-Range Weather Forecasts (ECMWF) were selected. These products provided input variables such as Convective Available Potential Energy (CAPE) and vorticity (PVORT), temperature (TMP), geopotential height (HGT), divergence (DIV), and horizontal wind fields (UV) at 700hPa, 500hPa, and 200hPa. Additionally, specific humidity (Q) at 700hPa and 500hPa, vertical wind (W), saturated specific humidity (SPFH), total precipitable water (PW), and 2m dew point temperature (DPT-2M) were included. In summary, 24 feature quantities are included in the analysis (Table 1).
Since ECMWF's numerical forecast products have a time resolution of 3 hours, with a horizontal resolution of 0.125°×0.125° for the surface layer (CAPE, DPT_2M, PW) and 0.25°×0.25° for the pressure layers. Temporal and spatial downscaling of the 24 feature quantities was necessary to align with the spatiotemporal resolution of the intelligent grid forecasting service. In the spatial domain, the technique of bilinear interpolation was employed, while in the temporal realm, the application of non-decreasing cubic spline interpolation (Liu et al., 2023) with a spatial resolution of 5 km, and a time resolution of 1 hour.
Prior to model input, standardization or normalization of the image data is required. The ECMWF feature quantities, which comprise various dimensions, are also under similar data preprocessing (Chen et al., 2021). Unlike images, the ECMWF feature quantities have clear upper and lower bounds, and their numerical spatial distribution and relative magnitudes are crucial for the model output. To preserve the spatial and interval information of the values, normalization was employed as follows(1):
where max and min represent the maximum and minimum values of the feature quantity data x, respectively.
3.2. Introduction of Dependent Variables and Samples for Modeling
Data belonging to STHR, hail, and CG—three types of severe convective weather in Gansu Province from 2017 to 2023—were collected and organized. STHR is defined as hourly rainfall exceeding 20 mm, hail is characterized by the presence of hailstones with a diameter equal to or exceeding 5 mm, and CG is determined in accordance with the prevailing operational standards proposed by the China Meteorological Administration. hourly accumulated lightning stroke data from the National Lightning Detection Network is accumulated onto a 0.5°×0.5° (multiples of 0.5° in latitude and longitude) grid using the nearest neighbor method, forming an hourly lightning count grid data, which is then interpolated to the station locations with the application of the nearest neighbor method. A station is considered to have encountered CG if the hourly cumulative number of lightning strokes is ≥1 and the hourly gust wind speed is ≥17m/s within an hour.
Based on the longitude and latitude of the weather stations where severe convective weather was recorded, along with the corresponding time of occurrence, data from the model products within 3 hours before and after the event were extracted as samples. For instance, if STHR is observed at a location from 18:00 to 22:00, the sample extraction time would be from 15:00 to 01:00 on the subsequent day. Meanwhile, the 18:00 to 22:00 period is selected as the severe convective weather sample, and the 15:00 to 17:00 and 23:00 to 01:00 periods are chosen as non-severe convective weather samples. Moreover, due to the infrequency of severe convective weather in Gansu Province, samples from days without severe convective weather were also collected to better establish the identification of non-severe convective weather, ensuring a sample ratio of approximately 10:1 between days characterized by non-severe and severe convective weather, respectively.
With the methods described above, a dataset of 26,747 severe convective weather samples and 269,746 non-severe convective weather samples for the years 2017—2023 was established. Given that the FCN model requires a large training set for modeling, 186,095 samples from 2017—2021 were used as the training set, with a training-to-cross-validation set ratio of 8:2. The 2022 samples served as an independent test set, comprising 4,093 severe convective weather samples and 51,024 non-severe convective weather samples. The 2023 samples were used as an independent validation set to verify the effectiveness in operational application, including 3,667 severe convective weather samples and 51,614 non-severe convective weather samples. To facilitate the recognition of machine language, this study set labels for four types: hail, CG, STHR, and no severe convection. Within the sample set, the configuration of labels are as follows: the designation of label 1 denoted the absence of severe convection, label 2 represented hail, label 3 represented CG, and label 4 represented to STHR. The distribution of training and validation period sets and label classification are shown in Table 2.
3.3. Model Validation Indicators
The validation indicators employed in this paper align with those utilized by Liu et al. (2021), including the rate of misjudgment, Probability of Detection (POD), Critical Success Index (CSI), and False Alarm Ratio (FAR), which facilitate the assessment of the identification and forecasting effectiveness of severe convective weather. The formulas are as follows (2)-(5):
The criteria employed for determining accurate or erroneous identification, as applied in this manuscript, are consistent with the established practices observed in forecasting operations. Specifically, it involves the validation of model forecast outcomes through point-to-point comparison with the ground-level observations during the period of severe convective weather, within a spatial range of 40 kilometers in radius. For example, if STHR weather occurs at a specific location from 18:00 to 20:00 on a given day, the FCN model is used to identify the forecasts for all times within the duration, encompassing a spatial radius of 40 kilometers around the station. If the model identifies the weather as STHR, such identification shall be labelled as an accurate prediction and counted as a hit; if it identifies the weather as another type of severe convection or no severe convection, it shall be regarded as a misjudgment.
4. Results Analysis
4.1. Training Set Effectiveness Evaluation
Using the 2017—2021 severe convective weather observational data as the training set, the FCN model was trained and cross-validated. The evaluation of the training set, as presented in Table 3, scrutinized the rates of misjudgment for three types of severe convective weather: hail, CG, and STHR. STHR exhibited the lowest misjudgment rate, which is only 21.8%. The model mainly misclassifies STHR as CG. Conversely, hail showed the highest misjudgment rate, reaching 33.2%, which is primarily due to the misclassification of hail as CG. As for CG, the misjudgment rate settled at 24.9%, with the primary misclassifications including STHR and non-severe convection. The misjudgment rate for non-severe convective weather was relatively low at 15.7%. By aggregating the total misjudgments across all categories and dividing it by the total number of training set samples, the overall misjudgment rate for the FCN model for severe convective weather is only 16.6%. Considering these metrics, the FCN model demonstrates high accuracy in categorizing severe convective weather.
Figure 3 displays the cross-validation scores for the model during the training period. CSI, POD, and FAR were used to evaluate the three types of severe convective weather: hail, CG, and STHR. STHR performed best, with CSI and POD reaching 51.9% and 78.2%, respectively. In comparison, hail and CG had similar CSI scores but were notably lower than STHR. The POD for CG was slightly lower than for STHR but significantly higher than for hail, which is 66.8%. STHR exhibited the lowest FAR score, the value of which is 39.4%Hail and CG had similar FAR values. The model's average CSI was 33.3%, accompanied by an average POD of 73.4% and an average FAR of 62.1%. These results indicate that after sufficient training, the FCN model is capable of classifying severe convective weather with high accuracy and efficiency.
4.2. Independent Test Set Effectiveness Evaluation
The FCN model, constructed based on the 2017-2021 training set, was applied to an independent 2022 dataset containing 55,117 samples. The results of the independent sample assessment, as shown in Table 4 and Figure 4, revealed misjudgment rates of 48.2%, 29.0%, and 27.2% for hail, CG, and STHR, respectively. In contrast, the misjudgment rate for non-severe convective weather was the lowest at 14.5%. Considering all categories, the overall misjudgment rate was 18.6%. Similar to the cross-validation results during the training period, hail was primarily misclassified as CG, and STHR was mainly misclassified as CG and non-severe convection. Although the test set performance was slightly lower than the training set, the average CSI still reached 25.8%, with an average POD of 65.2%, and an average FAR of 70.0%. Similar to the cross-validation set during the training period, the CSI and POD for STHR proved to be superior, accompanied by the lowest FAR. CSI and FAR scores for CG and hail were similar and significantly lower than for STHR. Moreover, the POD for CG close approached to the POD of STHR, while hail exhibited the lowest POD at 51.8%, consistent with the training set results. These results suggest that although there was a slight decline on the independent test set, the model still demonstrated notable accuracy and stability in classifying severe convective weather.
4.3. Independent Validation Set Effectiveness Evaluation
The well-trained FCN model was implemented in operational service and evaluated on 55,281 independent samples from 2023. The results of the evaluation conducted on the business application, as depicted in Table 5 and Figure 5, revealed misjudgment rates of 46.7%, 34.0%, and 31.5% for hail, CG, and STHR, respectively. Notably, the misjudgment rate for non-severe convective weather is lower than 13.3%, and the overall misjudgment rate was 18.3%.
Similar to the training and test set results, hail was primarily misclassified as CG, and STHR mainly as CG and non-severe convection. Although the performance of the independent validation set was slightly lower than the training period cross-validation set and test set, the gap was not significant. The model's average CSI was 24.3%, with an average POD maintained at 62.6%, and an average FAR of 71.2%. In accordance with previous findings, CSI and POD for STHR were the best, while the CSI and FAR for CG and hail exhibited resemblances and were notably lower than that of STHR. Furthermore, the POD for CG was close to that for STHR, surpassing hail by 10%, which aligns with the training period cross-validation set and test set results. These outcomes indicate that, despite a slight decrease in performance during operational implementation, the model still maintains a certain level of accuracy and stability in classifying severe convective weather, thereby supporting its suitability for operational application.
Across the entire training period cross-validation set, test set, and independent validation set (Figure 6), the FCN model's average CSI scores were: hail at 17.6%, CG at 20.3%, and STHR at the highest with 45.5%. In terms of average POD, hail was the lowest at 57.3%, while CG and STHR both exceeded 70%. As for the average FAR, hail and CG exhibited similarities, both of which are higher than 77%, while the average FAR for STHR was the lowest at 45.5%. These outcomes, in comparison with previous CNN-based models for severe convective weather forecasting (Zhou et al., 2019), demonstrate that the FCN model exhibits superior performance in terms of CSI and POD for hail, CG, and STHR, and also excelling in FAR. Overall, the FCN model-based classification of severe convective weather shows promising accuracy and has wide-ranging prospects for automated identification and early warning applications of severe convective weather.
4.4. Hourly Effectiveness Analysis
To explore the efficacy of the FCN model in classifying forecasts, an evaluation of hourly results was conducted. In order to visually illustrate the variations among the three categories of severe convective weather across different validation indicators for each hour, anomalies in the validation results were graphed (Figure 7). Specifically, the score of each indicator for each type of severe convective weather at each hour in different sample sets was calculated by subtracting the score of that indicator for the entire sample set (as shown in Figure 6). For instance, the anomaly for the hail CSI at the first hour in the cross-validation set (7.1%) is the hail CSI score in the cross-validation set (24.7%) minus the average hail CSI score for the entire sample set (17.6%).
Based on the CSI depicted in Figure 7, it is evident that, except for the second and eleventh hours in the cross-validation set, hail consistently scored above the average by more than 4.0%, reaching its peak anomaly of over 10.0% in the eighth hour. For the test set, apart from the fourth hour, the score of most hours is lower than the average value, especially the first, sixth, and eleventh hours, which showed a deviation of more than 4.0% below the average. Within the independent validation set, the third hour exhibited the most exemplary performance, the value of score is 0.5%, whereas the second hour was the poorest, the deviation of which is -8.0%. Additionally, the first, fifth, seventh, and twelfth hours also scored more than 4.0% below average.
For CG in the cross-validation set, the eleventh hour obtained the lowest score, and the tenth hour achieved the highest score. Furthermore, the first, second, fourth, fifth, sixth, ninth, and tenth hours were all significantly higher than the average value by more than 5.0%. In the test set, the sixth hour emerged as the best outstanding performer with the highest score, while the fifth hour was the worst. Similar to hail, most hours scored below average, which shares a similar deviation as observed in the hail results.
In the independent validation set, the performance of the first and second hours is higher than the average, which is slightly better than the test set in terms of hourly count. However, the overall classification performance is lower than the test set results, particularly with a noticeable drop after the sixth hour. For STHR, the cross-validation set demonstrated a remarkable performance above average, particularly during the second, third, fourth, sixth, seventh, tenth, and eleventh hours, where scores exceeded the average by more than 5.0%. The eleventh hour stood out as the best performance period of time, while the first hour ranked as the worst time period with a deviation of 3.6% above the average. Within the test set, apart from the first hour, the remaining time intervals exhibited a tendency of scoring below the average. Especially the seventh and twelfth hours, all of which are particularly lower than the average. However, the overall performance of classification on STHR was still slightly better than hail and CG. In the independent validation set, the score of all time periods are lower than average, particularly the first, sixth, eighth, and tenth hours, which exhibited the most substantial deviations below the average.
From the POD results, hail in the cross-validation set was significantly higher than average, especially in the first, fourth, fifth, eighth, ninth, and tenth hours, which were more than 10.0% above. Relative to the cross-validation set results, the score of test set is noticeably lower, particularly in the first, fifth, sixth, and eleventh hours, which were around 10.0% below the score of the cross-validation set. In the independent validation set, the fifth, seventh, and twelfth hours scored more than 5.0% below average, while the third, fourth, eighth, and tenth hours exceeded average scores, with the eighth hour being the highest at 3.4%. CG in the cross-validation set had a different pattern from hail, scoring below average in the third and seventh hours. The tenth hour performed the best, but not exceeding 10.0%. In the test set, apart from the first, fourth, fifth, eleventh, and twelfth hours, scores of the aforementioned time period are below the average value. The remaining seven hours were above average. The highest score corresponds to the sixth hour, which is 5.0%. In the independent validation set, only the second hour was close to average, while the score of all remaining hours was lower than the average value. In particular, scores corresponding to the fourth hour and seventh to twelfth hours are much lower than the average, with the twelfth hour being the lowest at -9.2%. Similar to CG, the seventh hour score of STHR in the cross-validation set is only slightly lower than that -0.9%, while the score of all other hours is higher than the average. The maximum score is corresponding to the eleventh hour. In the test set, only the third, seventh, eleventh, and twelfth hours scored beneath average, whereas scores of all other times are above average. The independent validation set scored below average across all times, particularly during the second, sixth, eighth, tenth, and twelfth hours, which exhibited pronounced deviations below the average.
From the FAR results, it was found that for hail, most hours in the cross-validation set scored below the average, particularly at the first, fourth, fifth, eleventh, ninth, and tenth hours, which were more than 10.0% below the average score. In the test set, the second, third, fourth, eighth, and tenth hours also scored below the average, while the remaining hours were above. In the independent validation set, only the third, fourth, and sixth hours were below average, while the fifth hour was notably 11.2% higher than the average.
For CG, the third and twelfth hours were above average in the cross-validation set. In the test set, the first, fourth, and eleventh hours were particularly higher than the others, with the second hour being the lowest at -4.5%. In the independent validation set, apart from the third, fifth, and sixth hours, the remaining hours exhibited a notable elevation in the performance, particularly the second and twelfth hours, which are significantly higher than other time periods.
As for STHR, all hours except the eighth, ninth, and twelfth were below the average in the cross-validation set. Especially fourth, sixth, and eleventh hours, all of which are over 10.0% below. In the test set, the first, second, fourth, fifth, ninth, and tenth hours were lower than average, while the others were higher.
Within the independent validation set, it is revealed that scores corresponding to the fourth, fifth, seventh, and eleventh hours are lower than the average, while scores of the remaining temporal intervals are much higher. The ninth hour, in particular, reached the maximum with a value of 9.9%.
In summary, the hourly analysis revealed that the POD and FAR for hail were lower in the test set than in the independent validation set. Upon reviewing the hail weather processes, it was found that the main reason lay in the diminished frequency of hail events throughout 2023. However, it was observed that each event was accompanied by a multitude of occurrences. For CG and STHR, the independent validation set had a lower POD and higher FAR value as compared to the test set. This disparity is primarily due to the recurrent CG events characterized by a reduced number of incidents per event throughout 2023. Additionally, there was an overall decrease in the occurrences of STHR within the Gansu province, with fewer instances per event in comparison to an average year.
Considering the CSI, POD, and FAR indices together across the hourly cross-validation set, test set, and independent validation set, it is apparent that the FCN model has a superior performance in relation to hail occurrences during the fourth, eighth, and tenth hours. This was closely followed by the performance during the third and ninth hours, while the least favorable outcomes were observed during the fifth, eleventh, and twelfth hours. In comparison, CG had the best performance at the sixth hour, followed by the first, second, and fifth hours, and the worst at eleventh and twelfth hours. STHR scored best at the second and fourth hours, followed by the third, fifth, sixth, tenth, and eleventh hours, with the worst performance at eighth and twelfth hours.
This comprehensive hourly analysis suggests that the FCN model, despite exhibiting variations in its performance across diverse categories of severe weather and different time intervals, still holds a considerable potential for accurately classifying severe convective weather events. Notably, it demonstrates a good performance during specific hours, which may offer valuable insights for targeted improvements in forecasting practices.
5. Conclusions and Discussions
This paper constructed an FCN model using ECMWF numerical model data, with the aim of evaluating its efficacy in predicting severe convective weather phenomena. The following main conclusions were drawn:
- (1)
- Within the 2017-2021 training set, the FCN model attained an overall misjudgment rate of 16.6% for severe convective weather. Specifically, the lowest misjudgment rate was for STHR at 21.8%, while the highest was for hail at 33.2%, and the misjudgment rate for non-severe convective weather was 15.7%. In terms of scoring, the FCN model's average CSI for the three types of severe convective weather was 33.3%, with an average POD of 73.4% and an average FAR of 62.1%. Among these, STHR had the highest POD and CSI, accompanied by the lowest FAR values. On the other hand, CG and hail had similar CSI and FAR scores, but CG had a higher POD than hail.
- (2)
- The FCN model was tested using ground observation data of severe convective weather from 2022, indicating an overall misjudgment rate of 18.6% for the three types of severe convective weather as well as non-severe convective weather. The misjudgment rates for hail, CG, and STHR were 48.2%, 29.0%, and 27.2%, respectively. The misjudgment rate is 14.5% for non-severe convective weather. The scores obtained from the test set were lower than those in the training set, with an average CSI of 25.8%, an average POD of 65.2%, and an average FAR of 70.0%. Nevertheless, STHR still showed the best in terms of forecast performance.
- (3)
- After operationalizing the FCN model, independent validation using ground observation data of severe convective weather from 2023 demonstrated an overall misjudgment rate of 18.3%. The misjudgment rates for hail, CG, and STHR were 46.7%, 34.0%, and 31.5%, respectively, with a rate of 13.3% for non-severe convective weather. The average CSI was 24.3%, the average POD remained at 62.6%, and the average FAR was 71.2%, with STHR continuing to have the best forecast performance. The performance of the independent validation set was slightly lower than the training period cross-validation set and the test set, , indicating that despite a slight performance decline in operational implementation, the model still demonstrates a degree of accuracy and stability in classifying severe convective weather.
- (4)
- The hourly analysis illustrated that the fluctuations in the CSI, POD, and FAR metrics across different time intervals. In a comprehensive assessment, it was found that the FCN model exhibited optimal performance in hail classification analysis during the fourth, eighth, and tenth hours. As for CG, its peak performance was observed at the sixth hour, whereas STHR demonstrated the best accurate performance during the second and fourth hours., Conversely, the least favorable performance was witnessed across all three categories of severe convective weather at the twelfth hour. Across the entire 2017-2023 sample, hail had a CSI of 17.6%, CG of 20.3%, and STHR of 45.5%. The best POD for STHR was 73.2%, followed by CG, with hail being the lowest at 57.3%. The FAR for hail and CG was comparable, with STHR having the lowest score, which was 45.5%. Thus, the FCN can be treated as a reliable short-term forecasting model, which can provide an accurate classification forecast for severe convective weather
The FCN model constructed using ECMWF numerical model data and ground observation data can rapidly and automatically forecast severe convective weather with considerable accuracy, significantly enhancing the level of short-term forecasting for severe convective weather. Moreover, the FCN algorithm can integrate radar echo extrapolation products and satellite data to improve the prediction accuracy of severe convective weather forecasts within the 0-2 hour time period, which will be one of the focal points in the future. However, the FCN algorithm constructed in this paper refrained from categorizing the intricate circulation patterns of various severe convective weathers, which is another focus for improving the algorithm later.
Although there has been extensive research based on the classification and recognition of single types of severe convective weather, it is crucial to acknowledge that multiple types often occur simultaneously or in different regions. Consequently, the limitations of systems and technologies that can only discern a singular type of severe convective weather become evident, as they fail to adequately address this requirement. Therefore, through the utilization of the FCN model, this paper has successfully attained automated classification forecasting for the three main types of transient severe weather with commendable outcomes., which is a major innovation of this study with broad application prospects in future short-term severe weather forecasting. Another contribution of this paper lies in the recognition that although a series of severe convective weather observation samples have been observed and recorded in China's central and western regions, these valuable data have not been fully utilized in conjunction with artificial intelligence technology in actual operational work. This paper can be treated as a benchmark on how to explore the application value of these data. Additionally, the advanced FCN algorithm is employed in this paper, thereby broadening the horizons of artificial intelligence's application in meteorological operations. This work, in turn, could also bring a significant contribution to the automation of meteorological services.
References
- Liu Xinwei, Jiang Yingsha, Huang Wubin, et al, 2021. Classified Identification and Nowcast of Hail Weather Based on Radar Products and Random Forest Algorithm[J]. Plateau Meteorology, 40(4):898-908. [CrossRef]
- Liu Xinwei, Huang Wubin, Jiang Yingsha, et al, 2021. Study of the Classified Identification of the Strong Convective Weathers Based on the LightGBM Algorithm[J]. Plateau Meteorology, 40(4):909-918. [CrossRef]
- Zhou Kanghui, Zheng Yongguang, Li Bo, et al., 2019. Forecasting Different Types of Convective Weather: A Deep Learning Approach[J]. J. Meteor. Res., 33(5), 797–809. [CrossRef]
- Stensrud David J., Xue Ming, Wicker Louis J. , et al., 2009. Convective-Scale Warn-on-Forecast System: A Vision for 2020[J]. Bull. Amer.Meteor. Soc., 90, 1487–1500. [CrossRef]
- Zheng Yongguang, Zhou Kanghu, Sheng Jie, et al., 2015.Advanc es in Techniques of Monitoring, Forecasting and Warning of Severe Convective Weather[J].Journal Of Applied Meteorological Science, 26(6):641-657. 2015. [CrossRef]
- Zhou Kanghui, Zheng Yongguang, Han Lei, et al, 2021.Advances in Application of Machine Learning to Severe Convective Weather Monitoring and Forecasting[J]. Meteor Mon,47(3) :274-289(in Chinese). [CrossRef]
- Sun Jisong, Dai Jianhua, He Lifeng, et al. 2014. Fundamental Principles and Technical Methods for Severe Convective Weather Forecasting: Manual for Severe Convective Weather Forecasting in China [M]. Beijing: China Meteorological Press, p. 282.
- Yu Xiaoding, Wang Xiuming, Li Wanli, et al. 2020. Thunderstorm and Severe Convective Nowcasting [M]. Beijing: China Meteorological Press, p. 416.
- Yu Xiaoding, Zhou Xiaogang, Wang Xiuming.2012.The Advances in the Nowcasting Techniques on Thunderstorms and Severe Convection[J]. Acta Meteorologica Sinica, 70(3):311-337.
- Guo Hanyang, Chen Mingxuan, Han Lei, et al, 2019.High Resolution Nowcasting Experiment of Severe Convections Based on Deep Learning[J]. Acta Meteorologica Sinica, 77(4):715-727. [CrossRef]
- Yu Xiaoding, Zheng Yongguang. 2020. Advances in Severe Convective Weather Research and Operational Service in China[J]. Acta Meteorologica Sinica, 78(3):391-418. [CrossRef]
- Miller Robert C.. 1972. Notes on Analysis and Severe Storm Forecasting Procedures of the Air Force Global Weather Central. Technical Report 200(Rev)[M]. Omaha: Air Weather Service, 181pp.
- Mcnulty Richard P.. 1995. Severe and Convective Weather:A Central Region Forecasting Challenge[J]. Wea Forecasting, 10(2):187-202. [CrossRef]
- Doswell Charles A., Brooks H E, Maddox R A. 1996. Flash Flood Forecasting:An Ingredients-Based Methodology[J]. Wea Forecasting, 11(4):560-581. [CrossRef]
- Moller Alan R.. 2001. Severe local storms forecasting//Doswell III C A. Severe Convective Storms[J]. Boston, MA:American Meteorological Society, 433-480. [CrossRef]
- Huang Wubin, Zhao Yang, Sun Chan, et al, 2020.Climate modulation of summer rainstorm activity in eastern China based on the Tibetan Plateau spring heating[J].Arabian Journal of Geosciences, 13(3). 1007. [CrossRef]
- Qian Zhuolei, Lou Xiaofen, Shen Xiaoling, et al, 2023.Research on Classified Severe Convection Weather Forecastin Zhejiang Province Based on Extreme Forecast Index of Ensemble Prediction[J].Meteorological Science and Technology, 51(04):582-594. [CrossRef]
- Wang Guo’an, Qiao Chungui, Zhang Yiping, et al, 2023.Statistical Characteristics of Thunderstorm Gale and Hail Severe Convection in Henan Under the Background of Cold Vortex[J].Meteorological and Environmental Sciences, 46(4): 27–37. [CrossRef]
- Tan Dan, Huang Yuxia, Sha Hong'e.Characteristic Analysis of Severe Convective Weather in Gansu Province[J].Journal of Natural Disasters, 31(02):222-232. [CrossRef]
- Mao Chengyan, Zheng Qian, Gong Liqing, et al, 2021. Diagnosis and Forecast Method of Severe Convection Under Different Synoptic Situations in the West-Central of Zhejiang[J].Journal of the Meteorological Sciences, 41(5): 687–695. [CrossRef]
- Zhu Yan, Zhai Danhua, Wu Zhipeng, et al, 2021.A Methodof Short-Duration Heavy Rain Forecast Based on Xgboost Algorithm[J].Meteorological Science And Technology, 49(3):406-418. [CrossRef]
- Li Boyong, Hu Zhiqun, Zheng Jiafeng,et al, 2021. Using Bayesian Method to Improve Hail Identification in South CHINA[J]. Journal of Tropical Metrorology, 37(1): 112-125. [CrossRef]
- Han Feng, Yang Lu, Zhou Chuxuan, et al, 2021.An Experimental Study of the Short- time Heavy Rainfall Event Forecast Based on Ensemble Learning and Sounding Data[J].Journal of Applied Meteorological Science, 32(2):188-199, 2021. [CrossRef]
- Zhang Hualong, Wu Zhifang, Xiao Liusi, et al, 2020. A Probabilistic Forecast Model of Short-time Heavy Rainfall in Guangdong Province Based on Factor Analysis and its operational experiments[J]. Acta Meteorologica Sinica, 79(1):15-30. [CrossRef]
- Yuan Tian, Yang Zhao, Seok-Woo Son, Jing-Jia Luo, Seok-Geun Oh, Yinjun Wang, 2023:A Deep-Learning Ensemble Method to Detect Atmospheric Rivers and Its Application to Projected Changes in Precipitation Regime. [CrossRef]
- Chen Jinpeng, Feng Yerong, Meng Weiguang, et al, 2021.Acorrection Method of Hourly Precipitation Forecast Based on Convolutional Neural Network[J] .Meteor Mon, 47(1):60-70. [CrossRef]
- Zhou Kanghui, Zheng Yongguang, Wang Tingbo. 2021. Very Short-range Lightning Forecasting With NWP and Observation Data: A Deep Learning Approach[J]. Acta Meteorologica Sinica, 79(1):1-14. [CrossRef]
- Zhang Yuchen, Long Mingsheng, Chen Kaiyuan, et al.2023.Skilful Nowcasting of Extreme Precipitation With NowcastNet[J]. Nature, 619(7970):1-7. [CrossRef]
- Yann LeCun , Bengio Yoshua, Hinton Geoffrey. 2015.Deep learning[J]. nature 521(7553): 436-444. [CrossRef]
- Maryam M Najafabadi, Flavio Villanustre, Taghi M Khoshgoftaar, et al. 2015. Deep Learning Applications and Challenges in Big Data Analytics[J]. Journal of Big Data, 2(1): 1-21. [CrossRef]
- ZhangXiaodong, Wang Tong, Chen Guanzhou, et al.2019. Convective Clouds Extraction From Himawari–8 Satellite Images Based on Double-stream Fully Convolutional Networks[J]. IEEE Geoscience and Remote Sensing Letters, 17(4): 553-557. [CrossRef]
- Shelhamer Evan, J.Long, T.Darrell. 2015. Fully Convolutional Networksfor Semantic Segmentation[C]J//Proceedings of the /IEEE Conference on Computer Vision and Pattern Recognition. 3431-3440. [CrossRef]
- Zhao Hengshuang, Shi Jianping, Qi Xiaojuan, et al.2017.Pyramid scene Parsing Network[C]V/Proceedings of the lEEE conference on computervision and pattern recognition.2881-2890. [CrossRef]
- Badrinarayanan Vijay, A. Kendall, R. Cipolla. 2017. Segnet: A Deep Convolutional Encoder-decoder Architecture for Image Segmentation[J]. IEEE Transactions on Pattern Analysis and Machine Intelligence, 39(12): 2481-2495. [CrossRef]
- Romero Adriana, C. Gatta, G. Camps-Vall. 2016 .Unsupervised Deep Feature Extraction for Remote Sensing Image Classification[J].IEEE Transactions on Geoscience and Remote Sensing, 54(3), 1349–1362. [CrossRef]
- Zhou Kanghui, Zheng Yongguang, Dong Wansheng, et al. 2020. A Deep Learning Network for Cloud-to-Ground Lightning Nowcasting with Multisource Data [J]. J Atmos Oceanic Technol, 37(5):927-942. [CrossRef]
- Li Mengya, Shi Xiaomeng, Wu Xiaojing, et al.2023.Detection of Nighttime Sea Fog / Low Stratus Over Western North Pacific Based on Geostationary Satellite Data Using Convolutional Neural Networks[ J]. Journal of Marine Meteorology, 43( 1):1⁃11. (in Chinese). [CrossRef]
- Zhang Xin, Yao Qing’an, Zhao Jian, et al.2020.Image Semantic Segmentation Based on Fully Convolutional Neural Network[J] .Computer Engineering and Applications, 58(08):45-57. [CrossRef]
- Maggiori E, Tarabalka Y, Charpiat G, et al. 2016. Fully Convolutional Neural Networks for Remote Sensing Image Classification[C]//2016 IEEE International Geoscience and Remote Sensing Symposium (IGARSS). IEEE, 5071-5074. [CrossRef]
- Zhang Hualong, Wu Zhifang, Xiao Liusi, et al.2021.A Probabilistic Forecast Model of Short-time Heavy Rainfall in Guangdong Province Based on Factor Analysis and its Operational Experiments[J].Acta Meteorologica Sinica, 79(1):15-30. [CrossRef]
- Lü Xiaona, Niu Shuzhen, Zhang Yiping, et al.2020.Research on Objective Forecast Method of Thunderstorm Potential Based on Probability and Weight [J].Torrential Rain and Disasters, 39(1):20-29. [CrossRef]
- Mo Lixia, Gao Xianquan, Ou Huining, et al., 2020. Study of Objective Forecast Method of Guangxi Hail Based on Numerical Model Product[J]. Journal of Arid Meteorology, 38(3):480-489. [CrossRef]
- Huang Yuxia, Wang Baojian, Wang Yong, et al. 2017. Mesoscale Analysis Operational Technical Specifications for Severe Convective Weather in Gansu Province [M]. Beijing: China Meteorological Press, pp. 20-47.
- Liu Na, Wang Yong, Duan Bolong, et al., 2023. The Objective Forecast of Hourly Gird Temperature Based on LPSC Algorithm and its’ Evaluation[J]. Transactions of Atmospheric Sciences, 1-12.
Figure 1.
Model structure diagram of FCN model.
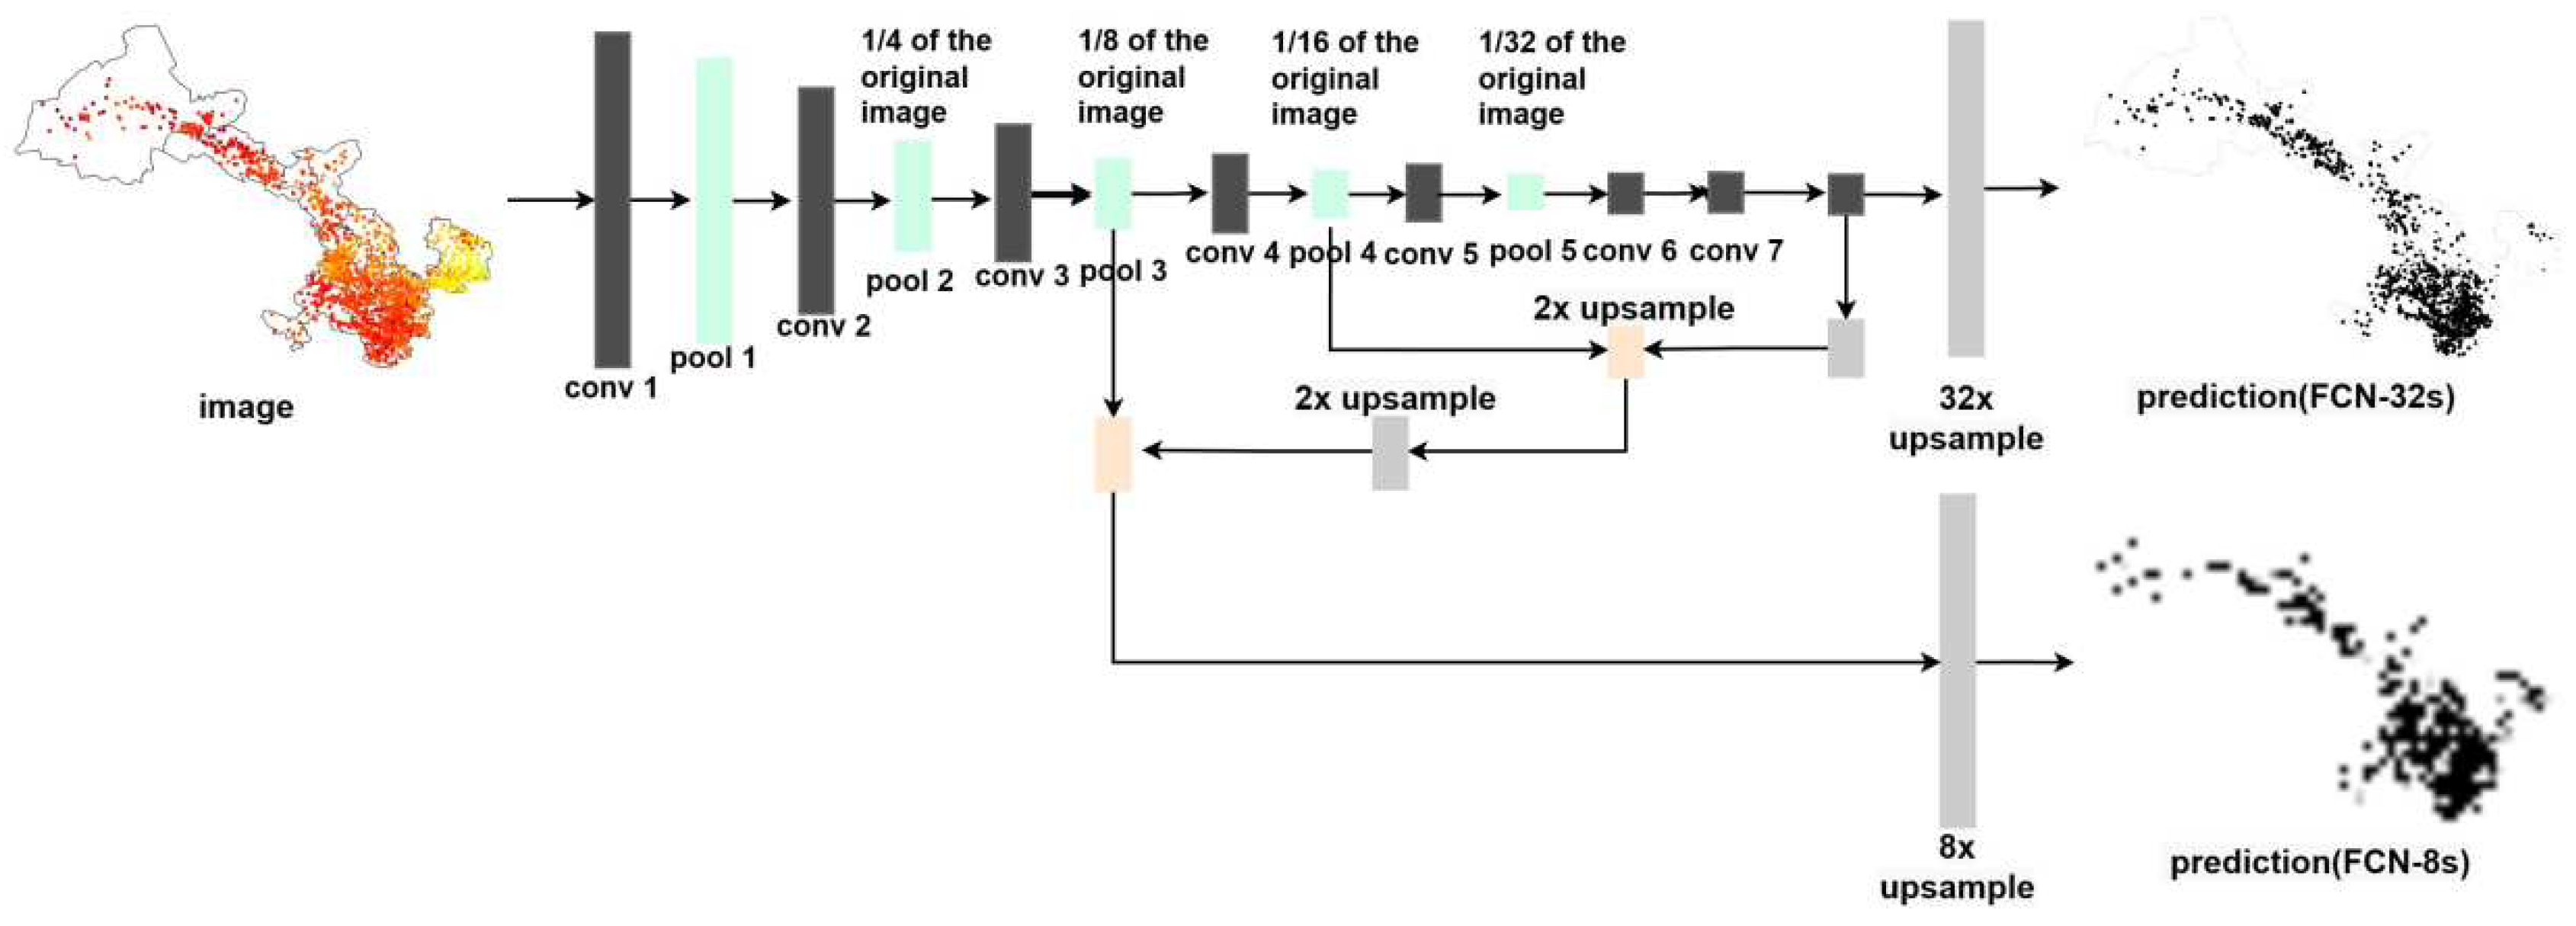
Figure 2.
Flow chart of severe convection algorithm of FCN model.
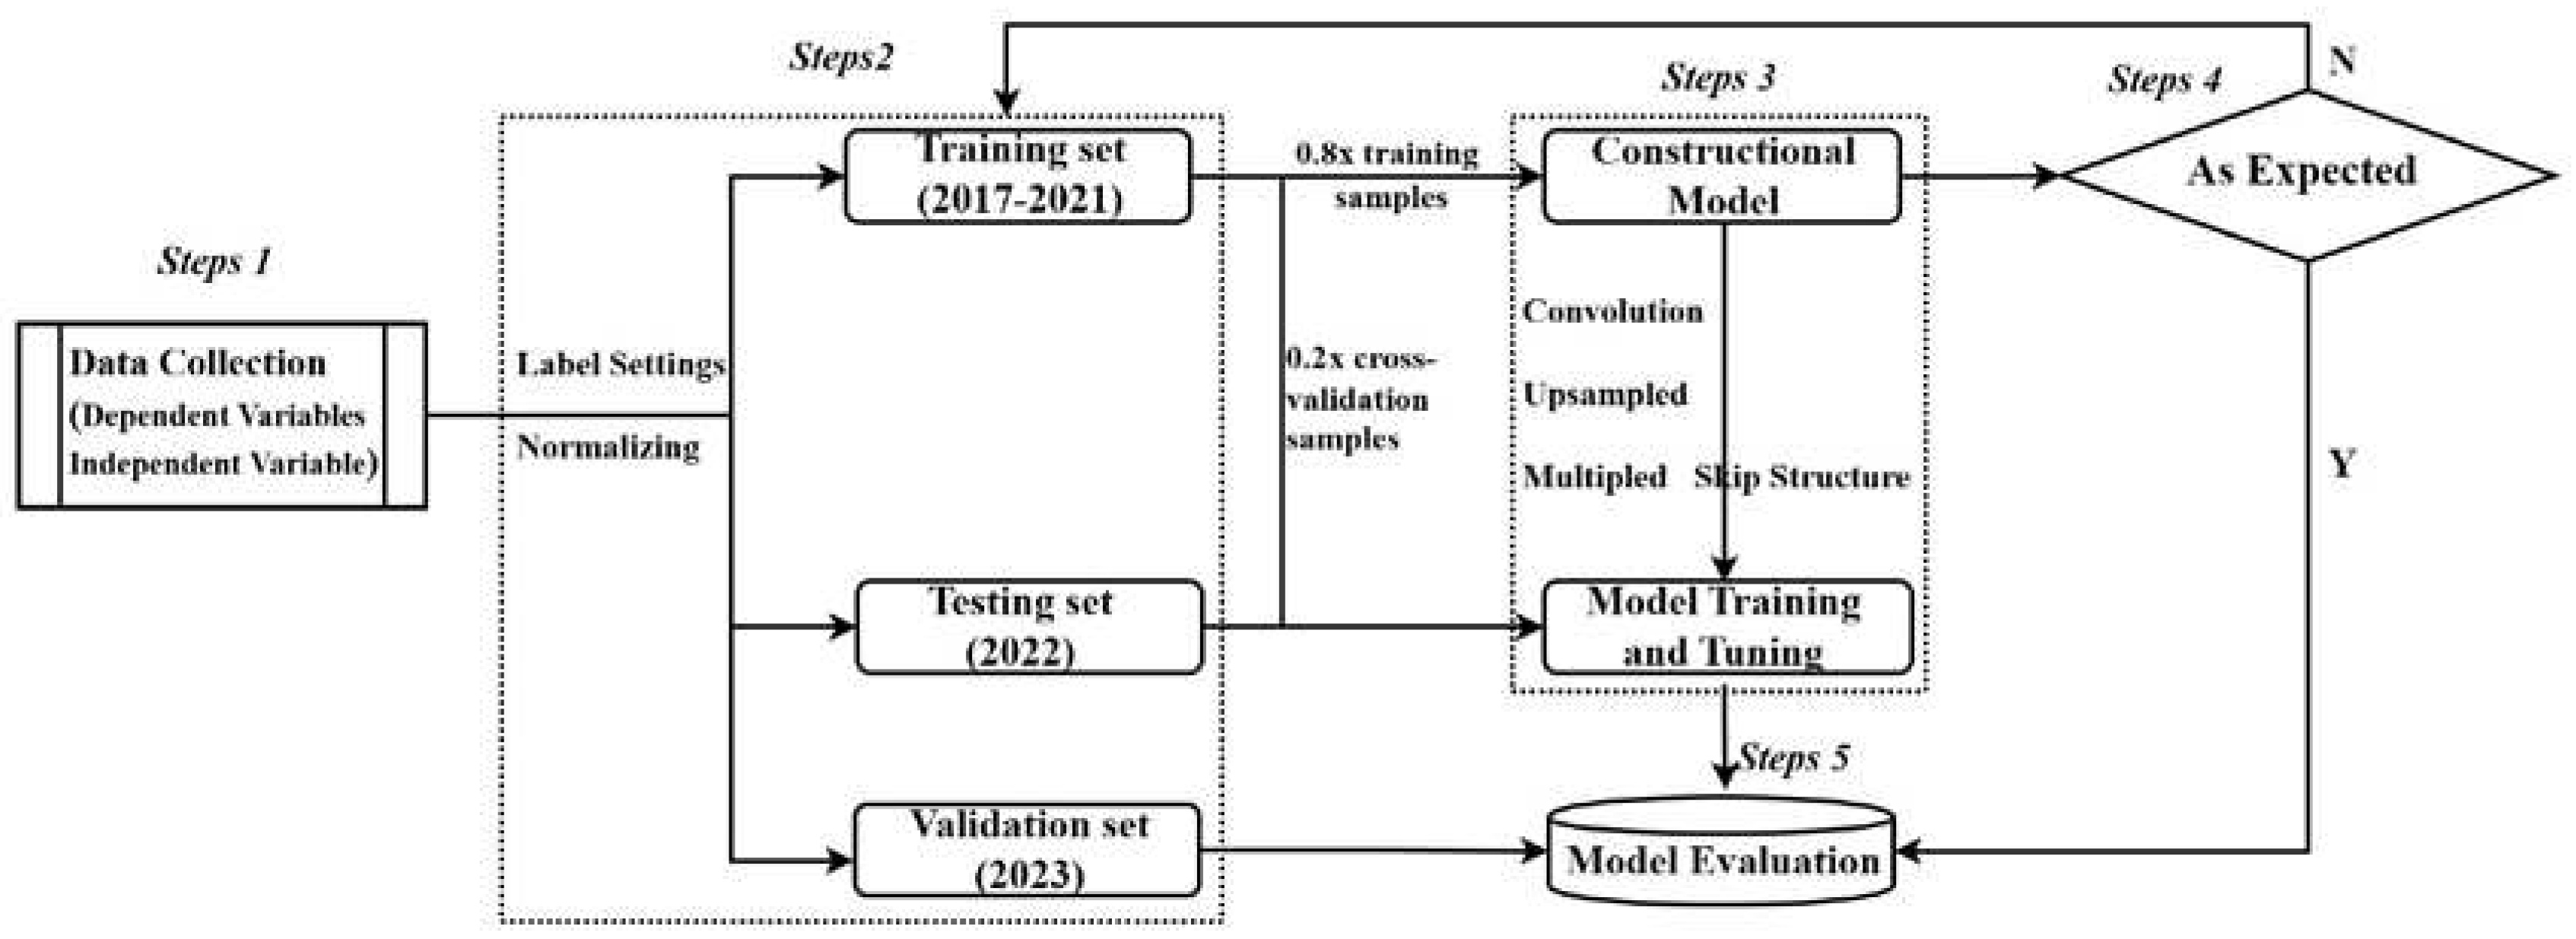
Figure 3.
Classification forecast results score of FCN model in training period cross-validation set.
Figure 3.
Classification forecast results score of FCN model in training period cross-validation set.
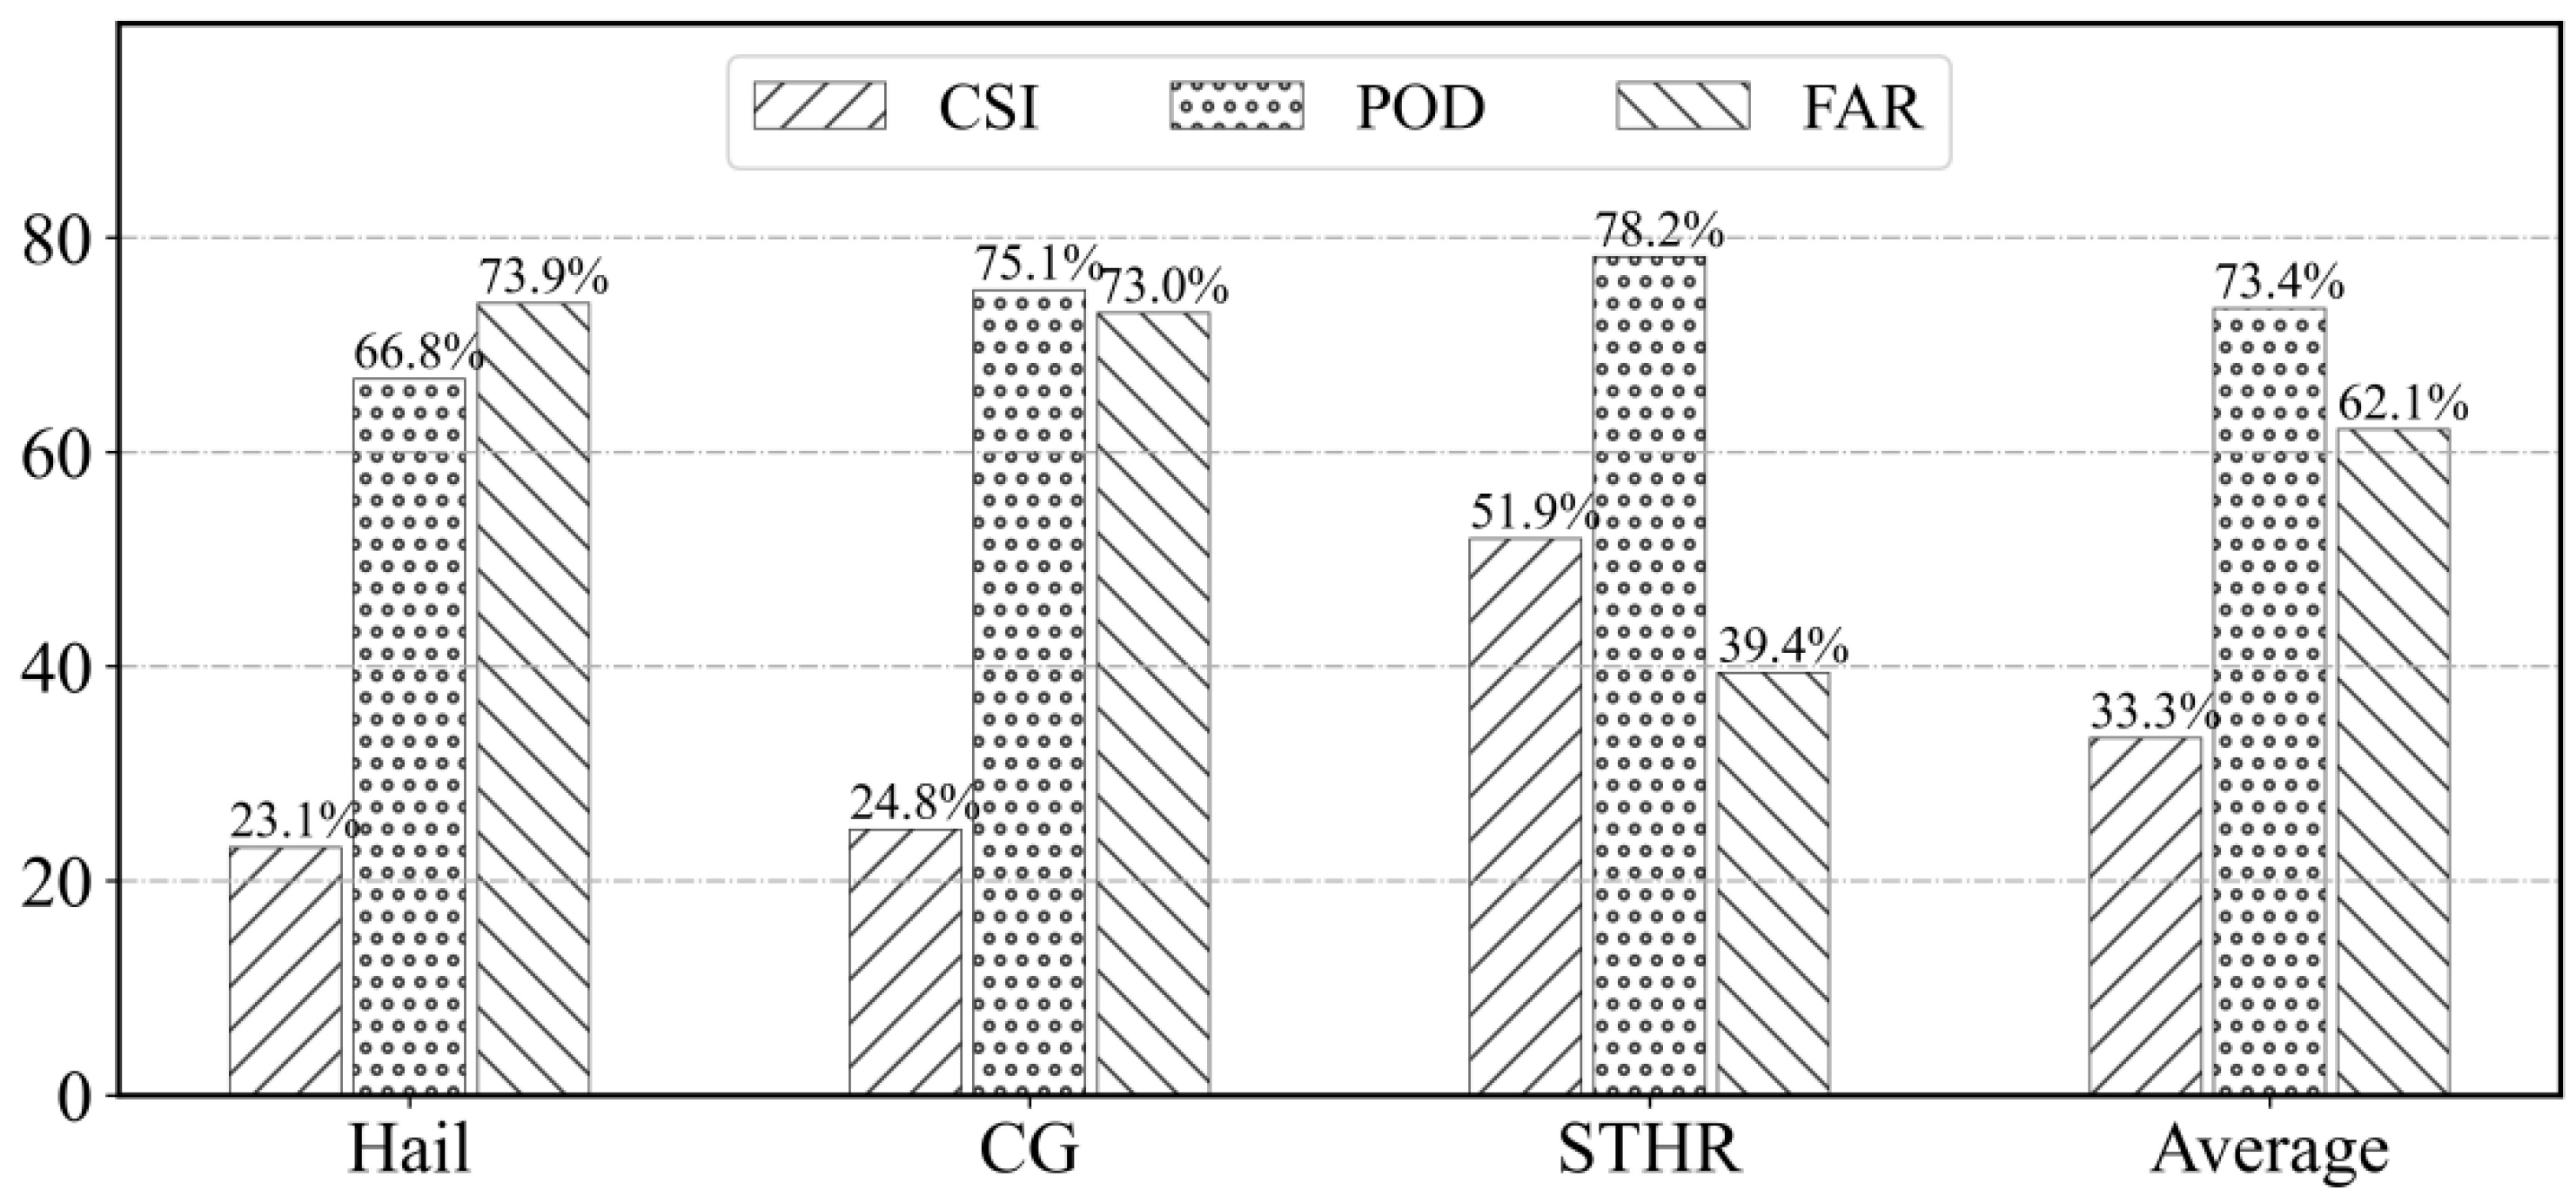
Figure 4.
Classification forecast results score of FCN model in independent test set.
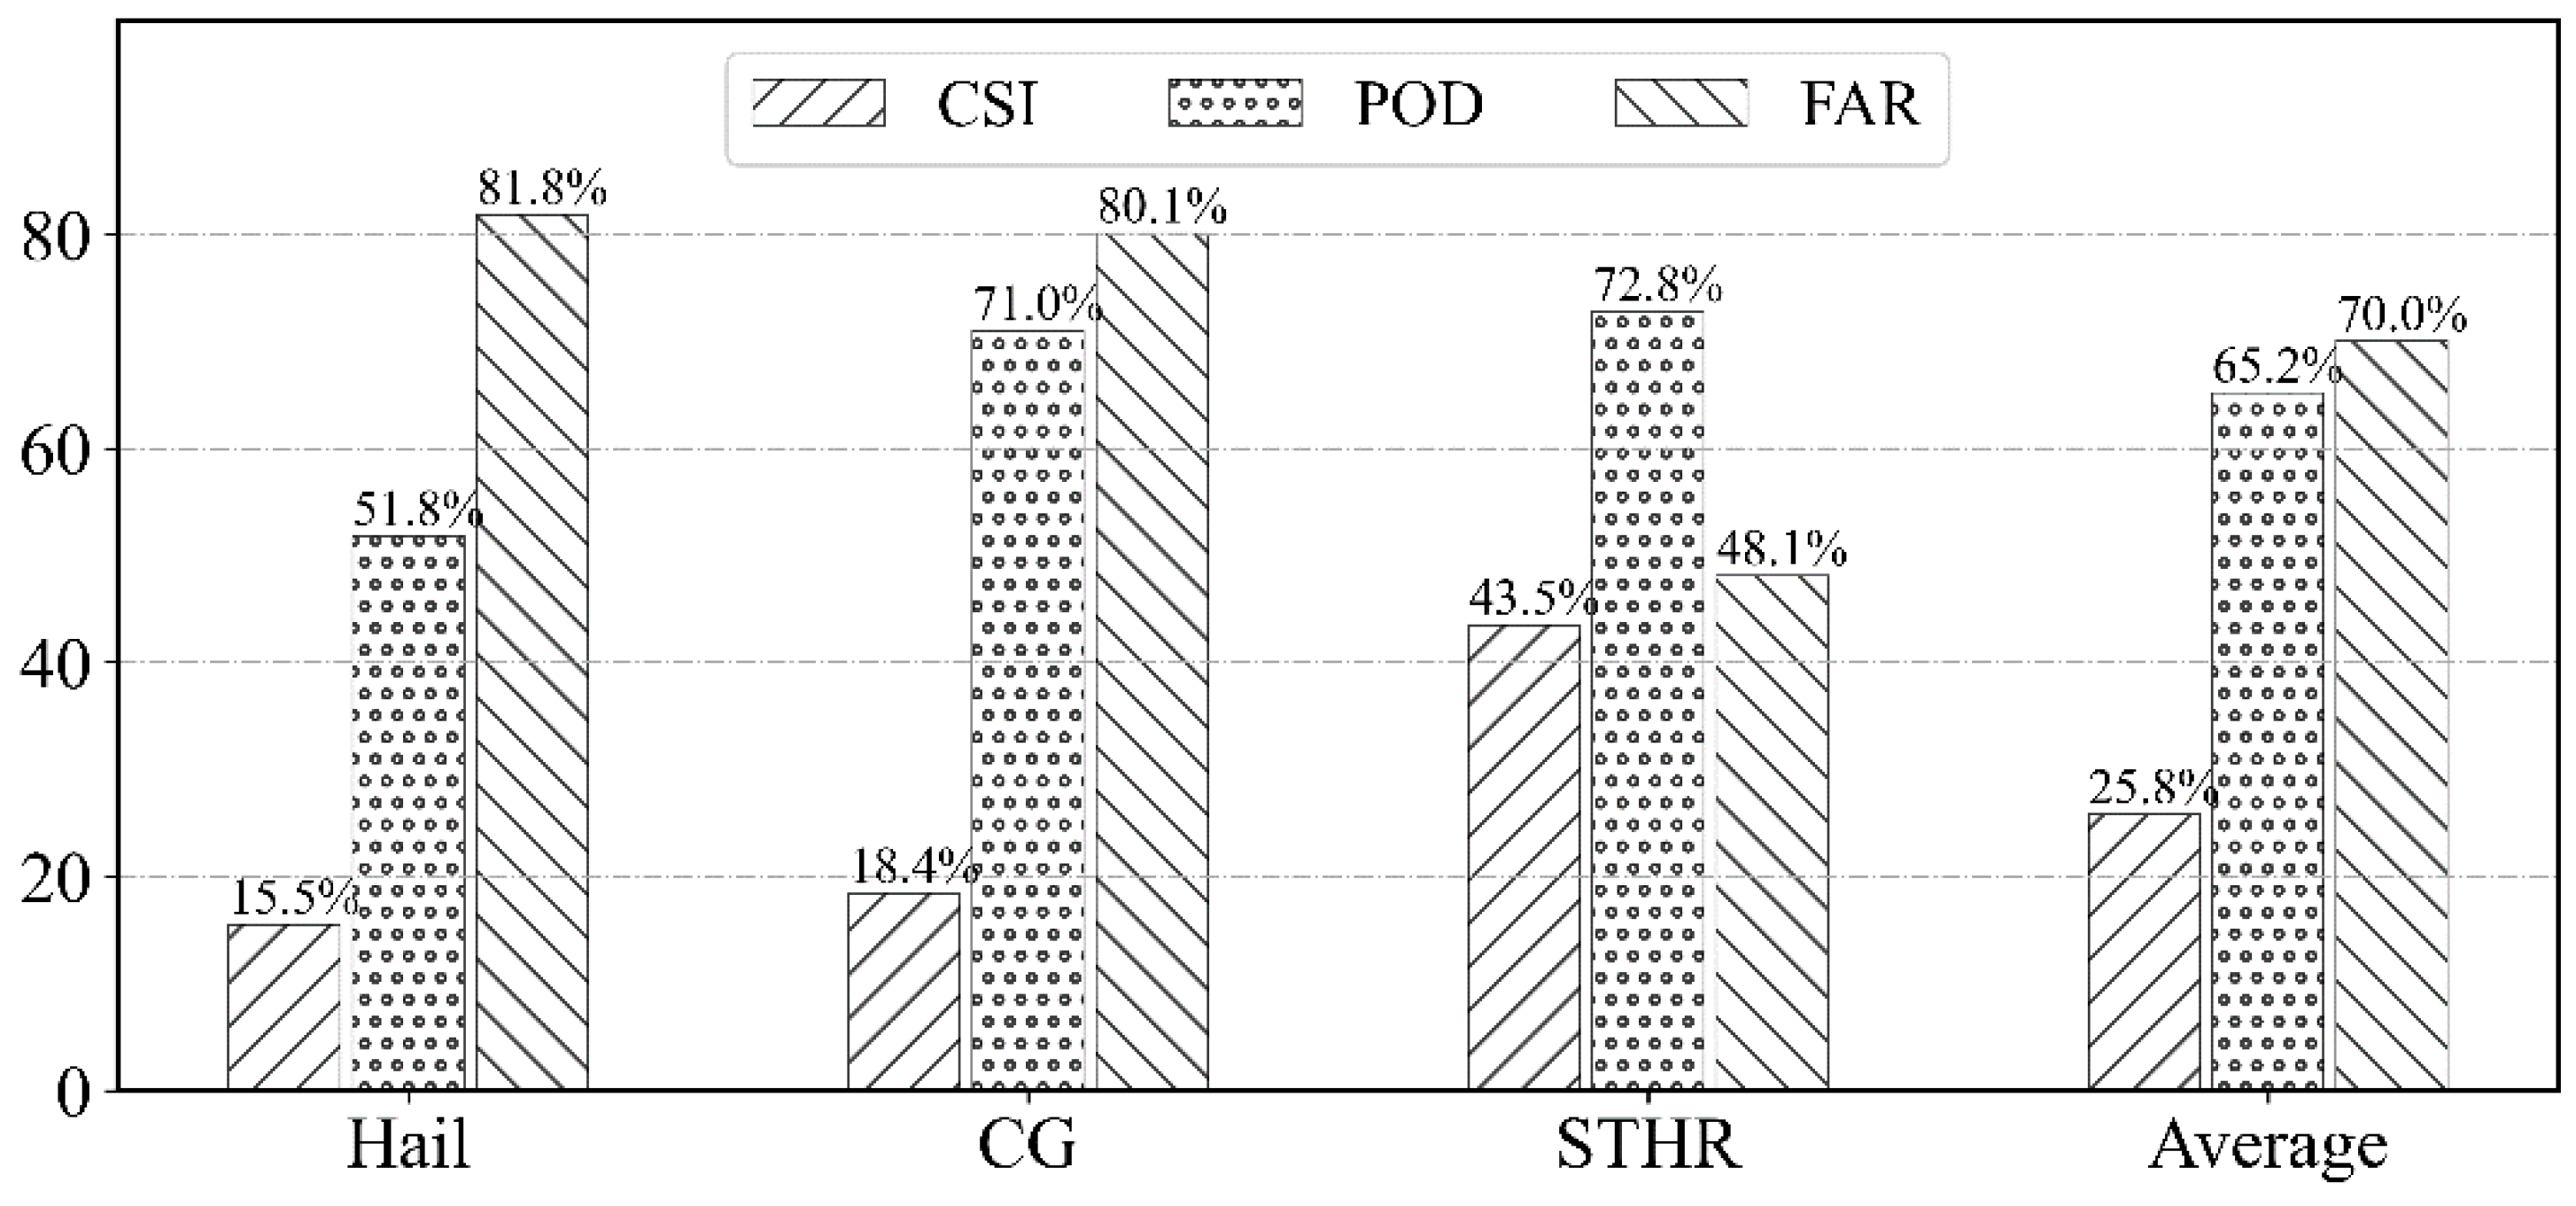
Figure 5.
Classification forecast results score of FCN model in independent validation set.
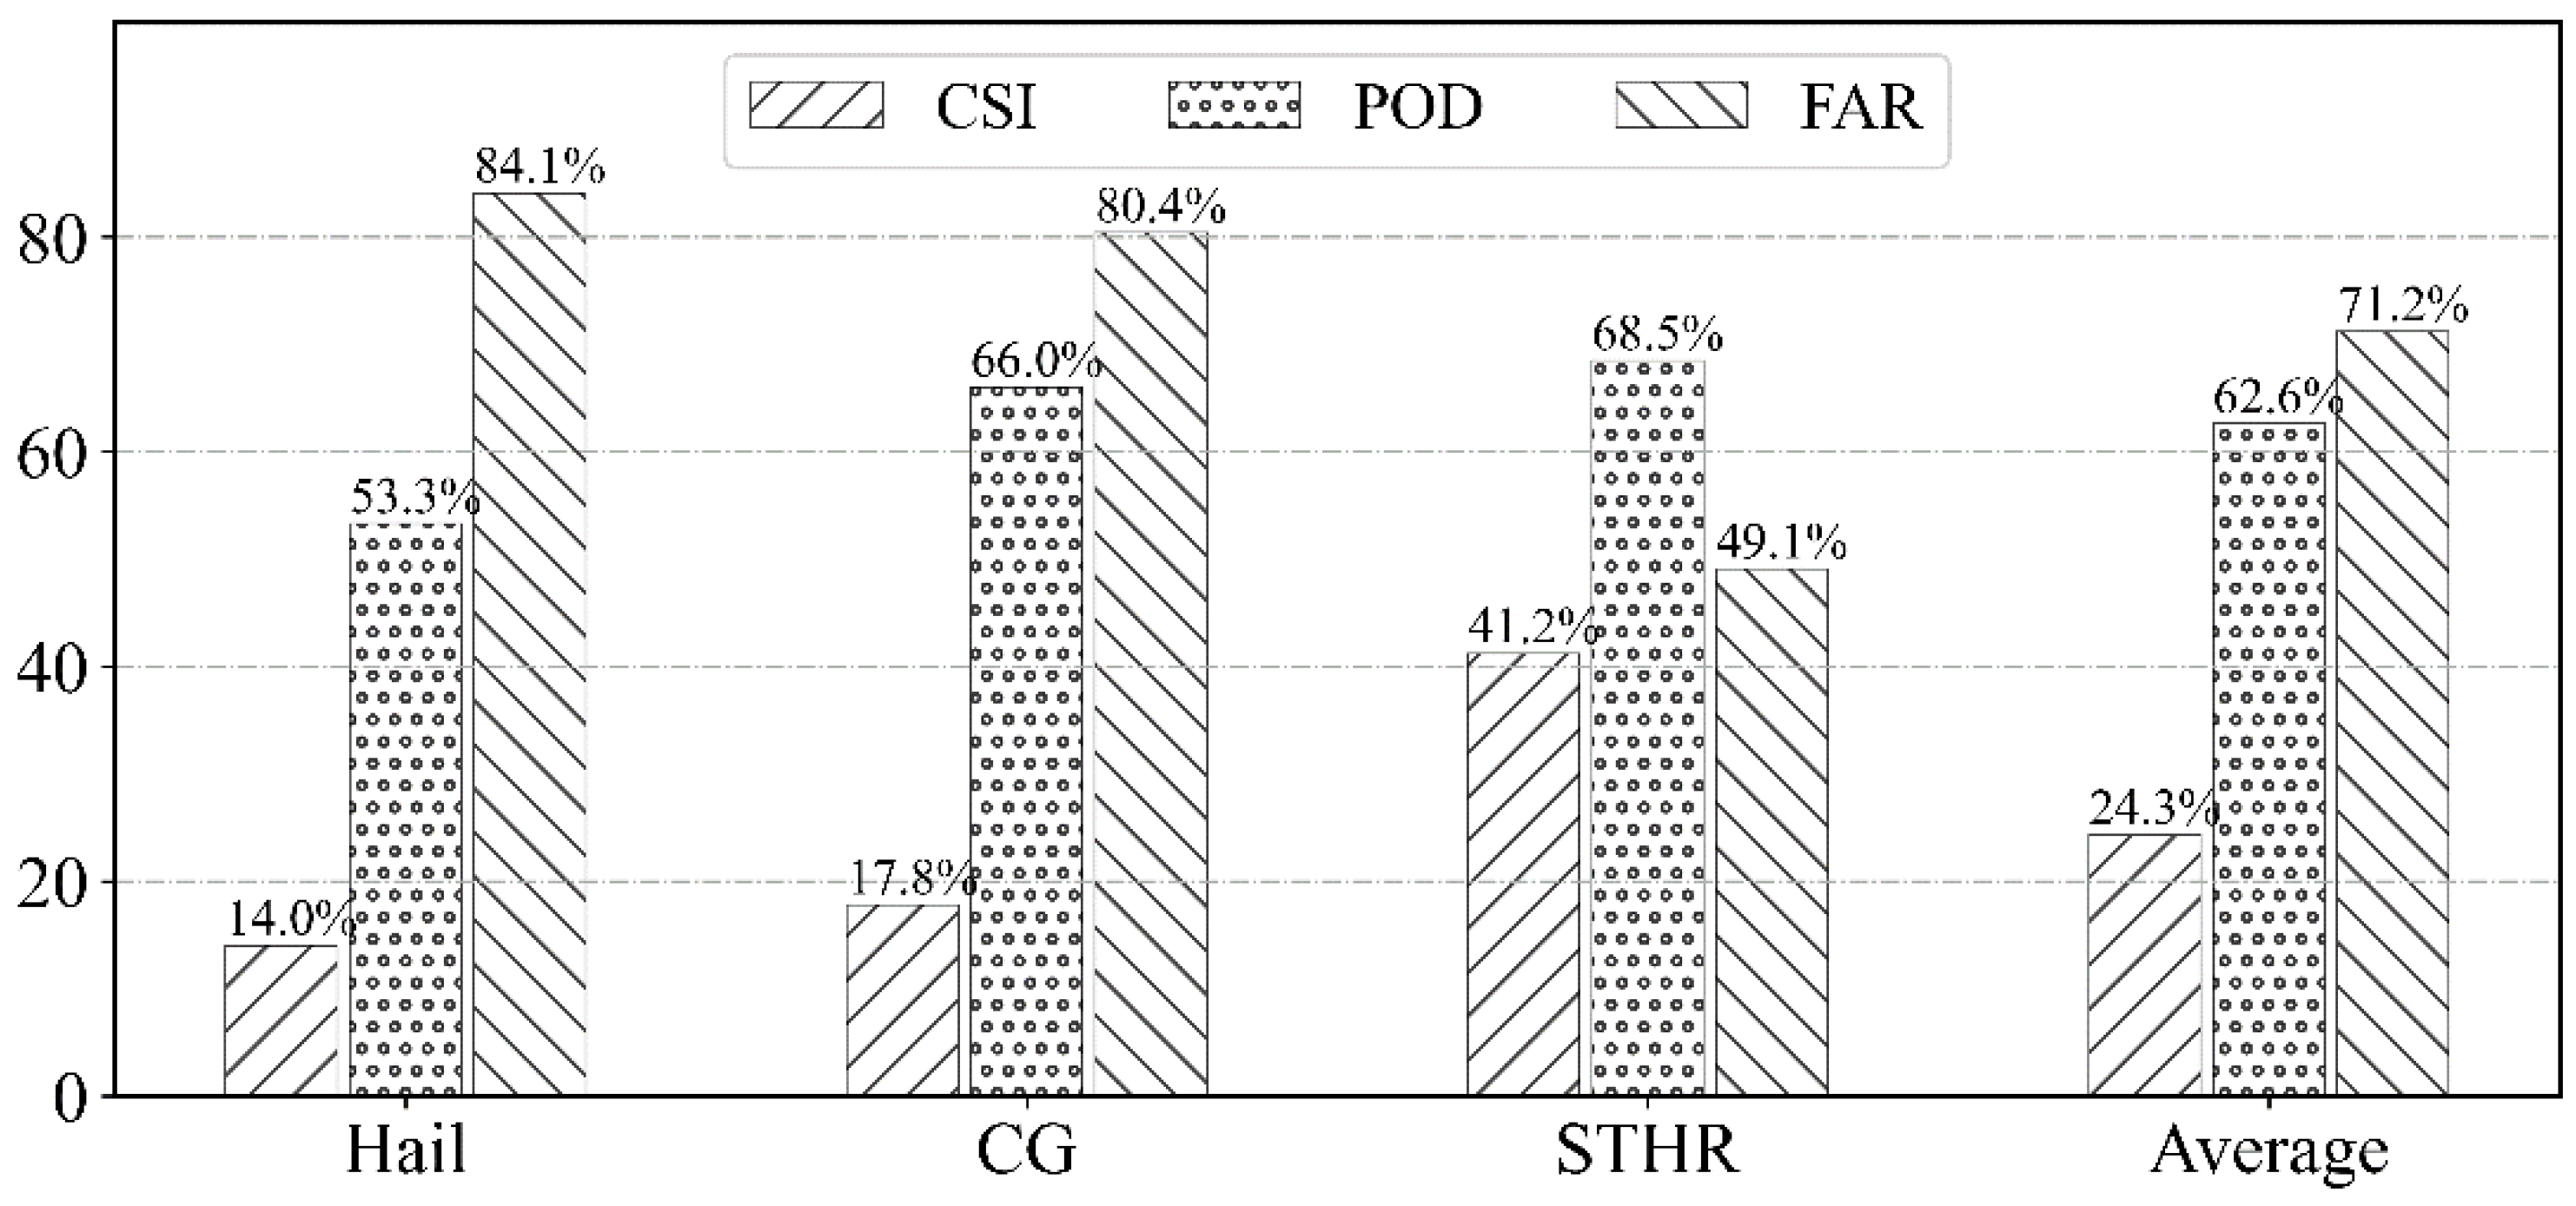
Figure 6.
Classification prediction results score of FCN model in the whole sample.
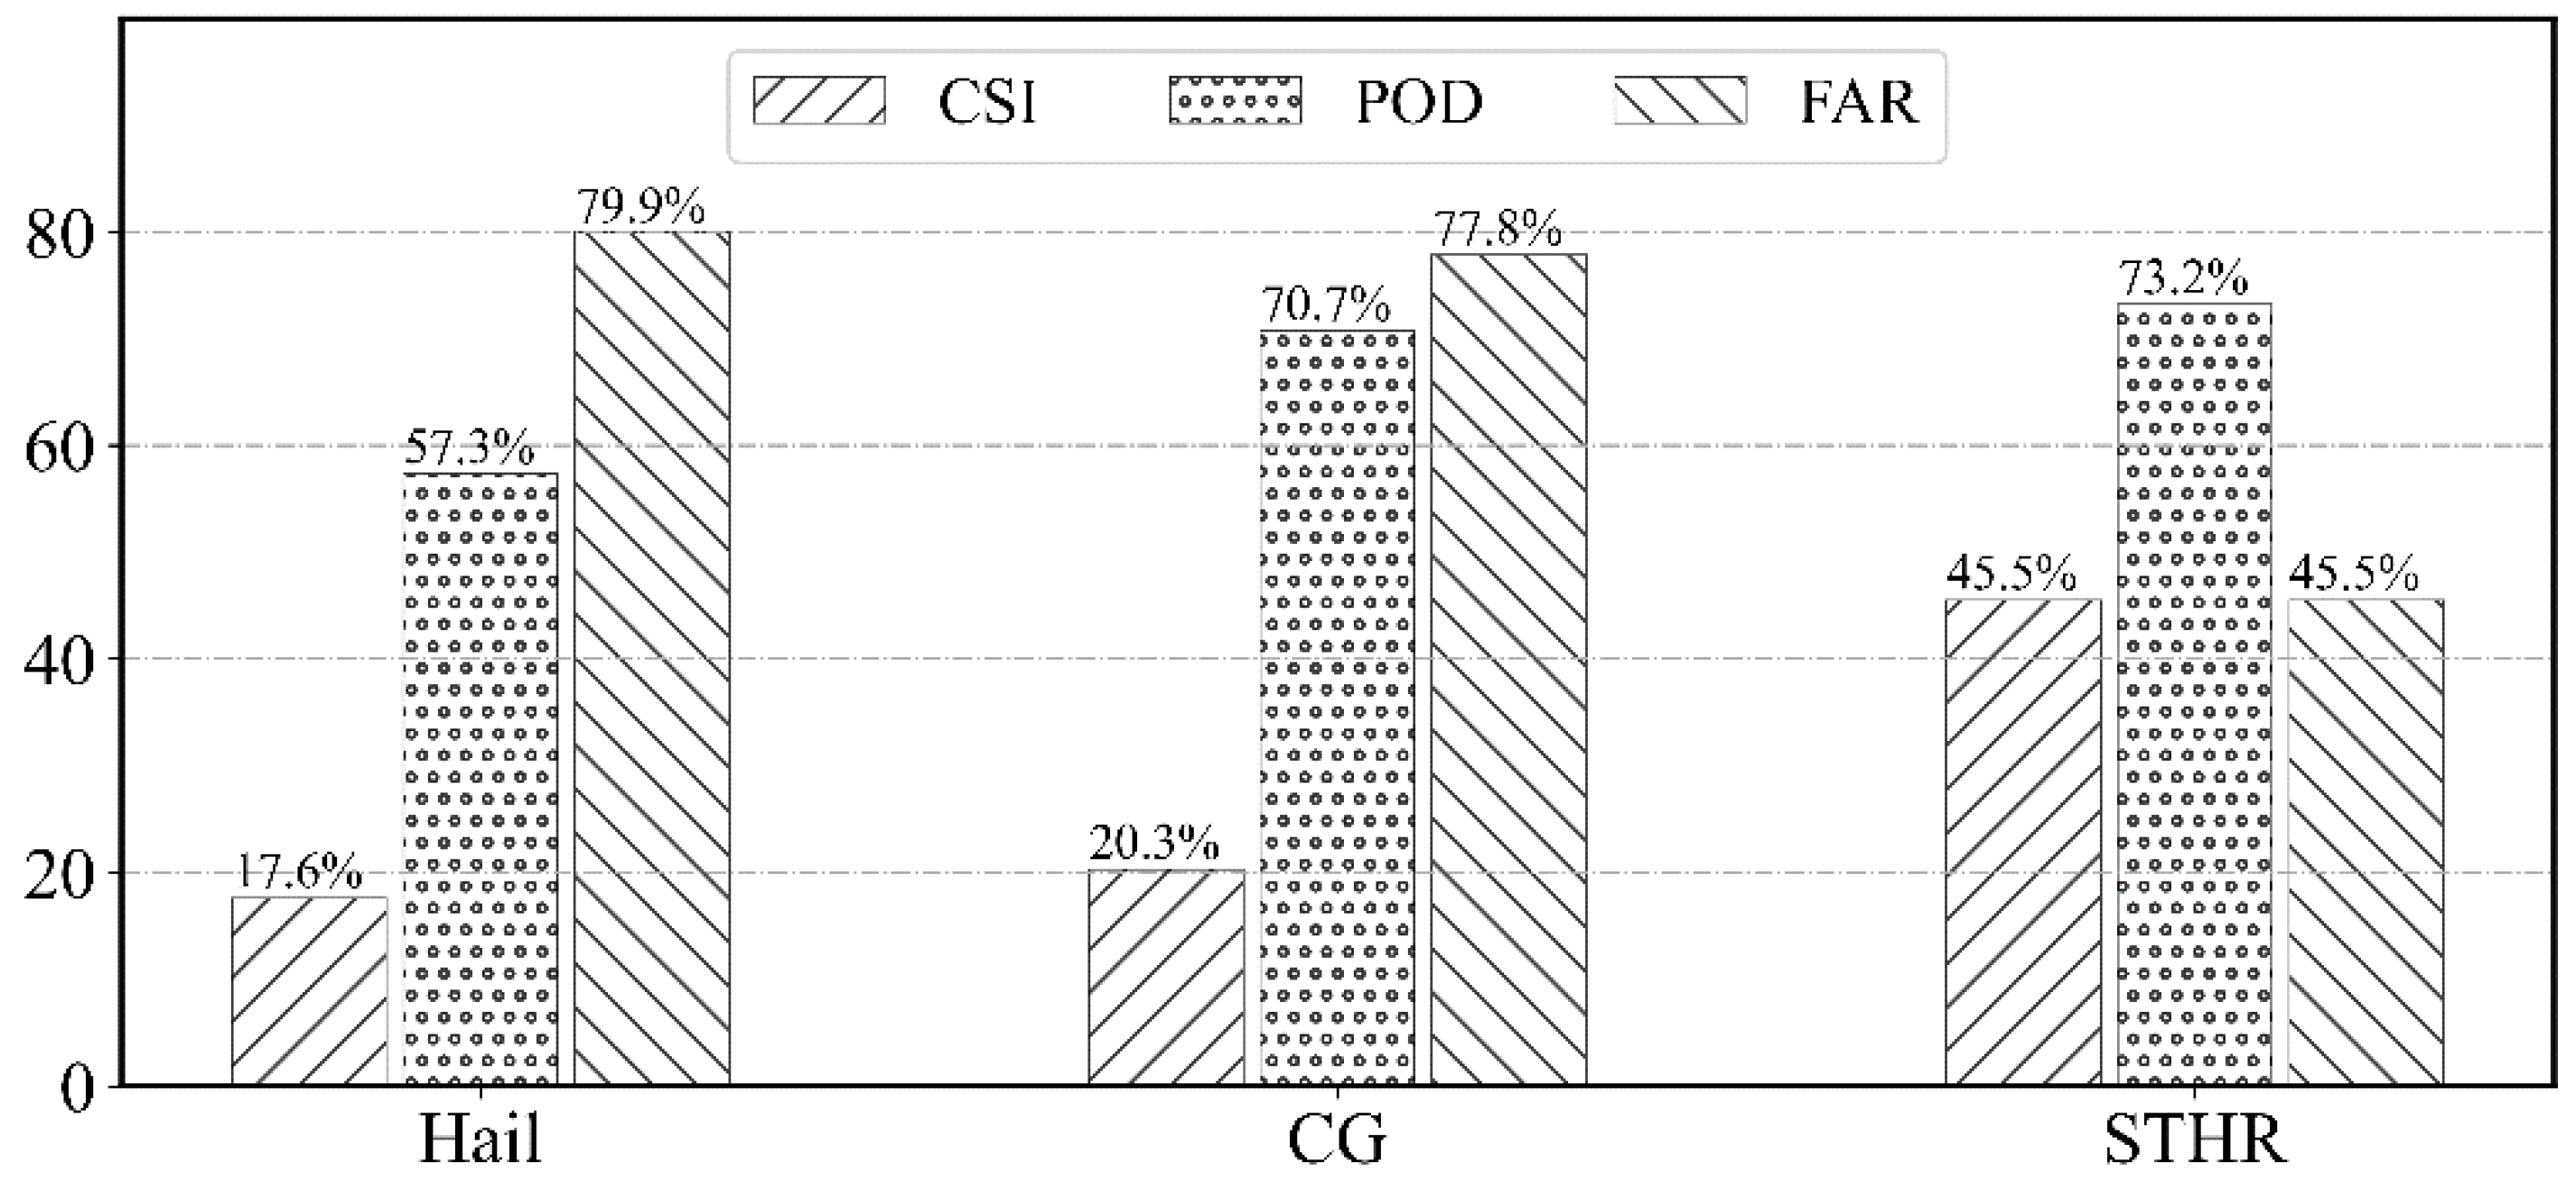
Figure 7.
The score anomaly of the FCN model in classification prediction results hour by hour (a, b, c are the score results of cross-validation set, testing set, and independent validation set).
Figure 7.
The score anomaly of the FCN model in classification prediction results hour by hour (a, b, c are the score results of cross-validation set, testing set, and independent validation set).
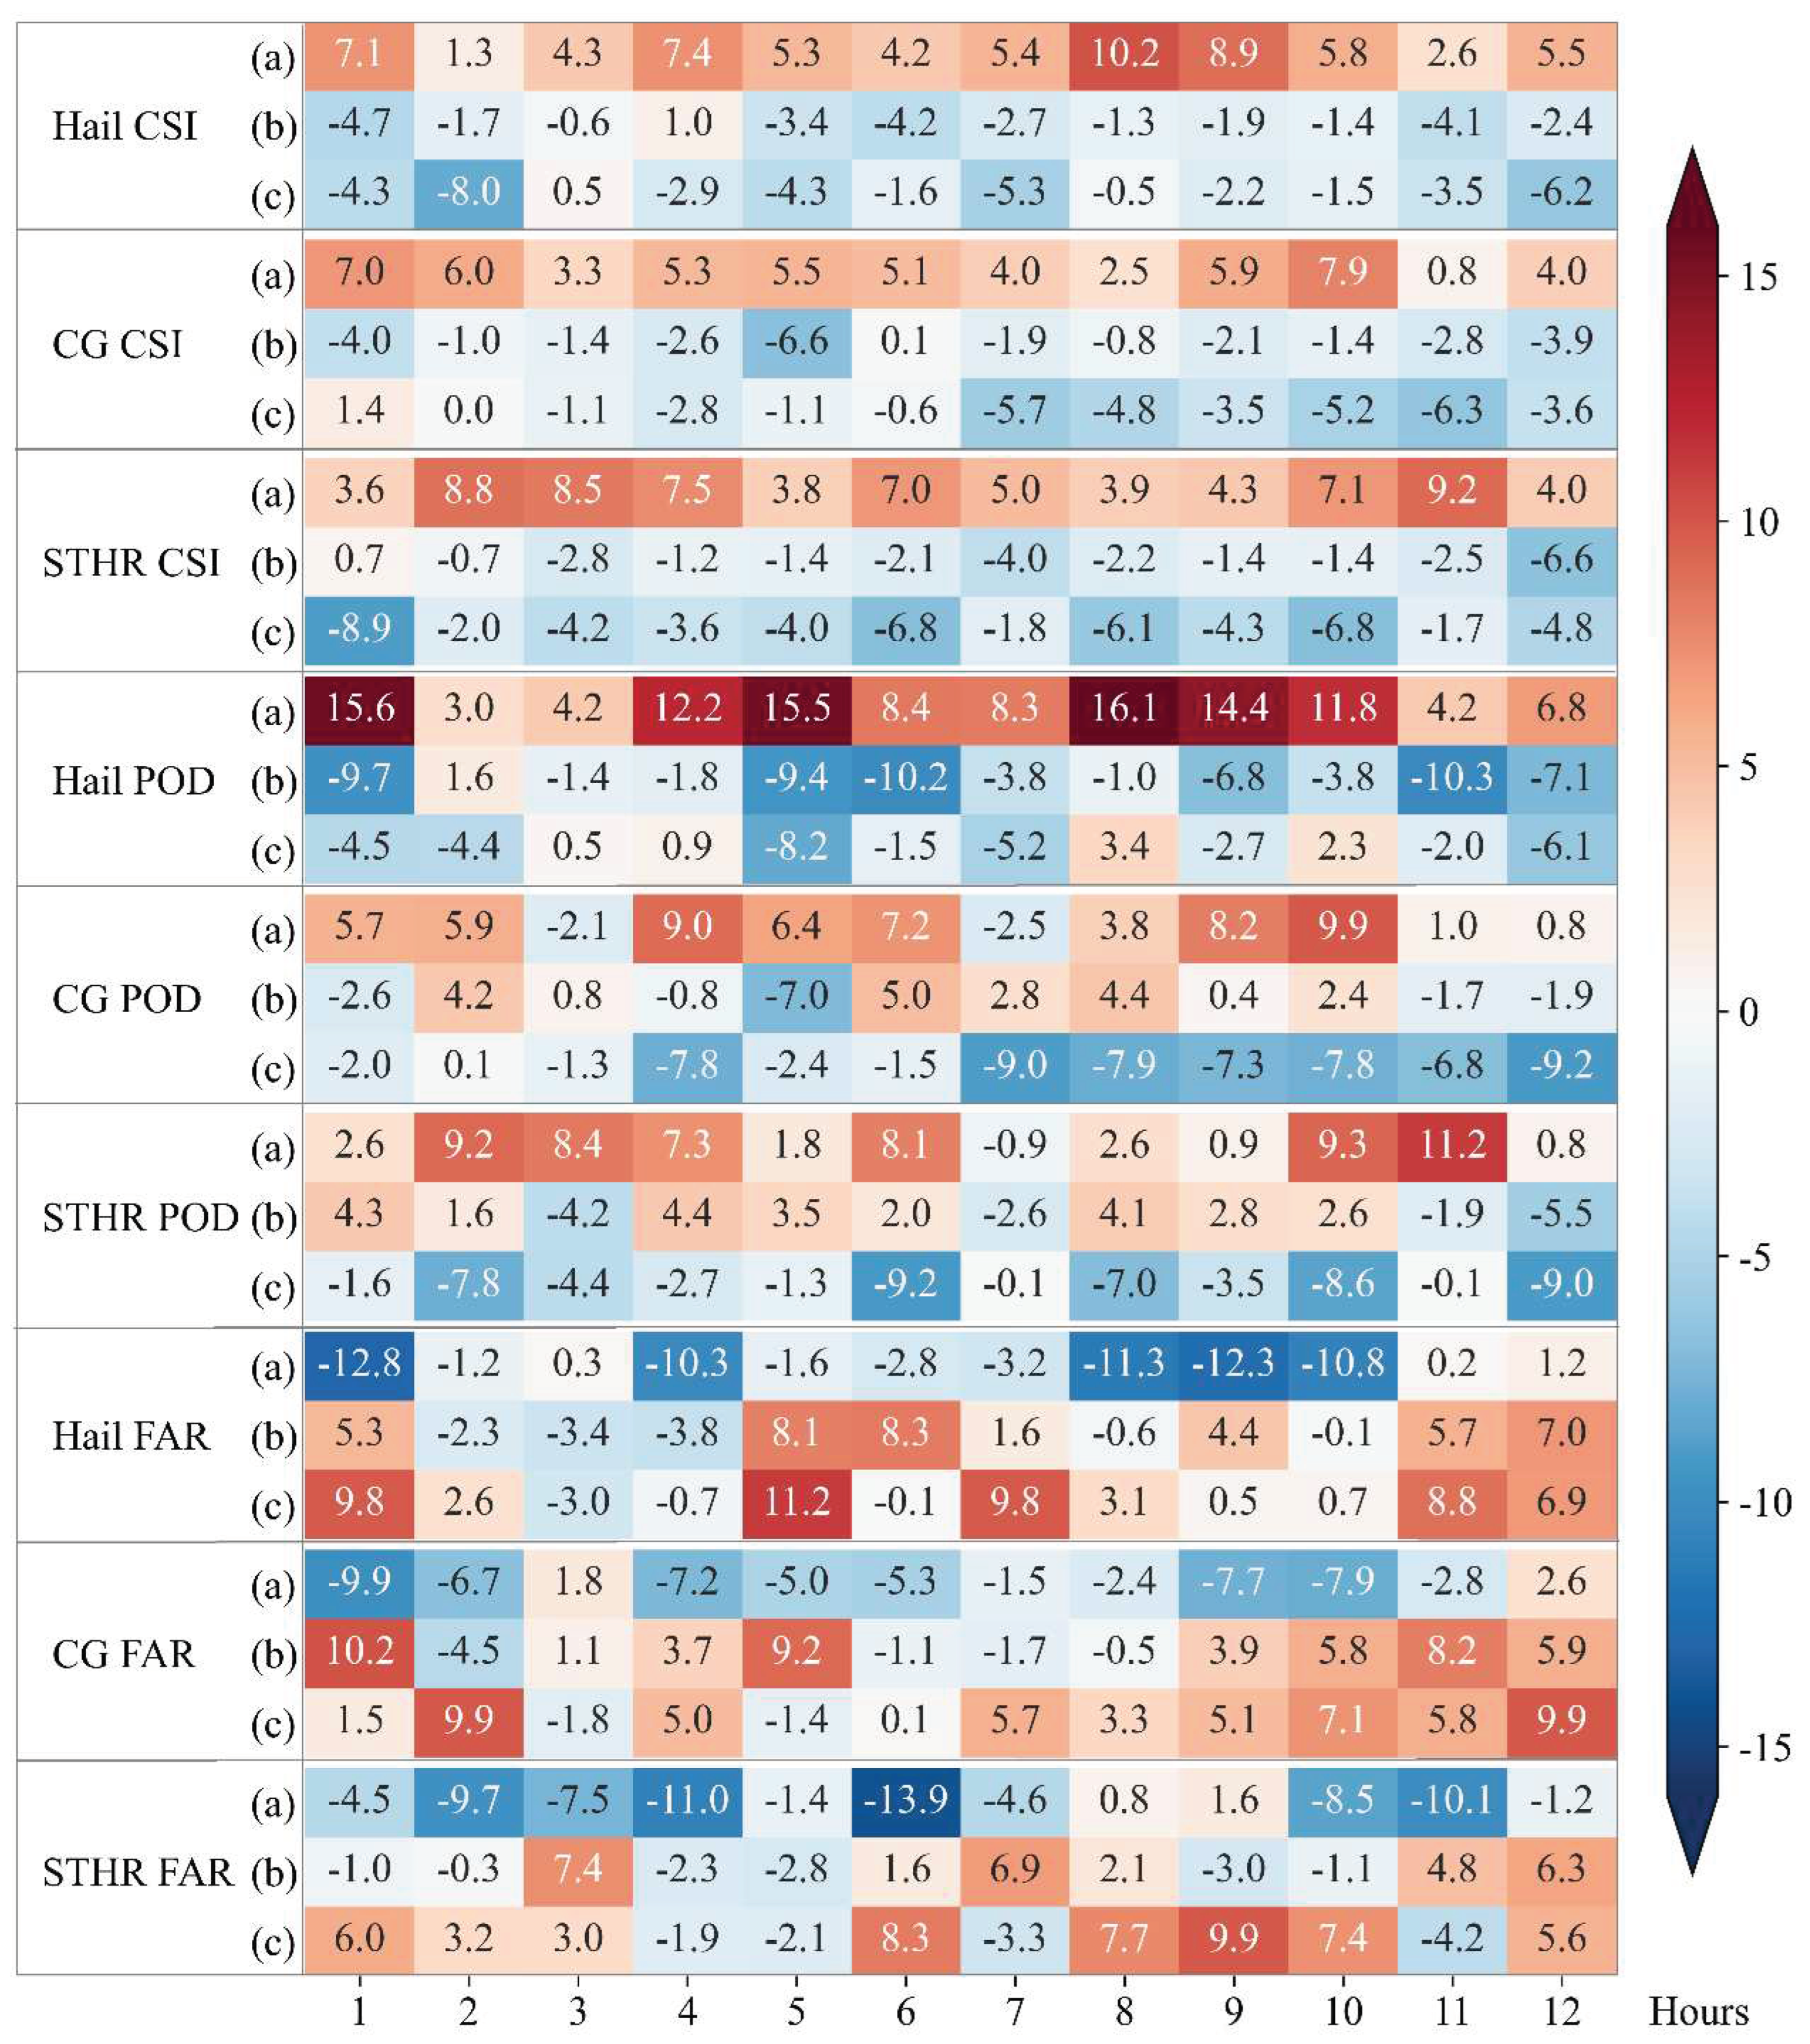

Table 1.
Characteristic quantity of FCN model.
| Factors | PVORT | TMP | HGT | DIV | UV | Q | W | SPFH | CAPE | PW |
|---|---|---|---|---|---|---|---|---|---|---|
| Level (hPa) |
200 | 200 | 200 | 200 | 200 | |||||
| 500 | 500 | 500 | 500 | 500 | 500 | 500 | 500 | |||
| 700 | 700 | 700 | 700 | 700 | 700 | 700 | 700 | |||
| surface | surface | all layers |
Table 2.
Sample numbers and label values of each type of severe convective weather in the Training set (2017-2021), Testing set (2022) and Validation set (2023) of the sets model.
Table 2.
Sample numbers and label values of each type of severe convective weather in the Training set (2017-2021), Testing set (2022) and Validation set (2023) of the sets model.
| Non-SCW | Hail | CG | STHR | |
| Training set | 167108 | 1125 | 11972 | 5890 |
| Testing set | 51024 | 168 | 2258 | 1667 |
| Validation set | 51614 | 167 | 2331 | 1169 |
| Label value | 1 | 2 | 3 | 4 |
Table 3.
Severe convection weather effect evaluation of FCN model in training period cross-validation set.
Table 3.
Severe convection weather effect evaluation of FCN model in training period cross-validation set.
| Obs. | Classification of the FCN model | |||||
|---|---|---|---|---|---|---|
| Hail | CG | STHR | Non-SCW | FIR | Overall FIR | |
| Hail | 150 | 46 | 16 | 13 | 33.2% | 16.6% |
| CG | 36 | 1798 | 320 | 241 | 24.9% | |
| STHR | 22 | 194 | 921 | 41 | 21.8% | |
| Non-SCW | 366 | 4619 | 262 | 28174 | 15.7% | |
Table 4.
Severe convection weather effect evaluation of FCN model in independent test set.
| Obs. | Classification of FCN model | |||||
|---|---|---|---|---|---|---|
| Hail | CG | STHR | Non-SCW | FIR | Overall FIR | |
| Hail | 87 | 44 | 18 | 19 | 48.2% | 18.6% |
| CG | 67 | 1603 | 128 | 460 | 29.0% | |
| STHR | 44 | 281 | 1214 | 128 | 27.2% | |
| Non-SCW | 281 | 6117 | 980 | 43646 | 14.5% | |
Table 5.
Severe convection weather effect evaluation of FCN model in independent validation set.
| Obs. | Classification of FCN model | |||||
|---|---|---|---|---|---|---|
| Hail | CG | STHR | Non-SCW | FIR | Overall FIR | |
| Hail | 89 | 58 | 12 | 8 | 46.7% | 18.3% |
| CG | 58 | 1539 | 340 | 394 | 34.0% | |
| STHR | 23 | 222 | 801 | 123 | 31.5% | |
| Non-SCW | 388 | 6053 | 421 | 44752 | 13.3% | |
Disclaimer/Publisher’s Note: The statements, opinions and data contained in all publications are solely those of the individual author(s) and contributor(s) and not of MDPI and/or the editor(s). MDPI and/or the editor(s) disclaim responsibility for any injury to people or property resulting from any ideas, methods, instructions or products referred to in the content. |
© 2023 by the authors. Licensee MDPI, Basel, Switzerland. This article is an open access article distributed under the terms and conditions of the Creative Commons Attribution (CC BY) license (http://creativecommons.org/licenses/by/4.0/).
Copyright: This open access article is published under a Creative Commons CC BY 4.0 license, which permit the free download, distribution, and reuse, provided that the author and preprint are cited in any reuse.


