
Submitted:
26 December 2023
Posted:
27 December 2023
You are already at the latest version
Abstract
The urgency for a shift towards cleaner and more efficient energy alternatives for power generation is underscored by the escalating demand for energy and the detrimental environmental impacts of conventional fossil fuels. In the case of automotive power, electric vehicles are being adopted in many applications, however, challenges remain such as extended charging periods and limited ranges between charges. Therefore, this research study conducts a techno-economic analysis of renewable energy technologies (including solar modules, wind turbines and piezoelectric materials) to augment the efficiency and sustainability of electric buses. The study examines the scope for these technologies to be adopted on double-decker electric buses in London in the United Kingdom. The solar modules are placed on the rooftop and sides of the bus generating 15.9 kWh/day and the wind turbine in the front bumper of the bus generates 8.3 kWh/day. However, the piezoelectric material generated only 22.6 Wh/day, rendering it an impractical inclusion in further analysis. Therefore, both the solar modules and wind turbines combined generate 24.2 kWh/day, which can increase the driving range by 16.3 km per day and this results in savings of 19.36 minutes for charging at the stations. Investing in such projects would have a positive return as the internal rate of return (IRR) and net present value (NPV) are 2.8% and £11,175 respectively. The annual revenue would be £6,712, and the greenhouse gas (GHG) reduction would be two metric tons annually. Electricity exported to the grid, the electricity export rate, and the initial investment are identified as key factors influencing power outage in a sensitivity analysis. In conclusion, this numerical modelling study paves the way for experimental validation towards implementation of renewable energy technologies on electric bus fleets.
Keywords:
Renewable Energy Technologies
; Solar Modules
; Wind Turbines
; Piezoelectric Materials
; Electric Buses
; Energy Efficiency
; Urban Public Transportation
; Techno-Economic Analysis
; Environmental Sustainability
; Charging Infrastructure Reduction
1. Introduction
Energy has been fundamental to human civilization, traditionally relying on non-renewable sources like coal, oil, and gas. These resources may deplete within this century if current consumption continues. Fossil fuel combustion releases harmful gases such as carbon dioxide (CO2) and methane (CH4), contributing to global warming. For instance, CO2 levels rose from 280 ppm pre-industrial revolution to 400 ppm with fossil fuel transportation, and could reach 560 ppm by century's end, exacerbating global warming and sea level rises [1]. It also emphasizes the urgent need to transition to renewable energy sources like solar, wind, tidal, geothermal, biomass, and nuclear fusion. These sources are sustainable, eco-friendly, and replenish quickly, offering a virtually unlimited supply. However, they face challenges like fluctuating energy output and lower energy density, necessitating advanced harnessing technologies.
In transportation, renewable energy can significantly decarbonize the sector, with electric vehicles (EVs) playing a crucial role [2,3,4] EVs, charged by renewable sources, could constitute over 80% of road transport by 2050 in a 1.5°C Paris Agreement scenario [5]. London exemplifies this shift, operating Europe's largest electric bus fleet, including over 200 buses and the UK's first full-electric double-deck bus routes. These efforts contribute to a 90% reduction in NOx emissions in Low Emission Bus Zones and align with London's net zero emissions goal by 2030 [6,7].
Renewable energy sources like solar panels, wind turbines, and to a lesser extent piezoelectric materials, are not only used for generating electricity in homes and businesses but are also being explored for vehicle power. Although still in developmental stages, some vehicles already incorporate these technologies. For example, the Lightyear One, a Dutch solar-powered electric car, features solar panels on its roof and hood, generating up to 12,000 km of energy annually [8]. Similarly, the Sion, a German electric car by Sono Motors, includes solar panels on its roof, hood, and sides for up to 34 km of additional daily range [9]. Wind turbines, due to their size and weight, are less common in vehicles, but research is ongoing to adapt them for vehicular use. The application of piezoelectric materials in vehicles, primarily in tires to generate electricity for sensors and lighting, is also being studied, albeit not extensively. There's a significant opportunity to integrate multiple renewable energy technologies in vehicles, particularly in public transportation. For instance, in London, out of approximately 9,000 buses, only a few are electric, and none employ renewable energy harvesting methods [10]. Incorporating technologies like solar panels, wind turbines, and piezoelectric materials into these buses could significantly reduce CO2 emissions and enhance sustainability.
This engineering research study aims to explore energy harvesting technologies for electric buses, thereby reducing reliance on charging stations and associated infrastructure. The empirical study investigates solar, wind, and pressure energy conversion to electrical power, aiming to decrease battery charging frequency and assess the economic benefits of these technologies on electric bus fleets. The structure of this article is as follows. After the introduction is the literature review. This is followed by the materials and methods section; results section; discussion section; and finally, the conclusions and future work.
1.1. Literature Review
1.1.1. Mounting Solar Panels Onto Electric Vehicles (EVs)
A study conducted in Japan indicated that 6.8 m² of solar modules on a plug-in hybrid vehicle generated 2.1 kWh/day, potentially cutting Japan's CO2 emissions by 63% as shown in Figure 1. These were placed on the vehicle's doors, hood and roof. A more efficient design using III-V cells reduced the area to 3.4 m² while maintaining a 22% efficiency, resulting in 1.8 kWh/day and extending the driving range by 31 km/day. Despite a 60% reduction in solar radiation on vertical surfaces, the decrease in power was only 40%, and the total output remained at 2.1 kWh/day. The study underscores the potential of micro-CPV and CIGSe cells for more cost-effective and efficient solar solutions [11,12].
The study by Abdelhamid et al. [13] evaluates photovoltaic (PV) modules for electric vehicles (EVs) using a decision-making strategy that combines quality function deployment (QFD) and analytical hierarchy process (AHP). It predicts driving ranges using bulk silicon PV modules, suggesting mono-Si PV modules are best for certain EVs, potentially reducing CO2 emissions. The study by Yamaguchi et al. [14] compares solar cells, noting III-V triple and six-junction cells as most efficient but costly, recommending improvements in material, efficiency, and multi-junction (MJ) solar cell structure for PV-powered vehicles as shown in Table 1.
The development of tandem solar cells is a significant advancement in solar technology, combining Silicon (Si) with materials such as Group III-V, Group II-VI substances, and perovskite chalcopyrite structures to achieve a balance between efficiency and cost. The III-V/Si triple-junction tandem cells have reached an efficiency rate of 35.9%, and perovskite/Si dual-junction cells have an efficiency of 29.15%, with potential upper limits of around 42% and 36%, respectively [14].
In the realm of solar-powered vehicles, the University of Kentucky's "Design, Development and Optimization of Highly Efficient Solar Cars: Gato del Sol I-IV" study by Mangu et al. [15] documents the evolution of the Gato del Sol series. The vehicles have shown consistent design and performance enhancements, with Gato del Sol III operating over 120.7 km without direct sunlight. The anticipated Gato del Sol IV is expected to be among the fastest solar vehicles, potentially reaching speeds of 120.7 km/h. This research emphasizes the importance of reliability, solar panel efficiency, weight reduction, and aerodynamics in the performance of solar vehicles.
The practical application of solar energy in vehicles has been explored by Chmielewski et al. [16], who proposed an electric vehicle design with a slim solar panel roof. The model analyzed the panel's impact on driving distance, suggesting its utility for long-distance buses and potential cost savings. Additionally, Schuss et al. [17] investigated the challenges and feasibility of photovoltaic (PV) systems on electric and hybrid vehicles, highlighting rooftop PV integrations as effective energy range extenders (EREs).
Uno et al. [18] introduced a PWM differential power processing (DPP) converter for solar roofs on plug-in hybrid vehicles, increasing energy yield and efficiency. Furthermore, a MATLAB-based design and operation model for solar-integrated electric vehicles (SIEVs) by Nivas et al. [19] showed system efficiency and potential for reduced carbon emissions.
Finally, a study by Gezelius and Mortazavi [20] revealed a positive correlation between households with solar panels and the likelihood of owning a battery electric vehicle (BEV). This supports the idea that domestic solar charging could boost BEV adoption, contributing to a greener future.
1.1.2. Mounting Wind Turbines
The potential of wind energy in vehicles has been extensively researched, with innovations aimed at integrating wind turbines into a range of vehicles, from cars to trucks. A study by Shivsharan et al. [21] highlights a vehicle-mounted wind turbine's ability to cut fuel consumption by 15% over 30km. While mounting turbines on the front bumper increases efficiency, issues with speed limits and vibrations need addressing. A novel toy-shaped turbine design was proposed, promising reductions in fossil fuel use and aiding against global warming, yet a literature gap on its direct applicability remains. Further research by Fathabadi [22] explores the use of batteries, solar modules, and wind turbines in plug-in hybrid electric vehicles (PHEVs) to extend cruising range. Experiments with an 1880 kg PHEV with specific parameters, including a cruising range of 110 km and a 100w-rated micro wind turbine, showed that isolating solar modules to only use wind power could increase the range to 116.3 km and enhance efficiency to 90.4%. As it can be seen in Figure 2, the wind energy generated was substantial but capped at 3 kW.
Recent studies have explored wind energy as a supplement to vehicular power, aiming to enhance efficiency and reduce reliance on traditional fuel sources. Awal et al. [23] developed a vehicle-mounted wind turbine (VMWT) system that improves rpm and torque, generating up to 200 W at vehicle speeds under 80 km/h. However, it introduces additional drag and must operate within the Betz limit for efficiency. Subsequently, Weng and Huang [24] attached a 400W turbine to a car's bumper, noting a 15% fuel saving at speeds over 80 km/h. An auxiliary battery was used to prevent battery damage from high charging currents. Their findings indicated that turbine efficiency decreases under 60 km/h. Moreover, Yao and Chiu [25] proposed a wind energy system for trucks with a unique turbine blade design, placing it on the truck's front roof to optimize energy generation, yet their efficiency measurements were modest. In addition, Hussain et al. [26] experimented with in-transit charging of EV batteries using a Vertical Axis Wind Turbine (VAWT) installed in the car's front grille, which could generate 0.5 kW at speeds of 40-60 km/h, requiring a power enhancement converter for voltage stabilization. In a similar study, Anagie et al. [27] tested a compact wind turbine on a utility vehicle, producing less power in real-world conditions compared to theoretical output, suggesting a diffuser might improve results despite increased drag. Furthermore, Chang et al. [28] created a hybrid car with a wind energy capture device enhanced by a diffuser shroud, increasing the power coefficient and mechanical output, although discrepancies were noted between expected and actual performance.
Lastly, Beesetty [29] proposed mounting a windmill on vehicles to generate electricity, not just for propulsion but also for powering refrigeration units, highlighting the potential for a sustainable, fuel-saving, and emission-reducing solution.
Wind speed is a critical determinant in the efficiency of energy generation for moving vehicles, as it directly influences the revolutions per minute (RPM) of the turbines installed on them. The RPM is closely linked to the torque produced by the turbine, which is essential for capturing and converting wind force into electrical power. A thorough comprehension of these elements is vital for enhancing the energy harvested from wind in automotive applications. It is well established that a vehicle’s increased speed can lead to higher RPMs of the turbine, due to the augmented wind force encountered. Additionally, as a vehicle accelerates, its engine or turbine tends to generate more torque, while simultaneously, the resistance due to wind force escalates, potentially impacting the vehicle’s performance and necessitating specific design adaptations. Furthermore, the generation of power is contingent upon surpassing a certain vehicle speed threshold, beyond which power output experiences significant growth with even modest increases in speed. This reflects the inherent cubic relationship between wind speed and power generation observed in wind energy systems [23].
The efficiency of wind turbines, a key aspect of renewable energy, has been extensively studied in scientific research. This includes advancements in turbine design and optimization, focusing on blade aerodynamics, structural design, and the use of advanced mathematical modeling and materials analysis. Pavel et al. [30] investigate alternative solutions for critical raw materials (CRMs) in wind turbines, noting that direct replacements for CRMs haven't reached commercial viability, but there are promising strides in material optimization and component-level replacements. In electric vehicles and lighting, similar efforts are underway to reduce CRM dependence. Jaen et al. [31] explores the use of low-density materials in electrical machines, finding that composites significantly reduce the mass of generator structures and perform better in weight-sensitive applications. Pourrajabian [32] focuses on wind turbine blade design, suggesting that blades with backward swept designs can effectively reduce load fluctuations and improve efficiency. Tang et al. [33] develops an aerodynamic mathematical model for small wind turbine blades, identifying optimal distributions for blade chord and twist angle, which aid in streamlined blade design. Lastly, Chen et al. [34] study the impact of flanged diffusers on compact wind turbines, finding that they enhance performance, particularly in turbines with certain rotor solidities and wind velocities, with a rotor solidity of 35-40% being ideal for maximizing the power coefficient in smaller turbines.
Aerodynamic drag is a significant factor affecting fuel efficiency in automobile engineering, and efforts to minimize this resistance are crucial. Rohatgi [35] investigated drag reduction techniques using a scaled SUV model in a wind tunnel, finding that certain modifications, such as a rear screen and rear fairing, could reduce drag by up to 26%. Similarly, Sudin et al. [36] examined the effectiveness of both active and passive strategies to control airflow and diminish drag, underscoring its impact on fuel consumption, especially at higher speeds common on freeways.
In the context of electric vehicles, Fotso et al. [37] assessed the aerodynamic implications of installing Savonius wind turbines through computational simulations, which revealed a notable increase in the drag coefficient. Sofian et al. [38] further explored where a wind turbine could be optimally placed on an electric vehicle to preserve aerodynamic qualities. Their analysis, utilizing ANSYS FLUENT, showed that a turbine on the front bumper could maintain the vehicle's aerodynamic integrity better than placements on the hood or rooftop, which significantly disrupt airflow and increase pressure.
1.1.3. Piezoelectricity to Convert Mechanical Energy to Electricity
The integration of piezoelectric materials in sustainable energy applications, especially for mechanical strain energy capture, has marked significant advancements. Kulkarni et al. [39] proposed a method to enhance the power supply of electric vehicles (EVs) during long travels, suggesting the use of PZT benders in tires to potentially double power output to 4.6 watts. Building on this, Esmaeeli et al. [40] demonstrated a practical application by embedding a piezoelectric energy harvester in car tires, generating electricity for tire pressure sensors.
Expanding the applications beyond vehicles, Song et al. [41] delved into the potential of piezoelectric generators on traffic roads, revealing that strategically sized modules could yield up to 2.95 kWh per kilometer. In the vehicular sector, Makki and Pop-Iliev [42] concentrated on incorporating piezoelectric elements, such as PZT and Polyvinylidene Fluoride (PVDF), into car tires. Their research evaluated various energy harvesting methods and concluded that piezoelectric-based energy generation holds promise for replacing smaller batteries in wheel sensors, indicating a substantial shift towards more sustainable and efficient energy solutions in the automotive industry.
Piezoelectric materials, crucial for generating electrical energy under mechanical strain, come in various forms like inorganic, organic, and composite substances. Piezoceramics are known for their high energy conversion efficiency but are brittle, while piezopolymers, though flexible, have lower electromechanical coupling. Composites aim to merge the benefits of both. These materials typically possess wurtzite or perovskite structures, with perovskites requiring additional preparation but offering higher efficiency. Designing piezoelectric generators involves embedding these materials between elastic layers with electrodes for electricity collection. Key selection factors include piezoelectric strain and voltage coefficients, electromechanical coupling, resilience, and dielectric coefficient. Inorganic compounds generally excel in strain and electromechanical coupling, while polymers like PVDF, known for their flexibility and durability, are suitable for applications like vehicle tires due to their comparable efficiency and ability to withstand significant stress [43,44].
In piezoelectric energy harvesting, the alignment of stress to the material's primary polar axis is key. Stress applied along this axis, the "3" direction, leads to the 33-mode of energy extraction, where stress and voltage are aligned, typically yielding higher voltage output. In contrast, the 31-mode involves stress applied axially (in the "1" direction) with voltage generated perpendicularly, resulting in greater current output. The open circuit voltage in piezoelectric materials depends on factors like applied stress, piezoelectric coefficients, electrode gap, dielectric constant, and permittivity. Each mode significantly influences the piezoelectric output's characteristics [43].
Khalili et al. [45] developed a Piezoelectric Energy Harvester (PEH) housing integrated into road surfaces, designed to transfer the weight of a truck axle to PZT (Lead Zirconate Titanate) stacks. The chosen PZT material, "# 840, Navy I Equivalent" from APC International Ltd, is configured into stacks at each corner of the metal box housing. Each stack consists of six circular disks, designed to minimize high voltages and increase low currents compared to older designs. These stacks operate in a 33-mode, producing significantly higher voltages than the 31-mode under similar stress. The stacks use copper sheet electrodes with an indium coating for soldering, with the indium's low melting point preventing damage to the PZT. The electrodes are insulated with Kapton, and each of the four stacks supports a corner of the PEH's top plate.
the evolving trend in the U.S. auto industry where car manufacturers are increasingly focusing on reducing the weight of their vehicles to improve fuel economy and performance. Following decades of increased vehicle weight, companies like Lotus, BMW, and Jaguar are now investing in lightweight materials like aluminum and carbon fibre. A lighter vehicle weight results in higher miles-per-gallon (MPG) numbers and thus cost savings on fuel. The EPA estimates a 1-2% increase in fuel economy for every 100 pounds removed from a vehicle. The text also encourages individual drivers to consider reducing excess weight in their own cars for better fuel efficiency. Finally, the text mentions the impact of future technology, such as the weight of batteries for plug-in vehicles, on the industry's focus on weight reduction [46].
1.1.4. EV Charging
Charging electric vehicles (EVs) while stationary, though technically feasible, can be costly. Efficient charging typically requires a direct grid connection at a personal parking space or garage, resulting in a low-cost charging setup. EVs are generally connected to the grid overnight, with the peak domestic charging power expected to reach 3.3 kW by 2020 and potentially 9.9 kW by 2030. Uncontrolled charging could lead to a peak load of 700 MW for a million EVs in 2020, posing challenges to the distribution grid. Controlled charging strategies, deferring charging to off-peak hours, are seen as a solution. However, evaluations indicate that by 2020, controlled charging would only allow 7.5% of excess wind energy to power EVs, with the figure dropping further by 2030 due to grid constraints [47].
Al-Ogaili et al. [48] analyzed various controlled charging strategies for EVs, including timing-based scheduling, aggregation, and predictive forecasting. Their study assesses the strengths and challenges of these methods in relation to smart grid integration, providing recommendations for future smart grid systems.
1.1.5. Green House Gas (GHG) Emissions
Addressing CO2 emissions in transportation, especially from road transportation globally, is crucial for sustainable progress. While battery-powered electric vehicles (BEVs) have lower CO2 emissions than internal combustion engine vehicles (ICEs), fuel cell-driven vehicles (FCVs), and hybrid electric vehicles (HEVs), further reduction efforts are ongoing. Incorporating photovoltaic (PV) systems into vehicles shows promise in reducing CO2 emissions. A study involving 5,000 participants and vehicles revealed that a vehicle with a 1 kW photovoltaic rating and a 4-kWh battery storage capacity (termed PV-EV) can achieve a 12% reduction in CO2 emissions over 12 years compared to an HEV. This highlights the importance of promoting PV-driven vehicles to bridge the gap between BEV adoption and charging infrastructure availability. Additionally, it was shown that PV-EVs emit significantly less CO2 compared to BEVs, ICEs, FCVs, and HEVs, emphasizing the potential of photovoltaic technology in further reducing emissions [14].
This research project set out with a threefold objective: to assess the feasibility of harnessing solar, wind, and piezoelectric energy for electric vehicles (EVs), to design an integrated system architecture incorporating these energy sources, and to evaluate their economic benefits, particularly in reducing EV charging needs. The study concluded that solar modules are highly efficient in power generation for EVs, producing 15.9 kWh, while wind turbines also showed significant efficiency at 8.3 kWh. In contrast, piezoelectric materials were less efficient, generating only 22.6 Wh. This variation in power generation had a notable impact on the cruising range of EVs, with solar modules extending it by approximately 10.7 km and wind turbines by about 5.6 km, compared to a minimal extension by piezoelectric materials.
An essential finding of the research was the potential of integrating solar modules and mini wind turbines on a single bus. This combination could generate 24.2 kWh daily, increasing the cruising range by about 16.3 km per day. Such an enhancement could significantly reduce the time buses spend at charging stations, a major challenge in urban areas like the UK where charging infrastructure is scarce. The integration of these technologies could potentially eliminate the need for conventional charging stations, addressing the project's objectives in system design and economic viability.
From an economic perspective, the project demonstrated viability through a comprehensive financial analysis. The initial investment for integrating the renewable energy systems was £57,000, coupled with an annual maintenance cost of £828 and yearly debt payments of £4,381. Despite these costs, the project was financially sustainable, evidenced by the generation of 8.7 MWh of electricity annually, which translated into £6,712 saved per bus in charging costs. Furthermore, each bus's ability to reduce greenhouse gas emissions by two tons could yield an additional £140 annually from selling credits. Even with total annual costs amounting to £5,209, the net annual revenue was £6,850, leading to a positive net yearly cash flow of £1,641. This confirmed the project's economic viability, driven by savings in charging costs and additional revenue from environmental contributions.
2. Materials and Methods
2.1. Methodology
This research meticulously integrates theoretical modeling with computational simulations to explore the integration of energy harvesting systems into the complex energy systems of electric vehicles, specifically double-decked buses. The initial modeling phase informed the subsequent simulations conducted using RETScreen (RETscreen Expert – Professional – 9.0.1.94) for evaluating solar and wind energy potential, Fusion 360 (2.0.16490) for designing the vehicle system architecture, and Ansys (ANSYS 2023 R2) for simulating wind speeds affecting buses. This methodical approach, underpinned by the RETScreen Clean Energy Management Software, also examines the feasibility of incorporating solar panels and mini wind turbines into London's public transportation. The analysis focuses on practicality and benefits, with buses potentially generating 24.2 kWh daily.
Emphasis is placed on weather data analysis, where wind speed variations are considered in relation to the buses' movement and solar irradiance. The study extends to assess environmental and financial impacts, such as GHG emissions reduction and the revenue from GHG reduction credits. Financial viability is scrutinized through metrics like inflation, debt, cost, and cash flow. Finally, risk and sensitivity analyses calculate the Net Present Value (NPV) and Internal Rate of Return (IRR) to assess project feasibility. Figure 6 explains the mains stages of the research.
In parallel, similar methodologies have been employed in studies like Nivas et al. [19], which designed a solar-powered electric vehicle using MATLAB, and Gupta and Kumar [49], who investigated the potential of mounting wind turbines on vehicles. These studies contribute to the understanding of environmental benefits and the progression of energy-efficient technologies within the automotive sector, underscoring the transformative potential of renewable energy in modernizing public transportation.
2.2. Data Collection
The methodology for data collection in this research is designed to ensure that the information gathered on solar panels, wind turbines, and piezoelectric materials is both accurate and relevant to the feasibility and design of energy-harvesting technologies in electric vehicles. Data for solar modules is primarily sourced from secondary sources, such as weather data and manufacturer specifications, including the rooftop area from BYD-ADL and solar panel wattage. Assumptions, such as a standard performance ratio and a module efficiency of 22%, are made to facilitate calculations, considering factors like "maximum power ratings" under optimal conditions and "peak sun hours" that vary by location [11,50]. System losses, which can account for about 25% of output, are also included, along with vehicle weight considerations that affect efficiency [46,50].
For wind energy, the methodology includes collecting data on the bus's front area to deduce the sweep area of wind turbines and assuming an efficiency rate based on previous studies Chen et al. [34]. Wind speed is intricately assessed through CFD simulations with ANSYS Fluent software, considering the bus's structure and local wind conditions to determine the effective wind speed at the turbine.
Piezoelectric materials, with a focus on PVDF for its efficiency and suitability for vehicle tire installation, are evaluated based on the generated power output per unit area under load [44]. The electricity generation capacity is analyzed by calculating the tire-ground contact area and considering the continuous power output during the vehicle's movement.
This comprehensive and systematic approach to data collection, substantiated by empirical values and theoretical assumptions, lays a robust foundation for the subsequent analysis, and ensures the credibility of the study's findings.
2.3. Data Analysis
During the analytical phase, prior to any computational modeling, a theoretical calculation is undertaken to preliminarily ascertain the potential power output of each renewable energy technology, namely solar panels, wind turbines, and piezoelectric materials. This foundational step will draw upon established mathematical formulas, which will be meticulously cataloged in Table 2 for clarity and ease of reference.
In conclusion, the study's methodology has effectively navigated through the complexities of data collection and computational analysis, ensuring a robust evaluation of renewable energy technologies for electric buses. The thorough and systematic approach underpins the study's credibility, providing a foundation for significant findings. Moving into the Results section, the study will present how the collected data and theoretical models manifest in real-world applications, unveiling the potential impact of renewable energy integration on public transportation efficiency.
3. Results
3.1. Introduction
In this section, the theoretical power generation through each technology is calculated. Computer simulations are used to determine certain parameters, such as wind speed blowing on the front face of the bus when it is in motion. The following subsections delves into the detail calculations of each technology.
3.2. Solar Modules
The first technology to evaluate its power output is solar modules to be installed on the rooftop and sides of the double-decked buses. The calculation below is a theoretical evaluation of its power output.
- Solar Module Power Output Calculation

Table 3.
Weather Data [56].
Table 3.
Weather Data [56].
| User defined area | |
|---|---|
| Parameter | Value |
| Area (London) | 2013.00 km² |
| Perimeter | 183.02 km |
| Report generated | 14 July 2023, 16:16 |
| Area Info | |
| Parameters | Value (min-max range) |
| Specific photovoltaic power output | 2.80 – 2.89 kWh/kWp |
| Direct normal irradiation | 2.39 – 2.52 kWh/m² |
| Global horizontal irradiation | 2.81 – 2.90 kWh/m² |
| Diffuse horizontal irradiation | 1.57 – 1.58 kWh/m² |
| Global tilted irradiation | 3.30 – 3.41 kWh/m² |
| Optimum tilt of PV modules | 36 – 38 °C |
| Air temperature | 10.3 – 11.1 °C |
| Terrain elevation | -1 – 227 m |
Simplified equation to calculate solar module (SM) power output (kWh):
- Solar Power output (kwh) = wattage ∗ peak sun hours ∗ performance ratio
Global formula for calculating solar panel power output (kWh):
- E = A ∗ r ∗ H ∗ PR
Where:
- E = Energy (kWh)
- A = Area (m²)
- r = Efficiency
- H = Annual average solar radiation (kWh/m²/day)
- PR = Performance Ratio, typically 0.75
- Bus Area Measurements
Figure 7.
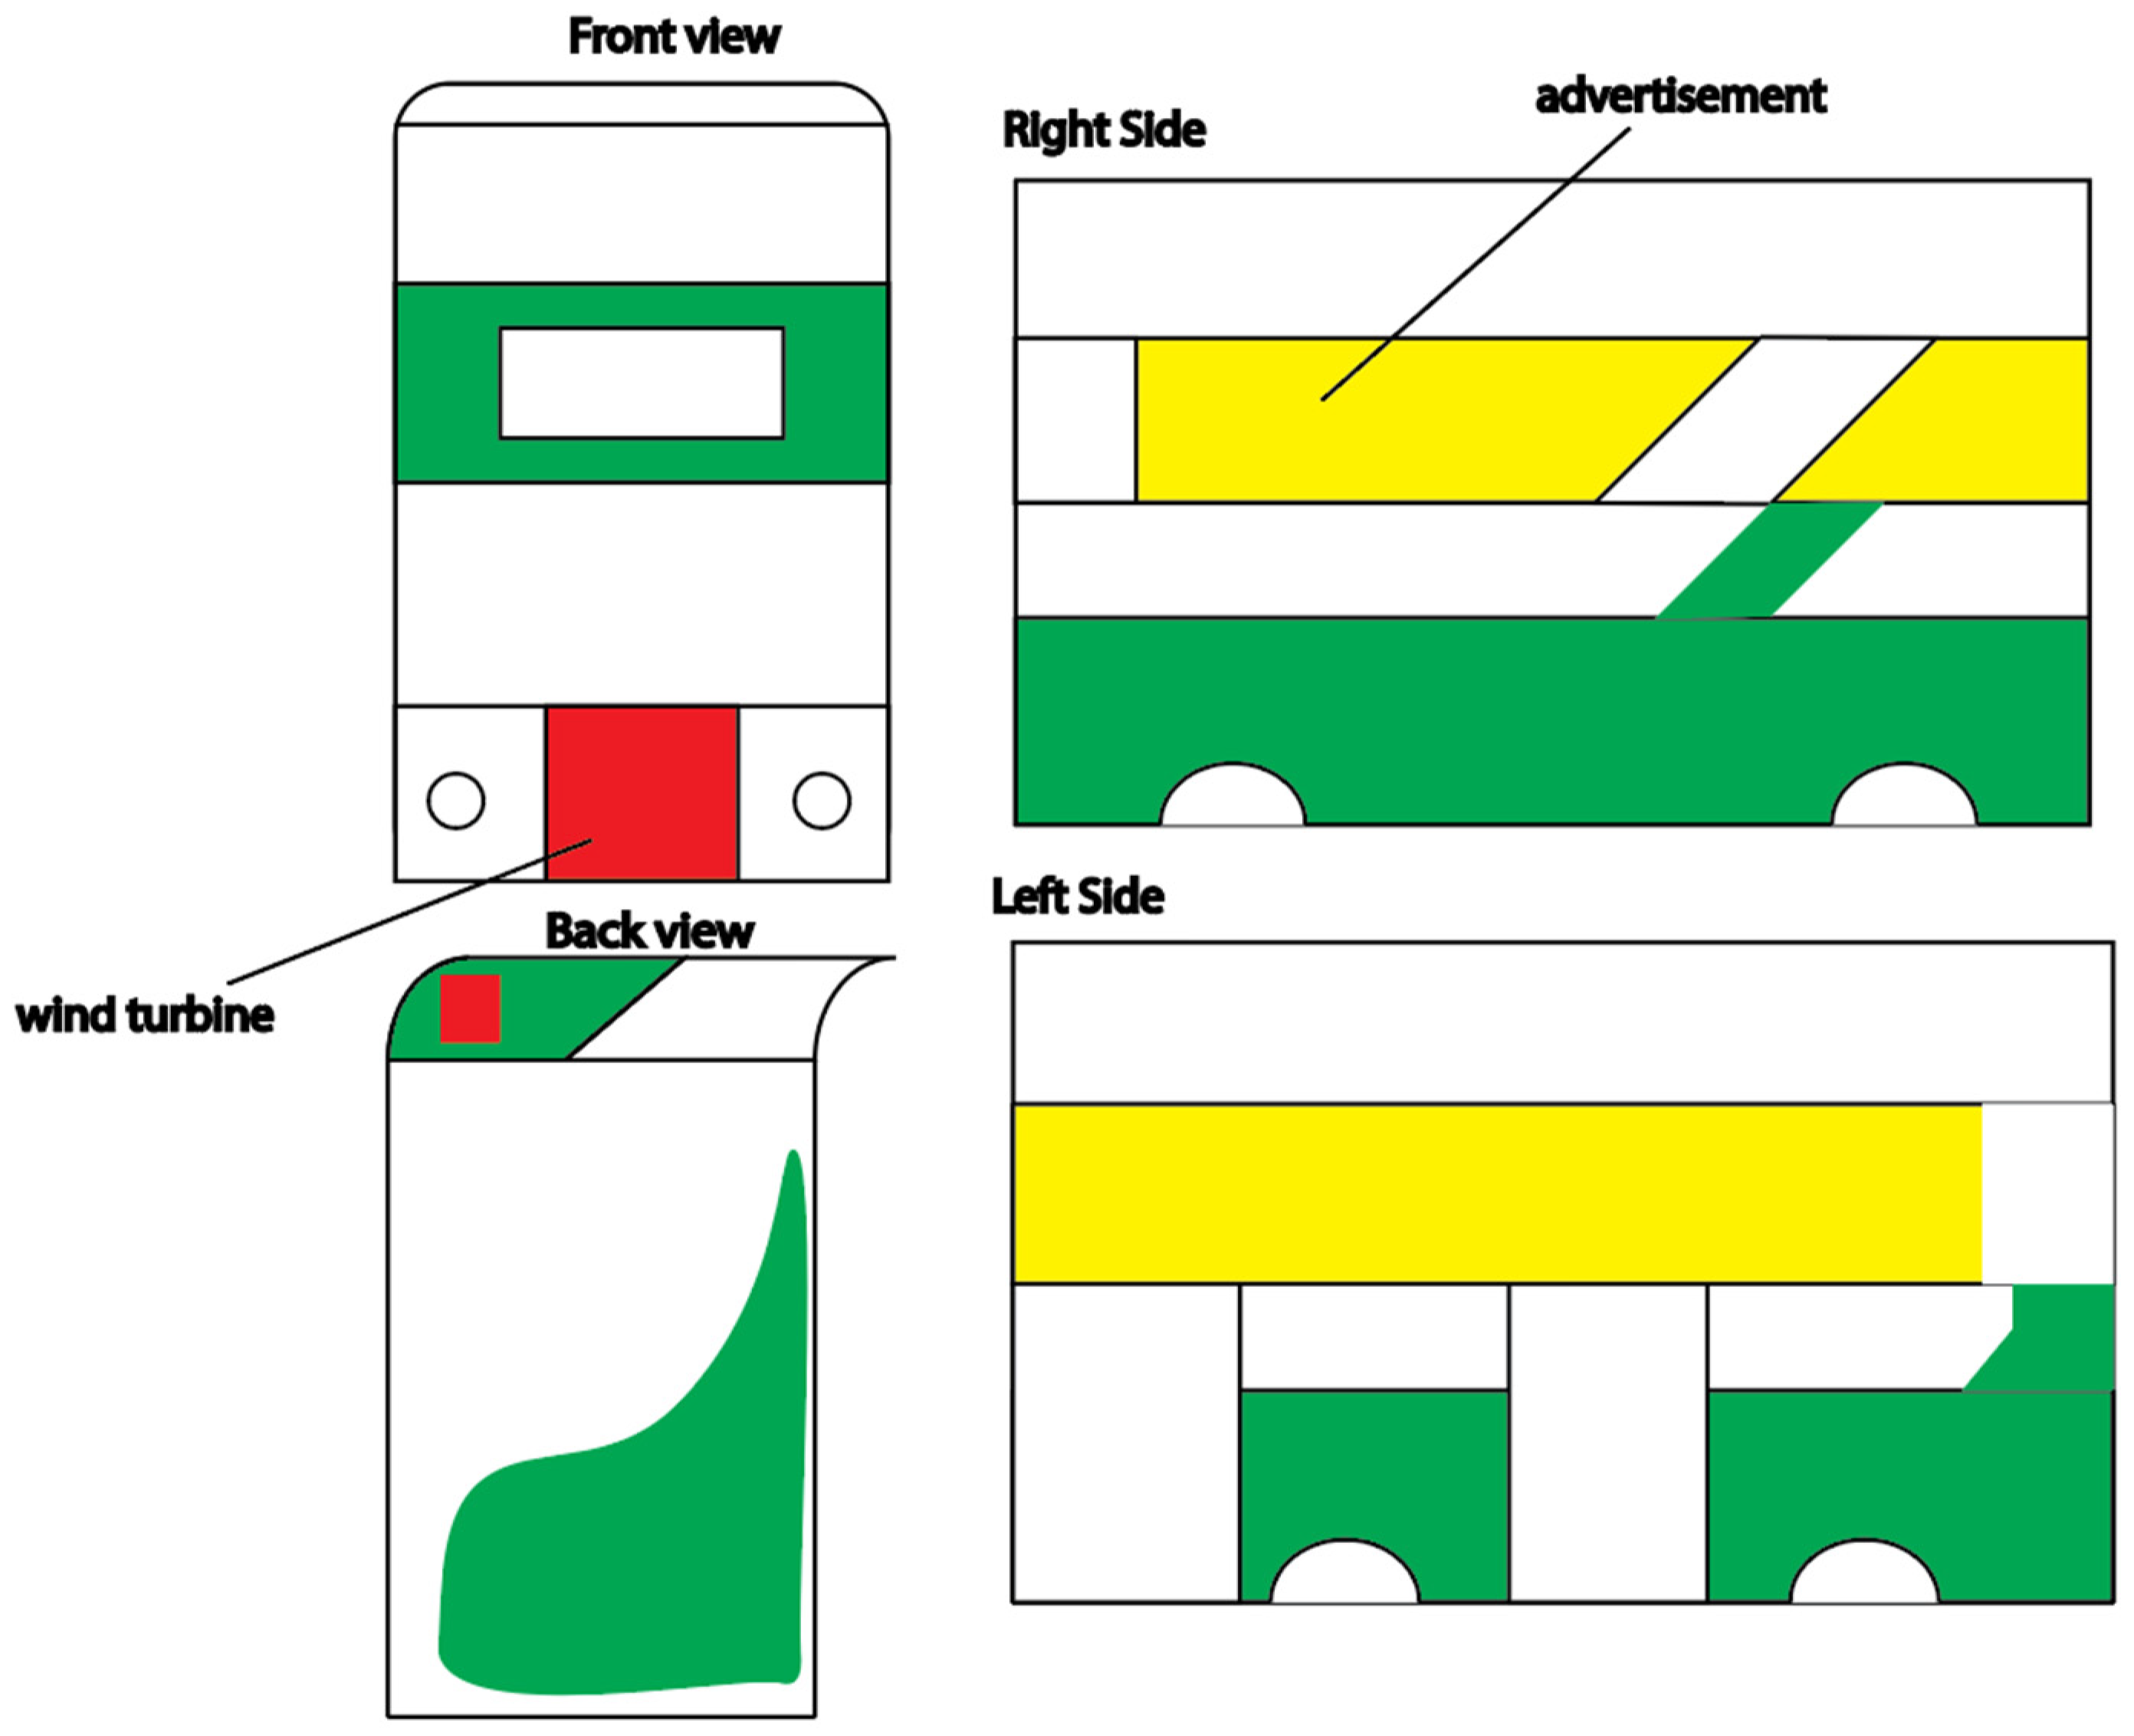
layout of the available area (highlighted in green) on the bus to install solar modules. Area highlighted in yellow is mostly used for advertisement. White and Red areas are used for windows, doors, ventilation, and wind turbine [57].
Figure 7.
layout of the available area (highlighted in green) on the bus to install solar modules. Area highlighted in yellow is mostly used for advertisement. White and Red areas are used for windows, doors, ventilation, and wind turbine [57].
- Area of bus roof top:
- Area of the sides including the windows, doors, and all the other parts:
- A = legth (m) ∗ height (m) ∗ 2(both sides) + width (m) ∗ height (m) = 10.8 ∗ 4.3 ∗ 2 + 2.55 ∗ 4.3 = 103.85 m2
As it is obvious that most of the area on the bus is used for windows, doors, advertisement, and ventilation systems. Therefore, the only useful area with the potential of integrating solar modules accounts for approximately 20 percent of the area.
It must also be noted, it was proven experimentally that the output power generation of the sides is only 0.615 compared to the output power generation of the rooftop [11]. Therefore, the ratio is introduced in the main equation.
- Known Parameters
Table 4.
known parameters.
| Parameter | Value | Source |
|---|---|---|
| Area (A) | 27.54 m² (horizontally placed solar panels) / 20.77 m² (vertically placed solar panels) | [57] |
| Efficiency (r) | 22% or 0.22 | [11] |
| Daily direct normal solar irradiation (H) | 2.39 kWh/m² | Table 3 |
| Performance Ratio (PR) | 0.75 | [50] |
The following equation is used to calculate the power output:
- E = A ∗ r ∗ H ∗ PR
- Calculated Parameters
Table 5.
calculated parameters.
| Parameter | Value |
|---|---|
| Energy (E) | 10.86 kWh/day (horizontal) / 5.04 kWh/day (vertical) |
| Total Power Output (E_t) | 15.9 kWh/day |
| Cruising Range Increase | 10.72 km/day |
The weight of SMs also adds to the existing weight of the buses, and hence decreases the cruising range of the buses. For this research, the weight of the SMs is negligible because there is not enough information of the specific type of the SM chosen for this research. Also, according to literature, the weight of III-V solar cells is very little [58].
3.2. Mini-Wind Turbine
The second technology to be installed on the buses is having a mini-wind turbine in the front face of the bus. To assess the amount of power output, the global formula to calculate power output of wind turbines is used [51].
And available wind power formula is as follows,
(Pwind = available wind power, A= sweep area, ρ = air density (usually 1.225 kg/m3), V = wind speed (m/s))
- Sweep area of WT:
For horizontal axis wind turbine (HAWT):
L: blade length or radius of horizontal axis turbine
Sweep area of the wind in the front face of the bus when L is (50 cm)
The efficiency of wind turbines usually does not exceed Boltz’s limit which is 59%. In a study, the efficiency of small wind turbines has been investigated for different speeds with added flanged diffusers. The researchers concluded that the efficiency of wind turbines exposed to different wind speeds is 0.45 on average Chen et al. [34].
To find the wind speed at the height of one meter, Power-law model [53] has been utilised.
- Vz is the wind speed at height z (meters)
- Vref is the reference wind speed at height Zref (usually 10 meters)
- Z is the desired height (1 meter in this case)
- Zref is the reference height (10 meters)
- α is friction coefficient or the power-law exponent (also called the Hellmann exponent), which depends on the surface roughness and atmospheric stability
| Landscape type | Friction coefficient α |
|---|---|
| Lakes, ocean and smooth hard ground | 0.10 |
| Grasslands (ground level) | 0.15 |
| Tall crops, hedges and shrubs | 0.20 |
| Heavily forested land | 0.25 |
| Small town with some trees and shrubs | 0.30 |
| City areas with high rise buildings | 0.40 |
Using the power-law model with an alpha value of 0.4, the estimated wind speed at a height of 1 meter is approximately 1.073 m/s.
The wind speed blowing on the mini wind turbine in the front face of the bus is changing since the vehicle is moving and thus generates more wind speed in the front face called effective wind speed (Veffective). To find this effective wind speed, a thorough computational fluid dynamics (CFD) analysis is carried out to find out (Veffective). ANSYS Fluid is used for the CFD analysis, and the computation is run six times, each time for a different wind speed (5, 10, 15, 20, 25, 30) mph. The results are shown below.
Figure 8 shows the results of the CFD analysis for six different speeds of the vehicle. The air streamline colour can be matched with the legend to show the effective wind speed. The results of the effective wind speed are summarized in Table 7 below. According to the table, the maximum speed is set to be 30 mph because in most areas of London the speed limit is set to be not more than 30 mph taken from a map published by Transport for London [63].
Figure 8.
CFD analysis of the bus for different speeds. velocity streamlines around the bus shows different effective wind speed [62].
Figure 8.
CFD analysis of the bus for different speeds. velocity streamlines around the bus shows different effective wind speed [62].
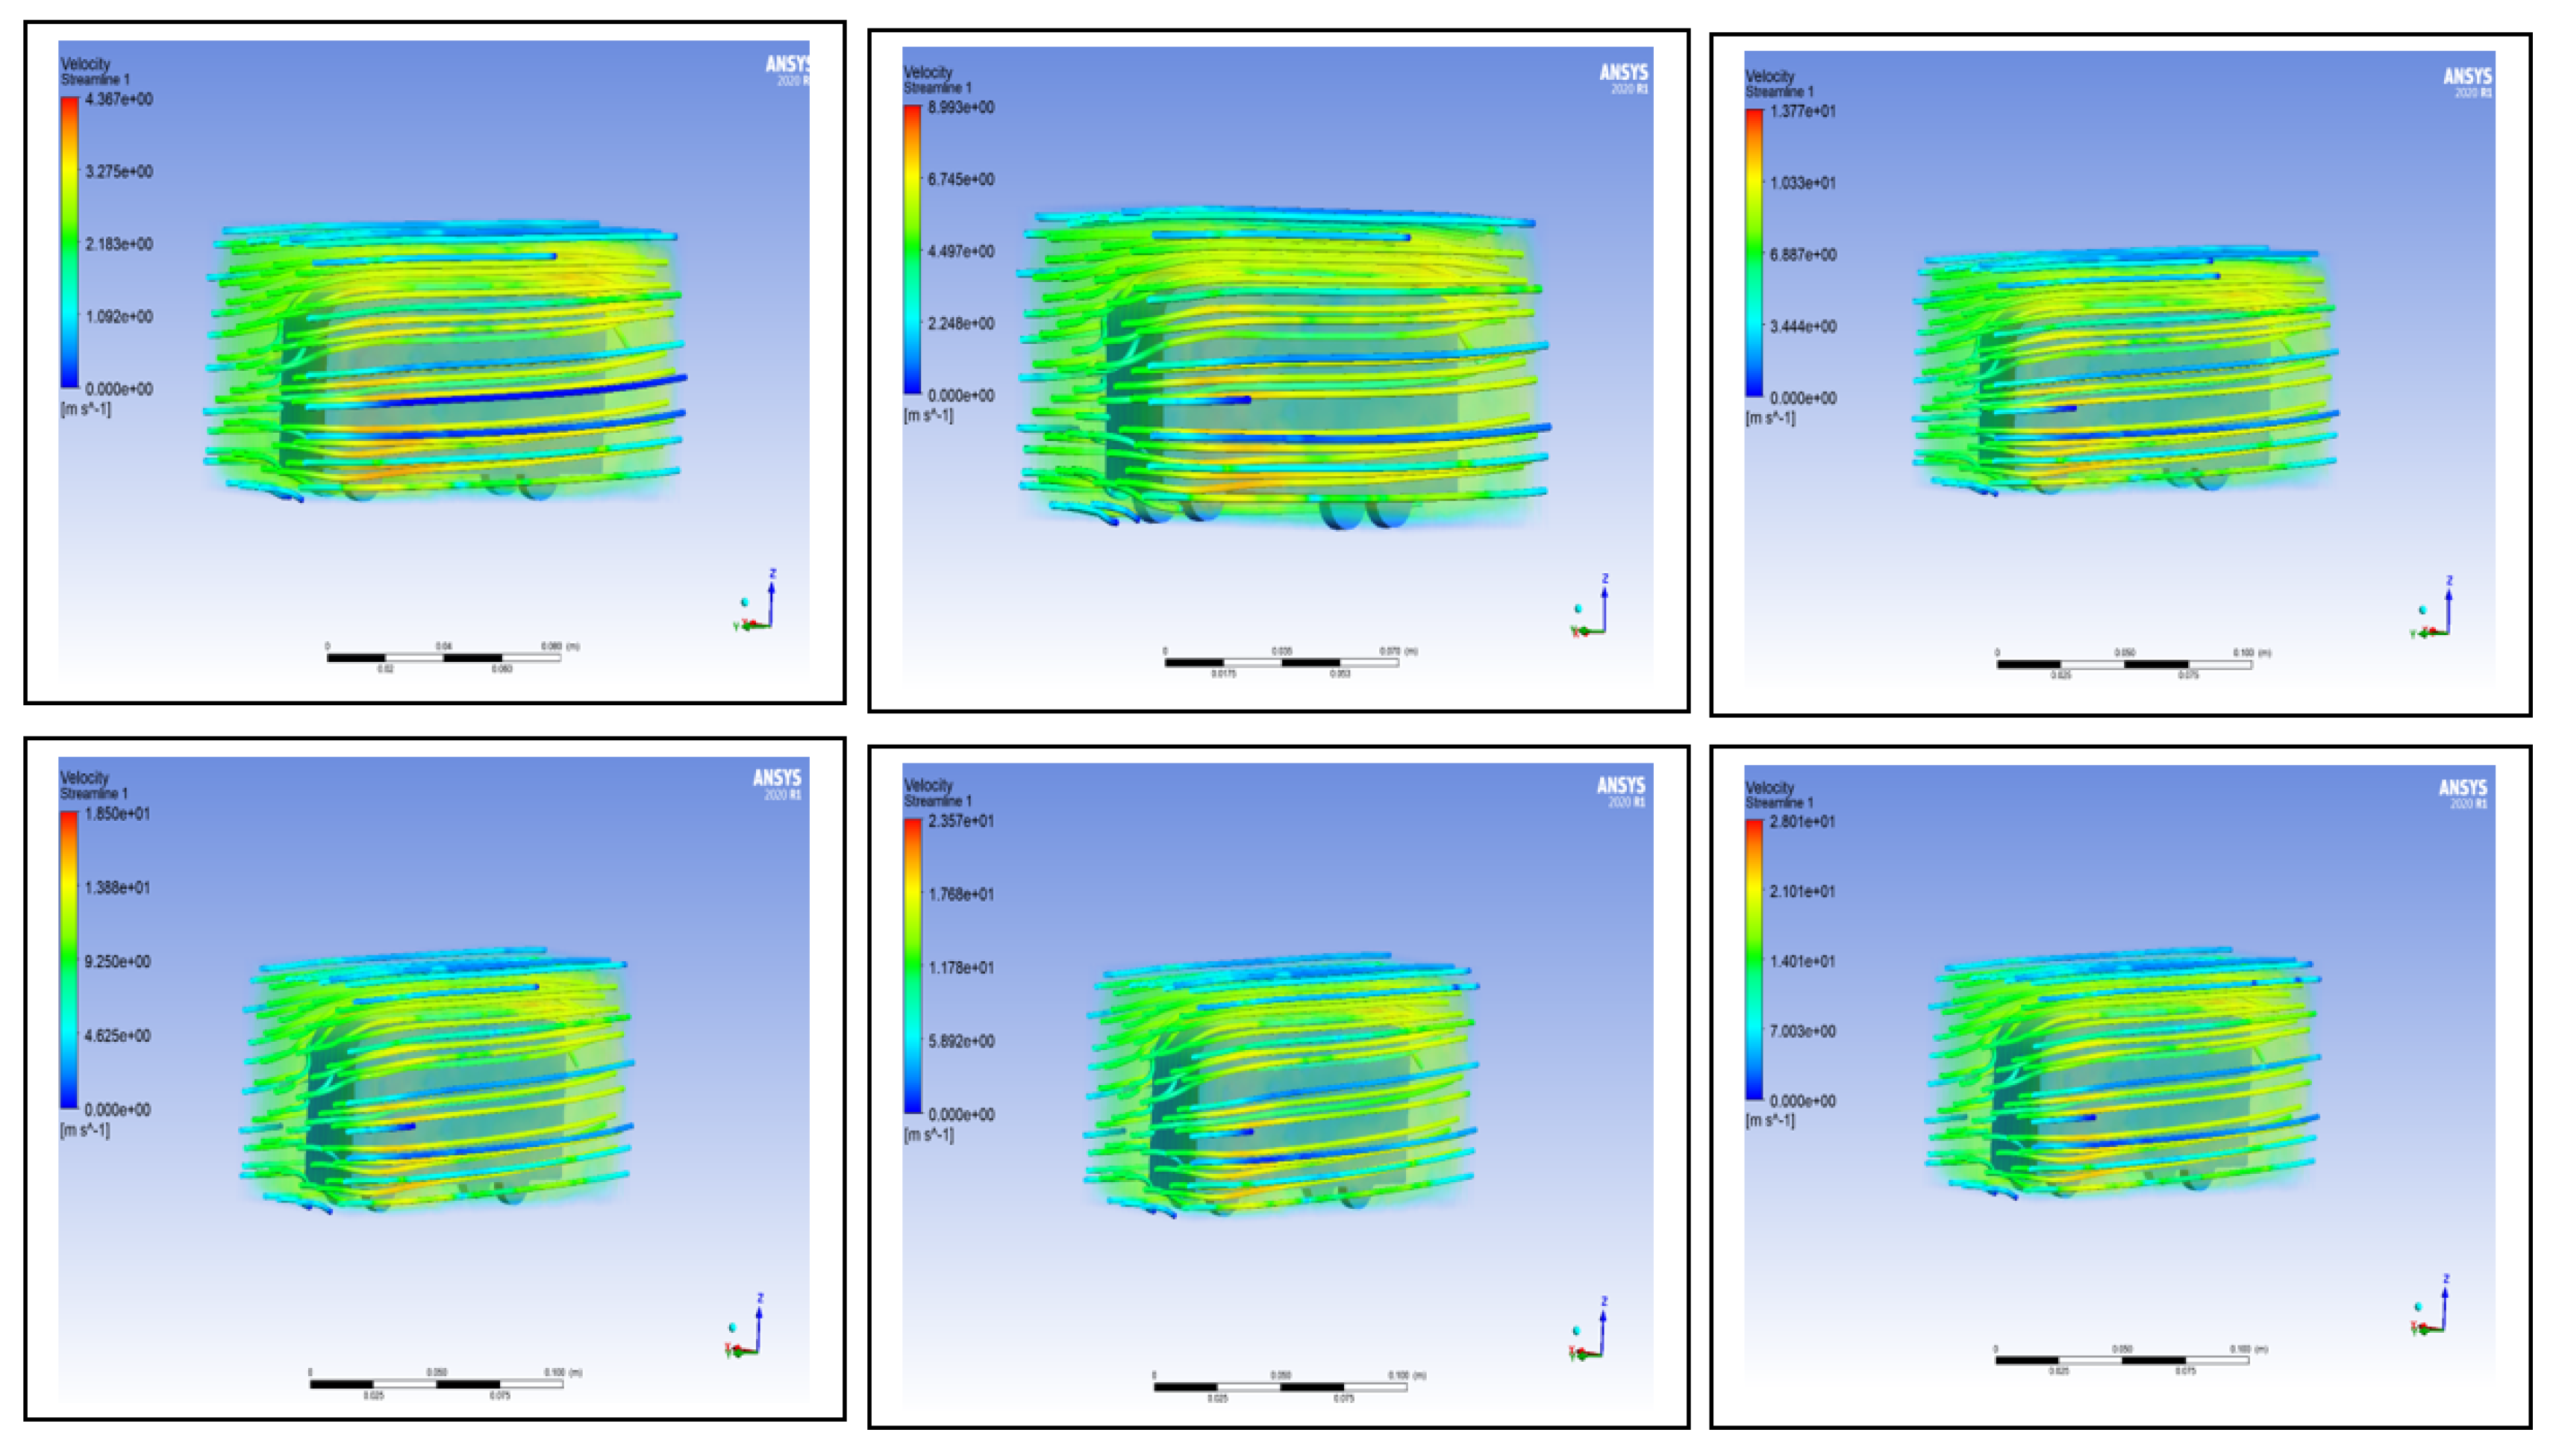
Table 7.
speed of the vehicle compared to the effective wind speed blowing on the front face of the bus.
Table 7.
speed of the vehicle compared to the effective wind speed blowing on the front face of the bus.
| mph | m/s | Effective Wind speed on moving vehicle (m/s) |
|---|---|---|
| 5 | 2.24 | 2.18 |
| 10 | 4.47 | 4.5 |
| 15 | 6.71 | 6.89 |
| 20 | 8.94 | 9.25 |
| 25 | 11.18 | 11.78 |
| 30 | 13.41 | 14.01 |
It should be noted that the direction of the wind might slightly affect the power generation of the wind turbine though the direction that blows directly on the front face of the vehicle generates most power. However, for the case of wind direction blowing on the sides or the back of the bus might cause the wind turbine to generate slightly less power outage. In this case, since the effective wind speed is generated by the direction of the bus and speed, the direction of the atmospheric wind does not affect the effective wind speed and thereby the power outage of the wind turbines.
After finding the effective wind speed (Veffective), the power outage generated by the wind turbine can be found for each speed of the bus, and the results are summarized in Table 8 below.
Table 8.
results of the wind turbine power outage for different speed of the bus.
| Air density (kg/m³) | Effective velocity (m/s) | Sweep area (m²) | WT efficiency | Power output (wh) |
|---|---|---|---|---|
| 1.225 | 2.18 | 0.79 | 0.45 | 2.2 |
| 1.225 | 4.5 | 0.79 | 0.45 | 22.66 |
| 1.225 | 6.89 | 0.79 | 0.45 | 56.72 |
| 1.225 | 9.25 | 0.79 | 0.45 | 220.16 |
| 1.225 | 11.78 | 0.79 | 0.45 | 397.16 |
| 1.225 | 14.01 | 0.79 | 0.45 | 2067.35 |
Taking the average power outage of the buses in an hour, it is 461.1 Wh. Also, the buses in London usually operate 18 hours a day. Therefore, the power harnessed by the buses in London via the wind turbines is equal to 8.3 kWh in a day. The power generated through the wind turbines which is equal to 8.3 kWh can increase the cruising range by 5.6 km a day.
3.3. Piezo Electricity
This section details the use of polyvinylidene fluoride (PVDF) polymer in piezoelectric technology for energy harvesting in bus tires.
- Introduction to PVDF in Piezoelectric Technology: while ceramic-based materials are commonly used for their high piezoelectric constant, PVDF has been identified as an efficient alternative for large-scale energy harvesting. Its flexibility and durability make it suitable for application in vehicle tires [44].
- Electricity Generation from Bus Tires: placing PVDF in the outer layer of car tires can generate electricity. This is based on the contact area between the tires and the ground.
-
Calculation of Power Output: To calculate the power output from the tires, the following steps are undertaken:
- o
-
Contact Area Calculation:
- -
- Each tire supports 4800 kg of the total 19200 kg bus weight [57].
- -
- Using a load per square cm value of 13.6 kg/cm², the contact area per tire is calculated to be 352.94 cm².
- o
-
Power Output Calculation:
- -
- PVDF polymer induces a power output of 0.00089 W/cm² [44].
- -
- The power output per tire is 0.31411 W (0.00089 W/cm² * 352.94 cm²).
- o
-
Total Power Output Calculation:
- -
- For all four tires, the total power output is 1.25644 W (0.31411 W * 4).
- o
-
Daily Energy Generation Calculation:
- -
- Assuming the bus operates for 18 hours a day, the total energy generated is 22.61592 Wh.
-
Energy Efficiency and Distance Calculation:
- o
- The energy required to drive a unit distance is calculated as 2387.5 Wh/km [57].
- o
- Using the 22.6 Wh generated, the bus can drive approximately 0.00947 km, under ideal conditions.
It should be noted that these calculations are based on several assumptions and may not fully represent real-world scenarios, which include varying road conditions, traffic, and driving behavior.
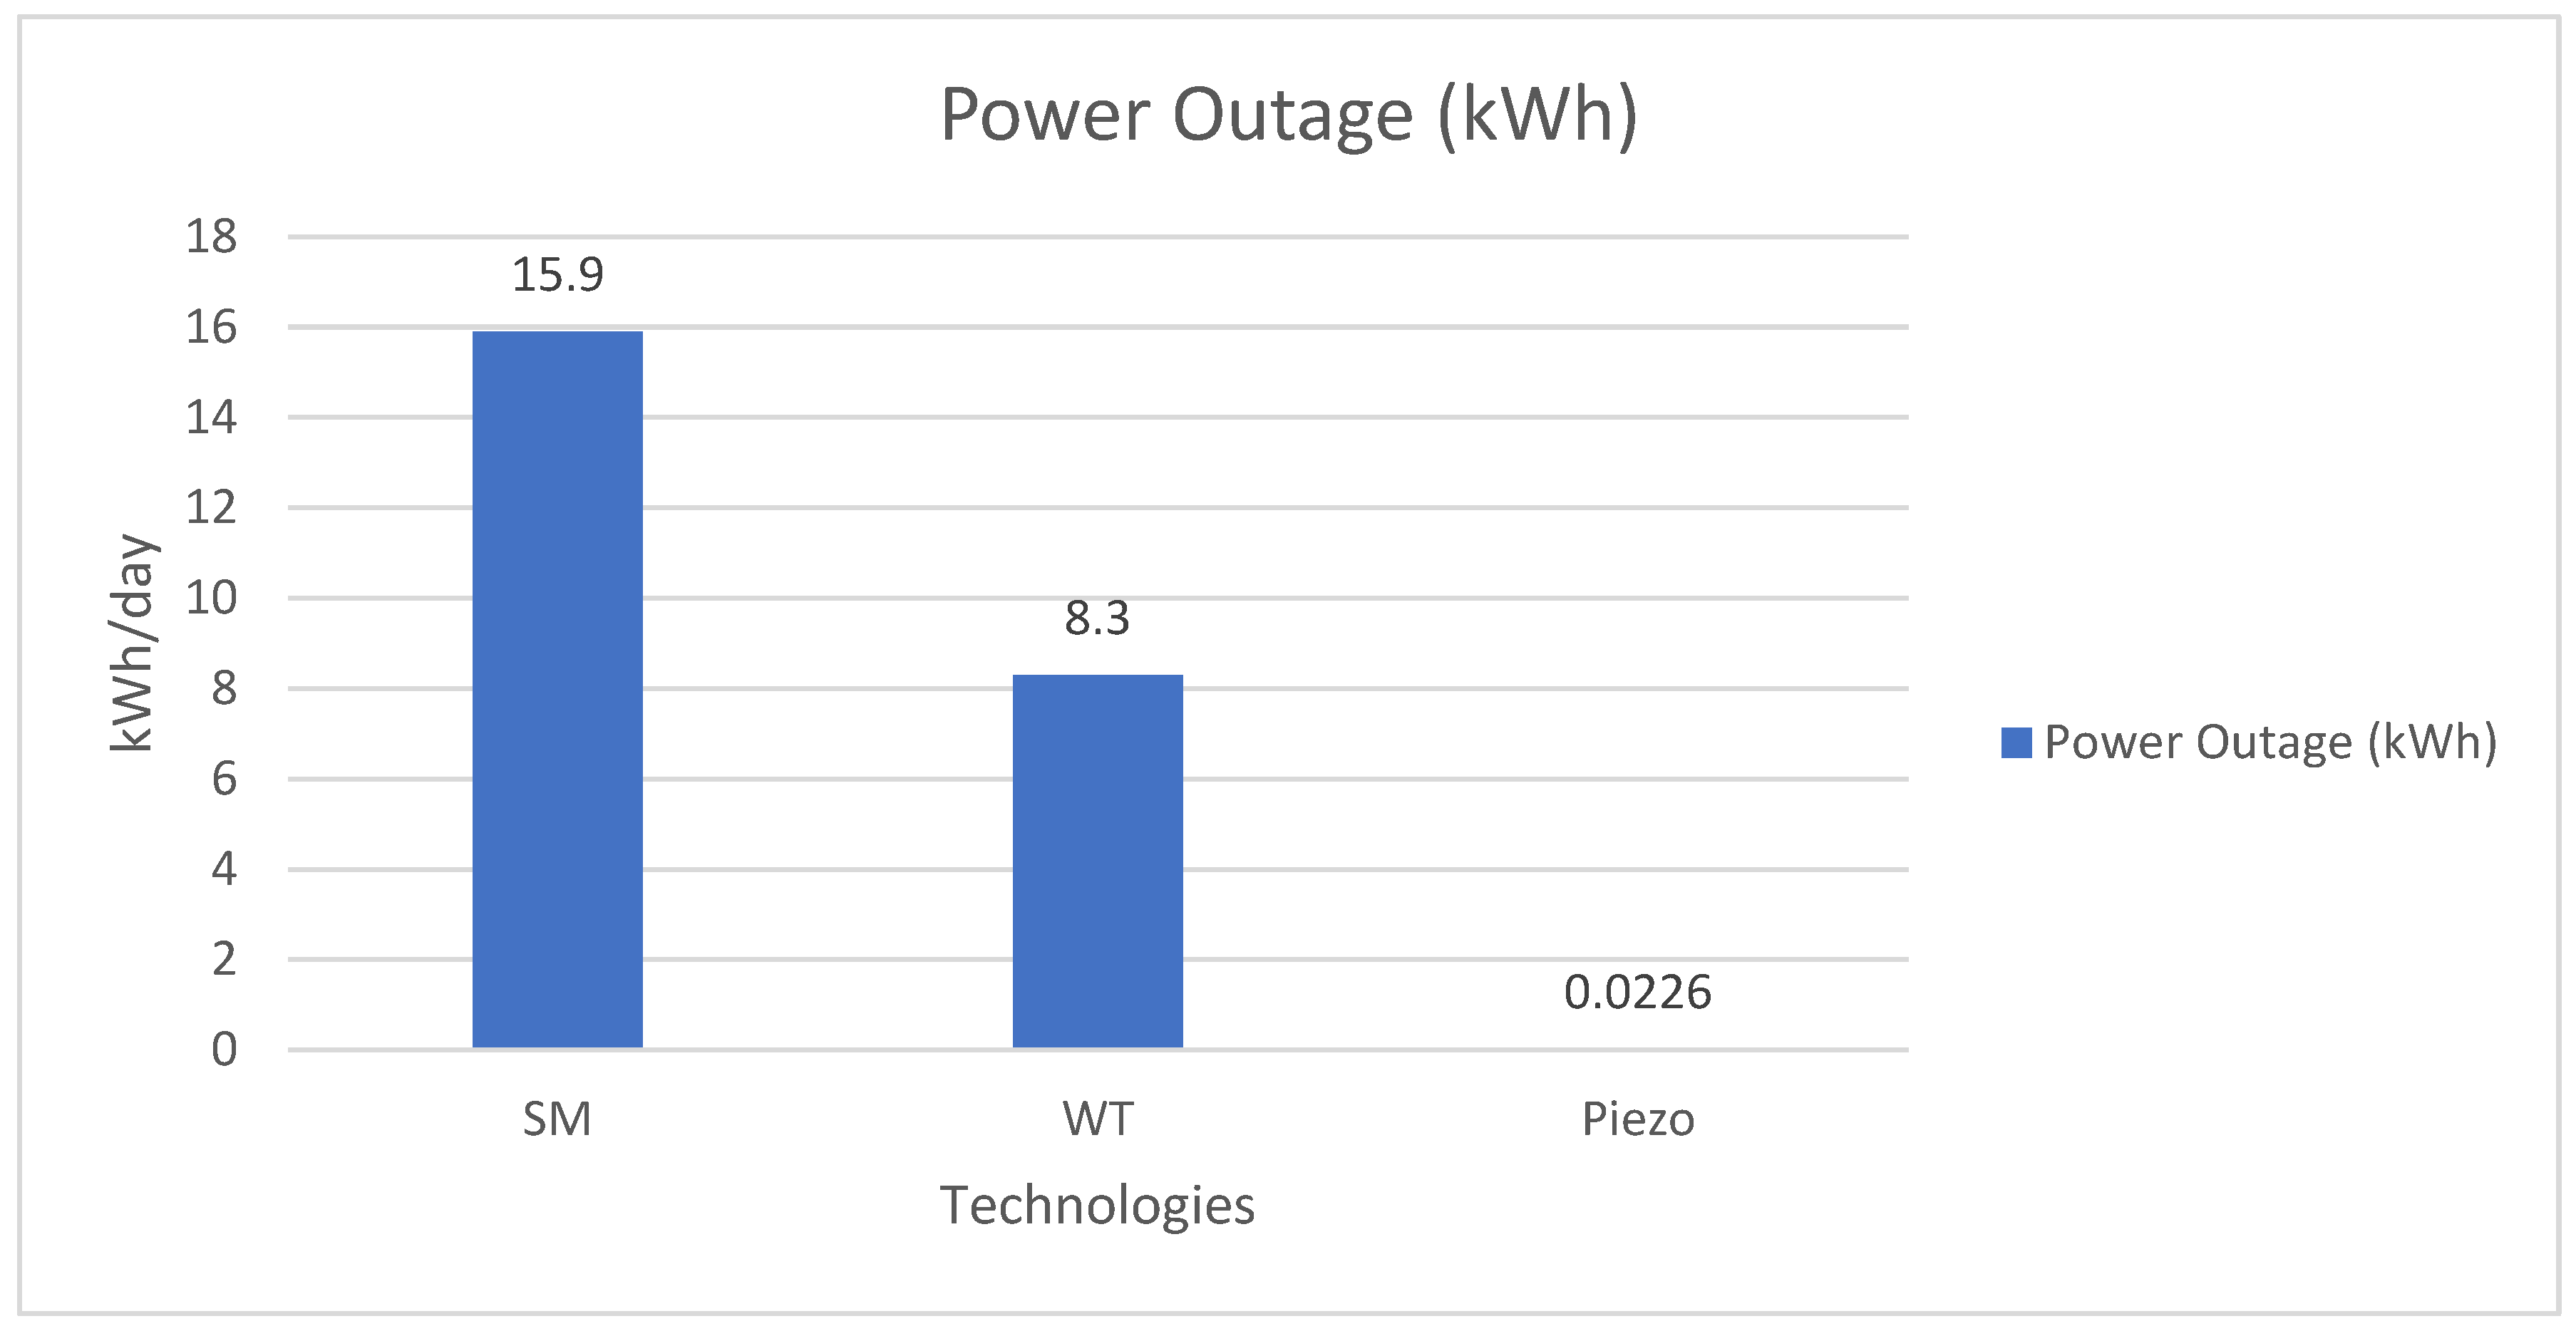
The study conducted thorough theoretical calculations on selected technologies and discovered varying levels of power generation. Solar modules proved the most efficient, generating 15.9 kWh, followed by wind turbines at 8.3 kWh and piezoelectric materials at 0.0226 kWh as depicted in Figure 6. This variance significantly impacts the cruising range of electric vehicles; solar modules can extend it by approximately 10.7 km, wind turbines by about 5.6 km, and piezoelectric materials by just around 0.015 km. The findings suggest that investing in piezoelectric materials for tire integration is economically less viable. However, further investigation into solar modules and wind turbines is advised to understand their potential in reducing dependence on public charging infrastructure.
Figure 6.
power outage of Solar Modules (SM), Wind Turbine (WT), and Piezo Materials.
Solar modules and mini wind turbines show promise in power output capabilities. Integrating both technologies on a single bus could generate 24.2 kWh daily, increasing the cruising range by about 16.3 km a day. This enhancement could significantly reduce the time buses spend at charging stations, a notable challenge in the United Kingdom, especially in London. The scarcity of charging stations complicates the scheduling of electric vehicle charging. Chargers vary in charging speed (slow, fast, rapid, ultra-rapid), time required, and cost. However, the combined use of solar modules and mini wind turbines could provide a daily renewable energy yield of 24.2 kWh, potentially eliminating the need for charging stations and their associated costs. Table 9 in the study details the different types of chargers, the time and cost for each, and the potential savings from integrating these technologies on a single bus.
| Type of chargers | Charging Time per kWh (min) | Cost (£) | Time Saved (min) per day | Saved Cost (£) per day |
|---|---|---|---|---|
| Slow (3.7 kW) | 16.8 | Not available | 406.56 | Not available |
| Fast (22 kW) | 4.0 | 0.63 | 96.8 | 15.25 |
| Rapid (50 kW) | 1.6 | 0.73 | 38.72 | 17.67 |
| Ultra Rapid (150 kW) | 0.8 | 0.77 | 19.36 | 18.63 |
The next sub-section of the study includes a feasibility study to assess the financial viability of integrating solar modules and mini wind turbines on a single bus, capable of generating 24.2 kWh daily. This feasibility study is crucial for future decisions in energy management and environmental sustainability in urban public transportation networks.
3.4. Feasibility Analysis of Solar Modules and Wind Turbines Fitted to Electric Buses
This feasibility report, utilizing RETScreen Clean Energy Management Software, investigates the introduction of renewable energy in London's transportation, focusing on solar panels and mini wind turbines on double-decker buses. It examines the practicality of installing these systems to generate 24.2 kWh daily. The study begins with weather data, particularly wind speed and solar irradiation, crucial for outcome accuracy. Adjustments in wind speed data are made to reflect changes when buses are in motion. The report also evaluates the environmental benefits, particularly in reducing greenhouse gases (GHGs) and the potential revenue from selling GHG reduction credits. Financial aspects, including inflation, debt ratio, costs, revenue, and annual cash flow, are thoroughly analyzed. Table 10 provides the main parameters for this analysis. The report concludes with a risk and sensitivity assessment, determining the project's feasibility through Net Present Value (NPV) and Internal Rate of Return (IRR) calculations.
The project's success hinges on climate and location factors, as high wind speeds and solar irradiation significantly boost the electricity output of the renewable technologies used. Table 11 displays critical climate data, including heating and cooling design temperatures, earth temperature amplitude, and monthly weather specifics. This data is essential for understanding the conditions under which the photovoltaic system and wind turbines will function, impacting their efficiency and lifespan. It's important to note that the only tailored weather data is the average wind speed, set at 8.1 m/s, to account for the dynamic motion of the bus, which increases wind speed when the bus is moving, and wind hits its front face.
The project's financial viability is enhanced by its environmental impact, with solar modules and wind turbines reducing greenhouse gas (GHG) emissions by an impressive 93% compared to conventional fossil fuel methods. This significant reduction shows a drop from 2.1 tons to 0.1 ton of CO2 emissions, equivalent to removing the emissions of 0.4 cars and light trucks. Therefore, these renewable energy technologies not only offer economic benefits but also play a crucial role in global climate change mitigation.
This subsection delves into key financial aspects of the project, including inflation rate, discount rate, reinvestment rate, and the project's projected lifespan. It outlines the financial structure, focusing on debt ratio, equity, and debt interest rates. The revenue projections consider savings from bus charging and CO2 reduction benefits. Initial costs for solar panels and wind turbines are also examined.
Table 12 outlines the financial parameters set at the start of the analysis. The inflation rate is fixed at 2.8%, reflecting the average rate in the UK from 1989 to 2023 [66]. Other parameters like discount rate, reinvestment rate, project life, and debt details are set according to RETScreen values. The debt ratio is set at 70%, with a 7% interest rate on loans repayable over 15 years.
Table 13 details revenue sources, including electricity generation and GHG reduction credits. Annually, 8.7 MWh of electricity is generated, saving £6,712 per bus in charging costs. Additionally, each bus reduces GHG emissions by two tons, potentially generating £140 annually from selling these credits.
Table 14 presents initial and annual costs, debt payments, and savings. The initial investment for the renewable energy systems is £57,000, with an annual maintenance cost of £828 and debt payments amounting to £4,381. The total annual cost is £5,209, while the net annual revenue from electricity generation and GHG reduction is £6,850. Consequently, the net yearly cash flow is £1,641. This financial analysis emphasizes that savings and revenue stem from reduced charging costs, not from selling excess energy back to the grid.
The feasibility analysis of the project crucially includes evaluating cash flows. This cash flow analysis provides a detailed view of the financial inflows and outflows related to the installation of solar panels and mini wind turbines on double-decker buses in London. It allows stakeholders to assess potential profitability and liquidity, helping them make informed decisions about the project's viability, identify financial risks, and ensure sufficient operational funding. This subsection focuses on the projected cash flow statement, highlighting key areas and offering insights into the financial sustainability of this innovative endeavor.
Table 15 displays the pre-tax and cumulative cash flow over 20 years, showing a continuous increase in inward cash flow. In year zero, the pre-tax cash flow is a negative £17,100, representing the initial investment cost, excluding any loans. Also, the pre-tax cash flow over 20 years illustrates an increase from the first year to the end of the project. Additionally, cumulative cash flow indicates that the project reaches a positive cash flow around its eighth year, also known as the payback period.
The financial evaluation of renewable energy projects is critically anchored on key metrics, notably the Net Present Value (NPV) and the Internal Rate of Return (IRR), which offer insights into profitability and return on investment. As indicated in Table 16, the NPV stands at 11,256 GBP, suggesting a positive outcome from the project's future cash flows discounted back to the present value. The IRR for equity and assets is reported at 14.8% and 2.7%, respectively, indicating a robust potential return for equity investors and a modest return for the assets overall.
The Modified Internal Rate of Return (MIRR) for equity and assets is 11.8% and 5.3%, respectively, which adjusts the IRR to account for the difference in reinvestment rate and financing rate, providing a more accurate reflection of the investment's profitability.
The project's simple payback period is 9.5 years, with an equity payback period of 7.9 years, which delineates the time needed to recoup the initial investment from net cash flows. The Benefit-Cost (B-C) ratio is 1.7, highlighting that the benefits of the project exceed the costs by 70%. A Debt Service Coverage ratio of 1.4 further confirms the project’s ability to generate sufficient earnings to cover its debts.
Additionally, the analysis considers the costs associated with greenhouse gas (GHG) reduction, showing a cost of -298 GBP/tCO2, which implies a credit or revenue per ton of CO2 reduced, and an energy production cost of 0.778 GBP/kWh.
In summary, the financial viability of renewable energy projects, as evidenced by the favorable NPV and IRR figures, indicates a solid potential for profitability. The project's ability to generate adequate returns and savings, alongside a reasonable payback period and a positive B-C ratio, reflects a sound investment. However, it's crucial for stakeholders to weigh these optimistic forecasts against the inherent uncertainties, with thorough planning and risk assessment being essential throughout the project's lifecycle.
Table 16.
overall financial viability [68].
Table 16.
overall financial viability [68].
| Metric | Value |
|---|---|
| Pre-tax IRR - equity | 14.8% |
| Pre-tax MIRR - equity | 11.8% |
| Pre-tax IRR - assets | 2.7% |
| Pre-tax MIRR - assets | 5.3% |
| Simple payback | 9.5 yr |
| Equity payback | 7.9 yr |
| Net Present Value (NPV) | 11,256 GBP |
| Annual life cycle savings | 1,233 GBP/yr |
| Benefit-Cost (B-C) ratio | 1.7 |
| Debt service coverage | 1.4 |
| GHG reduction cost | -298 GBP/tCO2 |
| Energy production cost | 0.778 GBP/kWh |
4. Discussion
This research study on integrating renewable energy technologies into electric buses has significant implications for bus manufacturers, fleet operators, and researchers in the field of sustainable transportation.
For bus manufacturers, the findings emphasize the efficiency and potential of integrating solar modules and wind turbines into bus designs. Solar modules are particularly effective, generating 15.9 kWh, while wind turbines contribute 8.3 kWh. This significant power generation capability extends the cruising range of electric buses, necessitating a thoughtful design approach. Manufacturers must balance the added weight and aerodynamics with the energy generation capabilities to optimize system architecture. Economically, this integration emerges as a prudent investment, with an initial cost of £57,000 and low annual maintenance expenses leading to positive annual cash flow. This economic viability, primarily driven by savings in charging costs, positions renewable energy technologies as a key strategy for enhancing operational efficiency and sustainability in bus designs.
Fleet operators stand to gain transformative benefits from the integration of these technologies. Incorporating solar and wind energy systems can significantly reduce the time buses spend at charging stations, a major operational challenge in densely populated urban areas. This reduction in charging time not only streamlines fleet operations but also translates into substantial cost savings. The integration could save thousands per bus annually in charging costs, making it a financially attractive option for fleet operators. Moreover, additional revenue streams, such as greenhouse gas reduction credits, augment these savings.
For researchers in sustainable transportation, these findings open new avenues for exploration and innovation. They highlight the potential of renewable energy technologies like solar modules and wind turbines in enhancing bus efficiency and sustainability. Future research can focus on optimizing these technologies for broader application in public transportation, addressing integration challenges specific to different vehicle types, and evaluating long-term durability and maintenance needs. Furthermore, these findings contribute significantly to the existing body of knowledge in sustainability, providing empirical evidence that supports the viability of renewable energy sources in reducing dependency on traditional charging infrastructures. This research enriches the dialogue around sustainable practices, emphasizing the practicality and economic feasibility of integrating renewable energy technologies into operational frameworks.
However, the study also underscores the need for real-world validation of theoretical models and computational simulations. Researchers are encouraged to conduct experimental studies that replicate real-world conditions more accurately, ensuring that the theoretical benefits of renewable energy integration are attainable in practice. This aspect is crucial for bridging the gap between theory and real-world application, furthering the advancement of sustainable transportation.
5. Conclusions and Future Work
In concluding, this comprehensive and systematic study on integrating renewable energy technologies into electric buses has generated a series of overall conclusions, which are summarized as follows:
- The study examines the scope for key underpinning technologies to be adopted on double-decker electric buses in London in the UK according to an engineering modelling approach underpinned by techno-economic analysis.
- The solar modules are placed on the rooftop and sides of the bus generating 15.9 kWh/day and the wind turbine in the front bumper of the bus generates 8.3 kWh/day. Although the piezoelectric material generated only 22.6 Wh/day, rendering it an impractical inclusion in further analysis.
- Both the solar modules and wind turbines combined generate 24.2 kWh/day, which can increase the driving range by 16.3 km per day and this results in savings of 19.36 minutes for charging at the stations.
- Investing in such projects would have a positive return as the internal rate of return (IRR) and net present value (NPV) are 2.8% and £11,175 respectively. The annual revenue would be £6,712, and the greenhouse gas (GHG) reduction would be two metric tons annually.
- Electricity exported to the grid, the electricity export rate, and the initial investment are identified as key factors influencing power outage in a sensitivity analysis. In conclusion, this numerical modelling study paves the way for experimental validation towards implementation of renewable energy technologies on electric bus fleets.
It is crucial to recognize the study's inherent limitations and identify potential directions for future research. The project demonstrated that solar modules are highly efficient in powering electric vehicles (EVs), generating 15.9 kWh, compared to wind turbines at 8.3 kWh and piezoelectric materials at a significantly lower 0.0226 kWh. This variation in efficiency markedly affects the cruising range of EVs, with solar modules enhancing it by about 10.7 km and wind turbines by roughly 5.6 km. Additionally, the integration of solar modules and mini wind turbines on a bus could yield a daily output of 24.2 kWh, extending the cruising range by approximately 16.3 km per day and substantially reducing charging time.
Economically, the initial investment for these renewable energy systems on a bus was £57,000, complemented by an annual maintenance cost of £828 and debt payments of £4,381. Despite these expenditures, the project proved financially viable, saving £6,712 per bus annually in charging costs and generating an extra £140 from greenhouse gas reduction credits, leading to a positive net yearly cash flow of £1,641.
The study, while methodologically rigorous, encountered limitations primarily in its data sources and modelling approaches. The use of secondary data, especially for solar panels, introduced potential inaccuracies. Furthermore, the heavy reliance on theoretical modelling and computational simulations, while generally reliable, may not have fully represented the complexities of real-world conditions. Moreover, the assumptions in these models, such as the efficiency of wind turbines and the output of piezoelectric materials, were scientifically grounded but might not align perfectly with practical realities, potentially affecting the accuracy of predictions. The focus on just three types of renewable energy technologies also limited the research scope, omitting other potential sources and technologies.
For future research, several paths are suggested. Implementing the project in areas with higher solar irradiance, e.g. countries such as Saudi Arabia or Morocco, could enhance its feasibility and energy generation. Investigating infrastructural advancements, such as integrating piezoelectric materials into roads, could improve energy collection and expand sustainable transportation solutions. Additionally, addressing scalability and production challenges is essential. Future studies should explore the scalability of these technologies and the necessary production adaptations for widespread implementation, considering economic, environmental, and technical factors for larger fleets and diverse vehicle types.
In summary, this empirical study offers significant insights into sustainable transportation but also underscores the need for further investigation. By addressing the identified limitations and pursuing suggested future research directions, subsequent studies can deepen the understanding and practical application of renewable energy technologies in electric buses, advancing the field of sustainable urban transportation.
References
- Oku, T. , 2016. Solar cells and energy materials, Walter de Gruyter GmbH & Co KG.
- Kennedy, D. , & Philbin, S. P. Techno-economic analysis of the adoption of electric vehicles. Frontiers of Engineering Management 2019, 6, 538–550. [Google Scholar]
- Rigogiannis, N. , Bogatsis, I., Pechlivanis, C., Kyritsis, A., & Papanikolaou, N. Moving towards Greener Road Transportation: A Review. Clean Technologies 2023, 5, 766–790. [Google Scholar]
- Vidhi, R. , Shrivastava, P., & Parikh, A. Social and technological impact of businesses surrounding electric vehicles. Clean Technologies 2021, 3, 81–97. [Google Scholar]
- Transport (2019) Available at: https://www.irena.org/Energy-Transition/Technology/Transport (Accessed: 27 August 2023).
- TfL sets out bold vision for electric buses in London (no date) Available at: https://transportandenergy.com/2023/06/22/tfl-sets-out-bold-vision-for-electric-buses-in-london/ (Accessed: 1 July 2023).
- London’s electric bus fleet becomes the largest in Europe (no date) Available at: https://www.london.gov.uk/press-releases/mayoral/londons-electric-bus-fleet-largest-in-europe (Accessed: 1 July 2023).
- Solar Electric Vehicle (no date) Available at: https://lightyear.one/ (Accessed: 27 August 2023).
- Kacher, G. (2022) Sono Motors Sion revealed: Solar-powered and on sale next year for £21K!. Available at: https://www.carmagazine.co.uk/car-news/tech/sono-sion/ (Accessed: 27 August 2023).
- Bus Fleet Data & Audits (no date) Available at: https://tfl.gov.uk/corporate/publications-and-reports/bus-fleet-data-and-audits (Accessed: 27 August 2023).
- Masuda, T. , Araki, K., Okumura, K., Urabe, S., Kudo, Y., Kimura, K., Nakado, T., Sato, A. and Yamaguchi, M. Static concentrator photovoltaics for automotive applications. Solar Energy 2017, 146, 523–531. [Google Scholar] [CrossRef]
- Alves, M. , Pérez-Rodríguez, A., Dale, P.J., Domínguez, C. and Sadewasser, S. Thin-film micro-concentrator solar cells. Journal of Physics: Energy 2019, 2, 012001. [Google Scholar]
- Abdelhamid, M. , Singh, R., Qattawi, A., Omar, M. and Haque, I. Evaluation of on-board photovoltaic modules options for electric vehicles. IEEE Journal of Photovoltaics 2014, 4, 1576–1584. [Google Scholar] [CrossRef]
- Yamaguchi, M. , Masuda, T., Araki, K., Sato, D., Lee, K.H., Kojima, N., Takamoto, T., Okumura, K., Satou, A., Yamada, K. and Nakado, T. Role of PV-powered vehicles in low-carbon society and some approaches of high-efficiency solar cell modules for cars. Energy and Power Engineering 2020, 12, 375–395. [Google Scholar] [CrossRef]
- Mangu, R. , Prayaga, K., Nadimpally, B. and Nicaise, S., 2010, April. Design, development and optimization of highly efficient solar cars: Gato del Sol I-IV. In 2010 IEEE Green Technologies Conference (pp. 1-6). IEEE.
- Chmielewski, A. , Szulim, P., Gregorczyk, M., Gumiński, R., Mydłowski, T. and Mączak, J., 2017, August. Model of an electric vehicle powered by a PV cell—A case study. In 2017 22nd International Conference on Methods and Models in Automation and Robotics (MMAR) (pp. 1009-1014). IEEE.
- Schuss, C. , Fabritius, T., Eichberger, B. and Rahkonen, T.,. Impacts on the output power of photovoltaics on top of electric and hybrid electric vehicles. IEEE Transactions on Instrumentation and Measurement 2019, 69, 2449–2458. [Google Scholar] [CrossRef]
- Uno, M. , Liu, X., Sato, H. and Saito, Y. Panel-to-Substring PWM differential power processing converter and its maximum power point tracking technique for solar roof of plug-in electric vehicles. IEEE Access 2022, 10, 42883–42896. [Google Scholar] [CrossRef]
- Nivas, M. , Naidu, R.K.P.R., Mishra, D.P. and Salkuti, S.R. Modelling and analysis of solar-powered electric vehicles. International Journal of Power Electronics and Drive Systems 2022, 13, 480. [Google Scholar]
- Gezelius, M. and Mortazavi, R. Effect of having solar panels on the probability of owning battery electric vehicle. World Electric Vehicle Journal 2022, 13, 125. [Google Scholar] [CrossRef]
- Shivsharan, B.A. , Magade, P.B., Chavan, S. and Magade, S., 2020. A Review Paper on Vehicle Mounted Wind Turbine. Journal of Seybold Report ISSN NO, 1533, p.9211.
- Fathabadi, H. Utilizing solar and wind energy in plug-in hybrid electric vehicles. Energy conversion and management 2018, 156, 317–328. [Google Scholar] [CrossRef]
- Awal, M.R. , Jusoh, M., Sakib, M.N., Hossain, F.S., Beson, M.R.C. and Aljunid, S.A. Design and implementation of vehicle mounted wind turbine. ARPN J Eng Appl Sci 2015, 10, 8699–8860. [Google Scholar]
- Weng, F.T. and Huang, Y.X., 2018, April. An investigation of vehicle wind turbine system. In 2018 IEEE International Conference on Applied System Invention (ICASI) (pp. 1346-1349). IEEE.
- Yao, A. W.-L. , & Chiu, C. -H. Development of a Wind Power System on Trucks. Universal Journal of Mechanical Engineering 2015, 3, 151–163. [Google Scholar]
- Hussain, M.Z. , Anbalagan, R., Jayabalakrishnan, D., Muruga, D.N., Prabhahar, M., Bhaskar, K. and Sendilvelan, S. Charging of car battery in electric vehicle by using wind energy. Materials Today: Proceedings 2021, 45, 5873–5877. [Google Scholar]
- Anagie, G.A. , Hassen, A.A. and Sintie, Y.T., 2021. Performance Investigation of Small Wind Turbine Installed over a Pick up Vehicle to Charge an Electric Vehicle Battery.
- Chang, S.H. , Lim, Q.H. and Lin, K.H. A novel hybrid car design using a wind energy capturing device. Int. J. Simul. Syst. Sci. Technol 2014, 15, 21–29. [Google Scholar]
- Beesetty, M. Generation of Electricity by mounting Wind mill on moving vehicles for safe Food and Medicine Transfer by using wind energy conversion system. The International Journal Of Engineering And Science (IJES) 2015, 4, 22–25. [Google Scholar]
- Pavel, C.C. , Marmier, A., Alves Dias, P., Blagoeva, D., Tzimas, E., Schüler, D., Schleicher, T., Jenseit, W., Degreif, S. and Buchert, M., 2016. Substitution of critical raw materials in low-carbon technologies: lighting, wind turbines and electric vehicles. Luxembourg: European Commission, Oko-Institut eV.
- Jaen-Sola, P. , McDonald, A.S. and Oterkus, E. Lightweight design of direct-drive wind turbine electrical generators: A comparison between steel and composite material structures. Ocean Engineering 2019, 181, 330–341. [Google Scholar] [CrossRef]
- Pourrajabian, A. , Afshar, P.A.N., Ahmadizadeh, M. and Wood, D. Aero-structural design and optimization of a small wind turbine blade. Renewable Energy 2016, 87, 837–848. [Google Scholar] [CrossRef]
- Tang, X. , Huang, X., Peng, R. and Liu, X. A direct approach of design optimization for small horizontal axis wind turbine blades. Procedia CIRP 2015, 36, 12–16. [Google Scholar] [CrossRef]
- Chen, T.Y. , Liao, Y.T. and Cheng, C.C. Development of small wind turbines for moving vehicles: Effects of flanged diffusers on rotor performance. Experimental Thermal and Fluid Science 2012, 42, 136–142. [Google Scholar] [CrossRef]
- Sirenko, V. , Pavlovs’ ky, R. and Rohatgi, U.S., 2012, July. Methods of reducing vehicle aerodynamic drag. In Fluids Engineering Division Summer Meeting (Vol. 44755, pp. 97–102). American Society of Mechanical Engineers.
- Sudin, M.N. , Abdullah, M.A., Shamsuddin, S.A., Ramli, F.R. and Tahir, M.M. Review of research on vehicles aerodynamic drag reduction methods. International Journal of Mechanical and Mechatronics Engineering 2014, 14, 37–47. [Google Scholar]
- Fotso, B.M. , Nguefack, C.F., Talawo, R.C. and Fogue, M. Aerodynamic analysis of an electric vehicle equipped with horizontal axis savonius wind turbines. Int. J. Recent Trends Eng. Res. IJRTER 2019, 5, 17–26. [Google Scholar]
- Sofian, M. , Nurhayati, R., Rexca, A.J., Syariful, S.S. and Aslam, A. An evaluation of drag coefficient of wind turbine system installed on moving car. Applied Mechanics and Material 2014, 660, 689–693. [Google Scholar] [CrossRef]
- Kulkarni, H. , Zohaib, K., Khusru, A. and Aiyappa, K.S. Application of piezoelectric technology in automotive systems. Materials Today: Proceedings 2018, 5, 21299–21304. [Google Scholar]
- Esmaeeli, R. , Aliniagerdroudbari, H., Hashemi, S.R., Nazari, A., Alhadri, M., Zakri, W., Mohammed, A.H., Batur, C. and Farhad, S. A rainbow piezoelectric energy harvesting system for intelligent tire monitoring applications. Journal of Energy Resources Technology 2019, 141, 062007. [Google Scholar] [CrossRef]
- Song, Y. , Yang, C.H., Hong, S.K., Hwang, S.J., Kim, J.H., Choi, J.Y., Ryu, S.K. and Sung, T.H. Road energy harvester designed as a macro-power source using the piezoelectric effect. International Journal of Hydrogen Energy 2016, 41, 12563–12568. [Google Scholar] [CrossRef]
- Makki, N. and Pop-Iliev, R., 2011. Piezoelectric power generation in automotive tires. Proceedings of the Smart Materials & Structures/NDT in Aerospace/NDT in Canada, pp.1-10.
- Sezer, N. and Koç, M. A comprehensive review on the state-of-the-art of piezoelectric energy harvesting. Nano energy 2021, 80, 105567. [Google Scholar] [CrossRef]
- Jung, I. , Shin, Y.H., Kim, S., Choi, J.Y. and Kang, C.Y. Flexible piezoelectric polymer-based energy harvesting system for roadway applications. Applied energy 2017, 197, 222–229. [Google Scholar] [CrossRef]
- Khalili, M. , Biten, A.B., Vishwakarma, G., Ahmed, S. and Papagiannakis, A.T. Electro-mechanical characterization of a piezoelectric energy harvester. Applied Energy 2019, 253, 113585. [Google Scholar] [CrossRef]
- Blanco, S. , 2009. How does weight affect a vehicle's efficiency. Available online via:(Accessed: 27-04-20).
- Hennings, W. , Mischinger, S. and Linssen, J. Utilization of excess wind power in electric vehicles. Energy policy 2013, 62, 139–144. [Google Scholar] [CrossRef]
- Al-Ogaili, A.S. , Hashim, T.J.T., Rahmat, N.A., Ramasamy, A.K., Marsadek, M.B., Faisal, M. and Hannan, M.A. Review on scheduling, clustering, and forecasting strategies for controlling electric vehicle charging: Challenges and recommendations. Ieee Access 2019, 7, 128353–128371. [Google Scholar] [CrossRef]
- Gupta, A. and Kumar, N. Energy regeneration in electric vehicles with wind turbine and modified alternator. Materials Today: Proceedings 2021, 47, 3380–3386. [Google Scholar]
- How to calculate the annual solar energy output of a photovoltaic system? (No date) Available at: https://photovoltaic-software.com/principle-ressources/how-calculate-solar-energy-power-pv-systems (Accessed: 05 April 2023).
- Wind Turbine Calculator (2021) Available at: https://windcycle.energy/wind_turbine_calculator/#:~:text=How%20to%20calculate%20the%20power%20generated%20by%20a,power%20...%204%20Calculating%20the%20output%20power%20 (Accessed: 05 April 2023).
- Ro, K.S. and Hunt, P.G. Characteristic wind speed distributions and reliability of the logarithmic wind profile. Journal of environmental engineering 2007, 133, 313–318. [Google Scholar] [CrossRef]
- Bañuelos-Ruedas, F. , Angeles-Camacho, C. and Rios-Marcuello, S. Methodologies used in the extrapolation of wind speed data at different heights and its impact in the wind energy resource assessment in a region. Wind farm-Technical regulations, potential estimation and siting assessment 2011, 97, 114. [Google Scholar]
- Fernando, J. (2023) Net present value (NPV): What it means and steps to calculate it, Investopedia. Available at: https://www.investopedia.com/terms/n/npv.asp (Accessed: 04 September 2023).
- Fernando, J. (2023) Internal Rate of Return (IRR) rule: Definition and example, Investopedia. Available at: https://www.investopedia.com/terms/i/irr.asp (Accessed: 04 September 2023).
- Global Solar Atlas (no date) Available at: https://globalsolaratlas.info/ (Accessed: 3 April 2023).
- 57. Meet the BYD–Alexander Dennis Enviro400EV (no date). Available at: https://www.evbus.co.uk/products/byd-adl-enviro400ev/ (Accessed: December 1, 2022).
- Law, D.C. , Edmondson, K.M., Siddiqi, N., Paredes, A., King, R.R., Glenn, G., Labios, E., Haddad, M.H., Isshiki, T.D. and Karam, N.H., 2006, May. Lightweight, flexible, high-efficiency III-V multijunction cells. In 2006 IEEE 4th World Conference on Photovoltaic Energy Conference (Vol. 2, pp. 1879–1882). IEEE.
- Fernández, P. (2008).Available at: http://www.termica.webhop.info (Accessed: 5 April 2023).
- Gilbert, M.M. , 2004. Renewable and efficient electric power systems.
- Patel, M.R. , 2006. Wind and solar power systems: design, analysis, and operation, 2nd edn, CRC Taylor & Francis. ISBN-10: 0-8493-1570-0, ISBN-13, 970, p.978.
- ANSYS. (2023). ANSYS Student 2023 R2. [Software]. Available at: https://www.ansys.com/academic/students/ansys-student (Accessed: March 2023).
- london-digital-speed-limit-map.pdf (tfl.gov.uk) (no date) Available at: https://content.tfl.gov.uk/london-digital-speed-limit-map.pdf (Accessed: 3 April 2023).
- How long does it take to charge an electric car? (no date) Available at: https://pod-point.com/guides/driver/how-long-to-charge-an-electric-car (Accessed: 03 August 2023).
- ESB Energy for Electric Vehicles (no date). Available at: https://www.esbenergy.co.uk/ev (Accessed: 03 August 2023).
- D. Clark and 16, A. D. Clark and 16, A. (2023) UK inflation rate 2023, Statista. Available at: https://www.statista.com/statistics/306648/inflation-rate-consumer-price-index-cpi-united-kingdom-uk/ (Accessed: 20 August 2023).
- Ten-fold increase in carbon offset cost predicted (2022). Available at: https://www.ucl.ac.uk/news/2021/jun/ten-fold-increase-carbon-offset-cost-predicted (Accessed: 21 August 2023).
- RETScreen International 2023, 'RETScreen Expert - Professional', version 9.0.1.94, Natural Resources Canada [Software]. Available at: https://natural-resources.canada.ca/maps-tools-and-publications/tools/modelling-tools/retscreen/7465 (Accessed: March 2023).
Figure 1.
solar radiation vs total power generation [11].
Figure 1.
solar radiation vs total power generation [11].
Figure 2.
power output generated hour by hour [22].
Figure 2.
power output generated hour by hour [22].
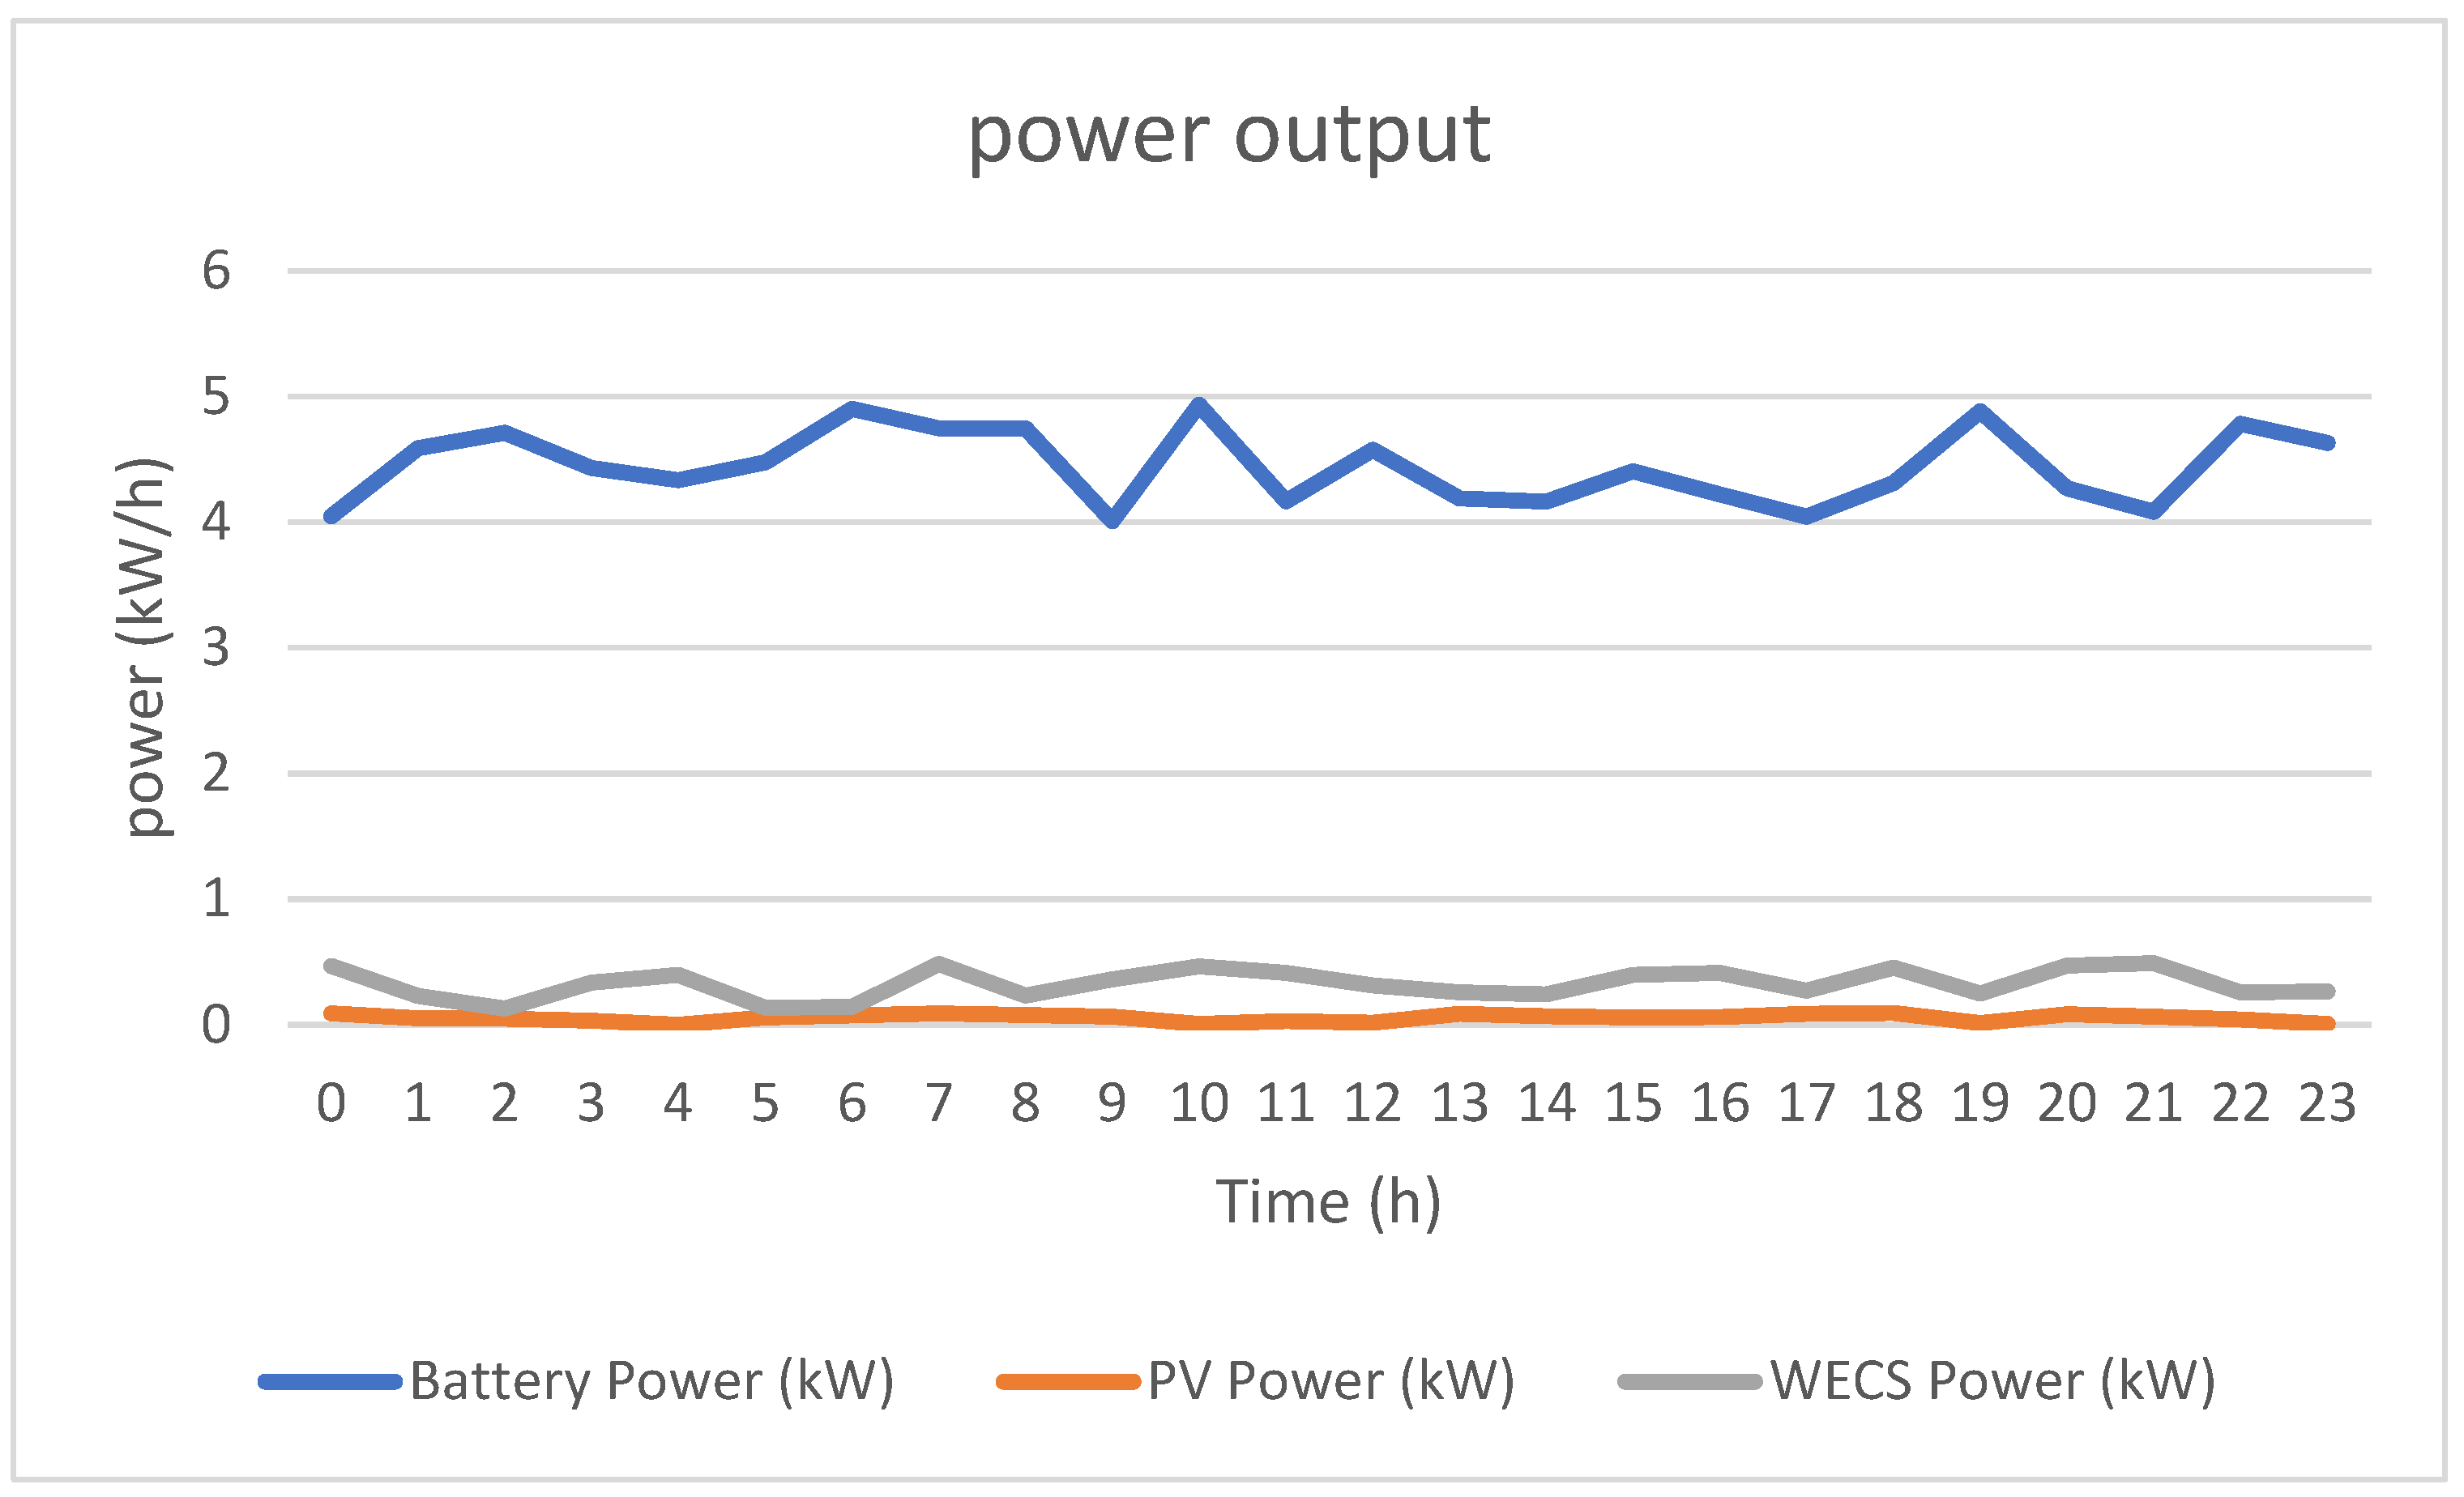
Figure 6.
main stages of analysis.
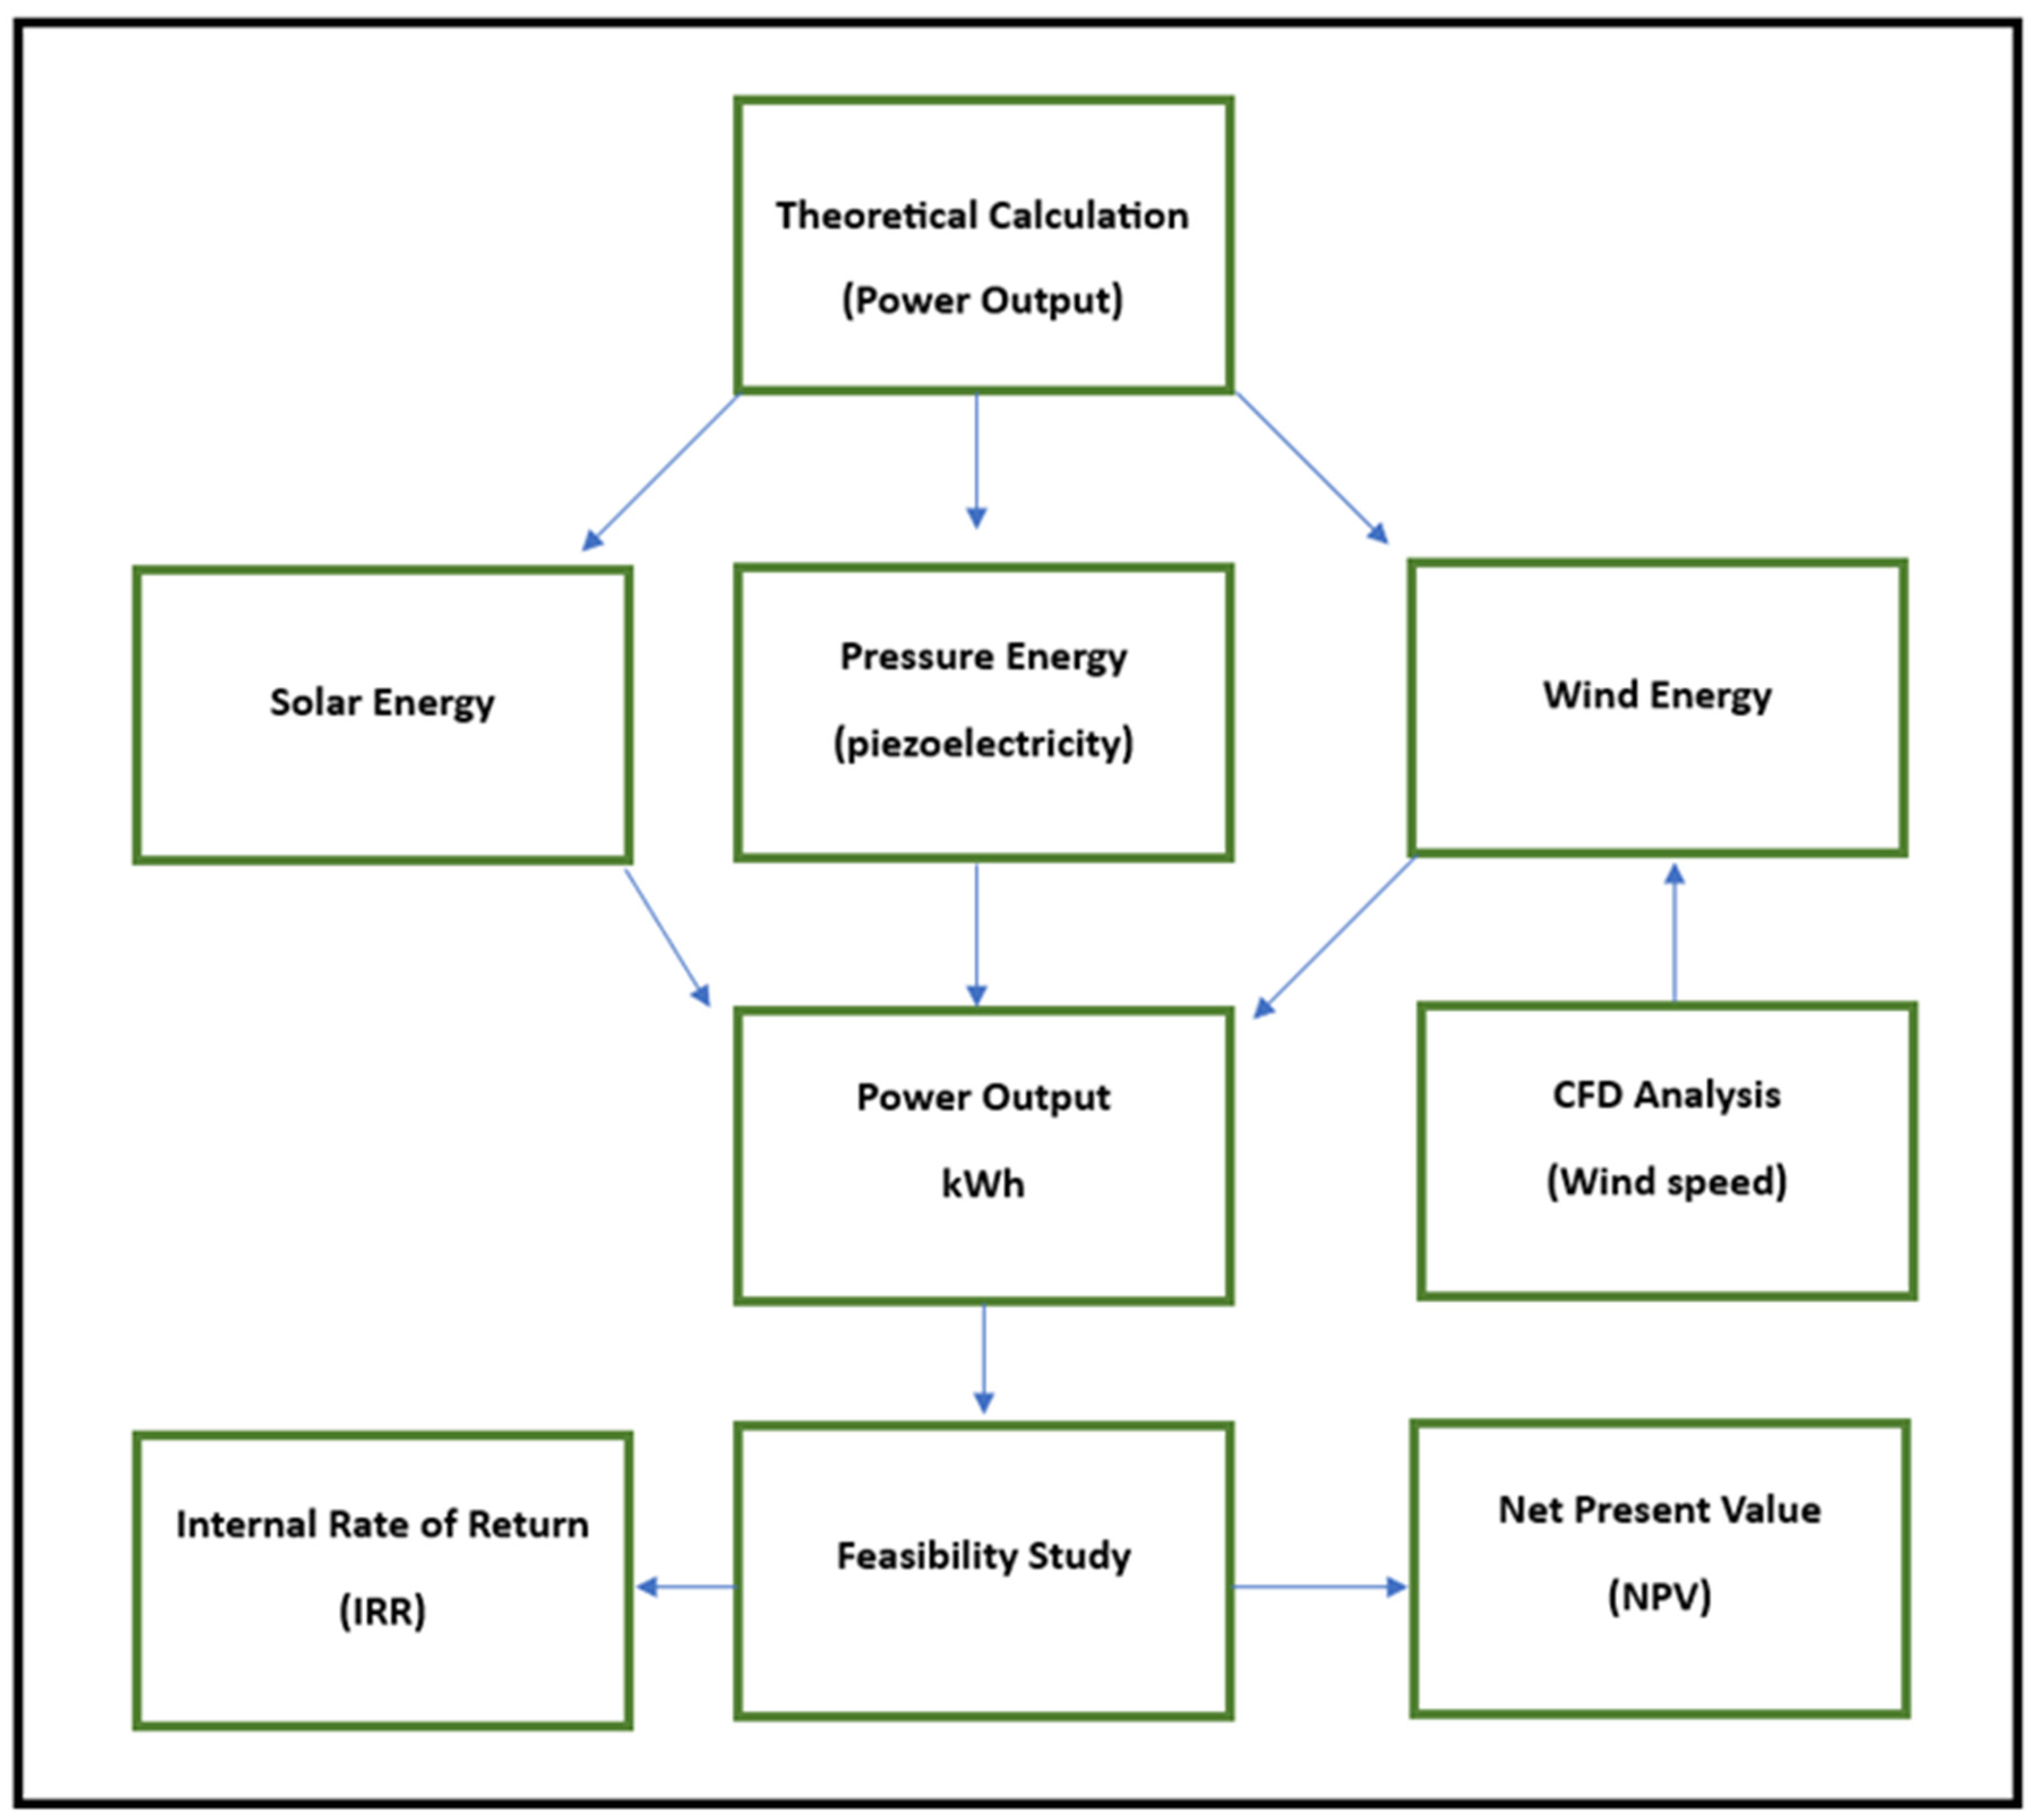
Table 1.
Summary of potential and achieved efficiencies of various candidate solar cells. “3J” and “6J” mean the triple-junction and six-junction, respectively [14].
Table 1.
Summary of potential and achieved efficiencies of various candidate solar cells. “3J” and “6J” mean the triple-junction and six-junction, respectively [14].
| Type | Potential (%) | Attained (%) | Reach (%) | Year |
|---|---|---|---|---|
| Mono crystalline Si | 28.8 | 26.7 | 92.7 | 2017 |
| Gallium arsenide | 30 | 29.1 | 97 | 2018 |
| III-V based 3J | 42 | 37.9 | 90.2 | 2013 |
| III-V based 6J | 46 | 39.2 | 85.2 | 2019 |
| III-V/Si | 42 | 35.9 | 85.5 | 2017 |
| SLVPV (2-4 suns) | 40 | 27.6 | 69 | 2019 |
| III-V/Si etc. | 40 | 27.6 | 69 | 2019 |
| CIGS | 27.7 | 23.4 | 84.5 | 2018 |
| CdTe | 27.7 | 22.1 | 79.8 | 2015 |
| Perovskite | 27.7 | 24.2 | 87.4 | 2019 |
| Organic | 20.2 | 16.4 | 81.2 | 2019 |
Table 2.
mathematical formulas.
| Number | Formula | Description | Variables | |
|---|---|---|---|---|
|
1 |
|
Global formula to calculate solar panel power output (kWh) [50] |
PR: performance ratio which is typically (0.75 [50]) H: Annual average solar radiation r: efficiency A: Area E: energy (kWh) |
|
|
2 |
|
global formula to calculate power output of wind turbines [51]. | ||
|
3 |
|
global formula for available wind power [51]. |
A = sweep area ρ = air density (usually 1.225 kg/m3) V = wind speed (usable range is 3-25 m/s Pwind = available wind power |
|
|
4 |
|
Sweep area formula [51]. |
A: sweep area π: mathematical constant (a circle’s circumference to its diameter ratio) L: blade length or radius of horizontal axis turbine |
|
|
5 |
|
Logarithmic Wind Method [52] |
Vz: is the wind speed at height z. Vref: is the reference wind speed at height Zref. Z: is the desired height Zref: is the reference height. z0: is the surface roughness length |
|
|
6 |
|
Power-law model [53] |
Vz: is the wind speed at height z Vref: is the reference wind speed at height zref (usually 10 meters) Z: is the desired height (1 meter in this case) Zref: is the reference height (10 meters) α: is friction coefficient or the power-law exponent (also called the Hellmann exponent), which depends on the surface roughness and atmospheric stability |
|
|
7 |
|
Net Present Value (NPV) formula [54] |
Ct: cash flow C0: initial investment NPV: initial investment IRR: required return or discount rate. t: number of time periods |
|
|
8 |
|
Internal Rate of Return Formula [55] |
IRR: internal rate of return FV: future value t: periods PV: present value |
Table 10.
Defined parameters.
| Parameter | Value | Source |
|---|---|---|
| USDGBP exchange rate | 0.8 | User defined |
| Cumulative inflation rate | 2.79% | [66] |
| Fuel cost escalation rate | 2% | RETScreen |
| Discount rate | 9% | RETScreen |
| Project life | 20 years | RETScreen |
| Debt ratio | 70% | RETScreen |
| Debt interest rate | 7% | RETScreen |
| Debt term | 15 years | RETScreen |
| GHG reduction credit rate | 70 GBP/tCO2 | [67] |
| GHG reduction credit duration | 20 years | RETScreen |
| Electricity export rate (price of charging cars) | £0.77 | [64,65] |
| Solar Panel Cost per kWh | £3,604 | RETScreen with user modification |
| O&M costs | 50.11 GBP/KW-year | RETScreen |
| Mini wind turbine including installation cost | £333,000 | User defined |
| O&M costs | 50 GBP/kW-year | RETScreen |
| Vehicle Design with SM and WT Mounted | £2000 | User defined |
| WT and SM Installation | £2000 | User defined |
Table 11.
climate data for London [68].
Table 11.
climate data for London [68].
| Heating design temperature | -1.0 | ||||||||
| Cooling design temperature | 25.6 | ||||||||
| Earth temperature amplitude | 15.3 | ||||||||
| Month | Air Temperature (°C) | Relative Humidity (%) | Precipitation (mm) | Daily Solar Radiation - Horizontal (kWh/m²/d) | Atmospheric Pressure (kPa) | Wind Speed (m/s) | Earth Temperature (°C) | Heating Degree-days (°C·d) | Cooling Degree-days (°C·d) |
| January | 5.8 | 78.9 | 63.55 | 0.64 | 100.9 | 8.1 | 3.1 | 378 | 0 |
| February | 5.3 | 75.8 | 45.92 | 1.19 | 100.9 | 8.1 | 3.4 | 356 | 0 |
| March | 7.9 | 73.2 | 47.49 | 2.16 | 100.7 | 8.1 | 5.8 | 313 | 0 |
| April | 9.5 | 68.9 | 51.0 | 3.87 | 100.9 | 8.1 | 8.5 | 255 | 0 |
| May | 12.9 | 69.7 | 53.32 | 4.75 | 101.0 | 8.1 | 12.1 | 158 | 0 |
| June | 15.7 | 70.4 | 57.9 | 5.65 | 101.0 | 8.1 | 15.2 | 69 | 0 |
| July | 18.7 | 68.2 | 67.85 | 5.87 | 101.0 | 8.1 | 17.7 | 0 | 0 |
| August | 18.3 | 70.1 | 58.59 | 3.98 | 101.0 | 8.1 | 17.5 | 0 | 0 |
| September | 15.7 | 73.5 | 54.0 | 2.83 | 101.0 | 8.1 | 14.3 | 69 | 0 |
| October | 12.7 | 77.9 | 72.54 | 1.66 | 100.8 | 8.1 | 10.5 | 164 | 0 |
| November | 8.7 | 80.1 | 67.5 | 0.84 | 100.9 | 8.1 | 6.2 | 279 | 0 |
| December | 7.4 | 80.1 | 66.96 | 0.5 | 100.8 | 8.1 | 3.8 | 329 | 0 |
| Annual | 11.6 | 73.9 | 694.51 | 2.58 | 100.9 | 8.1 | 9.9 | 2370 | 1043 |
Table 12.
Financial parameters [68].
Table 12.
Financial parameters [68].
| Parameter | Unit | Value |
|---|---|---|
| Inflation rate | % | 2.8% |
| Discount rate | % | 9% |
| Reinvestment rate | % | 9% |
| Project life | yr | 20 |
| Debt ratio | % | 70% |
| Debt | GBP | 39,900 |
| Equity | GBP | 17,100 |
| Debt interest rate | % | 7% |
| Debt term | yr | 15 |
| Debt payments | GBP/yr | 4,381 |
Table 13.
Electricity and GHG annual revenue [68].
Table 13.
Electricity and GHG annual revenue [68].
| Description | Unit | Value |
|---|---|---|
| Electricity export revenue | ||
| Electricity exported to grid | MWh | 8.7 |
| Electricity export rate | GBP/kWh | 0.77 |
| Electricity export revenue | GBP | 6,712 |
| Electricity export escalation rate | % | 2% |
| GHG Reduction Revenue | ||
| Net GHG reduction | tCO2/yr | 2 |
| Net GHG reduction - 20 yrs | tCO2 | 40 |
| GHG reduction credit rate | GBP/tCO2 | 70 |
| GHG reduction revenue | 139 | |
| GHG reduction credit duration | yr | 20 |
| Net GHG reduction - 20 yrs | tCO2 | 39.7 |
Table 14.
costs, savings, and annual revenue [68].
Table 14.
costs, savings, and annual revenue [68].
| Category | Percentage | Currency | Value |
|---|---|---|---|
| Initial costs | |||
| Initial cost | 93% | GBP | 53,000 |
| Vehicle Design with SM and WT Mounted | 3.5% | GBP | 2,000 |
| WT and SM Installation | 3.5% | GBP | 2,000 |
| Total initial costs | 100% | GBP | 57,000 |
| Yearly cash flows - Year 1 | |||
| Annual costs and debt payments | GBP | 828 | |
| O&M costs (savings) | GBP | 4,381 | |
| Debt payments - 15 yrs | GBP | ||
| Total annual costs | GBP | 5,209 | |
| Annual savings and revenue | |||
| Electricity export revenue | GBP | 6,712 | |
| GHG reduction revenue - 20 yrs | GBP | 139 | |
| Other revenue (cost) | GBP | 0 | |
| CE production revenue | GBP | 0 | |
| Total annual savings and revenue | GBP | 6,850 | |
| Net yearly cash flow - Year 1 | GBP | 1,641 | |
Table 15.
yearly pre-tax and cumulative cash flow [68].
Table 15.
yearly pre-tax and cumulative cash flow [68].
| Yearly | Pre-tax | cumulative |
|---|---|---|
| # | GBP | GBP |
| 0 | -17,100 | -17,100 |
| 1 | 1,753 | -15,347 |
| 2 | 1,866 | -13,482 |
| 3 | 1,981 | -11,501 |
| 4 | 2,098 | -9,402 |
| 5 | 2,218 | -7,184 |
| 6 | 2,340 | -4,845 |
| 7 | 2,463 | -2,381 |
| 8 | 2,590 | 208 |
| 9 | 2,718 | 2,926 |
| 10 | 2,849 | 5,775 |
| 1 | 2,982 | 8,757 |
| 12 | 3,118 | 11,875 |
| 13 | 3,256 | 15,131 |
| 14 | 3,396 | 18,528 |
| 15 | 3,540 | 22,067 |
| 16 | 8,066 | 30,133 |
| 17 | 8,215 | 38,348 |
| 18 | 8,366 | 46,714 |
| 19 | 8,519 | 55,233 |
| 20 | 8,676 | 63,909 |
Disclaimer/Publisher’s Note: The statements, opinions and data contained in all publications are solely those of the individual author(s) and contributor(s) and not of MDPI and/or the editor(s). MDPI and/or the editor(s) disclaim responsibility for any injury to people or property resulting from any ideas, methods, instructions or products referred to in the content. |
© 2023 by the authors. Licensee MDPI, Basel, Switzerland. This article is an open access article distributed under the terms and conditions of the Creative Commons Attribution (CC BY) license (http://creativecommons.org/licenses/by/4.0/).
Copyright: This open access article is published under a Creative Commons CC BY 4.0 license, which permit the free download, distribution, and reuse, provided that the author and preprint are cited in any reuse.


