
Submitted:
19 December 2023
Posted:
19 December 2023
You are already at the latest version
Abstract
Fires are a significant threat to people, property, and environment. One of the requirements for the buildings during fires is ensuring the safe evacuation of persons. The evacuation assessment has usually been based on a comparison of the Required Safe Egress Time (RSET) and the Available Safe Egress Time (ASET). One of the important factors influencing the safe evacuation of persons is smoke, which is an important accompanying phenomenon in the burning of polymers. The smoke layer interface is one basic barrier for effective evacuation. The current calculation technique for assessing the smoke layer interface in the Czech Republic is unsatisfactory. For this reason, a calculation technique CSN has been derived, which has been compared with the selected simple calculation techniques, the zone fire model Consolidated Model of Fire and Smoke Transport (CFAST) and the field type model Fire Dynamics Simulator (FDS). The CSN technique was also compared with a real large-scale experiment. The data were also subjected to statistical evaluation using the root mean square error method (RMSE). The deviations between the NFPA, ISO and CSN calculation techniques, the CFAST and FDS fire models and the implemented experiment ranged from 0.05 to 2.41. The established deviations indicate that the calculation technique CSN will be practically usable.
Keywords:
fire
; evacuation
; smoke layer interface
; calculation techniques
; CFAST model
; FDS model
; experiment
1. Introduction
One of the basic priorities of the European Union is to ensure sustainability, which is also closely related to ensuring safety. Fires are a significant threat to the people, property, and environment [1,2]. The basic requirements for buildings include mechanical resilience and stability, hygiene, health and environmental protection, safety and accessibility during use, noise protection, energy and heat saving, the sustainable use of natural resources and fire safety [3]. The basic requirement for buildings in terms of fire safety is to ensure the safe evacuation of people. The safe evacuation of persons has been dealt with as a rule by designating the “Required Safe Egress Time” (RSET) and its comparison with the “Available Safe Egress Time” (ASET) [4,5,6]. In general, it applies that the ASET must be greater than or equal to the RSET.
The ASET is related to the accompanying phenomena of the fire, such as the presence of combustion products, reduction in oxygen concentration, presence of flame and generated heat. [7,8]
A significant threat in building fires is smoke. The amount and properties of smoke are significantly influenced by polymers, which are increasingly common in today's modern buildings. Optical density, toxicity and temperature are the basic characteristics of smoke [2,3,4]. One of the methods of smoke management is the use of the buoyancy effect of smoke. This is caused by the decreasing smoke density when the temperature in the burning space increases. The smoke thus accumulates under the ceiling structure and gradually fills the entire space [9,10]. One of the significant factors influencing the ASET is the threat to persons resulting from the descending smoke layer in a compartment. A level of 2.5 m above the floor is generally considered a “safe level” of a non-smoke-filled height of a compartment, although in some cases different values are used, such as 3 m in public buildings or 80% of the clear height in garages [11,12].
The filling of the space with smoke is influenced by several factors. Some of the most important include the fire dynamics, geometry of compartment, and the influence of any fixed extinguishers [13]. The precise definition of the smoke layer and layer without smoke is also fairly problematic [14,15,16]. From the aspect of fire dynamics, the amount and type of flammable materials and location of the fire source are primarily fundamental [17,18]. In general, as the fire dynamics increase, the smoke layer in the area decreases more rapidly. The geometry of a compartment also has a significant impact on the spread of smoke. Compared with a compartment with “regular geometry”, the amount and manner of smoke spread is different for specific buildings, specifically buildings with one significantly larger dimension. Typical examples are atria (the height is generally the predominant dimension) and corridors (the predominant dimension is the length) [19,20]. In these buildings, there may be layering of smoke and thus deterioration of the conditions for evacuation [21,22,23]. Fixed extinguishers can influence the movement of smoke and generation of an accumulated smoke layer. Characteristic phenomena accompanying extinguishing, such as the cooling of smoke during extinguishing using fixed water extinguishers, can have a significant negative impact on the generation of an accumulated smoke layer [24,25].
The problem with ensuring the safe evacuation of persons in relation to the formation of a smoke layer in a compartment can be dealt with by calculation and simulations using fire models or experimentally. Calculation techniques can be simple techniques using a calculator or Microsoft Excel software. In terms of performing simulations with fire models, mathematical fire models are currently used. Use is made of single-zone and two-zone models, and models based on the Calculation Fluid Dynamics (CFD). Experimental measurements can be of a small-scale nature in laboratories or medium to large-scale experiments. [26,27] The most commonly used simple calculation techniques for smoke layer interface determination include those listed in the NFPA [28] or ISO [29] standards. However, the use of these calculation techniques may be severely limited in some cases. This can be caused not only by the inherent limits of the calculation techniques, but more often by the use of different input values for the assessment of buildings in terms of fire protection in different countries, including the Czech Republic. The basic input value when using the calculation techniques presented in the NFPA and ISO standards is the heat flux released for a constant or time-evolving fire [28,29]. For input values, the current calculation technique for determining the smoke layer interface in the Czech Republic uses the combustion rate from the perspective of the character of the flammable materials a and the probability of the occurrence and the spread of the fire p1 [30,31]. Another significant shortcoming of the calculation techniques for determining the smoke layer interface in the Czech Republic is the fact that they do not consider the area of space [30,31]. The standardly presented calculation techniques for determining the smoke layer interface have been therefore difficult to apply when designing the buildings in the Czech Republic and, in addition, they can provide incorrect results in some cases. For this reason, a new CSN calculation technique has been developed, which is based on ISO technique. The CSN calculation technique was compared with other existing calculation techniques, namely NFPA, ISO and ASET techniques [28,29]. Calculation techniques have been compared for the characteristic types of fire, which are slow, medium, fast, and ultra-fast fire growth [5,6]. The differences between the calculation techniques were evaluated using the percentage bias method (PBIAS) and root mean square error method (RMSE) [32,33]. The benchmark calculation technique was the ISO technique. The largest deviation between the calculation techniques determined by the PBIAS method was 20%. The largest deviation between the ISO and CSN techniques was 1.6%. The largest deviation between calculation techniques determined by the RMSE method was 0.160. The largest deviation between the ISO and CSN techniques was 0.007. The variations between the calculation techniques were adjudged to be acceptable and the newly derived calculation technique was adjudged to be promising, with further validation needed. [34] The aim of this paper is to present the results of the validation of the suitability of the CSN calculation technique of the case study. The CSN calculation technique was verified by ISO and NFPA calculation techniques, selected fire models and experimentally. The fire models selected were the Consolidated Model of Fire and Smoke Transport (CFAST) [35] zone fire model and the Fire Dynamics Simulator (FDS) field type model [36]. A large-scale real experiment was chosen for experimental validation.
2. Materials and Methods
The dynamism of the fire and geometry of the compartment that is developing has a fundamental influence for an evaluation of the smoke layer interface descent. For the evaluation of the smoke layer interface descent, use has been made by the simple calculation techniques, which have long been used for dealing with this matter and which in this sense can be considered representative. A new technique derived with relation to the calculation procedures for evaluating the fire safety of buildings in the Czech Republic has been added to the current calculation techniques. The smoke layer interface descent in a room has also been evaluated using the CFAST and FDS models and then a real experiment. Subsequently, the variations between the individual methods were evaluated.
2.1. Dynamics of fire and the spreading of smoke in spaces
As a rule, a fire is described by four phases, whereas the fire growth phase of fire development is the most important from the point of view of evacuation of people [37]. In this phase of the fire, the amount of burning materials is limited. This phase of the fire is also referred to as a local fire [38,39]. One of the characteristic accompanying phenomena of a local fire is a vertical column of smoke called a smoke plume, which transports material and transfers the energy from the fire to the space [38]. It is standardly assumed that the matter and energy from the fire cumulates mainly in the upper hot layer. As the fire gradually grows, there is an increase in the temperature of gaseous combustion products and a reduction in their density, thus a buoyancy effect develops. With a sufficient temperature difference, the fire plume reaches the ceiling of the compartment and a flow along the ceiling develops [40]. Smoke gases start to spread out initially in a relatively thin layer under the ceiling, and as the fire develops, they gradually spread to the structures bounding the compartment. When they hit the structures bounding the compartment, the flow of the smoke changes to a direction towards the floor. The flow towards the floor slows due to buoyancy and frictional forces until it finally stops, and the flow once again changes direction towards the ceiling. The smoke plume starts to form a deepening layer [29]. As the fire growth develops, there is a deepening of the accumulated smoke layer. If there are openings between the room where the fire is developing and the neighbouring rooms, the fire spreads between rooms, i.e., throughout the building if the accumulated layer of gases drops below the level of the openings’ upper edge.
2.2. Existing technique for evaluating the smoke layer interface in the Czech Republic
The smoke layer interface is currently determined in the Czech Republic depending on the clear height of the space and the characteristics of the fire. The time to reach the smoke layer interface to the level of 2.5 m above the floor is evaluated. Said time can be determined by the following equations [30,31]:
Non-production objects
Objects for production and storage
The equations (1) and (2) are very simple, but they do not take into account the area of space. This is a major problem.
2.3. New technique for evaluating the smoke layer interface in the Czech Republic
Based on previous work, the following CSN equations were derived for smoke layer interface assessment for the Czech Republic [34]:
Non-production objects
Objects for production and storage
For the description of fire dynamics, they use the equations fire loading p and average fire loading p ̅, which are variables that are used not only in the Czech Republic but also in other countries. The CSN calculation technique was theoretically derived from the ISO calculation technique [29]. The derivation procedure of the CSN technique has already been presented in detail before [34].
2.4. Selected calculation techniques for evaluating the smoke layer interface
The ISO standards describe a calculation technique for determining the smoke layer interface with the following equation [29]:
The ISO calculation technique was derived from the Zukoski theory for fire plume solutions [38,40,41]. For this reason, the use of the equation is limited by the condition that the smokem layer interface must be [29].
The standard NFPA describes the technique for designating the smoke layer interface in large-volume compartments [28,42]:
The limiting factors for the use of NFPA computing are the area-to-height ratio of the compartment and the ratio of the non-smoked compartment height to the height of the compartment .
Equations (5) and (6) are some of the most used simple calculation techniques for designating the smoke layer interface descent in an enclosed compartment.
2.5. CFAST Model
The CFAST model is a zone fire model that can be used to determine selected fire characteristics depending on time. The model was developed at the National Institute of Standards and Technology in the USA [43]. The model requires only simple hard-ware, and the calculations usually only take a few tens of seconds. The program requires an operating system (Windows or Linux). Sufficient hard disk space is required. The single calculation can generate output files as large as several tens to hundreds of megabytes. The Smokeview software can be used to display the model. The characteristics of fire are determined by a set of differential equations based on the laws of conservation of mass and energy. Ideal gas laws are also used. The transfer of smoke and heat between individual zones is described by empirical correlations. Another of the fire characteristics that can be determined by the model is the smoke layer interface. [35,44]
2.6. FDS Model
Fire models based on Calculation Fluid Dynamics are widely used for the as-sessment of fire development. One of the most promising models based on this foundation is the FDS model. The model was developed at the National Institute of Standards and Technology in the USA [43] in collaboration with the Technical Research Centre of Finland in Finland [45]. The program requires a Windows or Linux operating system. To facilitate the work, it is possible to use the graphical interfaces PyroSim [46], or Blender FDS [47]. The model can be visualised with Smokeview software. FDS solves numerically the Navier-Stokes equations for temperature-controlled flow, with an emphasis on heat and smoke transfer from the fire. It is a model that allows to simulate many fire parameters, e.g., determination of the heat release rate and its sub-fractions, the flow of gases induced by the fire, the determination of the concentration of substances released by the fire, etc. The model can be used to simulate fires in various objects, e.g., buildings or technical equipment (e.g., cars). All input data is entered by means of a single text input file. The output is multiple files where the output data is stored. [36]
2.7. Large-scale experiment
A large-scale experiment was carried out in the original production and storage facility of Vítkovice, a.s. in Ostrava, Czech Republic. It is a single-storey building of a rugged character and the experiment was carried out in a separate part of it, which can be called an extension. The floor plan dimensions of the extension are 10 x 7 m, with one room inside this extension having dimensions of 2.92 m x 7 m and a height of 2.5 m. Above this height there was already a free space up to the ceiling. The height of the whole extension was 8 m. The building where the experiment was carried out is shown in Figure 1.
The fire was in a metal container measuring 0.6 x 0.6 m. The experiment lasted 150 s and 3.2 l of petrol was burned during the experiment. The fire is shown in Figure 2.
During the experiment, the decrease of the smoke layer in the area was monitored by MTC 11-E1-10000-200-23 thermocouples (referred to as "K" thermocouples), which were placed at a horizontal distance of 1.5 m from the centre of the fire. The thermocouples were mounted on metal chains at distances of 500 mm from the ceiling structure (8 m, 7.5 m, 7 m, 6.5 m, 6 m, 5.5 m, 5 m, 4.5 m, 4 m, 3.5 m, 3 m, 2.5 m, 2 m, 1.5 m, 1 m). The temperature was measured with an ALMENO 5690-2M control panel, which was connected to the thermocouple with cables. The measurement was started at the moment of petrol being introduced. The location of the thermocouples during the experiment is shown in Figure 3.
To evaluate the smoke layer interface in one experiment, two sub-experiments were implemented, which are referred to as Experiment 1 and Experiment 2 in the text. Both experiments were implemented under identical conditions.
2.8. Evaluation of deviations
The RMSE (root mean square error method) has been used to evaluate the deviations between the individual methods for determining the smoke layer interface [32,33]:
Declining RMSE values indicate smaller deviations between the chosen standard and the compared values (it does not assess the acceptability or unacceptability of deviations). The ISO equation (5) was chosen as the benchmark because this equation has long been considered relevant for smoke layer interface determination and has a wide range of applications. The ISO technique is based on the determination of the smoke layer interface of a fire in a confined space according to the theory of Zukoski [29], which is evaluated as promising. The ISO technique can be considered reliable and can be used as a benchmark for the comparison of other techniques for smoke layer interface assessment.
3. Results
The newly derived CSN calculation technique was compared with ISO calculation techniques, NFPA, CFAST and FDS fire models and real experiments. All techniques were applied in the same space and under the same conditions as the experiment itself.
3.1. Input values
The input values for verification of the CSN calculation technique are given in Table 1.
3.2. Graphic depiction of inputs using models CFAST and FDS
3.3. Output values
The smoke layer interface determined by CSN, ISO and NFPA calculation techniques, CFAST and FDS fire models and Experiment 1 of the real experiment is shown in Figure 6.
Smoke layer interface determined by CSN, ISO and NFPA calculation techniques, CFAST and FDS fire models and Experiment 2 of the real experiment is shown in Figure 7.
The results of the experimental measurements were then plotted using an exponential trend line (red and green dotted curves). The trend equations are shown in Figure 6 and Figure 7. A positive thermocouple response in the experiments was considered to occur when there was a temperature increase of at least 5 °C in three consecutive measurements.
3.4. Evaluation of designated deviations
The deviations determined by the RMSE method for the compared CSN, ISO and NFPA calculation techniques, the CFAST and FDS fire models and Experiment 1 of the real experiment are shown in Figure 8.
The deviations determined by the RMSE method for the compared CSN, ISO and NFPA calculation techniques, CFAST and FDS fire models and Experiment 2 of the real experiment are shown in Figure 9.
4. Discussion
In the previous sections of this paper, the new CSN calculation technique for the smoke layer interface evaluation was described. The calculation technique was then compared with the NFPA and ISO calculation techniques, the CFAST and FDS fire models, and a large-scale real experiment. It can be seen from Figure 6 and Figure 7 that the techniques used show a difference in the time of initiation of the smoke layer drop. The CSN, ISO and CFAST calculation techniques suggest that almost immediately after the initiation of the flammable liquid in the experiment, the smoke layer under the ceiling accumulates and drops. In the case of the FDS model on the thermocouples on the right chain, the initiation of the smoke layer interface drop occurs after 10 s. The NFPA calculation technique suggests that the smoke layer drop occurs after approximately 20 s. In the case of the experimental measurements, the smoke layer starts to drop at approximately 70 s (Experiment 1) and 100 s (Experiment 2). The later drop of the layer in the experiment can be explained by a certain delay in the response of the thermocouples, even though thermocouples with a fast response were purposely chosen for the real experiment. The level of the smoke layer interface in the evaluated area at 150 s is also of interest. The smoke layer interface was determined by calculation techniques to be between 1.64 m (NFPA) and 2 m (CSN) above the floor. The smoke layer interface using the ISO technique was located at 1.95 m and the floor. Using the fire models, the smoke layer interface ranged from 0.55 m (FDS) to 1.41 m (CFAST). In the case of the experimental measurements, there was also an indication of smoke on the thermocouples at 1 m above the floor.
The evaluation of the deviations between the techniques by the RMSE method (see Figure 8 and Figure 9) shows the "degree of difference" of each technique from the chosen benchmark, which was the ISO calculation technique. The deviations between the NFPA, ISO and CSN calculation techniques, the CFAST and FDS fire models and the implemented experiment ranged from 0.05 to 2.41. The smallest deviation was between the CSN and ISO calculation techniques and was 0.05. This result is predictable because the CSN technique was derived from the ISO technique. The deviation between the CSN and NFPA calculation techniques was 0.5. The deviation is small and shows a very good correlation between all the CSN, ISO and NFPA calculation techniques used. The deviation between the CSN calculation technique and the CFAST fire model was 0.36. This can be considered a very good correlation. The deviation between the CSN calculation technique and the FDS fire model was 0.91 - 1.11 (the smoke layer interface was measured separately at the right and left chain locations during the experiment, where the thermocouples were placed). The deviation between the CSN calculation technique and the FDS fire model is larger than in the previous cases. This can probably be explained by the more accurate calculation technique of the FDS model. The deviation between the CSN calculation technique and Experiment 1 of the high-dimensional experiment was 1.79 to 1.85, and between the CSN calculation technique and Experiment 2 of the large-scale experiment was 2.71 to 2.41. The deviations are significantly larger than in all previous cases. The magnitude of the deviations can be partly explained by some delay in the thermocouple response. At the same time, in most cases, thermocouples located in lower parts of the space (especially at the level of 1 to 2 m and the floor) react faster. It is likely that some of the lower thermocouples were raised in temperature by radiant heat flux from the fire (thermocouples were placed on chains 1.5 m away from the centre of the fire).
The evaluation of the smoke layer interface in a confined space without smoke extraction to the outside environment in relation to the safe evacuation of occupants has been the subject of long-term research by a number of experts dealing with the evacuation of people during fires [48]. Based on the comparison of the deviations between the newly developed CSN calculation technique and other calculation techniques, selected fire models and the real experiment, the CSN calculation technique can be considered as promising. In general, it can be assumed that simple calculation techniques will continue to find application in the future.
5. Conclusions
Fires are a significant threat to the people, property, and environment. An important requirement in case of fires is to ensure the safe evacuation of people. One of the important factors affecting the evacuation of occupants inside building is the level of smoke layer interface that accumulates under the ceiling structure and gradually fills the entire space. Polymers play a significant role in the amount and composition of smoke. The smoke layer interface can be evaluated by calculations, fire models or experimentally. The aim of this paper was to present the results of the validation of the newly developed CSN calculation technique. The CSN calculation technique was compared with the ISO and NFPA calculation techniques, the CFAST and FDS fire models, and a large-scale experiment. The deviations obtained by the different techniques were compared using the RMSE method. The deviations were in the range of 0.05 to 2.41. The smallest deviations were achieved when comparing the CSN calculation technique with other ISO calculation techniques, NFPA and the CFAST fire model. The largest deviations of 1.71 to 2.41 were achieved when comparing the CSN calculation technique with the large-scale experiment. The newly-derived calculation technique can be considered promising. The creation of CSN calculation technique for assessing the smoke layer interface will lead to changes in the standards for assessing fire safety in the Czech Republic. The use of new calculation technique can also be expected in other countries that use similar values as the Czech Republic in terms of fire safety for the design of buildings (e.g., the Slovak Republic, Poland). As the CSN calculation technique for the smoke layer interface assessment is based on the internationally recognised ISO calculation technique, further investigations will also contribute to the possible further development of the ISO technique, which is used worldwide.
Author Contributions
For research articles with several authors, a short paragraph specifying their individual contributions must be provided. The following statements should be used “Conceptualisation, M.P. and J.P.; methodology, J.P.; software, M.P. and J.P.; validation, L.B. and D.S.; formal analysis, Z.H. and K.K.; investigation, M.P. and J.P.; resources, Z.H. and K.K.; data curation, M.P.; writing—original draft preparation, M.P., J.P., Z.H. and M.T.; writing—review and editing, L.B., D.S. and V.V.; visualisation, M.P.; supervision, L.B., V.V., S.Z. and D.D; project administration, J.P.; funding acquisition, Z.H. All authors have read and agreed to the published version of the manuscript.
Funding
This research was funded by the project “Verification of the rate of fall of the smoke layer created during fires by a real experiment”, grant number SP2022/87.
Institutional Review Board Statement
Not applicable.
Informed Consent Statement
Not used.
Conflicts of Interest
The authors declare no conflict of interest.
Legend of Symbols
| A | floor area of enclosure (m2) |
| ASET | available Safe Egress Time (min) |
| D | diameter of the fire (m) |
| E | etalon value (-) |
| H | height of enclosure (m) |
| HN | standard calorific value of petrol (MJ.kg-1) |
| Heff | effective combustion coefficient (-) |
| Lf | mean flame height (m) |
| P | value of assessed model (-) |
| RHRf | maximum heat release rate (kW.m-2) |
| RSET | required Safe Egress Time (min) |
| Q | heat release rate (kW) |
| Q’ | heat flux per unit area (kW.m-2) |
| S | area of the fire (m2) |
| T | ambient temperature (°C) |
| a | coefficient expressing the combustion rate from the perspective of the character of the flammable materials (-) |
| j | summation index (-) |
| k | number of samples (-) |
| m | mass burning rate per unit area (kg.m-2.min-1) |
| mc | total amount of liquid burnt off during the experiment (l) |
| n | n-th power (-), n = 2 for a t-quadratic fire |
| p | fire loading (kg.m-2) |
| average fire loading (kg.m-2) | |
| ph | ambient pressure (kPa) |
| p1 | probability of the occurrence and the spread of the fire (-) |
| t | fire growth time (s) |
| tg | time needed to reach reference rate (the reference flow is understood to be the value of thermal 1055 kW) (s) |
| t(z) | time of the reaching a level of smoke 2.5 m and the floor space (min) |
| z | interface height above the base of fire source (m) |
| a | fire growth rate (kW.s-2) |
| c | fraction of heat released that is emitted as thermal radiation (-) |
| ϕ | relative humidity (%) |
| rs | smoke density (kg.m-3) |
References
- A Shared Vision, a Common Approach: A Stronger Europe. Global Strategy of Foreign and Safety Policy of the European Union; European Union, Brussels, Belgium, 2016.
- Kubeckova, D.; Krocova, S. Long-term sustainability of the landscape in new climatic conditions. IOP Conference Series: Earth and Environmental Science. 2017, vol. 92, p 012032. ISSN 1755-1307, 1755-1315. [CrossRef]
- Directive of the European Parliament and Council. 2011. Directive of the European Parliament and Council (EU) No. 305/2011 of 9 March 2011 laying down harmonised conditions for the marketing of construction products and repealing Council Directive 89/106/EEC. Available online: https://eur-lex.europa.eu/legal-content/EN/TXT/PDF/?uri=CELEX:32011R0305&from=EN (accessed on 10 August 2023).
- Folwarczny, L.; Pokorny, J. Evacuation of persons. Ostrava: Association of Fire and Safety Engineering, 2006. ISBN 978-80-86634-92-0.
- Zehfuss, J. Guide to engineering methods of fire protection. Braunschweig: Association for the Promotion of German Fire Protection e. V. (vfdb), Technical and Scientific Advisory Board (TWB), 2020. P 494. Technical report TB 04/01, 4th revised and expanded edition. Available online: https://www.vfdb.de/fileadmin/download/vfdb-Leitfaden_IngMethoden_4Auflage_2020-03-26.pdf (accessed on 12 July 2023).
- Hurley, M. SFPE handbook of fire protection engineering. New York, NY: Springer Science+Business Media, 2015. ISBN 978-1-4939-2564-3.
- Karlsson, B.; Quintiere, J. G. Enclosure fire dynamics. Boca Raton, FL: CRC Press, 2000. 315 s. Environmental and energy engineering series. ISBN 978-0-8493-1300-4.
- Fu, M.; Liu, R.; Zhang, Y. Why do people make risky decisions during a fire evacuation? Study on the effect of smoke level, individual risk preference, and neighbor behavior. Safety Science. 2021, vol. 140, p 105245. ISSN 09257535. [CrossRef]
- Klote, J. H.; Milke, J. A. Principles of smoke management. Atlanta, Ga: American Society of Heating, Refrigerating and Air-Conditioning Engineers, 2002. p 377. ISBN 978-1-883413-99-6.
- Brändli, O. et al. Fire protection in buildings. REHVA Association of European heating, ventilation and air conditioning engineers, 2018. ISBN 978-3-931384-92-0.
- CSN P CEN/TR 12101-5 Smoke and Heat Control Systems - Part 5: Guidelines on Functional Recommendations and Calculation Methods for Smoke and Heat Exhaust Ventilation Systems. Office for Technical Standardisation, Metrology and State Testing. Prague: 2008.
- BS 7974 Application of Fire Safety Engineering Principles to the Design of Buildings. Code of Practice. British Standards Institution. London: 2019.
- Haouari-Harrak, S.; Mehaddi, R.; Boulet, P.; Koutaiba, E.M. Evaluation of the room smoke filling time for fire plumes: Influence of the room geometry. Fire and Materials. 2020, vol. 44, no. 6, pp 793–803. ISSN 0308-0501, 1099-1018. [CrossRef]
- Chow, W.K. Determination of the Smoke Layer Interface Height for Hot Smoke Tests in Big Halls. Journal of Fire Sciences. 2009, roč. 27, no. 2, pp 125–142. ISSN 0734-9041, 1530-8049. [CrossRef]
- Yao, H.; Chen, J.; Zhao, Z.; Liu, F.; Liang, D. Measurement of the smoke layer interface in fires. Automation in Construction. 2014, roč. 37, s. 223–227. ISSN 09265805. [CrossRef]
- Capote, J. A.; Alvear, D.; Abreu, O.V.; Lazaro, M.; Espina, P. Scale Tests of Smoke Filling in Large Atria. Fire Technology. 2009, roč. 45, č. 2, s. 201–220. ISSN 0015-2684, 1572-8099. [CrossRef]
- Wegrzynski, W.; Konecki, M. Influence of the fire location and the size of a compartment on the heat and smoke flow out of the compartment. Lublin, Poland: 2018, p. 110007, Available online: http://aip.scitation.org/doi/abs/10.1063/1.5019110 (accessed on 20 June 2023). [CrossRef]
- Vigne, G.; Wegrzinsky, W.; Cantizano, A.; Ayala, P.; Rein, G.; Gutiérrez-Montes, C. Experimental and calculation study of smoke dynamics from multiple fire sources inside a large-volume building. Building Simulation. 2021, vol. 14, no. 4, pp 1147–1161. ISSN 1996-3599, 1996-8744. [CrossRef]
- Qin, Y.; Huang, W.; Xiang, Y.; Yhang, R.; Lu, P.; Tan, X. Feasibility Analysis on Natural Smoke Extraction for Large Space Warehouse Buildings. Procedia Engineering. 2016, vol. 135, pp 495–500. ISSN 18777058. [CrossRef]
- Yuen, A. et al. Natural Ventilated Smoke Control Simulation Case Study Using Different Settings of Smoke Vents and Curtains in a Large Atrium. Fire. 2019, vol. 2, no. 1, p 7. ISSN 2571-6255. [CrossRef]
- Tang, F.; Zhao, Z.; Zhao, K. Experimental investigation on carriage fires hazards in the longitudinal ventilated tunnels: Assessment of the smoke stratification features. Safety Science. 2020, vol. 130, p 104901. ISSN 09257535. [CrossRef]
- Hu, P.; Zhang, Z.; Zhang, X.; Tang, F. An experimental study on the transition velocity and smoke back-layering length induced by carriage fire in a ventilated tunnel. Tunnelling and Underground Space Technology. 2020, vol. 106, p 103609. ISSN 08867798. [CrossRef]
- Morgan, H.P.; Hansell, G.O. Atrium buildings: Calculating smoke flows in atria for smoke-control. Fire Safety Journal. 1987, vol. 12, no. 1, pp 9–35. ISSN 03797112. [CrossRef]
- Sun, N.; Wang, L.; Xu, H. Study on mutual influence of water spray and natural smoke exhaust system in single chamber fire based on FDS simulation. Changsha City, China, 2018, p 020002. Available online: http://aip.scitation.org/doi/abs/10.1063/1.5075642 (accessed on 10 April 2023). [CrossRef]
- Li, K. Y.; Spearpoint, M. J. Simplified Calculation Method for Determining Smoke Downdrag Due to a Sprinkler Spray. Fire Technology. 2011, vol. 47, no. 3, pp 781–800. ISSN 0015-2684, 1572-8099. [CrossRef]
- Fire Model Survey of Computer Models for Fire and Smoke. Combustion Science & Engineering, Inc. Available online: http://www.firemodelsurvey.com (accessed on 9 January 2023).
- ISO 16730-1 Fire safety engineering - Procedures and requirements for verification and validation of calculation methods — Part 1: General. Geneva: International Organization for Standardization, 2015. p 42.
- NFPA 92 Standard for Smoke Control Systems. Quincy: National Fire Protection Association, 2021.
- ISO16735 Fire safety engineering - Requirements governing algebraic equations - Smoke layers. Geneva: International Organization for Standardization, 2006. p 55.
- CSN 73 0802 ed. 2 Fire protection of buildings - Non-industrial buildings. Prague: Office for Technical Standardization, Metrology and State Testing, 2020.
- CSN 73 0804 ed. 2 Fire protection of buildings - Industrial buildings. Prague: Office for Technical Standardization, Metrology and State Testing, 2020.
- Hendl, J. The overview of statistical methods: data analysis and meta-analysis. Fifth, extended edition. Prague: Portal, 2015, 736 p. ISBN 978-80-262-0981-2.
- Warner, M.R. Applied Statistics II. Multivariable and Multivariate Techniques. Place of publication not identified: SAGE PUBLICATIONS, 2020. 3rd. ISBN 978-1-07-181337-9.
- Podkul, M.; Pokorny, J.; Brumarova, L.; Dlouha, D.; Heinzova, Z.; Kubricka, K.; Szurgacz, D.; Fanta, M. New Calculation Technique for Assessment of Smoke Layer Interface in Large Buildings in Connection with the Design of Buildings in the Czech Republic. Sustainability. 2022, roč. 14, č. 11, s. 6445. ISSN 2071-1050. [CrossRef]
- Peacock, R.D. CFAST, Fire Growth and Smoke Transport Modeling [online]. [cit. 2018-05-19]. Available online: https://www.nist.gov/el/fire-research-division-73300/product-services/consolidated-fire-an d-smoke-transport-model-cfast (accessed on 11 July 2023).
- FDS-SMV. Fire Dynamics Simulator [online]. [cit. 2019-03-22]. Available online: https://pages.nist.gov/fds-smv/ (accessed on 11 July 2023).
- Cote, A. E. Fire protection handbook. 19. ed. ff ed. Quincy, Mass: National Fire Protection Association, 2003. ISBN 978-0-87765-474-2.
- ISO 16734 Fire safety engineering - Requirements governing algebraic equations - Fire plumes. Geneva: International Organization for Standardization, 2006. s. 17.
- EN 1991-1-2 Eurocode 1: Actions on structures - Part 1-2: General actions - Actions on structures exposed to fire. Belgium, Brussels: CEN/TC 191Fixed firefighting systems, 2002.
- ISO 16736 Fire safety engineering - Requirements governing algebraic equations - Ceiling jet flows. Geneva: International Organization for Standardization, 2006. p 17.
- Brein, D. Areas of application and limits for practice-relevant model approaches for evaluating the spread of smoke in buildings (plume formulas). Version 1.2. Karlsruhe: Research center for fire protection technology at the University of Karlsruhe, 2001. P 59.
- Klote, H. J. Method of Prediction Smoke Movement in Atria with Application to Smoke Management. NISTIR 5516 ed. Gaithersburg: Building and Fire Reserch Laboratory, National Institute of Standards and Technology, 1994. p 98.
- National Institute of Standards and Technology. Available online: https://www.nist.gov/ (accessed on 5 July 2023).
- CFAST, Fire Growth and Smoke Transport Modeling [online]. Available online: https://www.nist.gov/el/fire-research-division-73300/product-services/consolidated-fire-and-smoke-transport-model-cfast (accessed on 4 July 2023).
- PVTT | Technical Research Centre of Finland Ltd [online]. [cit. 2023-08-5]. Available online: https://www.vttresearch.com/en (accessed on 5 July 2023).
- PyroSim | Thunderhead Engineering. https://www.thunderheadeng.com/pyrosim/?gclid=Cj0KCQjwmcWDBhCOARIsALgJ2QeCpMK0AtDO1vTGJV8l9mESq8NHXnGZ4NrQnBDC2Vk5gVCdw1cjlxEaAhE9EALw_wcB (April 24, 2023).
- BlenderFDS [online]. [cit. 2023-08-5]. Available online: https://blenderfds.org/ (accessed on 5 July 2023).
- Zhang, Y.; Liu, Z.; Lin, Y.; Fu, M.; Chen, Y. New approaches to determine the interface height of fire smoke based on a three-layer zone model and its verification in large confined space. Fire and Materials. 2020, vol. 44, no. 1, pp 130–138. ISSN 0308-0501, 1099-1018. [CrossRef]
Figure 1.
Representation of the building where the large-scale experiment was carried out. Where there is: (a) general view, (b), (c) and (d) details of the front of the building (extension).
Figure 1.
Representation of the building where the large-scale experiment was carried out. Where there is: (a) general view, (b), (c) and (d) details of the front of the building (extension).

Figure 2.
Outbreak of fire. Where there is: (a) preparation of the experiment, (b) container with the centre of the fire, (c) and (d) combustion of the flammable liquid.
Figure 2.
Outbreak of fire. Where there is: (a) preparation of the experiment, (b) container with the centre of the fire, (c) and (d) combustion of the flammable liquid.
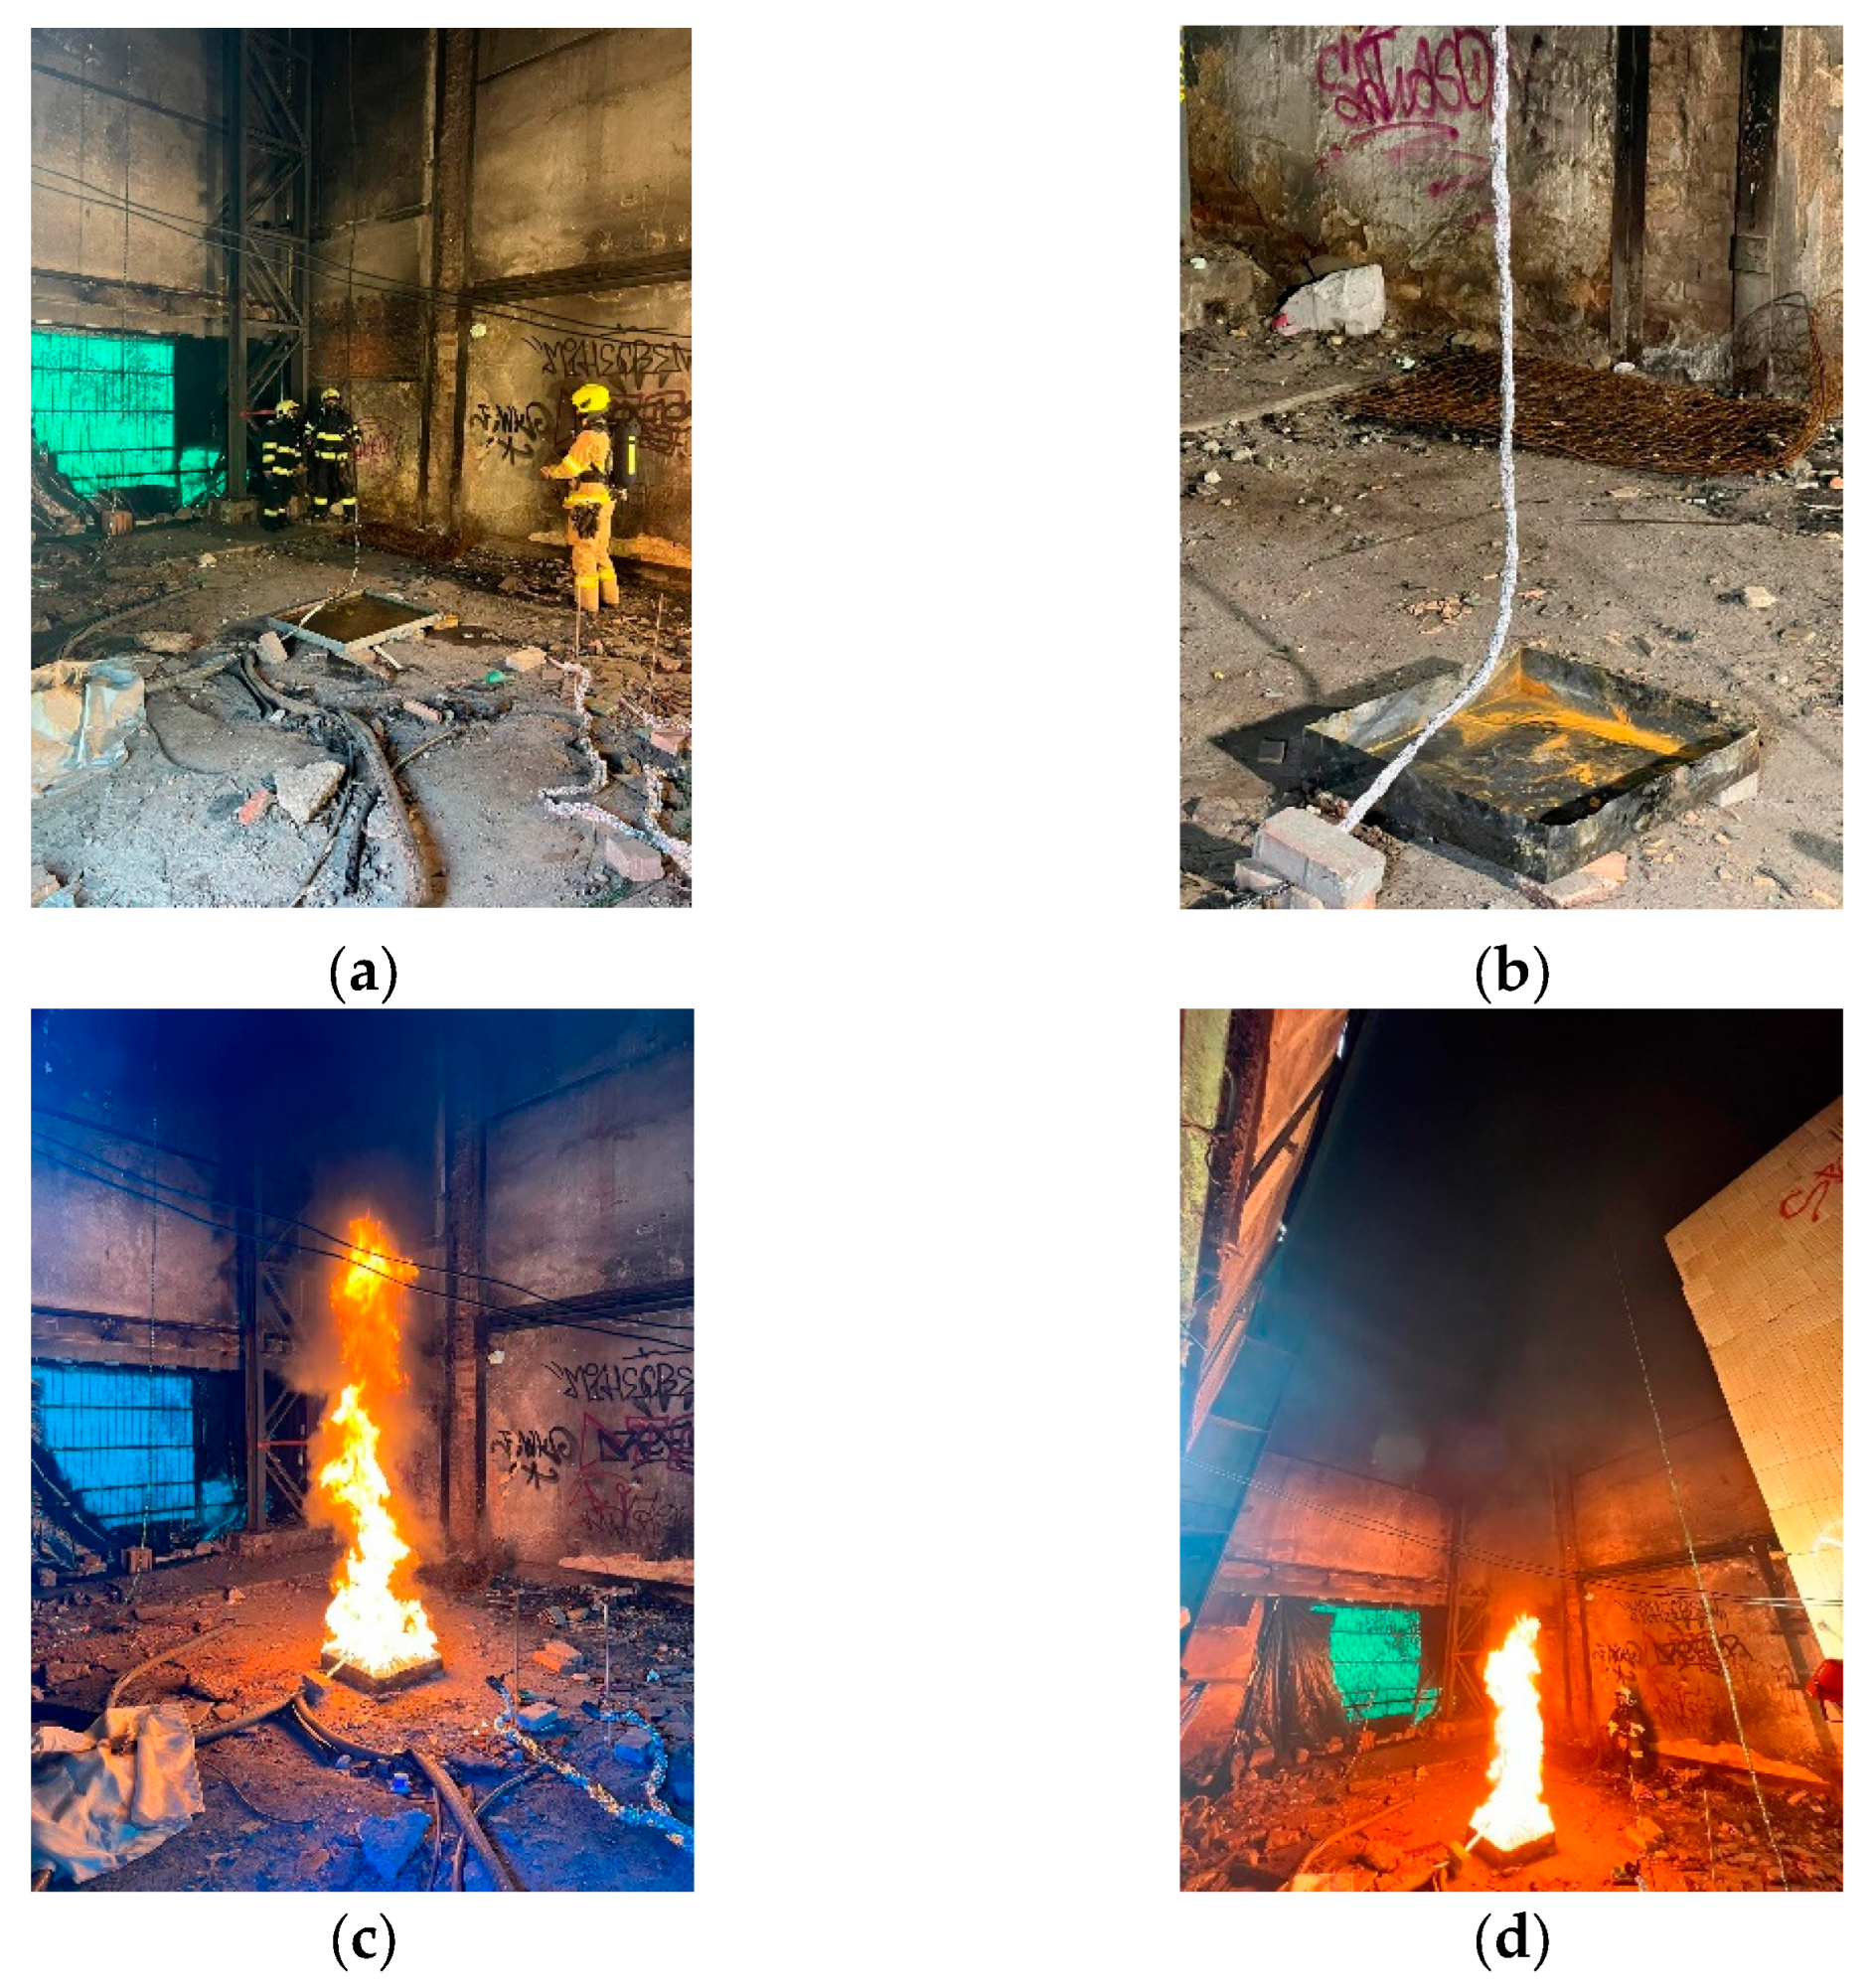
Figure 3.
Positioning of thermocouples in the experiment. Where there is: (a) detail of the thermocouple MTC 11-E1-10000-200-23, (b) and (c) location of the thermocouple chains and (d) measuring control panel ALMENO 5690-2M.
Figure 3.
Positioning of thermocouples in the experiment. Where there is: (a) detail of the thermocouple MTC 11-E1-10000-200-23, (b) and (c) location of the thermocouple chains and (d) measuring control panel ALMENO 5690-2M.
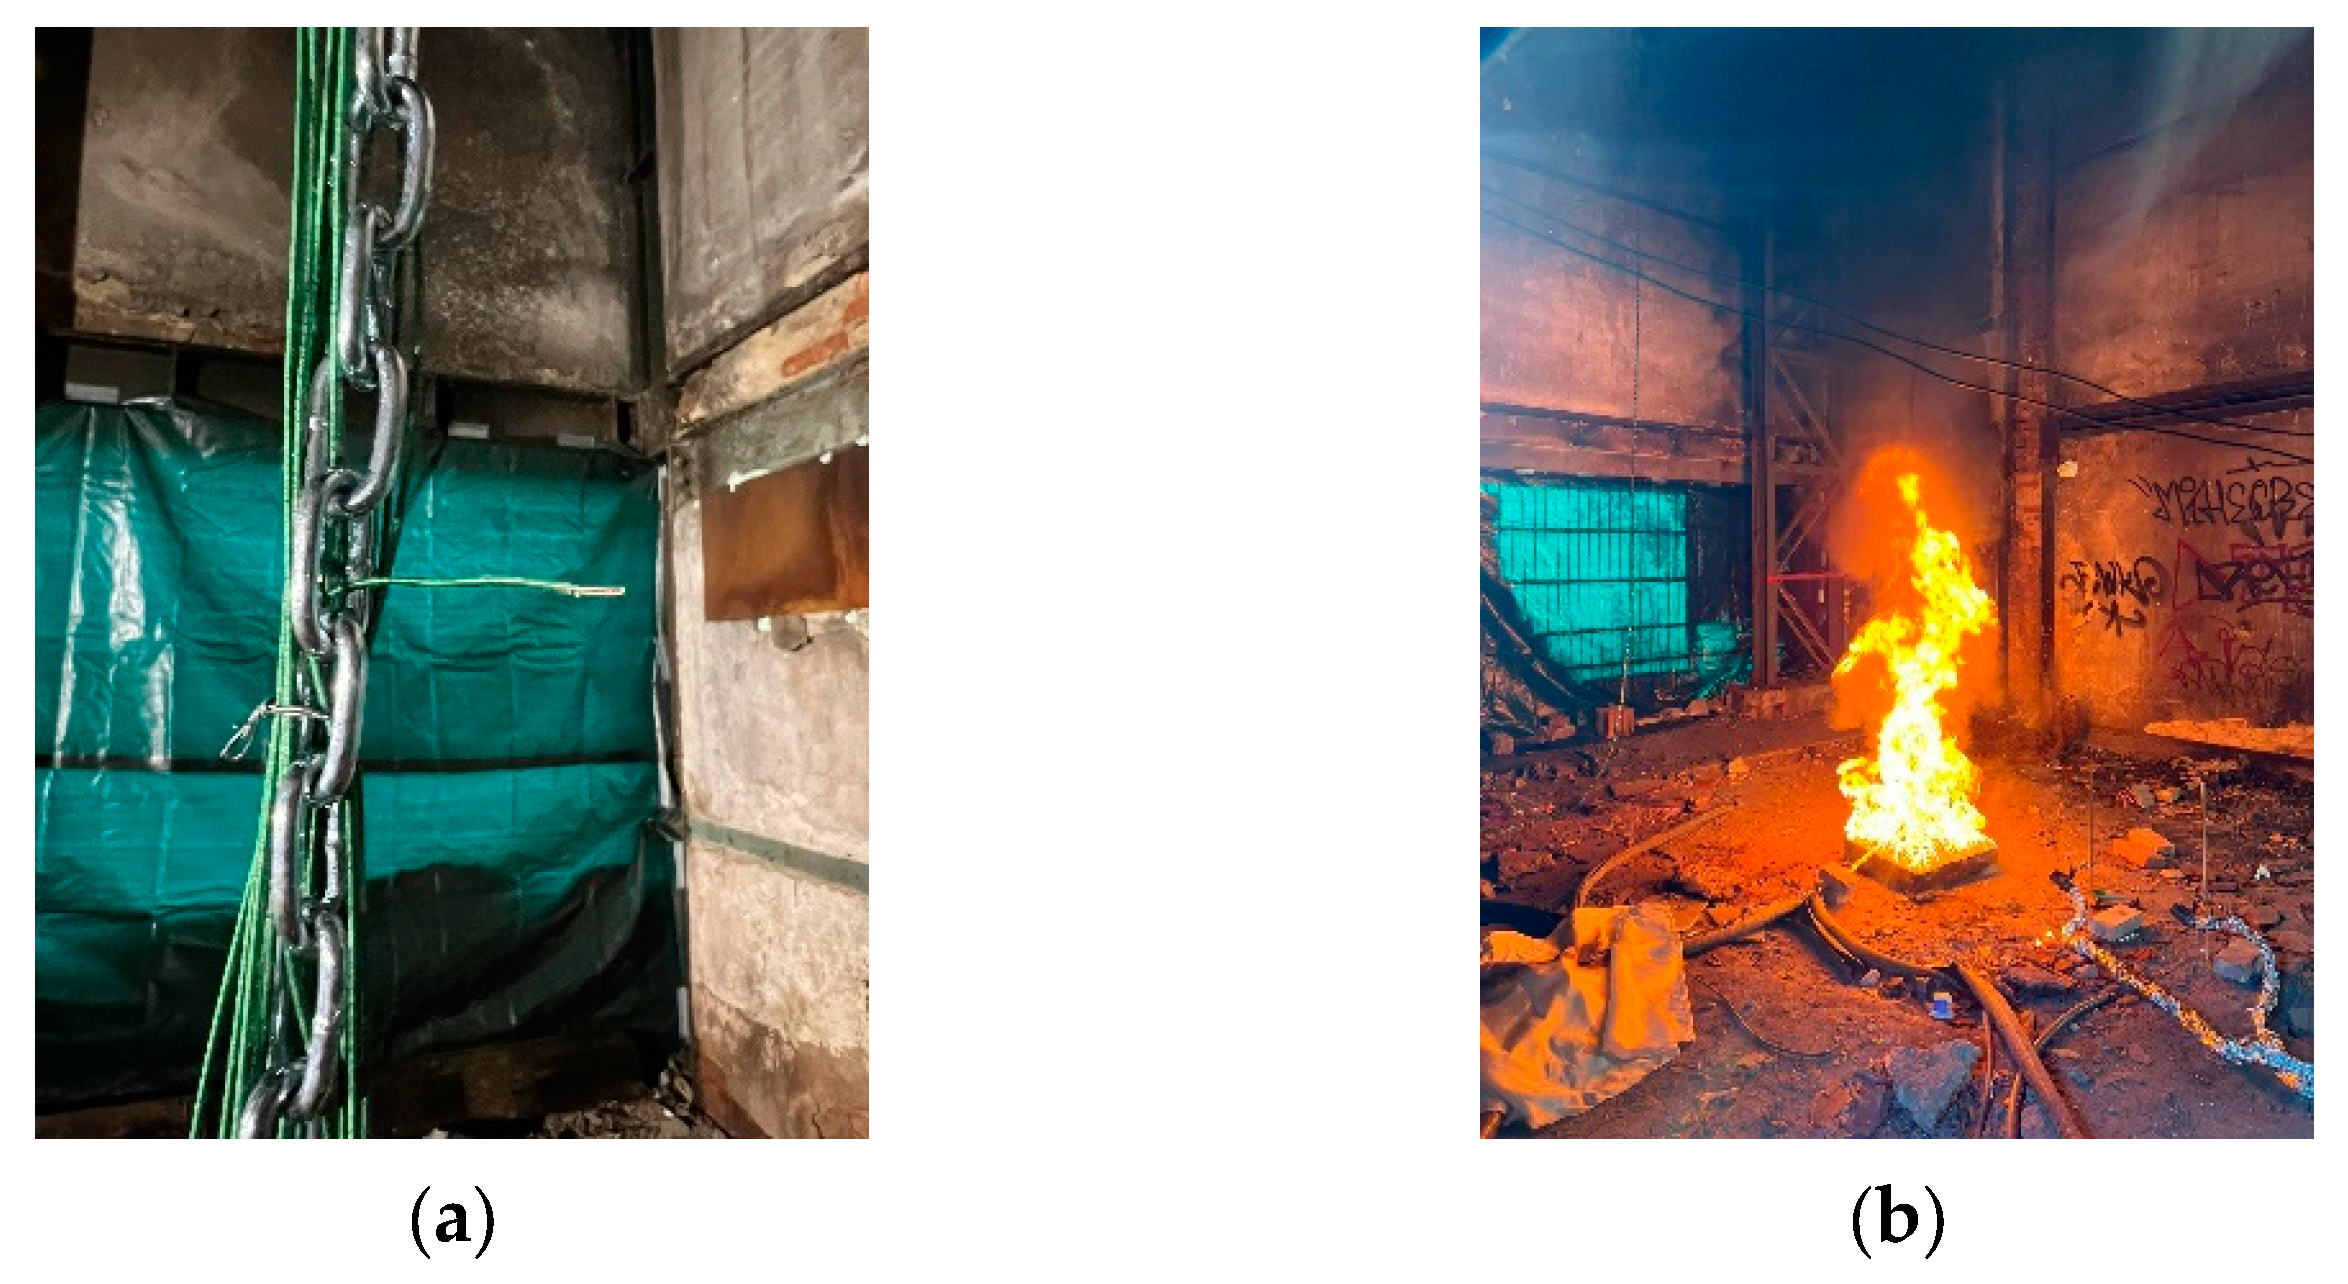
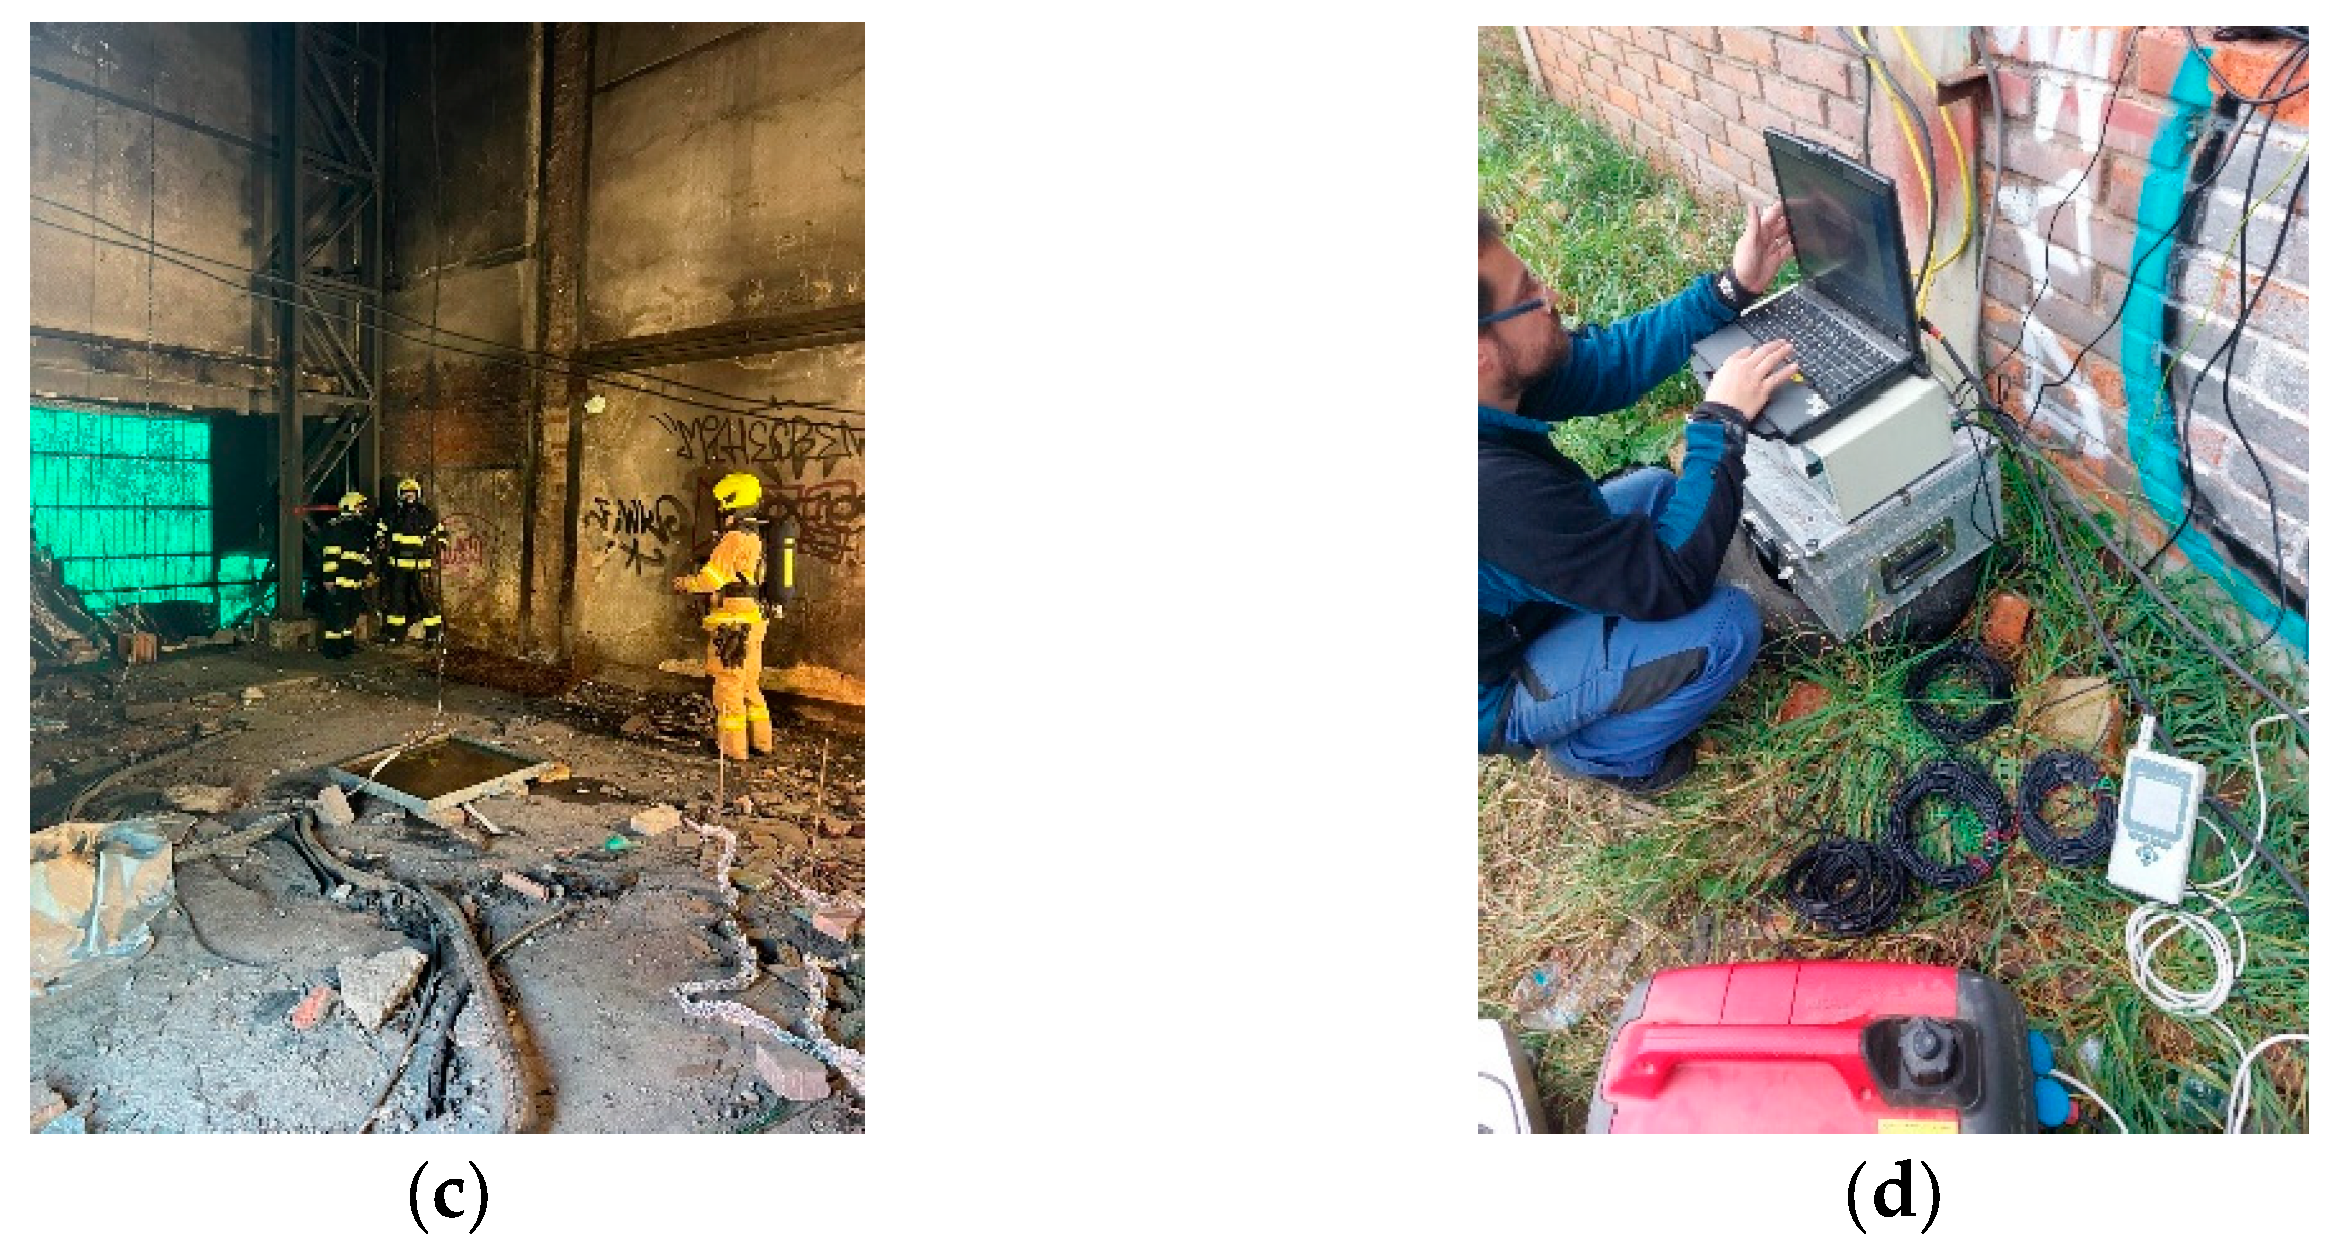
Figure 4.
Graphical outputs processed by the CFAST model. Where there is: (a) visualisation of simulation initiation at time t = 1 s, (b) smoke layer interface at time t = 50 s, (c) smoke layer interface at time t = 100 s and (d) smoke layer interface at time t = 150 s.
Figure 4.
Graphical outputs processed by the CFAST model. Where there is: (a) visualisation of simulation initiation at time t = 1 s, (b) smoke layer interface at time t = 50 s, (c) smoke layer interface at time t = 100 s and (d) smoke layer interface at time t = 150 s.
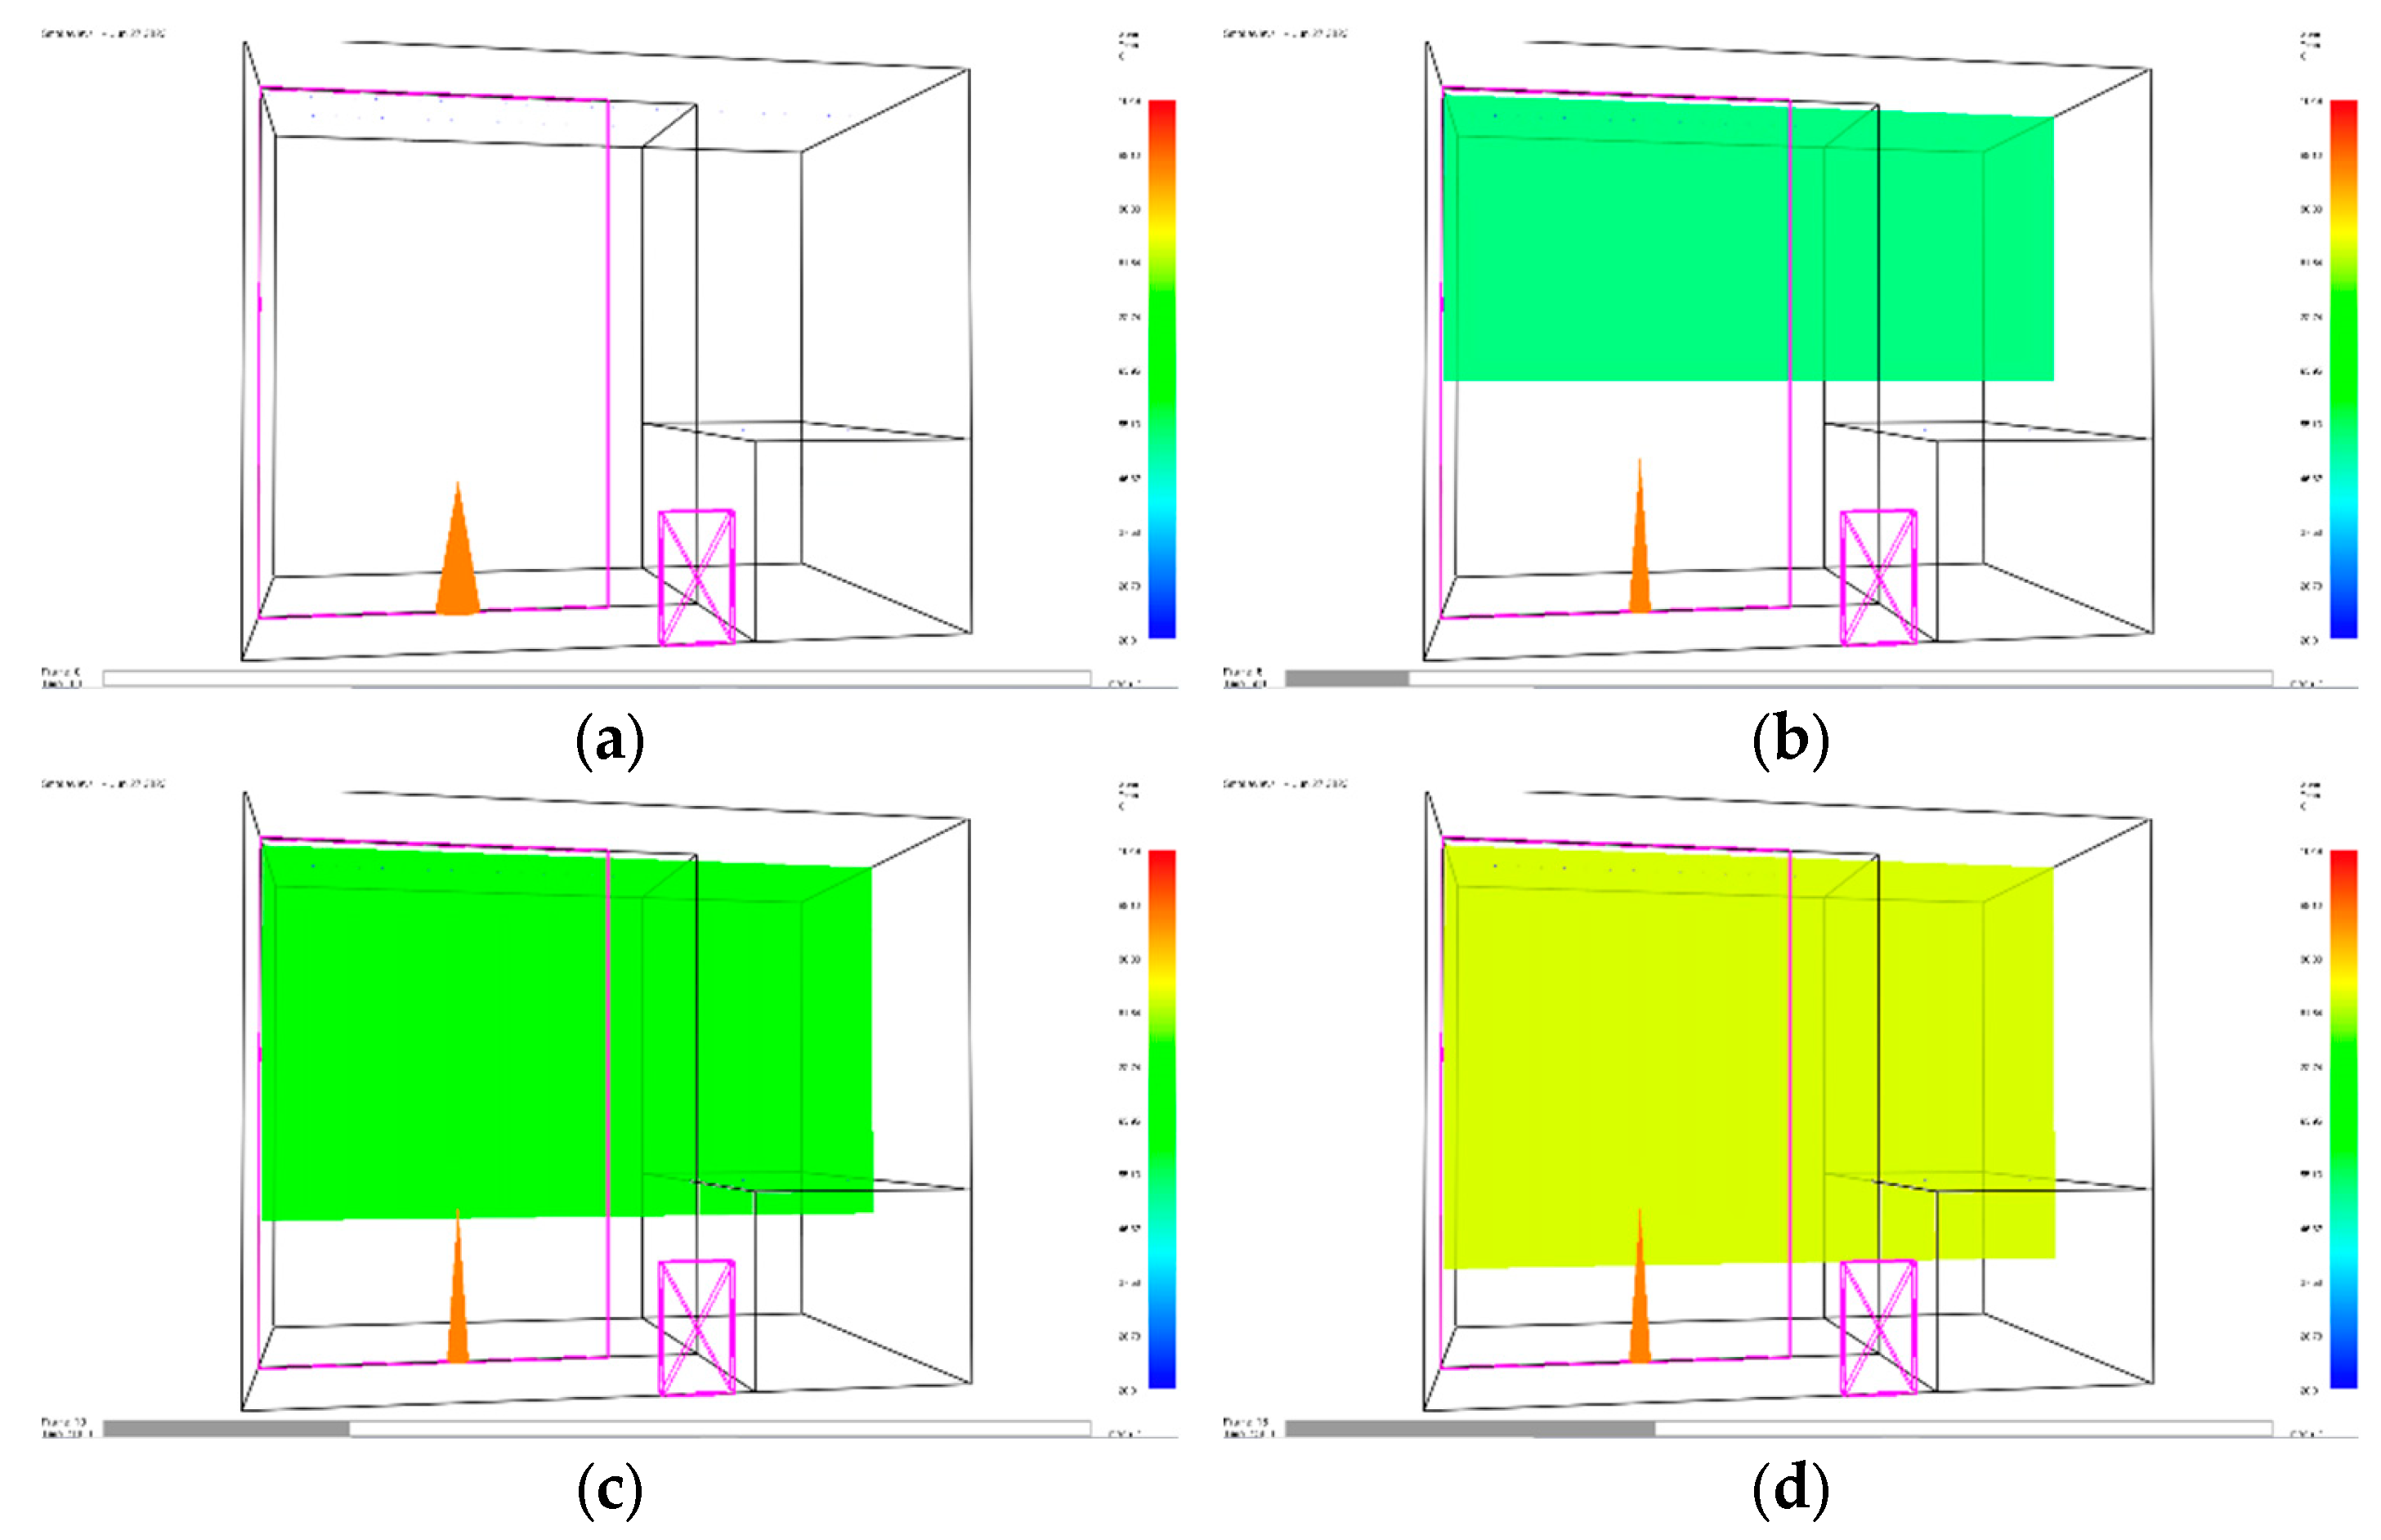
Figure 5.
Graphical outputs processed by the FDS model. Where there is: (a) smoke layer interface at time t = 1 s, (b) smoke layer interface at time t = 50 s, (c) smoke layer interface at time t = 100 s and (d) smoke layer interface at time t = 150 s.
Figure 5.
Graphical outputs processed by the FDS model. Where there is: (a) smoke layer interface at time t = 1 s, (b) smoke layer interface at time t = 50 s, (c) smoke layer interface at time t = 100 s and (d) smoke layer interface at time t = 150 s.
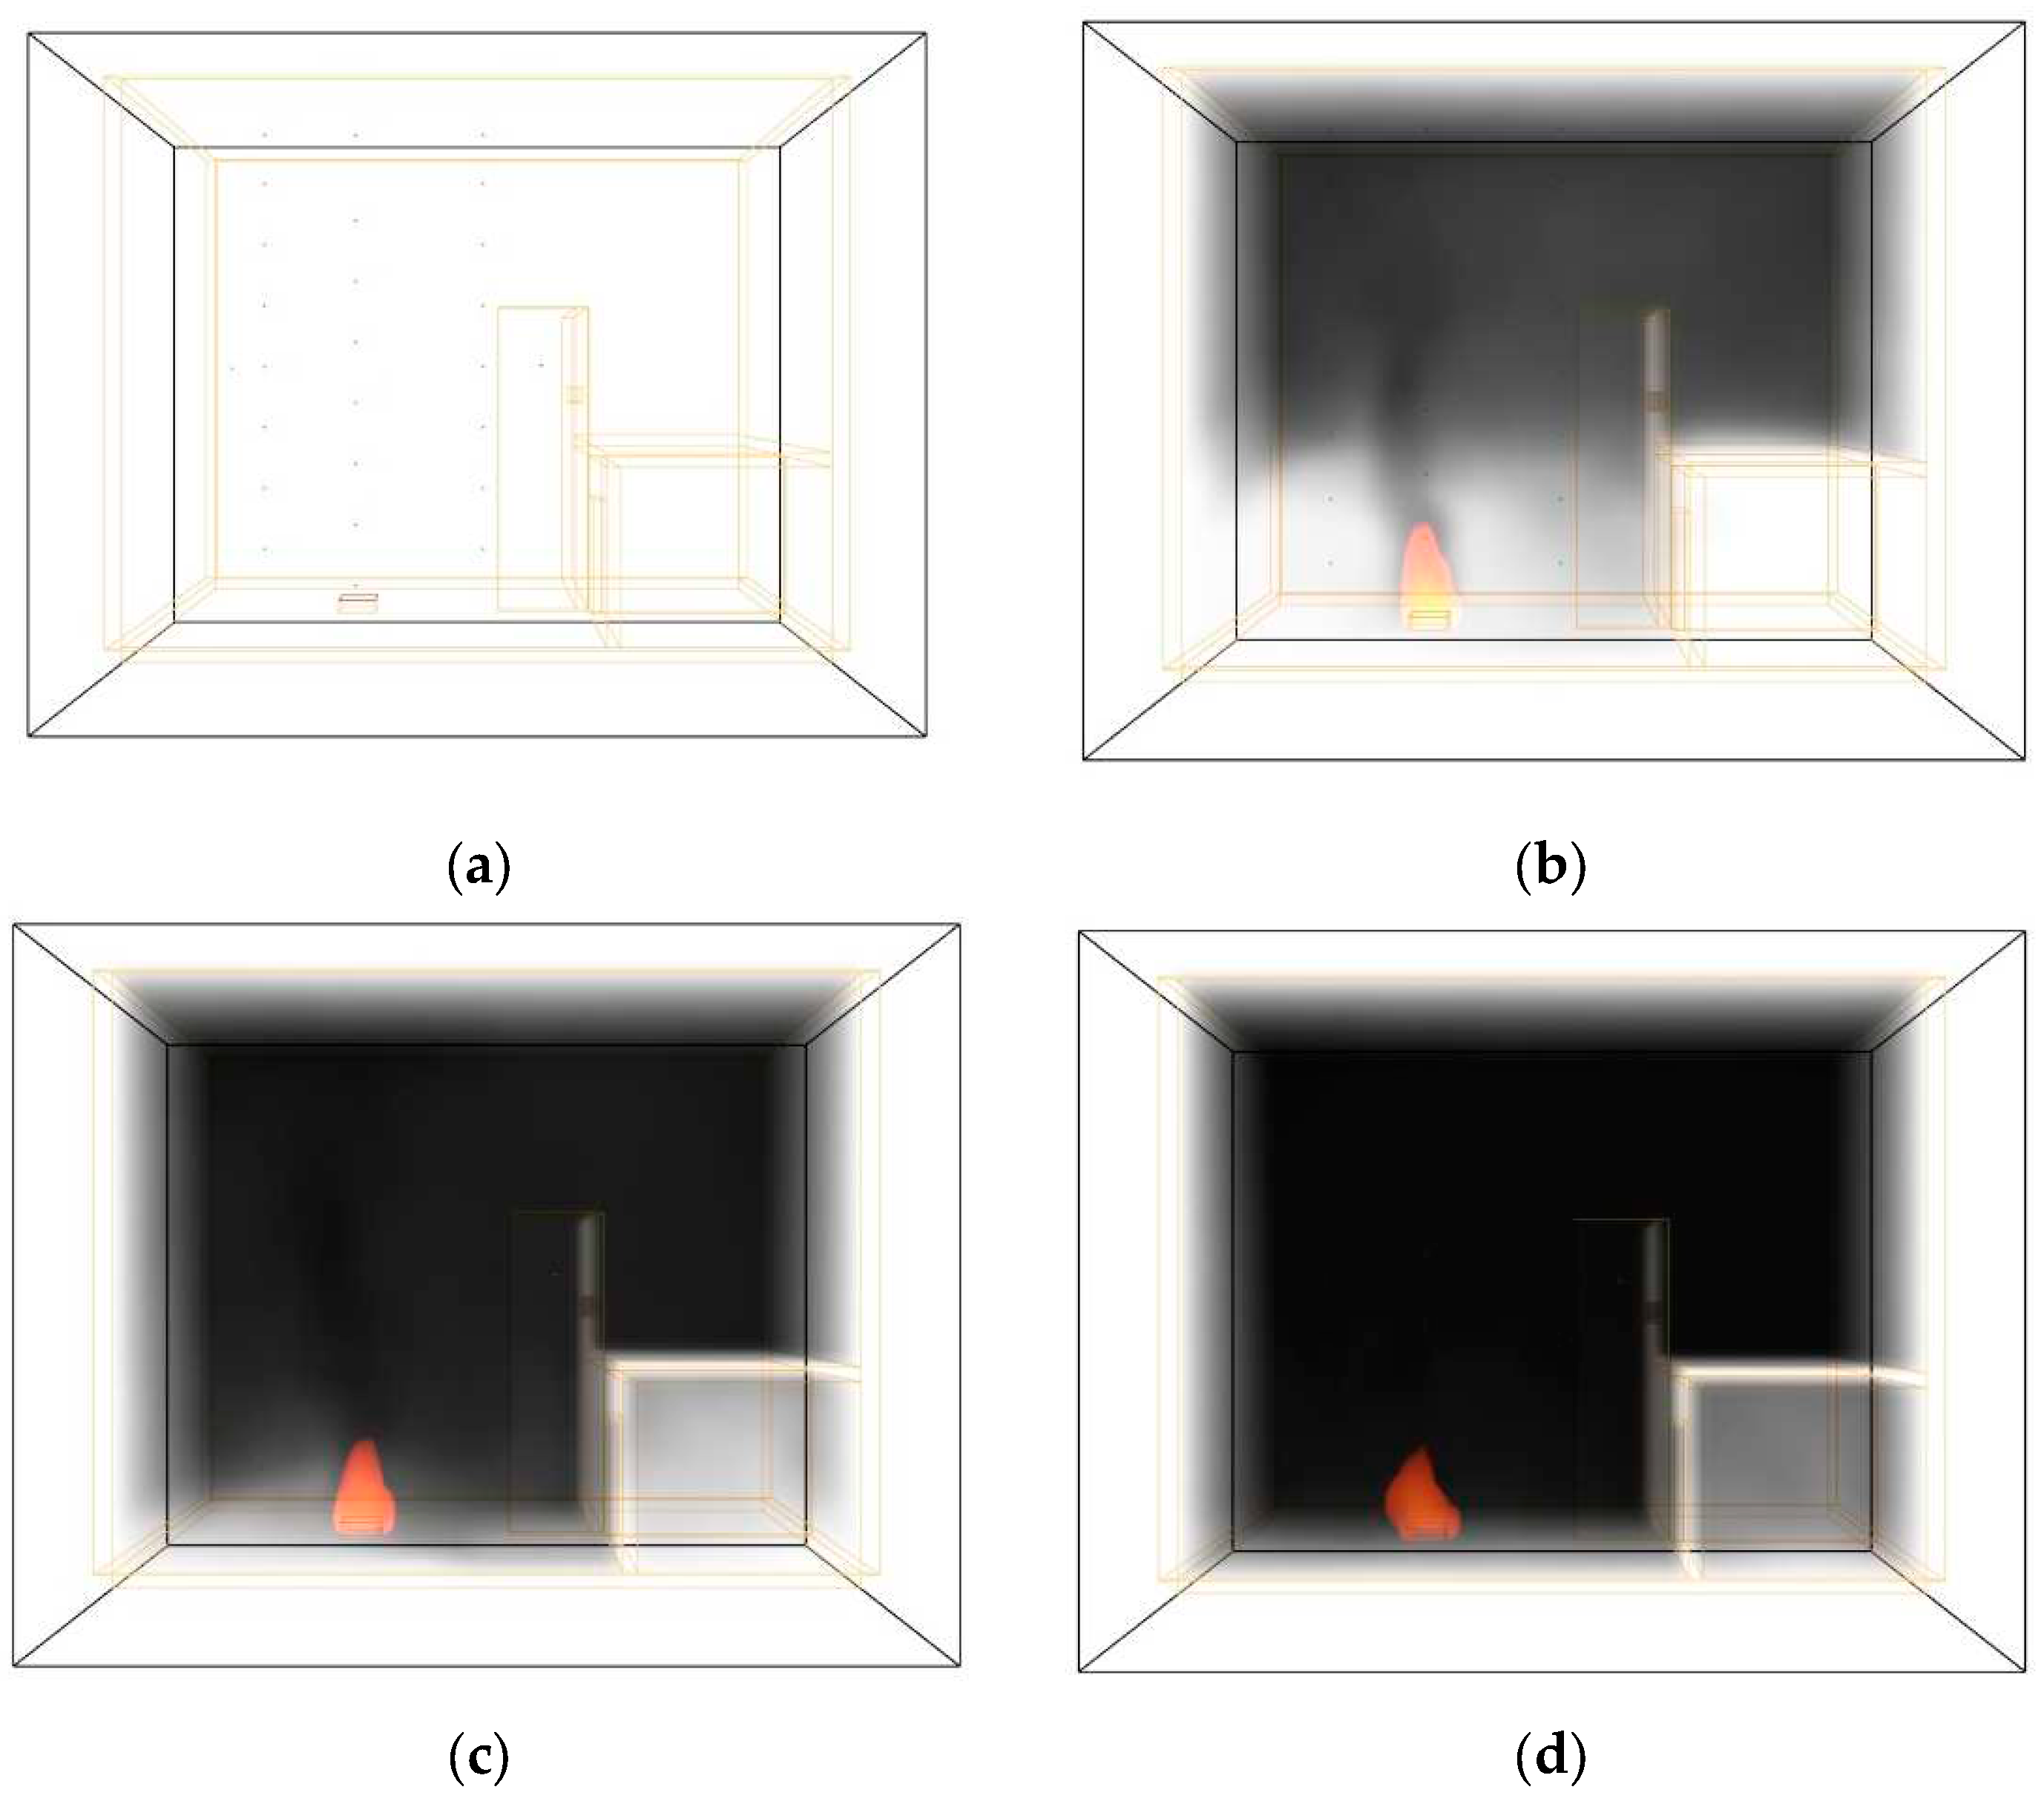
Figure 6.
Smoke layer interface determined by CSN, ISO and NFPA calculation techniques, CFAST and FDS fire models and Experiment 1 of the real experiment.
Figure 6.
Smoke layer interface determined by CSN, ISO and NFPA calculation techniques, CFAST and FDS fire models and Experiment 1 of the real experiment.
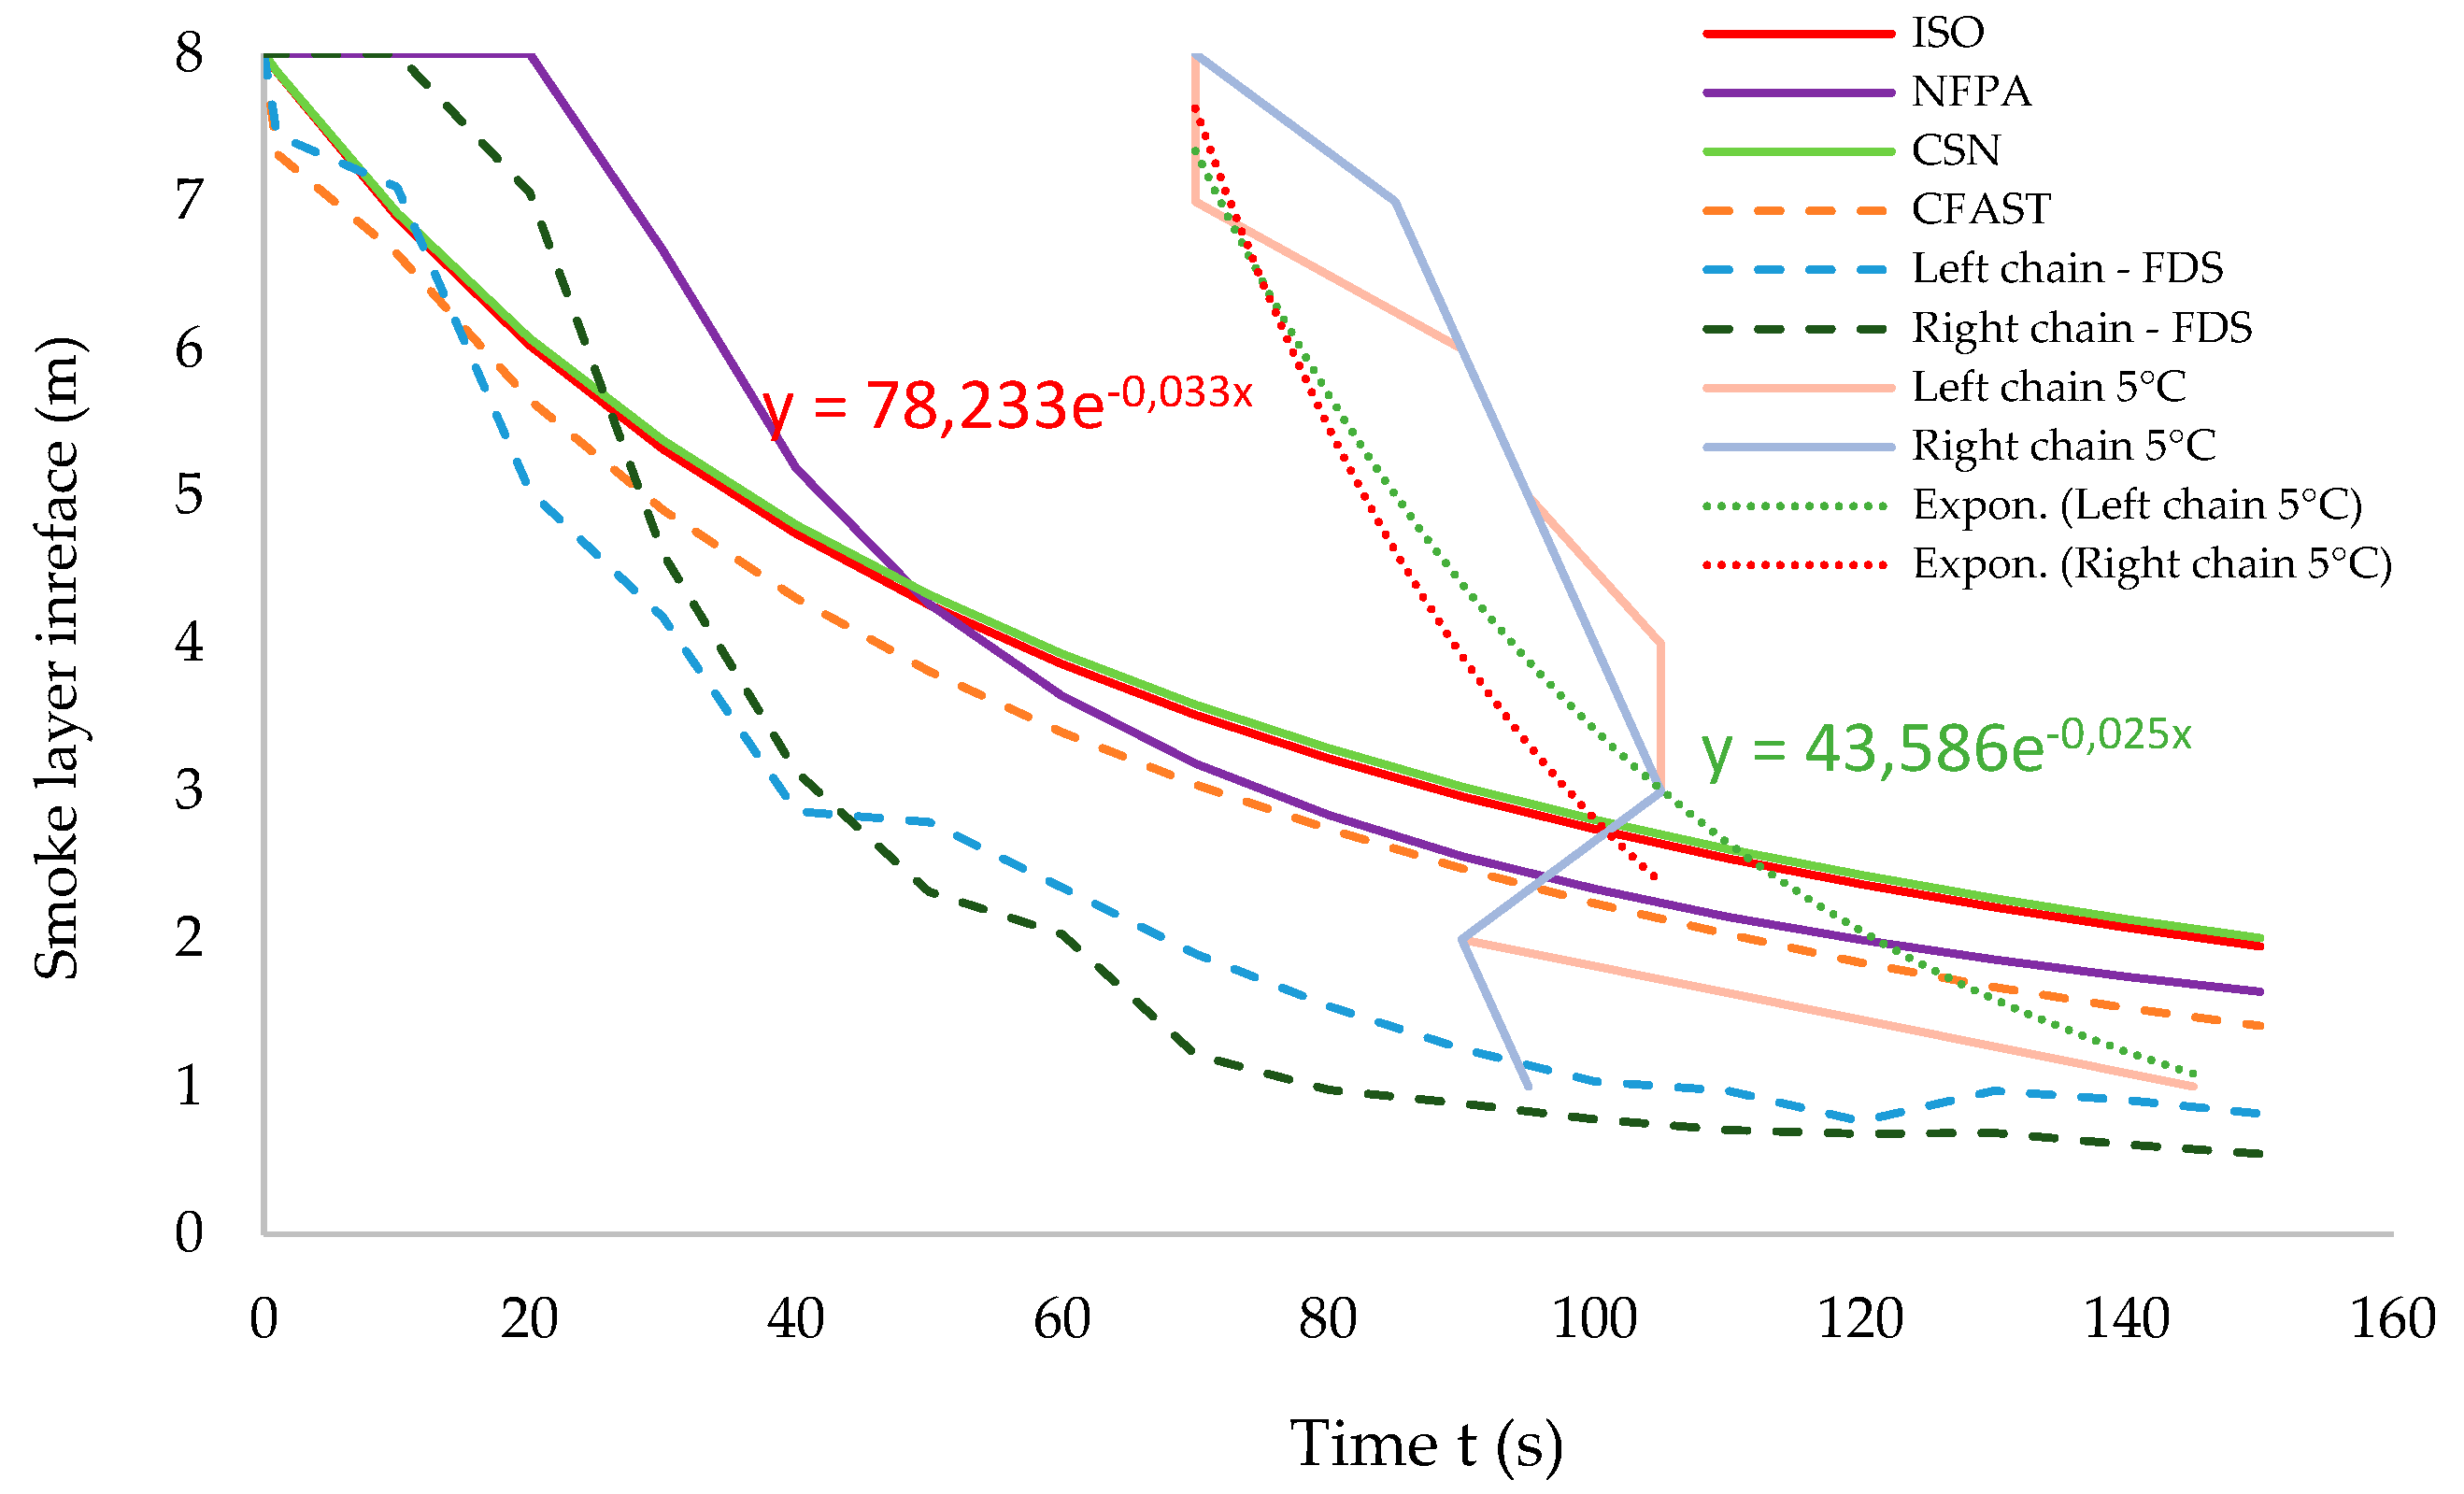
Figure 7.
Smoke layer interface determined by CSN, ISO and NFPA calculation techniques, CFAST and FDS fire models and Experiment 2 of the real experiment.
Figure 7.
Smoke layer interface determined by CSN, ISO and NFPA calculation techniques, CFAST and FDS fire models and Experiment 2 of the real experiment.
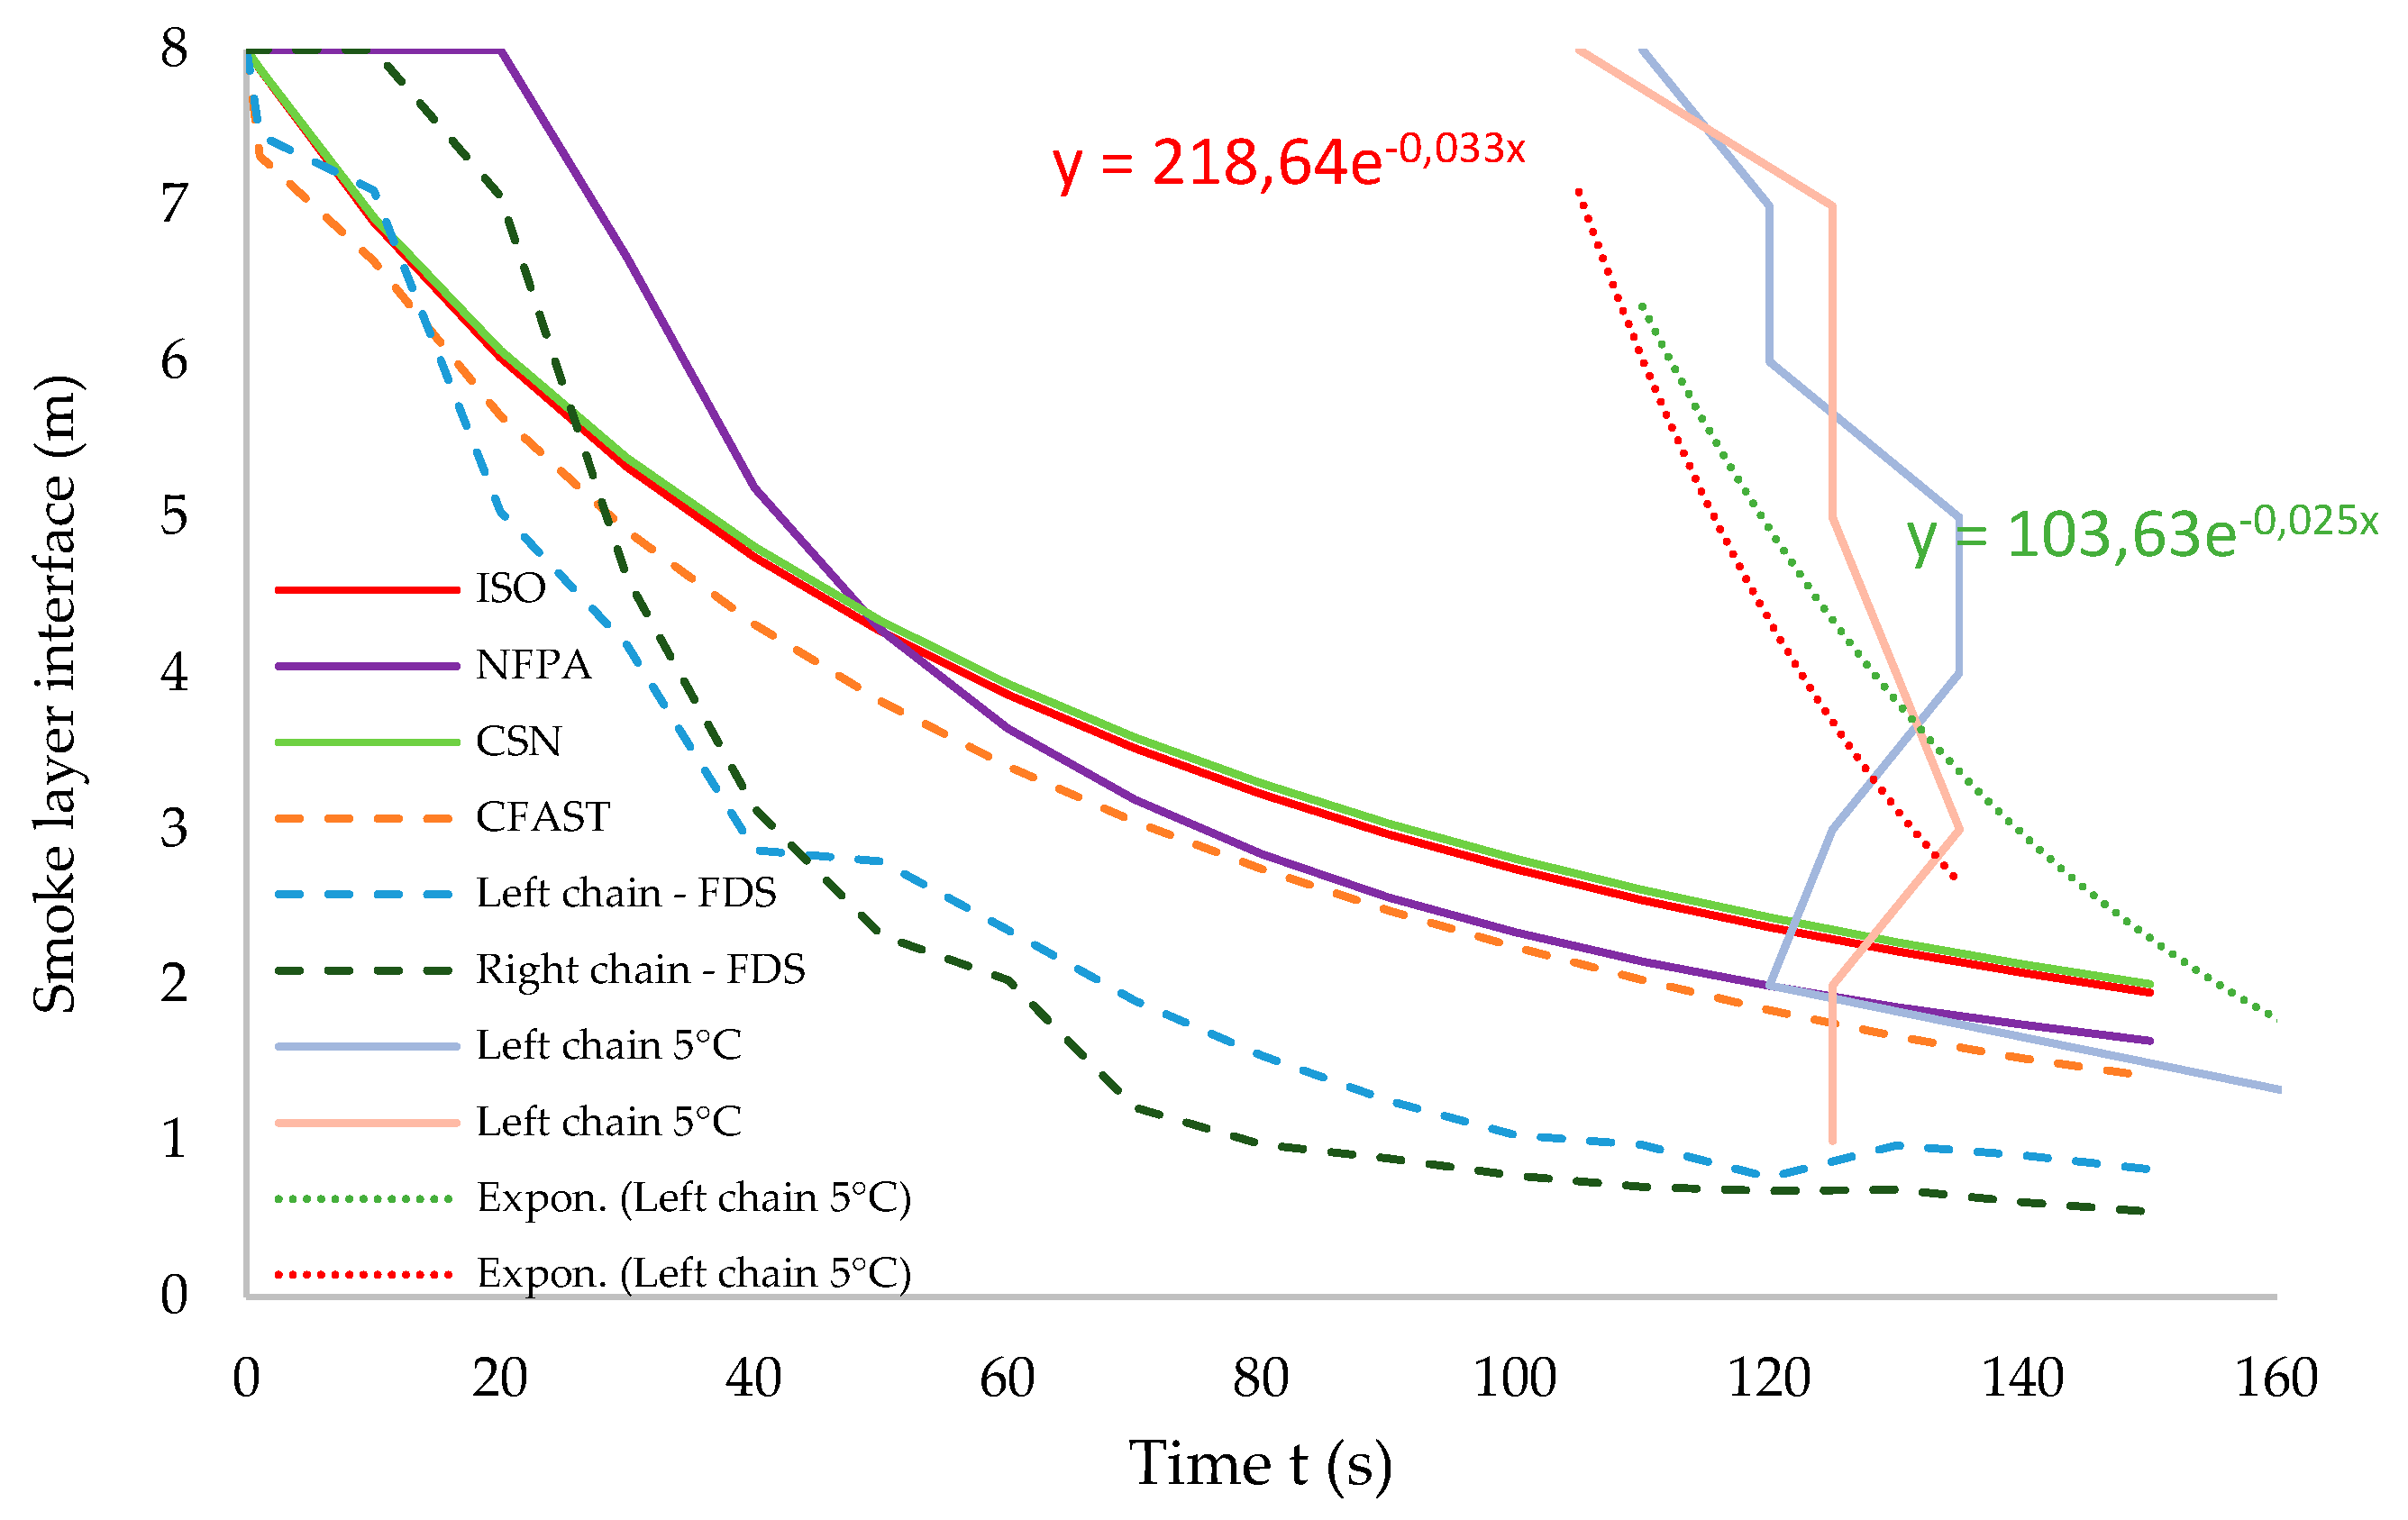
Figure 8.
Deviations determined by the RMSE method for individual calculation and simulation techniques and experiment 1 of the real experiment.
Figure 8.
Deviations determined by the RMSE method for individual calculation and simulation techniques and experiment 1 of the real experiment.
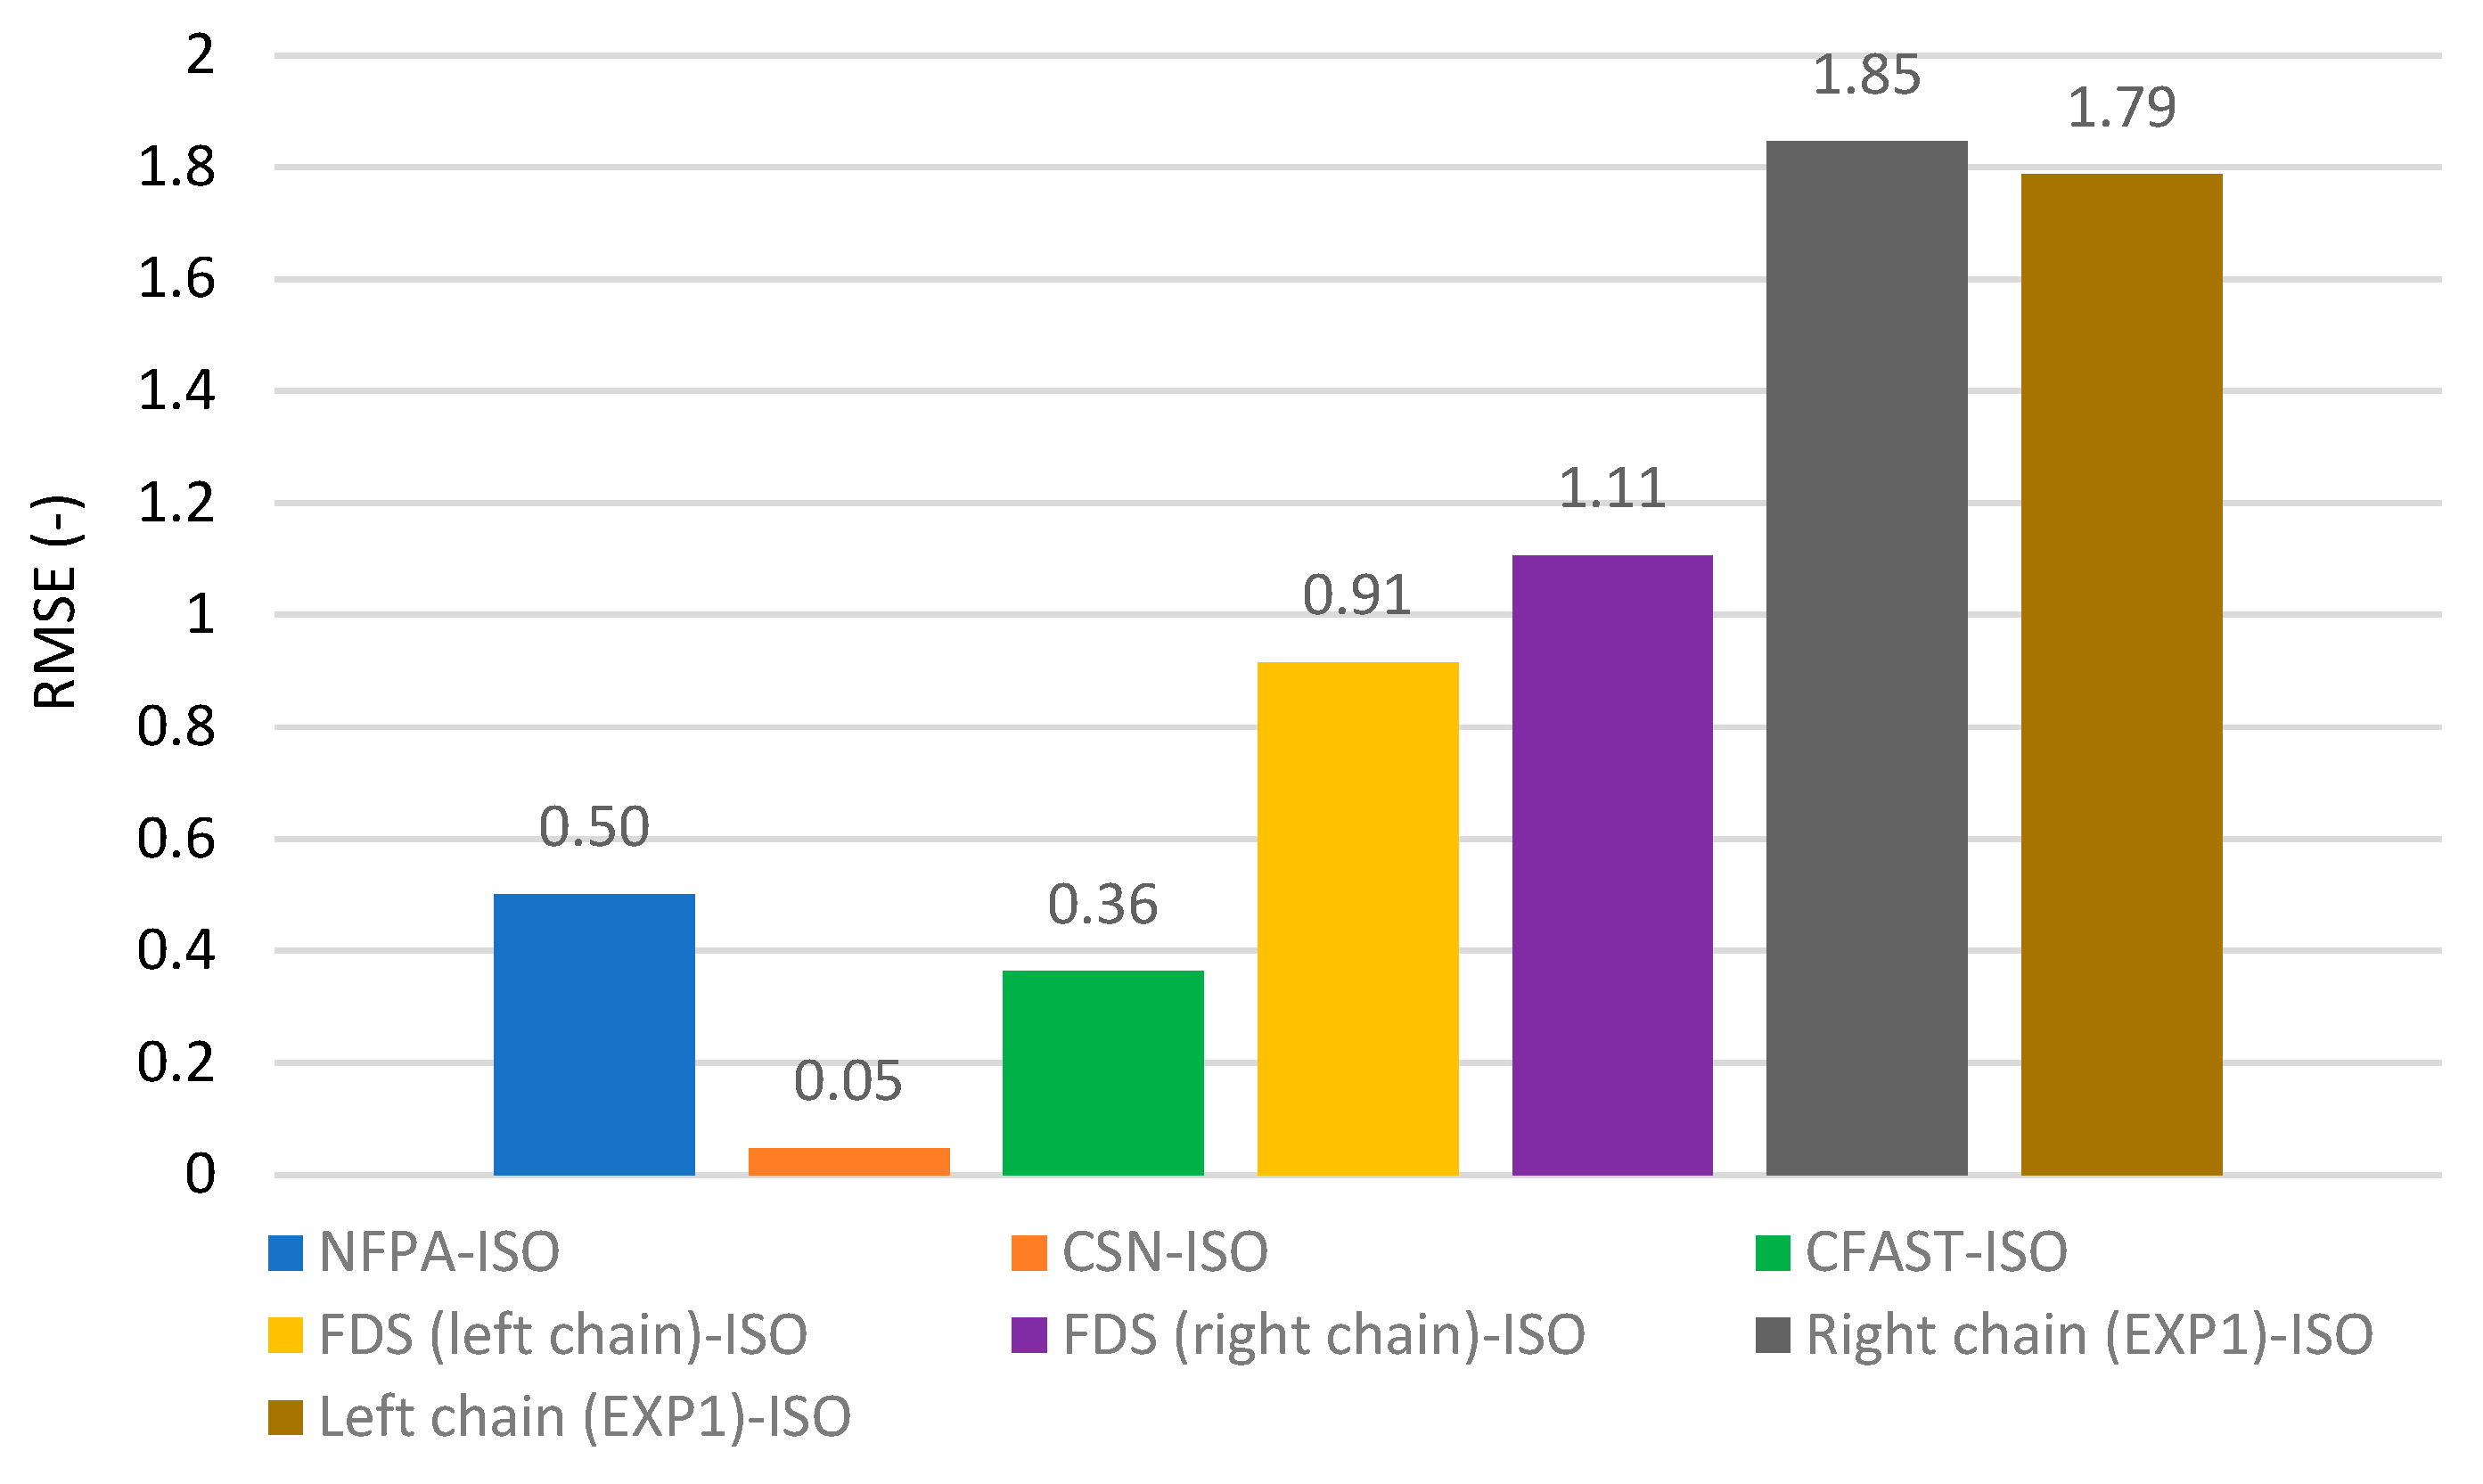
Figure 9.
Deviations determined by the RMSE method for individual calculation and simulation techniques and experiment 2 of the real experiment.
Figure 9.
Deviations determined by the RMSE method for individual calculation and simulation techniques and experiment 2 of the real experiment.
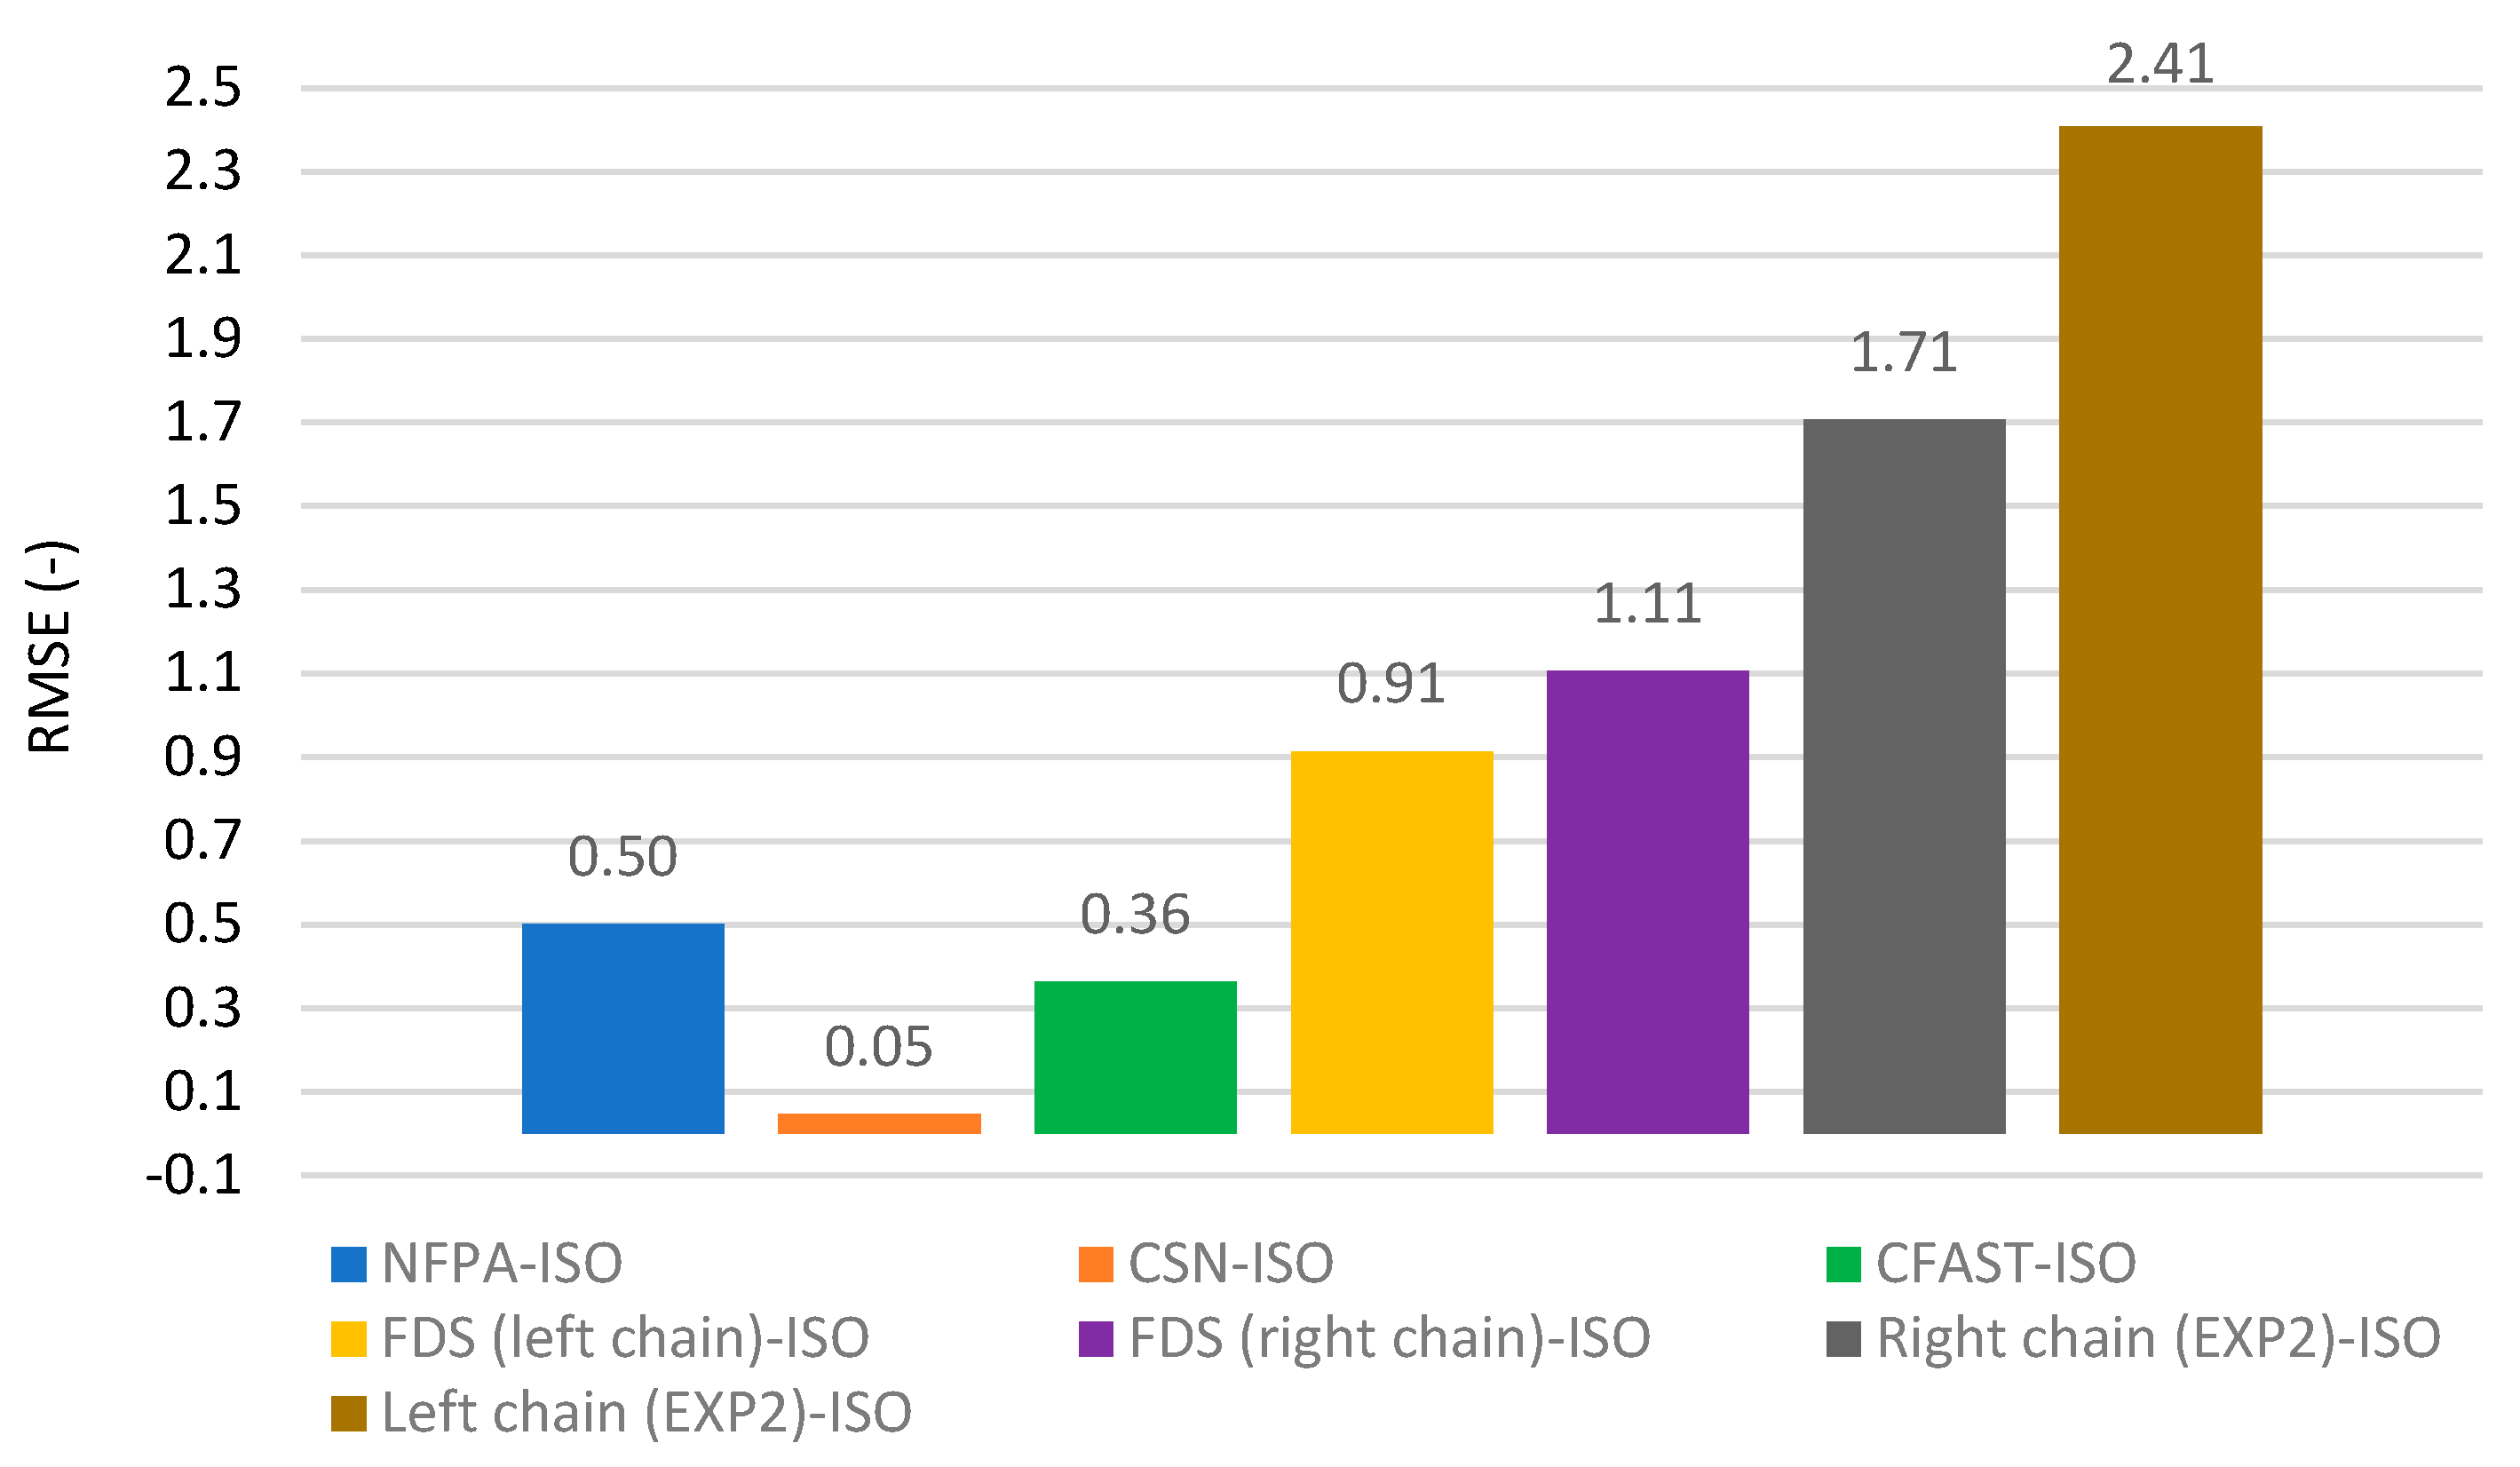

Table 1.
Input values for verification of the CSN calculation technique.
| Designation of input values | Symbol | Value | Physical unit | |
|---|---|---|---|---|
| ambient temperature | T | 12 | °C | |
| ambient pressure | ph | 100.3 | kPa | |
| relative humidity | ϕ | 93.5 | % | |
| floor area of enclosure | A | 70 | m2 | |
| height of enclosure | H | 8 | m | |
| area of the fire | S | 0.36 | m2 | |
| diameter of the fire | D | 0.677 | m | |
| mass burning rate per unit area | m | 2.504 | kg.m-2.min-1 | |
| total amount of liquid burnt off during the experiment | mc | 3.2 | l | |
| standard calorific value of petrol | HN | 44 | MJ.kg-1 | |
| effective combustion coefficient | Heff | 0.7 | - | |
| heat flux per unit area | Q’ | 1285.41 | kW.m-2 | |
| heat flux of the fire | Q | 462.75 | kW | |
| fire growth time | T | 150 | s | |
| combustion rate coefficient | A | 1 | - | |
| maximum heat release rate | RHRf | 300 | kW.m-2 | |
| time interval of calculations | 30 | s | ||
| smoke density | ρs | 1 | kg.m-3 | |
| radiation fraction of heat flux | χ | 0.2 | - |
Disclaimer/Publisher’s Note: The statements, opinions and data contained in all publications are solely those of the individual author(s) and contributor(s) and not of MDPI and/or the editor(s). MDPI and/or the editor(s) disclaim responsibility for any injury to people or property resulting from any ideas, methods, instructions or products referred to in the content. |
© 2023 by the authors. Licensee MDPI, Basel, Switzerland. This article is an open access article distributed under the terms and conditions of the Creative Commons Attribution (CC BY) license (http://creativecommons.org/licenses/by/4.0/).
Copyright: This open access article is published under a Creative Commons CC BY 4.0 license, which permit the free download, distribution, and reuse, provided that the author and preprint are cited in any reuse.


