Submitted:
15 December 2023
Posted:
18 December 2023
You are already at the latest version
Abstract
Coarse-grained molecular dynamics simulations are employed to investigate spatiotemporal evolution of vesicles (polymersomes) via self-assembly of randomly distributed amphiphilic diblock copolymers in water. Vesiculation pathway consists of several intermediate structures such as spherical/rodlike aggregates, wormlike micelles, lamellae, and cavities. Lamella to vesicle transition occurs at a constant aggregation number and is accompanied by a reduction in the solvent accessible surface area. Simulation predictions are in qualitative agreement with the mechanism of vesicle formation in which the unfavorable hydrophobic interactions between water molecules and polymer segments along the edge of the lamella are eliminated at the expense of gaining curvature energy. However, rod-lamella-vesicle transition is accompanied by an increase in copolymer packing density. Hence, the change in the surface area accompanying vesiculation predicted by the simulations is significantly lower than theoretical estimates. Changes in information entropy, quantified by the expectation of the logarithm of the probability distribution function of the segmental stretch parameter s, defined as the difference between the maximum and instantaneous segmental extension, are statistically insignificant along the vesiculation pathway. For rods, lamellae and polymersomes, s follows a log normal distribution. This is explained based on the configurational dynamics of a single diblock chain in water.
Keywords:
Block Copolymer
; Micelle
; Bilayer
; Vesicle
; Polymersome
; Molecular Dynamics
; Information Entropy
; Nanomedicine
; Biomimetic
1. Introduction
Self-assembly of block copolymers (BCPs) in solution has generated renewed interest following the pioneering discoveries of vesicular morphologies, referred to as polymersomes [1,2,3,4,5,6,7,8,9,10,11,12]. While traditional ionic surfactants with hydrocarbon chains can form vesicular structures, manipulation of their chemical environment is often required to facilitate vesiculation, e.g., by addition of a salt or co-surfactant, which limits their biocompatibility and biomedical applications. Further, non-ionic copolymer vesicles offer superior stability due to enhanced hydrophobicity as evidenced by their ultra-low critical micelle concentrations compared to those of traditional surfactants. Specifically, the change in chemical potential associated with the exchange of individual copolymer molecules between a molecular assembly and surrounding solvent is large enough to render kinetic time scales spanning hours to days [13]. Further, BCPs offer robust means of size control of the vesicles by varying polymer chain composition/length, addition of secondary spacer molecules, and microfluidics-based flow focusing techniques to produce droplets of controllable sizes: see review by Bleul et al. [1]. Polymersomes with size that ranges between several nanometers to tens of micrometers can be routinely manufactured. They form the building blocks of complex nanostructures that offer significant promise in detergency, environmental remediation, nanomedicine, and cancer theranostics, an approach that integrates diagnosis (e.g., by imaging) and therapeutics [1,14,15,16,17], catalysis and nanoreactor design [18,19,20,21] as well as development of biomaterials that mimic cellular structure and function [22,23,24].
Experimental studies have provided a wealth of information on and insights into the phase behavior of BCPs in solution. Further, they have offered several clues regarding the thermodynamic and kinetic pathways underlying the morphological diversity and structure transitions in such systems. However, a quantitative theoretical understanding of energetic and entropic conduits that facilitate spontaneous changes in aggregate morphology is still lacking due to many reasons. First, real time visualization of the self-assembly process leading to the formation of molecular aggregates in solution is well beyond the spatiotemporal resolution of advanced imaging technologies. Consequently, morphology characterization is achieved often by cryogenic Transmission Electron Microscopy (cryo-TEM) experiments although progress in NMR imaging has made it possible to track the trajectories of individually tagged molecules in native solution as they navigate within and across molecular aggregates [25,26]. Second, experimental observations of shape transitions are often rationalized based on elegant, yet simplified geometric arguments, such as the one based on the packing parameter, which was developed to explain spherical, cylindrical, and vesicular aggregates in amphiphilic surfactants [27]. However, experiments [7,8,9,10,11,12,28,29] and a recently reported systematic coarse-grained molecular dynamics (CGMD) study by the authors [30] have shown that self-assembly of BCPs in solution generates extraordinarily diverse and topologically complex morphologies. Quantitative characterization of structure evolution in such systems requires detailed understanding of the dynamics of molecule exchange between a self-assembled structure and solvent as well as internal reorganization of molecules that is often associated with morphology transitions. In this work, such dynamics are explored in detail in the context of vesiculation in amphiphilic diblock copolymer solutions which involves molecular aggregation in the early stages and internal reorganization of molecules at a constant aggregation number during the latter phase of vesiculation.
Quantitative understanding of entropic (e.g., segmental stretch and orientation of copolymer chains) and energetic (e.g., area of hydrophobic interfaces and potential energy of solvent-monomer interactions) changes underlying morphology transitions, especially rod to lamella as well as lamella to vesicle transitions seen in experiments [28], remains inadequate. At least two pathways have been proposed to explain vesicle formation in BCP solutions. One mechanism entails solvent diffusion into spherical micelles creating a polymer-free core region [1]. The other mechanism, which is widely accepted by scholars due to its perceived universality to phospholipids (biological membranes) and copolymers, is based on energetics arguments, i.e., a sufficiently large lamellar (bilayer) structure develops spontaneous curvature, bends, and folds into a vesicle (or polymersome). Specifically, it is envisioned that during such morphology change, the lamella discards the energy associated with the unfavorable hydrophobic interactions of the polymers along its edge with the surrounding solvent molecules at the expense of gaining curvature energy [1,13,27,29,31,32,33,34,35]. In experiments conducted by Fromherz et al. [23] on egg lecithin – taurochenodesoxycholate systems, electron microscopy revealed that metastable, discoid assemblies of phospholipids spontaneously closed to form vesicular morphologies. This process is thought to be initiated only when the perimeter of the lamella exceeds a threshold value or equivalently, when the driving force provided by the unfavorable hydrophobic edge energy, which is approximately equal to the product of the area of the lateral solvent-lamella interface and interfacial tension, is sufficiently large to overcome the bending energy of the bilayer [31]. Under such circumstances, geometric arguments, e.g., conservation of surface area of the copolymer aggregate, can provide a relationship between the linear dimensions of the lamella and vesicle produced: see for example Figure 5 in Antonietti and Förster [29].
The abovementioned conceptualization of vesicle generation from bilayers is qualitatively supported by computer simulations that utilize solvent-free multi-particle collision dynamics and discrete representations of fluid membranes parameterized to manipulate particle diffusion and membrane rigidity [36,37]. Such discrete particle simulations can capture dynamic organization of fluid membranes and provide significantly more nuanced depictions of the pathways of morphology transitions compared to those offered by classical continuum mechanics theories based on energy minimization principles that govern bending/buckling of planar sheets to form curved and closed surfaces [38,39,40,41,42]. However, they lack critical details of the organization of constituent molecules within the aggregates, which is largely dictated by solvent-mediated interactions. In the context of aqueous solutions of copolymers, distributions of segmental stretch and water within the assemblies are highly heterogeneous and greatly dependent on the chain composition, confinement (e.g., water-hydrophilic segment interface in the inner and outer layers of a unilamellar vesicle), hydrogen bonding interactions, and/or solvent mobility [30,43]. Moreover, aggregate morphologies are dynamic with irregular shapes and diffuse interfaces [20,21,30]. Such molecular-scale aspects of shape transitions are addressed in the present study.
Experiments by Chen et al. [28] show the coexistence of rodlike micelles, lamellae, and vesicles in polystyrene-polyacrylic acid solutions in dioxane/water. These authors inferred that rod to vesicle transition involves an intermediate lamellar state by visualizing a series of structures by cryo-TEM. The transition from a solution that contains predominantly rods to one that is dominated by vesicles was facilitated by perturbing a solution of rodlike micelles at equilibrium, by increasing its water content by incremental amounts. The coexistence of rods, lamellae, and vesicles were quantified using turbidity data. Specifically, each morphology makes a distinctive contribution to the overall turbidity of the solution which was quantified using experimental measurements. Further, a kinetic model based on a two-state transition theory in which (a). rods are flattened to form a lamella, and (b). develops curvature and closes on itself to create a vesicle was proposed. Intermediate morphologies between spherical micelle and vesicles, such as cylindrical micelle, lamellar (discoid) and open vesicle (curved lamellar) have been observed in experiments for amphiphilic systems [44,45]. In cetyl-trimethyl-ammonium-bromide and 5-methyl salicylic acid solution, thermally reversible transition from vesicles to wormlike micelles has been observed [46]. In phospholipid solutions containing vesicles, spherical micelle formation can be triggered by the addition of surfactants [44,45]. The underlying pathway consists of opening of the vesicle to form a curved bilayer followed by bilayer to rodlike micelle transition and formation of spherical micelles from rods. In our earlier molecular dynamics study [30], co-existence of rods, bilayers and vesicles was predicted in diblock polymer solutions. In this work, we investigate the sequence of morphology transitions leading to vesicle formation in diblock copolymer solutions using CGMD simulations.
CGMD simulations conducted by Markvoort and coworkers [47,48] on phospholipid systems predict an increase in the overall potential energy associated with bilayer to vesicle transition, suggesting the existence entropic driving forces. Whether this is true in the case of copolymer solution is unknown. Configurational entropy associated with the distributions of chain stretch and orientation of hydrophobic/hydrophilic segments within BCP aggregates could influence their macroscopic mechanical properties. This in turn could have pronounced implications on shape transitions. Establishing quantitative relationships between molecular structure and mechanical properties of BCP aggregates is beyond the scope of the present study. However, we compute probability distribution functions of segmental stretch for rodlike, lamellar, and vesicular aggregates to glean insights into potential entropic driving forces underlying vesiculation.
The present study is built on our recently reported CGMD simulations of spontaneous self-assembly in model (PB-PEO) diblock copolymer solution leading to the formation of diverse morphologies [30]. The initial conditions of our simulations correspond to a homogeneous BCP solution at a prescribed concentration in which polymer molecules of given chain length and composition are randomly distributed. No pre-assembly is employed, and spatiotemporal evolution of structures is tracked in real time. In the past, mesoscopic simulations based on self-consistent field theory [19,20,21,22,23,24,25,26,27,28,29,30,31,32,33,34,35,36,37,38,39,40,41,42,43,44,45,46,47,48,49,50,51], dissipative particle dynamics [52,53,54,55,56,57,58,59,60], and CGMD simulations with pre-assembled initial conditions [20,21,61] have been employed to study self-assembly of amphiphilic BCPs in solution, bilayer to vesicle transition, and kinetics of copolymer exchange between self-assembled aggregates in BCP solutions. Further, coarse-grained molecular dynamics simulations that account for solvent-mediated hydrophobic interactions implicitly via a suitably parameterized Lennard-Jones (LJ) potential function have been used to study differences in copolymer architecture (linear vs. bottlebrush) on self-assembly in solution [62] and shape deformation of PEO-PS polymersomes induced by osmotic pressure stress [63]. CGMD simulations have also been used to qualitatively study the self-assembly process of PS-PAA polymers [64], phospholipid [65], and DTAB and gemini surfactants [66]. In the present study, we employ the CGMD simulation framework reported in [30] which were adapted from our previous investigations of self-assembly and shape transitions in as well as shear/elongational flow dynamics and rheology of cationic surfactant solutions [67,68,69,70,71,72,73,74]. We use the MARTINI force field to describe all bonded and non-bonded interactions within the BCP solution [75]. Our simulations capture vesiculation from an initially homogeneous copolymer solution. This process, which is facilitated through multiple intermediate stages of micellization and structure reorganization, is analyzed to provide quantitative insights into the underlying energetics and entropic motifs. Simulation details and data analytics methods are discussed in Section 2. Results are discussed in Section 3. Conclusions and outlook are offered in Section 4.
2. Materials and Methods
2.1. Methods and Software
Lenard-Jones and harmonic potential functions are used to represent non-bonded and bonded pairwise interactions, respectively [54]. The parameter values used in this study are identical to those reported in Liu and Sureshkumar [30] in which morphological diversity in diblock BCP solutions mimicking PEO-PB architectures of varying chain length, chain composition and concentration was explored.
In the present simulations, 400,000 water beads, 40,000 antifreeze water beads and 9,000 polymer chains consisting of six PEO and six PB beads (14.4 wt%) are randomly placed in an initial cubical box of linear dimension 40 nm by using PACKMOL software. The simulations are performed by using the Gromacs 2020.2 MD software. The production runs are NPT simulations. They span 400 ns which is approximately 10% longer than the time required for a stable vesicular structure to evolve from an initially random configuration of copolymer chains. The molecular visualization is performed by VMD 1.9.3. Data analysis and graphing are performed using MatlabTM 2023, Microsoft 365TM, C++ and OriginlabTM 2017.
2.2. Data Analytics
Discrete spatiotemporal data generated from the CGMD simulations are analyzed to identify copolymer clusters. Subsequently, their geometric features such monomer number N, volume V, surface area A, and monomer density ρ ≡ N/V are computed. We also calculate solvent accessible surface area (SASA), which may be interpreted as the surface area of the water−aggregate interface. Specifically, SASA is measured as the area circumscribed by the motion of the center of a spherical probe that is slid along the periphery of the beads that constitute a cluster [76]. The algorithms utilized for the above calculations are described in detail in our earlier work [30].
End-to-end Distance and Body Gaussian Curvature
To quantitatively describe shape changes of the self-assembled structures, we calculate the end-to-end distance Q and body Gaussian curvature KG of the entire assembly with respect to its center of mass. Note that KG is a wholistic (body) curvature measure of the geometry of the aggregate rather than the integral of the pointwise Gaussian curvatures along its surface. This concept is illustrated in Figure 1 for two representative surfaces, one that is relatively flat along (Figure 1a–c) and the other curved (Figure 1d–f). The Cartesian (x, y, z) coordinate system used has the center of mass of the aggregate as its origin. The shortest linear dimension is along the y axis. Figure 1b shows the collections of discrete points (“point cloud”) that lie within -2.5 nm ≤ z ≤ 2.5 nm of the structure whose mesh representation is given in Figure 1a. This set of points are projected onto the x-y plane and binned into several intervals: see Figure 1b,e. We use 20 and 60 intervals for flat and curved surfaces, respectively as they provide sufficient discretization to calculate numerically converged results for the curvature. A structure is considered flat if its center of mass lies within its point cloud and curved if otherwise. The curvature in the x-y plane is calculated as the inverse of the radius of the circle (Figure 1c) that fits the centers of mass of the beads in each bin (red dots in Figure 1b), by using a robust fitting algorithm developed by Pratt [77]. We discard data for the first two (four) and last two (four) bins for flat (curved) structures, to minimize the uncertainty in the calculations arising from large fluctuations of the edges. The curvature is considered positive (negative) if the center of the best fit circle lies above (below) the center of mass of the structure. The end-to-end distance of the point cloud Qp is calculated as the magnitude of the vector connecting the extreme points in the two outermost bins. The above procedure is repeated by rotating the cluster in increments of 10 degrees around the y-axis to a total of 180 degrees. The body Gaussian curvature KG ≡ K1K2 where K1 and K2 denote the maximum and minimum curvatures. The end-to-end distance Q of the structure is defined as the maximum of the computed Qp values.
Information Entropy of Aggregates
To quantify the changes in the configurational entropy associated with the packing of copolymers within various intermediate assemblies leading to vesiculation, we calculate the probability distribution function (pdf) of the extension of the hydrophobic (PB) and hydrophilic (PEO) segments of the polymer chains. The associated structure parameter s ≡ qmax − q, where qmax is the maximum end-to-end distance between the first and last beads of the PB or PEO segment within a structure. The pdf of s is normalized such that
where sm = qmax − qmin. Given p(s), we calculate the information entropy H of the structure using its standard definition as H(s) ≡ ∑ p(s) ln (p(s)) where the discrete summation is carried out for the ensemble of copolymers within a cluster.
3. Results and Discussion
We study the evolution of nearly spherical polymersomes made up of symmetric BCP chains which consist of 6 PB and 6 PEO beads corresponding to a PEO mole fraction of 50%. The BCP concentration is 14.4 wt%. The chain lengths used in the simulations translate to a polymer molecular weight of 590 Da. Hence, these are relatively short polymers with molecular weights appreciably greater than those of surfactants with long hydrocarbon chains, e.g., cetyl-trimethyl ammonium chloride, a C-16 cationic surfactant studied extensively in experiments and our previous CGMD simulations, has a molecular weight of 320 Da.
To quantify the geometry of the structure, we tracked the number of monomers (N), body Gaussian curvature (KG) and end-to-end distance of the self-assembled structure (Q) as functions of time. Representative results are shown in Figure 2 and Figure 3. Vesiculation is facilitated through the following pathway: formation of well-defined spherical aggregates from a homogeneous copolymer solution, merger of spherical aggregates to form rodlike micelles (t < 100 ns, Figure 2A–F), fusion of rods to form longer wormlike micelles (100 ns < t < 120 ns, Figure 2F–H), flattening of flexible cylindrical structures to form rectangular lamellae (bilayers) which further reorganize into disk-shaped lamellae (120 ns < t < 250 ns, Figure 2H–N), bending and curving of disklike lamellae leading to cavity formation, and closure of the cavity to form vesicles (250 ns < t < 375 ns, Figure 2N–Q). A video (Video S1) of this process is provided in SI.
The early stage of vesiculation is characterized by copolymer aggregation into spherical micelles. Each one of the three step changes seen in N in Figure 3 corresponds to a merger event. First, small spherical aggregates consisting of ~1000 monomers coalesce to form a rodlike micelle. Second, two rodlike micelles approach each other at an obtuse angle (see Figure 2F) and combine into a longer wormlike micelle (WM) by an endcap opening mechanism. Specifically, it is energetically favorable for cylindrical micelles to merge as this process results in the loss of the curvature energy associated with their endcaps [72]. Third, the wormlike micelle accommodates a small spherical aggregate and grows larger. The first two mergers occur at terminal positions and are accompanied by an increase in Q while the third merger occurs on the side of the rodlike micelle resulting in little change in Q. For the rodlike structures shown in Figure 2E–H, positive maximum body curvature appears along the major axis, and negative minimum body curvature appears along the minor axis. Hence, KG is negative.
After the third merging process, the maximum and standard deviation in N is 0.28% and 0.06%, respectively. Consequently, vesicle formation from the rodlike structure occurs through a series of structure re-organization at a practically constant aggregation number n = N/12 as seen from Figure 3. For 140 ns ≤ t ≤ 180 ns, the reordering of the copolymers within the flexible WM results in the formation of a rectangular lamella (RL). WM to RL transition is accompanied by a continuous decrease in Q. Early in the process, due to the initial angle of approach between the two rodlike micelles during the merging process shown in Figure 2G, a topological twist is formed within the RL, thus creating a saddle point: see row 3 in Table 1. For 180 ns < t ≤ 215 ns, the cluster rearranges to a flat circular disk lamella (DL) to increase symmetry. During this transition, KG approaches 0 and Q decreases further. For 215 ns < t ≤ 375 ns spontaneous curvature fluctuations of the DL initiate a curling process. Subsequently. the structure begins to bend and form a spherical cavity (C). This is accompanied by a reduction in Q and an increase in KG. For t > 375 ns, a stable spherical bilayer structure (vesicle, V) is established by the closure of the cavity. Simulations predict that the bending process is characterized by a larger density of monomers (ethylene oxide beads) in the internal leaflet: see Figure 4.
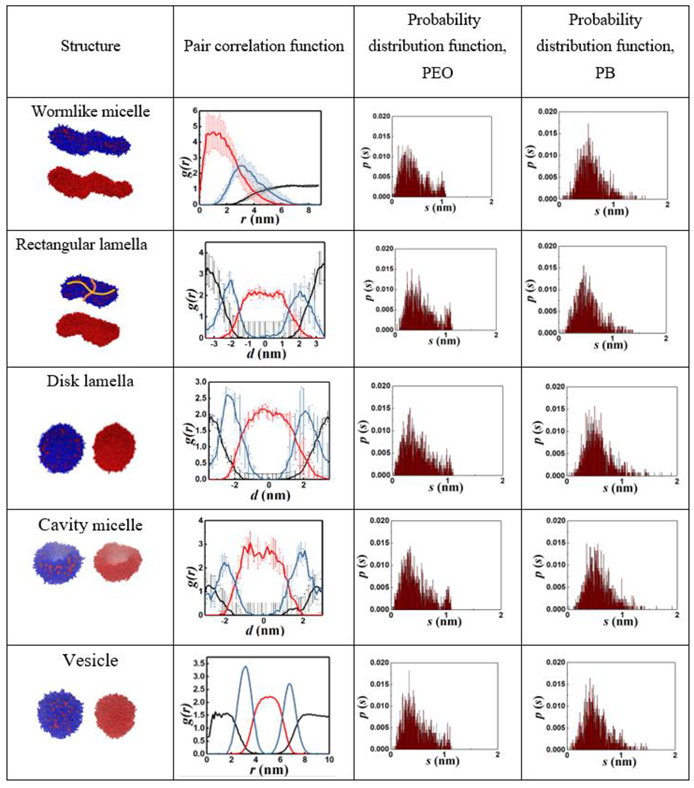
Table 1 summarizes the five prominent structures observed along the vesiculation pathway, namely wormlike micelle (WM), rectangular lamella (RL), disklike lamella (DL), cavity (C) and vesicle (V). Images consisting of blue and red domains depict the entire copolymer, while those with red surfaces reveal only the PB segments. The table also shows the particle pair correlation functions, g(r), and the probability distribution functions, p(s), for the structure parameters corresponding to the segmental stretches of PB (qPB) and PEO (qPEO). Variations in g(r) for PB (hydrophobic), PEO (hydrophilic), and water are shown in red, blue, and black lines, respectively. These functions quantify molecular density profiles within the structures and provide information on the relative sizes of the hydrophilic and hydrophobic domains. A WM is devoid of water inside and has a PB core surrounded by PEO shell exposed to water. RL, DL, and C all exhibit a PEO-PB-PEO bilayer structure. Vesicles possess a water core and a PEO-PB-PEO bilayer shell. It is intriguing that p(s) variations for all structures are skewed toward lower s (larger segmental stretch q) values and better fitted to a log-normal rather than Gaussian (normal) distributions, discounting the second minor peak seen for PEO. This second peak in the tail of the pdfs corresponds to ring-like configurations primarily located at the overlapping PEO-PB interfaces: see paragraph below. Diffuse (overlapping) interfaces predicted by our simulations are consistent with those observed in previous CGMD simulations of flexible diblock BCPs [4,63]. The average segmental stretch is expectedly greater for the hydrophilic component (PEO). The p(s) of PB features relatively long and low-probability tails, which is a consequence of large chain length fluctuations in the less extended (coiled) PB configurations.
To understand the log normal variations in s, we conducted simulations to track the equilibrium configuration dynamics of a single chain in solution. Analysis of the data collected for the instantaneous values of qPEO and qPB showed that the chain stretch parameter s follows log-normal distribution for PEO and PB segments as well as the entire diblock chain, as shown in Figure 5. Consequently, the pdfs of s for assemblies of individual polymer chains are also log-normal. The qualitative agreement of p(s) to a log normal distribution might have implications in terms of entropy maximization. Specifically, a log normal distribution maximizes the information entropy of a random variable with prescribed values of both mean and variance [78]. The average segmental stretch and configurational fluctuations are bounded by the ring-like and fully stretched states of the segments. The skewness and kurtosis in the distributions appear to depend on the aggregate shape. This suggests that the details of molecular packing within the aggregates are topology dependent. Further investigations are needed to quantify such structure-topology relationships.
To investigate whether vesicle formation is entropy-driven, we calculated the information entropy, H along the vesiculation pathway within the constant N regime. Figure 6a shows that H values for the PB and PEO segments remain practically unchanged during the vesiculation process, with HPEO and HPB = 4.62 ± 0.10 nat and 5.02 ± 0.02 nat, respectively. Figure 6a also shows that HPB exhibits relatively larger fluctuations. Upon examining qmax and qmin (Figure 6b), we find that for PEO, qmax and qmin remain practically constant along the vesiculation pathway. However, for PB, qmax shows negligible changes while qmin undergoes relatively large fluctuations. This observation can be attributed to the fact that qmax is related to the fully stretched segment length, which does not change substantially. On the other hand, qmin is associated with the shortest coiled configurations. Based on their chemical structures, the parameter Kθ in the bending potential function for PB is smaller than that for PEO (Kθ = 25 kJ/mol and 50 kJ/mol for PB and PEO, respectively) [75,79]. A lower Kθ value results in greater fluctuations of the coiled configurations. In the absence of systematic statistically significant variations in the information entropy, we conclude that entropic driving forces are not responsible for vesiculation in the system studied.
We now examine the energetics-based mechanism proposed for lamella to vesicle transition [27,34]. Towards this end, we compare the relative change in the surface area △S ≡ 1 - Sv/Sd associated with the transition where Sv and Sd denote the surface area exposed to the solvent for the vesicle and disklike lamella, respectively. For an ideal lamella of radius Rd and thickness L, Sd = 2πRd2(1 + L/Rd). If such a lamella bends, curves, and folds to form an ideal vesicle of radius Rv, the resulting surface area Sv = 4π [Rv2 + (Rv – L)2] where Rv ≈ Rd/2. However, this assumes perfect geometric shapes and that packing density is conserved during the structure transition process. To assess the impact of such non-idealities on △S, we also compute Sd and Sv directly from the simulations. The procedure is illustrated in Figure 7 for the ideal (Figure 7a) and actual (Figure 7b) cases for Rd = 9.9 nm and L = 4.7 nm. Figure 7b,c show that the bilayer thickness L remains unchanged during the lamella to vesicle transition, as assumed in classical theoretical models. However, the radius of the resulting vesicle is significantly larger than that predicted by ideal geometric conditions, i.e., simulations yield Rv/Rd = 0.73. This implies that the size of the water core, and consequently the surface area, of the vesicles formed are larger than those predicted by models that use ideal geometric representations of the self-assembled structures. This translates to a smaller value of △S ≈ 0.18 predicted by the simulations vs. △S ≈ 0.66 calculated for idealized structures.
Figure 8 shows the change in solvent accessible surface area (SASA) along the vesiculation pathway. Note that SASA is different from the macroscopic surface area calculated from the linear geometric dimensions shown in Figure 7: specifically, as explained in [30], SASA computations incorporate interfacial area variations on the scale of the monomer bead size. Figure 8a shows that the PEO-water interface accounts for nearly 95% of the cumulative SASA. Moreover, SASA decreases continuously during rod to RL and DL to vesicle transitions. However, as the RL reorganizes into a DL, SASA is unchanged. This observation is consistent with the changes in the packing density during vesiculation shown in Figure 9. Specifically, during the transition from RL to DL the packing density and SASA are unaffected. Furthermore, although the SASA associated with PB segments is much smaller compared to that of PEO, the relative change in SASA during rod to vesicle transition of the PB segments (≈ 0.3) is significantly greater than that of PEO segments (≈ 0.1). This observation supports the edge energy hypothesis [1,13,27,29,31,32,33,34,35] that the unfavorable edge energy of the hydrophobic boundaries is the driving force for vesicle formation. The quantitative differences in SASA between theoretical and simulation predictions can be attributed to the shape imperfections of the aggregates and changes in the packing density. Figure 9 clearly shows that the polymers within the vesicle are more compactly packed as compared to those in the lamella. The reduction in SASA manifests as lower energies of polymer-solvent interaction as shown in Figure 10. Specifically, the (non-bonded) interaction energy of either PB or PEO segments with water is seen to become less negative during vesiculation.
Finally, the robustness of the above conclusions was established by performing simulations with different initial configurations of the system: see Figures S1 and S2. Further, the isentropic pathway of vesiculation was seen in simulations in which bond stretching and bending force parameters were varied with 10% of their values.
4. Conclusions
CGMD simulations of real-time evolution of vesicles, starting with an initial condition of randomly distributed diblock copolymer chains in an explicit solvent, have been performed to identify intermediate self-assembled states along the vesiculation pathway. The vesiculation process is facilitated by rapid formation of spherical aggregates, the merger of spherical aggregates to form rodlike assemblies, fusion of rods to form wormlike micelles, flattening of a WM to create a rectangular lamella, reorganization of the RL into a disk-shaped lamella, bending and curving of the DL leading to cavity formation, and closure of the cavity to form a vesicle. Analysis of information entropy shows that vesiculation from a wormlike micelle is an isentropic process. SASA decreases during vesiculation, with a more significant relative surface area reduction occurring in the PB-water interface. These predictions support the edge energy hypothesis that vesiculation is accompanied by a loss in the energy of hydrophobic interactions between solvent and copolymers along the lateral interface of the lamella, at the expense of gaining curvature energy. However, simulations show that the rod-lamella-vesicle transition is accompanied by an increase in copolymer packing density. Hence, the change in the surface area accompanying vesiculation predicted by the simulations is significantly lower than theoretical estimates based on idealized geometric representations of lamellar and vesicular morphologies.
Supplementary Materials
The following supporting information can be downloaded at the website of this paper posted on Preprints.org, Video S1. The vesiculation process. Video S2. 3D visualization of wormlike micelle intermediate. Video S3. 3D visualization of rectangular lamella intermediate. Video S4. 3D visualization of disk lamella intermediate. Video S5. 3D visualization of cavity micelle intermediate. Video S6. 3D visualization of vesicle. Figure S1. Information entropy vs. time obtained from simulations that start with three different initial copolymer distributions. Figure S2. Number of monomers (N) and end-to-end distance (Q) vs. time obtained from simulations that start with three different initial copolymer distributions.
Author Contributions
Conceptualization, supervision, project administration, funding acquisition, R.S.; methodology, investigation, resources, writing—original draft preparation, writing—review and editing, S.L., R.S.; software, validation and formal analysis, data curation, visualization, S.L. All authors have read and agreed to the published version of the manuscript.
Funding
This work was supported by the donors of ACS Petroleum Research Fund under grant #66629-ND9.
Acknowledgments
This work was supported by the donors of ACS Petroleum Research Fund under grant #66629-ND9. This research was supported in part through computational resources provided by Syracuse University. The authors gratefully acknowledge the funding from NSF award ACI-1341006 to support research computing in Syracuse. The visualization figures were made with VMD, which is developed with NIH support by the Theoretical and Computational Biophysics group at the Beckman Institute, University of Illinois at Urbana-Champaign. The authors gratefully acknowledge the developer of Gromacs software/manual.
Conflicts of Interest
The authors declare no conflict of interest.
References
- Bleul, R.; Thiermann, R.; Maskos, M. Techniques to Control Polymersome Size. Macromolecules 2015, 48 (20), 7396–7409. [CrossRef]
- Mohammadi, M.; Ramezani, M.; Abnous, K.; Alibolandi, M. Biocompatible Polymersomes-Based Cancer Theranostics: Towards Multifunctional Nanomedicine. International Journal of Pharmaceutics 2017, 519 (1-2), 287–303. [CrossRef]
- Zhang, X.-ying; Zhang, P.-ying. Polymersomes in Nanomedicine - A Review. Current Nanoscience 2017, 13 (2), 124–129. [CrossRef]
- Discher, D. E.; Ortiz, V.; Srinivas, G.; Klein, M. L.; Kim, Y.; Christian, D.; Cai, S.; Photos, P.; Ahmed, F. Emerging Applications of Polymersomes In Delivery: From Molecular Dynamics to Shrinkage of Tumors. Progress in Polymer Science 2007, 32 (8-9), 838–857. [CrossRef]
- Burkett, S. L.; Davis, M. E. Mechanism of Structure Direction In the Synthesis of Pure-Silica Zeolites. 2. Hydrophobic Hydration and Structural Specificity. Chemistry of Materials 1995, 7 (8), 1453–1463. [CrossRef]
- Deng, Y.; Wei, J.; Sun, Z.; Zhao, D. Large-Pore Ordered Mesoporous Materials Templated From Non-Pluronic Amphiphilic Block Copolymers. Chem. Soc. Rev. 2013, 42 (9), 4054–4070. [CrossRef]
- van Hest, J. C.; Delnoye, D. A.; Baars, M. W.; van Genderen, M. H.; Meijer, E. W. Polystyrene-Dendrimer Amphiphilic Block Copolymers With a Generation-Dependent Aggregation. Science 1995, 268 (5217), 1592–1595. [CrossRef]
- Zhang, L.; Eisenberg, A. Multiple Morphologies of “Crew-Cut” Aggregates of Polystyrene-b-Poly(Acrylic Acid) Block Copolymers. Science 1995, 268 (5218), 1728–1731. [CrossRef]
- Discher, B. M.; Won, Y.-Y.; Ege, D. S.; Lee, J. C.-M.; Bates, F. S.; Discher, D. E.; Hammer, D. A. Polymersomes: Tough Vesicles Made From Diblock Copolymers. Science 1999, 284 (5417), 1143–1146. [CrossRef]
- Mai, Y.; Eisenberg, A. Self-assembly of Block Copolymers. Chemical Society Reviews 2012, 41 (18), 5969. [CrossRef]
- Jain, S.; Bates, F. S. On the Origins of Morphological Complexity in Block Copolymer Surfactants. Science 2003, 300 (5618), 460–464. [CrossRef]
- Won, Y.-Y.; Brannan, A. K.; Davis, H. T.; Bates, F. S. Cryogenic Transmission Electron Microscopy (Cryo-Tem) of Micelles and Vesicles Formed in Water by Poly(Ethylene Oxide)-Based Block Copolymers. The Journal of Physical Chemistry B 2002, 106 (13), 3354–3364. [CrossRef]
- Israelachvili, J. N. Intermolecular and surface forces; Acad. Press, 2011.
- Karayianni, M.; Pispas, S. Block Copolymer Solution Self-Assembly: Recent Advances, Emerging Trends, and Applications. Journal of Polymer Science 2021, 59 (17), 1874–1898. [CrossRef]
- Li, S.; Byrne, B.; Welsh, J. E.; F. Palmer, A. Self-Assembled Poly(Butadiene)-b-Poly(Ethylene Oxide) Polymersomes As Paclitaxel Carriers. Biotechnol Prog. 2007, 23(1), 278–285. [CrossRef]
- Christine Allen, Adi Eisenberg, Jas, C. A.; Maysinger, D.; Mrsic, J.; Eisenberg, A. PCL-b-PEO Micelles As a Delivery Vehicle for Fk506: Assessment of a Functional Recovery of Crushed Peripheral Nerve. Drug Delivery 2000, 7 (3), 139–145. [CrossRef]
- Allen, C.; Yu, Y.; Maysinger, D.; Eisenberg, A. Polycaprolactone-b-Poly(Ethylene Oxide) Block Copolymer Micelles As a Novel Drug Delivery Vehicle For Neurotrophic Agents Fk506 and l-685,818. Bioconjugate Chemistry 1998, 9 (5), 564–572. [CrossRef]
- Boucher-Jacobs, C.; Rabnawaz, M.; Katz, J. S.; Even, R.; Guironnet, D. Encapsulation of catalyst in block copolymer micelles for the polymerization of ethylene in aqueous medium. Nature Communications 2018, 9 (1). [CrossRef]
- Cuomo, F.; Ceglie, A.; De Leonardis, A.; Lopez, F. Polymer Capsules for Enzymatic Catalysis in Confined Environments. Catalysts 2018, 9 (1), 1. [CrossRef]
- Peters, R. J.; Marguet, M.; Marais, S.; Fraaije, M. W.; van Hest, J. C.; Lecommandoux, S. Cascade Reactions in Multicompartmentalized Polymersomes. Angewandte Chemie International Edition 2013, 53 (1), 146–150. [CrossRef]
- Wilson, D. A.; Nolte, R. J.; van Hest, J. C. Autonomous Movement of Platinum-Loaded Stomatocytes. Nature Chemistry 2012, 4 (4), 268–274. [CrossRef]
- Marguet, M.; Bonduelle, C.; Lecommandoux, S. Multicompartmentalized Polymeric Systems: Towards Biomimetic Cellular Structure and Function. Chem. Soc. Rev. 2013, 42 (2), 512–529. [CrossRef]
- Che, H.; van Hest, J. C. Stimuli-Responsive Polymersomes and Nanoreactors. Journal of Materials Chemistry B 2016, 4 (27), 4632–4647. [CrossRef]
- Jacobs, M. L.; Boyd, M. A.; Kamat, N. P. Diblock Copolymers Enhance Folding of a Mechanosensitive Membrane Protein During Cell-free Expression. Proceedings of the National Academy of Sciences 2019, 116 (10), 4031–4036. [CrossRef]
- Li, X.; Cooksey, T. J.; Kidd, B. E.; Robertson, M. L.; Madsen, L. A. Mapping Coexistence Phase Diagrams of Block Copolymer Micelles and Free Unimer Chains. Macromolecules 2018, 51 (20), 8127–8135. [CrossRef]
- Holder, S. W.; Grant, S. C.; Mohammadigoushki, H. Nuclear Magnetic Resonance Diffusometry of Linear and Branched Wormlike Micelles. Langmuir 2021, 37 (12), 3585–3596. [CrossRef]
- Israelachvili, J. N.; Mitchell, D. J.; Ninham, B. W. Theory of Self-Assembly of Lipid Bilayers and Vesicles. Biochimica et Biophysica Acta (BBA) - Biomembranes 1977, 470 (2), 185–201. [CrossRef]
- Chen, L.; Shen, H.; Eisenberg, A. Kinetics and Mechanism of the Rod-to-Vesicle Transition of Block Copolymer Aggregates in Dilute Solution. The Journal of Physical Chemistry B 1999, 103 (44), 9488–9497. [CrossRef]
- Antonietti, M.; Förster, S. Vesicles and liposomes: A Self-Assembly Principle Beyond Lipids. Advanced Materials 2003, 15 (16), 1323–1333. [CrossRef]
- Liu, S.; Sureshkumar, R. Morphological Diversity in Diblock Copolymer Solutions: A Molecular Dynamics Study. Colloids and Interfaces 2023, 7 (2), 40. [CrossRef]
- Huang, C.; Quinn, D.; Sadovsky, Y.; Suresh, S.; Hsia, K. J. Formation and Size Distribution of Self-Assembled Vesicles. Proceedings of the National Academy of Sciences 2017, 114 (11), 2910–2915. [CrossRef]
- Srinivas, G.; Discher, D. E.; Klein, M. L. Self-Assembly and Properties of Diblock Copolymers By Coarse-Grain Molecular Dynamics. Nature Materials 2004, 3 (9), 638–644. [CrossRef]
- Srinivas, G.; Shelley, J. C.; Nielsen, S. O.; Discher, D. E.; Klein, M. L. Simulation of Diblock Copolymer Self-Assembly, Using a Coarse-Grain Model. The Journal of Physical Chemistry B 2004, 108 (24), 8153–8160. [CrossRef]
- Lipowsky, R. The Conformation of Membranes. Nature 1991, 349 (6309), 475–481. [CrossRef]
- Fromherz, P.; Röcker, C.; Rüppel, D. From discoid micelles to spherical vesicles. the concept of edge activity. Faraday Discuss. Chem. Soc. 1986, 81, 39–48. [CrossRef]
- Noguchi, H.; Gompper, G. Dynamics of vesicle self-assembly and dissolution. The Journal of Chemical Physics 2006, 125 (16), 164908. [CrossRef]
- Yuan, H.; Huang, C.; Li, J.; Lykotrafitis, G.; Zhang, S. One-particle-thick, solvent-free, coarse-grained model for biological and biomimetic fluid membranes. Physical Review E 2010, 82 (1). [CrossRef]
- Canham, P. B. The Minimum Energy of Bending as a Possible Explanation of the Biconcave Shape of the Human Red Blood Cell. Journal of Theoretical Biology 1970, 26 (1), 61–81. [CrossRef]
- Helfrich, W. Elastic Properties of Lipid Bilayers: Theory and Possible Experiments. Zeitschrift für Naturforschung C 1973, 28 (11–12), 693–703. [CrossRef]
- Faucon, J. F.; Mitov, M. D.; Méléard, P.; Bivas, I.; Bothorel, P. Bending Elasticity and Thermal Fluctuations of Lipid Membranes-Theoretical and Experimental Requirements. Journal de Physique 1989, 50 (17), 2389–2414. [CrossRef]
- Evans, Evan.; Needham, David. Physical Properties of Surfactant Bilayer Membranes: Thermal Transitions, Elasticity, Rigidity, Cohesion and Colloidal Interactions. The Journal of Physical Chemistry 1987, 91 (16), 4219–4228. [CrossRef]
- Cooke, I. R.; Deserno, M. Coupling Between Lipid Shape and Membrane Curvature. Biophysical Journal 2006, 91 (2), 487–495. [CrossRef]
- Fogel, A. L.; Ravichandran, A.; Mani, S.; Upadhyay, B.; Khare, R.; Morgan, S. E. Water structure and mobility in acrylamide copolymer glycohydrogels with galactose and Siloxane Pendant Groups. Journal of Polymer Science Part B: Polymer Physics 2019, 57 (10), 584–597. [CrossRef]
- Walter, A.; Vinson, P. K.; Kaplun, A.; Talmon, Y. Intermediate structures in the cholate-phosphatidylcholine vesicle-micelle transition. Biophysical Journal 1991, 60 (6), 1315–1325. [CrossRef]
- Vinson, P. K.; Talmon, Y.; Walter, A. Vesicle-micelle transition of phosphatidylcholine and octyl glucoside elucidated by cryo-transmission electron microscopy. Biophysical Journal 1989, 56 (4), 669–681. [CrossRef]
- Davies, T. S.; Ketner, A. M.; Raghavan, S. R. Self-assembly of surfactant vesicles that transform into viscoelastic wormlike micelles upon heating. Journal of the American Chemical Society 2006, 128 (20), 6669–6675. [CrossRef]
- Markvoort, A. J.; van Santen, R. A.; Hilbers, P. A. Vesicle shapes from molecular dynamics simulations. The Journal of Physical Chemistry B 2006, 110 (45), 22780–22785. [CrossRef]
- Markvoort, A. J.; Pieterse, K.; Steijaert, M. N.; Spijker, P.; Hilbers, P. A. The Bilayer−Vesicle Transition is Entropy Driven. The Journal of Physical Chemistry B 2005, 109 (47), 22649–22654. [CrossRef]
- He, X.; Schmid, F. Spontaneous formation of complex micelles from a homogeneous solution. Physical Review Letters 2008, 100 (13). [CrossRef]
- He, X.; Schmid, F. Dynamics of spontaneous vesicle formation in dilute solutions of Amphiphilic Diblock Copolymers. Macromolecules 2006, 39 (7), 2654–2662. [CrossRef]
- Sevink, G. J.; Zvelindovsky, A. V. Self-assembly of complex vesicles. Macromolecules 2005, 38 (17), 7502–7513. [CrossRef]
- Ye, X.; Khomami, B. Self-Assembly of Linear Diblock Copolymers in Selective Solvents: From Single Micelles To Particles With Tri-Continuous Inner Structures. Soft Matter 2020, 16 (26), 6056–6062. [CrossRef]
- Li, Z.; Dormidontova, E. E. Equilibrium Chain Exchange Kinetics In Block Copolymer Micelle Solutions By Dissipative Particle Dynamics Simulations. Soft Matter 2011, 7 (9), 4179. [CrossRef]
- Javan Nikkhah, S.; Turunen, E.; Lepo, A.; Ala-Nissila, T.; Sammalkorpi, M. Multicore assemblies from three-component linear homo-copolymer systems: A coarse-grained modeling study. Polymers 2021, 13 (13), 2193. [CrossRef]
- Ortiz, V.; Nielsen, S. O.; Discher, D. E.; Klein, M. L.; Lipowsky, R.; Shillcock, J. Dissipative particle dynamics simulations of polymersomes. The Journal of Physical Chemistry B 2005, 109 (37), 17708–17714. [CrossRef]
- Shillcock, J. C. Spontaneous vesicle self-assembly: A mesoscopic view of membrane dynamics. Langmuir 2012, 28 (1), 541–547. [CrossRef]
- Xiao, M.; Liu, J.; Yang, J.; Wang, R.; Xie, D. Biomimetic membrane control of block copolymer vesicles with tunable wall thickness. Soft Matter 2013, 9 (8), 2434. [CrossRef]
- Li, Y.; Zhang, H.; Wang, Z.; Bao, M. Micelle-vesicle transitions in catanionic mixtures of SDS/DTAB induced by salt, temperature, and selective solvents: A dissipative particle dynamics simulation study. Colloid and Polymer Science 2014, 292 (9), 2349–2360. [CrossRef]
- Luo, Z.; Li, Y.; Wang, B.; Jiang, J. Ph-sensitive vesicles formed by amphiphilic grafted copolymers with tunable membrane permeability for drug loading/release: A multiscale simulation study. Macromolecules 2016, 49 (16), 6084–6094. [CrossRef]
- Wu, S.; Lu, T.; Guo, H. Dissipative particle dynamic simulation study of lipid membrane. Frontiers of Chemistry in China 2010, 5 (3), 288–298. [CrossRef]
- Feng, X.; Yan, N.; Jin, J.; Jiang, W. Disassembly of amphiphilic AB block copolymer vesicles in selective solvents: A molecular dynamics simulation study. Macromolecules 2023, 56 (6), 2560–2567. [CrossRef]
- Lyubimov, I.; Wessels, M. G.; Jayaraman, A. Molecular dynamics simulation and prism theory study of assembly in solutions of amphiphilic bottlebrush block copolymers. Macromolecules 2018, 51 (19), 7586–7599. [CrossRef]
- Chakraborty, K.; Shinoda, W.; Loverde, S. M. Molecular Simulation of the Shape Deformation of a Polymersome. Soft Matter 2020, 16 (13), 3234–3244. [CrossRef]
- Sun, X.; Pei, S.; Wang, J.; Wang, P.; Liu, Z.; Zhang, J. Coarse-grained molecular dynamics simulation study on spherical and tube-like vesicles formed by amphiphilic copolymers. Journal of Polymer Science Part B: Polymer Physics 2017, 55 (16), 1220–1226. [CrossRef]
- Marrink, S. J.; Mark, A. E. Molecular dynamics simulation of the formation, structure, and dynamics of small phospholipid vesicles. Journal of the American Chemical Society 2003, 125 (49), 15233–15242. [CrossRef]
- Wu, R.; Deng, M.; Kong, B.; Yang, X. Coarse-grained molecular dynamics simulation of ammonium surfactant self-assemblies: Micelles and vesicles. The Journal of Physical Chemistry B 2009, 113 (45), 15010–15016. [CrossRef]
- Sambasivam, A.; Dhakal, S.; Sureshkumar, R. Structure and Rheology of Self-Assembled Aqueous Suspensions Of Nanoparticles And Wormlike Micelles. Molecular Simulation 2017, 44 (6), 485–493. [CrossRef]
- Sambasivam, A.; Sangwai, A. V.; Sureshkumar, R. Self-Assembly of Nanoparticle–Surfactant Complexes With Rodlike Micelles: a Molecular Dynamics Study. Langmuir 2016, 32 (5), 1214–1219. [CrossRef]
- Sambasivam, A.; Sangwai, A. V.; Sureshkumar, R. Dynamics and Scission of Rodlike Cationic Surfactant Micelles In Shear Flow. Physical Review Letters 2015, 114 (15), 8302. [CrossRef]
- Dhakal, S.; Sureshkumar, R. Anomalous Diffusion and Stress Relaxation In Surfactant Micelles. Physical Review E 2017, 96 (1), 2605. [CrossRef]
- Dhakal, S.; Sureshkumar, R. Uniaxial Extension of Surfactant Micelles: Counterion Mediated Chain Stiffening and a Mechanism of Rupture by Flow-Induced Energy Redistribution. ACS Macro Letters 2015, 5 (1), 108–111. [CrossRef]
- Dhakal, S.; Sureshkumar, R. Topology, Length Scales, and Energetics of Surfactant Micelles. The Journal of Chemical Physics 2015, 143 (2), 024905. [CrossRef]
- Sangwai, A. V.; Sureshkumar, R. Binary Interactions and Salt-Induced Coalescence of Spherical Micelles of Cationic Surfactants From Molecular Dynamics Simulations. Langmuir 2011, 28 (2), 1127–1135. [CrossRef]
- Sangwai, A. V.; Sureshkumar, R. Coarse-Grained Molecular Dynamics Simulations of the Sphere to Rod Transition in Surfactant Micelles. Langmuir 2011, 27 (11), 6628–6638. [CrossRef]
- Marrink, S. J.; Risselada, H. J.; Yefimov, S.; Tieleman, D. P.; de Vries, A. H. The Martini Force Field: Coarse Grained Model For Biomolecular Simulations. The Journal of Physical Chemistry B 2007, 111 (27), 7812–7824. [CrossRef]
- Eisenhaber, F.; Lijnzaad, P.; Argos, P.; Sander, C.; Scharf, M. The double cubic lattice method: Efficient approaches to numerical integration of surface area and volume and to Dot surface contouring of Molecular Assemblies. Journal of Computational Chemistry 1995, 16 (3), 273–284. [CrossRef]
- Pratt, V. Direct least-squares fitting of algebraic surfaces. ACM SIGGRAPH Computer Graphics 1987, 21 (4), 145–152. [CrossRef]
- Park, S. Y.; Bera, A. K. Maximum Entropy Autoregressive conditional heteroskedasticity model. Journal of Econometrics 2009, 150 (2), 219–230. [CrossRef]
- Yang, Y. Structure, Dynamics and Rheology of Polymer Solutions from Coarse-Grained Molecular Dynamics: Effects of Polymer Concentration, Solvent Quality and Geometric Confinement. Ph.D. Dissertation, Syracuse University, Syracuse, NY, 2015.
Figure 1.
Illustration of the algorithm used to compute the body curvature KG and end-to-end distance Q for a disklike lamella (1(a)-(c)) and a cavity (1(d)-(f)). 1(a) and 1(d) show 3-d mesh representations of the structures constructed using the position vectors of the outermost monomers. 1(b) and 1(e) show the cross sections marked in 1(a) and 1(d), respectively. The blue and red dots represent the monomer beads and the center of mass of the beads within the intervals marked by the solid black lines in 1(b) and 1(e), respectively. 1(e) and 1(f) show the best fit circle with radius equal to the inverse curvature for the lamella and cavity, respectively.
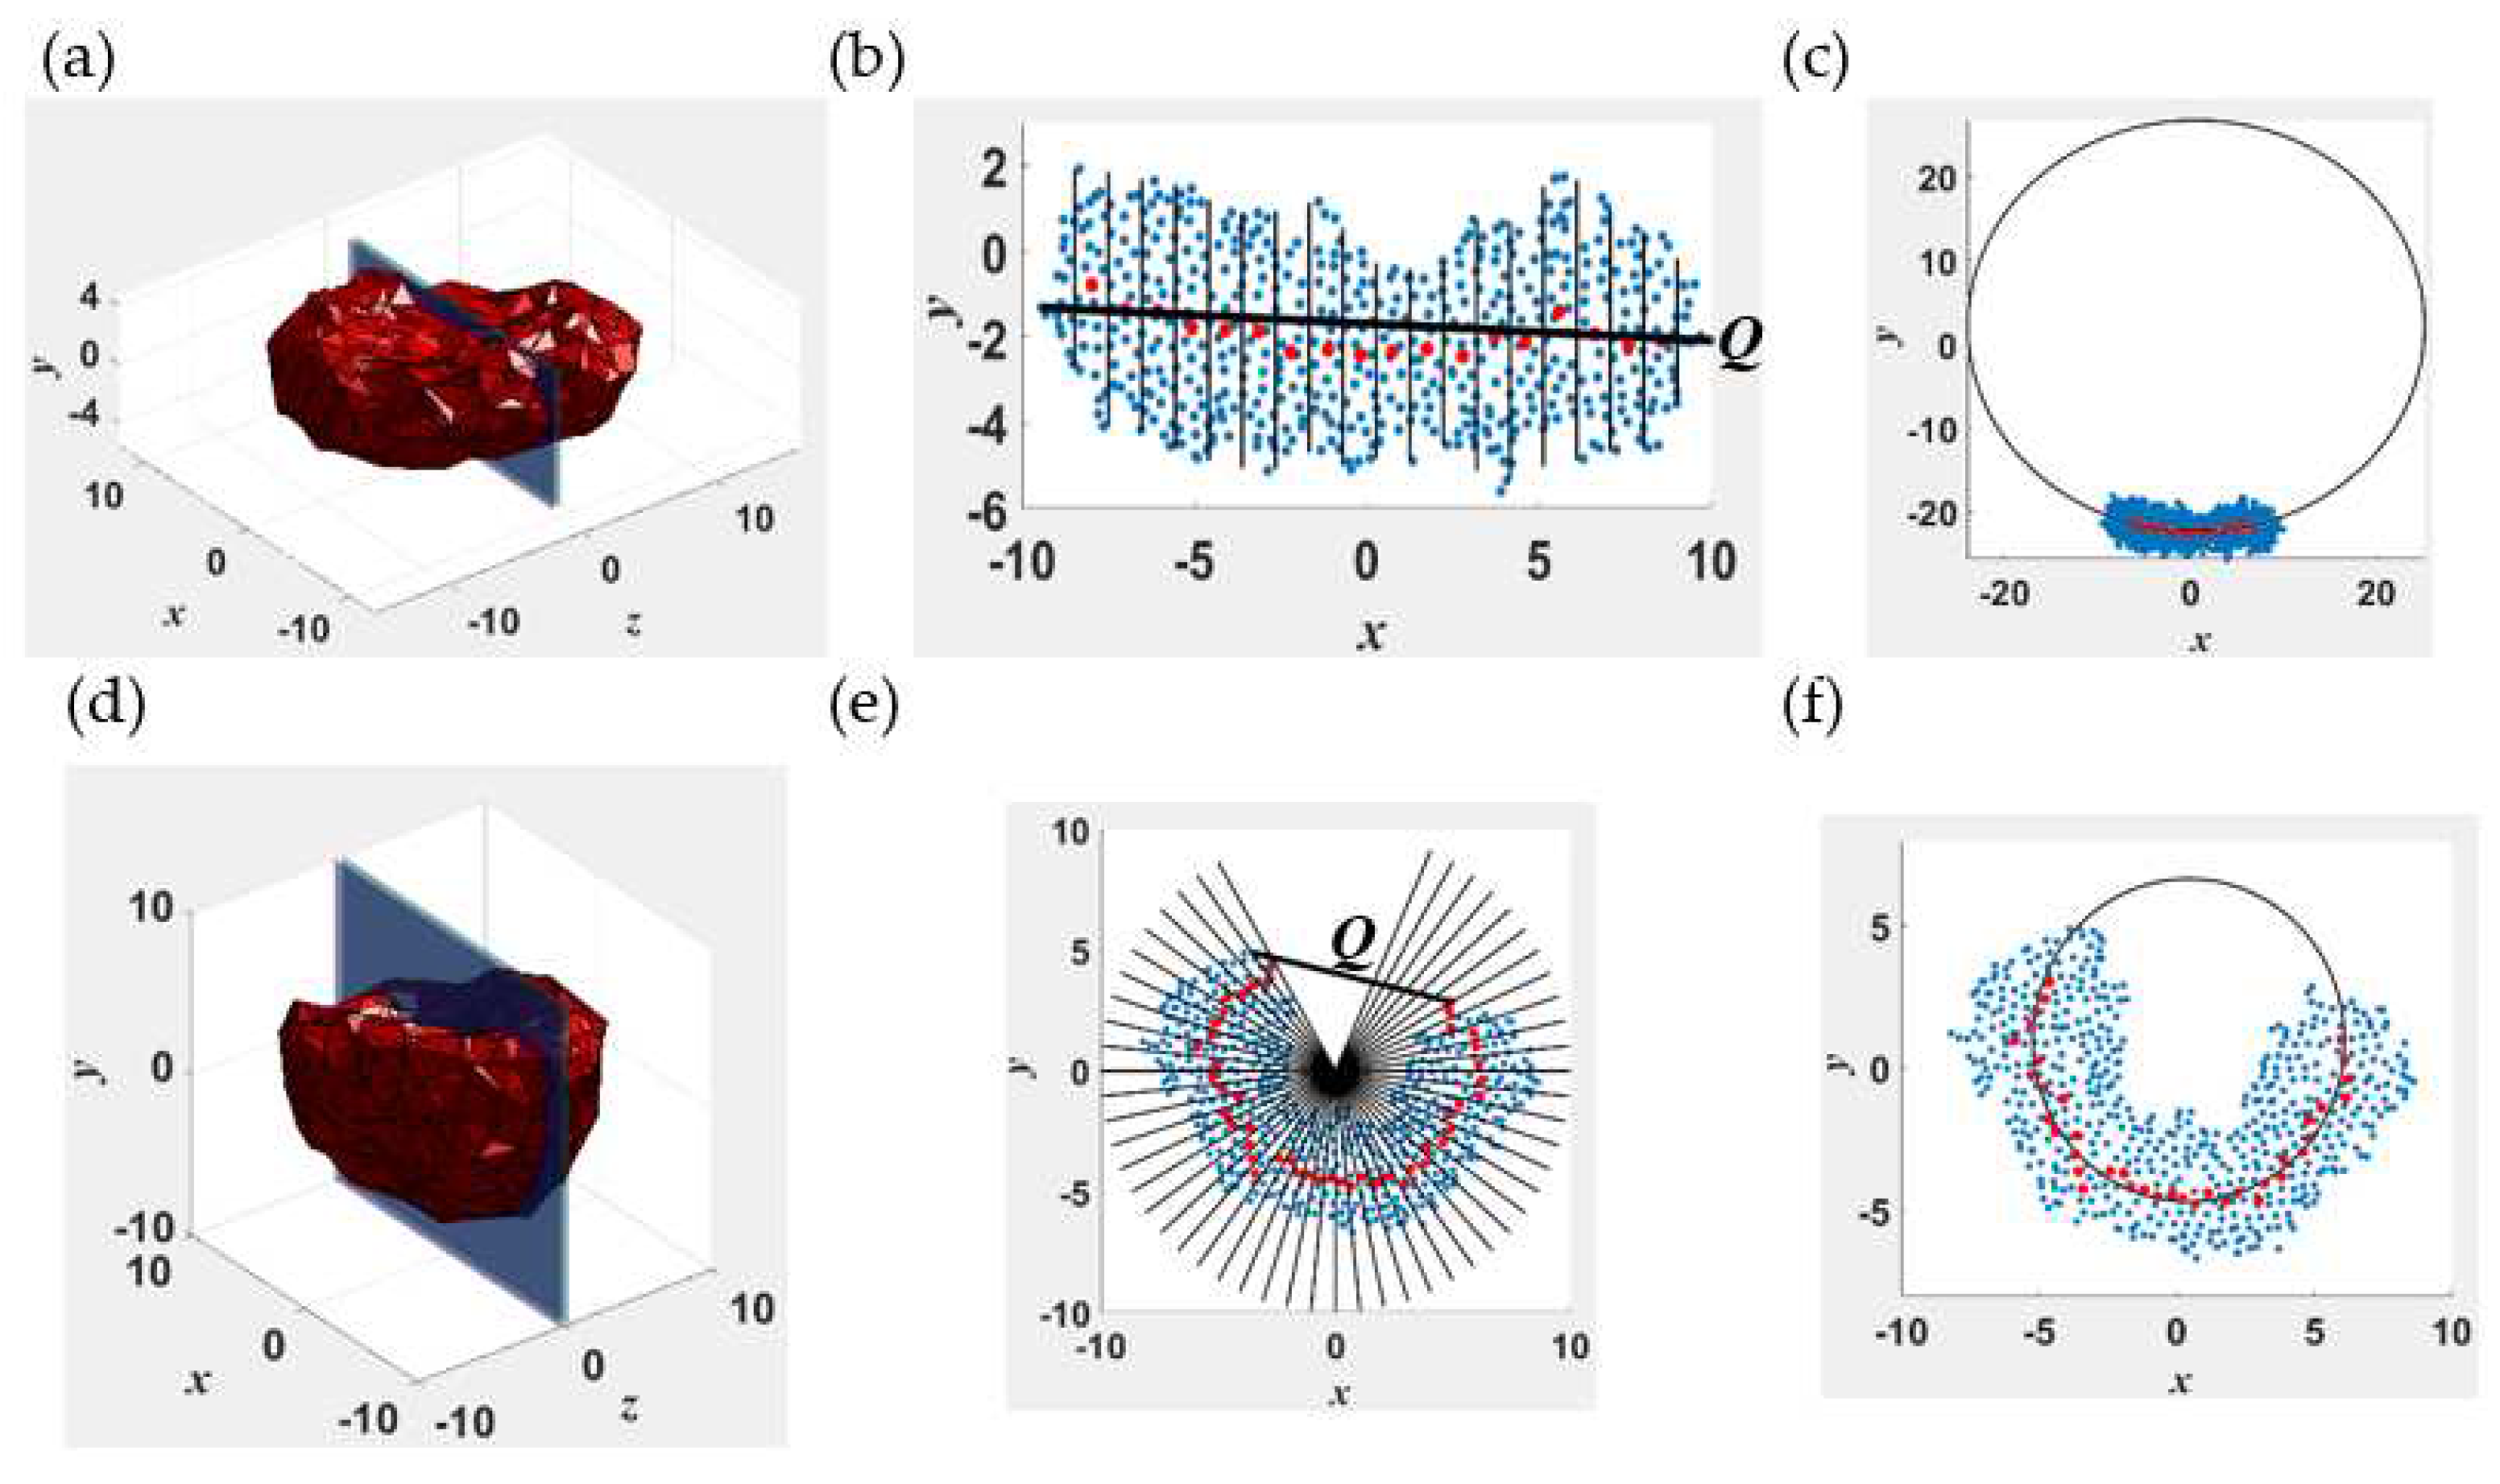
Figure 2.
Intermediate states during vesiculation. A: homogeneous solution; B−E: formation of spherical and cylindrical micelles; E−H: merger of spherical and cylindrical structures to form a flexible wormlike micelle (WM); H−L: reorganization of WM to form a rectangular lamella (RL); L−N: formation of disklike lamella (DL); O−Q: shape fluctuations of DL leading cavity and vesicle formation. For states O and P, top and side views are shown.
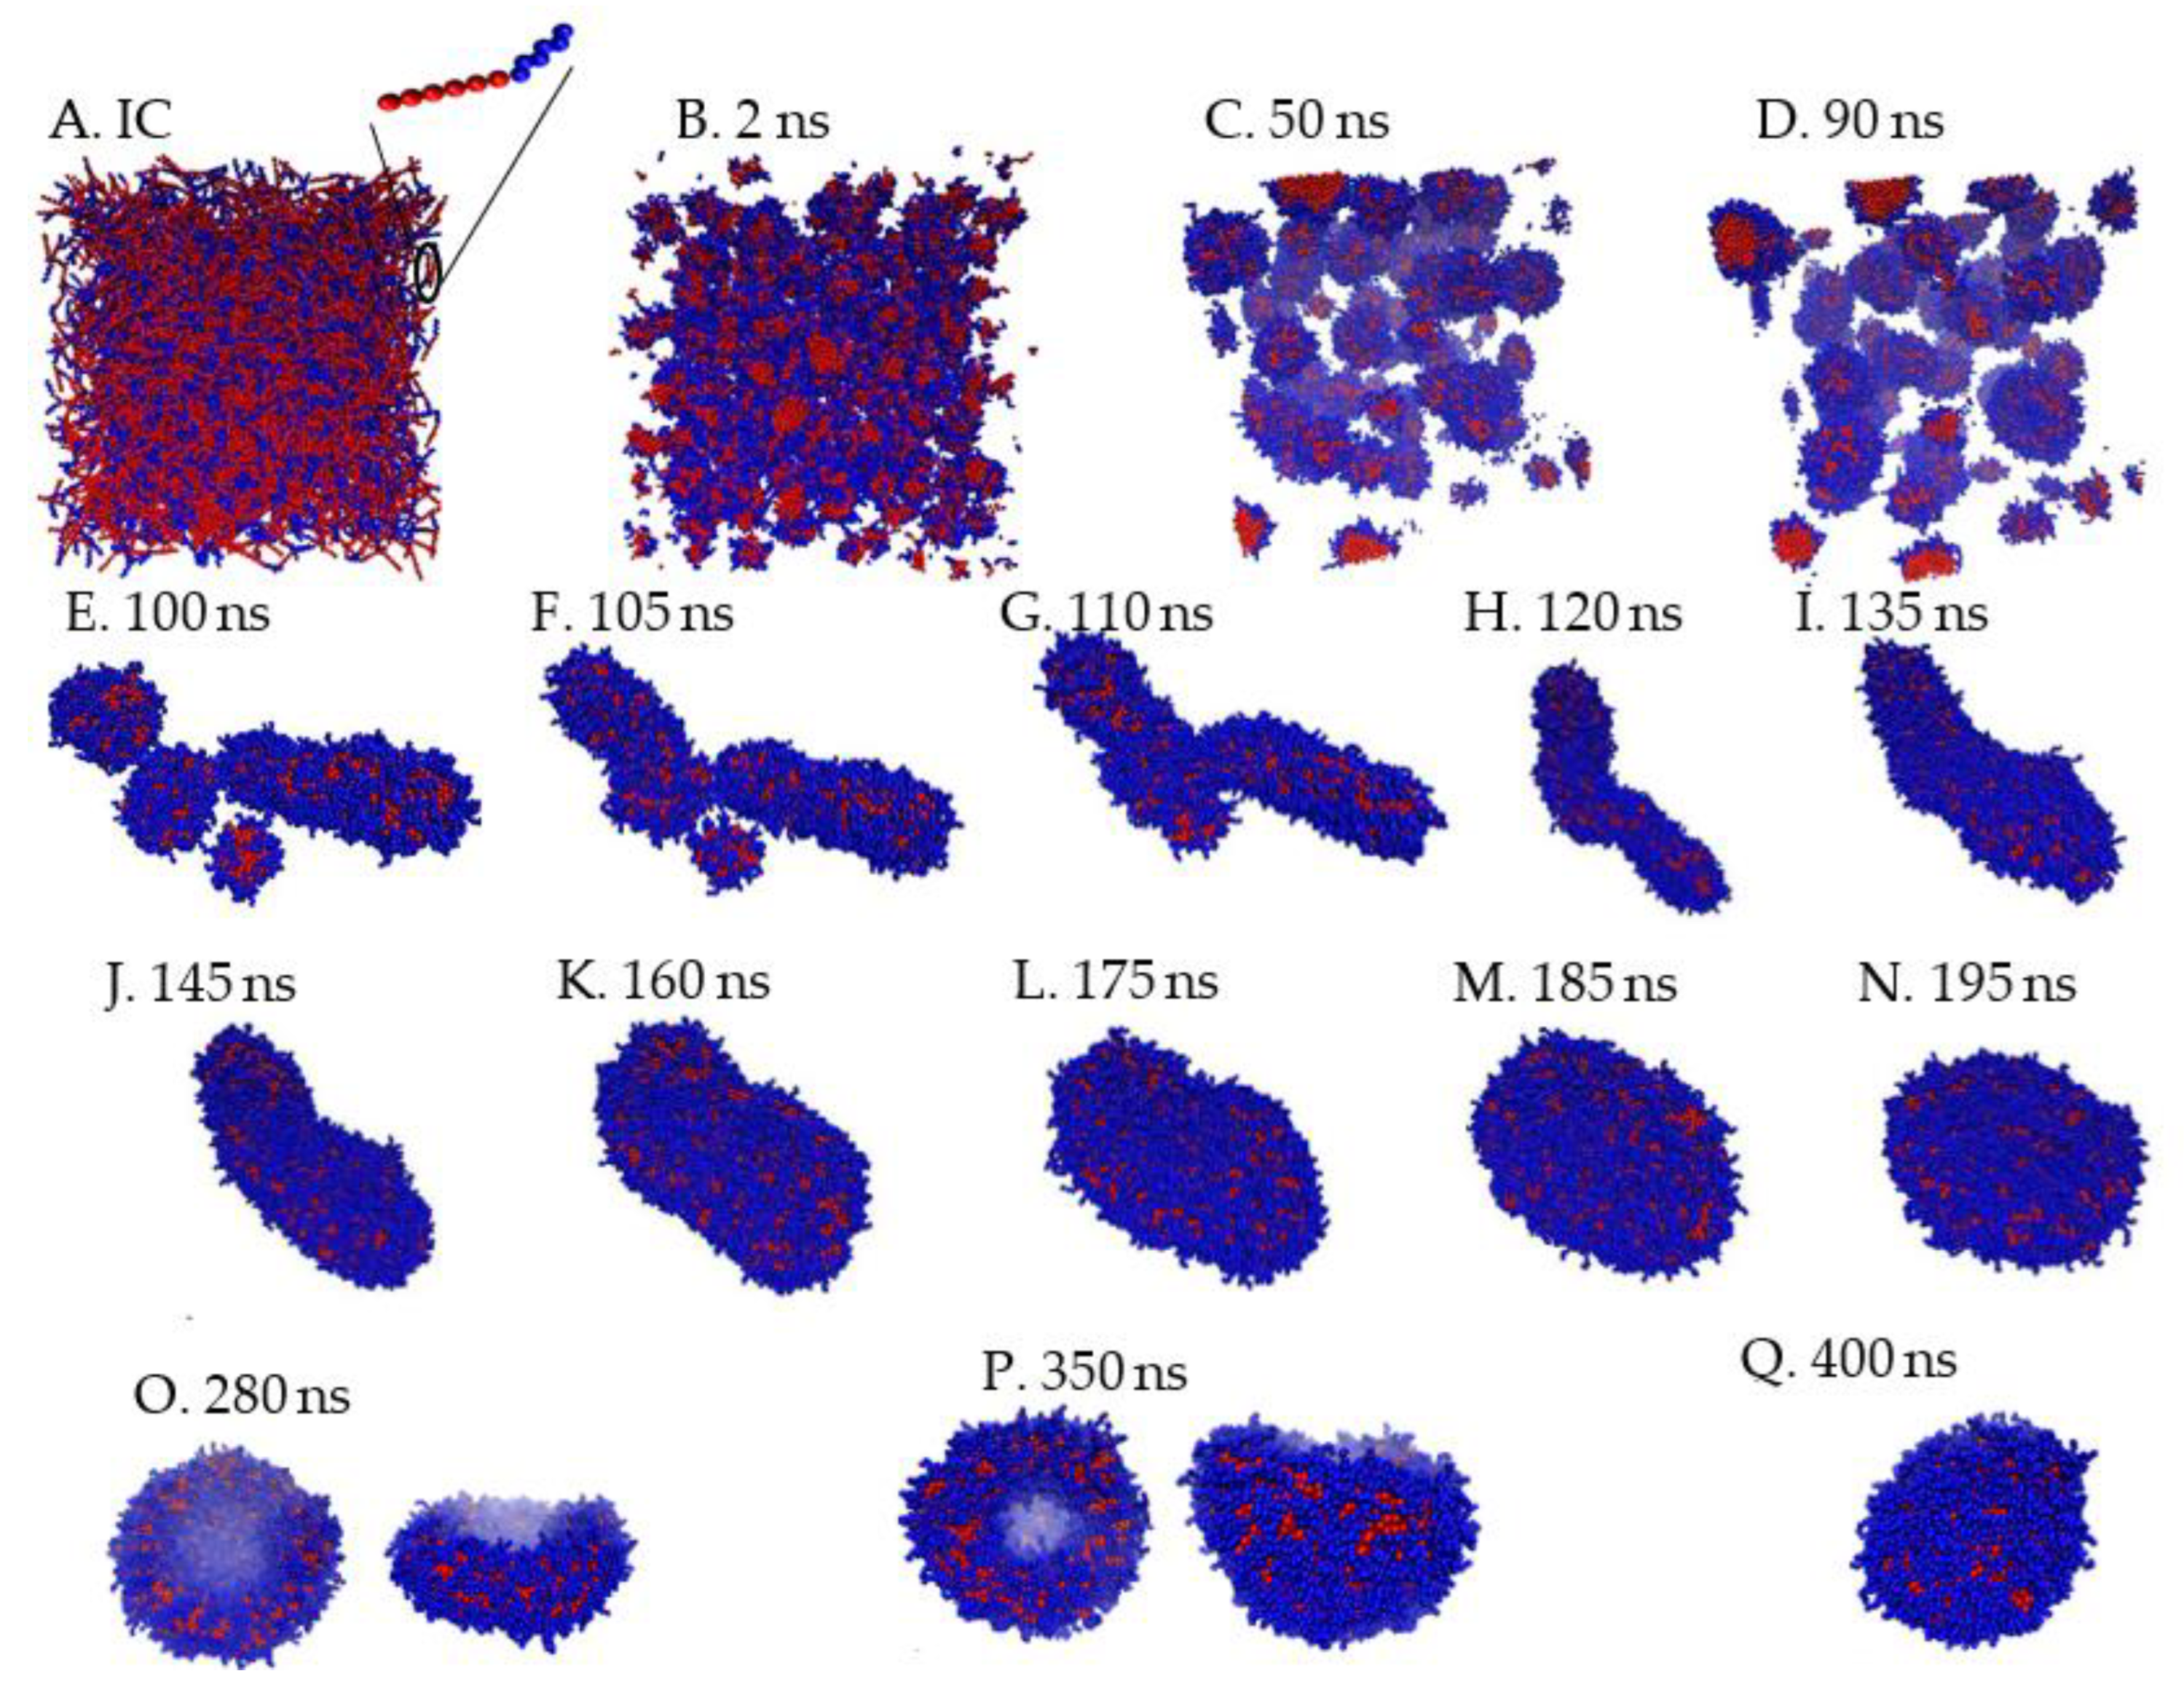
Figure 3.
Number of monomers (N), body Gaussian curvature (KG) and end-to-end distance (Q) vs. time. Blue and red colors represent PEO and PB domains. For the discoid lamella top and side views are shown. KG = 0 along the dotted horizontal line.
Figure 3.
Number of monomers (N), body Gaussian curvature (KG) and end-to-end distance (Q) vs. time. Blue and red colors represent PEO and PB domains. For the discoid lamella top and side views are shown. KG = 0 along the dotted horizontal line.
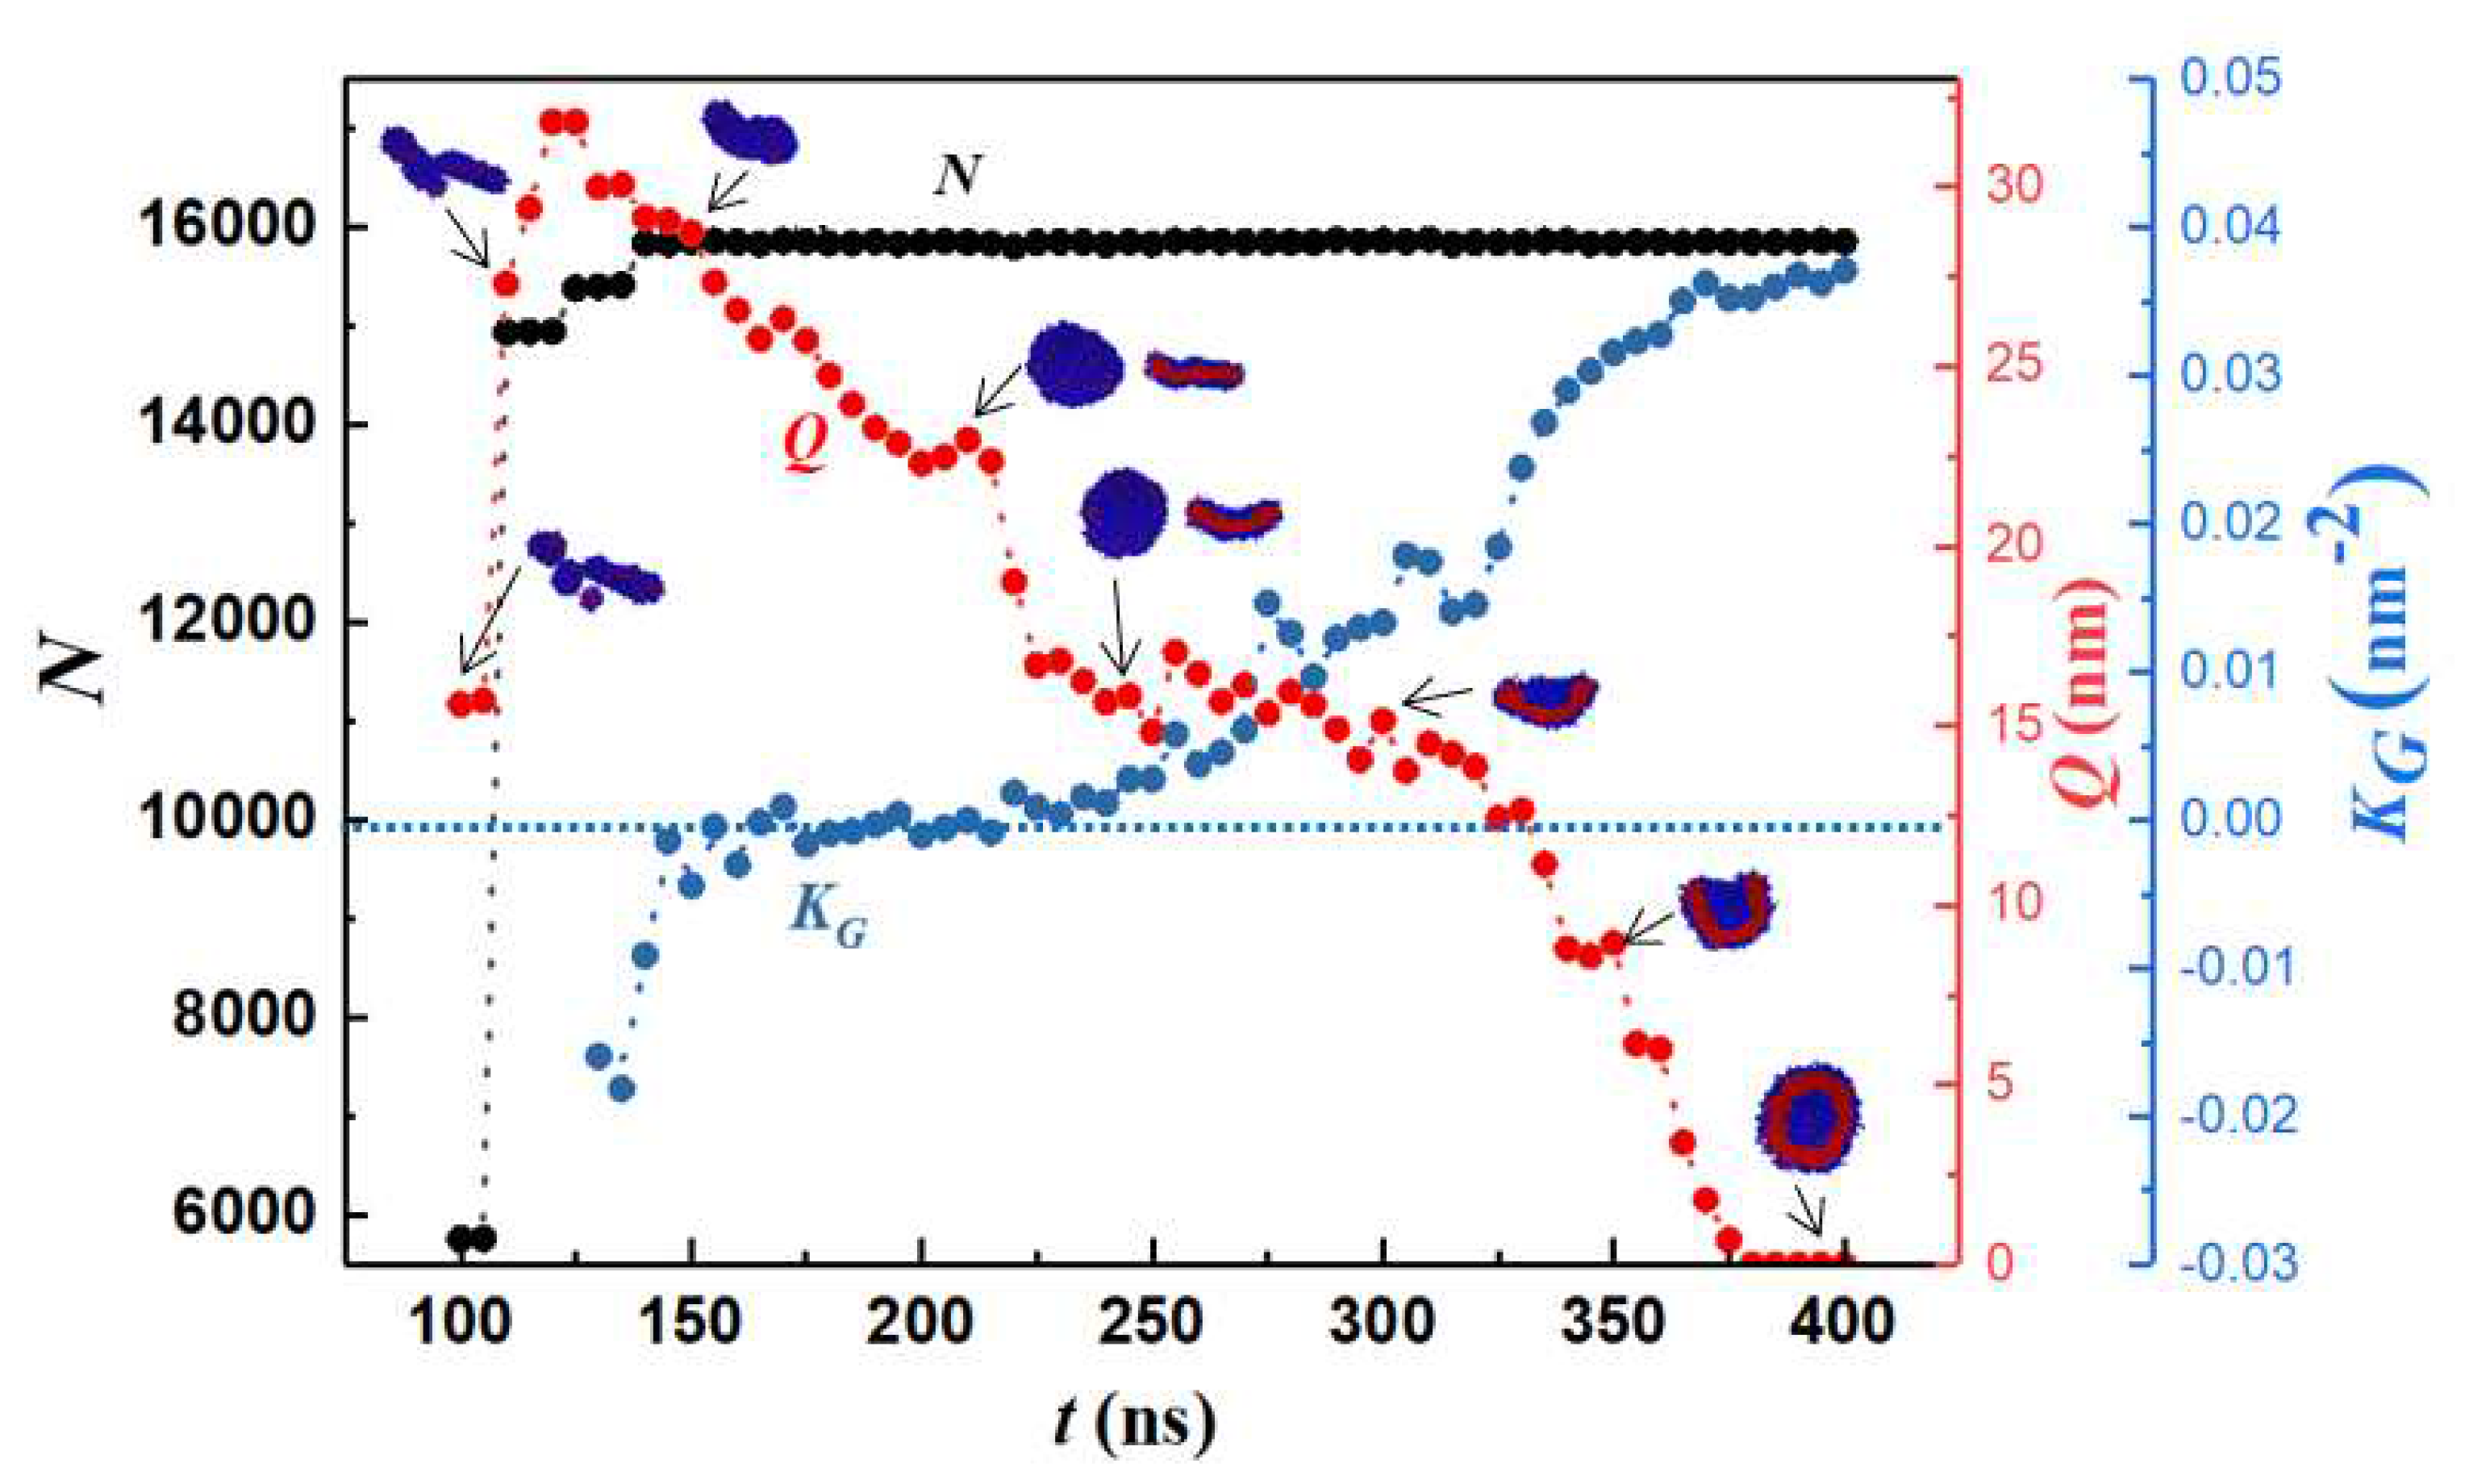
Figure 4.
Density of ethylene oxide beads in the top and bottom leaflets of the bilayer as a function of time. The dotted lines are moving averages.
Figure 4.
Density of ethylene oxide beads in the top and bottom leaflets of the bilayer as a function of time. The dotted lines are moving averages.
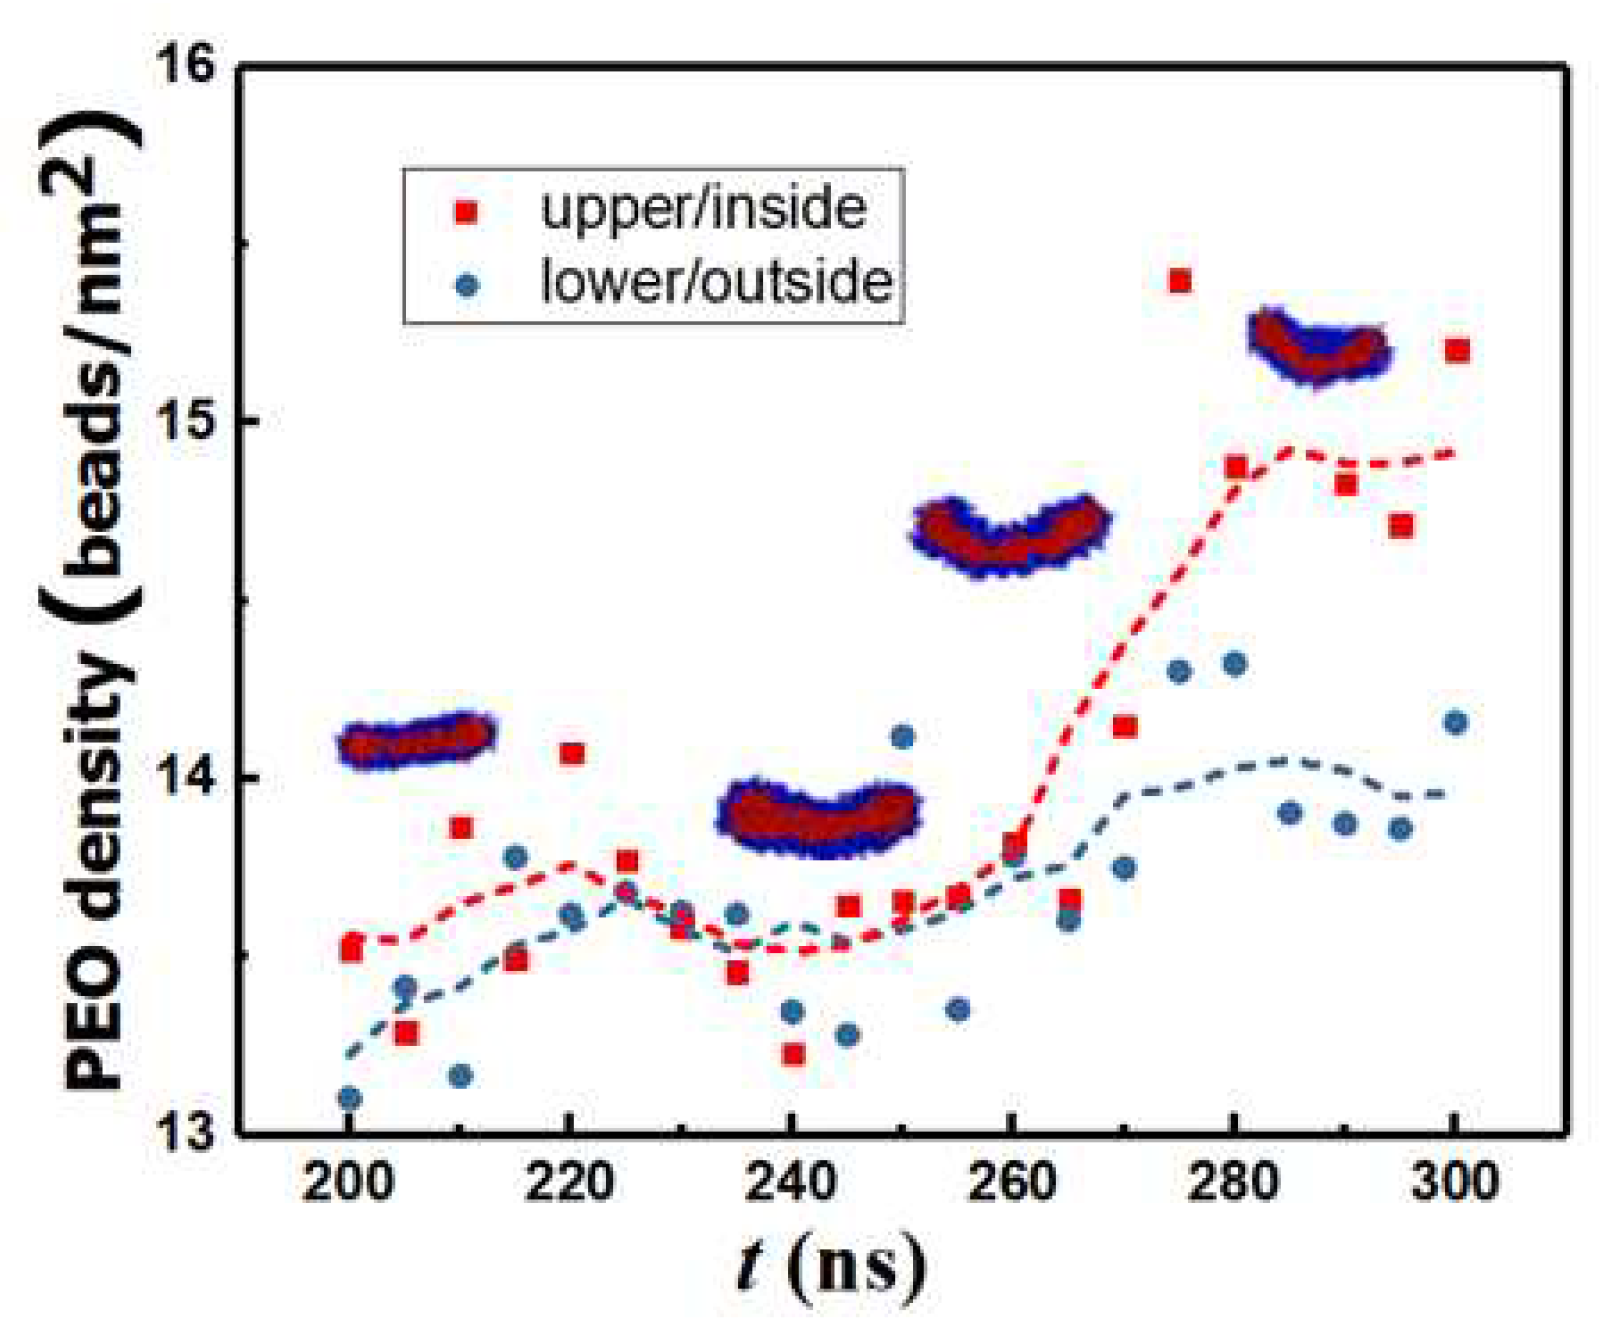
Figure 5.
Probability distribution function of the segmental stretch parameter for equilibrium (a). PB segment, (b). PEO segment, and (c). PB-PEO chain. Typical configurations at different locations in the pdf are shown.
Figure 5.
Probability distribution function of the segmental stretch parameter for equilibrium (a). PB segment, (b). PEO segment, and (c). PB-PEO chain. Typical configurations at different locations in the pdf are shown.
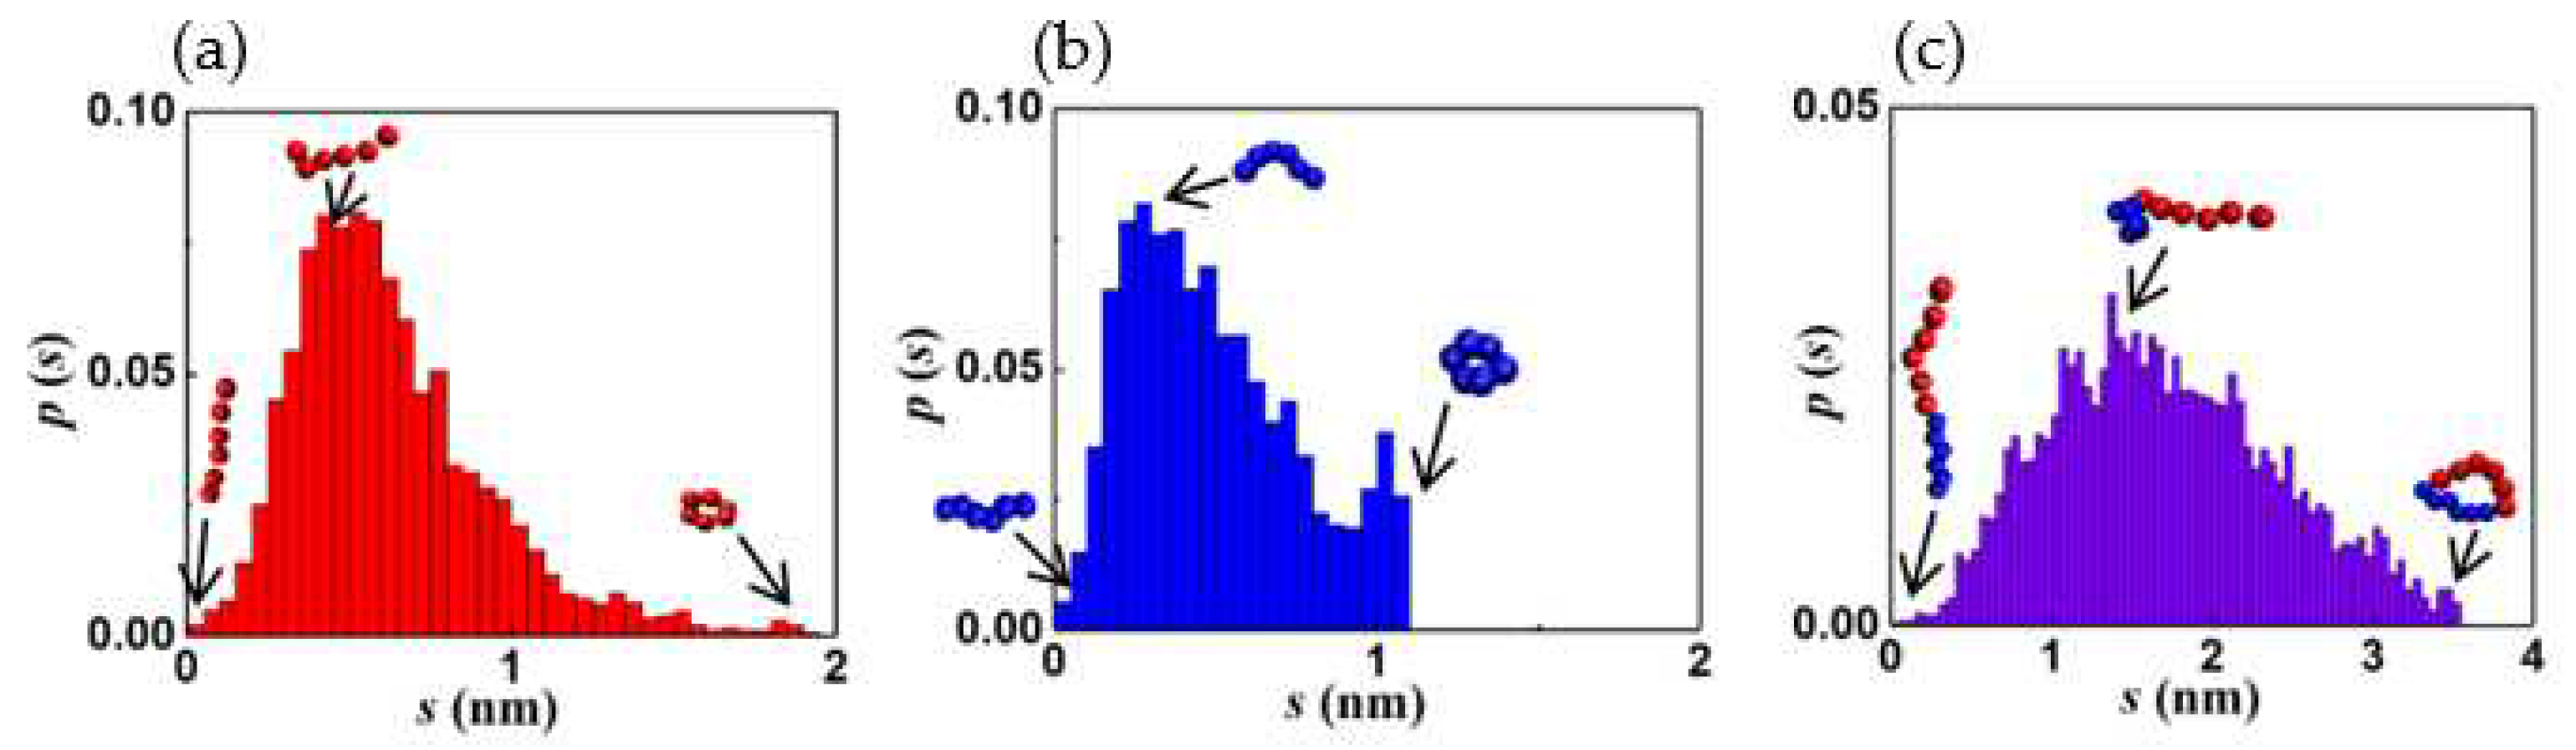
Figure 6.
a) Information entropy and (b) maximum and minimum segmental extension vs. time.
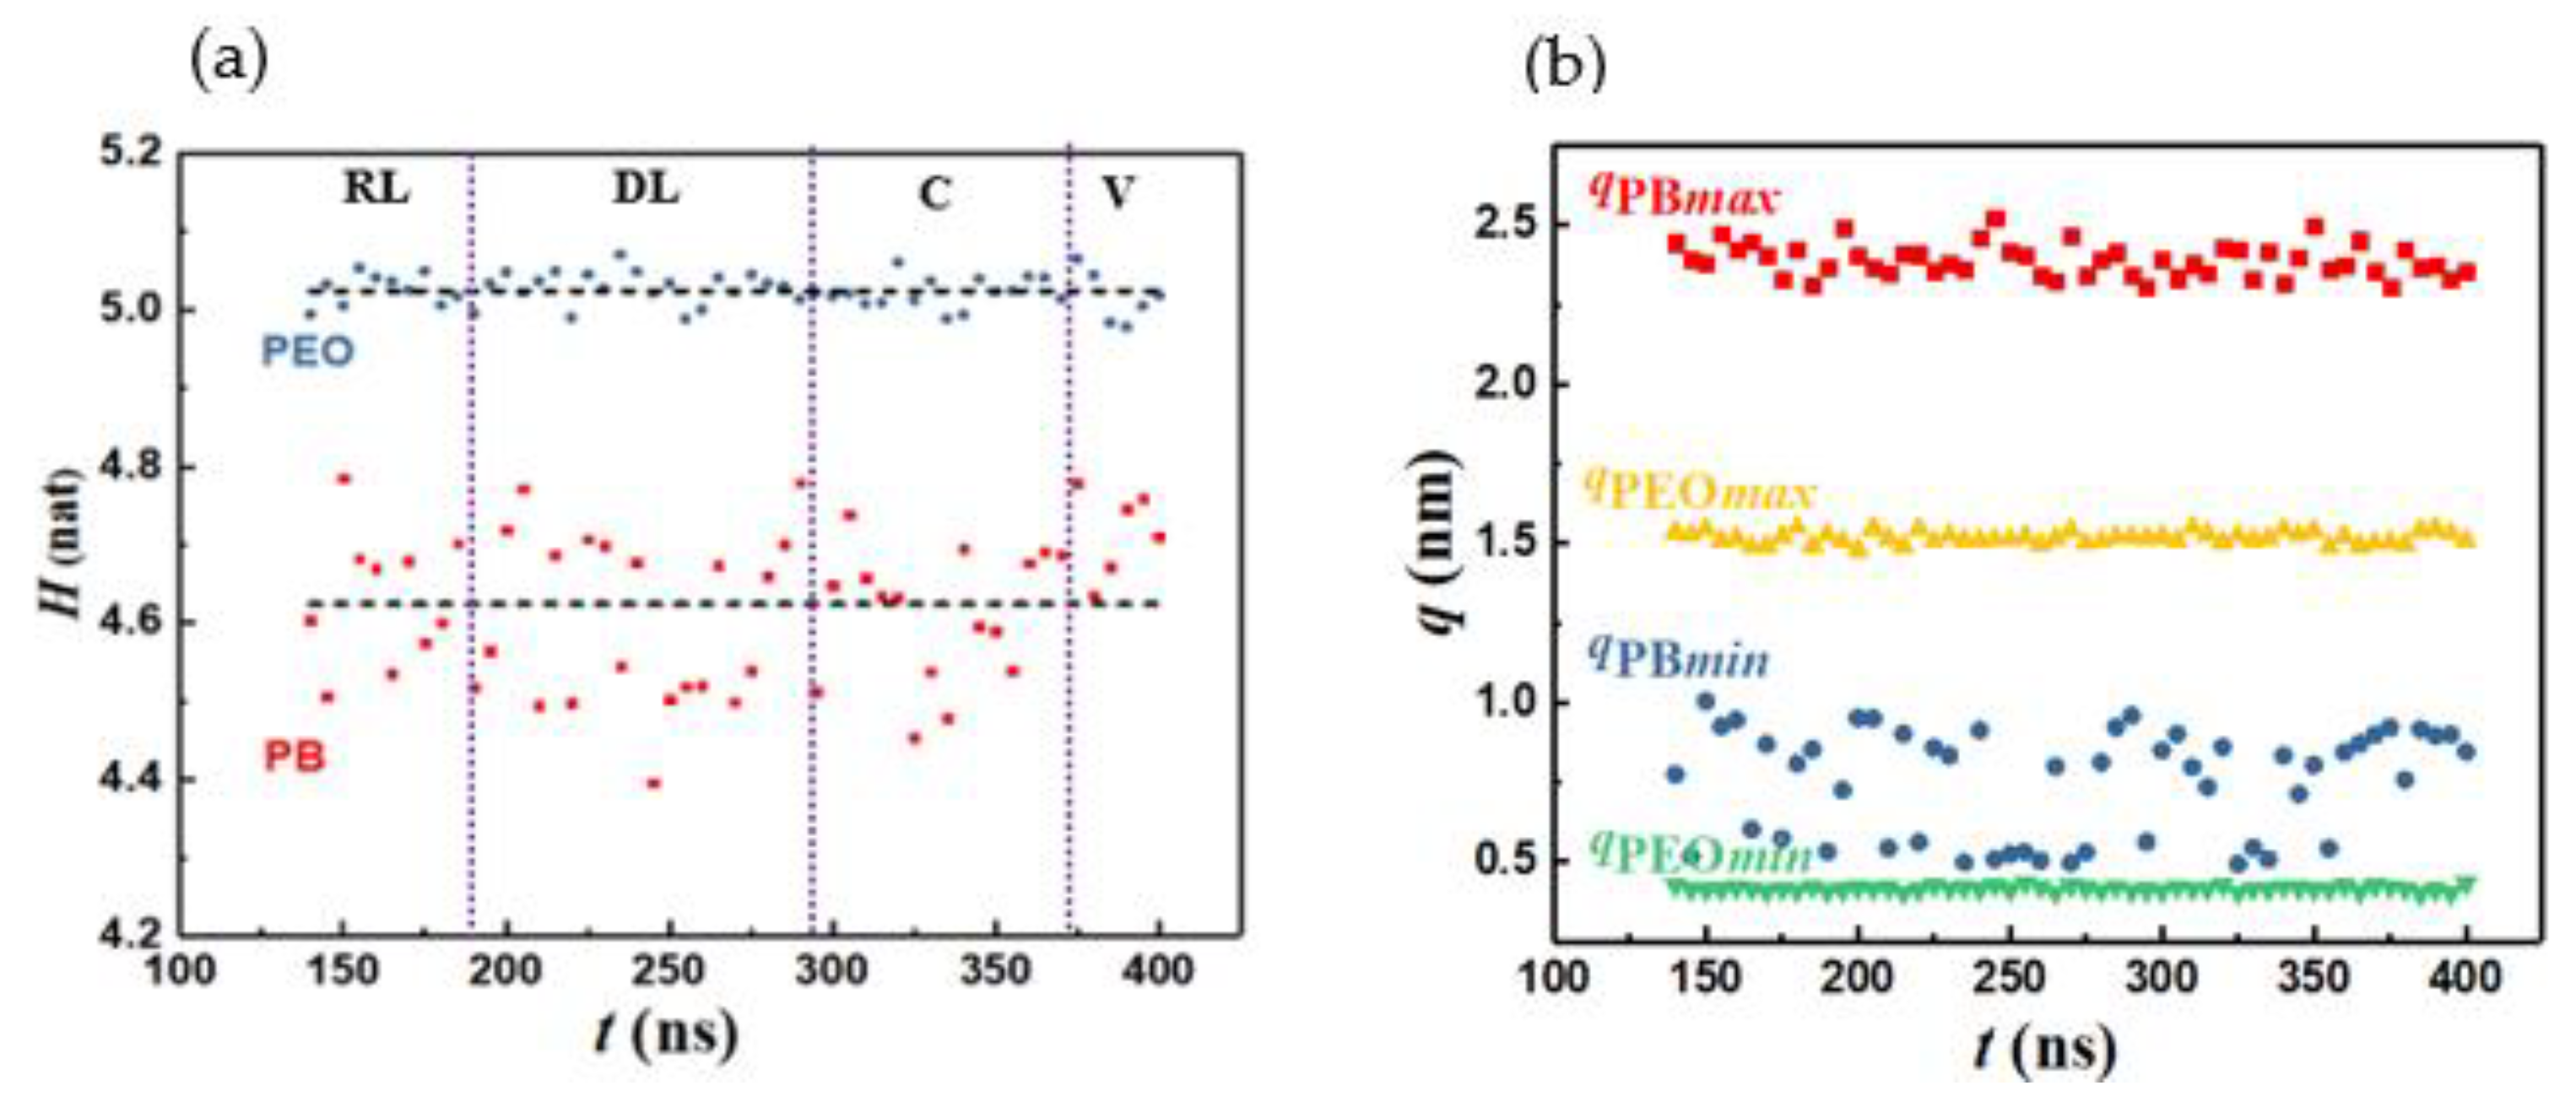
Figure 7.
a) Schematic diagram of disk to vesicle transition. (b) Disklike lamella and (c) vesicle from simulation.
Figure 7.
a) Schematic diagram of disk to vesicle transition. (b) Disklike lamella and (c) vesicle from simulation.
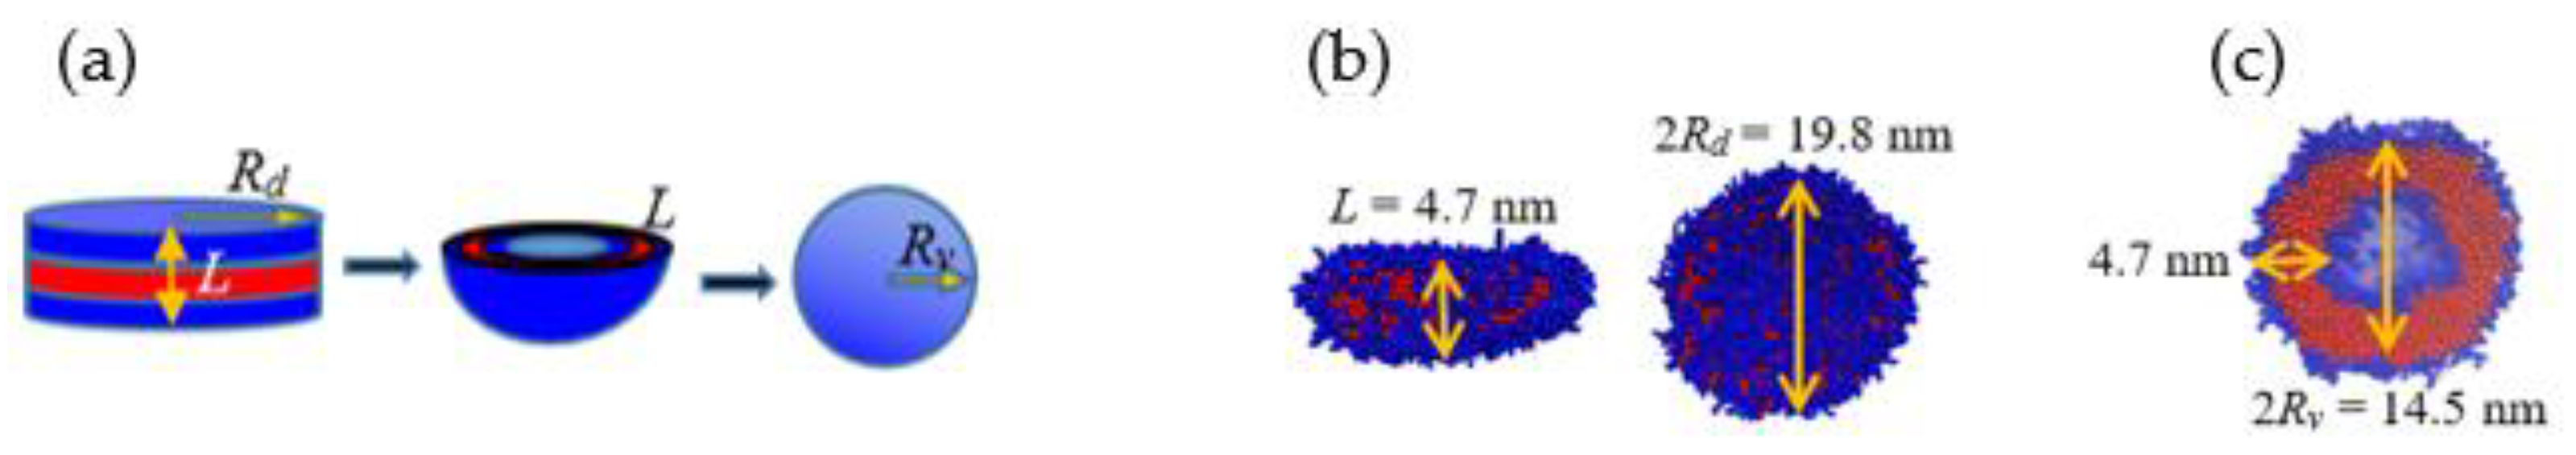
Figure 8.
(a) SASA and (b) relative SASA vs. time.
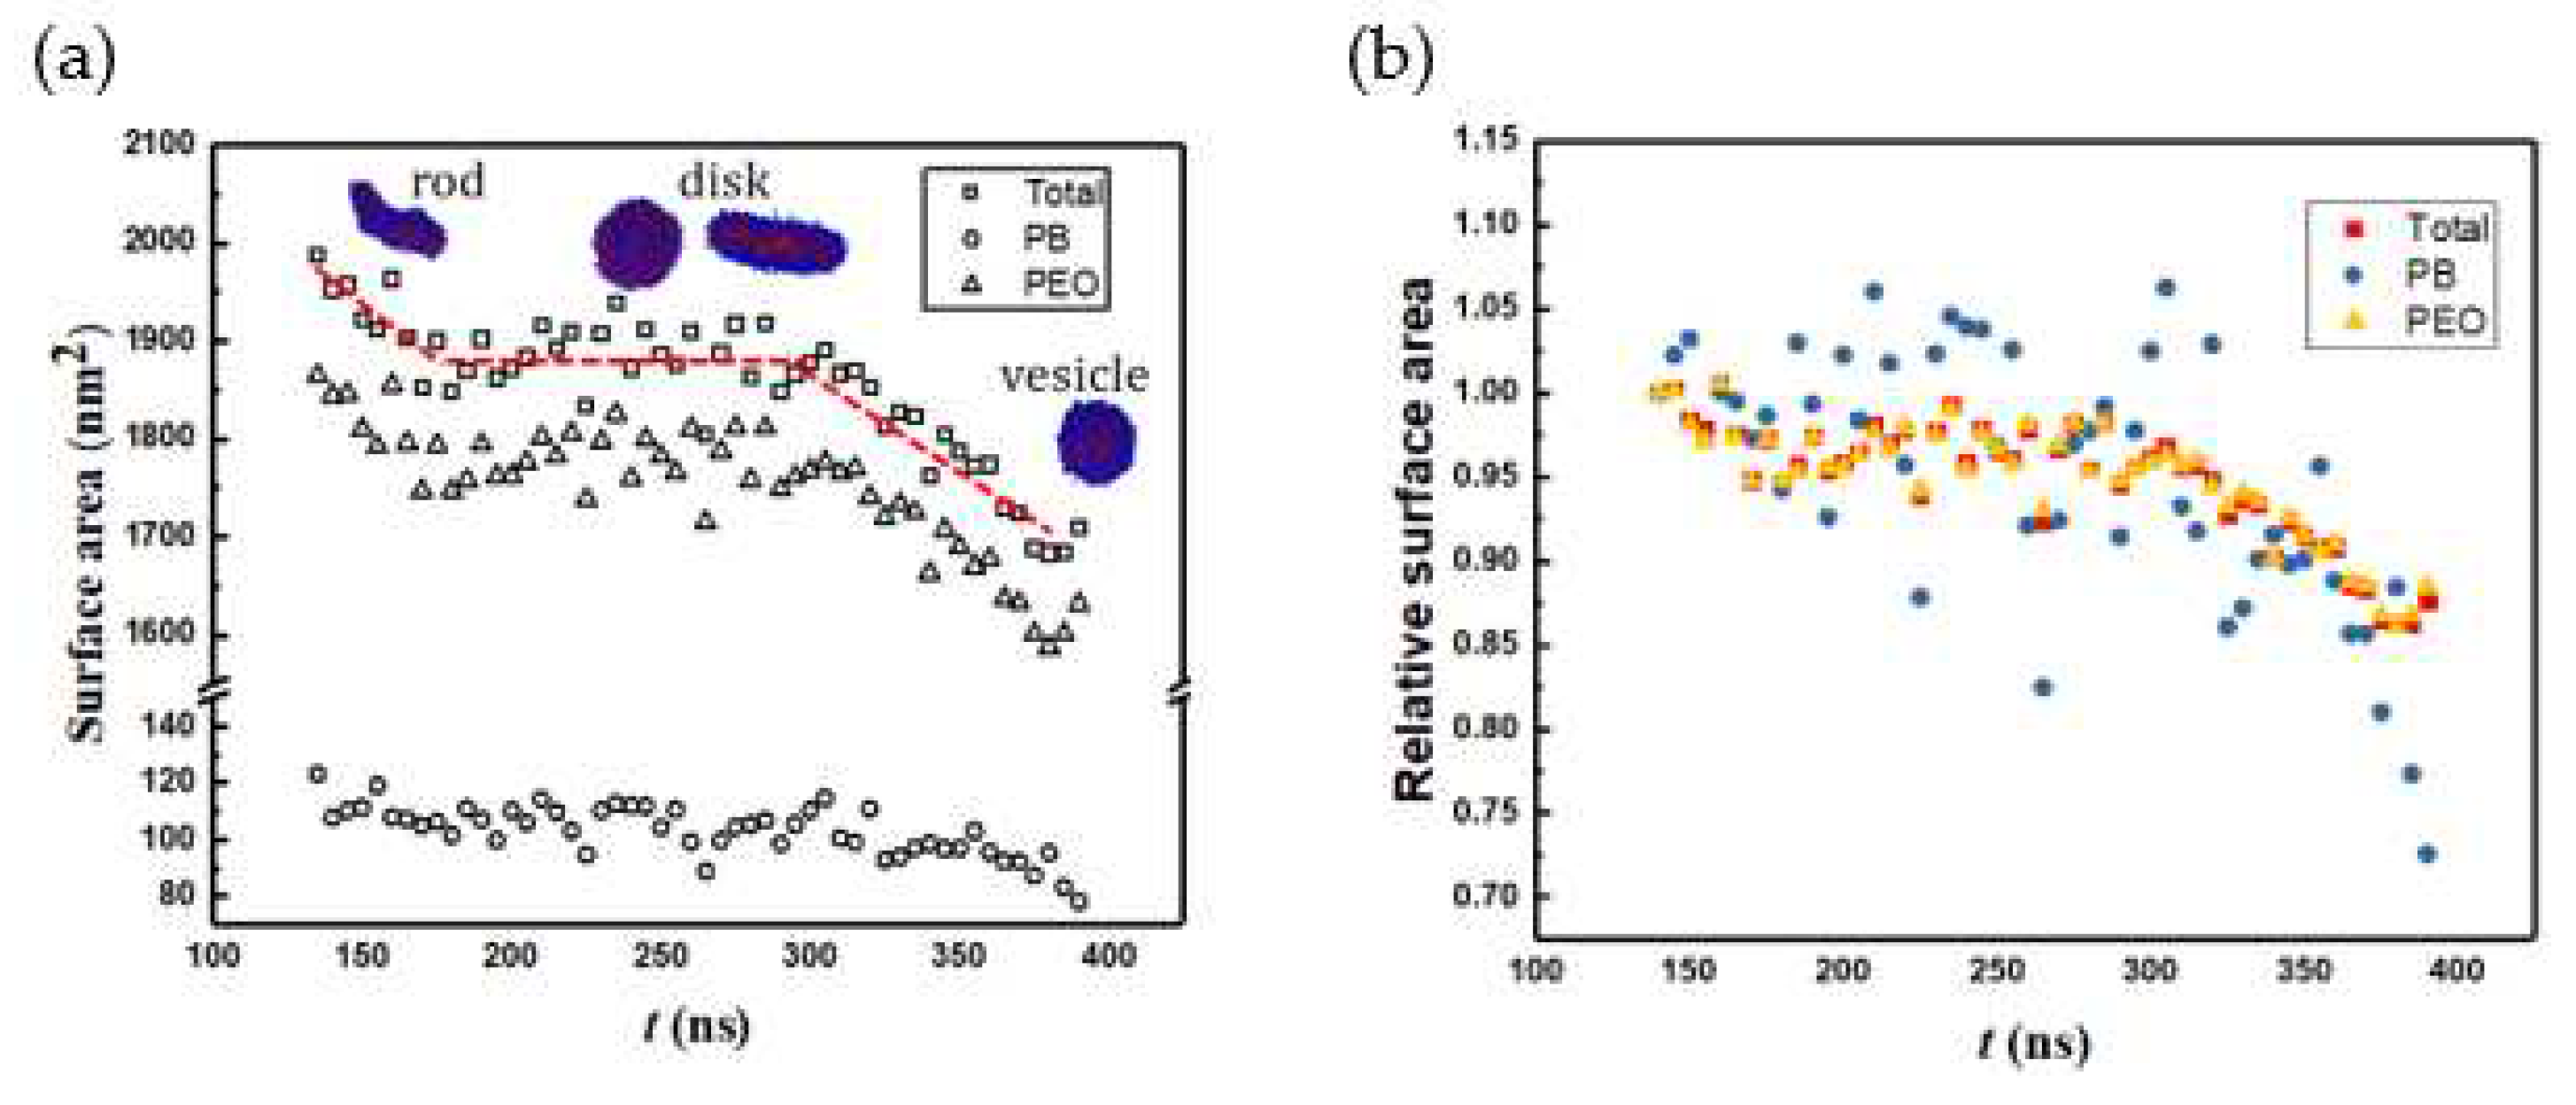
Figure 9.
Packing density vs. time.
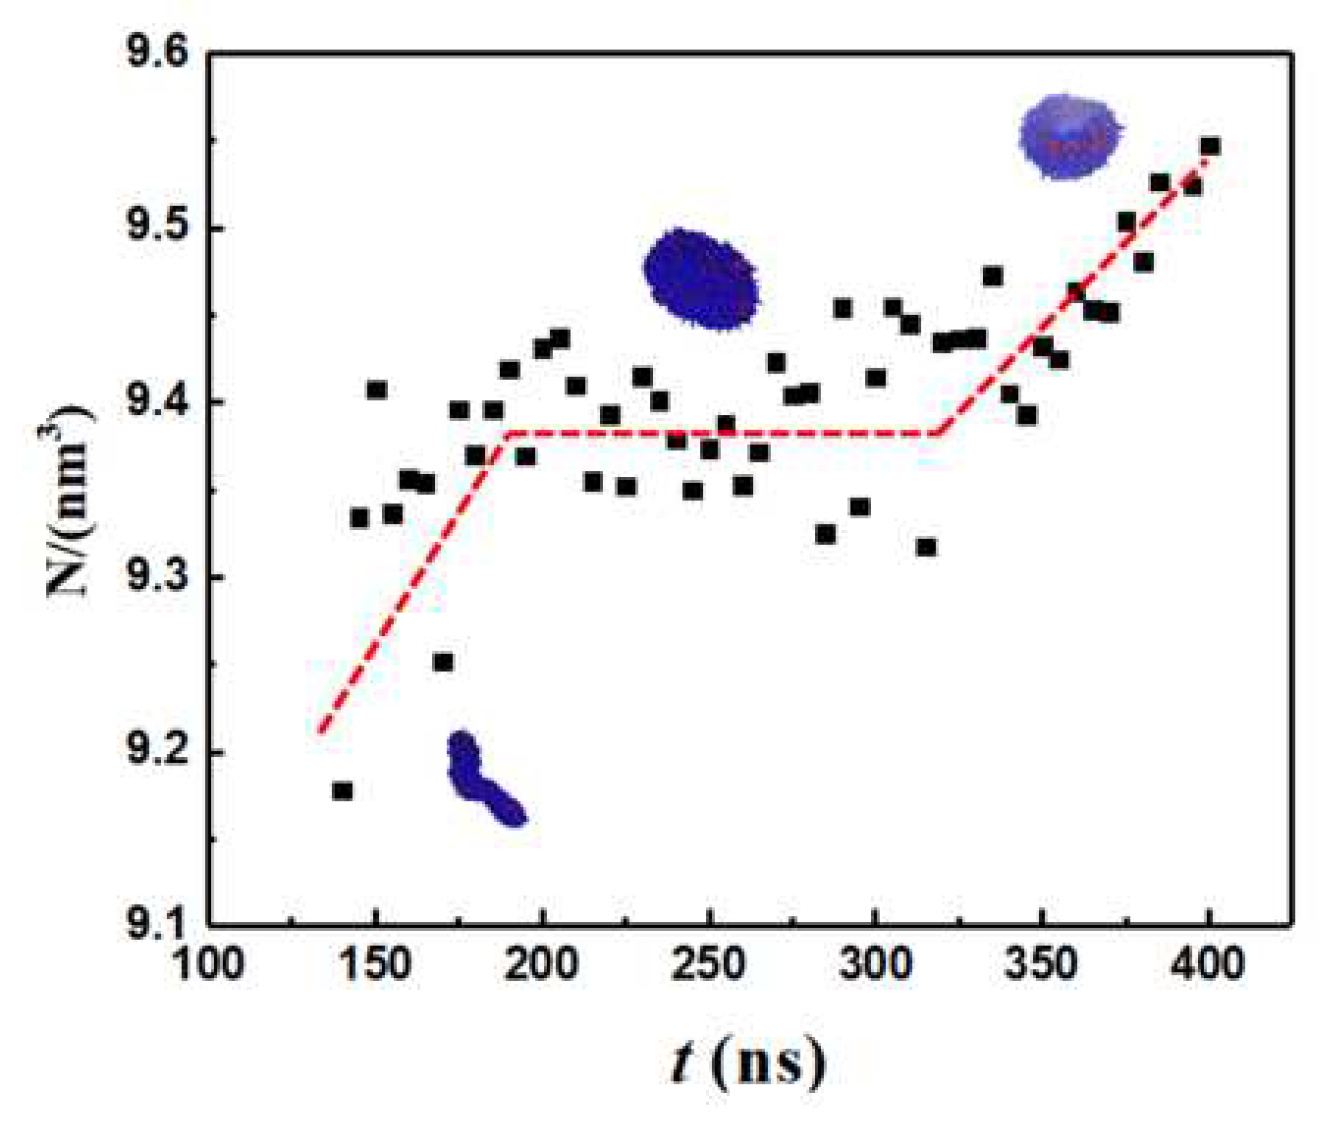
Figure 10.
Total non-bonded pairwise interaction energy for (a) water-PB (b) water-PEO.
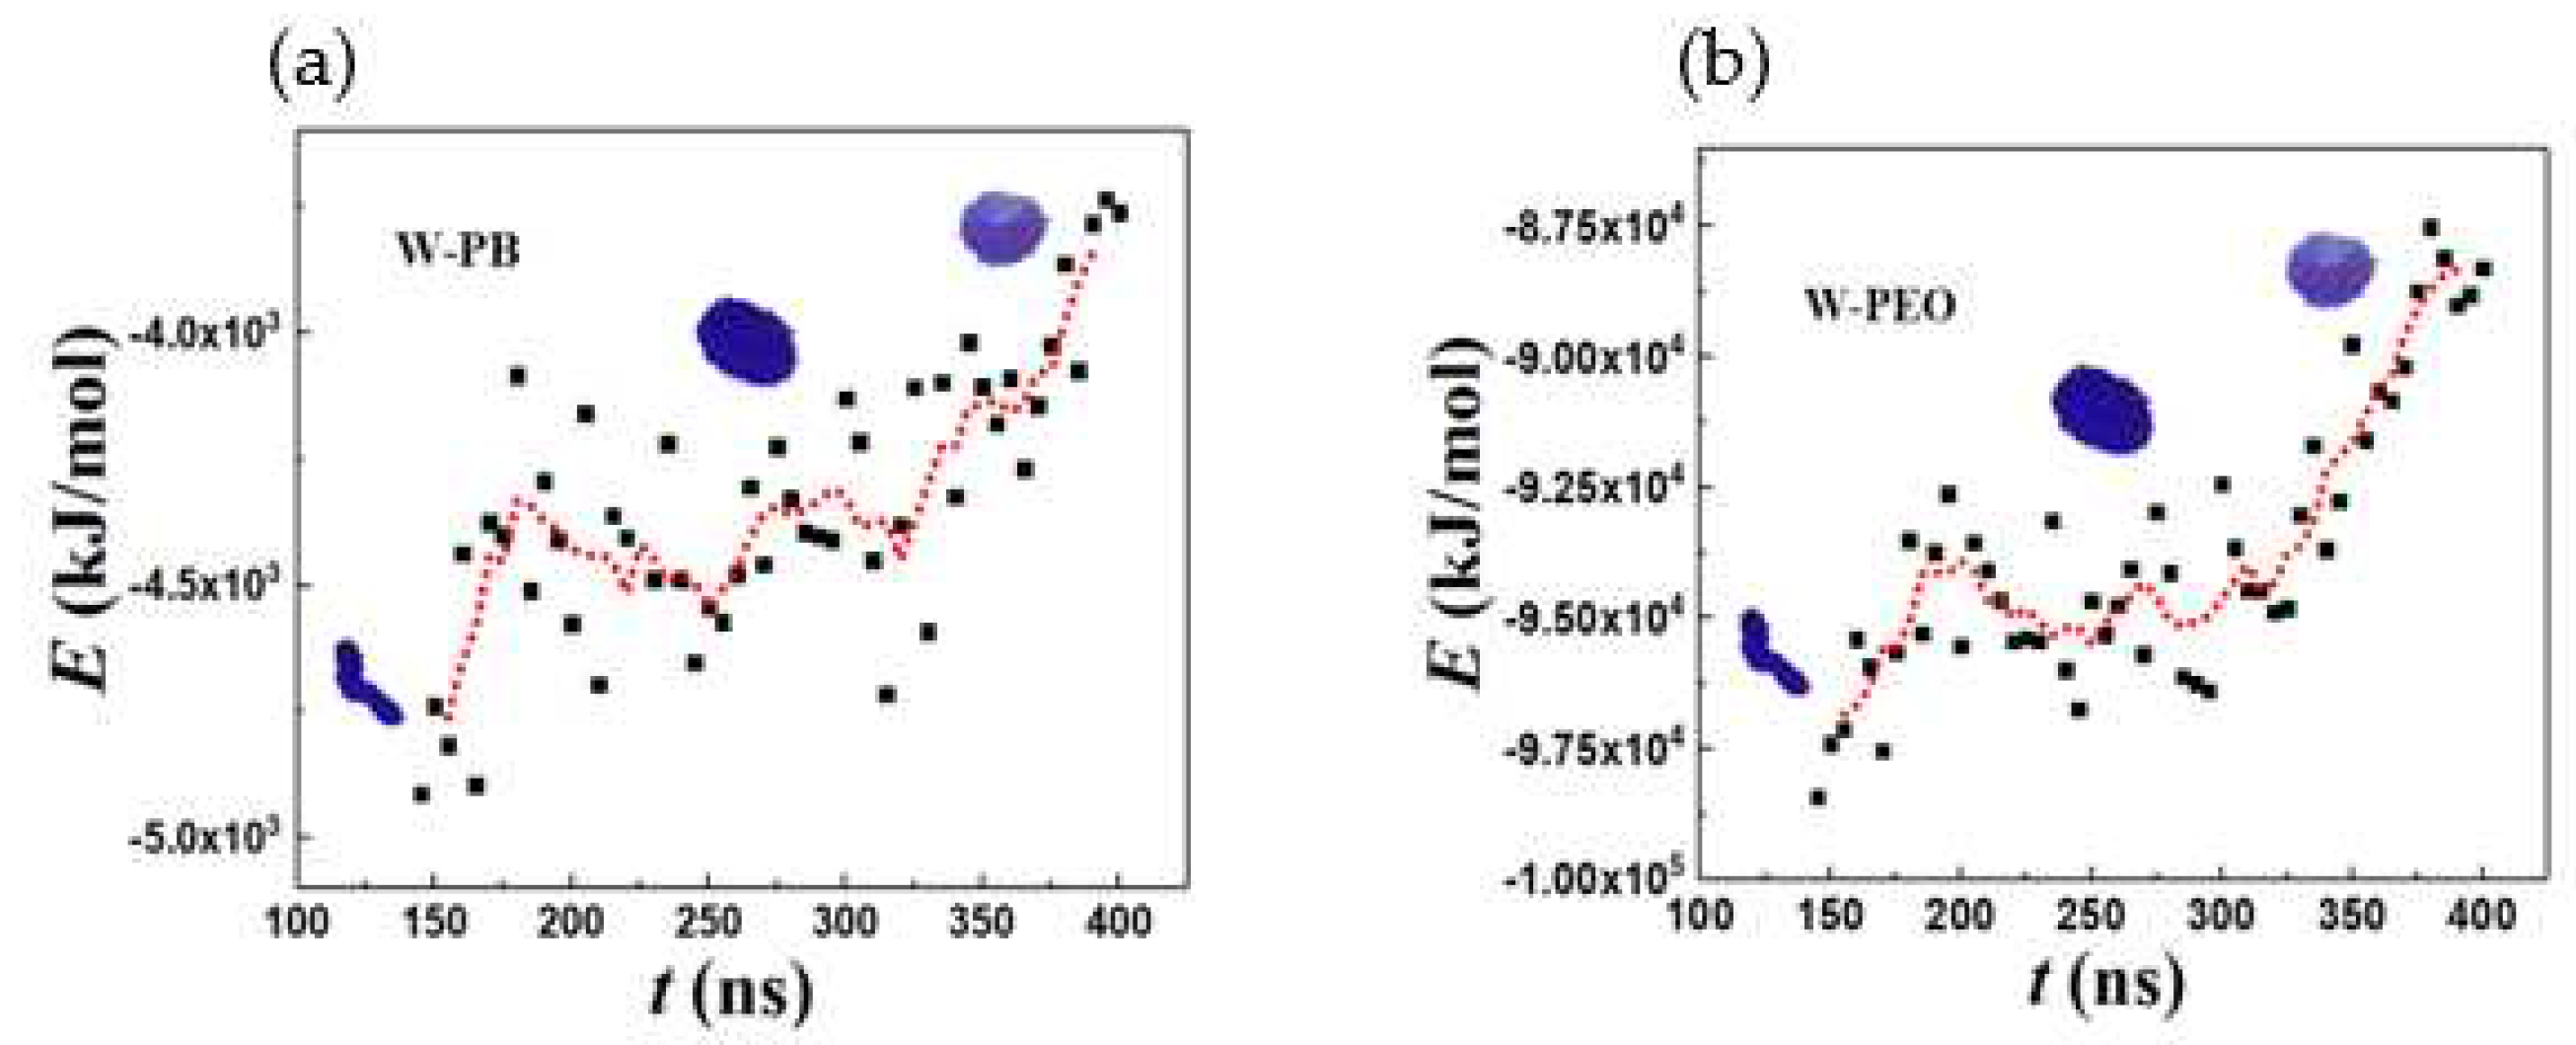

Table 1.
Quantitative descriptors of various morphologies. In the particle pair correlation functions, black, red, and blue lines represent water, PB, and PEO, respectively. See Videos S2-S6 for corresponding 3D visualizations.
Table 1.
Quantitative descriptors of various morphologies. In the particle pair correlation functions, black, red, and blue lines represent water, PB, and PEO, respectively. See Videos S2-S6 for corresponding 3D visualizations.
Disclaimer/Publisher’s Note: The statements, opinions and data contained in all publications are solely those of the individual author(s) and contributor(s) and not of MDPI and/or the editor(s). MDPI and/or the editor(s) disclaim responsibility for any injury to people or property resulting from any ideas, methods, instructions or products referred to in the content. |
© 2023 by the authors. Licensee MDPI, Basel, Switzerland. This article is an open access article distributed under the terms and conditions of the Creative Commons Attribution (CC BY) license (http://creativecommons.org/licenses/by/4.0/).
Copyright: This open access article is published under a Creative Commons CC BY 4.0 license, which permit the free download, distribution, and reuse, provided that the author and preprint are cited in any reuse.


