Submitted:
13 December 2023
Posted:
14 December 2023
You are already at the latest version
Abstract
The EU has planned the phase-out of new vehicles based on internal combustion engines in favour of high efficiency electric cars by 2035 (Fit for 55 package). However, many doubts remain about the effectiveness of this choice for each Country of the Union in terms of CO2 emissions reduction, as each State is characterized by a different carbon intensity related to the production of electricity needed to manufacture and recharge vehicles. This study seeks to explore the Italian case. To this aim, carbon intensities related to the electricity production were calculated considering both the Italian electricity mix production at 2021 and those at 2035, envisaged considering two scenarios based on different introductions of renewable sources (RES). Afterwards, the values obtained were adopted for determining the CO2 emissions related to the whole production process of battery systems in Italy (emissions from mining and refining, scrap materials and final assembly included) by comparing some of the most up-to-date Life-Cycle Assessment (LCA) analysis related to the manufacturing cycle of the batteries. Finally, the results were adopted to calculate the starting carbon debit for A, B, C and M car segments for Mild Hybrid, Full Hybrid and Full Electric powertrains. At the same time, statistical road fuel/electricity consumption data were collected and overall CO2 emissions were calculated for the same vehicles for a defined mileage, so to determine break-even points with respect to the cumulative (i.e., from battery and road) carbon emissions. The results showed that advantages related to electric vehicles are significant only if a low carbon intensity related to electricity production is reached by means of a very high introduction of RES, thus keeping the door open for innovative powertrain technologies (plug-in), if fed with low carbon fuels.
Keywords:
ICEV 2035 phase-out
; BEV
; HEV
; PHEV
; battery
; carbon intensity
1. Introduction
In order to contain – or rather avoid - the imminent effects of climate change, rapid decarbonisation of all economic sectors is required [1]. In particular, a fast decrease in the emissions production within the vehicular transport sector is necessary, as it alone contributes to emit around 23.2% [2] of the total CO2 emissions (2022) and in general to air pollution [3,4]. To this end, a wide variety of technologies and policies have been suggested and implemented in many Countries so far, along with diversified ways to achieve the targets needed to meet mitigation in CO2 production [5]. Among these, electrification of transport is considered one of the most noticeable actions to be adopted, above all in Italy where the fleet is constituted by a large number (39.8 million) of quite old (12 years on average) and polluting units [6]. In fact, it is well known that Battery Electric Vehicles (BEVs) have significant advantages, as highlighted in various Papers [7,8,9], such as no tail-pipe emissions and an overall greater efficiency than internal combustion engine (ICE)- based vehicles in terms of energy and emissions, even when electricity production is taken into account. However, BEVs cannot be considered as zero emission vehicles, as they are characterized by significant values of CO2 cumulative emissions. The latter are obtained by summing up the emissions related to the energy necessary for their functioning (i.e., the use-phase emissions) and those for the battery production phase (i.e., the production-phase emissions or battery cycle emissions) [7,10,11,12,13]. This approach is generally not applied in most of the Papers found in literature, which take into account only the end-use phase emissions and not the CO2 cumulative emissions produced by batteries. Therefore, as the European Union has recently guided its member States to adopt a phase-out in the production of conventional ICE vehicles and hybrid vehicles (HEV) by 2035 in favour of BEVs (Fit for 55 package) [14] mostly due to their reduced carbon footprint, this paper seeks to determine the real convenience of BEVs over both Mild Hybrid (M-HEV) and Full Hybrid (F-HEV) cars in terms of CO2 emissions. In details, the Authors focused the analysis on the energy aspect of the problem, as they believe that the real convenience of adopting one or another technology strictly depends on the future carbon intensity value of the electricity (c.i.e) produced in the Country where vehicles, and especially battery systems, have to be manufactured and finally used, along with the evolution of the c.i.e. value over time. This aspect has to be taken into major account if considering the Regulation (EU) 2023/1542 [15], which states that future batteries have to be produced in Europe in order to promote ethical and transparent sourcing/processing of raw materials, favour security of supply and support the re-use, repurposing and recycling of batteries. Since Italy has a long tradition as a carmaker, the analysis is focused on the comparison between BEVs and HEVs in the eventuality vehicles, and therefore batteries, were produced and adopted in the Country.
To determine the convenience cited above, the cumulative CO2 emissions, related to some of the most popular M-HEVs, F-HEVs and BEVs on the market, were determined and afterwards plotted versus mileage. In particular, at first, the production-phase emissions of batteries were determined by comparing some of the most significant and recently published LCAs [7,10,11,12,13,16] with respect to the actual (2021) Italian c.i.e. Afterwards, the road-use emissions related to the same vehicles, which are based on average real drive fuel or electricity consumption, were added, thus allowing the determination of the final cumulative CO2 emissions value for each car. The obtained values were, then, considered as baseline in order to forecast the cumulative CO2 emissions by 2035 when considering the evolution of the vehicles both in terms of running efficiency and energy battery density and two different c.i.e. The latter were calculated for that date by taking into account the RES installed capacities according to two different scenarios: a conservative one (BAU@2035) and a binding one (Fit for 55@2035) with respect to the objectives of the Fit for 55 package by 2030 within the Green Deal [14], although extended until 2035. The study presented shows that a significant advantage related to the BEVs deployment in terms of CO2 reduction could be obtained only if a much lower c.i.e than the actual one is reached. Moreover, it highlights that this advantage differs significantly when it is compared to those found in other European Countries characterised by much lower c.i.e than the Italian one. At last, it keeps the door open to different powertrain technologies (plug-in hybrids vehicles, PHEVs) fed with low carbon fuels.
2. Materials and Methods
In order to carry out the assessment regarding the convenience in phasing out the production of HEV powertrains (Mild or Full) by 2035, 12 vehicles belonging to A, B, C and M segments, which represent around 85% of the Italian fleet, were initially selected (Table 1). Each of them was characterised by the three recalled powertrains, was a model year 2022 and was identified after a market inquiry. The models were currently manufactured by the following Brands: Suzuki, Mazda, Ford, Honda, Toyota, Hyundai, Volkswagen, Nissan, Tesla and Opel.
- the Business as Usual (BAU@2035) scenario (conservative), constructed considering a consolidated average growth rate (CAGR) of newly installed RES capacity over the period 2016-2021 until obtaining a total amount of RES in 2035;
- the Fit for 55@2035 (FF55@2035) scenario (binding), constructed taking into account the same growth rate of newly installed RES capacity as stated to fulfil the Fit for 55 package objectives by 2030 until obtaining a total amount of RES in 2035
Afterwards, the value related to the cumulative CO2 emissions produced by the aforementioned vehicles was calculated. As said before (§1), the cumulative CO2 emissions was obtained for each vehicle by summing up the emissions coming from a) the specific use-phase of the vehicle; b) the vehicle production phase. In details, the first ones are produced by the vehicles (Table 1) during their functioning on the road and therefore depend on the energy/fuel consumption data, which in this case are real statistical mean records and not homologation data. They are expressed in terms of kgCO2/km and increase with mileage. Moreover, in case of BEVs, they depend on the c.i.e. of the electricity consumed to power vehicles. Instead, the emissions coming from the vehicle production phase are fixed and are produced during the materials extraction and transformation processes (mining and refining), the vehicle production (manufacturing, battery production, etc.), the vehicle dismantlement (final disposal phase) [7,10,11,12,13]. In particular, the main content of the vehicle production emissions is related to the battery production, which is particularly true for BEVs, as the HEVs have normally a modest battery capacity on board. For this reason, in order to simplify the comparison between HEV and BEV vehicles without involving any significant inaccuracy, it was chosen to focus the analysis only on the emissions from battery production, thus assuming an equal amount of CO2 generation for the rest of the vehicles (both BEVs and HEVs), which will not be considered in the comparison. To calculate the CO2 emissions from battery production when these are produced in Italy, the CO2 specific emission value, expressed in terms of kgCO2/kWh of battery capacity, was determined. To achieve this goal, a critical comparison between six of the most recent and relevant LCA analysis available in literature [7,10,11,12,13,16] was performed, so to define a specific reference value of battery CO2 emission when the current (2021) Italian c.i.e. is considered. The cross comparison of these analysis was necessary as the LCAs results reported in literature, even if calculated by means of important and detailed databases, are commonly presented as local values of c.i.e, which could strongly differ among each other and from the Italian one, as they could depend on coal or nuclear energy for electricity production. At last, the specific CO2 emission value related to battery production was multiplied for the battery capacity of each aforementioned vehicle and finally summed to the relative total road emissions produced until the end of vehicle’s life, thus allowing the determination of the final cumulative CO2 emissions value for each car. All these values were, then, considered as reference to forecast the cumulative emissions values by 2035. To obtain these results, two c.i.e. values at 2035 were calculated according to the two following scenarios:
Afterwards, by means of the two aforementioned c.i.e values, it was possible to evaluate the evolution of the battery CO2 specific emission value through time and the road use emissions, therefore to calculate the cumulative emissions of each vehicle by 2035. As regards the reference mileage, it was chosen both a theoretical maximum value of 160.000 km and one closer to reality of 120.000 km, which corresponds to the average running range for vehicles in Europe [17]. Finally, a comparison was carried out in terms of CO2 emissions between the three different powertrains for each of the four vehicle segments in the current, BAU@2035 and FF55@2035 scenarios. This analysis was based not only on the current total consumption data, which consider the electrical and/or thermal powertrain efficiencies, battery energy capacity, etc., but also on their future development until 2035 in terms of technical evolution and enhanced performances of the recalled parameters [18]. For this reason, in 2035 energy scenarios, an increase in performance regarding battery capacity and a better running efficiency were considered for BEVs. At the same time, a lower fuel consumption was considered for M-HEV and F-HEV due to an enhanced matching between electric powertrain and IC engine, which reduces even more the low efficiency part-load operation.
3. Results
In this Section, the value of the Italian c.i.e at 2021 was at first determined and reported (§3.1). Along with it, two different predictions of c.i.e at 2035 were made by taking into account the evolution of the parameter over time (2021-2035) according to a conservative (BAU@2035) and a binding scenario (FF55@2035) (§3.2). These scenarios differ from each other above all for the different future electricity generation mix values and, in particular, for the different potential RES installed capacities. The obtained c.i.e at 2021 and 2035 were newly determined, in comparison to a previous paper by the same Authors [19], by taking into account some updated values of the CO2 specific emissions, expressed in terms of gCO2/kWh, regarding renewables (e.g., new technologies for the production of photovoltaic panels, etc.) and fossil fuels (e.g. more efficient CCGT power plants), according to the American National Renewable Energy Laboratories (NREL) [20]. Furthermore, it was considered the contribution coming from the CO2 specific emissions related to the imported electricity from other Countries. In particular, the mean European value of the c.i.e was taken into account according to the current (2021) and future (2035) scenarios. At last, the CO2 specific emissions related both to the battery production (§3.3) and to the use-phase of the vehicle (§3.4) were calculated. The resulting data, which correspond to the cumulative value of CO2 emissions related to each vehicle, were then plotted versus mileage until the vehicle’s end of life (@160,000 km) according to the current scenario (2021) and to the four vehicle segments (respectively, A, B, C and M). In particular, in all the four plots obtained a comparison between the three different powertrains was done both highlighting break-even points in terms of CO2 emissions and calculating the additional carbon emissions (expressed as percentages) produced by HEVs, if compared to BEVs. Afterwards, by taking into account the c.i.e. at 2035 for both the scenarios and the evolution of the vehicles in terms of running efficiency and energy battery density, a new set of data, corresponding to the future cumulative value of CO2 emissions, was plotted according to BAU@2035 and FF55@2035 scenarios and to the four vehicle segments. In particular, in all the eight plots obtained a comparison between the three different powertrains was done both highlighting break-even points in terms of CO2 emissions and calculating the additional carbon emissions (expressed as percentages) produced by HEVs, if compared to BEVs.
3.1. The Italian c.i. at 2021
In general, the mean c.i.e of the electricity produced in a Country depends on the following features:
- The primary fuel used and the thermodynamic cycle allowable by the fuel.
- The contribution of RES, whose total incidence varies according to the season and to the different weather conditions;
- The net energy flux imported and exported through the international exchange;
Regarding the Italian situation (updated to 2021, as 2022 was considered statistically not significant because of the war between Russia-Ukraine and of the exceptional drought), the energy consumption resulted to be around 320 TWh, with an electricity mix depending on the deployment of thermoelectric non-renewable plants based on natural gas (about 50% of the whole electricity production), oil (6.1%) and coal (6.9%), along with a significant percentage of RES (about 37%), mainly hydroelectric (15.7%), photovoltaic and wind (16.1%) [21,22,23]. According to this energy panorama, the total electricity produced in the Country resulted to be 278 TWh, 116 TWh of which from renewable sources and 162 TWh from fossil fuel ones (Table 2). Instead, the net electricity import was approximately 43 TWh [21] and the curtailment/storage losses accounting about 1 TWh [24]. Therefore, based on the specific c.i. for each technology production reported by NREL [20] and considering a mean European c.i.e related to the net imported electricity (287 gCO2/kWh@2021) [25], a quite accurate c.i.e value of 293 gCO2/kWh was determined by means of the following equation:
C.I. E. (2021) = ∑gCO2/kWhres*(TWhres/TWhtot) + ∑gCO2/kWhfos*(TWhfos/TWhtot) + ∑ gCO2/kWhI* (TWhI/TWhtot)
3.2. The Italian c.i. at 2035
In order to calculate the c.i.e at 2035, two different scenarios were defined by the Authors: the BAU@2035 and the FF55@2035 scenarios. The latter were outlined by the comparison and merge of different scenarios at 2030 and 2040 defined by several analysis performed by Terna, Snam and Institute for Sustainable Future (ISF) [24,26,27]. The BAU is a conservative scenario which takes into account the evolution of the Italian newly installed RES capacity over the period 2021-2035. It considers the trend of newly installed RES capacity for 2016-2021 extended up to 2035 along with a constant capacity of fossil fuel-based power plants, if compared to the 2021 values. The latter is constant as a whole, but foresees an increase in the deployment of natural gas and a decrease in the other non-RES (mainly coal and oil), this to accomplish the decarbonisation pledges. In details, the BAU@2035 scenario is characterised by a consolidated annual growing rate (CAGR) of newly installed RES equal to 1.0 GW/year (corresponding to an energy growing rate of about 1.35 TWh/year), a value which was calculated over the period 2016-2021 (2020 excluded because of COVID-19) and fully confirmed in the 2023 IEA report regarding Italy [22,23,28]). The trend depicted in the BAU scenario reflects the condition of minimum introduction of RES, therefore representing the lowest trend of decarbonisation. This situation reflects the limiting conditions which are present in the Italian panorama, such as cumbersome and time-consuming authorisation process for new power-plants, inadequate grid characteristics [29], high costs of logistics and critical procurement of base materials which influence the success of the auctions. Last but not least, it must be underlined the increasing local opposition of populations due to the NIMBY syndrome. According to this scenario, the total electricity produced in the Country at 2035 would result to be approximately 301 TWh, 139 TWh of which from renewable sources and 162 TWh from conventional power-plants based on fossil fuels (Table 2). Furthermore, the total electricity consumption would result to be 350 TWh and the annual electricity import from neighbouring Countries would rise up to 53 TWh [24]. In this energy panorama, the curtailment/storage losses would result to be 4 TWh [id.]. Assuming the above seen equation (1), while considering the specific c.i. for each energy source, the final c.i.e value would be almost equal to 249 gCO2/kWh, when taking into account a mean European c.i.e value reduced up to 100 gCO2/kWh because of increased decarbonisation [25]. The Fit for 55@2035, instead, is a binding scenario strongly based on RES whose trend is outlined considering the same CAGR of newly installed RES planned in 2019 to achieve the Fit for 55 package pledges by 2030 (i.e. 7 GW/y), although extended up to 2035 through extrapolation. This scenario leads to an electricity generation of 413 TWh, with 300 TWh of RES, 60 TWh of fossil energy (mainly natural gas) and 53 TWh of imported energy. Because of the inconstancy of RES (mainly based on photovoltaic systems), which cause great difficulty in following the real electric loads and would require large and expensive storage systems, significant energy curtailment and storage losses are expected (around 26 TWh), thus making the total national electric availability decrease to 387 TWh. The resulted trend depicted in this scenario reflects the condition of maximum introduction of RES and therefore represents the highest trend of decarbonisation. In this scenario, still assuming the (1) and considering a mean European c.i.e of 100 gCO2/kWh [27], the c.i.e would be almost equal to 110 gCO2/kWh. In the following Table 2 the current and forecasted electricity mixes and c.i.e. are reported.
However, it has to be pointed out that the c.i.e values reported in Table 2 have to be considered as gross values due to the fact that they are calculated at the power-plants. Therefore, the grid efficiency should also be taken into account in order to consider the real c.i.e of the delivered energy. The latter may be available for production plants and industries (such as a battery production plant) normally at medium voltage (about 20 kV) with an average transmission efficiency of 95%. At the same time, electricity may be available at low voltage (380V) for non-industrial uses (e.g. recharging points) after more transformation stages and consequent losses with a final transmission efficiency of 92%. In the following Table 3 the resulting c.i.e according to the different grid transmission efficiencies are provided with respect to scenarios and final applications.
3.3. The carbon footprint related to the battery production (c.i.b)
In order to calculate the specific c.i. related to the production of the batteries (c.i.b) in Italy, six life-cycle assessment analysis (LCAs) referred to the production of BEVs or batteries (cells or packs) were considered (Table 4). The latter were chosen from literature based on their relevance, their being up-to-date and because they contained implicitly or explicitly values of c.i.b related to defined energy contexts (e.g., nuclear-based or coal-based ones). As the contexts reported are quite different if compared to the current (2021) Italian one (Table 2), each of the values related to the c.i.b were at first singularly highlighted or extrapolated from each LCA (Table 4) along with the CO2 emissions related both to the mining and refining processes (from brine or ore) and to the scrap materials production in the battery factory, when available. As regards the emissions produced during the mining/refining processes and scrap materials production, the Authors allocated them completely to the battery, following the methodology of the cut-off approach according to the Environmental Product Declaration (EPD) system [30]. For this reason, no system expansion was applied to this analysis, as no credits were recognized for material recycling and/or energy recovery from the same recycling.
Afterwards, the aforementioned values of CO2 emissions related only to the production phase of the battery cells (all reports but Volvo, whose study is referred to the whole battery pack) were compared among each other in order to derive a law of dependence of the specific CO2 emissions production of the batteries in respect to the electricity mix available for the production site, as indicated in Table 3. Once determined it, the values of CO2 emissions related to the production of the batteries were scaled on the base of the Italian current (2021) and future (2035) c.i.e (§ 3.1, 3.2) with the aim of obtaining a reliable mean specific value of CO2 emissions related to the production of whole battery packs in Italy. Furthermore, for BAU@2035 and FF55@2035 scenarios, the evolution of the battery in terms of energy density was also considered, assuming an increase in battery capacity (+20%) at constant weight. The Authors did not considered solid-state cells, whose industrial applicability is not yet clearly defined. Therefore, a value of 74 kgCO2/kWh was obtained for 2021 energy scenario, while 50 kgCO2/kWh and 23 kgCO2/kWh were determined for BAU and FF55@2035 ones, respectively (Table 5). Instead, the CO2 emissions related to the mining and refining processes were scaled only by 10%, these resulting to be 45 kgCO2/kWh in 2021 and 40 kgCO2/kWh in both 2035 scenarios (Table 5). In fact, these processes generally take place in non-EU Countries where carbon-free electricity will not be widely available even in the near future. Instead, the contribution of scrap materials during production of batteries in terms of CO2 emissions is supposed to follow the c.i.e reduction trends by 2035. In fact, the related specific CO2 emissions resulted to be 15 kgCO2/kWh in 2021, while it is supposed to become around 14 kgCO2/kWh in BAU@2035 scenario and 10 kgCO2/kWh in FF55@2035 scenario (Table 5). Moreover, 20 kgCO2/kWh were added to the obtained c.i.b values in order to determine the CO2 content related to the construction of the whole battery-pack, thus taking into account the significant contribution of the assembly process due to the presence of hundreds of welded connections, frame structures, containing case, etc. [16]. As the previous ones, CO2 emissions related to the battery-pack assembly process is expected to see a decrease through time, from 20 to 18 or 14 kgCO2/kWh, according to BAU@2035 scenario or FF55@2035 scenario, respectively (Table 5).
3.4. The c.i. of the vehicles’ use-phase
As well known, the use-phase CO2 emissions of any vehicle are determined by two factors: 1) the fuel/electricity consumption of the vehicle; 2) the c.i. of the fuel/electricity used to feed the vehicle. In order to determine the first one, the Authors did not consider simulation models which calculate the vehicle fuel/electricity consumption according to different vehicle’s characteristics and operation points, nor WLTP homologation procedures, the implementation of which always provides values of the vehicle’s fuel requirement that are quite far from the real ones (-15% on average). Indeed, in order to determine real fuel/electricity consumption of vehicles, in this Paper only significant statistical records relating to fuel needs were taken into account [31], these eventually compared to other consumption data delivered by independent institutions which carried out road tests [32]. On the other side, in order to determine the c.i. of the fuel/electricity used to feed the vehicle, a “well-to-wheel” (WTW) approach was adopted, both for HEVs and BEVs. Therefore, the CO2 emissions produced during both the “well-to-tank”(WTT) phase, which includes also the refinery and transportation contributions, and the “tank-to-wheel”(TTW) phase, also called “battery-to-wheel”(BTW) phase for BEVs, were taken into account. In particular, for HEVs fed with gasoline, the values reported in the following two references were considered:
After having analysed these data, a mean value of 470 gCO2/dm3 for the WTT phase was determined along with a mean value of 2330 gCO2/dm3 for the TTW phase. Therefore, a resulting total value of 2800 gCO2/dm3 for the WTW phase was obtained, which was later used in the computation of the real total CO2 emissions related to the vehicle fuel consumption. Instead, as regards the determination of the c.i. of the electricity used to feed BEVs in the road phase, the values reported in Table 3 regarding the c.i.e at low voltage in the three scenarios were considered as references, to be afterwards divided for the efficiency of the whole charging phase. In fact, in order to determine a c.i. of the electricity used to feed BEVs as closer to real conditions as possible, several losses should be considered, starting from charging system, whose mean efficiency during charging can be sensibly lower than nominal value, passing through cables, connections up to the battery itself. In particular, global charging phase can be characterized by different efficiencies, ranging from 83%, in case of an AC single phase home apparatus, up to 87%, which is typical of an AC three phases road charging tower (up to 22 kW of power)[32,35,36]. As regards DC systems, which can reach up to 300 kW of power and are normally adopted for fast charging on highways, they are characterised by a higher charging efficiency (around 91%) [37], if compared to AC systems. However, they were not considered in this analysis because of their much lower diffusion due to high costs. In conclusion, a mean efficiency value of about 85%, fully confirmed by [32], was chosen for the existing (2022) AC charging systems, while for the future (2035) ones a significant improvement was considered by the Authors, fixing the global mean charging efficiency at 88%. It must be underlined that charging phase represents the most inefficient stage of the whole energy transmission process (from energy production sites up to car battery) and, therefore, that the energy effectively stored in the battery can be significantly lower than the energy provided by the grid. For this reason, in order to determine the effective BEVs efficiency in terms of CO2 emissions, the global mean AC charging efficiency value according to the different scenarios should be adopted. The latter values are reported in the following Table 6 along with the c.i.e at low voltage and the resulting c.i. charging (c.i.c.) values for BEVs. It has to be pointed out that the c.i. of the electricity used to feed BEVs could be considered as equivalent to the WTT c.i. previously reported for gasoline; alternatively, it could be called as Plant-to-Battery efficiency (PTB).
As stated before, the fuel/electricity consumptions of the vehicles taken into account in the present investigation were gained from statistical records from customers and some real world consumption tests performed by independent organizations [31,32]. Afterwards, all obtained data were compared, thus determining a mean fuel consumption expressed in terms of dm3/km for gasoline, in case of M-HEV and F-HEV vehicles, or in terms of kWh/km for electricity, in case of BEVs (Table 7). These values were, then, multiplied respectively for the fuel c.i. and the c.i.c. above calculated in order to determine the specific CO2/km emissions. Moreover, the three total values of specific CO2 emissions reported in Table 5 (e) were multiplied for the battery capacity of each vehicle, thus determining the starting CO2 emissions for each model, to be summed up to the road ones. It must be underlined that the very low battery capacity in HEVs (both Mild and Full) leads to quite negligible emissions, if compared to BEVs.
Afterwards, a graphical comparison (in terms of CO2 emissions versus mileage) was made between the three powertrains when these are applied to the four vehicle segments according to the current (2021) scenario (Figure 1). The two crosses between green line and blue line or red line, respectively, represent the break-even point of BEV in respect to M-HEV and F-HEV.
By analysing Figure 1, it can be seen that the parity between BEVs and HEVs is obtained in most cases after significant mileages, especially when F-HEVs are considered, mostly due to their higher global efficiency. It must be observed that only in one case a M-HEV (i.e. Mazda 2 provided with Skyactive-G engine family) showed similar CO2 emissions in respect to a F-HEV, mostly because of the very high efficiency of its I.C. engine even at partial loads [38]. Also, it is clear the significant role played by battery capacity, as it increases considerably both the vehicle starting carbon debit and the energy consumption related to a greater moving mass (increasing green line slope). At last, in order to outline forecasts for 2035, the above mentioned vehicles were again considered, although with upgraded performances in terms of global efficiency. In fact, it was considered a reduction in fuel consumption of about 5% and 10% for M-HEVs and F-HEVs respectively, because of the higher potential expressed by the second ones in reducing inefficient partial load operations due to the higher electric/thermal ratio. At the same time, only a 5% improvement in efficiency was considered for BEVs, due to the already very high level achieved by each single component which will be very difficult to improve further. Instead, as regards battery, a 20% higher specific energy density was taken into account along with a lower specific c.i.b in BAU@2035 and FF55@2035 scenarios, as reported in Table 5. In the following Figure 2 and Figure 3, graphical comparisons (in terms of CO2 emissions versus mileage) of the three powertrains when these are applied to the four vehicle segments according to the BAU@2035 and the FF55@2035 scenarios are shown. Even in these cases, crosses between lines represent the break-even points in terms of CO2 emissions between BEVs and HEVs.
By analysing Figure 2 and Figure 3, it can be easily seen that the convenience in adopting BEVs is disruptive only in case of FF55@2035 scenario and if the whole life of the vehicle is considered. On the contrary, the break-even points are significantly higher for most of the vehicles in BAU@2035 scenario, this leading to a lower advantage for BEVs in terms of avoided CO2 emissions when HEVs are considered. In the following Table 8, the additional CO2 emissions for M-HEVs and F-HEVs in respect to BEVs are reported in terms of percentage for each of the four vehicle segments and for the three scenarios considered. It has to be highlighted that the values reported are related both to the full lifespan of a vehicle (160,000 km) and to the mean statistical lifespan (120,000 km [17]). This last aspect makes the advantage of BEVs over HEVs just theoretical, as the real increase in CO2 emissions should be calculated in respect to the mean real life of each vehicle, this resulting lower than the expected one.
4. Discussion
As can be easily seen from Figure 1, the 2021 Italian electricity mix is not currently able to bring any significant advantage to BEVs in reducing total CO2 emissions when the latter are compared to HEVs fed with conventional fossil fuels. In fact, the necessary mileage for reaching the break-even point, therefore the carbon emission parity, is significant and the advantages in terms of avoided emissions over the mean statistical lifespan @120.000 km can result negative in some cases, while giving limited savings in case of full lifespan @160.000 km. This issue is evident for most of the vehicle segments and especially when comparing BEVs to F-HEVs, the latter characterised by a higher efficiency powertrain in comparison to M-HEVs. On the contrary, Segment-A BEVs can offer an important advantage due to the small battery pack, whose presence determines a lesser carbon debit and a better running efficiency. Regards the 2035 objectives imposed by the Fit for 55 package within the Green Deal, the convenience of phasing out new ICE-based vehicles will depend on the actual (real) introduction of grid-connected RES. In fact, in case of BAU@2035 scenario, BEVs would gain a major benefit in reducing CO2 emissions in comparison to HEVs, while, in case of FF55@2035 scenario, BEVs would achieve an impressive advantage over HEVs. However, the latter would be very far to be reached in Italy because of the current very slow RES introduction rate to the grid. Also, political uncertainty, e.g. linked to the Russia-Ukraine conflict, could play a troublesome action on future scenarios, as confirmed by the negative trends of c.i.e. reduction recorded during the last period (2022) in Italy and all over Europe. For this reason, it is expected that a feasible c.i.e. value at 2035 could fall between the two values reported in BAU@2035 and FF55@2035 scenarios, resulting in higher-than-expected specific CO2 emissions from cars and in limited global savings of total carbon emissions. Indeed, this perspective would represent a profound different situation from what EU has planned by phasing out new ICE-based vehicles by 2035. The performed analysis has also underlined that in the future Italy will hardly give up using natural gas power-plants because of its dependence from photovoltaic energy, which is characterized by a very strong seasonal fluctuation in power production. In fact, energy compensation can hardly be resolved by means of storage systems based on hydrogen or battery systems, which would result, at least at the moment, enormous in terms of capacity and highly expensive. For these reasons, it is improbable that the Italian energy setup will soon reach a very low-carbon intensity value in electricity production like other Countries can provide, for instance, with nuclear power-plants and more stable RES (based on wind turbines and hydroelectric power-plants).
The Paper has also shown other aspects which make more difficult to gain significant advantages for BEVs over HEVs in terms of CO2 emissions. The main issue still remains the high specific c.i. related to battery production, which results quite higher than that one assessed in other Papers. To explain this underestimation, the Authors have highlighted the following reasons: 1) Mining and refining of base materials are often not taken into account; 2) CO2 emissions related to batteries are referred to a single cell and not to the battery pack, thus excluding the emissive content related to the assembly phase; 3) Emissions related to scrap materials are not allocated to the battery itself; 4) The considered c.i.e for the production of batteries is often theoretical, being this referred to an average value proper of a very large region and not the local one available in the production site or, in contrast, distinctive of a specific Country characterized by a very low c.i.e. On the contrary, strictly applying recognized LCA guidelines [30] and considering only the effective c.i.e of the manufacturing Country (Italy, in this case) leads to higher specific carbon emissions than average for the whole production process. At last, it must be underlined that carbon footprint could be further reduced in the future through the adoption of electricity with lower c.i. for cells manufacturing and assembly, but emissive content from mining and refining processes will not easily decrease, as these processes take generally place in developing countries where low carbon energy will not be available even in the near future. All these aspects together will keep the total carbon footprint value for battery production significant, above all in Countries, like Italy, which will not reach easily very low c.i. values for electricity production. Furthermore, other important issues regarding the effectiveness of ICE-based vehicles phase-out are set out below. The first one regards the effectiveness of the transmission of electricity from power-plant to battery; in particular, the battery charging phase. In fact, the latter usually provides to be the most critical one, as it contributes to reduce BEVs’ global energy efficiency. Instead, the second issue regards the size of the battery pack and the consequences it could determine on road efficiency and relative CO2 emissions. In fact, BEVs provided with larger battery pack lead to higher CO2 emissions during battery production phase and to a lower global efficiency due to a higher vehicle mass. Instead, Segment-A (city cars) BEV vehicles show better performances in comparison to HEVs because of the smaller battery pack and the consequent lower mass, although this involving a minor running range. It must be underlined that, even with cars provided with large battery systems, the actual mileage may be much lower than the one achievable by HEVs; this aspect is still considered as crucial by customers, making the trend towards bigger batteries quite unavoidable. On the other side, the analysis has shown that current (2023) HEVs, provided with high efficiency right-sized combustion engine, could introduce a significant evolution in terms of fuel consumption and CO2 emissions production, as they were expressly designed to match with electric powertrains, thus achieving better global efficiency if compared to past models. Moreover, the same powertrains could be considered a base for rechargeable hybrid vehicles (PHEVs) or BEVs provided with a range extender based on an internal combustion engine. Both solutions could fully take advantage from the availability of liquid fuels (very short fuelling time), therefore by-passing collateral issues like lack of charging infrastructures and range anxiety, while implementing the environmental benefits of BEVs. This solution could be even more viable in case low-carbon fuels (LCF) were available, this giving an impressive attractiveness in the reduction of CO2 emissions to HEVs and PHEVs. In fact, these fuels could even be produced in a sustainable and affordable way thanks to the availability of a low cost electricity instead of performing RES curtailment (quite probable in case of FF55@2035 scenario). This could lead to an availability of a low-c.i. energy source for automotive making PHEVs and HEVs competitive again with BEVs in many situations.
5. Conclusion
This Paper demonstrates that, if taking into account the current Italian energy situation, to produce and employ BEVs (except for city cars) in Italy is not to be considered a viable solution to significantly reduce CO2 emissions because of the actual c.i. value of the available electricity. The same assumption can be done for all the other European Countries whose c.i.e. value exceeds the Italian one, while it represents an absolute revolution in terms of efficiency and CO2 reduction for Countries already characterised by a very low c.i.e. value. As regards the energy panorama at 2035, the effectiveness of BEVs will depend on the actual (real) introduction of RES, which constitutes the only solution to dramatically reduce the c.i.e. value. In case of BAU@2035 scenario, the effectiveness in terms of avoided CO2 emissions will be noticeable, while in case the objectives of FF55@2035 were reached, BEVs will result clearly winning over HEVs. Nevertheless, this last option appears very difficult to be achieved in Italy because of the cumbersome and time-consuming authorisation process for new renewable power-plants, the issues related to the structure of the grid and the lack of storage systems. Therefore, an intermediate situation between those outlined in BAU@2035 and FF55@2035 scenarios is expected, which will involve important but not disruptive results as those expected, as starting point, by the EU for the phase-out of new ICE-based vehicles by 2035 (Fit for 55 package). Furthermore, the previously mentioned limited effectiveness in CO2 reduction along with the problems related to the industrial feasibility of BEVs, which in turns depends on the availability of critical materials in battery production, power control and motors/generators, etc., would make the industrial transformation to electric vehicles very challenging for Italy. In fact, in these conditions it could be quite impossible to create a production context capable of being competitive on the global market with other Countries, characterized by lower c.i.e and cost of energy (i.e., with a nuclear base production and wind/hydro renewables). Also, the resulting uncertainty could even have a negative impact on the Country, reducing its potential and the related economic benefits. This panorama could make unworthy the huge economical efforts necessary to prepare adequate infrastructures for vehicles recharging without yielding substantial results in terms of CO2 emissions reduction. Since this revolution is profoundly affecting the Italian automotive industry, policymakers should carefully move towards a too rapid electrification roadmap, which could definitively damage the significance of the car industry, which represents one of the most important Italian economic pillar. For all the above mentioned reasons, the Authors suggest to postpone the phase-out of thermal engines until the achievement of a real reduction in CO2 electricity emissions, making battery production and end-use phase not critical for customers from both economic and environmental points of view. The latter concept finds confirmation in the insignificant selling percentages of BEVs in Italy until middle 2023, therefore, in the still negligible percentage of BEVs within the circulating park and in their consequent impact on total CO2 emissions. Furthermore, the above seen uncertainties regarding BEVs, together with the potential expressed by modern HEVs, let suggest the adoption of a new generation PHEVs or BEVs provided with I.C. range extenders, thus keeping the door open for different ICE powertrain technologies and development programs. These solutions could be even more viable in case LCF were available, giving an impressive attractiveness in the reduction of CO2 emissions.
Acknowledgments
we warmly thank Antonio Di Meo for the precious help.
Conflicts of Interest
The authors declare no conflict of interest.
References
- Abdul-Manan A.F.N., Zavaleta V.G., Agarwal A.K., Kalghatgi G., Amer. A.A. Electrifying passenger road transport in India requires near-term electricity grid decarbonisation. Nat Commun 13, 2022, 2095. [CrossRef]
- Eurostat. (2023) Shedding light on energy – 2023 edition. Luxembourg: Eurostat. Available online: (https://ec.europa.eu/eurostat/web/interactive-publications/energy-2023 (accessed: 27 October 2023) .
- McBain, S. and Teter J. (2021) Tracking transport, 2021. Paris: IEA. Available online: https://www.iea.org/reports/tracking-transport-2021 (accessed on 13 September 2023).
- International Energy Agency (IEA). Data Browser. Available online: https://www.iea.org/countries/italy(accessed: 15 November 2023).
- International Energy Agency (IEA). (2020) Clean Energy Innovation. Paris: IEA. Available online: https://www.iea.org/reports/clean-energy-innovation (accessed on 15 October 2023).
- The European Automobile Manufacturers’ Association (ACEA). (2023) Vehicles in use, Europe. Brussels: ACEA. Available online: https://www.acea.auto/publication/report-vehicles-in-use-europe-2023/ (accessed on 04 October 2023).
- Woody M., Vaishan P., Keoleian G.A., De Kleine R., Kim H.C., Anderson J.E., Wallington T.J. The role of pickup truck electrification in the decarbonisation of light-duty vehicles. Environ. Res.Lett., 17(3), 2022, 034031. [CrossRef]
- The European Automobile Manufacturers’ Association (ACEA). (2021) Fuel types of new cars: battery electric 9.1%, hybrid 19.6% and petrol 40.0% market share full-year 2021. Brussels: ACEA. Available online: https://www.acea.auto/files/20220202_PRPC-fuel_Q4-2021_FINAL.pdf (accessed on 13 September 2023).
- Xia X. and Li P. A review of the Life-cycle Assessment of electric vehicles: Considering the influence of batteries. Science of total environment 814, 2022, 152870. [CrossRef]
- Cox B., Bauer C., Beltran A. M., van Vuuren D.P, Mutel C.L. Life cycle environmental and cost comparison of current and future passenger cars under different energy scenarios. Applied Energy, 269, 2020, 115021. [CrossRef]
- Evrard E., Davis J., Hagdahl K.-H, Palm R., Lindholm J., Dahllöf L. (2021) Carbon footprint report – Volvo C40 Recharge. Goteborg: Volvo. Available online: https://www.volvocars.com/us/news/sustainability/Wanted-clean-energy-for-full-climate-benefits/ (accessed on 15 August 2023).
- Helmers, E. , Johannes D., Weiss M. Sensitivity Analysis in the Life-Cycle Assessment of Electric vs. Combustion Engine Cars under Approximate Real-World Conditions. Sustainability, 12, 2020, 1241. [CrossRef]
- Emilsson E., Dahllof. L. (2019) Lithium-ion Vehicle Battery Production, Status 2019 on Energy use, CO2 emissions, use of metals, Products Environmental Footprint, and Recycling. Stockholm: IVL. Available online: https://www.ivl.se/download/18.14d7b12e16e3c5c36271070/1574923989017/C444.pdf (accessed on 8 September 2023).
- European Council (EU). Fit for 55. Available online: https://www.consilium.europa.eu/en/policies/green-deal/fit-for-55-the-eu-plan-for-a-green-transition/(accessed 1May 2023).
- European Parliament, Council of the European Union. REGULATION (EU) 2023/1542 of the European Parliament and of the council of 12 July 2023 concerning batteries and waste batteries, amending Directive 2008/98/EC and Regulation (EU) 2019/1020 and repealing Directive 2006/66/EC. Official Journal of the European Union, 2023, 66. Available online: http://data.europa.eu/eli/reg/2023/1542/oj.
- Northvolt. (2023) Sustainability and annual report, 2022. Stockholm: Northvolt. Available online: https://northvolt.com/environment/report2022/(Accessed: 01 November 2023).
- UNRAE per Quattroruote. (2022) L’automobile: Italiani a Confronto. Roma: UNRAE. Available online: https://unrae.it/files/Studio%20UNRAE%20L_automobile%20Italiani%20a%20confronto_6336ab4170253.pdf(Accessed: 15 October 2023).
- Islam, E. , Vijayagopal R., Moawad A., Kim N., Dupont B., Prada D.N., Rousseau A. A detailed vehicle modeling & simulation study quantifying energy consumption and cost reduction of advanced vehicle technology through 2050. United States. [CrossRef]
- Capaldi P. and Grimaldi F.M. The effectiveness of ICEV phase-out at 2035 in terms of CO2 emission reduction in the Italian scenario. In Proceedings of the 6th International Conference on Energy Harvesting, Storage, and Transfer (EHST’22). Niagara Falls, Canada – June 08-10, 2022. Available online: https://avestia.com/EHST2022_Proceedings/files/paper/EHST_146.pdf.
- Life Cycle Greenhouse Gas Emissions from Electricity Generation: Update. Available online: https://www.nrel.gov/docs/fy21osti/80580.pdf(Accessed: 10 October 2023).
- Ministero della Transizione Ecologica – Dip.Energia – Direzione generale infrastrutture e sicurezza. La situazione energetica nazionale nel 2021. Italy. Available online: https://dgsaie.mise.gov.it/pub/sen/relazioni/relazione_annuale_situazione_energya_nazionale_dati_2021.pdf.
- Federazione ANIE. Sala Stampa – Comunicati stampa. Osservatorio FER. Available online: https://anie.it/sala-stampa/comunicati-stampa/(10 October 2023).
- International Energy Agency (IEA). (2023) Italy 2023 – Energy Policy Review. Paris: IEA. Available online: https://www.iea.org/reports/italy-2023(Accessed 27 October 2023).
- Terna – Snam. (2022) Documento di descrizione degli scenari 2022. Roma: Terna/Snam. Available online: https://www.terna.it/it/sistema-elettrico/rete/piano-sviluppo-rete/scenari (accessed on 10 October 2023).
- EMBER. European Union – The EU accelerates electricity transition in the wake of crisis. Explore open data (Emissions intensity). Available online: https://ember-climate.org/countries-and-regions/regions/european-union/(Accessed 02 October 2023).
- Terna. (2021) Evoluzione Rinnovabile 2021. Roma: Terna. Available online: https://download.terna.it/terna/Evoluzione_Rinnovabile_8d940b10dc3be39.pdf (accessed on 27 October 2023).
- Teske, S.; , Morris T., Nagrath K. (2020) 100% Renewable Energy: An Energy [R] evolution for ITALY. Report prepared by ISF for Greenpeace Italy. Available online: https://www.uts.edu.au/sites/default/files/article/downloads/100-Percent-Renewable-Energy-Italy-report.pdf(accessed 1May 2023).
- Federazione ANIE. Sala Stampa – Comunicati stampa. Osservatorio FER. Available online: https://anie.it/sala-stampa/comunicati-stampa/(15 October 2023).
- International Energy Agency (IEA). (2023) Electricity Grids and Secure Energy Transition. Paris: IEA. Available online: https://www.iea.org/reports/electricity-grids-and-secure-energy-transitions (accessed on 21 October 2023).
- The international EPD system. Documentation overview for EPD and PCR. Available online: https://environdec.com/resources/documentation#generalprogrammeinstructions (accessed on 1 November 2023).
- Spritmonitor.de. MPG and Cost Calculator and Tracker. Available online: https://www.spritmonitor.de/en/ (accessed on 21 October 2023).
- ADAC, Elektroautos im Test: So hoch ist die Reichweite wirklich. Available online: https://www.adac.de/rund-ums-fahrzeug/elektromobilitaet/tests/stromverbrauch-elektroautos-adac-test/.
- Edwards, R.; , Larivé J.-F., Rickeard D., Weindorf W. (2014) JEC, Well-to-Wheels analysis, Well-to-wheels analysis of future automotive fuels and powertrains in the European context”, Concawe-EUCAR-JRC. Bruxelles: JRC. Available online: https://publications.jrc.ec.europa.eu/repository/bitstream/JRC85326/wtt_report_v4a_april2014_pubsy.pdf (accessed on 10 September 2023).
- Argonne National Laboratory. Energy Systems and Infrastructure Analysis, GREET Model – The Greenhouse gases, Regulated Emissions, and Energy use in Technologies Model. Available online: https://greet.es.anl.gov/(Accessed: 01 October 2023).
- Reick B., Konzept A., Kaufmann A., Stetter R., Engelmann, D. Influence of charging losses on energy consumption and CO2 emissions of battery-electric vehicles. Vehicles, 3(4), 2021, 736-748. [CrossRef]
- Genovese, A. , Ortenzi F., & Villante, C. On the energy efficiency of quick DC vehicle battery charging. World Electric Vehicle Journal, 7(4), 2015, 570-576. [CrossRef]
Figure 1.
the comparison (in terms of CO2 emissions versus mileage) between the three powertrains when applied to the four vehicle segments according to the current scenario (2021).
Figure 1.
the comparison (in terms of CO2 emissions versus mileage) between the three powertrains when applied to the four vehicle segments according to the current scenario (2021).
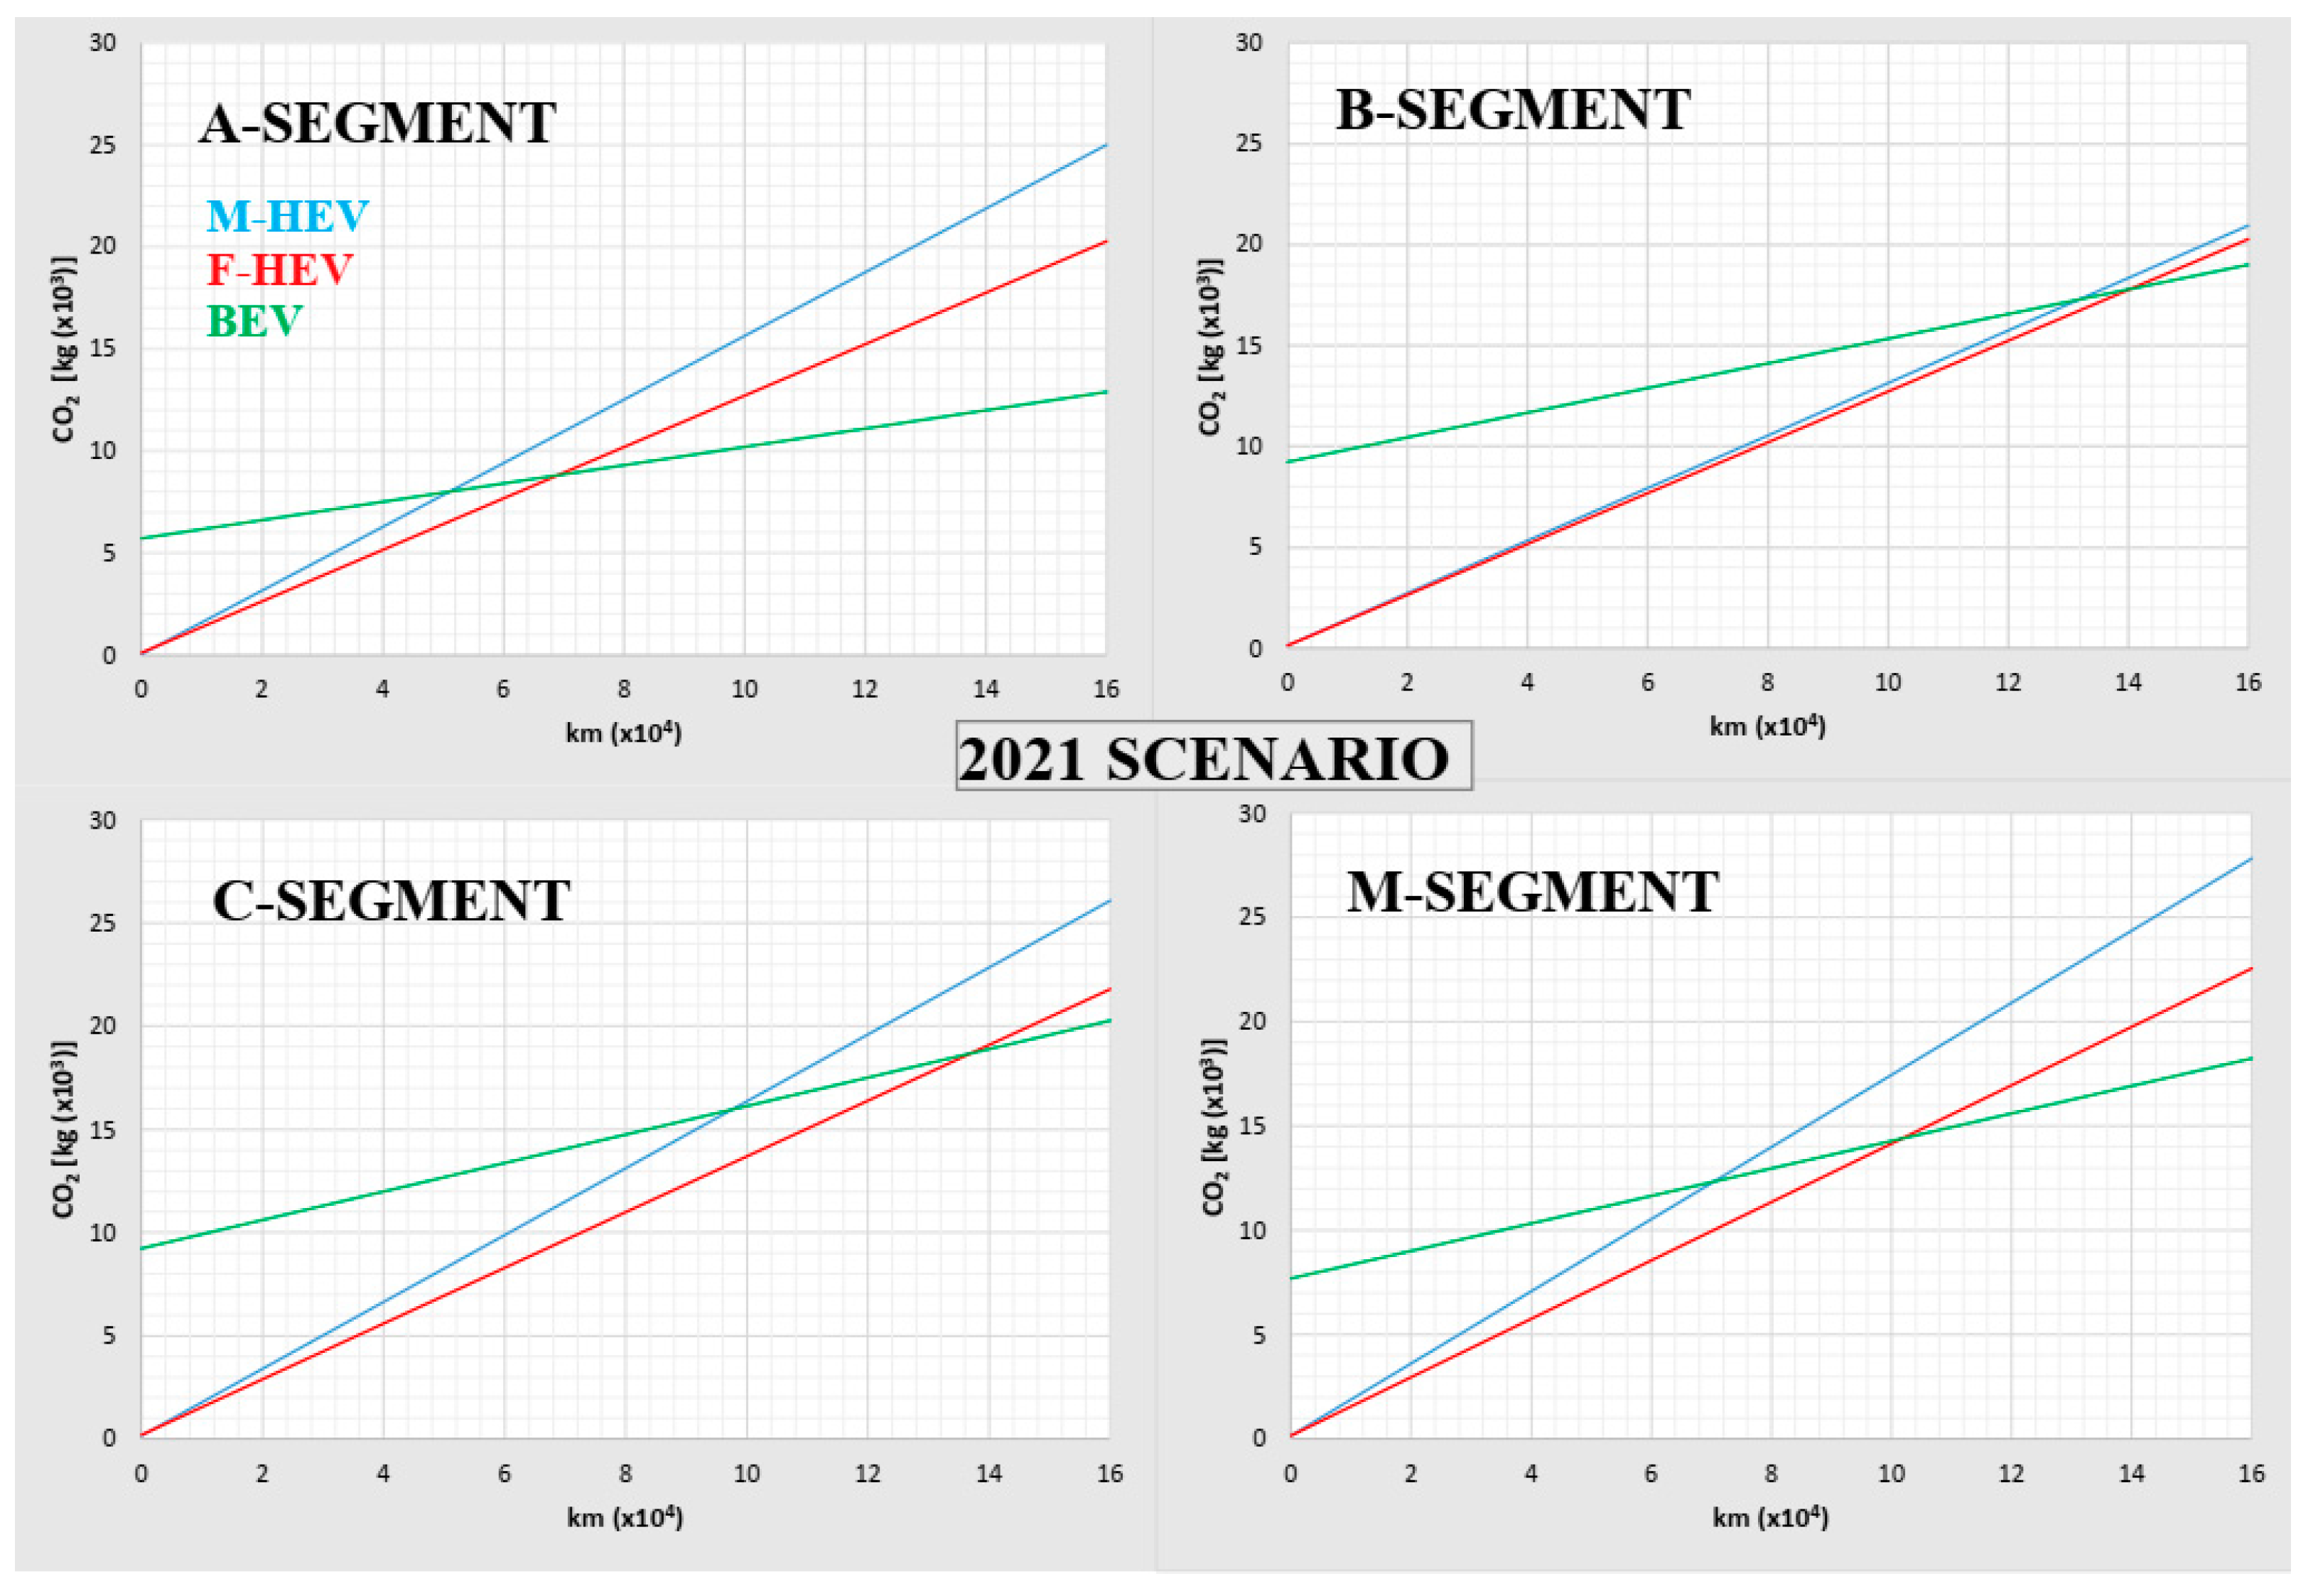
Figure 2.
the comparison (in terms of CO2 emissions versus mileage) between the three powertrains when applied to the four vehicle segments according to the BAU scenario.
Figure 2.
the comparison (in terms of CO2 emissions versus mileage) between the three powertrains when applied to the four vehicle segments according to the BAU scenario.
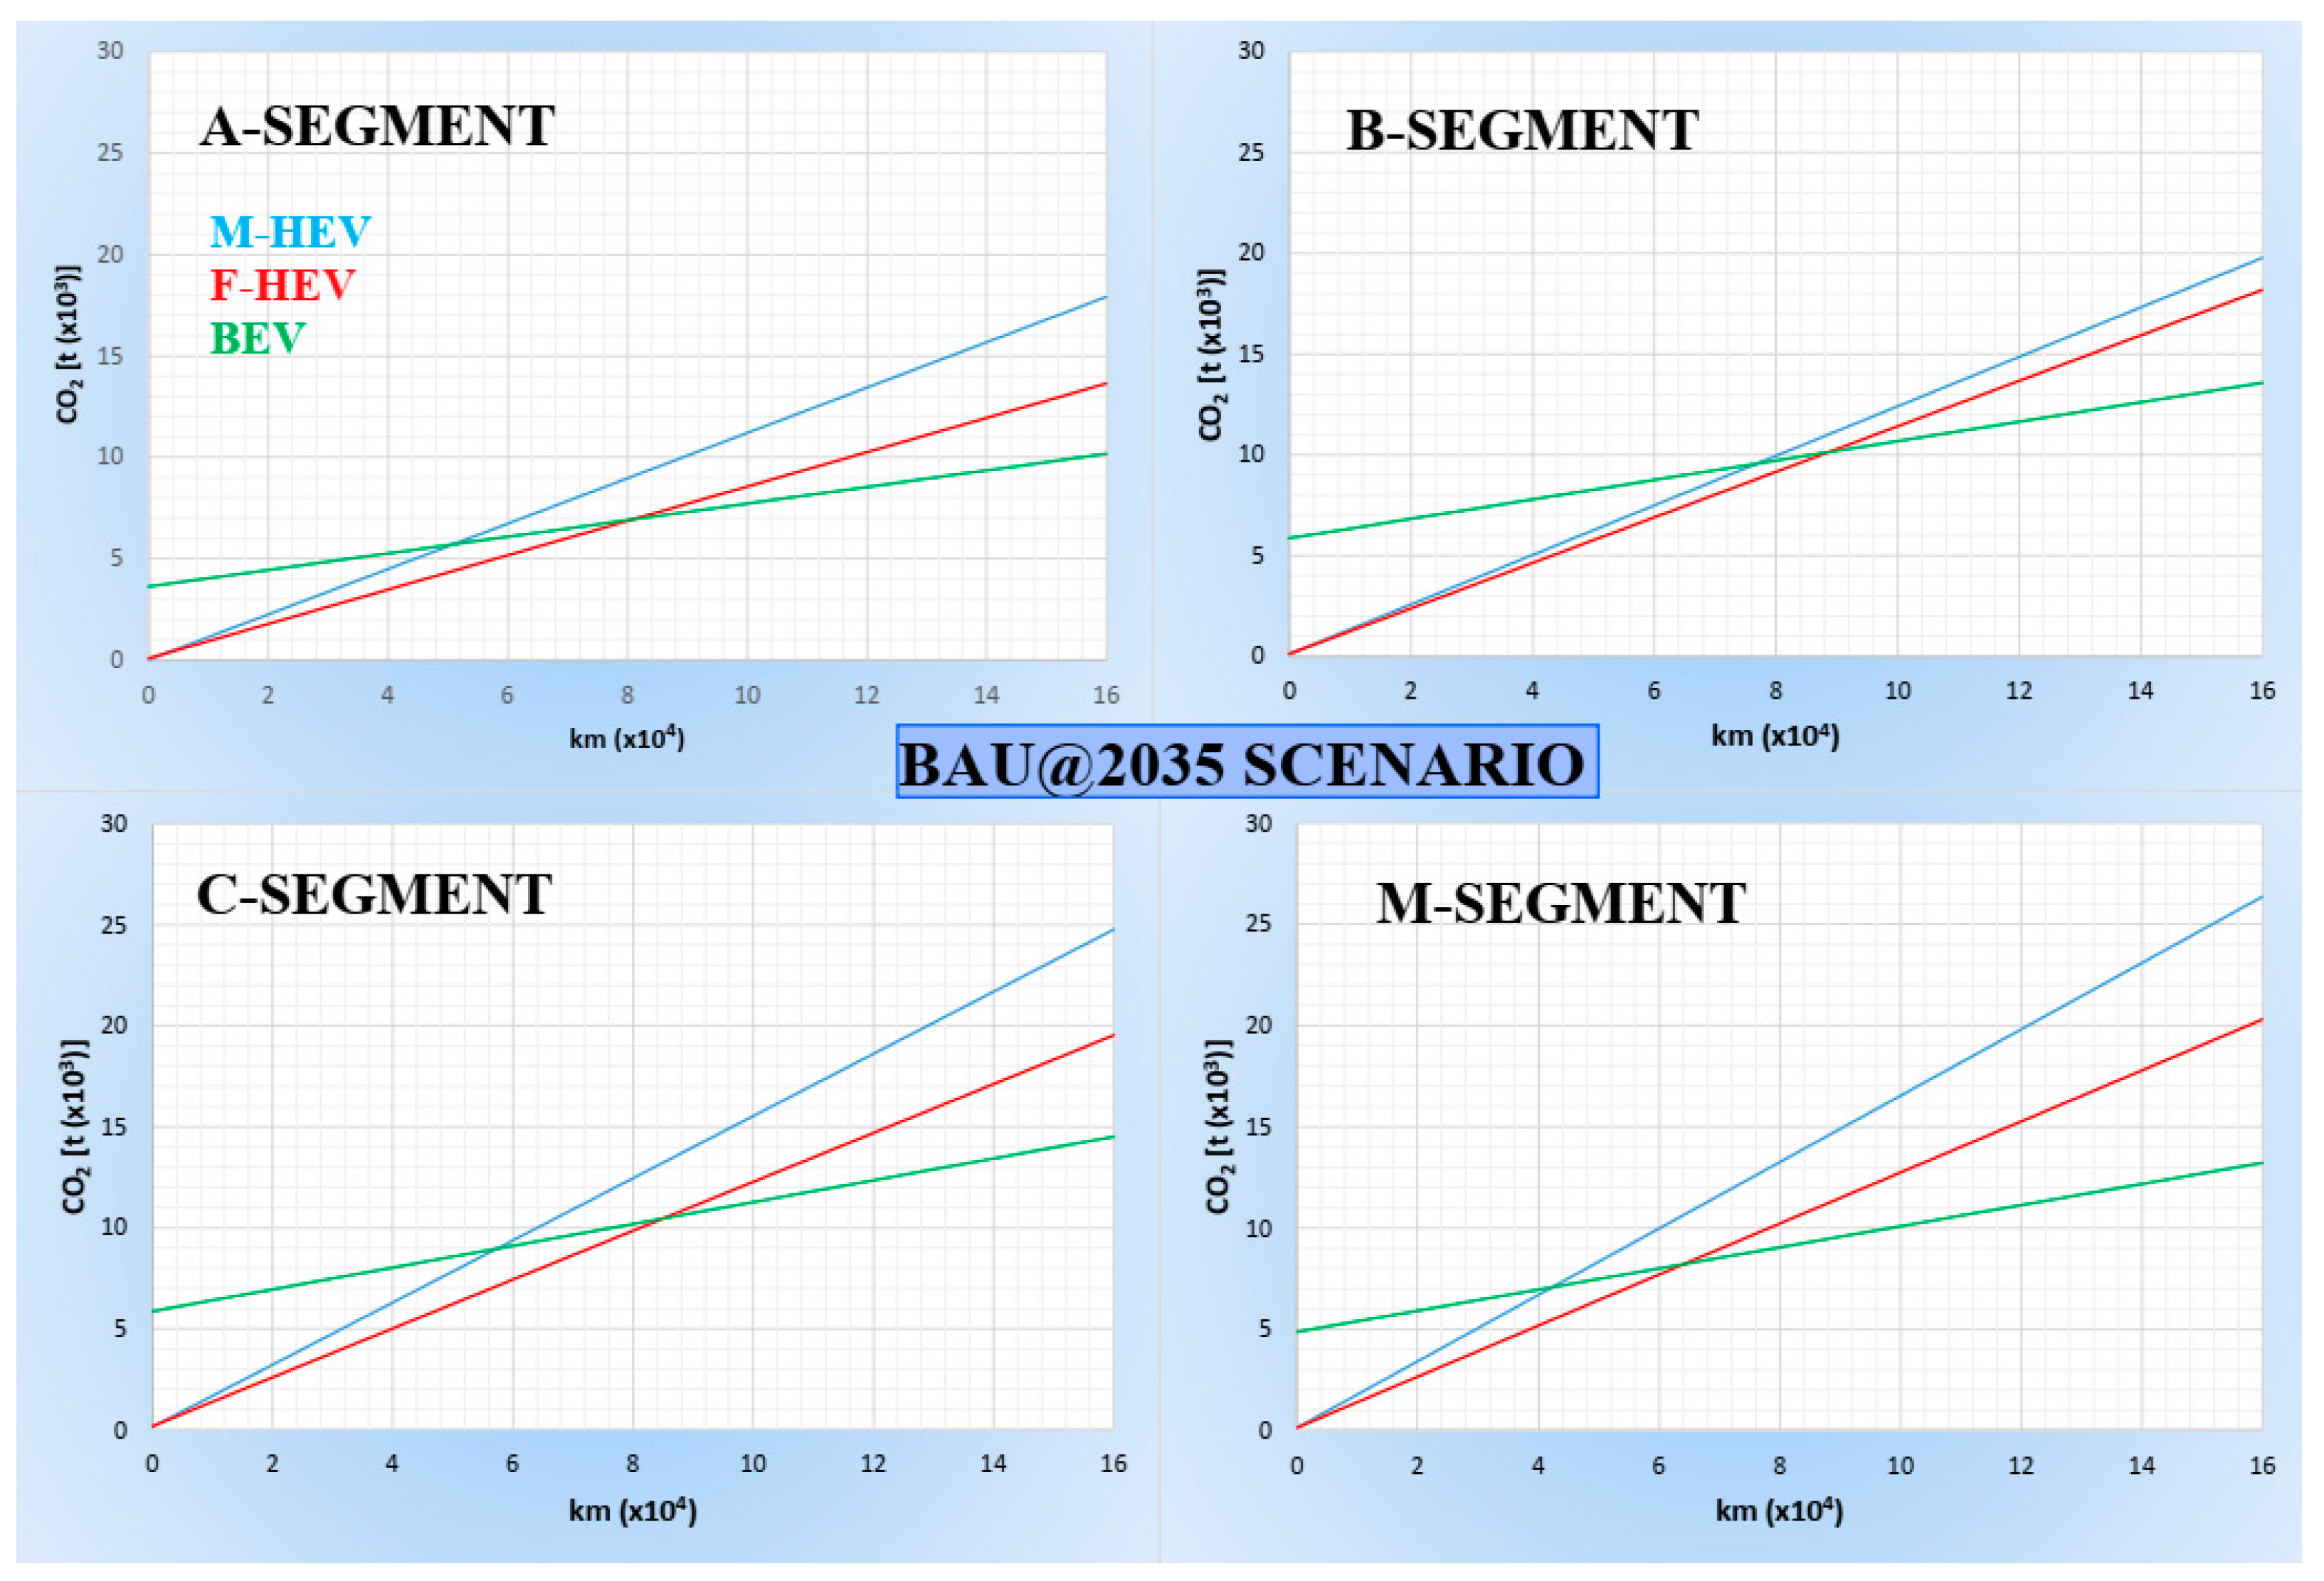
Figure 3.
the comparison (in terms of CO2 emissions versus mileage) between the three powertrains when applied to the four vehicle segments according to the FF55@2035 scenario.
Figure 3.
the comparison (in terms of CO2 emissions versus mileage) between the three powertrains when applied to the four vehicle segments according to the FF55@2035 scenario.
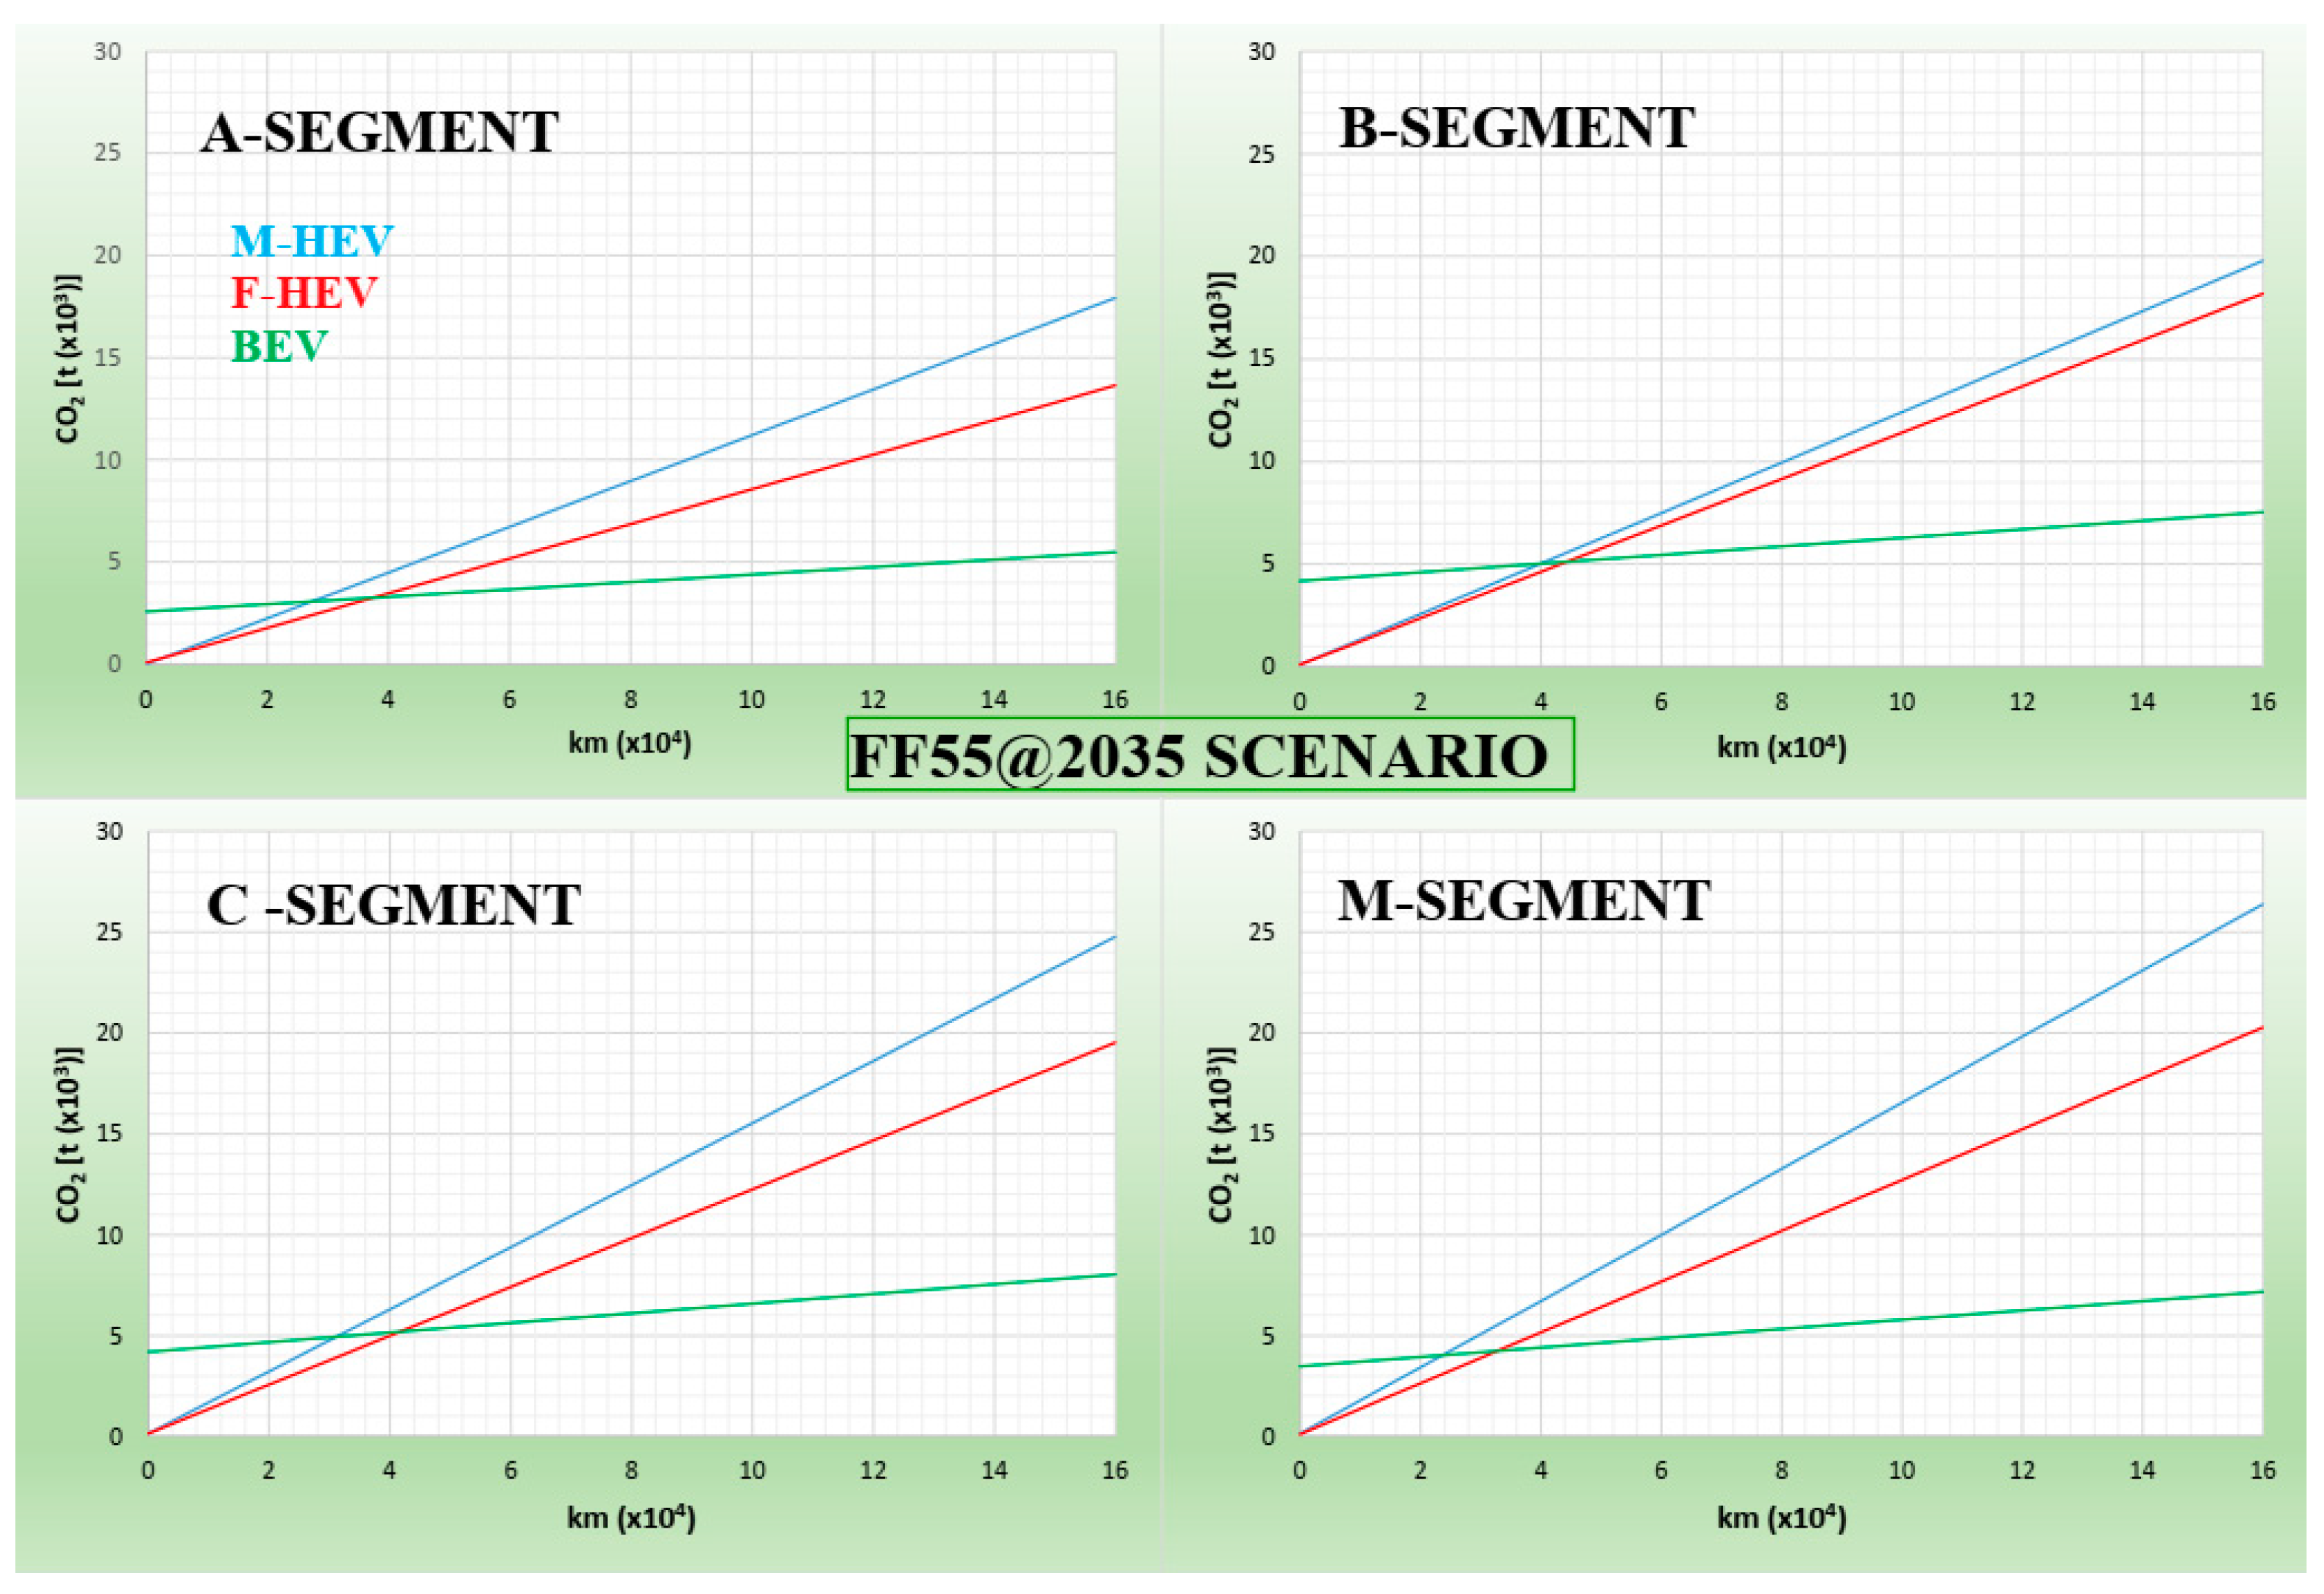

Table 1.
The chosen vehicles according to the segment and powertrain.
| Car segment | Powertrain | ||||
|---|---|---|---|---|---|
| Mild HEV |
Full HEV |
BEV | |||
| A | Suzuki Ignis | Honda Jazz | VW UP | ||
| B | Mazda 2 | Toyota Yaris | Nissan Leaf | ||
| C | Ford Kuga | Hyundai Ioniq | Tesla Mod.3 | ||
| M | Suzuki Vitara | VW Tiguan | Opel Mokka | ||
Table 2.
The Italian electricity mixes (TWh) and their relative c.i.e (gCO2/kWh) according to current, BAU@2035 and Fit for 55@2035 scenarios. The c.i.e reported for current (2021) and future (2035) scenarios have to be considered as gross values.
Table 2.
The Italian electricity mixes (TWh) and their relative c.i.e (gCO2/kWh) according to current, BAU@2035 and Fit for 55@2035 scenarios. The c.i.e reported for current (2021) and future (2035) scenarios have to be considered as gross values.
| NG | OTHER NON- RES |
HYDRO | PV | WIND | OTHER RES | CURTAILMENT/ LOSSES |
Net I/E | c.i.e | |
|---|---|---|---|---|---|---|---|---|---|
| 2021 | 140 | 22 | 47 | 25 | 21 | 23 | -1 | 43 | 293 |
| 2035 BAU | 155 | 7 | 51 | 35 | 30 | 23 | -4 | 53 | 249 |
| 2035 FF55 | 57 | 3 | 51 | 136 | 90 | 23 | -26 | 53 | 110 |
Table 3.
Specific carbon intensities (c.i.e) related to the energy scenarios and delivery points (kgCO2/kWh).
Table 3.
Specific carbon intensities (c.i.e) related to the energy scenarios and delivery points (kgCO2/kWh).
| Energy scenario | Electric C.I. (p.p.)1 |
Electric C.I. (m.v.)2 |
Electric C.I. (l.v.)3 |
|---|---|---|---|
| 2021 | 0.293 | 0.308 | 0.318 |
| 2035 BAU | 0.249 | 0.262 | 0.270 |
| 2035 FF55 | 0.110 | 0.116 | 0.120 |
1 p.p. = electricity at power-plant; 1 m.v. = medium voltage; electricity for production plants and industries (battery production plants) at medium voltage (20 kV) with 95% grid transmission efficiency; 1 l.v. = low voltage; electricity for non-industrial uses (e.g. recharging points) at low voltage (380 V) with 92% grid transmission efficiency.
Table 4.
CO2 emissions (kgCO2/kWh) related to a) the battery cell production, b) mining and refining processes and c) the scrap materials production found in literature.
Table 4.
CO2 emissions (kgCO2/kWh) related to a) the battery cell production, b) mining and refining processes and c) the scrap materials production found in literature.
| Authors | CO2 specific emissions related to the battery cell (kgCO2/kWh) |
CO2e emissions related to mining and refining processes (kgCO2/kWh) |
CO2e emissions from scrap materials (kgCO2/kWh) |
|---|---|---|---|
| Cox et Al. (2017) [10] | 100 | N.C.1 | N.C. |
| IVL (2019) [13] | 80 | N.C. | N.C. |
| Helmers et Al. (2020) [12] | 90 | N.C. | N.C. |
| Woody et Al. (2021) [7] | 90 | N.C. | N.C. |
| Volvo2 (2021) [11] | 90 | 50 | 15 |
| Northvolt (2022) [16] | 1303 | // | // |
1 N.C. = not considered; 2 Total emissions referred to the whole battery pack; 3 Global “State of Art” value also considering mining, refining and emissions from unrecycled scrap materials.
Table 5.
CO2 emissions (kgCO2/kWh) related to a) mining and refining processes, b) battery cell production, c) scrap materials production, d) battery pack assembly process, e) total emissions related to battery pack production in the Italian case study, f) total emissions related to battery pack production in the Italian case study in case of an enhanced battery efficiency. As the b-f are dependent on the same c.i.e, the latter is reported for all the energy scenarios at battery production plant.
| Energy scenario | Electric C.I. (battery production plant) |
(a) CO2 for mining & refining |
(b) CO2 for battery cell production |
(c) CO2 for scrap materials production |
(d) CO2 for battery pack assembly |
(e) Total CO2 for battery pack Production |
(f) Total CO2 for enhanced battery @2035 (+ 20% energy) |
|---|---|---|---|---|---|---|---|
| 2021 | 0.308 | 45 | 74 | 15 | 20 | 154 | // |
| 2035 BAU | 0.262 | 40 | 50 | 14 | 18 | 122 | 97 |
| 2035 FF55 | 0.116 | 40 | 23 | 10 | 14 | 87 | 70 |
Table 6.
C.I.E.@ low voltage (kgCO2/kWh), AC Charging phase efficiency, C.I.C. for BEVs (kgCO2/kWh).
Table 6.
C.I.E.@ low voltage (kgCO2/kWh), AC Charging phase efficiency, C.I.C. for BEVs (kgCO2/kWh).
| Energy Scenario |
C.I.E. @low voltage |
AC Charging phase efficiency |
C.I.C. @vehicle Battery (PTB) |
|---|---|---|---|
| 2021 | 0.318 | 0.85 | 0.374 |
| BAU@2035 | 0.270 | 0.88 | 0.307 |
| FF55@2035 | 0.120 | 0.88 | 0.137 |
Table 7.
The emissions produced by the 12 vehicles taken into account.
| Mild HEV Car segment |
Model | Fuel consumption (dm3/km) |
WTW CO2 emissions (gCO2/km) |
Battery Capacity (kWh) |
CO2 for battery production (kgCO2) |
|---|---|---|---|---|---|
| A | Suzuki Ignis | 0.054 | 151 | 0.13 | 20 |
| B | Mazda 2 | 0.046 | 129 | 0.90 | 138 |
| C | Ford Kuga | 0.058 | 162 | 1.20 | 185 |
| M | Suzuki Vitara | 0.062 | 174 | 1.10 | 169 |
|
Full HEV Car segment |
|||||
|
A B C M |
Honda Jazz | 0.046 | 129 | 0.75 | 115 |
| Toyota Yaris | 0.045 | 126 | 0.90 | 138 | |
| Hyundai Ioniq | 0.048 | 134 | 1.30 | 200 | |
| VW Tiguan | 0.050 | 140 | 1.20 | 185 | |
|
BEV Car segment |
Model |
Energy consumption (kWh/km) |
Plant-to-Wheel CO2 emissions (gCO2/km) |
Battery Capacity (kWh) |
Battery carbon Intensity (kgCO2) |
| A | VW UP | 0.141 | 45 | 37 | 5700 |
| B | Nissan Leaf | 0.162 | 51 | 60 | 9240 |
| C | Tesla Mod.3 | 0.184 | 59 | 60 | 9240 |
| M | Opel Mokka | 0.177 | 56 | 50 | 7700 |
Table 8.
Additional CO2 emissions for M-HEVs and F-HEVs in respect to BEVs.
| CAR SEGMENT |
POWERTRAIN | ||||||
|---|---|---|---|---|---|---|---|
| BEV | Full HEV |
Mild HEV |
BEV | Full HEV |
Mild HEV |
||
| Additional CO2 emissions for full lifespan @160.000 km |
Additional CO2 emissions for mean lifespan @120.000 km |
||||||
| 2021 | A | Ref. | +27% | +57% | Ref. | +27% | +57% |
| B | “ | +7% | +10% | “ | -8% | -5% | |
| C | “ | +7% | +29% | “ | -7% | +11% | |
| M | ” | +23% | +52% | ” | +8% | +33% | |
| BAU@2035 | A | “ | +59% | +109% | “ | +59% | +109% |
| B | “ | +34% | +45% | “ | +17% | +28% | |
| C | “ | +35% | +70% | “ | +18% | +49% | |
| M | “ | +53% | +100% | “ | +38% | +78% | |
|
FF55@ 2035 |
A | “ | +185% | +277% | “ | +185% | +277% |
| B | “ | +141% | +162% | “ | +102% | +122% | |
| C | “ | +143% | +208% | “ | +107% | +161% | |
| M | “ | +183% | +268% | “ | +145% | +219% | |
Disclaimer/Publisher’s Note: The statements, opinions and data contained in all publications are solely those of the individual author(s) and contributor(s) and not of MDPI and/or the editor(s). MDPI and/or the editor(s) disclaim responsibility for any injury to people or property resulting from any ideas, methods, instructions or products referred to in the content. |
© 2023 by the authors. Licensee MDPI, Basel, Switzerland. This article is an open access article distributed under the terms and conditions of the Creative Commons Attribution (CC BY) license (http://creativecommons.org/licenses/by/4.0/).
Copyright: This open access article is published under a Creative Commons CC BY 4.0 license, which permit the free download, distribution, and reuse, provided that the author and preprint are cited in any reuse.


