
Submitted:
13 October 2025
Posted:
15 October 2025
You are already at the latest version
Abstract
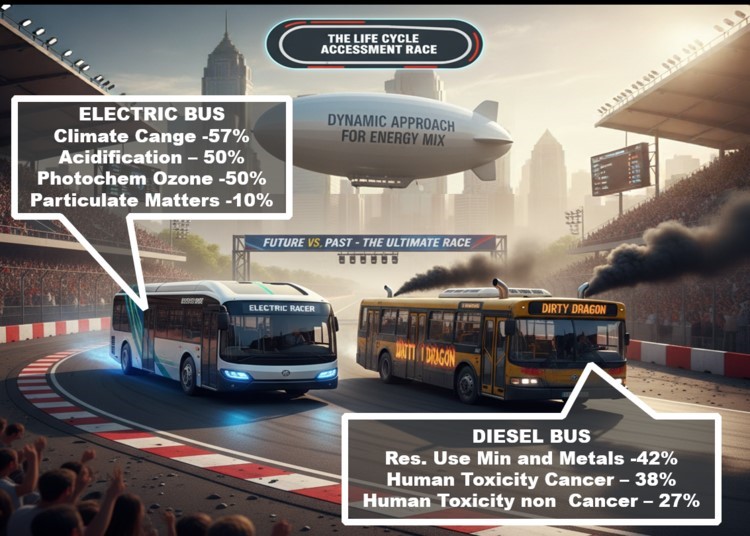
European energy and climate policies have enabled reductions in greenhouse gas emissions across many sectors, with transport standing out as an exception. In this ar-ea, one of the most promising solutions is the electrification of vehicles. In urban con-texts, the shift towards electrifying transport—particularly local public transport (LPT)—can yield significant benefits, especially when paired with an increasingly de-carbonized electricity mix, effectively reducing tailpipe emissions of both greenhouse gases and other pollutants. Nevertheless, it is essential to assess whether eliminating tailpipe emissions simply shifts environmental impacts to other stages of a vehicle’s life cycle. The Life Cycle Assessment (LCA), employing a comprehensive cra-dle-to-grave approach, serves as the principal tool for such evaluations. In this framework, this study focuses on the Italian situation using a dynamic LCA for elec-tricity mix. Results show that the electric bus reduces the impact on climate change (28.5 g CO₂eq/pkm vs 66.7 g CO₂eq/pkm for diesel, -57%), acidification, photochemical ozone formation, particulate matter, and the use of fossil resources. However, it pre-sents higher impacts in terms of human toxicity (both carcinogenic and non-carcinogenic) and the use of mineral and metal resources, mainly due to batteries production and the use of metals such gold, silver and copper.
Keywords:
life cycle assessment
; electric bus
; sustainable transport
1. Introduction
European energy and climate policies have led to reductions in greenhouse gas emissions in almost all sectors except for transport, where increased demand has more than offset the positive effects associated with increasingly stringent emission standards [1].
According to data published by the European Union in 2023 [2], greenhouse gas emissions from the transport sector, which had decreased in 2020 due to the pandemic, began to rise again in 2021, accounting for 26.7% of the Union’s total emissions. Of these, 76.2% can be attributed to road transport. Heavy-duty vehicles, including buses, are responsible for approximately 28% of the total emissions from road traffic in the EU.
In this context, it is clear that achieving the decarbonization targets set by the European Green Deal[3] (-55% by 2030 and net zero emissions by 2050) cannot be accomplished without decisive interventions in the transport sector [4], the most significant of which is the electrification of transportation [5]. Whereas scientific research in the past primarily focused on passenger cars for private transportation, there has been a growing interest in decarbonizing heavy-duty transport, particularly local public transport (LPT) [6,7,8,9,10]. Although a comprehensive literature review is beyond the scope of the present paper, the studies reviewed suggest that a widespread increase in electric vehicles within local public transport fleets can lead to substantial benefits, especially when coupled with electricity mixes characterized by a high share of renewable energy sources [8].
In this regard, to encourage the electrification of public transport fleets, the European Directive EU 2019/1161 [11] (Clean Vehicle Directive)—implemented in Italy by the Legislative Decree 187/2021 [12]12]—sets minimum procurement targets for clean and energy-efficient vehicles for public administrations. The directive requires that, during the procurement process, the energy and environmental impacts throughout the entire life cycle of these vehicles should be considered. In other words, it is essential to assess whether the absence of tailpipe emissions leads to a shift of impacts to other life cycle stages of so-called green vehicles. The Life Cycle Assessment (LCA) methodology—with its cradle-to-grave approach—proves to be the primary tool for such evaluations, as it enables the consideration of potential impacts linked to pollutant emissions and resource consumption throughout the entire life span of the analyzed vehicles: from the mining of materials required for the vehicle construction, through the production of energy carriers necessary for operation (electricity and diesel oil in this case), and including use phase (with maintenance), up to end-of-life management.
In this context, in the present study we carried out a Life Cycle Assessment of urban electric buses, comparing them with their diesel counterparts. The performance of the vehicles is evaluated using the Environmental Footprint (EF 3.0) method developed by the Joint Research Centre and recommended by the European Commission as a common European approach to measure the environmental performance of products [13]. As previously mentioned, several other studies have also addressed this topic. Limiting the view to the last years, Szczurowski [8] analyzes the electrification of the bus fleet in Krakow concluding that Electric buses can reduce total greenhouse gas emissions by 41.6% over their life cycle with a decarbonized electricity grid. García [14] compares hybrid and electric buses in Spain and in his analysis hybrid buses reduce LCA emissions by 40% (approx. 21 gCO2eq/km·passenger), and electric buses by 60% (approx. 12.5 gCO2eq/km·passenger) compared to diesel. Iannuzzi [15] studies hydrogen buses in Argentina, founding that renewable hydrogen from biomass can avoid at least 70% of GHG emissions compared to fossil diesel, with values of 0.24-0.28 kgCO2eq/km versus 0.78 kgCO2eq/km for diesel. Jelti [16] conducts a Well-to-Wheel (WtW) LCA of alternative buses in Morocco. In his study Electric and fuel cell buses have zero direct emissions (TtW), but WtT impact depends on the energy mix[16]. Gabriel [17] evaluates electric, CNG, and diesel buses in Bangkok and LCA emissions for electric buses are approximately 0.659 kgCO2eq/km, for CNG 1.117 kgCO2eq/km, and for diesel 2.0 kgCO2eq/km. Mastinu & Solari [18]compare electric and biomethane (CBG) buses. CBG performs better for global warming over the life cycle, while electric excels in human health and ecosystem quality[18]. Al-Ogaili [19] highlights that electrification in Malaysia without grid decarbonization leads to increased CO2 emissions. Zhao [7] analyzes charging infrastructure in Australia. In this case, due the high carbon intensity of the Australian electricity mix (approx. 0.944-1.05 kgCO2eq/km), electric Bus produces 1.2-1.4 times more GHGs than diesel (approx. 0.765-0.799 kgCO2eq/km), making grid decarbonization crucial.
In this context, the present study contributes to the literature with a comparative LCA of diesel and Electric urban buses focused on the Italian situation, with special attention to the electric mix that charges the electric bus batteries. On one side, the modelling relies on past detailed studies on thez mix of technologies and energy sources used for electricity generation ([20,21,22]) on the other side we applied a “dynamic” LCA approach, taking into account the evolution of the Italian electric mix during the life span of buses (10 years) instead of considering future energy mix only for sensitivity analysis as for example in [8,23]. The significance of selecting an appropriate electricity mix in the comparative Life Cycle Assessment of electric vehicles has been well established in the literature [6,24]. This is due to the fact that electricity generation—specifically the well-to-wheel phase—represents one of the principal contributors to numerous environmental impact categories, particularly those related to climate change. Relying on a static energy mix, as is common in literature, can introduce significant bias in impacts quantification. For instance, applying the 2019 electricity mix to our analysis would result in overestimating the impact on climate change by 26% and on photochemical ozone formation by 13%, while underestimating resource use (minerals and metals) by approximately 8%. Conversely, using the projected 2030 Italian electricity mix instead of the proposed dynamic approach would underestimate the impacts on climate change and photochemical ozone formation by 36% and 18% respectively, while overestimating impacts on resource use (minerals and metals) by about 8%. Other impact categories, such as Human Toxicity (both cancer and non-cancer) and Particulate matter formation are less sensitive to the electric mix scenarios
Although the dynamic approach is the methodological novelty that most affects the results, other methodological improvements with respect to literature are:
- A detailed Italian specific biodiesel production;
- The rely on primary data for battery cells production;
- The higher coverage of Environmental Footprint impact categories (many studies focused only on Carbon Footprint);
- The use of Monte Carlo analysis to take into account the uncertainty on diesel bus energy consumption.
The analysis is carried out using Simapro Software and relying on Ecoinvent 3.9.1 [25] cut off as background database. After this introduction, this paper follows the guidelines established by ISO 14040 [26]: methodology is hence described in chapter 0 (Goal and Scope ); main hypothesis and calculation methods are describe in chapter 0 (Life Cycle Inventory ), while chapter 0 (Results – Life Cycle Impact Assessment) discusses main results; finally , after a sensitivity analysis in chapter 5, the Interpretation of LCA results are discussed in chapter 0 (Conclusions).
2. Goal and Scope
The goal of this study is to assess the potential environmental impacts of electric and diesel urban public buses throughout their entire life cycle (cradle-to-grave approach) in the case of Italian cities. The overarching goal is to elucidate the key advantages and disadvantages of electrifying urban public transportation, thereby providing policymakers with robust evidence to inform the development of strategies for managing both public and private urban transport sustainably and to support other researchers and LCA practitioners in evaluating LCA of urban buses. An attributional approach was adopted in the present analysis. [27].
2.1. Functional Unit
The functional unit defines the quantitative reference against which the environmental impacts of the analyzed systems are assessed. It serves as the basis for ensuring comparability across different technologies and operational scenarios.
This study compares two propulsion technologies for a 12-meter urban bus: one powered by diesel and the other by electricity. The functional unit selected for this analysis is the passenger-kilometer (pkm), which corresponds to the specific function of a bus transporting passengers along a given route.
The service life of the buses is assumed to be 800,000 km (80,000 km per year over 10 years) [28], and it is further assumed that the battery of the electric bus will be replaced once during the vehicle's operational lifespan [6]. The maximum passenger capacity is set at 102 passengers per vehicle [28]. By considering an average occupancy rate of 20% [29], the resulting value is 20.4 average passengers transported per vehicle. This value is consistent with data found in the literature: according to [6], the average occupancy is 16.04 persons per vehicle; The Ecoinvent database reports an average value of 21.1 persons per vehicle [25], while [30] indicates an average of 17.8 persons per vehicle in their research
2.2. System Boundaries
Authors adopted a cradle-to-grave approach, encompassing all stages of the bus life cycle: raw material extraction and processing, component manufacturing and vehicle assembly, energy carrier supply, use phase, maintenance, and end-of-life management.
2.3. Allocation
In this analysis, allocation procedures were generally not required for the main supply chains, except for the electricity when produced in combined heat-and-power power plants; in this case an energy based allocation has been applied (refer to [31] for further details).
Regarding the general approach, a cut-off strategy was adopted, with the sole exception of batteries. For batteries, end-of-life material recycling was considered, along with an environmental credit attributed to the secondary raw materials produced by the recycling process itself.
2.4. Environmental Impact Categories
The assessment of potential environmental impacts throughout the life cycle (Life Cycle Impact Assessment, LCIA) is conducted using the Environmental Footprint Impact Assessment Method (EF Method) [32] developed by the Joint Research Centre and recommended by the European Commission as a common European method for measuring the environmental performance of products [13]. The impact categories included in the analysis are presented in Table 1.
These categories are among the most frequently adopted in life cycle assessment (LCA) studies about the transportation sector [6].
3. Life Cycle Inventory
In the following sections, the technical specifications representative of the buses and the description of the data used for modelling each life cycle phase are reported. Regarding background data, the main reference is the Ecoinvent 3.9.1 database[25].
Reference was then made to the GREET model (Greenhouse gases, Regulated Emissions, and Energy use in Technologies Model) to describe the production and maintenance phases of the vehicles [40].
The inventory of the lithium-ion battery was developed thanks to the activities carried out within the work described in [41] and updated in [42] which relies on primary data from an Italian battery producer.
In the following paragraphs, detailed information is provided for each life cycle phase considered.
3.1. Vehicles and Batteries Production
As previously mentioned, the modelling of the bus production phase is based on the GREET model and, more specifically, on the section dedicated to Medium Heavy-Duty Vehicles (MHDV) [40].
The GREET model provides a quantitative description of three different heavy-duty vehicles configurations, specifying the components included in each and their respective material compositions. A comprehensive breakdown of these components is available in Appendix A (Table A1, Table A2 and Table A3). Among the several available vehicles, Model 1—Class 6 PnD Trucks (Pick-up and Delivery)—was selected, as it most closely resembles the 12-meter urban bus considered in this study in terms of configuration (e.g. number of axles and tires), engine power (250 kW) and overall weight. To better reflect the specific characteristics of urban buses, The GREET data were adjusted to account for the higher content of materials such as glass and fabrics/polymers, which are typically more prevalent in buses than in trucks. To adapt the GREET data to the bus model, the EPD declaration of the Urbino 12 hybrid bus was used as a reference [28]. Table 2 shows the components and their respective weight for the two bus models considered, following the data reprocessing. Detailed data on original GREET subcomponents and adaptation to our case studies are reported in Appendix A (Table A5 and Table A6).
Electricity consumption per vehicle assembly is 3,108 kW, while Heat consumption per vehicle is 5,574 MJ [40].As for emissions during the painting phase of vehicles, the following emissions are assumed per vehicle: 1.6 kg of VOC, 0.02 kg of CO, 0.03 kg of NOx, 0.06 kg of PM10, and 0.03 kg of PM2.5 [40].
In the absence of specific data, the end-of-life phase for buses was handled as in [43], initially considering that the end-of-life treatment process for cars could be extended to buses. Specifically, the end-of-life treatment involves a manual dismantling stage, which is followed by mechanical shredding and subsequent post-shredding operations with an overall recycling rate of about 80% [44].We assumed that the electric bus is equipped with an NMC-type battery; the system includes 5 battery packs, with a total capacity of 395 kWh, and the battery weight is 2,995 kg, reflecting the specification of the Solaris NMC High Energy battery installed on the Urbino 12 electric bus [28].
The LCA modeling was carried out assuming a NMC 712 battery model (Lithium Nickel Manganese Cobalt oxide, LiNi₀.₇Mn₀.₁Co₀.₂) as it has an energy density close to that of the electric Solaris electric bus battery (approximately 140 Wh/kg for the reference battery versus 131 Wh/kg). As stated, the inventory of the lithium-ion battery was developed thanks to the activities carried out within the work described in [41] and updated in [42] which relies on primary data from an Italian battery producer. The modelling of energy consumption during the battery production phase was carried out under the assumption that the cells are manufactured in China and the battery pack is assembled in Europe.
The end-of-life treatment for the batteries involves a two-step process comprising pyrometallurgical and hydrometallurgical procedures, performed sequentially. These processes enable the recovery of copper, cobalt sulfate, nickel sulfate, and manganese sulfate. The end-of-life modelling was based on the study by Cusenza et al. [45]
3.2. Electricity and Fossil Fuels
According to the so-called dynamic approach in LCA, the Italian electricity mix considered for charging the batteries of electric buses considers the gradual decarbonization of the country's power system over the vehicle's ten-year lifespan. This mix, is defined as a linear combination of the Italian electricity mix for 2019 and the 2030 mix (Green Deal policy scenario), referring to a vehicle produced in 2019 and reaching its end of life in 2030. Assumptions and results for 2019 Italian Electric mix and the 2030 Italian electricity mix are taken from [21] and updated based on .[22,25]
The composition by source of the electricity supply mixes used in the study is shown in Figure 1. In line with the progressive decarbonization of the electricity sector, the supply mixes for 2019 and 2030 correspond to carbon intensities of 395 gCO₂eq/kWh and 153 gCO₂eq/kWh, respectively.
Concerning other life cycle phases, the following assumptions apply: Electricity consumption during maintenance, as well as that related to diesel refining and distribution, is represented by the average energy mix over the vehicle’s lifetime (just as the charging mix for batteries); The energy mix for vehicle end-of-life processes is fixed at the 2030 scenario.
For vehicle and battery production phases, since these are assumed to occur outside of Italy, the reference is to the electricity mixes provided by Ecoinvent (European mix for vehicle production and battery assembly, Chinese mix for cell production).
The diesel oil burned in the internal combustion engine bus consists of a blend of mineral diesel and biodiesel with a 7% volume blend (as per UNI EN 590 standard [46]), in line with [47]. The production of biodiesel used in Italy in terms of share of domestic production and import as well as the type of biomasses employed and their geographical origin, reflects the data published by GSE for the year 2019 [48] and hence is quite different from what is suggested in Ecoinvent database for European market. Moreover, since biomass is certified as “sustainable”, it means that no change in land use occurred for its production. For these reasons, neither land use change (from forest to crop) nor furans emissions (usually due to forest intentionally burned to leave spaces to cropland) have been considered.
3.3. Use Phase
Energy consumption values are taken from the literature and are assumed to be 1.25 kWh/km for the electric bus [18] and 38.04 l/100km for the Diesel bus [49].
Vehicle use-phase emissions include direct emissions from fuel combustion (for the internal combustion engine vehicle only) and those from brake, tire, and road surface wear.
For direct emissions, the average emission factors for road transport in Italy published by ISPRA for 2020 [49] were used. The reference buses are those classified as Urban Buses Standard 15 - 18 t, compliant with the Euro VI D/E standard. Emission factors per km used in the study are reported Table 3.
Wear-related emissions are assessed using specific datasets provided by Ecoinvent, based on data published by EMEP/EEA in the Air Pollutant Emission Inventory Guidebook [50,51].These emissions are modeled as proportional to the total weight of the vehicle, including transported passengers.
The maintenance phase is modelled using data published by GREET[40], which have been adapted for this case study and account for the replacement of tires, fluids, oil filters, windshield wiper blades, and lead-acid batteries (for ICE buses) throughout the operational lifespan of the vehicles. Table A 4 in Appendix A shows the number of replacements and the quantities replaced for the analyzed vehicles.
4. Results – Life Cycle Impact Assessment
This chapter describes the results obtained from the comparison between electric and diesel buses from a life cycle perspective and in relation to the service provided, namely the transport of one passenger over one kilometer in an urban context. In particular, the performances of the vehicles according to the EF 3.0 method (indicators in Table 1), are illustrated.
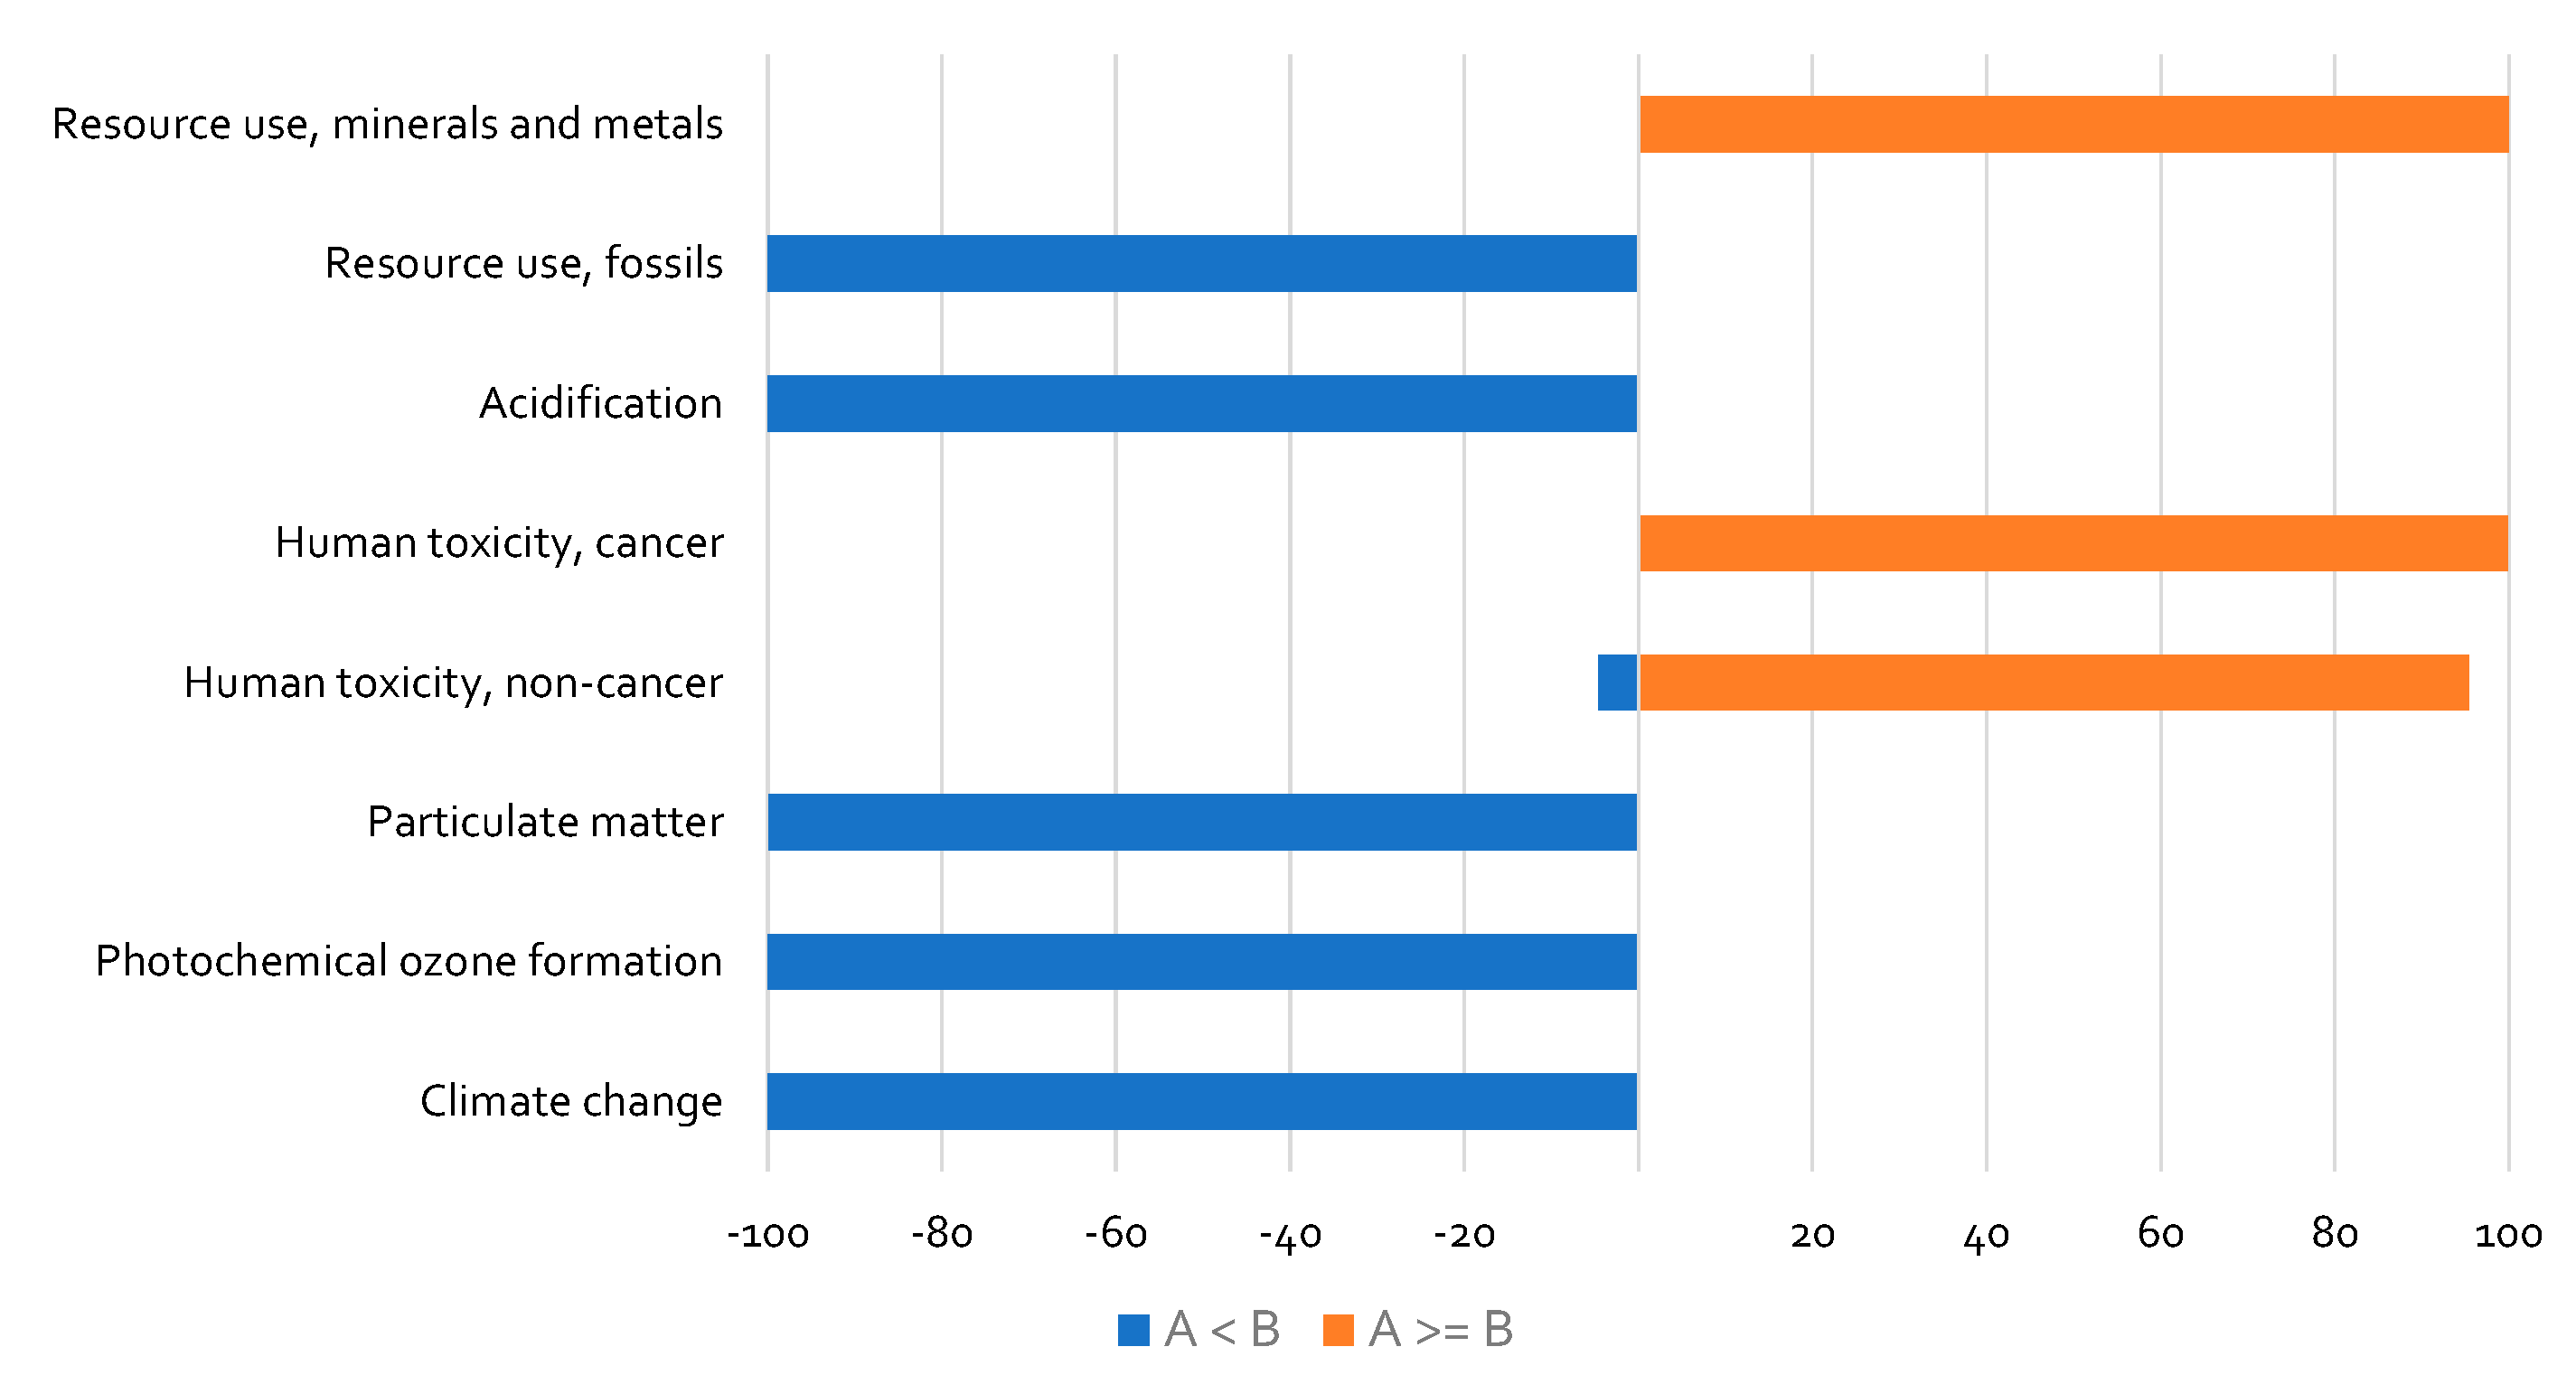
Figure 2 presents the environmental comparison between the two buses under study over their entire life cycle and for selected impact categories. In the graph, the reference value (100%) is assigned to the Diesel bus. The results highlight the potential contribution of electric buses to both the decarbonization of public transport and the improvement of the quality of life in urban areas. The electric bus shows lower potential impacts related to climate change (CC), acidification (A), particulate matter formation (PM), photochemical ozone formation (POF), and energy resource use (RU-E). However, it should be noted that the electric bus performs worse than the diesel bus in terms of human toxicity, both cancer and non-cancer related (HT-C and HT-NC), and, even more markedly, in Resource Use Mineral and metals (RU-M).
Figure 3–6 show the contribution of each life cycle phase to the selected impact categories. The life cycle stages represented in Figure 3–6 are: Vehicle: includes production and end-of-life of the vehicle; Battery: includes production and end-of-life of the NMC battery; Maintenance: includes vehicle maintenance and disposal of replaced components; Energy carrier: includes electricity and Diesel supply; Use: includes exhaust and non-exhaust emissions.
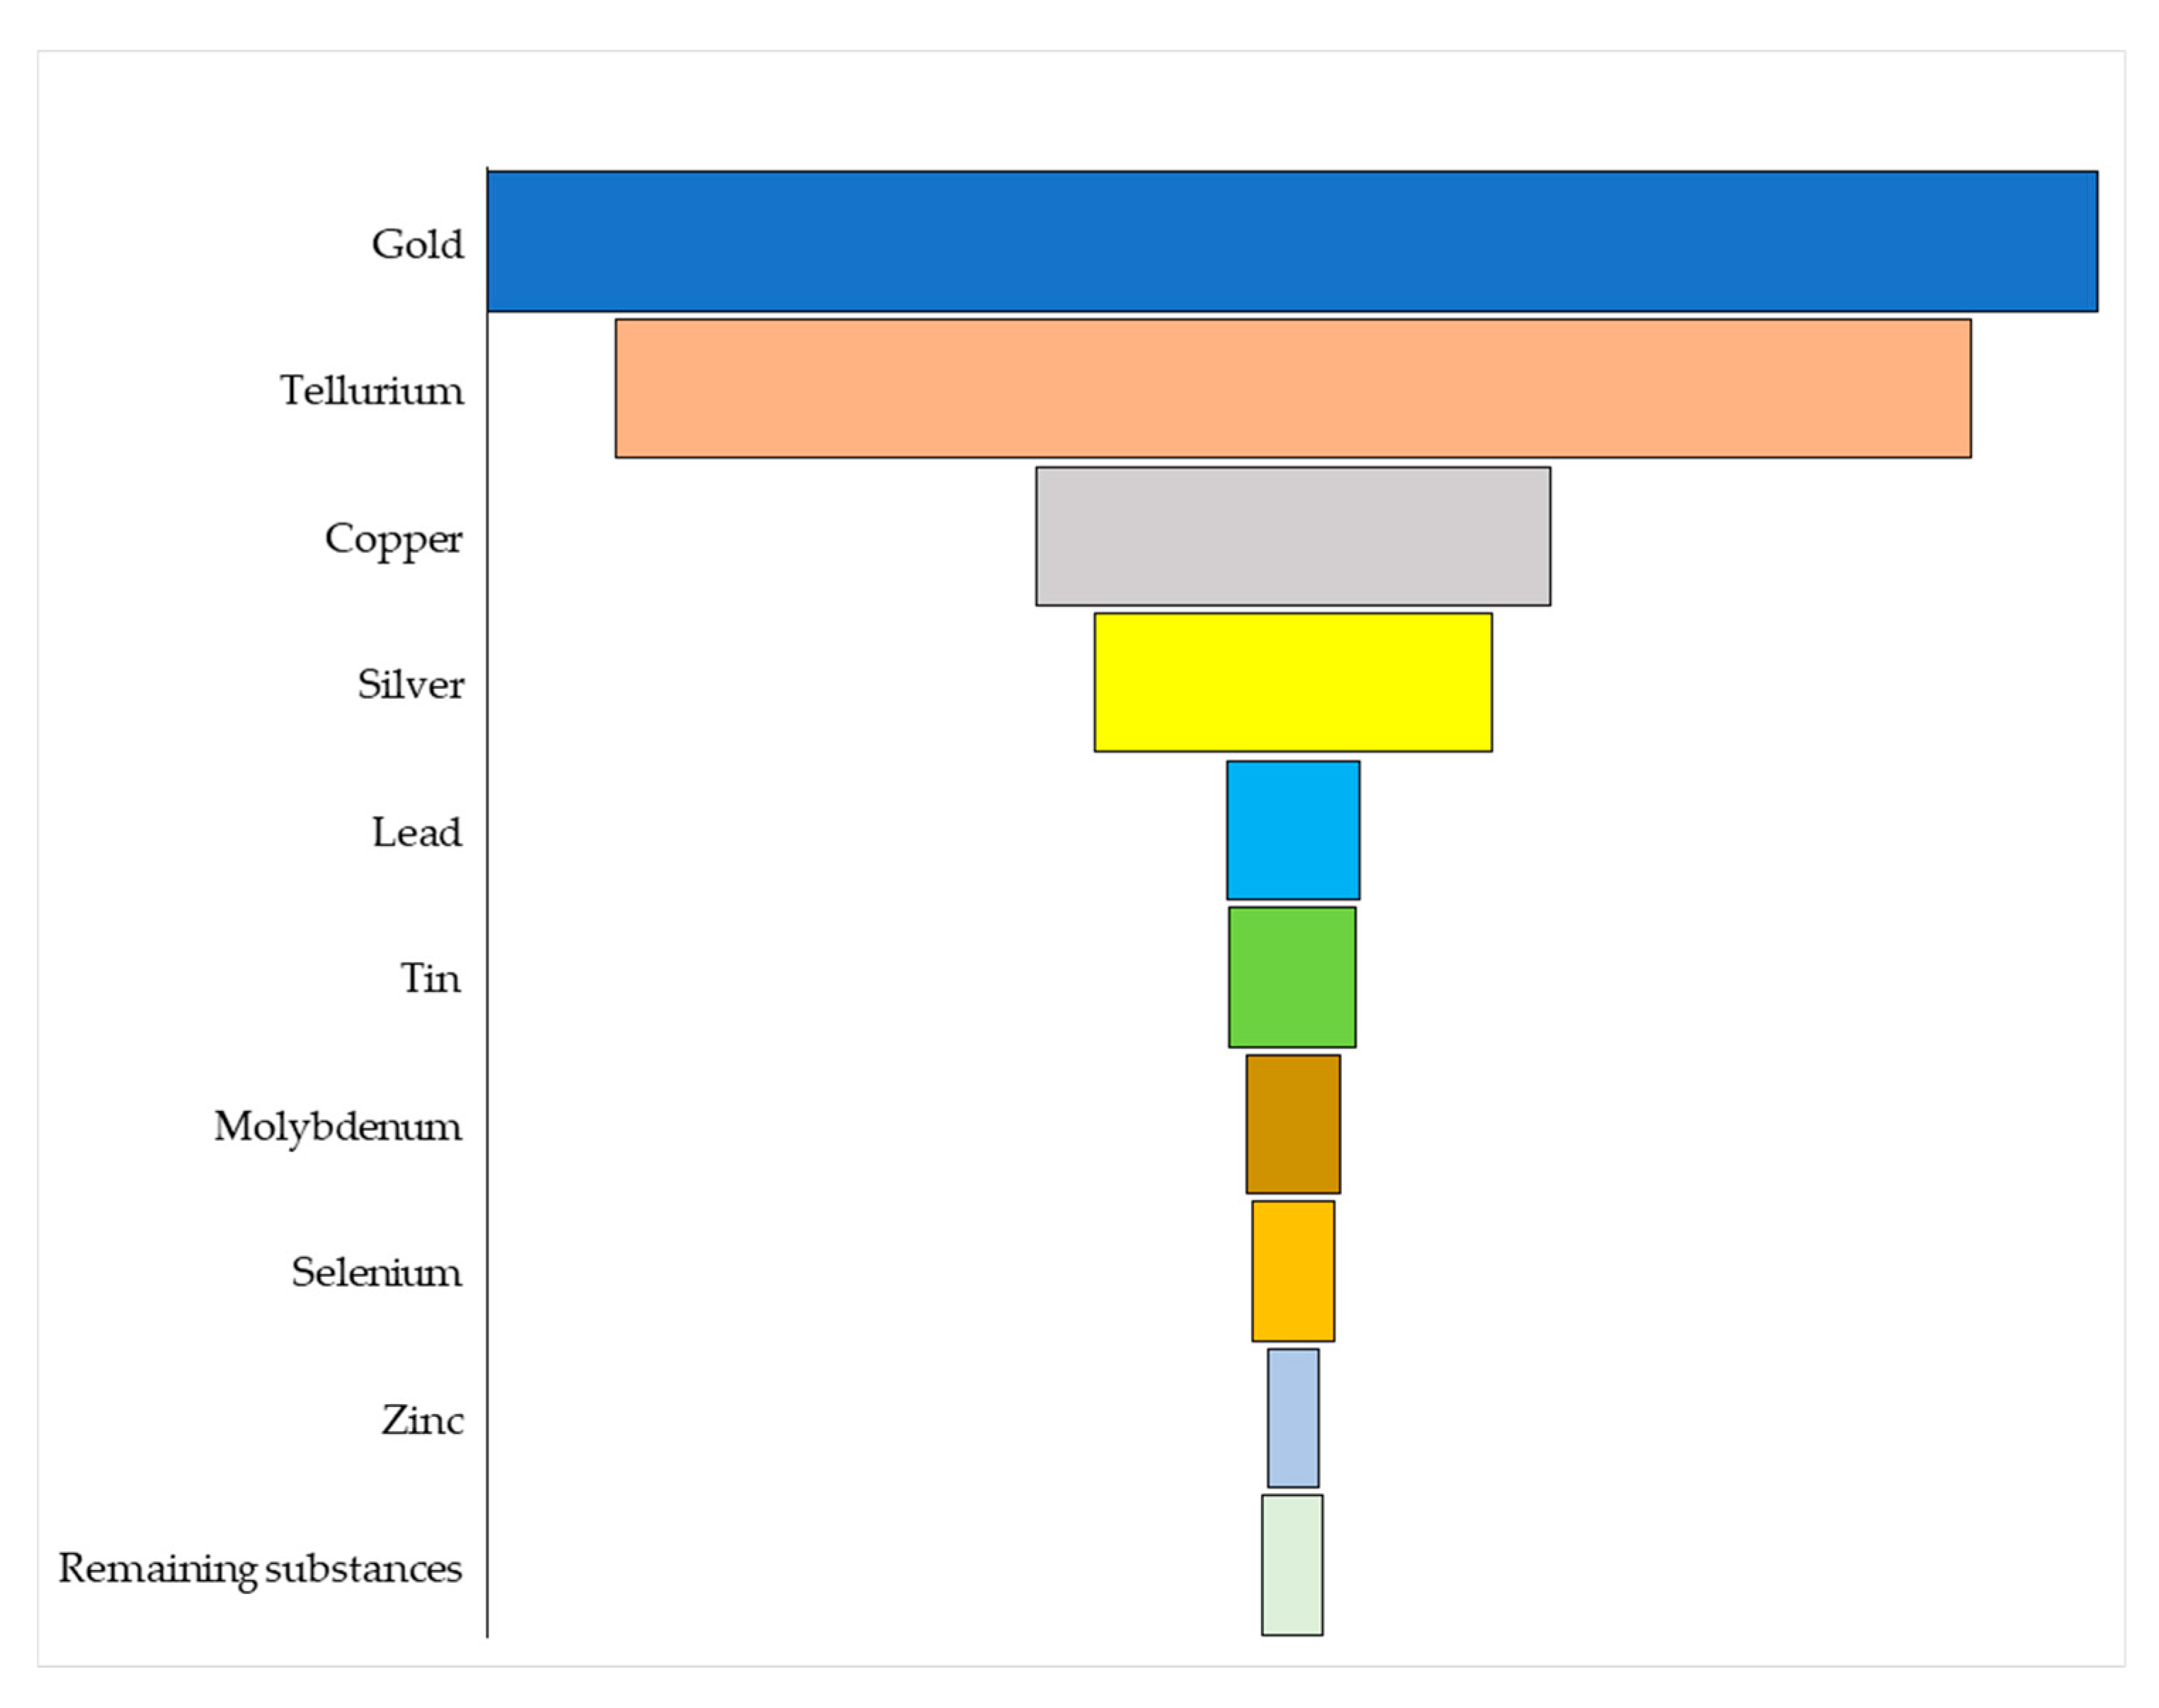
In each graphics stacks are computed according to the description made in section 0 and in particular vehicle and battery computational rules are described in subsection 0, Energy career in subsection 0, maintenance and use in subsection 0 For the Climate Change impact category, the potential impacts for electric and diesel buses are 28.5 and 66.7 g CO₂eq/p*km, respectively, with a percentage difference of 57%. For the diesel bus, the predominant contribution is attributable to the use phase (75% of the total). Regarding Acidification and Photochemical Ozone Formation, the electric bus demonstrates the best performance, and it is observed that, for the diesel bus, potential impacts from the diesel oil supply phase are particularly significant. The Particulate Matter impact category shows that the performance of the two vehicles is rather similar. In fact, the lower impacts associated with the electric powertrain are offset by those related to the battery life cycle. Moreover, the use-phase contribution is comparable for both vehicles and is essentially due to wear from brakes, tires, and road surfaces (for the diesel bus, wear accounts for 90% of potential particulate emissions in the use phase, and 100% for the electric bus). The consumption of fossil energy resources follows a trend analogous to that of climate change, while the use of mineral resources highlights the real weakness of the electric bus. Specifically, for the electric vehicle, a substantial share of the value of this indicator (Resources Use – Minerals and Metals) is due to battery production and end-of-life, which alone accounts for 60% of the indicator's overall value. The main drivers of this impact are the consumption of gold, silver, and copper (and tellurium, connected to copper production) used in battery manufacturing (including BMS). Cobalt and Nickel do not significantly influence the value of the indicators (see Figure 7), revealing that perhaps this metrics selected for EF method is not able to adequately address the problem of Critical Raw Materials consumption in energy transition, especially for what concerns batteries chemistry [52]. The percentage difference between the indicator values for the two vehicles is approximately 75%. Moreover, the potential impacts related to human toxicity (both cancer and non-cancer) penalize the electric bus, once again due to the potential impacts associated with the battery life cycle.
Figure 3.
Potential environmental impacts of the analyzed vehicles across Climate Change and Acidification impact categories (EF 3.0 method). Values are expressed per passenger-kilometer.
Figure 3.
Potential environmental impacts of the analyzed vehicles across Climate Change and Acidification impact categories (EF 3.0 method). Values are expressed per passenger-kilometer.
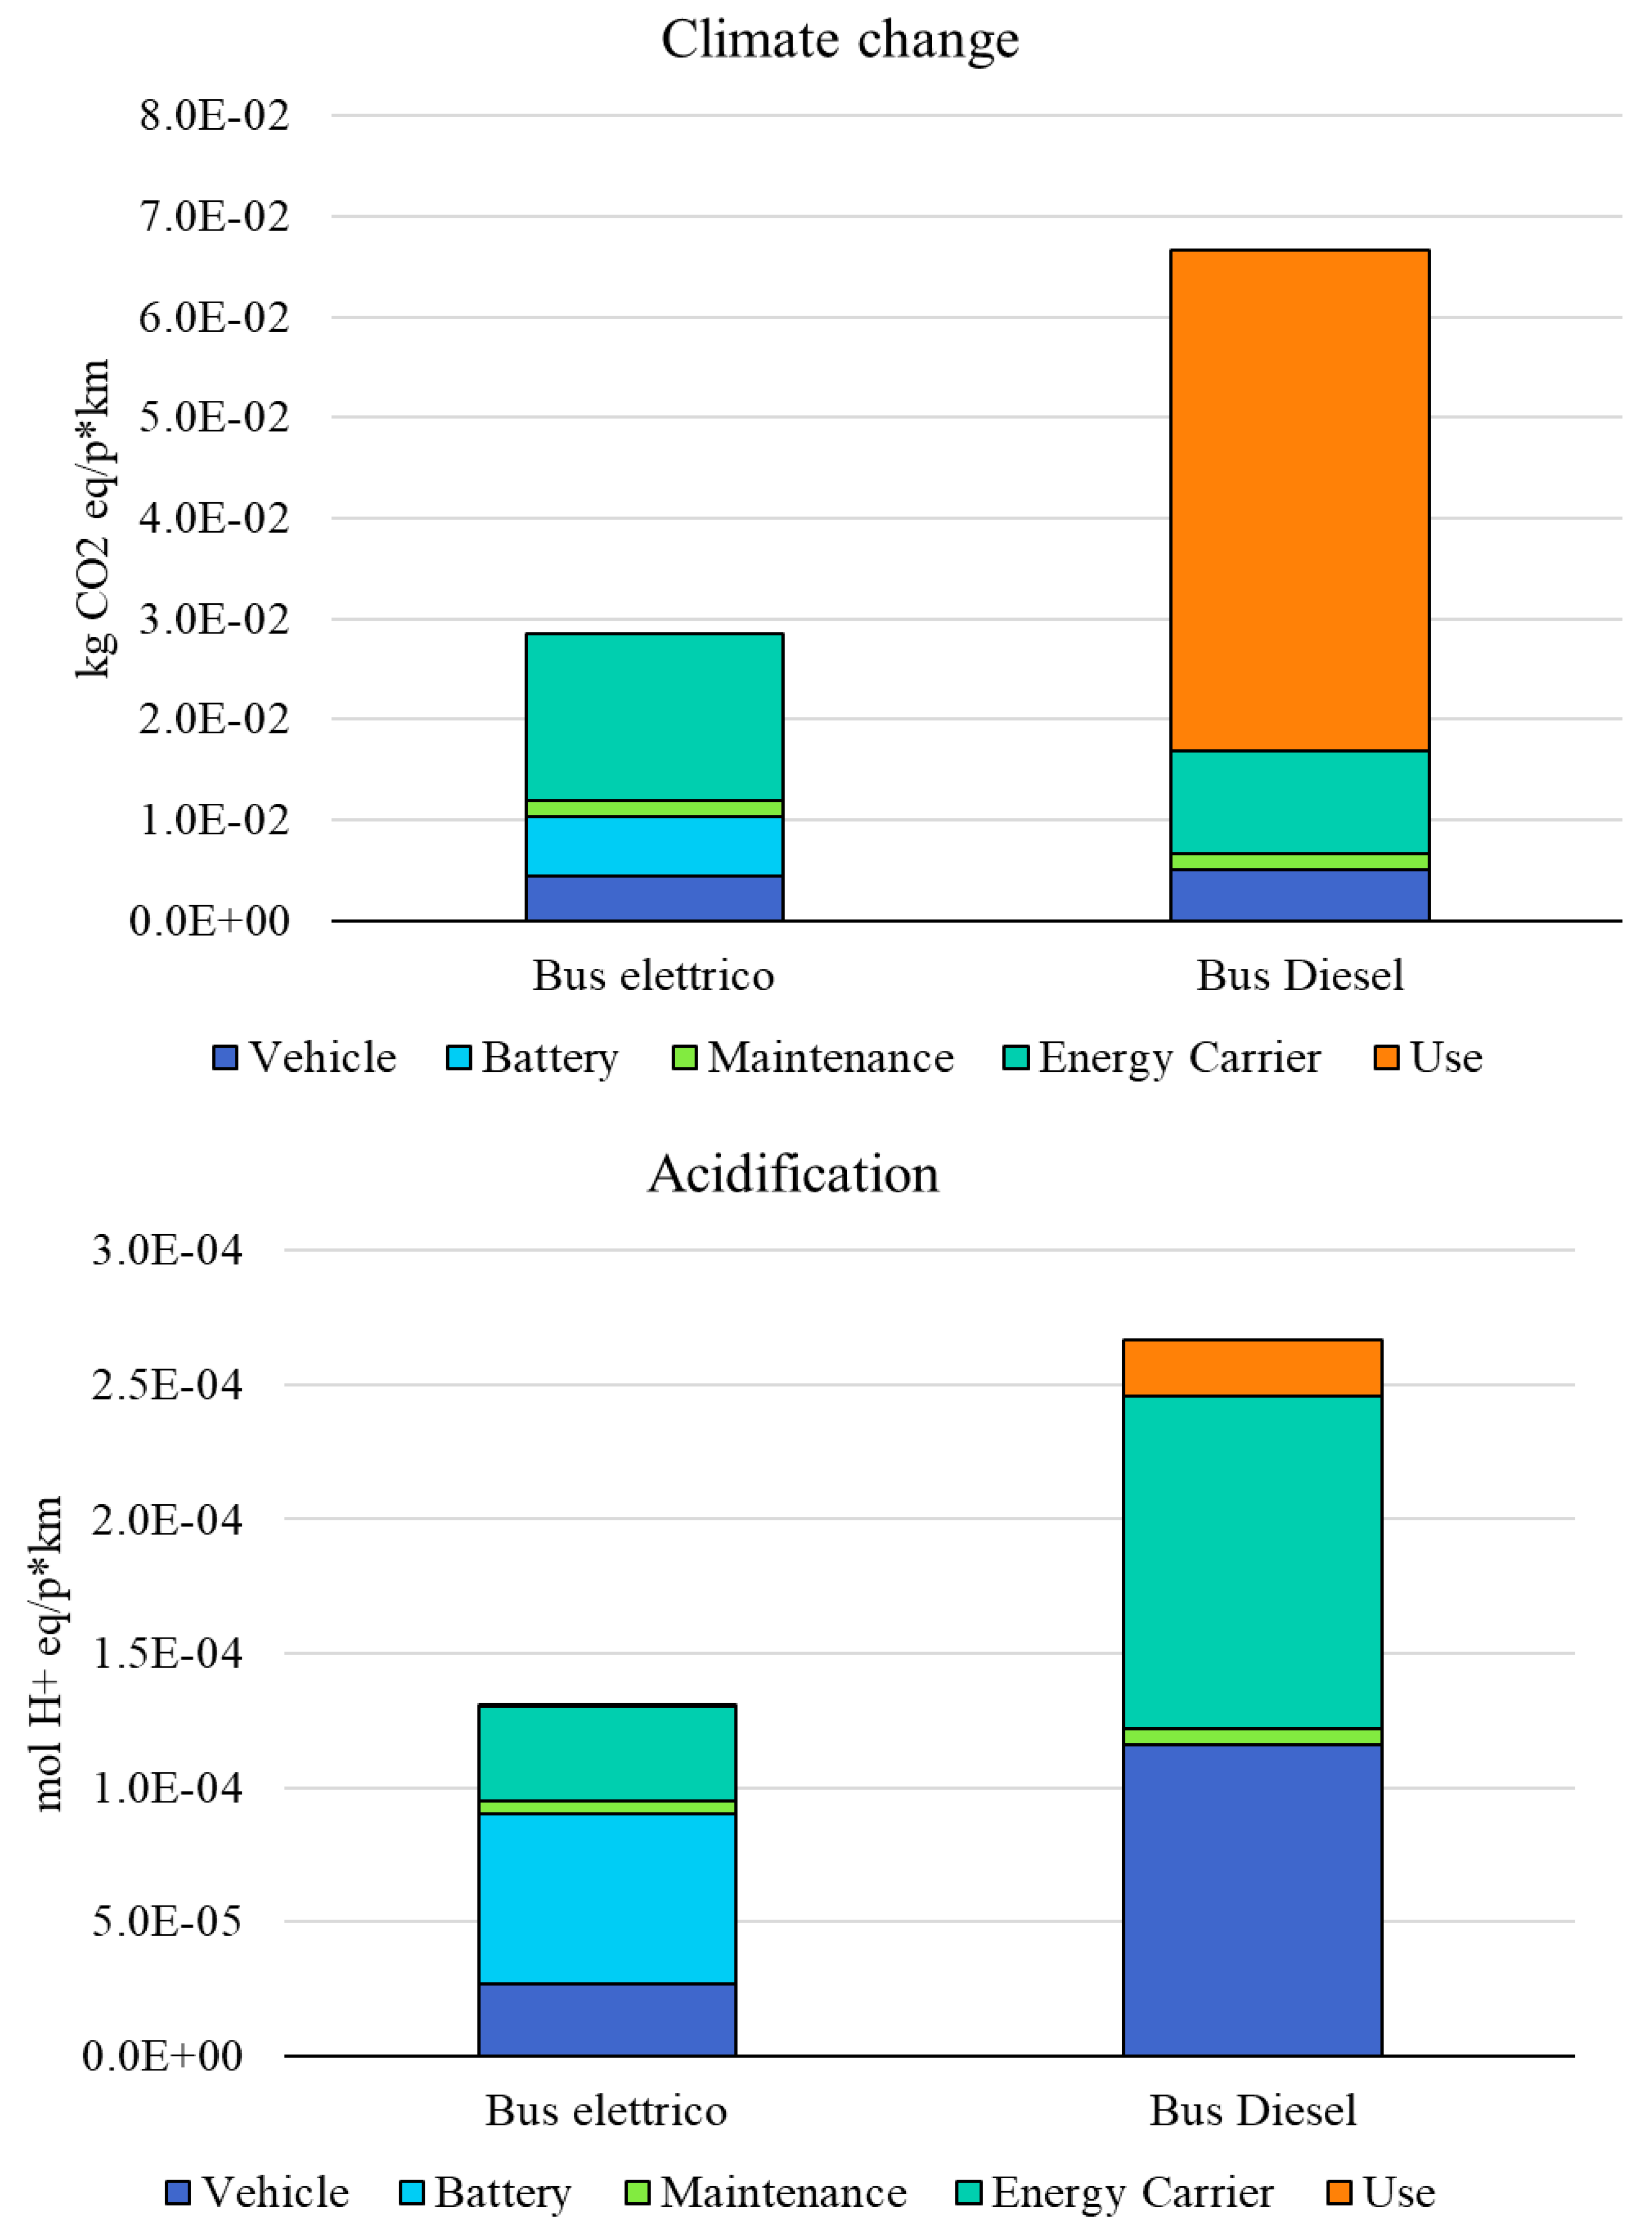
Figure 4.
Potential environmental impacts of the analyzed vehicles across Particulate Matter and Photochemical Ozone Formation impact categories (EF 3.0 method). Values are expressed per passenger-kilometer.
Figure 4.
Potential environmental impacts of the analyzed vehicles across Particulate Matter and Photochemical Ozone Formation impact categories (EF 3.0 method). Values are expressed per passenger-kilometer.
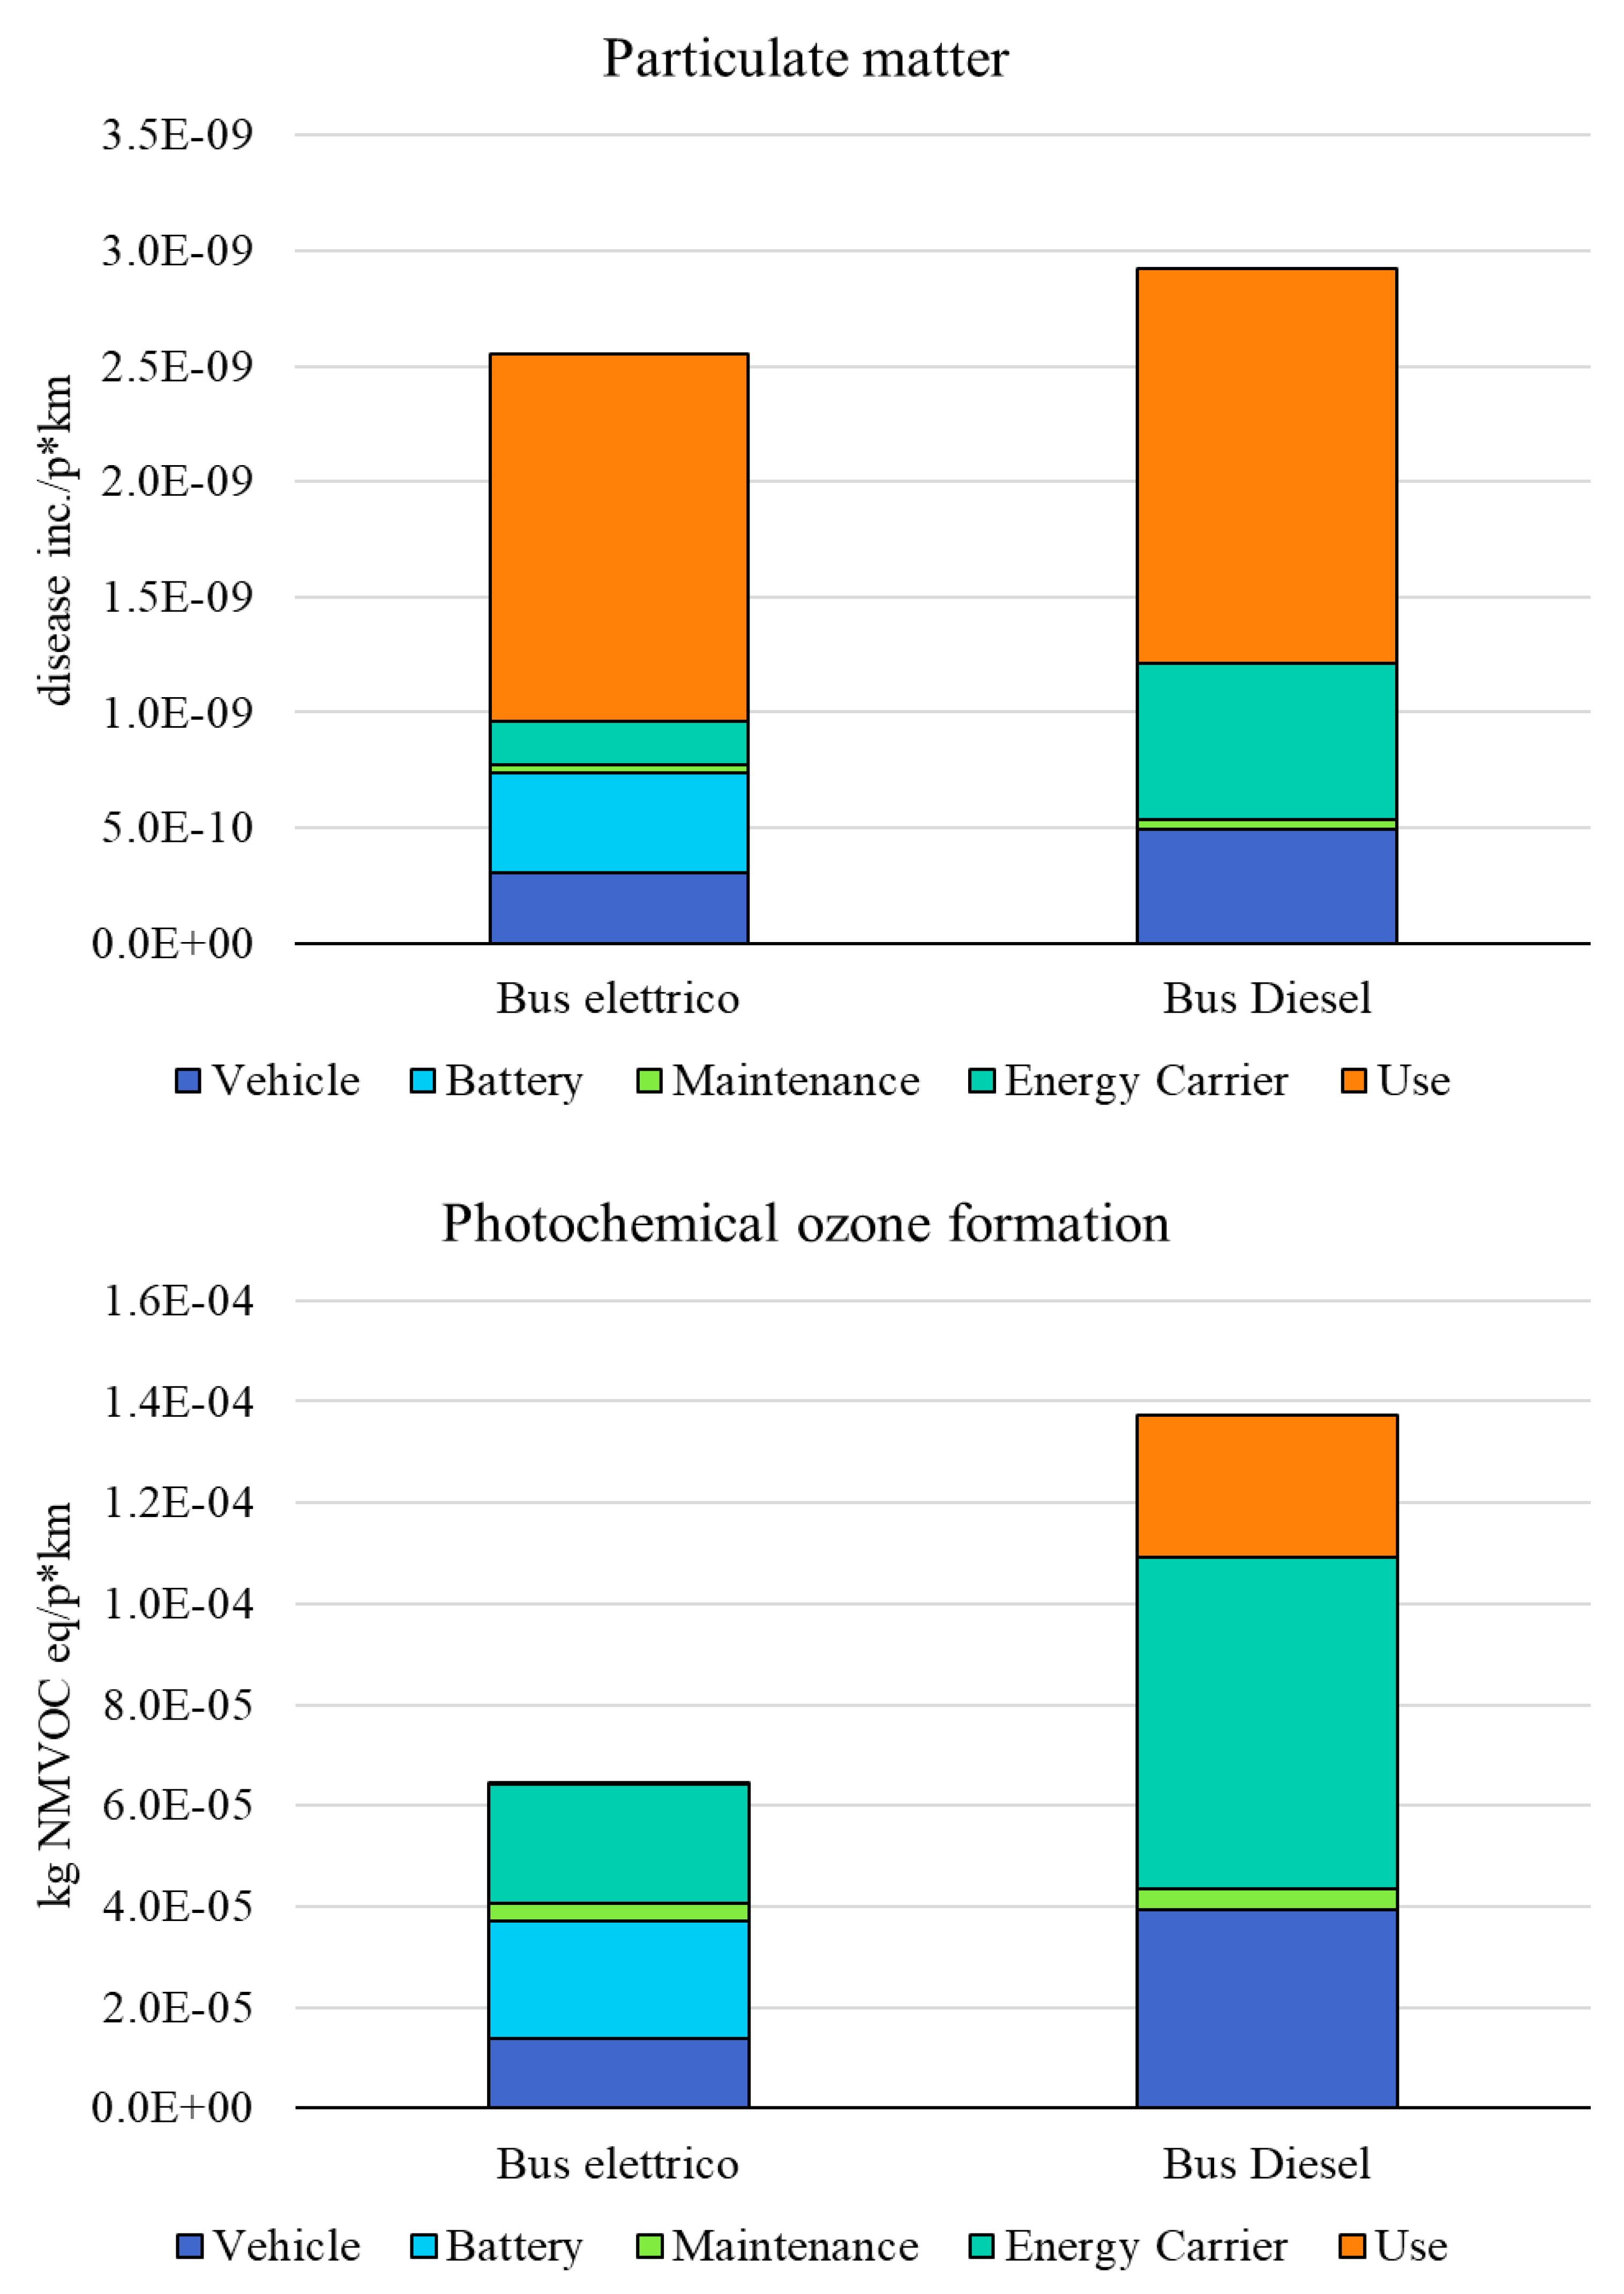
Figure 5.
Potential environmental impacts of the analyzed vehicles across Resource Use, minerals and metals and Resource Use, fossils impact categories (EF 3.0 method). Values are expressed per passenger-kilometer.
Figure 5.
Potential environmental impacts of the analyzed vehicles across Resource Use, minerals and metals and Resource Use, fossils impact categories (EF 3.0 method). Values are expressed per passenger-kilometer.
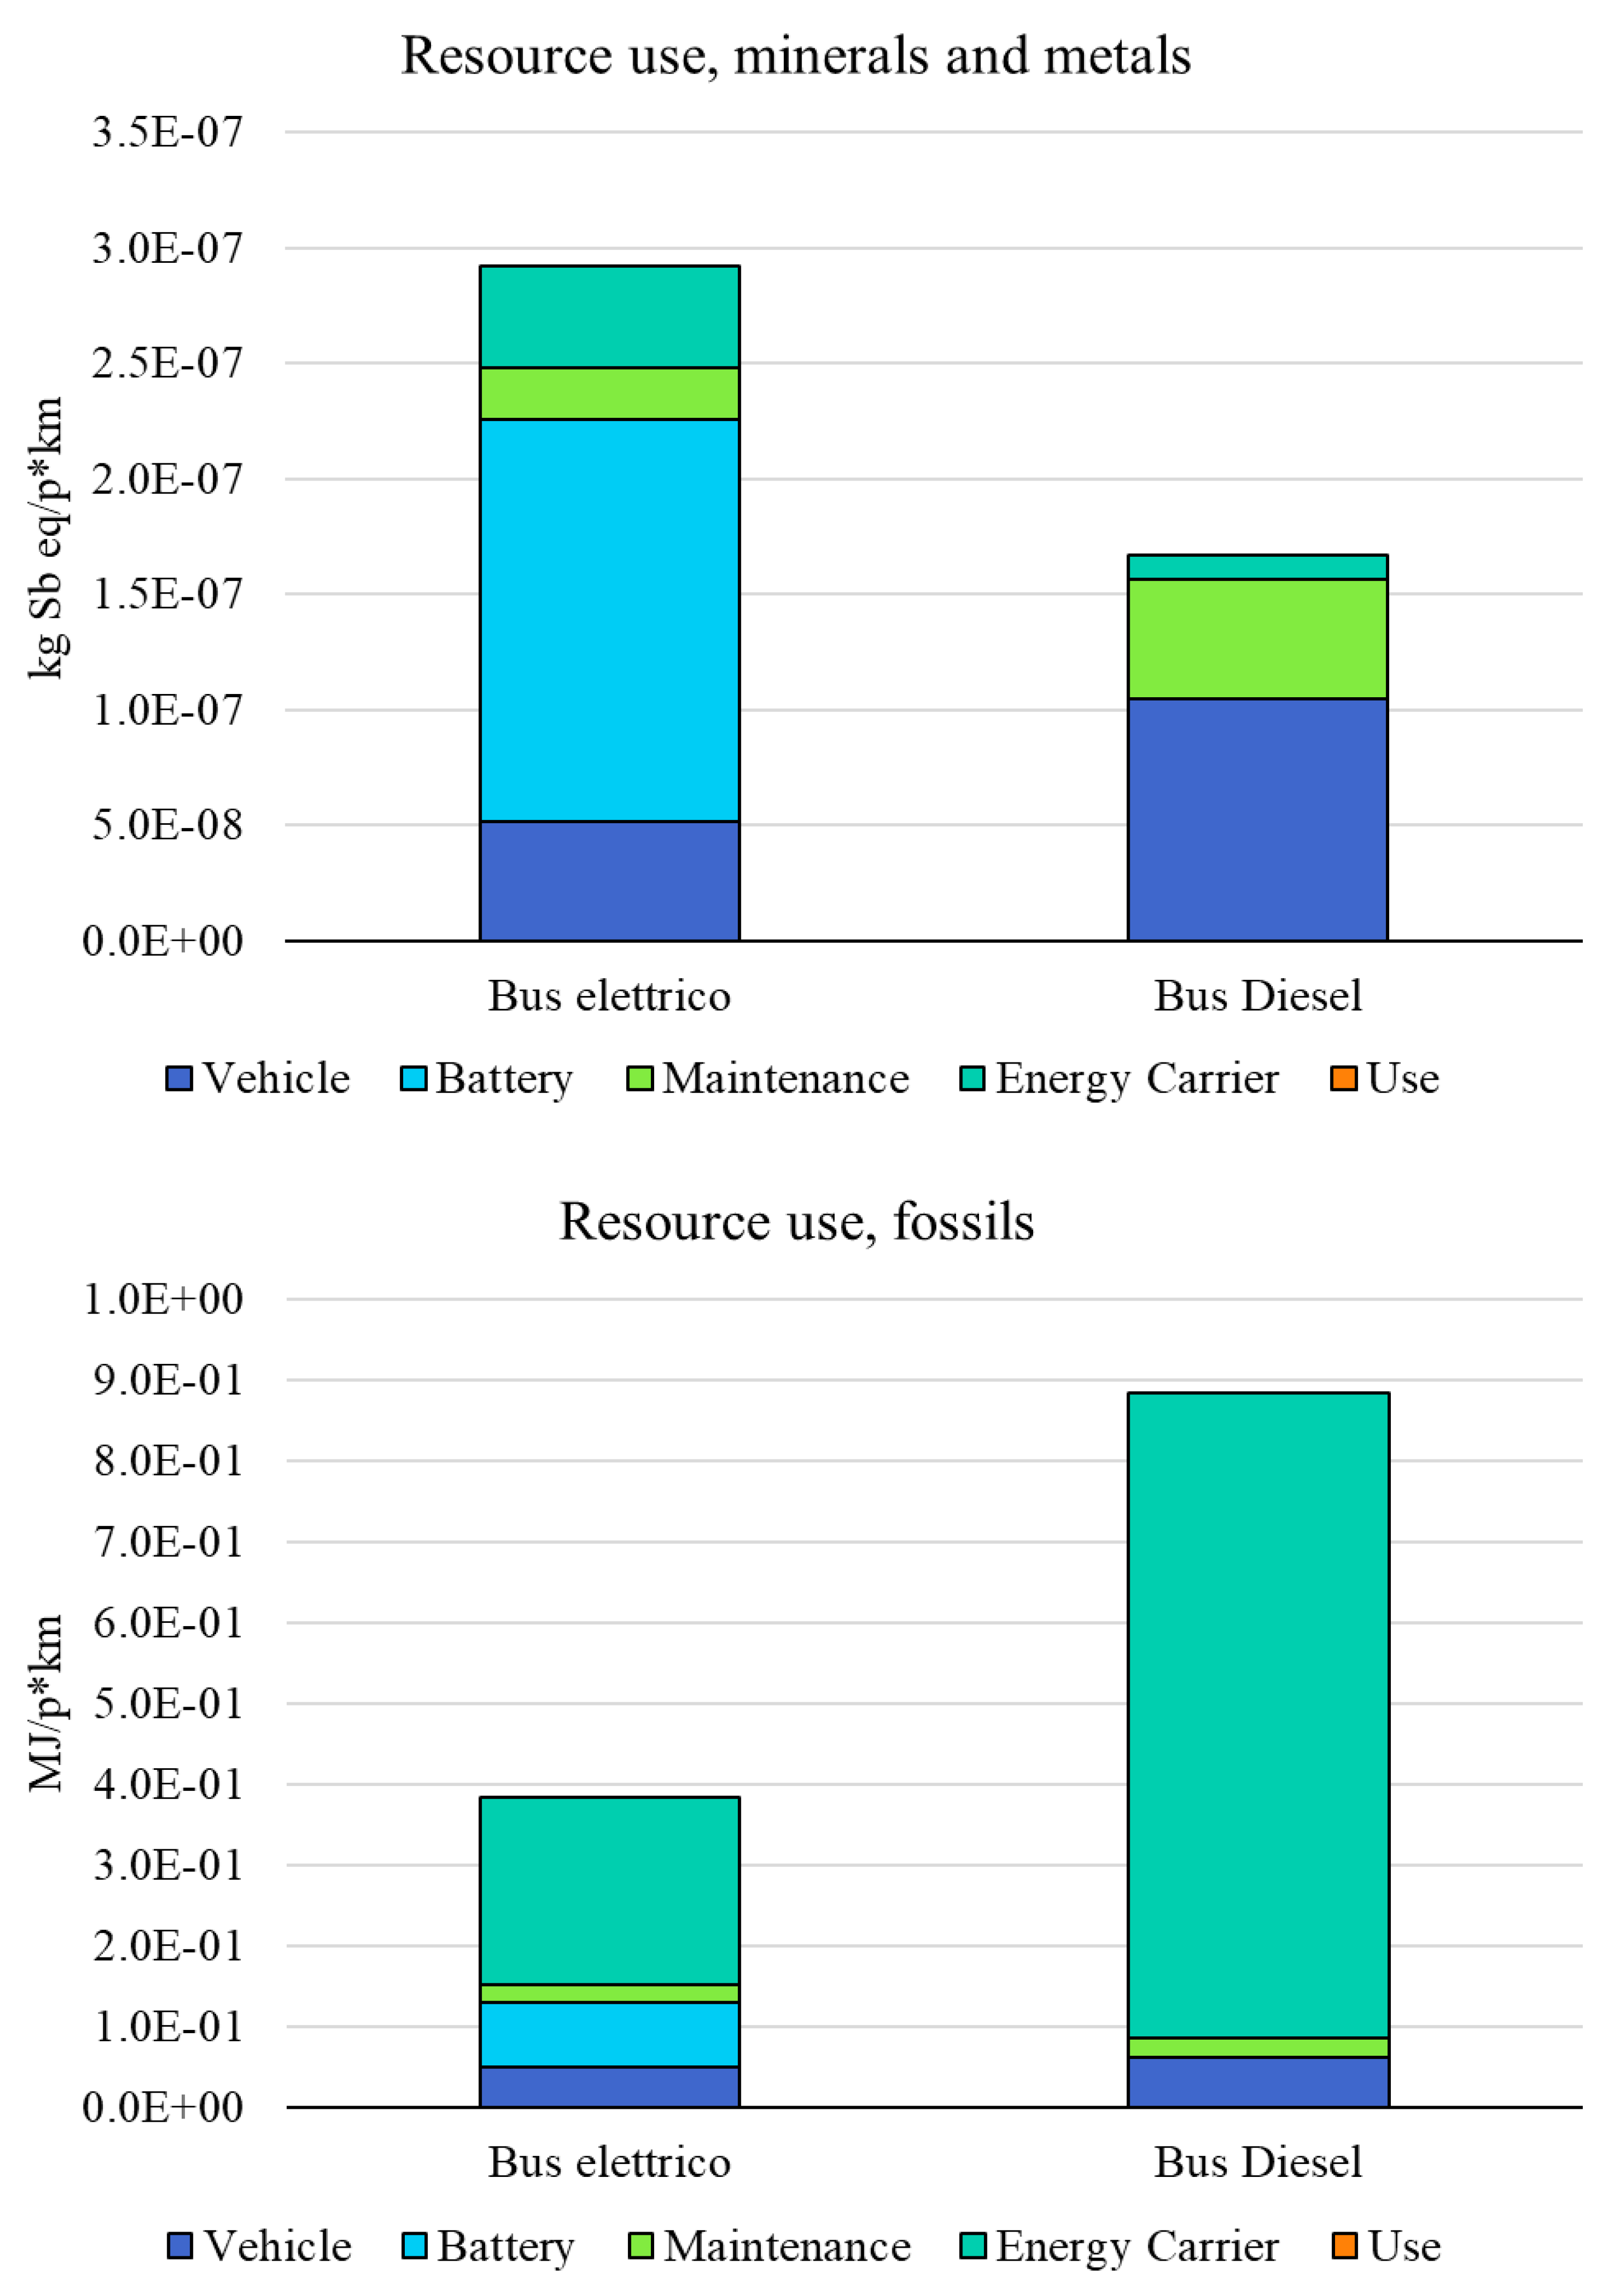
Figure 6.
Potential environmental impacts of the analyzed vehicles across Human Toxicity, cancer and Human Toxicity, non-cancer impact categories (EF 3.0 method). Values are expressed per passenger-kilometer.
Figure 6.
Potential environmental impacts of the analyzed vehicles across Human Toxicity, cancer and Human Toxicity, non-cancer impact categories (EF 3.0 method). Values are expressed per passenger-kilometer.
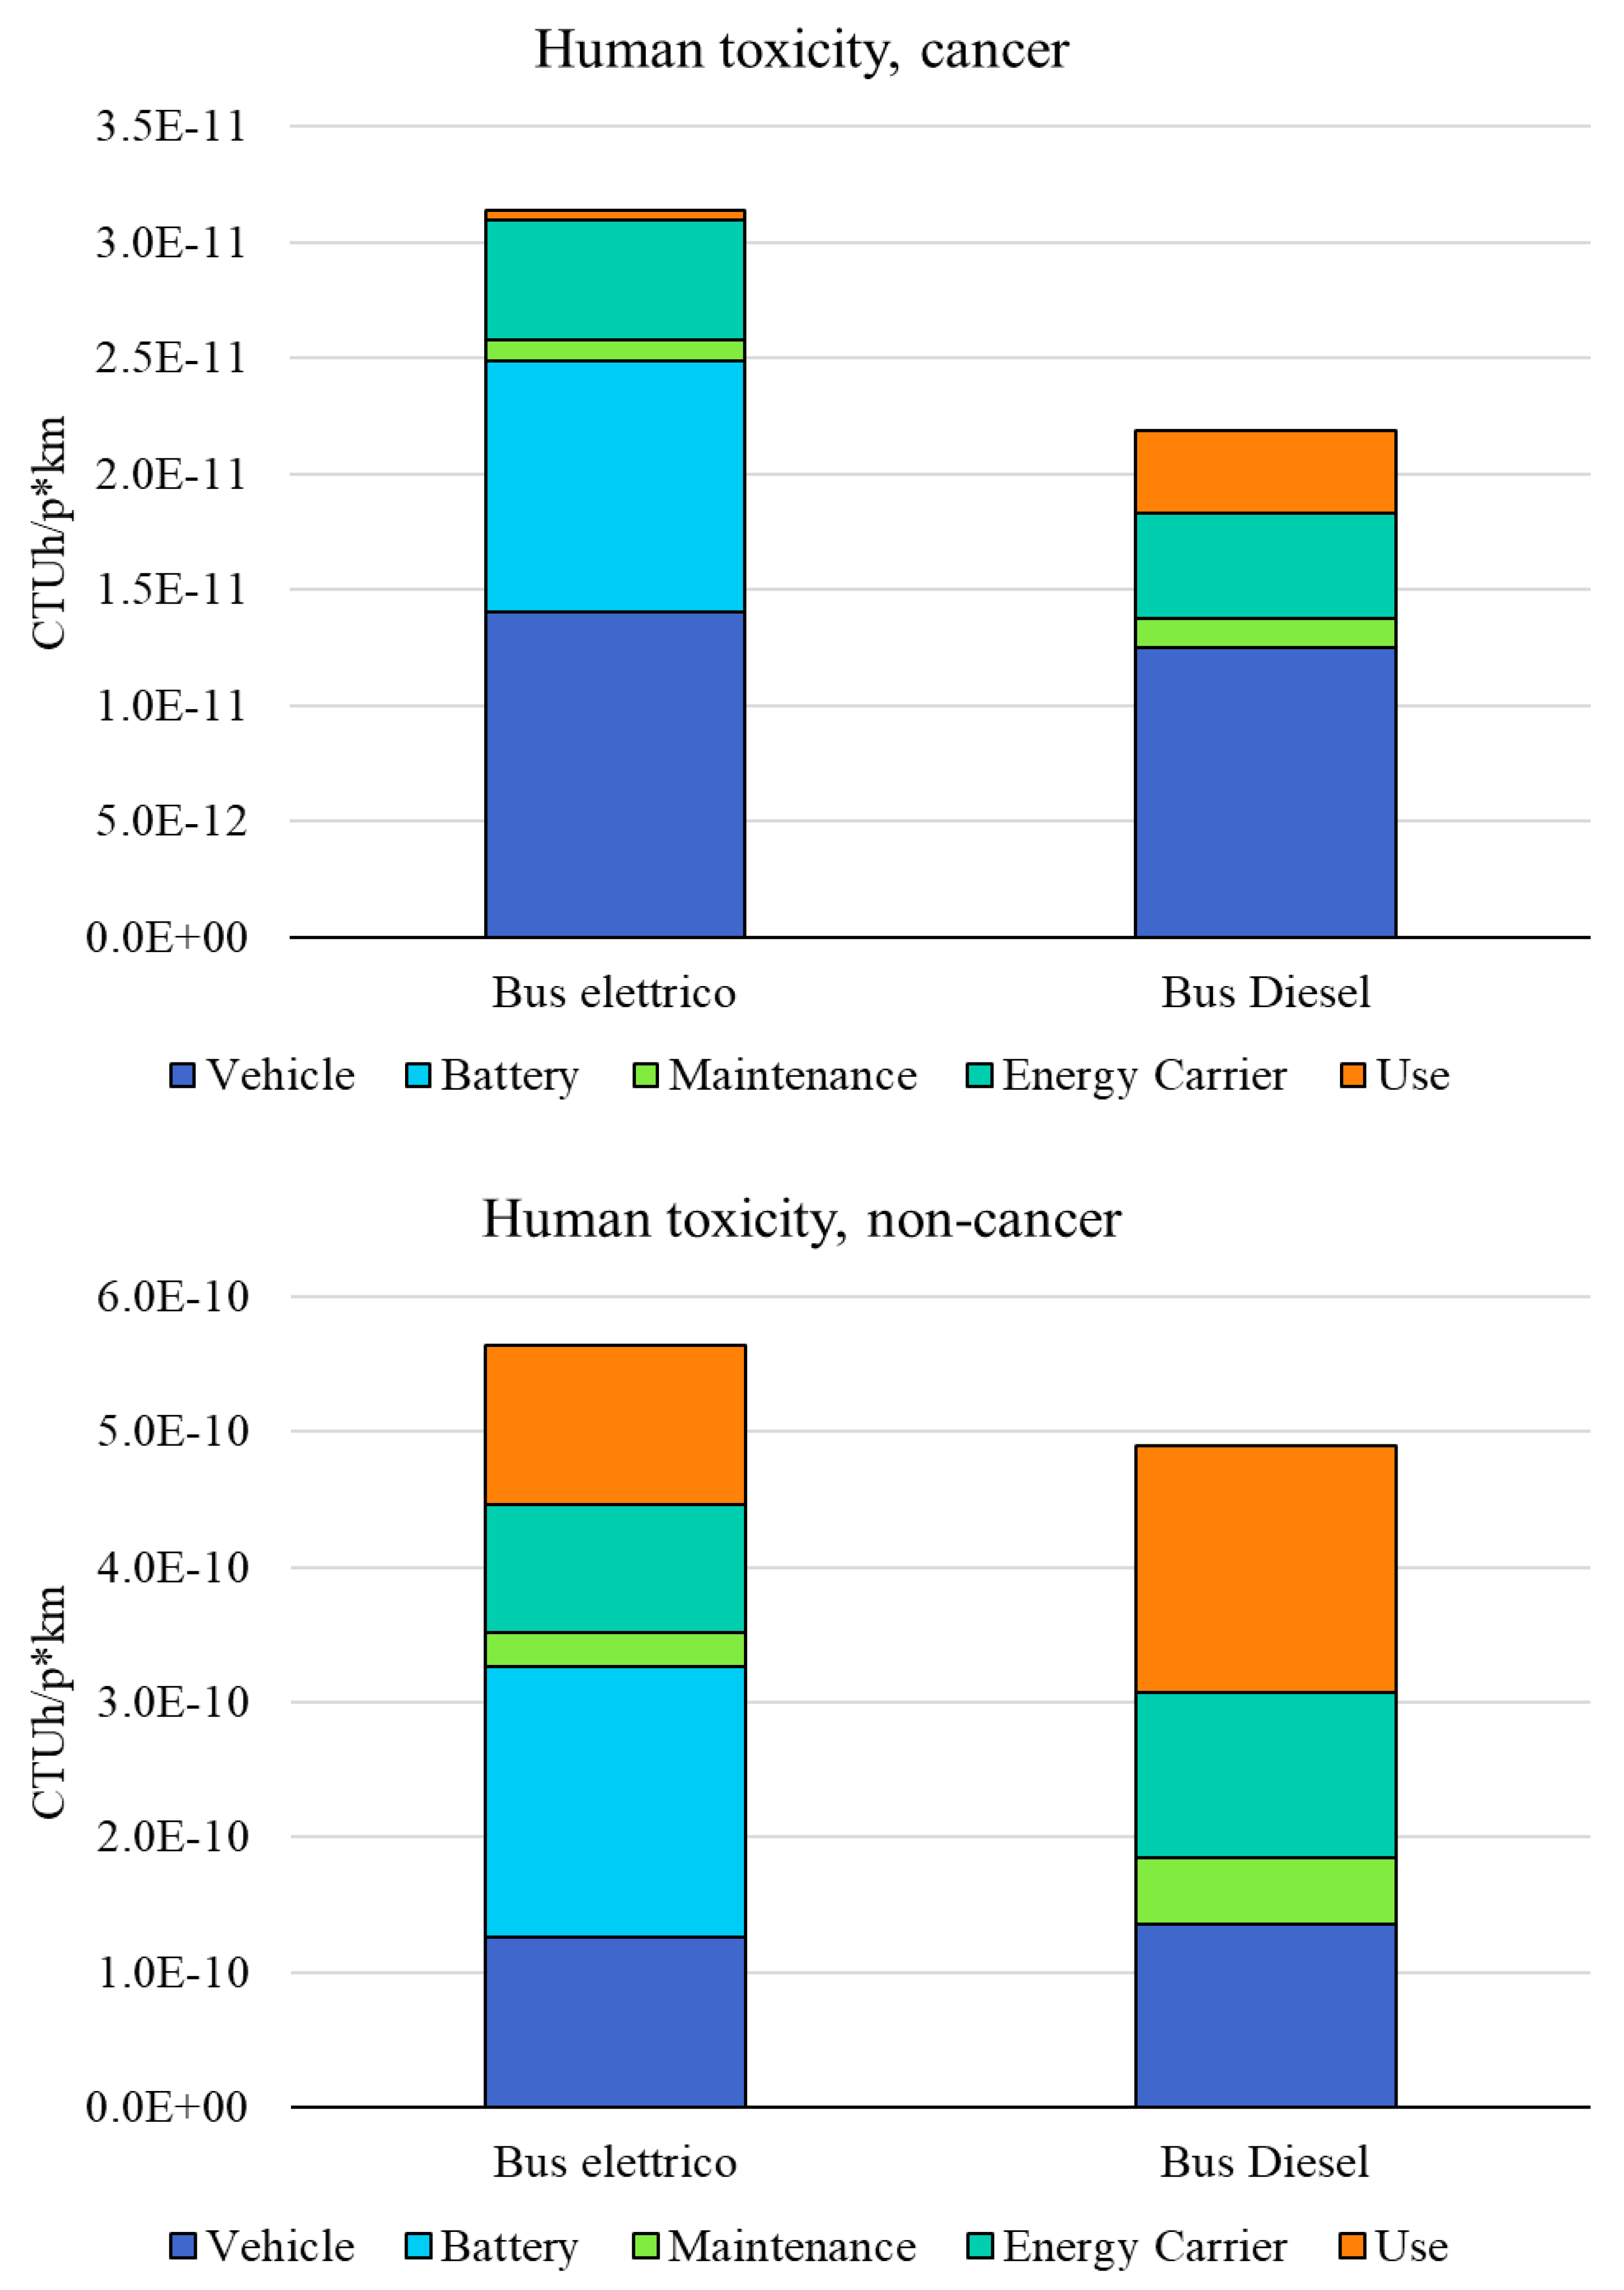
Figure 7.
Resource Use Minerals and Metals - Li-Ion Battery - Substance Contribution.
As illustrated by the figures, multiple impact categories are significantly influenced by both the production of the energy carrier (whether electricity or diesel fuel) and the use phase. This, in turn, suggests that these impacts are primarily influenced by the bus energy consumption. According to a brief literature review, there is considerable variability in energy consumption values, ranging from 110 kWh/100 km [6] to 170 kWh/100 km [45] for electric buses, and from 26 l/100 km [46] to 63.17 l/100 km [30] for diesel buses (see Table B.1 in Appendix B). However, the uncertainty analysis performed using the Monte Carlo method showed that the ranking of vehicle performance remains unchanged across the range of consumption values. For further details on this analysis, please refer to Appendix B.
Comparing different LCA studies is always difficult due to the differences in hypotheses, system boundaries, background databases and of course to selected environmental impact categories and related calculation methods. However, one of the most used impact categories is Climate Change and, hence, we compared our results with other LCA studies on electric buses. To this end we made a harmonization of results in terms of total mileage and average occupancy rate. More in detail, results from other studies were harmonized using the following reference parameters: a useful vehicle lifetime of 800,000 km and an average occupancy of 20.4 passengers per vehicle. In cases where original data were not available, harmonization was performed on a vehicle-kilometer basis and then converted to passenger-kilometers using the 20.4 passenger figure and assuming a similar bus lifespan. If sources provided a different passenger occupancy, the value was converted to reflect 20.4 passengers. Where total mileage where not declared a default value of 800,000 km was assumed.
As shown in Table 4, our results are in line with other literature studies, although a certain degree of variability is observed. This variability is mainly due to differences in the energy mix used and to the assumptions for the maintenance phase, in particular to the number of battery substitutions during the vehicle lifetime. Specifically, Nordelöf et al. [6] shows similar impacts for what concerns vehicle and battery production while much higher impacts of the operational phase due to the higher carbon intensity of the mix used in the study, near to 500 gCO2eq/kWh. Also in O’Connell et al [53] the main contribution to climate change impact category come from electricity production but, in this case, the carbon intensity considered is lower than that adopted in our analysis (197 vs 274 gCO2eq/kWh) resulting in total life cycle impact that are 20% lower than in our study. On the other hand, Syré et al [54], as the other studies in the table, consider higher electricity consumption in driving phase and higher carbon intensity for energy mix, resulting in higher total gCO2eq/p*km emissions.
5. Sensitivity Analysis
The results illustrated in the previous section do depend on several hypotheses and assumptions as illustrated in Chapter 0. Many of these assumptions are designed to fit as safe as possible to the actual Italian situation, in particular for what concerns energy pathways (well to wheel) and consumption. However, change in some of these parameters, although still acceptable in relation to the Italian situation, can lead to significant changes in some impact category results. Moreover, the ISO 14040 Standard recommend performing a sensitivity analysis whenever a comparative LCA is conducted. The parameters that most affect the results are:
- BEB energy consumption: we consider the maximum and minimum energy consumption value found in literature;
- ICEB diesel consumption: we consider the maximum and minimum energy consumption value found in literature;
- Bus total mileage: we consider a scenario of 400,000 according to 40,000 annual mileage (similar for example of those reported for the urban buses in the city of Milan [55]), keeping a 10-year life span;
- Different kinds of fuels, using HVO instead of diesel oil in ICEB;
- Different chemistry for BEB batteries (using LFP derived from [41]);
- Different number of battery changes across the lifetime of the electric bus, respectively no change and two changes instead of one change for NMC batteries;
- Different energy mixes used for BEB battery recharging, namely a dynamic mix considering the evolution of the Italian photovoltaic mix from 2019 to 2030 as modelled in [22] and a dynamic mix of the combined cycle natural gas power plant in Italy considering the evolution from 2019 to 2030 as in [56].Different energy mixes used for BEB battery recharging, namely a dynamic mix considering the evolution of the Italian photovoltaic mix from 2019 to 2030 as modelled in [22] and a dynamic mix of the combined cycle natural gas power plant in Italy considering the evolution from 2019 to 2030 as in [56].
The list of considered scenarios is showed in Table 5.
As regard the LCA modelling of the HVO, we made the following assumptions: the Hydrotreated Vegetable Oil (HVO) released for consumption in Italy is entirely produced from palm oil (44%) and used cooking oil (56%), at Eni’s biorefineries located in Gela and Porto Marghera [57].
The purification/refining and hydrogenation processes of the oils were modelled based on the environmental declaration of the Gela plant [58] and on the inventory data from the Porto Marghera facility taken from Puricelli et al [59]. Both plants produce Diesel-HVO, Naphtha-HVO and LPG-HVO, therefore, material flows were allocated among the different co-products according to their energy content, assumed to be 44 MJ/kg, 45 MJ/kg, and 46 MJ/kg respectively [59]. The modelling of vegetable oils in input to the biorefineries was carried out by considering the country of origin of the raw materials as reported in [57]. Transport processes were modelled throughout all life cycle stages using average background data from Ecoinvent v3.9.1 [25] .
The results of the sensitivity analysis are showed in Table 6 in absolute terms and in Table 7 as a percentage of the ICEB baseline scenario. As can be seen the proposed scenarios can significantly affect the results. Considering shorter total mileage affects in particular Resource use Mineral and Metals, which increases 60% in the case of ICEB (ICEB 2 vs ICEB 1) and 24% for BEB (BEB2 vs BEB1). The higher increase in these impact categories is observed when considering an LFP battery instead of an NMC and the same number of battery changes (BEB LFP1 vs BEB1). This is mainly because of to the gold content in the electronic of the Battery Management System (BMS) which – considering its lower energy density – in higher for LFP batteries and because of high credits in recycling for NMC batteries compared to LFP [41,54]. Considering Climate Change, the higher variations for BEB are due to different energy mixes, scoring the lowest value when using only Photovoltaic energy (BEB PV, for example a night bus recharging during the day) and the highest when using only energy produced in Natural Gas Combined Cycle (BEB CC). On the other hand, ICEV scores the highest impact on Climate Change when considering the highest consumption rate found in literature (ICEB 4) and the lowest when using HVO instead of Diesel Oil (ICEB HVO). It is worth noting that the use of HVO almost doubles the impact on Resource Use Minerals and metals and increases significantly all other impact categories, except for Climate Change and Resource Use - Energy.
As can be noticed also from Table 7 the ranking between BEBs and ICEBs across the various impact categories remains almost unchanged compared to the baseline, regardless the assumptions made in each single scenario. In other words, for the categories for which BEB1 performs better than ICEB1 (such as Climate Change) all BEBs perform better than any ICEBs and for categories where BEB1 performs worse than ICEB1 all BEBs perform worse than any ICEBs. The only noticeable exception is the ICEB HVO, which performs better than many BEBs alternative for Climate Change (e.g. better than BEB2, BEB4 and BEB CC) but worse for what concerns RU-M (e.g. worse than BEB 1, BEB3, BEB4, BEB CC).
Thus, when focusing on Climate Change, the HVO, when available, can be seen as a good solution especially in the short- to mid-term scenario, where the penetration of the renewable energies in the energy mix is still limited.
Of course, where penetration of renewable energy is already relevant BEBs, results in environmentally advantages [60]. HVO should be considered only if costs of BEB outweigh the environmental advantages when compared with HVO ICEB. The graph in Figure 8 illustrates the environmental impact of the different vehicle types—ICEB1 (grey), ICEB HVO (orange), and BEB (green)—across several energy scenarios, including PV, CC, and average IT mixes. Vertical dashed lines mark key emission benchmarks for 2019 and projected values for 2030, highlighting the evolution of energy efficiency and decarbonization potential over time. As can be seen, BEBs outperform Diesel Oil ICEB (ICEB1) whenever carbon intensity of the energy mix is below 950 gCO2eq/kWh (which correspond to a mix including only solid fuels such as hard coal and lignite) and can outperform HVO ICEB whenever the energy mix carbon intensity is near the 2019 Italian mix.
6. Conclusions
This comparative Life Cycle Assessment (LCA) of electric and diesel buses, conducted using the Environmental Footprint (E.F.) 3.0 method, provides a detailed evaluation of the environmental impacts associated with each type of bus. The results show that in the Italian scenario, electric buses offer significant advantages over diesel buses across most impact categories. Specifically, electric buses demonstrate reduced environmental impacts in areas such as climate change (-57%), acidification (-43%), Photochemical Oxidant Formation (-41%) and Particular Matter (-14%). These findings are consistent with other LCA studies, underlying the advantages of BEBs particularly when the carbon footprint of the electricity mix is below 950 gCO2eq/kWh. Moreover, when the electricity mix falls below 369 gCO₂eq/kWh, BEBs can outperform even buses powered by HVO in terms of environmental performances.
However, the study also highlights certain areas where electric buses do not perform as well. Notably, the impact categories of Resource use, minerals and metals, Human toxicity, cancer and Human toxicity, non-cancer show higher impacts for electric buses compared to their diesel counterparts. These findings underscore the importance of considering the entire life cycle of electric buses, including the extraction and processing of raw materials used in battery production and a wide range of impact categories.
Overall, the transition to electric buses presents a promising pathway towards reducing the environmental footprint of public transportation. Nevertheless, it is crucial to address the identified challenges related to resource use and human toxicity to fully realize the environmental benefits of electric buses. Future technological development should focus on improving battery technology also using machine learning to optimise characteristics and maintenance [61]. As regards batteries environmental impacts, it is also crucial to improve recycling processes to mitigate these impacts and enhance the sustainability of electric buses, in particular policy should promote circular economy to reduce the impact on resource use and on use of critical raw materials which are crucial in the energy transition of the transport sector [62,63].
It is important to emphasize that the reduction in urban air pollutants (NOx, PM, ozone precursors) from electric buses can lead to improved respiratory health and lower healthcare costs, benefiting urban populations. As known, this benefit can be evaluated in monetary terms through the monetization of the environmental externalities [64]. In particular for what concerns Climate Change impacts, assuming a social cost of carbon of 208 USD/ton [65], the use of BEB instead of ICEB can lead to avoiding about 130 000 USD of external cost in its entire life.
Future research should also include a TCO analysis comparing electric and diesel buses, factoring in purchase price, maintenance, energy/fuel costs, battery replacement, and end-of-life recycling. This would provide decision-makers with a comprehensive understanding of the financial implications for the vehicle’s lifespan. Finally, although our study relies on detailed data on consumption and emission factors for what concerns diesel buses as well as on detailed data on energy mix and cell production for electric buses, future research would benefit from primary data from bus manufacturers, on battery pack composition and, for electric buses, on road real data on maintenance and consumptions as well as extending the analysis to other energy careers and to scenarios beyond year 2030.
Author Contributions
Conceptualization, P.C Brambilla. and P. Girardi.; methodology, P.C Brambilla.; validation, P. Girardi.; investigation, P.C Brambilla.; data curation, P.C Brambilla.; writing—original draft preparation, P. Girardi.; writing—review and editing, P.C Brambilla.; supervision, P. Girardi.; project administration, P. Girardi. All authors have read and agreed to the published version of the manuscript.”.
Funding
This work has been financed by the Research Fund for the Italian Electrical System under the Three-Year Research Plan 2025-2027 (MASE, Decree n.388 of November 6th, 2024), in compliance with the Decree of April 12th, 2024”.
Data Availability Statement
The raw data supporting the conclusions of this article will be made available by the authors on request.
Acknowledgments
A special thanks to Benedetta Marmiroli and Carmen Ferrara for their support in modelling the LCA of Hydrogenated Vegetable Oil (HVO). During the preparation of this manuscript, the authors used Microsoft 365 Copilot for translating sentences from Italian and\or for improving English clarity. The authors have reviewed and edited the output and take full responsibility for the content of this publication.
Conflicts of Interest
The authors declare no conflicts of interest.
Abbreviations
The following abbreviations are used in this manuscript:
| A | Acidification |
| AE | Accumulated Exceedance |
| BMS | Battery Management System |
| BOM | Bill Of Materials |
| CC | Climate Change |
| CLCC | Commodity Life Cycle Costing |
| CTUh | Comparative Toxic Unit for human |
| EEA | European Environment Agency |
| EF | Environmental Footprint |
| EMEP | European Monitoring and Evaluation Programme |
| EPD | Environmental product Declaration |
| GREET | The Greenhouse gases, Regulated Emissions, and Energy use in Technologies Model |
| GWP100 | Global Warming Potential 100 years |
| HT-C | Human toxicity, cancer |
| HT-NC | Human toxicity, non-cancer |
| IPCC | Intergovernmental Panel on Climate Change |
| LCA | Life Cycle Assessment |
| LCIA | Life Cycle Impact Assessment |
| MHDV | Medium Heavy-Duty Vehicles |
| NMC 712 | Lithium Nickel Manganese Cobalt oxide LiNi0.7Mn0.1Co0.2 |
| PM | Particulate matter |
| POF | Photochemical ozone formation |
| RU-F | Resource use, fossils |
| RU-M | Resource use, minerals and metals |
| RdS | Ricerca di Sistema |
| RSE | Ricerca Sistema Energetico |
| TPL | Trasporto Pubblico Locale |
Appendix A. Life Cycle Inventory additional information
Appendix A.1 Buses Composition
Below are detailed supplementary notes which integrate the modelling framework described in Chapter 0.
Table A1 provides a list of components included in the GREET model and their respective descriptions. These components served as the foundational basis for the modelling of bus BOMs.

Table A1.
Systems and subsystems present in GREET used to model Urban Buses in the present work.
| System | Subsystems | Description of Individual Parts |
|---|---|---|
| Body system | Cab-in-white | Primary MHDV structure, i.e., a single-body assembly to which the other major components are attached |
| Body Panels and Fairings | Closure and hang-on panels, including hood, roof, decklid, doors, quarter panels, and fenders, as well as fairings | |
| Front/Rear Bumpers | Impact bars, energy absorbers, and mounting hardware | |
| Glass | Front windshield, and windows (door, side, and sleeper) | |
| Lighting | Exterior: Head lamps, fog lamps, turn signals, side markers, front top markers, and rear light assemblies Interior: Wiring and controls for interior lighting, instrumentation, and power accessories |
|
| Heating, Ventilation, Air Conditioning (HVAC) Module | Air flow system, heating system, and air conditioning system (includes a condenser, fan, heater, ducting, and controls) | |
| Seating and Restraint System | Seat tracks, seat frames, foam, trim, restraints, anchors, head restraints, arm rests, seat belts, tensioners, clips, air bags, and sensor assemblies | |
| Door Module | Door insulation, trim assemblies, speaker grills, and switch panels and handles (door panels are part of body panels) | |
| Instrument Panel | Panel structure, knee bolsters and brackets, instrument cluster (including switches), exterior surface, console storage, glove box panels, glove box assembly and exterior, and top cover | |
| Trim and Insulation | Emergency brake cover, switch panels, ash trays, cup holders, headliner assemblies, overhead console assemblies, assist handles, overhead storage, pillar trim, sun visors, carpet/rubber, padding, insulation, and accessory mats | |
| Body Hardware | Miscellaneous body components | |
| Powertrain system | Engine Unit | Engine block, cylinder heads, shafts, fuel injection, engine air system, ignition system, manifolds, alternator, containers and pumps for the lubrication system, gaskets, and seals |
| Engine Fuel Storage System | Fuel tank, tank mounting straps, tank shield, insulation, filling piping, and supply piping | |
| Powertrain Thermal System | Water pump, radiator, and fan | |
| Exhaust System | Catalytic converter, muffler, heat shields, and exhaust piping | |
| Powertrain Electrical System | Control wiring, sensors, switches, and processors | |
| Emission Control Electronics | Sensors, processors, and engine emission feedback equipment | |
| Transmission Unit | Clutch, gear box, final drive, and controls Use of automated manual transmission system |
|
| Chassis system | Cradle | Frame assembly, front rails and cross-members, and cab and body brackets (the cradle bolts to cab-in-white and supports the mounting of engine) |
| Driveshaft/Axle/ Inter-axle Shaft | Propeller shaft that connects gearbox to the differential Half shaft that connects wheels to the differential; Shafts that connect front and rear parts of a tandem drive axle | |
| Axles | Steer (single) and drive (tandem) axles | |
| Differential | A gear set that transmits energy from driveshaft to axles and allows for each of the driving wheels to rotate at different speeds while supplying them with an equal amount of torque | |
| Suspensions | Upper and lower shock brackets, shock absorbers, springs, steering knuckle, and stabilizer shaft | |
| Braking System | Hub, disc, rotor, splash shield, and calipers | |
| Wheels and Tires | Steer and drive axle wheels and tires | |
| Auxiliary | Steering wheel, column, joints, linkages, bushes, housings, and hydraulic- assist equipment | |
| Electric drive system | Generator | Power converter that takes mechanical energy from the engine and produces electrical energy to recharge batteries and power the electric motor for series |
| Electric drive system | Traction Motor | Electric motor used to drive the wheels |
| Electric drive system | Electronic Controller | Power controller/phase inverter system that converts power between the batteries and motor/generators for electric drive vehicles |
| Battery system | ICEV | Pb-acid battery to handle startup and accessory load |
| Battery system | EV | Pb-acid battery to handle mainly startup load, Li-ion battery for use in electric drive system |
| Fluid system | ICEV | Engine oil, engine/powertrain coolant with coolant cleaner, brake fluid, windshield fluid, transmission fluid, power steering fluid, lubricant oils, and adhesives |
| Fluid system | EV | Powertrain coolant with coolant cleaner, power steering fluid, brake fluid, transmission fluid, windshield fluid, lubricant oils, adhesives |
| Van/Box system | Body | Front, sides, floor, and roof of van/box, along with auxiliary parts |
| Lift-gates system | Lift-gates | Gates used for loading/unloading of goods, along with their hydraulic systems and other constituent parts |
The composition by material of the constituent components of the electric and diesel buses is presented in Table A2 and Table A3, respectively. This composition is the result of an elaboration of data published by GREET for the MHDV model, designated as Class 6 PhD, and is based on the findings of the Environmental Product Declaration (EPD) for the Solaris Urbino 12 hybrid bus manufactured by Solaris [28].
Table A2.
Material composition of the components of the electric bus.
| System | Material | Mass (kg) |
|---|---|---|
| Body | 5.05E+03 | |
| Cast aluminum | 2.39E+02 | |
| Copper | 2.37E+01 | |
| Cotton paper | 6.21E+00 | |
| Glass | 3.63E+02 | |
| Glass fiber-reinforced plastic | 7.65E+02 | |
| Graphite | 7.50E+00 | |
| Latex | 2.21E+02 | |
| Leather | 1.15E+02 | |
| Plastic | 6.76E+02 | |
| Rubber | 1.36E+02 | |
| Silica | 7.50E+00 | |
| Stainless steel | 1.84E+02 | |
| Steel | 1.88E+03 | |
| Wrought aluminum | 4.27E+02 | |
| Chassis (w/o battery) | 3.72E+03 | |
| Brass | 2.78E-01 | |
| Cast aluminum | 1.89E+02 | |
| Cast iron | 3.43E+02 | |
| Copper | 8.83E-01 | |
| Magnet | 5.37E-01 | |
| Plastic | 2.17E+00 | |
| Rubber | 2.50E+02 | |
| Steel | 2.93E+03 | |
| Electronic Controller | 1.30E+01 | |
| Alumina | 3.89E-02 | |
| Average Plastic | 1.31E-01 | |
| Cast aluminum | 6.95E+00 | |
| Copper/Brass | 3.95E+00 | |
| Epoxy resin | 2.55E-02 | |
| Fiberglass | 8.04E-02 | |
| Nickel | 2.14E-02 | |
| Nylon | 9.38E-03 | |
| PET | 3.59E-01 | |
| Polypropylene | 5.12E-01 | |
| Polyurethane | 2.55E-01 | |
| Rubber | 1.61E-01 | |
| Steel | 3.66E-01 | |
| Zinc | 1.33E-01 | |
| Zinc oxide | 2.68E-03 | |
| Lead-Acid Battery | 3.13E+01 | |
| Fiberglass | 6.63E-01 | |
| Lead | 2.18E+01 | |
| Plastic (polypropylene) | 1.92E+00 | |
| Sulfuric Acid | 2.49E+00 | |
| Water | 4.45E+00 | |
| Li-Ion Battery | 3.00E+03 | |
| Traction Motor | 1.34E+02 | |
| Cast aluminum | 4.23E+01 | |
| Copper/Brass | 1.16E+01 | |
| Enamel | 5.23E-01 | |
| Epoxy resin | 1.03E+00 | |
| Glass fiber | 1.34E-02 | |
| Methacrylate ester resin | 1.74E-01 | |
| Mica | 4.02E-02 | |
| Nd(Dy)FeB magnet | 3.85E+00 | |
| Nickel | 4.02E-02 | |
| Nylon | 1.34E-02 | |
| Paint/Varnish | 4.29E-01 | |
| PBT | 2.14E-01 | |
| PET | 4.29E-01 | |
| Phenolic resin | 6.70E-02 | |
| Silicone | 5.36E-02 | |
| Stainless steel | 8.98E-01 | |
| Steel | 7.23E+01 | |
| Zinc | 1.34E-02 | |
| Transmission System/Gearbox | 9.00E+01 | |
| Brass | 1.95E-01 | |
| Cast aluminum | 5.28E+00 | |
| Cast iron | 2.18E+01 | |
| Magnet | 1.90E-02 | |
| Plastic | 9.55E-02 | |
| Rubber | 9.55E-02 | |
| Steel | 6.21E+01 | |
| Wrought aluminum | 3.60E-01 | |
| Fluids | 8.76E+01 | |
| Steer axle | 7.00E+00 | |
| Drive axle | 5.87E+00 | |
| Inter-axle/Drive shafts | 1.40E+01 | |
| Wheel-end: Steer axle | 8.62E+00 | |
| Wheel-end: Drive axle | 8.62E+00 | |
| Transmission Fluid | 2.35E+00 | |
| Powertrain Coolant | 1.68E+01 | |
| Coolant cleaner | 1.71E+01 | |
| Windshield Fluid | 7.19E+00 | |
| Total | 1.21E+04 |
Table A3.
Material composition of the components of the Diesel bus.
| System | Material | Mass(kg) |
|---|---|---|
| Body | 5.05E+03 | |
| Cast aluminum | 2.39E+02 | |
| Copper | 2.37E+01 | |
| Cotton paper | 6.21E+00 | |
| Glass | 3.63E+02 | |
| Glass fiber-reinforced plastic | 7.65E+02 | |
| Graphite | 7.50E+00 | |
| Latex | 2.21E+02 | |
| Leather | 1.15E+02 | |
| Magnet | 0.00E+00 | |
| Plastic | 6.76E+02 | |
| Rubber | 1.36E+02 | |
| Silica | 7.50E+00 | |
| Stainless steel | 1.84E+02 | |
| Steel | 1.88E+03 | |
| Wrought aluminum | 4.27E+02 | |
| Chassis (w/o battery) | 3.72E+03 | |
| Brass | 2.78E-01 | |
| Cast aluminum | 1.89E+02 | |
| Cast iron | 3.43E+02 | |
| Copper | 8.83E-01 | |
| Magnet | 5.37E-01 | |
| Plastic | 2.17E+00 | |
| Rubber | 2.50E+02 | |
| Steel | 2.93E+03 | |
| Lead-Acid Battery | 6.26E+01 | |
| Fiberglass | 1.33E+00 | |
| Lead | 4.35E+01 | |
| Plastic (polypropylene) | 3.85E+00 | |
| Sulfuric Acid | 4.98E+00 | |
| Water | 8.90E+00 | |
| Powertrain System (including BOP) | 6.45E+02 | |
| Bronze | 5.05E-02 | |
| Cast aluminum | 2.69E+01 | |
| Cast iron | 2.37E+02 | |
| Ceramic | 4.75E+01 | |
| Copper & Brass | 1.96E-01 | |
| Graphite | 1.88E-02 | |
| Nichrome | 1.68E+00 | |
| Plastic | 4.29E+01 | |
| Platinum | 3.16E-01 | |
| Rubber | 2.06E+00 | |
| Stainless steel | 2.67E+01 | |
| Steel | 1.85E+02 | |
| Wrought aluminum | 7.42E+01 | |
| Transmission System/Gearbox | 2.21E+02 | |
| Brass | 4.78E-01 | |
| Cast aluminum | 1.30E+01 | |
| Cast iron | 5.36E+01 | |
| Magnet | 4.67E-02 | |
| Plastic | 2.35E-01 | |
| Rubber | 2.35E-01 | |
| Steel | 1.53E+02 | |
| Wrought aluminum | 8.84E-01 | |
| Fluids | 1.24E+02 | |
| Engine Oil | 1.53E+01 | |
| Steer axle | 7.00E+00 | |
| Drive axle | 5.87E+00 | |
| Inter-axle/Drive shafts | 1.40E+01 | |
| Wheel-end: Steer axle | 8.62E+00 | |
| Wheel-end: Drive axle | 8.62E+00 | |
| Transmission Fluid | 7.65E+00 | |
| Powertrain Coolant | 2.45E+01 | |
| Coolant cleaner | 2.50E+01 | |
| Windshield Fluid | 7.19E+00 | |
| Total | 9.82E+03 |
Table A 4 presents the components replaced during maintenance and the number of replacements carried out over the service life of the vehicle. The values were calculated, based on those published by GREET, considering the assumed service life for the buses.
Table A4.
Components replaced during maintenance and the number of replacements performed.
| Type of component | Spare parts | N. substitution |
|---|---|---|
| Fluids | ||
| Engine Oil (ICEB only) | 13 | |
| Steer axle | 6 | |
| Drive axle | 0 | |
| Inter-axle/Drive shafts | 16 | |
| Wheel-end: Steer axle | 0 | |
| Wheel-end: Drive axle | 0 | |
| Transmission Fluid | 5 | |
| Powertrain Coolant | 2 | |
| Coolant cleaner | 2 | |
| Windshield Fluid | 73 | |
| Battery | ||
| Lead Acid | 6 | |
| Li-Ion | 1 | |
| Tyre | ||
| Steer Tire | 3 | |
| Drive Tyre | 2 | |
| Other components | ||
| Windshield Wiper Blades | 25 | |
| Engine oil filter (ICEB only) | 10 |
Table A5.
Comparison among GREET Class6_PnD_Electric_Truck and Electric Bus Materials assumed in the present study.
Table A5.
Comparison among GREET Class6_PnD_Electric_Truck and Electric Bus Materials assumed in the present study.
| Material | Component | Class6_PnD_Electric_Truck | Electric Bus |
|---|---|---|---|
| Steel | Body | 389.5 | 1875.3 |
| Stainless steel | Body | 38.2 | 183.8 |
| Wrought aluminum | Body | 88.7 | 427.0 |
| Cast aluminum | Body | 49.7 | 239.4 |
| Plastic | Body | 171.3 | 676.3 |
| Rubber | Body | 28.9 | 135.8 |
| Glass fiber-reinforced plastic | Body | 193.7 | 764.5 |
| Glass | Body | 109.3 | 363.5 |
| Copper | Body | 4.9 | 23.7 |
| Latex | Body | 0.0 | 221.2 |
| Leather | Body | 13.7 | 114.9 |
| Graphite | Body | 1.6 | 7.5 |
| Silica | Body | 1.6 | 7.5 |
| Cotton paper | Body | 0.7 | 6.2 |
| Steel | Transmission System/Gearbox | 62.1 | 62.1 |
| Cast aluminum | Transmission System/Gearbox | 5.3 | 5.3 |
| Wrought aluminum | Transmission System/Gearbox | 0.4 | 0.4 |
| Cast iron | Transmission System/Gearbox | 21.8 | 21.8 |
| Rubber | Transmission System/Gearbox | 0.1 | 0.1 |
| Plastic | Transmission System/Gearbox | 0.1 | 0.1 |
| Brass | Transmission System/Gearbox | 0.2 | 0.2 |
| Magnet | Transmission System/Gearbox | 0.0 | 0.0 |
| Steel | Chassis (w/o battery) | 2151.5 | 2932.5 |
| Cast iron | Chassis (w/o battery) | 251.4 | 342.6 |
| Cast aluminum | Chassis (w/o battery) | 138.7 | 189.0 |
| Rubber | Chassis (w/o battery) | 249.6 | 249.6 |
| Plastic | Chassis (w/o battery) | 1.6 | 2.2 |
| Copper | Chassis (w/o battery) | 0.6 | 0.9 |
| Brass | Chassis (w/o battery) | 0.2 | 0.3 |
| Magnet | Chassis (w/o battery) | 0.4 | 0.5 |
| Steel | Traction Motor | 72.3 | 72.3 |
| Cast aluminum | Traction Motor | 42.3 | 42.3 |
| Copper/Brass | Traction Motor | 11.6 | 11.6 |
| Stainless steel | Traction Motor | 0.9 | 0.9 |
| Nd(Dy)FeB magnet | Traction Motor | 3.8 | 3.8 |
| Phenolic resin | Traction Motor | 0.1 | 0.1 |
| Enamel | Traction Motor | 0.5 | 0.5 |
| Nickel | Traction Motor | 0.0 | 0.0 |
| PET | Traction Motor | 0.4 | 0.4 |
| PBT | Traction Motor | 0.2 | 0.2 |
| Mica | Traction Motor | 0.0 | 0.0 |
| Fiberglass | Traction Motor | 0.0 | 0.0 |
| Silicone | Traction Motor | 0.1 | 0.1 |
| Epoxy resin | Traction Motor | 1.0 | 1.0 |
| Nylon | Traction Motor | 0.0 | 0.0 |
| Methacrylate ester resin | Traction Motor | 0.2 | 0.2 |
| Paint/Varnish | Traction Motor | 0.4 | 0.4 |
| Zinc | Traction Motor | 0.0 | 0.0 |
| Others | Traction Motor | 0.0 | 0.0 |
| Steel | Electronic Controller | 0.4 | 0.4 |
| Cast aluminum | Electronic Controller | 6.7 | 6.7 |
| Copper/Brass | Electronic Controller | 3.8 | 3.8 |
| Rubber | Electronic Controller | 0.2 | 0.2 |
| Average Plastic | Electronic Controller | 0.1 | 0.1 |
| Alumina | Electronic Controller | 0.0 | 0.0 |
| Epoxy resin | Electronic Controller | 0.0 | 0.0 |
| Fiberglass | Electronic Controller | 0.1 | 0.1 |
| Nickel | Electronic Controller | 0.0 | 0.0 |
| Nylon | Electronic Controller | 0.0 | 0.0 |
| PET | Electronic Controller | 0.3 | 0.3 |
| Polypropylene | Electronic Controller | 0.5 | 0.5 |
| Polyurethane | Electronic Controller | 0.2 | 0.2 |
| Zinc | Electronic Controller | 0.1 | 0.1 |
| Zinc oxide | Electronic Controller | 0.002600317 | 0.002600317 |
| Others | Electronic Controller | 0.39004749 | 0.39004749 |
| Stainless steel | Body | 1.785330581 | 0 |
| Steel | Body | 235.6564766 | 0 |
| Cast aluminum | Body | 7.696758504 | 0 |
| Wrought aluminum | Body | 999.8278372 | 0 |
| Wood | Body | 882.8732775 | 0 |
| Rubber | Body | 28.56604307 | 0 |
| Plastic | Body | 3.324537116 | 0 |
| Copper | Body | 4.508021914 | 0 |
| Brass | Body | 0.296563246 | 0 |
| Steel | Body | 600.8933368 | 0 |
| Plastic (polypropylene) | Lead-Acid Battery | 1.909168728 | 1.909168728 |
| Lead | Lead-Acid Battery | 21.59551512 | 21.59551512 |
| Sulfuric Acid | Lead-Acid Battery | 2.472529992 | 2.472529992 |
| Fiberglass | Lead-Acid Battery | 0.657254808 | 0.657254808 |
| Water | Lead-Acid Battery | 4.412996568 | 4.412996568 |
| Others | Lead-Acid Battery | 0.250382784 | 0.250382784 |
| Li-Ion | Li-Ion Battery | 2254.237069 | 2995 |
| Fluids | Fluids | 87.60411447 | 87.60411447 |
| Total | 9261.597007 | 12115 |
Table A6.
Comparison among GREET Class6_PnD_diesel_Truck and Diesel Bus Materials assumed in the present study.
Table A6.
Comparison among GREET Class6_PnD_diesel_Truck and Diesel Bus Materials assumed in the present study.
| Material | Component | Class6_PnD_Diesel_Truck | Diesel Bus |
|---|---|---|---|
| Steel | Body | 389.5 | 1875.3 |
| Stainless steel | Body | 38.2 | 183.8 |
| Wrought aluminum | Body | 88.7 | 427.0 |
| Cast aluminum | Body | 49.7 | 239.4 |
| Plastic | Body | 171.3 | 676.3 |
| Rubber | Body | 28.9 | 135.8 |
| Glass fiber-reinforced plastic | Body | 193.7 | 764.5 |
| Glass | Body | 109.3 | 363.5 |
| Copper | Body | 4.9 | 23.7 |
| Latex | Body | 0.0 | 221.2 |
| Leather | Body | 13.7 | 114.9 |
| Graphite | Body | 1.6 | 7.5 |
| Silica | Body | 1.6 | 7.5 |
| Cotton paper | Body | 0.7 | 6.2 |
| Stainless steel | Powertrain System (including BOP) | 26.7 | 19.9 |
| Steel | Powertrain System (including BOP) | 185.0 | 137.8 |
| Cast aluminum | Powertrain System (including BOP) | 26.9 | 20.0 |
| Wrought aluminum | Powertrain System (including BOP) | 74.2 | 55.2 |
| Cast iron | Powertrain System (including BOP) | 237.4 | 176.8 |
| Rubber | Powertrain System (including BOP) | 2.1 | 1.5 |
| Plastic | Powertrain System (including BOP) | 42.9 | 32.0 |
| Copper & Brass | Powertrain System (including BOP) | 0.2 | 0.1 |
| Bronze | Powertrain System (including BOP) | 0.1 | 0.0 |
| Graphite | Powertrain System (including BOP) | 0.0 | 0.0 |
| Nichrome | Powertrain System (including BOP) | 1.7 | 1.3 |
| Platinum | Powertrain System (including BOP) | 0.3 | 0.2 |
| Ceramic | Powertrain System (including BOP) | 47.5 | 35.4 |
| Steel | Transmission System/Gearbox | 152.6 | 113.6 |
| Cast aluminum | Transmission System/Gearbox | 13.0 | 9.7 |
| Wrought aluminum | Transmission System/Gearbox | 0.9 | 0.7 |
| Cast iron | Transmission System/Gearbox | 53.6 | 39.9 |
| Rubber | Transmission System/Gearbox | 0.2 | 0.2 |
| Plastic | Transmission System/Gearbox | 0.2 | 0.2 |
| Brass | Transmission System/Gearbox | 0.5 | 0.4 |
| Magnet | Transmission System/Gearbox | 0.0 | 0.0 |
| Steel | Chassis (w/o battery) | 2151.5 | 2932.5 |
| Cast iron | Chassis (w/o battery) | 251.4 | 342.6 |
| Cast aluminum | Chassis (w/o battery) | 138.7 | 189.0 |
| Rubber | Chassis (w/o battery) | 249.6 | 249.6 |
| Plastic | Chassis (w/o battery) | 1.6 | 2.2 |
| Copper | Chassis (w/o battery) | 0.6 | 0.9 |
| Brass | Chassis (w/o battery) | 0.2 | 0.3 |
| Magnet | Chassis (w/o battery) | 0.4 | 0.5 |
| Stainless steel | Body | 1.8 | 0.0 |
| Steel | Body | 235.7 | 0.0 |
| Cast aluminum | Body | 7.7 | 0.0 |
| Wrought aluminum | Body | 999.8 | 0.0 |
| Wood | Body | 882.9 | 0.0 |
| Rubber | Body | 28.6 | 0.0 |
| Plastic | Body | 3.3 | 0.0 |
| Copper | Body | 4.5 | 0.0 |
| Brass | Body | 0.3 | 0.0 |
| Steel | Body | 600.9 | 0.0 |
| Plastic (polypropylene) | Lead-Acid Battery | 3.8 | 3.8 |
| Lead | Lead-Acid Battery | 43.2 | 43.2 |
| Sulfuric Acid | Lead-Acid Battery | 4.9 | 4.9 |
| Fiberglass | Lead-Acid Battery | 1.3 | 1.3 |
| Water | Lead-Acid Battery | 8.8 | 8.8 |
| Others | Lead-Acid Battery | 0.5 | 0.5 |
| Fluids | Fluids | 123.7 | 123.7 |
| Total | 7703.8 | 9595.3 |
Appendix B. Monte Carlo Analysis
Table B1 Shows energy consumption for diesel and electric buses reported in several literature studies.
Table B1.
Energy consumption for diesel and electric buses literature.
| Diesel (l/100km) |
Elettrico (kWh/100km) |
|
|---|---|---|
| Nordelöf et al, 2019 [6] | 45 | 110 |
| Basma et al., 2020 [66] | 55.7 | 170 |
| ISPRA 2020 [49] | 38.04 | n.a. |
| Ecoinvent [25] | 63.17 | n.a. |
| Jakub et al., 2022 [8] | 42 | 150 |
| Luu et al., 2022[30] | 26 | 136 |
| Mastinu e Solari, 2022 [18] | n.a. | 125 |
| Green Bocconi, 2021 [67] | n.a. | 115 |
| Söderena et al., 2019 [68] | 28 | n.a. |
| Motus-E, 2022 [5] | n.a. | 127 |
| Zhou et al., 2016 [69] | 138 | |
| Zhou et al 2016 [69] | 175 | |
| Zhao et al., 2021 [7] | 29.20 | 120 |
| Doulgeris et al., 2024 [70] | n.a. | 96 |
| Doulgeris et al., 2024 [70] | n.a. | 220 |
| Min value | 26 | 96 |
| Max value | 63.17 | 220 |
| Best guess value | 38.04 | 115 |
The robustness of the ranking obtained for the performance of the buses was assessed through an uncertainty analysis based on the Monte Carlo method. For this purpose, it was assumed that consumption values follow a triangular probability distribution, with minimum and maximum values corresponding to the lowest and highest values (for the two vehicles) found in the literature. The simulation was carried out with 10,000 iterations and a confidence level of 95%.
Figure B1 presents the results of the Monte Carlo analysis for the transportation of one passenger over one kilometer using an electric bus (A) and a diesel bus (B), taking into account the impact categories of the EF 3.0 method.
Figure B1.
Monte Carlo analysis for the transport of 1 passenger-kilometer with electric and diesel buses. The values shown represent the probability of the difference between the potential impacts of the electric bus (A) and those of the diesel bus (B).
Figure B1.
Monte Carlo analysis for the transport of 1 passenger-kilometer with electric and diesel buses. The values shown represent the probability of the difference between the potential impacts of the electric bus (A) and those of the diesel bus (B).
The analysis reveals that, for all indicators except human non-carcinogenic toxicity, the ranking established by the baseline assessment is confirmed. For instance, regarding the Climate Change indicator (as reported in the graph), the probability that the value calculated for the electric bus is lower than that for the diesel bus (A < B) is 100%. A similar result is observed for the impact categories Acidification, Resource Use–Fossil, Particulate Matter, and Photochemical Ozone Formation. Conversely, there is a small probability (4.6%) that the human non-carcinogenic toxicity associated with the electric bus is lower than that due to the diesel bus. Lastly, the probability that the impact categories Resource Use–Minerals and Metals and Human Toxicity–Cancer are in favor of the electric bus is zero
References
- European Environment Agency Digitalisation in the Mobility System: Challenges and Opportunities; Transport and environment report; European Environment Agency: Luxembourg, 2022.
- European Commission, Directorate-General for Mobility and Transport EU Transport in Figures – Statistical Pocketbook 2023 2023.
- The European Green Deal - European Commission. Available online: https://commission.europa.eu/strategy-and-policy/priorities-2019-2024/european-green-deal_en (accessed on 29 December 2023).
- Transport and the Green Deal - European Commission Available online: https://commission.europa.eu/strategy-and-policy/priorities-2019-2024/european-green-deal/transport-and-green-deal_en.
- Motus-E Autobus Elettrici Nel Trasporto Pubblico. Un Vademecum 2022.
- Nordelöf, A.; Romare, M.; Tivander, J. Life Cycle Assessment of City Buses Powered by Electricity, Hydrogenated Vegetable Oil or Diesel. Transportation Research Part D: Transport and Environment 2019, 75, 211–222. [Google Scholar] [CrossRef]
- Zhao, E.; Walker, P.; Surawski, N. Emissions Life Cycle Assessment of Diesel, Hybrid and Electric Buses. Proceedings of the Institution of Mechanical Engineers, Part D: Journal of Automobile Engineering 2021, 236, 095440702110343. [Google Scholar] [CrossRef]
- Szczurowski, J.; Lubeck, A.; Bałys, M.; Brodawka, E.; Zarębska, K. Life Cycle Assessment Study on the Public Transport Bus Fleet Electrification in the Context of Sustainable Urban Development Strategy. Science of The Total Environment 2022, 824, 153872. [Google Scholar] [CrossRef]
- Lubecki, A.; Szczurowski, J.; Zarębska, K. A Comparative Environmental Life Cycle Assessment Study of Hydrogen Fuel, Electricity and Diesel Fuel for Public Buses. Applied Energy 2023, 350, 121766. [Google Scholar] [CrossRef]
- Cooney, G.; Hawkins, T.R.; Marriott, J. Life Cycle Assessment of Diesel and Electric Public Transportation Buses. Journal of Industrial Ecology 2013, 17, 689–699. [Google Scholar] [CrossRef]
- DIRETTIVA (UE) 2019/1161 DEL PARLAMENTO EUROPEO E DEL CONSIGLIO Del 20 Giugno 2019 Che Modifica La Direttiva 2009/33/CE Relativa Alla Promozione Di Veicoli Puliti e a Basso Consumo Energetico Nel Trasporto Su Strada; 2019; Vol. PE/57/2019/REV/2.
- Decreto Legislativo Del 09/11/2021 n. 187 - Attuazione Della Direttiva (UE) 2019/1161 Che Modifica La Direttiva 2009/33/CE Relativa Alla Promozione Di Veicoli Puliti e a Basso Consumo Energetico Nel Trasporto Su Strada.; 284 AD.
- Commission Recommendation (EU) 2021/2279 of 15 December 2021 on the Use of the Environmental Footprint Methods to Measure and Communicate the Life Cycle Environmental Performance of Products and Organisations; 2021; Vol. 471.
- Garcia, R.; Marques, P.; Freire, F. Life-Cycle Assessment of Electricity in Portugal. Applied Energy 2014, 134, 563–572. [Google Scholar] [CrossRef]
- Iannuzzi, L.; Hilbert, J.A.; Silva Lora, E.E. Life Cycle Assessment (LCA) for Use on Renewable Sourced Hydrogen Fuel Cell Buses vs Diesel Engines Buses in the City of Rosario, Argentina. International Journal of Hydrogen Energy 2021, 46, 29694–29705. [Google Scholar] [CrossRef]
- Jelti, F.; Allouhi, A.; Al-Ghamdi, S.G.; Saadani, R.; Jamil, A.; Rahmoune, M. Environmental Life Cycle Assessment of Alternative Fuels for City Buses: A Case Study in Oujda City, Morocco. International Journal of Hydrogen Energy 2021, 46, 25308–25319. [Google Scholar] [CrossRef]
- Gabriel, N.R.; Martin, K.K.; Haslam, S.J.; Faile, J.C.; Kamens, R.M.; Gheewala, S.H. A Comparative Life Cycle Assessment of Electric, Compressed Natural Gas, and Diesel Buses in Thailand. Journal of Cleaner Production 2021, 314, 128013. [Google Scholar] [CrossRef]
- Mastinu, G.; Solari, L. Electric and Biomethane-Fuelled Urban Buses: Comparison of Environmental Performance of Different Powertrains. Int J Life Cycle Assess 2022, 27, 238–254. [Google Scholar] [CrossRef]
- Al-Ogaili, A.S.; Al-Shetwi, A.Q.; Sudhakar Babu, T.; Hoon, Y.; Abdullah, M.A.; Alhasan, A.; Al-Sharaa, A. Electric Buses in Malaysia: Policies, Innovations, Technologies and Life Cycle Evaluations. Sustainability 2021, 13, 11577. [Google Scholar] [CrossRef]
- Gargiulo, A.; Carvalho, M.L.; Girardi, P. Life Cycle Assessment of Italian Electricity Scenarios to 2030. Energies 2020, 13, 3852. [Google Scholar] [CrossRef]
- Carvalho, M.L.; Marmiroli, B.; Girardi, P. Life Cycle Assessment of Italian Electricity Production and Comparison with the European Context. Energy Reports 2022, 8, 561–568. [Google Scholar] [CrossRef]
- Ferrara, C.; Marmiroli, B.; Carvalho, M.L.; Girardi, P. Life Cycle Assessment of Photovoltaic Electricity Production in Italy: Current Scenario and Future Developments. Science of The Total Environment 2024, 948, 174846. [Google Scholar] [CrossRef]
- García, A.; Monsalve-Serrano, J.; Lago Sari, R.; Tripathi, S. Life Cycle CO₂ Footprint Reduction Comparison of Hybrid and Electric Buses for Bus Transit Networks. Applied Energy 2022, 308, 118354. [Google Scholar] [CrossRef]
- Girardi, P.; Gargiulo, A.; Brambilla, P.C. A Comparative LCA of an Electric Vehicle and an Internal Combustion Engine Vehicle Using the Appropriate Power Mix: The Italian Case Study. Int J Life Cycle Assess 2015, 20, 1127–1142. [Google Scholar] [CrossRef]
- Wernet, G.; Bauer, C.; Steubing, B.; Reinhard, J.; Moreno-Ruiz, E.; Weidema, B. The Ecoinvent Database Version 3 (Part I): Overview and Methodology. Int J Life Cycle Assess 2016, 21, 1218–1230. [Google Scholar] [CrossRef]
- ISO - International Organization for Standardization ISO 14040:2006: Environmental Management — Life Cycle Assessment — Principles and Framework; ISO 14040:2006; 2006.
- Ekvall, T.; Azapagic, A.; Finnveden, G.; Rydberg, T.; Weidema, B.P.; Zamagni, A. Attributional and Consequential LCA in the ILCD Handbook. Int J Life Cycle Assess 2016, 21, 293–296. [Google Scholar] [CrossRef]
- The International EPD System Environmental Product Declaration According to ISO 14025 for: Solaris Urbino 12 Hybrid Bus; S-P-05600; 2022.
- Directorate-General for Climate Action (European Commission); Ricardo Energy & Environment; Hill, N.; Amaral, S.; Morgan-Price, S.; Nokes, T.; Bates, J.; Helms, H.; Fehrenbach, H.; Biemann, K.; et al. Determining the Environmental Impacts of Conventional and Alternatively Fuelled Vehicles through LCA: Final Report; Publications Office of the European Union: LU, 2020; ISBN 978-92-76-20301-8.
- Luu, L.Q.; Riva Sanseverino, E.; Cellura, M.; Nguyen, H.-N.; Tran, H.-P.; Nguyen, H.A. Life Cycle Energy Consumption and Air Emissions Comparison of Alternative and Conventional Bus Fleets in Vietnam. Energies 2022, 15, 7059. [Google Scholar] [CrossRef]
- Delle Monache, A.; Marmiroli, B.; Luciano, N.; Carvalho, M.L.; Girardi, P.; Dotelli, G.; Franzò, S. Influence of Thermoelectric Generation Primary Data and Allocation Methods on Life Cycle Assessment of the Electricity Generation Mix: The Case of Italy. In Proceedings of the Sustainable Development with Renewable Energy; Caetano, N.S., Ed.; Springer Nature Switzerland: Cham, 2024; pp. 417–428.
- Fazio, S.; Biganzoli, F.; De Laurentiis, V.; Zampori, L.; Sala, S.; Diaconu, E. Supporting Information to the Characterisation Factors of Recommended EF Life Cycle Impact Assessment Methods; European Union, Luxembourg, 2018, 2019.
- Stocker, T.F.; Qin, D.; Plattner, G.-K.; Tignor, M.; Allen, S.K.; Boschung, J.; Nauels, A.; Xia, Y.; Bex, V.; Midgley, P.M. Climate Change 2013: The Physical Science Basis. Contribution of Working Group I to the Fifth Assessment Report of the Intergovernmental Panel on Climate Change; Cambridge University Press, Cambridge, United Kingdom and New York, NY, USA, 1535 pp.
- van Zelm, R.; Huijbregts, M.A.J.; den Hollander, H.A.; van Jaarsveld, H.A.; Sauter, F.J.; Struijs, J.; van Wijnen, H.J.; van de Meent, D. European Characterization Factors for Human Health Damage of PM10 and Ozone in Life Cycle Impact Assessment. Atmospheric Environment 2008, 42, 441–453. [Google Scholar] [CrossRef]
- Posch, M.; Seppälä, J.; Hettelingh, J.-P.; Johansson, M.; Margni, M.; Jolliet, O. The Role of Atmospheric Dispersion Models and Ecosystem Sensitivity in the Determination of Characterisation Factors for Acidifying and Eutrophying Emissions in LCIA. Int J Life Cycle Assess 2008, 13, 477–486. [Google Scholar] [CrossRef]
- Seppälä, J.; Posch, M.; Johansson, M.; Hettelingh, J.-P. Country-Dependent Characterisation Factors for Acidification and Terrestrial Eutrophication Based on Accumulated Exceedance as an Impact Category Indicator (14 Pp). Int J Life Cycle Assessment 2006, 11, 403–416. [Google Scholar] [CrossRef]
- Fantke, P.; Evans, J.R.; Hodas, N.; Apte, J.S.; Jantunen, M.J.; Jolliet, O.; McKone, T.E. Health Impacts of Fine Particulate Matter. In Global guidance for life cycle impact assessment indicators; SETAC, 2016; Vol. 1, pp. 76–99 ISBN 978-92-807-3630-4.
- Rosenbaum, R.K.; Bachmann, T.M.; Gold, L.S.; Huijbregts, M.A.J.; Jolliet, O.; Juraske, R.; Koehler, A.; Larsen, H.F.; MacLeod, M.; Margni, M.; et al. USEtox—the UNEP-SETAC Toxicity Model: Recommended Characterisation Factors for Human Toxicity and Freshwater Ecotoxicity in Life Cycle Impact Assessment. Int J Life Cycle Assess 2008, 13, 532–546. [Google Scholar] [CrossRef]
- van Oers, L.; De Koning, A.; Guinée, J.B.; Huppes, G. Abiotic Resource Depletion in LCA. Road and Hydraulic Engineering Institute, Ministry of Transport and Water, Amsterdam 2002.
- Iyer, R.K.; Kelly, J.C.; Elgowainy, A. Vehicle-Cycle Inventory for Medium- and Heavy-Duty Vehicles; Argonne National Laboratory (ANL), Argonne, IL (United States), 2021.
- Carvalho, M.L.; Temporelli, A.; Girardi, P. Life Cycle Assessment of Stationary Storage Systems within the Italian Electric Network. Energies 2021, 14, 2047. [Google Scholar] [CrossRef]
- Carvalho, M.L.; Temporelli, A.; Brivio, E.; Brambilla, P.C.; Mela, G.; Girardi, P. Batteries in Motion: A Life Cycle Assessment and Critical Resource Use Analysis of Micromobility Vehicles with Primary Li-Ion Battery Data. Journal of Energy Storage 2025, 125, 116965. [Google Scholar] [CrossRef]
- Brambilla, P.C.; Temporelli, A.; Mela, G.; Brivio, E.; Marmiroli, B. LCA della mobilità urbana dalle persone alle merci. 2021.
- Santini, A.; Morselli, L.; Passarini, F.; Vassura, I.; Di Carlo, S.; Bonino, F. End-of-Life Vehicles Management: Italian Material and Energy Recovery Efficiency. Waste Management 2011, 31, 489–494. [Google Scholar] [CrossRef]
- Cusenza, M.A.; Bobba, S.; Ardente, F.; Cellura, M.; Di Persio, F. Energy and Environmental Assessment of a Traction Lithium-Ion Battery Pack for Plug-in Hybrid Electric Vehicles. Journal of Cleaner Production 2019, 215, 634–649. [Google Scholar] [CrossRef]
- U.N.I. Ente Nazionale Italiano di Unificazione UNI EN 590:2017 - Combustibili per Autotrazione - Gasolio per Motori Diesel - Requisiti e Metodi Di Prova; 2017.
- Brambilla, P.C.; Brivio, E.; Marmiroli, B.; Mela, G.; Molocchi, A.; Temporelli, A. LCA Della Mobilità Urbana Dalle Persone Alle Merci; Ricerca di Sistema, RSE, n. 21010643: Milano, 2021;
- GSE Energia Nel Settore Trasporti 2005-2019; 2020.
- ISPRA La Banca Dati Dei Fattori Di Emissione Medi per Il Parco Circolante in Italia (FE2020) 2020.
- European Environment Agency EMEP/EEA Air Pollutant Emission Inventory Guidebook - 2009; 2009.
- Ntziachristos, L.; Boulter, P. Road Vehicle Tyre and Brake Wear. Road Surface Wear. In EMEP/CORINAIR emission inventory guidebook; European Environment Agency: Copenhagen, Denmark, 2009. [Google Scholar]
- Carvalho, M.L.; Mela, G.; Temporelli, A.; Brivio, E.; Girardi, P. Sodium-Ion Batteries with Ti1Al1TiC1.85 MXene as Negative Electrode: Life Cycle Assessment and Life Critical Resource Use Analysis. Sustainability 2022, 14, 5976. [Google Scholar] [CrossRef]
- O’Connell, A.; Pavlenko, N.; Bieker, G.; Searle, S. A Comparison of the Life-Cycle Greenhouse Gas Emissions of European Heavy-Duty Vehicles and Fuels. International Council on Clean Transportation.
- Syré, A.M.; Shyposha, P.; Freisem, L.; Pollak, A.; Göhlich, D. Comparative Life Cycle Assessment of Battery and Fuel Cell Electric Cars, Trucks, and Buses. World Electric Vehicle Journal 2024, 15, 114. [Google Scholar] [CrossRef]
- Report della Mobilità 2023.pdf. Available online: https://datashare.amat-mi.it/index.php/s/5T7P7tdZk88fRXo (accessed on 7 October 2025).
- Marmiroli, B.; Carvalho, M.L.; Mela, G.; Molocchi, A.; Girardi, P. Life Cycle Assessment and Evaluation of External Costs of the Italian Electricity Mix. In Proceedings of the The 9th International Conference on Energy and Environment Research; Caetano, N.S., Felgueiras, M.C., Eds.; Springer Nature: Cham, Switzerland, 2023; pp. 203–213. [Google Scholar]
- GSE-Ufficio Statistiche e Monitoraggio Target Rapporto Statistico 2021 - Energia Da Fonti Rinnovabili in Italia; 2021.
- ENI ENI Local Report Gela 2023; 2023.
- Puricelli, S.; Eid, M.; Casadei, S.; Dolci, G.; Lixi, S.; van den Oever, A.; Rigamonti, L.; Grosso, M. Life Cycle Assessment of a Partially Renewable Blend for Bi-Fuel Passenger Cars and Comparison with Petrol and Battery Electric Cars. Journal of Cleaner Production 2025, 505, 145347. [Google Scholar] [CrossRef]
- Skrúcaný, T.; Milojević, S.; Semanová, Š.; Čechovič, T.; Figlus, T.; Synák, F. The Energy Efficiency of Electric Energy as a Traction Used in Transport. Transport technic and technology 2018, 14, 9–14. [Google Scholar] [CrossRef]
- Marinković, D.; Dezső, G.; Milojević, S. Application of Machine Learning during Maintenance and Exploitation of Electric Vehicles. 2024. [Google Scholar] [CrossRef]
- Ma, L.; Ghorbani, Y.; Kongar-Syuryun, C.B.; Khayrutdinov, M.M.; Klyuev, R.V.; Petenko, A.; Brigida, V. Dynamics of Backfill Compressive Strength Obtained from Enrichment Tails for the Circular Waste Management. Resources, Conservation & Recycling Advances 2024, 23, 200224. [Google Scholar] [CrossRef]
- Cotrina-Teatino, M.A.; Marquina-Araujo, J.J.; Mamani-Quispe, J.N.; Chira-Fernandez, J.; De la Cruz-Poma, C.; Castillo-Chung, A.R.; Arango-Retamozo, S.M.; González-Vasquez, J.A.; Ortiz-Quintanilla, S.M. Recovery of Strategic Elements from Mining Tailings at La Cienega, Peru, through Geochemical and Mineralogical Assessment: A Focus on Circular Economy Policy. Resources Policy 2025, 110, 105746. [Google Scholar] [CrossRef]
- Girardi, P.; Brambilla, C.; Mela, G. Life Cycle Air Emissions External Costs Assessment for Comparing Electric and Traditional Passenger Cars. Integrated Environmental Assessment and Management 2020, 16, 140–150. [Google Scholar] [CrossRef]
- Molocchi, A.; Mela, G. Social Cost of Carbon as an International Benchmark to Drive Countries’ Carbon Pricing during the Transition. Sustainability 2024, 16, 8573. [Google Scholar] [CrossRef]
- Basma, H.; Mansour, C.; Haddad, M.; Nemer, M.; Stabat, P. Comprehensive Energy Modeling Methodology for Battery Electric Buses. Energy 2020, 207, 118241. [Google Scholar] [CrossRef]
- Green, Università Bocconi Scenari e Prospettive Dell’elettrificazione Del Trasporto Pubblico Su Strada; Research Report Series; 2021.
- Söderena, P.; Nylund, N.-O.; Mäkinen, R. City Bus Performance Evaluation; VTT Customer Report; VTT Technical Research Centre of Finland, 2019.
- Zhou, B.; Wu, Y.; Zhou, B.; Wang, R.; Ke, W.; Zhang, S.; Hao, J. Real-World Performance of Battery Electric Buses and Their Life-Cycle Benefits with Respect to Energy Consumption and Carbon Dioxide Emissions. Energy 2016, 96, 603–613. [Google Scholar] [CrossRef]
- Doulgeris, S.; Zafeiriadis, A.; Athanasopoulos, N.; Tzivelou, Ν.; Michali, M.E.; Papagianni, S.; Samaras, Z. Evaluation of Energy Consumption and Electric Range of Battery Electric Busses for Application to Public Transportation. Transportation Engineering 2024, 15, 100223. [Google Scholar] [CrossRef]
Figure 1.
Electricity supply mix by energy source for the years 2019 and 2030.
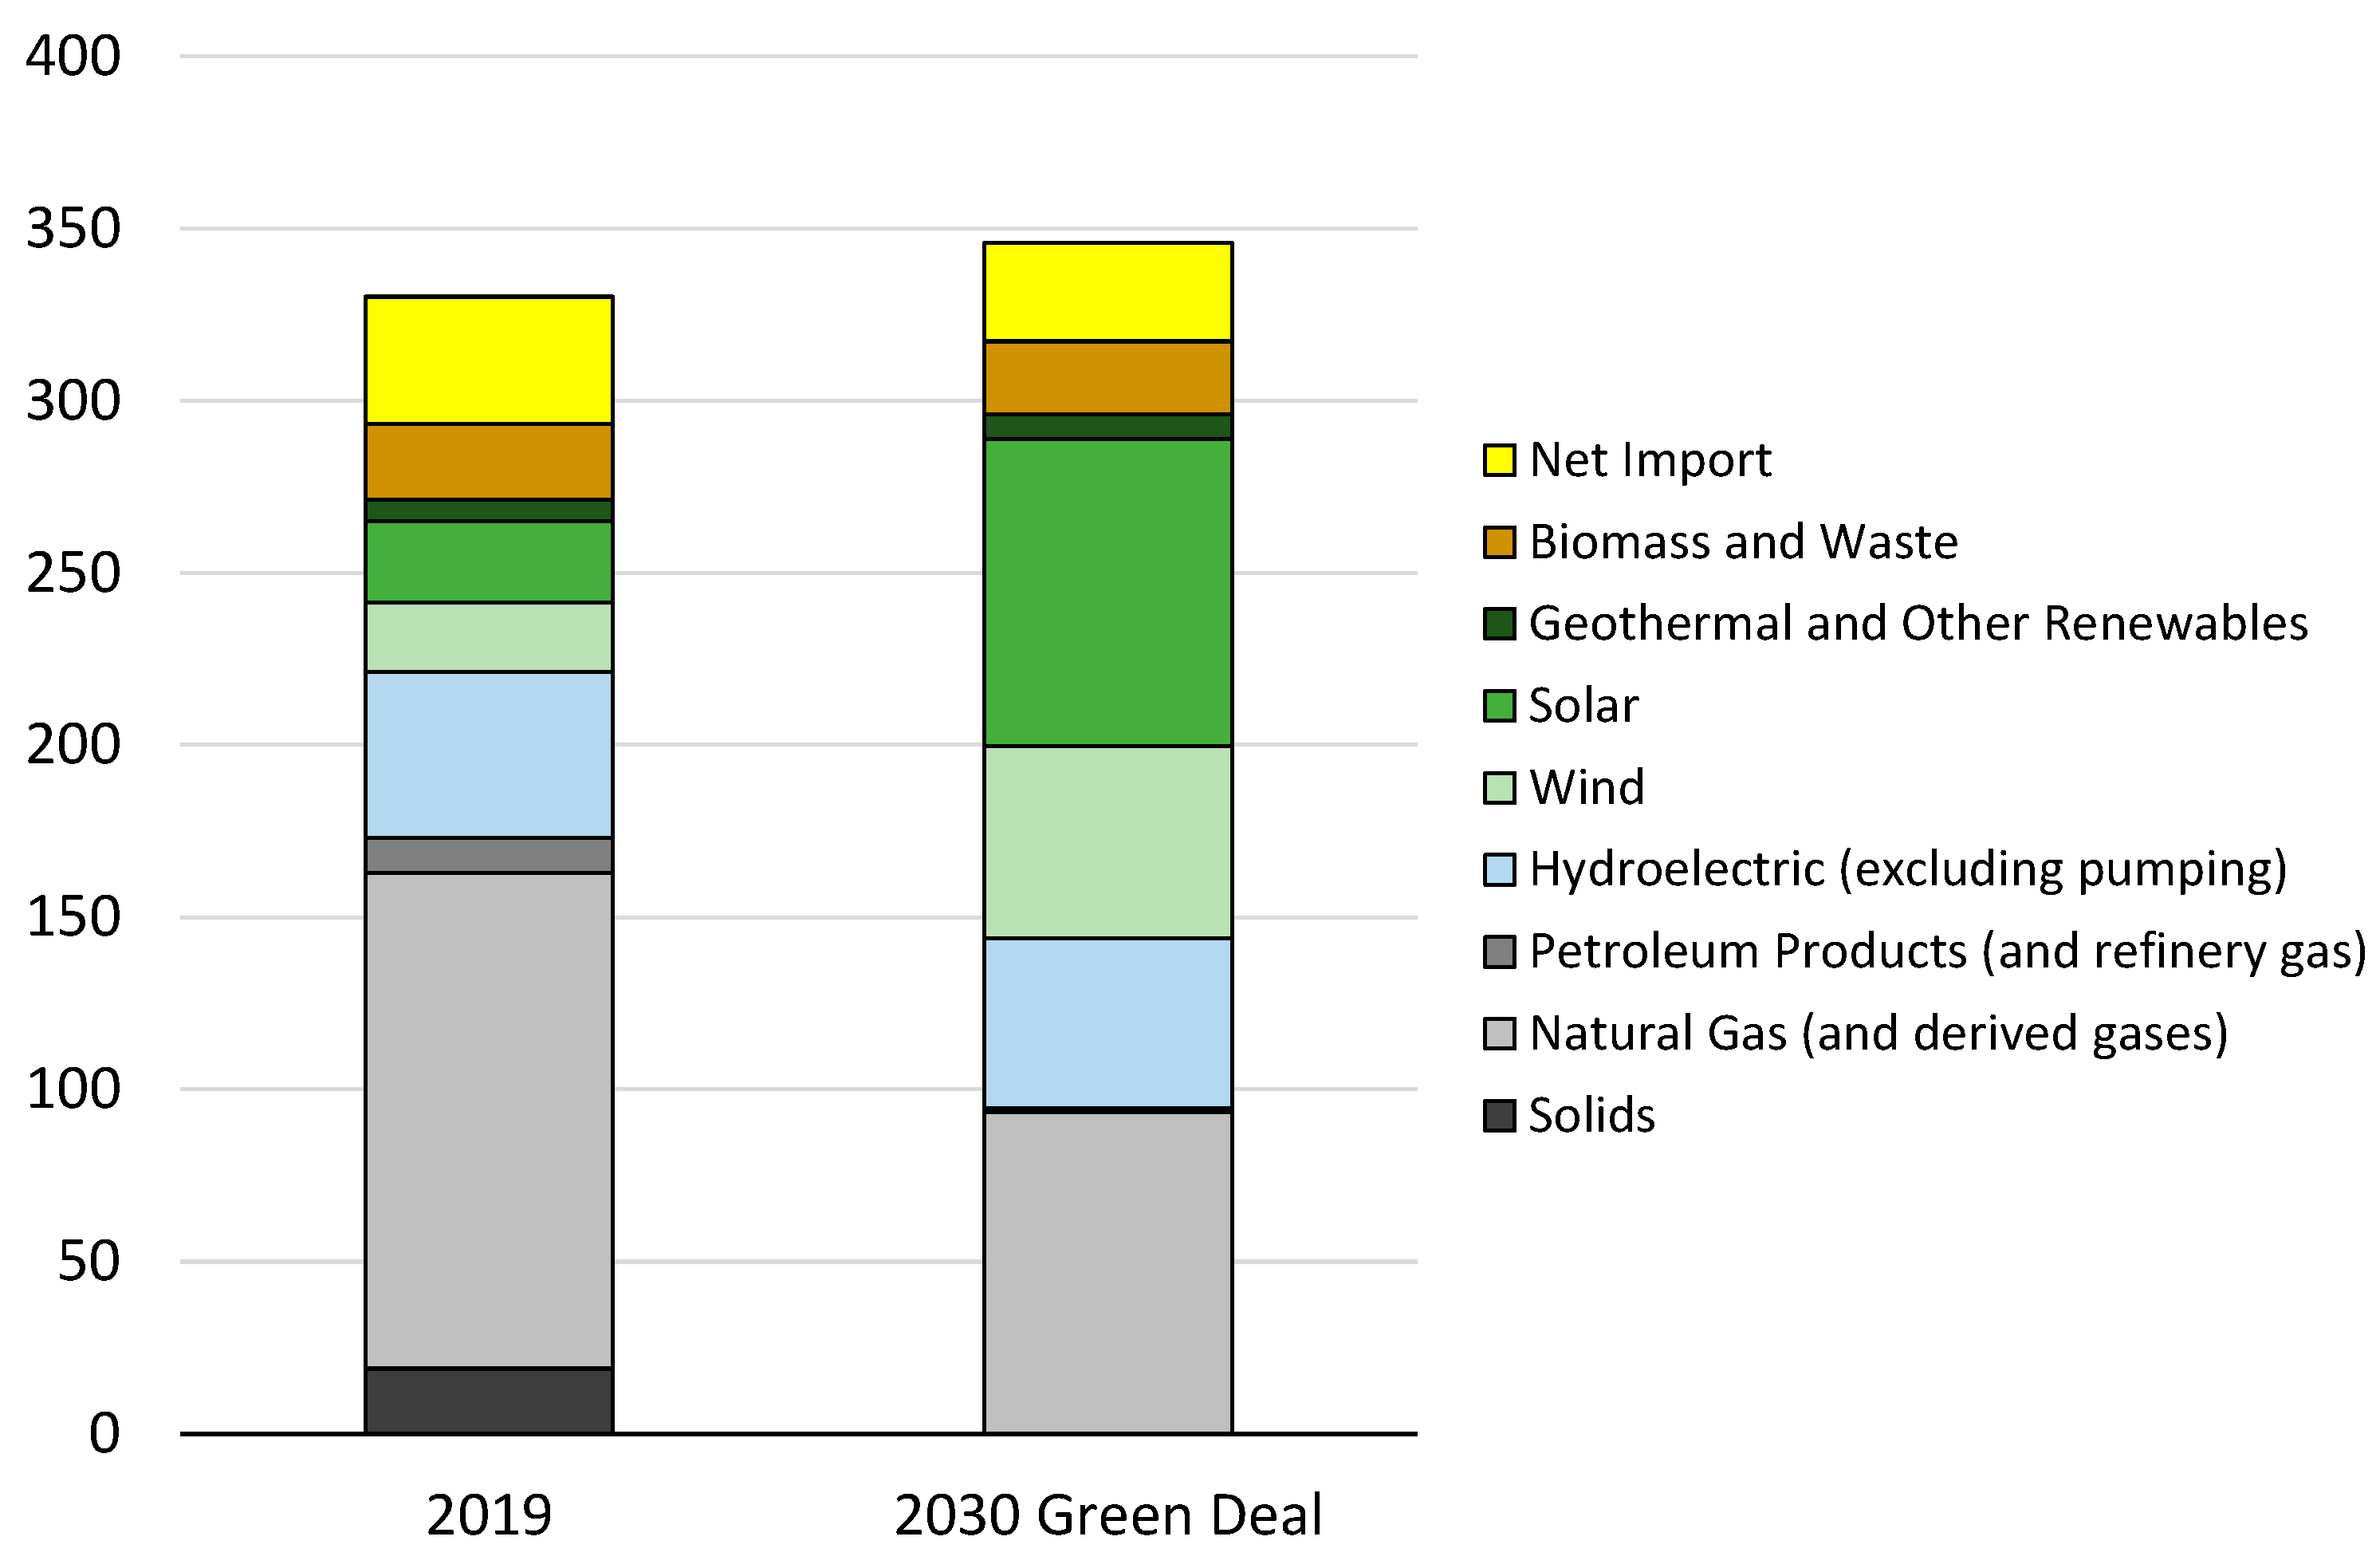
Figure 2.
Potential impacts related to the two bus powertrains in an urban driving cycle. In the graph, the reference point (100%) is represented by the performance of the Diesel-powered bus.CC = Climate Change; HT-C = Human toxicity, cancer; HT-NC = Human toxicity, non-cancer; PM = Particulate matter; POF = Photochemical ozone formation; RU-E = Resource use, fossils; RU-M = Resource use, minerals and metals; A = Acidification.
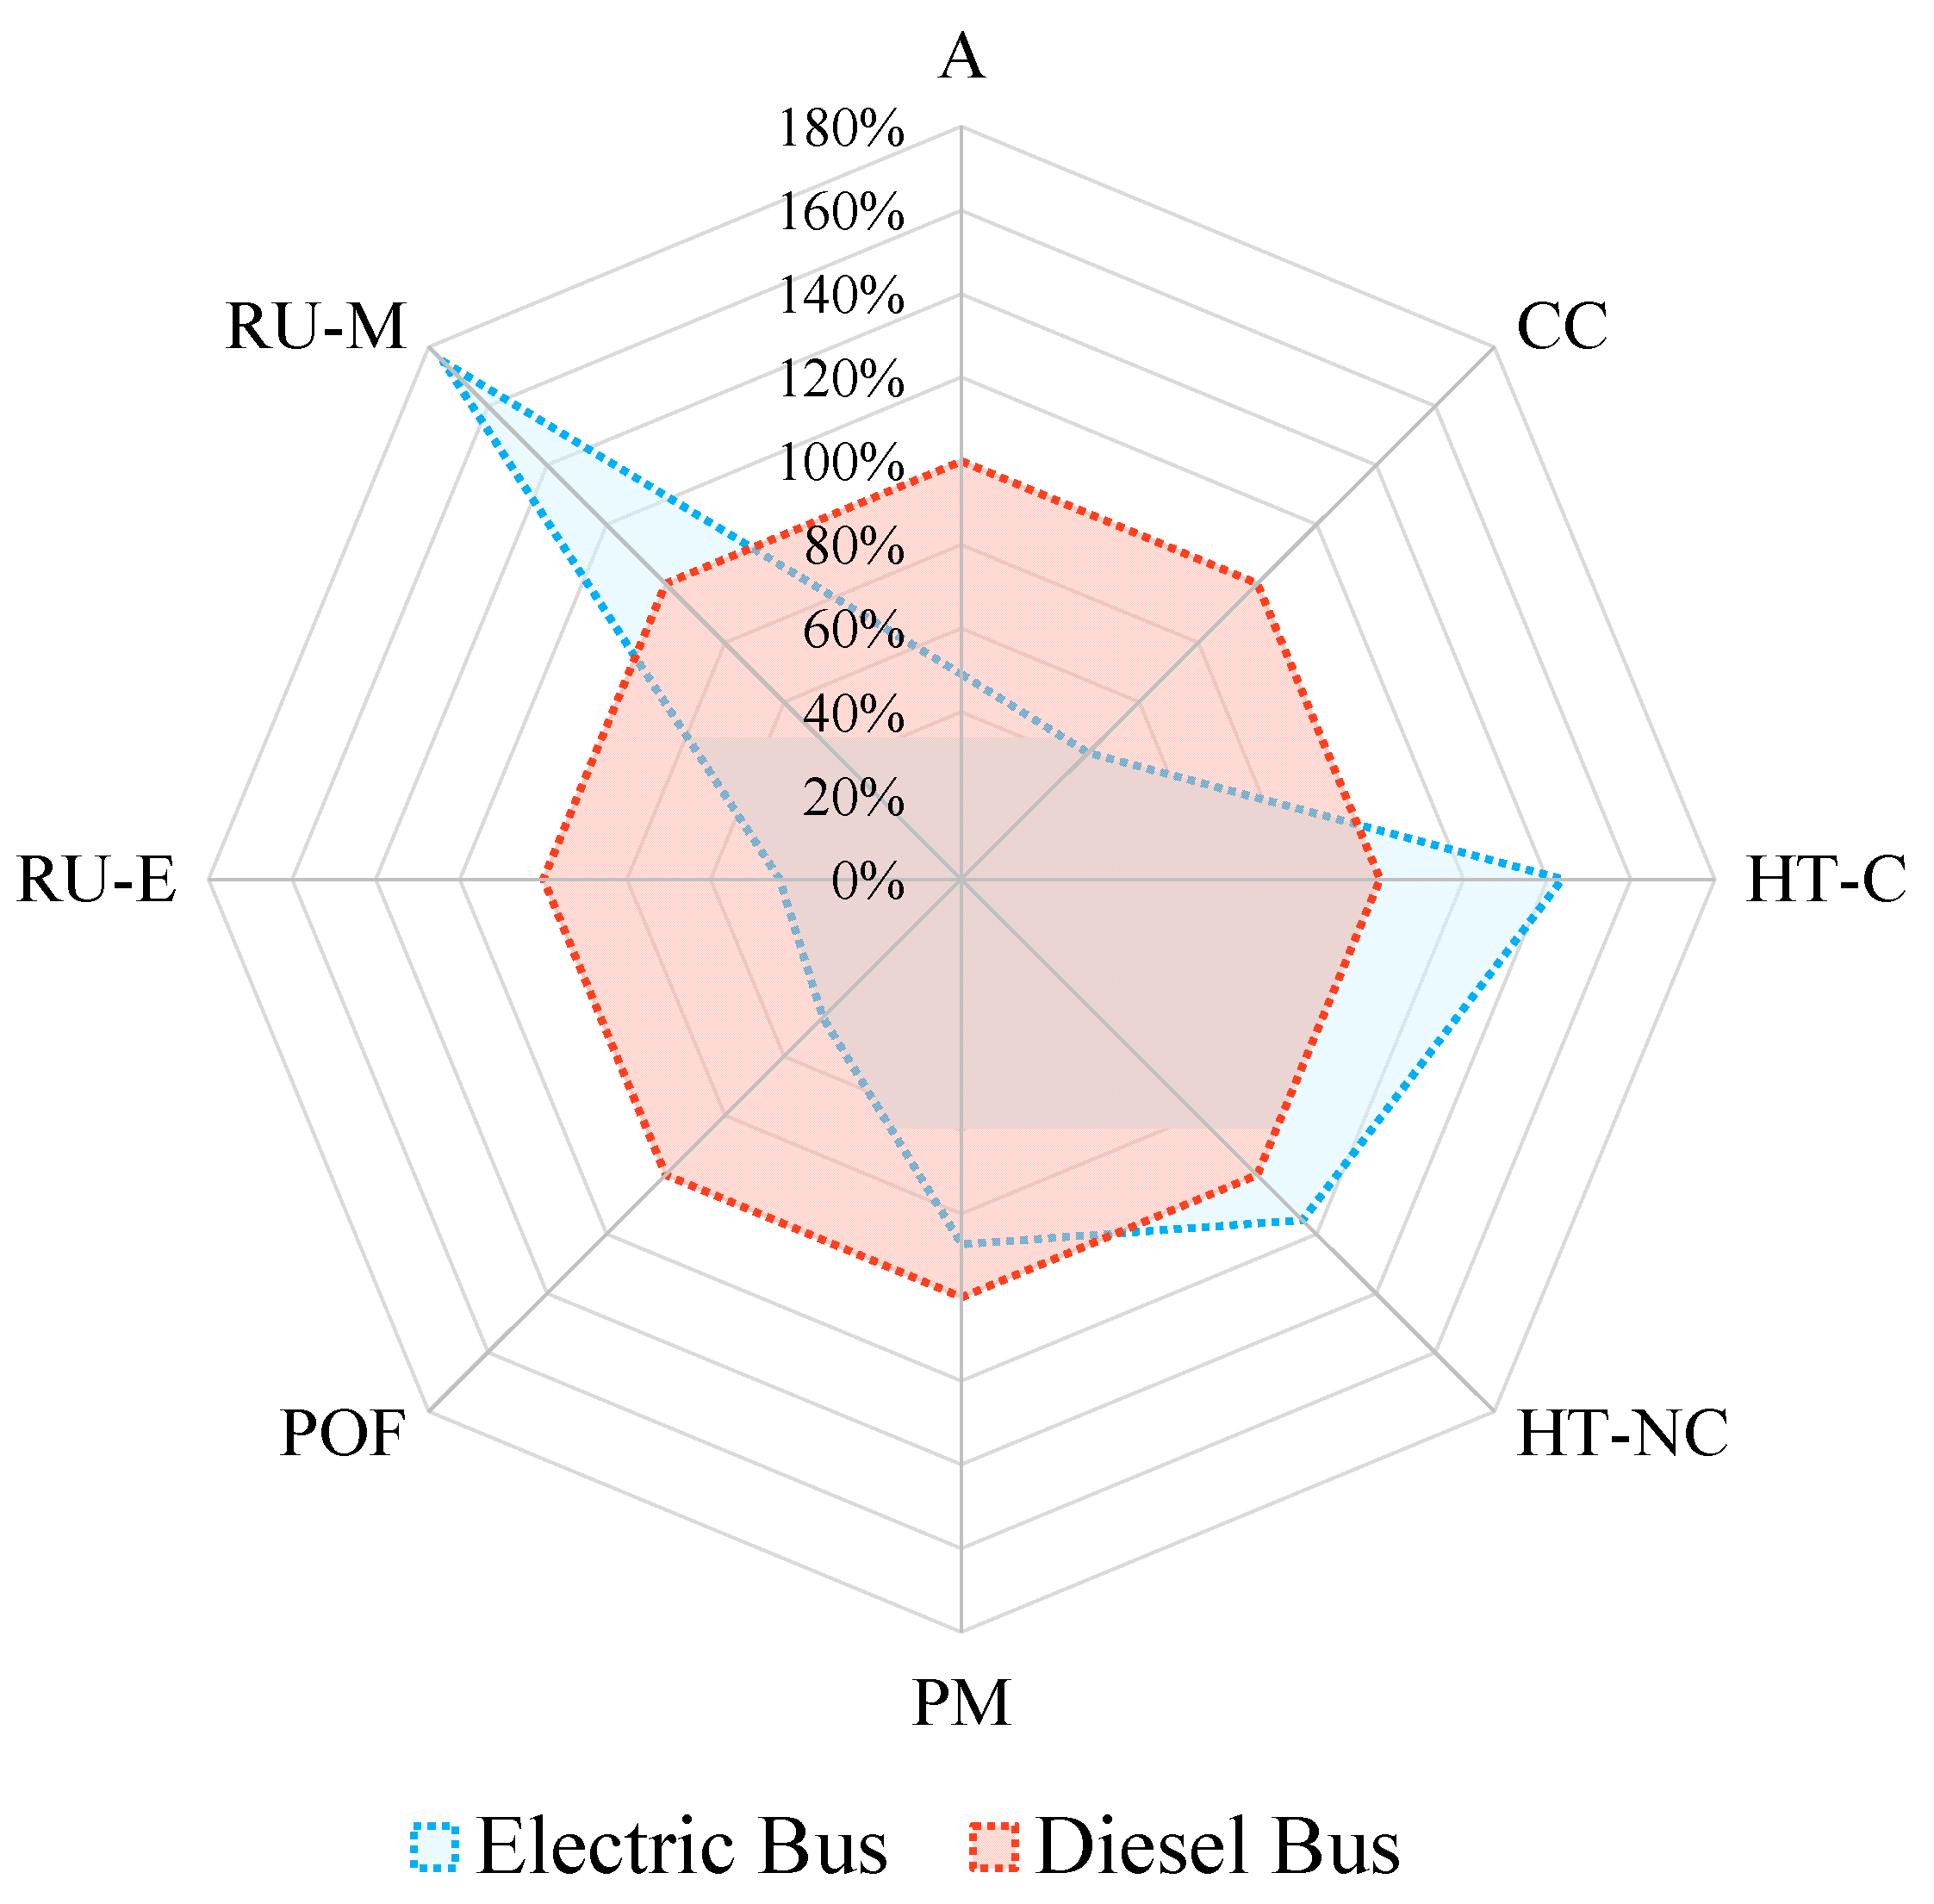
Figure 8.
Climate Change impact per passenger*km vs carbon intensity of the energy mix.
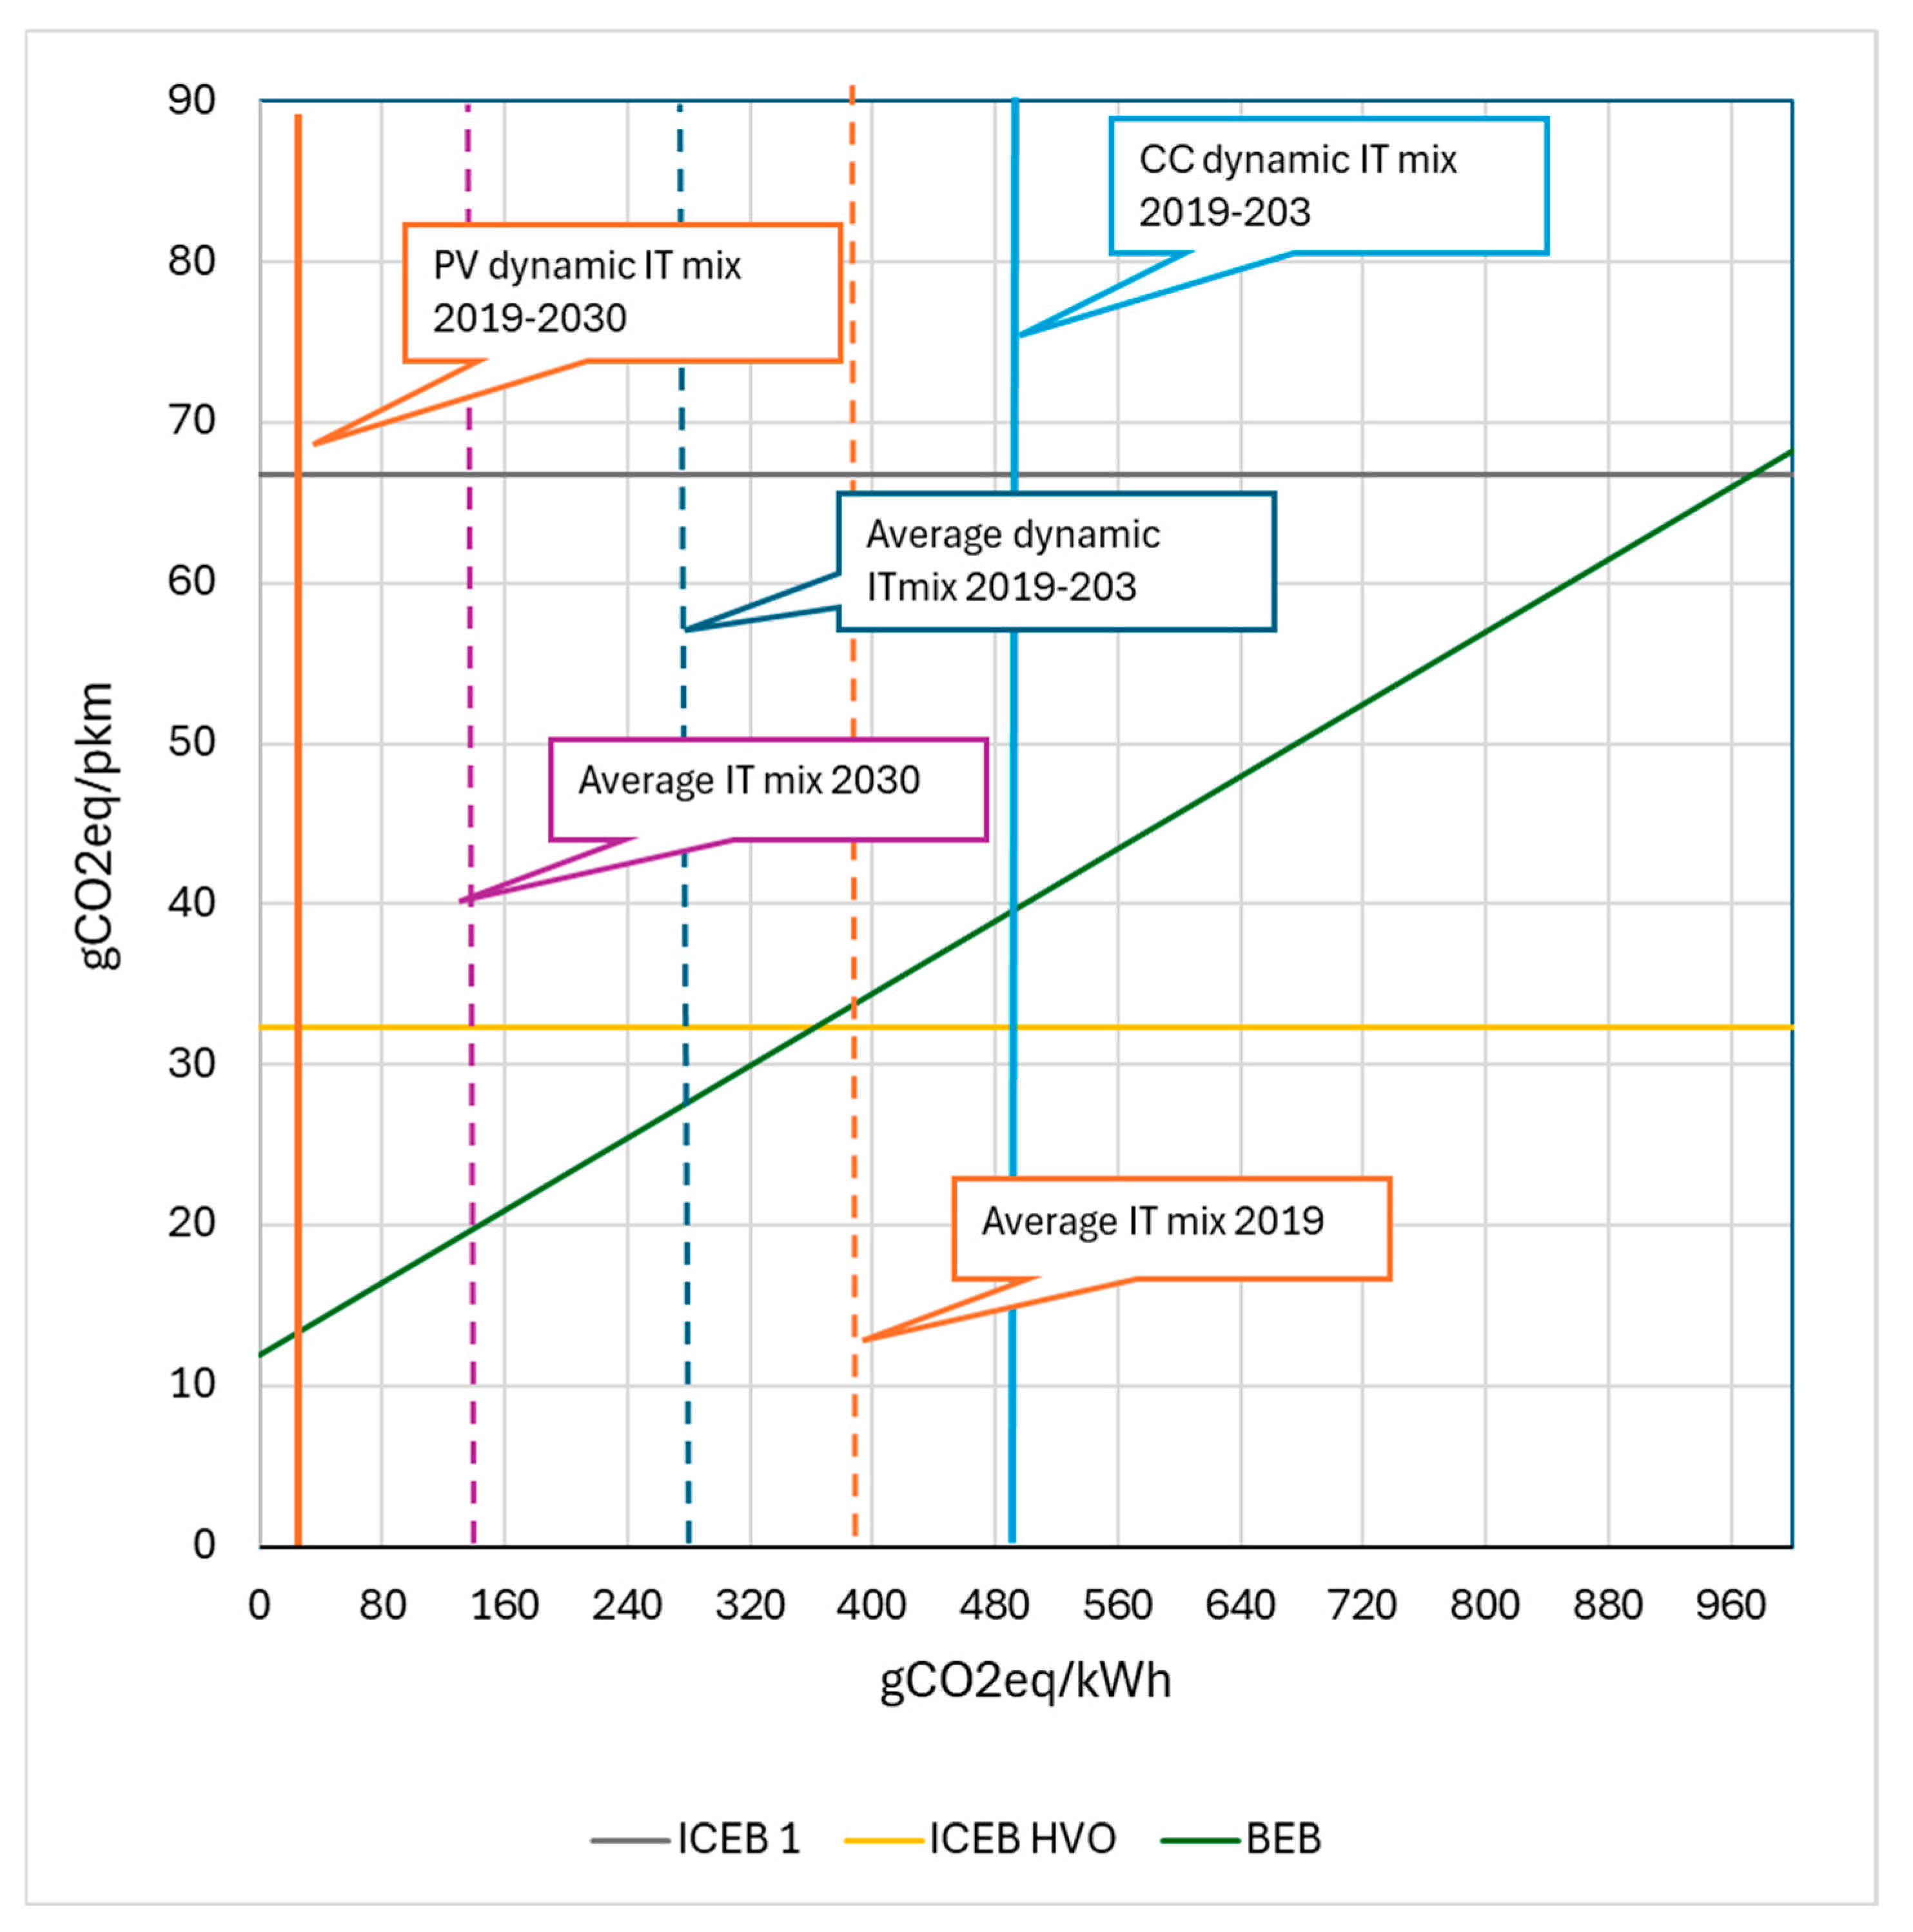
Table 1.
Impact categories of the Environmental Footprint method considered in this study, together with the respective indicators and characterization models.
Table 1.
Impact categories of the Environmental Footprint method considered in this study, together with the respective indicators and characterization models.
| Impact Categories | Functional Unit | Midpoint Indicator | Characterization Model |
|---|---|---|---|
| Climate change (CC) | kg CO2eq | Total global warming potential over the 100-year time horizon (GWP100). | IPCC 2013 [33] |
| Photochemical ozone formation (POF) | kg NMVOCeq | Potential for photochemical ozone formation. | LOTOS-EUROS come applicato in ReCiPe 2008 [34] |
| Acidification (A) | Mol H+eq | Accumulated exceedance of the critical load of acidifying substances in terrestrial and freshwater ecosystems. | Superamento accumulato AE (Accumulated Exceedance) [35,36] |
| Particulate matter (PM) | Disease incidence. | Impact on human health due to exposure to PM2.5 particulate matter (disease incidence) | UNEP-SETAC Task Force (TF) on PM [37] |
| Human toxicity, non-cancer (HT-NC) | CTUh(*) | Increase in non-carcinogenic morbidity in the total population per unit of chemical compound emitted | USEtox, UNEP/SETAC Life Cycle Initiative [38] |
| Human toxicity, cancer (HT-C) | CTUh | Increase in carcinogenic morbidity in the total population per unit of chemical compound emitted | USEtox, UNEP/SETAC Life Cycle Initiative [38] |
| Resource use, fossils (RU-E) | MJ | Depletion of abiotic resources, fossil fuels (MJ) | Abiotic Resource Depletion, “ultimate reserves” [39] |
| Resource use, minerals and metals (RU-M) | kg Sbeq | Depletion of abiotic resources, minerals and metals (kg Sb eq.) | Abiotic Resource Depletion, “ultimate reserves” [39] |
(*) Comparative Toxic Unit for humans.
Table 2.
Weight of the components of the electric bus (BEB) and the Diesel bus (ICEB) considered in this study (Source: GREET, RSE elaborations).
Table 2.
Weight of the components of the electric bus (BEB) and the Diesel bus (ICEB) considered in this study (Source: GREET, RSE elaborations).
| Systems | BEB (kg) | ICEB (kg) |
|---|---|---|
| Body | 5,046.53 | 5,046.53 |
| Chassis (w/o battery) | 3,717.56 | 3,717.56 |
| Electronic Controller | 13.00 | 0.00 |
| Fluids | 87.60 | 123.75 |
| Lead-Acid Battery | 31.30 | 62.60 |
| Li-Ion Battery | 2,995.00 | 0.00 |
| Powertrain System (including BOP) | 0.00 | 644.96 |
| Traction Motor | 134.00 | 0.00 |
| Transmission System/Gearbox | 90.00 | 221.00 |
| Totale complessivo | 12,115.00 | 9,816.40 |
Table 3.
Emission factors per tons of diesel burned [49].
Table 3.
Emission factors per tons of diesel burned [49].
| Pollutant | Emission Factor [t/t] Urban |
|---|---|
| CO | 8.85E-04 |
| NOx | 1.64E-03 |
| NMVOC | 1.29E-04 |
| CH4 | 1.65E-05 |
| N2O | 1.31E-04 |
| NH3 | 2.83E-05 |
| PM exhaust | 2.80E-05 |
| CO2 | 3.16E+00 |
| SO2 | 1.43E-05 |
| Pb Exhaust | 4.89E-11 |
| Cadmium exhaust | 6.76E-09 |
| Copper exhaust | 1.15E-06 |
| Chromium exhaust | 3.68E-08 |
| Nickel exhaust | 4.72E-08 |
| Selenium exhaust | 6.79E-09 |
| Zinc exhaust | 6.81E-07 |
| Benzene | 9.04E-08 |
| Indeno(1,2,3-cd)pyrene | 4.65E-09 |
| Benzo(k)fluoranthene | 2.02E-08 |
| Benzo(b)fluoranthene | 1.81E-08 |
| Benzo(a)pyrene | 2.99E-09 |
| Dioxins | 5.31E-16 |
| Furans | 7.97E-16 |
Table 4.
Harmonized Climate Change results for Electric Bus
| Study | Year | Scenario | Original Value | Original Unit | Original Useful Life | Original Occupancy Factor | Harmonized Value (g CO₂eq/pkm) |
| This study (RSE) | Dynamyc 2019-2030 | E-bus (Dynamic IT mix) | 28.5 | g/pkm | 800,000 | 20.4 | 28.5 |
| Nordelöf et al. [6] | 2019 | Electric (EU mix) | 48 | g/pkm | 780,000 | 16 | 37.7 |
| O’Connell et al[53] | 2021-2040 | BEV (EU grid) | 22.9 | g/pkm | 881,000 | n.d | 22.9 |
| Syré et al[54]. | 2024 | BEV bus (EU) | 20 | g/km | 70,000 | 39 (60*65%) | 34.4 () |
| Luu et al.[30] | 2022 | E-bus (Vietnam) | 108.11 | g/pkm | 320,000 | 17.8 | 37.8 |
| García et al.[23] | 2022 | Electric Bus (total LCA, current) | 12.5 | g/km.passenger | 800,000 | 80 | 49.02 |
| Jelti et al.[16] | 2021 | Electric Bus (total WTW) | 5,174 | T CO2 eq/year (fleet) | n.d. | n.d. | 47.02 |
| Gabriel et al.[17] | 2021 | Electric Bus (total LCA) | 6.14 × 10⁵ | kg CO2-eq (per bus) | 930,750 | 46 | 32.34 |
| Zhao et al.[7] | 2021 | Electric Bus (total LCA, incl. infrastructure) | 690,549.6 | kgCO2e (per station/bus) | 650,000 | n.d. | 52.06 |
Table 5.
Scenarios considered in sensitivity analysis and their description.
| Scenario name | Bus tot mileage km | Battery life km | Consumption l/km or kWh/km | scenario description |
|---|---|---|---|---|
| ICEB1 | 800000 | - | 0.3804 | ICEB baseline |
| ICEB2 | 400000 | - | 0.3804 | ICEB 400 000 km total mileage |
| ICEB3 | 800000 | - | 0.26 | ICEB min cons |
| ICEB4 | 800000 | - | 0.6317 | ICEB max cons |
| BEB1 | 800000 | 400000 | 1.25 | BEB baseline |
| BEB2 | 400000 | 400000 | 1.25 | BEB 400 000 km total mileage |
| BEB3 | 800000 | 400000 | 0.96 | BEB cons min |
| BEB4 | 800000 | 400000 | 2.2 | BEB cons max |
| BEB5 | 800000 | 800000 | 1.25 | BEB no Batt Change |
| BEB6 | 800000 | 266667 | 1.25 | BEB 2 Batt Change |
| BEB LFP1 | 800000 | 400000 | 1.25 | BEB batt LFP |
| BEB LFP2 | 800000 | 800000 | 1.25 | BEB batt LFP no Batt Change |
| BEB PV | 800000 | 400000 | 1.25 | BEB dynamic PV mix |
| BEB CC | 800000 | 400000 | 1.25 | BEB dynamic Combined Cycle mix |
| ICEB HVO | 800000 | - | 0.3692 | ICEB 100% HVO |
Table 6.
Life Cycle Impact Assessment for different ICEB and BEB scenarios. Values are per psg*km. Impact categories are: Climate Change (CC), Photochemical Oxidant Formation (POF), Particulate Matters (PM), Human Toxicity Non-Cancer (HT -NC), Human toxicity Cancer (HT-C), Acidification (A), Resource Use Energy (RU-E), Resource Use Minerals and Metals (RU-M).
| CC | POF | PM | HT-NC | HT-C | A | RU-E | RU-M | |
|---|---|---|---|---|---|---|---|---|
| U.M. | kg CO2 eq | kg NMVOC eq | disease inc. | CTUh | CTUh | mol H+ eq | MJ | kg Sb eq |
| ICEB 1 | 6.7E-02 | 1.4E-04 | 2.9E-09 | 5.2E-10 | 2.0E-11 | 2.7E-04 | 8.8E-01 | 1.7E-07 |
| ICEB 2 | 7.2E-02 | 1.8E-04 | 3.4E-09 | 6.7E-10 | 3.1E-11 | 3.9E-04 | 9.5E-01 | 2.8E-07 |
| ICEB 3 | 4.8E-02 | 1.1E-04 | 2.7E-09 | 4.7E-10 | 1.8E-11 | 2.3E-04 | 6.3E-01 | 1.7E-07 |
| ICEB 4 | 1.1E-01 | 2.0E-04 | 3.5E-09 | 6.1E-10 | 2.5E-11 | 3.7E-04 | 1.4E+00 | 1.8E-07 |
| ICEB HVO | 3.2E-02 | 2.5E-04 | 4.8E-09 | 6.3E-10 | 2.5E-11 | 4.9E-04 | 3.6E-01 | 3.5E-07 |
| BEB1 | 2.9E-02 | 6.8E-05 | 2.5E-09 | 6.0E-10 | 2.9E-11 | 1.3E-04 | 3.8E-01 | 3.2E-07 |
| BEB2 | 3.5E-02 | 8.7E-05 | 2.9E-09 | 7.7E-10 | 4.2E-11 | 1.6E-04 | 4.6E-01 | 4.0E-07 |
| BEB3 | 2.5E-02 | 6.3E-05 | 2.5E-09 | 5.7E-10 | 2.8E-11 | 1.2E-04 | 3.3E-01 | 3.1E-07 |
| BEB4 | 4.1E-02 | 8.6E-05 | 2.7E-09 | 6.7E-10 | 3.3E-11 | 1.6E-04 | 5.6E-01 | 3.7E-07 |
| BEB5 | 2.6E-02 | 5.6E-05 | 2.3E-09 | 4.9E-10 | 2.4E-11 | 9.7E-05 | 3.5E-01 | 2.3E-07 |
| BEB6 | 3.2E-02 | 8.1E-05 | 2.7E-09 | 7.0E-10 | 3.4E-11 | 1.6E-04 | 4.2E-01 | 4.1E-07 |
| BEB LFP1 | 2.9E-02 | 6.8E-05 | 2.8E-09 | 1.1E-09 | 3.2E-11 | 1.2E-04 | 3.7E-01 | 7.4E-07 |
| BEB LFP2 | 2.5E-02 | 5.5E-05 | 2.5E-09 | 7.5E-10 | 2.5E-11 | 9.3E-05 | 3.3E-01 | 4.4E-07 |
| BEB PV | 1.3E-02 | 5.2E-05 | 2.5E-09 | 6.2E-10 | 2.7E-11 | 1.1E-04 | 1.6E-01 | 4.0E-07 |
| BEB CC | 4.6E-02 | 1.1E-04 | 2.5E-09 | 5.6E-10 | 2.7E-11 | 1.2E-04 | 5.8E-01 | 2.6E-07 |
Table 7.
Life Cycle Impact Assessment for different ICEB and BEB scenarios. Values are per psg*km. Impact categories are: Climate Change (CC), Photocemical Oxidant Formation (POF), Particulate Matters (PM), Human Toxicity Non-Cancer (HT -NC), Human toxicity Cancer (HT-C), Acidification (A), Resource Use Energy (RU-E), Reousce Use Minerals and Metals (RU-M).
| Scenario | CC | POF | PM | HT-NC | HT-C | A | RU-E | RU-M |
| ICEB 1 | 100% | 100% | 100% | 100% | 100% | 100% | 100% | 100% |
| ICEB 2 | 108% | 129% | 117% | 130% | 154% | 145% | 107% | 161% |
| ICEB 3 | 72% | 79% | 91% | 91% | 88% | 83% | 71% | 98% |
| ICEB 4 | 159% | 145% | 119% | 119% | 125% | 135% | 160% | 105% |
| ICEB HVO | 48% | 175% | 164% | 122% | 123% | 180% | 40% | 199% |
| BEB1 | 43% | 48% | 87% | 115% | 145% | 47% | 44% | 186% |
| BEB2 | 52% | 62% | 99% | 149% | 210% | 59% | 52% | 231% |
| BEB3 | 37% | 45% | 85% | 111% | 139% | 44% | 37% | 177% |
| BEB4 | 62% | 61% | 92% | 129% | 164% | 57% | 63% | 215% |
| BEB5 | 38% | 39% | 80% | 95% | 118% | 36% | 39% | 135% |
| BEB6 | 47% | 58% | 94% | 136% | 171% | 59% | 48% | 238% |
| BEB LFP1 | 43% | 48% | 94% | 213% | 158% | 45% | 42% | 425% |
| BEB LFP2 | 37% | 39% | 87% | 146% | 125% | 34% | 37% | 256% |
| BEB PV | 20% | 37% | 86% | 121% | 134% | 40% | 19% | 229% |
| BEB CC | 69% | 77% | 84% | 108% | 134% | 44% | 66% | 151% |
Disclaimer/Publisher’s Note: The statements, opinions and data contained in all publications are solely those of the individual author(s) and contributor(s) and not of MDPI and/or the editor(s). MDPI and/or the editor(s) disclaim responsibility for any injury to people or property resulting from any ideas, methods, instructions or products referred to in the content. |
© 2025 by the authors. Licensee MDPI, Basel, Switzerland. This article is an open access article distributed under the terms and conditions of the Creative Commons Attribution (CC BY) license (http://creativecommons.org/licenses/by/4.0/).
Copyright: This open access article is published under a Creative Commons CC BY 4.0 license, which permit the free download, distribution, and reuse, provided that the author and preprint are cited in any reuse.


