
Submitted:
11 December 2023
Posted:
13 December 2023
You are already at the latest version
Abstract
Several strategies promote phyllosphere colonization by soil-born Trichoderma plant-beneficial strains. One of these is foliar spraying with suspensions containing large amounts of chlamydospores – spores with a thick cell wall structure that makes them highly resistant to harsh environmental conditions. Trichoderma biomass was produced by cultivation on cornmeal medium and compared by microscopic and thermogravimetric analysis with the biomass produced in potato dextrose broth. Both analyses revealed higher chlamydospores content and thicker mycelium in the fungal biomass produced on cornmeal medium. The Trichoderma suspension rich in chlamydospores was sprayed on bitter gourd (Momordica charantia) leaves at two concentration levels, 106 and 108 ufc/ml. The effect of these treatments on plant physiological parameters, leaf photosynthetic pigments, polyphenol and flavonoid contents, antioxidant activity of leaves and fruits and yield was compared to the control (plants sprayed with water) and to the experimental treatment sprayed with 108 ufc propagules produced in potato dextrose broth. The effect of chlamydospore-rich suspensions on plant physiological parameters was more pronounced and long-lasting compared with the other treatments. The treatment with chlamydospore-rich suspension enhanced the accumulation of polyphenols and flavonoids in the leaves and fruits and increased the antioxidant activity. The application of the foliar treatment with Trichoderma suspensions did not modify the cytocompatibility of the extracts from fruits determined on L929 cells.
Keywords:
maximum quantum yield of Photosystem II
; net photosynthetic rate
; stomatal conductance
; polyphenols
; flavonoids
; antioxidant activity
; cytocompatibility
1. Introduction
The fungal strains from Trichoderma (Hypocrea) genera are largely used as microbial inputs in agricultural technologies [1]. For decades, the bioproducts based on selected Trichoderma strains were used to protect cultivated plants against fungal pathogens [2,3]. In the 21st century, Trichoderma strains were reported to be active against nematodes [4,5] and insects [6,7]. The plant-beneficial strains from Trichoderma genera were also recognized as plant biostimulants [8], increasing nutrient uptake and nutrient use efficiency, enhancing plant tolerance to abiotic stress and improving crop quality traits.
The multifaceted actions of beneficial Trichoderma strains applied on cultivated plants result after establishing and colonizing the microbiocenosis defined by belowground and above-ground plant organs, rhizosphere, and, respectively, phyllosphere [9]. The colonizing strains produce various categories of bioactive compounds: lytic exo-enzymes [10], expansin-like proteins [11], other protein elicitors [12], secondary metabolites [13], such as volatiles 6-pentyl-pyrones [14] or trichothecenes [15]. These bioactive compounds produced by the Trichoderma populations established in the plant microbiocenosis (microbial ecological niche) control plant pathogens [16,17] and plant-feeding insects [18] and/or activate plant defense pathways [19]. The colonizing Trichoderma strains mediate plant interaction at multiple trophic levels [20]
Various Trichoderma strains were demonstrated to activate jasmonic and salicylic acid plant defense pathways [21], priming in a balanced manner the plant innate immunity [22]. Plant defense elicitation by the compounds produced by Trichoderma microbial colonizer boosts primary metabolism, increasing nutrient uptake and nutrient use efficiency [23]. The activation of plant defense pathways determines a higher plant tolerance to abiotic stress [24]. The secondary metabolism pathways associated with different plant defense pathways determine bioactive compounds accumulation in leaves and fruits [14]. Trichoderma strain application on plants activates mainly the phenylpropanoid pathway t [25,26], leading to a higher accumulation of polyphenols [27,28].
Trichoderma strains are versatile plant symbionts [29], specific to rhizosphere and plant roots surface [16,30,31]. The harsher phyllosphere environment, with lower level of nutrients and water, highly variable temperature, and high light irradiation [32] is less permissive to non-native Trichoderma strains. Introduction of beneficial Trichoderma strains into the phyllosphere is challenging. Several strategies were developed to promote the introduction of the beneficial Trichoderma strains in the phyllosphere — the phyllosphere microbiome being essential for plant health and productivity in a changing environment [33-36]. One strategy is to utilize protective formulations, such as dry flowable formulations that include antioxidants [37] or a talc formulation [38]. Application of a 10-8 cfu/ml suspension of T. harzianum TriH_JSB36 in a sterile talc mixture (1:10 v/w) to grape leaves promoted Plasmopara viticola biocontrol, by priming grape defense responses [38]. Recently, it was suggested that oil based formulation are important for foliar applied products, due to protection against UV radiation, enhancement of the biocontrol activity and better adhesion on the hydrophobic surface of leaf cuticle [39].
Another strategy is to apply repeatedly highly active Trichoderma strains. T. harzianum strain T22 (ATCC® 20847™) was used to induce accumulation of polyphenols in Vitis vinifera cv. Sangiovese grapes. Solutions with 108 spores were drenched on grape leaves every 14 days and 10 treatments were applied [28]. Such strategy determined the accumulation of polyphenols in grapes, with concomitant control of Uncinula necator [28]. However, the high number of treatments makes difficult large-scale adoption of such strategy.
In previous work, we used another strategy. We applied higher concentrations of a plant biostimulant Trichoderma consortium with high amount of chlamydospores to the leaves of Passiflora cearulea [40]. This strategy proved effective – the polyphenols and the antioxidant activity increased in leaves and fruits of P. caerulea treated with the Trichoderma consortium. We showed that the biostimulant effect of the applied Trichoderma consortium involves chloroplast proliferation – to compensate the high light stress exerted on a shadow plant by cultivation in open space. In this work, we intended to differentiate between the contribution of inoculation with two compatible strains, which have more chances to colonize different leaves microhabitats, and the contribution of chlamydospores, that survive better in harsh conditions. The experiments were done by applying the same Trichoderma consortium, prepared from biomass obtained by cultivation on cornmeal medium (that promotes chlamydospore accumulation) and from biomass obtained on potato dextrose broth (PDB). Trichoderma suspension produced on cornmeal was sprayed at two concentration levels, 106 and 108 ufc/ml, and that produced on potato dextrose broth at one concentration, 108 ufc/ml. The effect of these treatments on plant physiological parameters, leaf photosynthetic pigments, polyphenol and flavonoid contents, antioxidant activity of leaves and fruits, and yield, was compared to control (plants sprayed with water).
2. Materials and Methods
2.1. Biological material.
M. charantia (bitter gourd, bitter cucumber) plants were cultivated under greenhouse conditions in an anthropogenic soil (hortic cerno-cambic) with 3.15% humus near Bucharest - 44° 33' 02” N, 26° 04' 12” E, altitude 91 m. The soil of the experimental plots was prepared by disking and raised bedding. Trellises (4.2 m long) were built for each replicate block at 3 m space within the same raised beds and connected with ropes at 2 m height. Irrigation was done using a drip irrigation system (provided by Netafim, Bucharest, Romania), with the emitters at 30 cm. Bitter ground seedlings (cv. Avangard F1, Opal, Plovdiv, Bulgaria) of around 20 cm height were transplanted at the beginning of May, at a distance of 1.4 m × 0.75 m (equivalent to 9000 plants per ha). Temperature in the greenhouse was maintained between 25±5°C during the day, and 18±3°C during the night, and relative humidity was maintained between 60 and 80%.
The used Trichoderma consortium included two multi-functional strains from INCDCP-ICECHIM collection, T. harzianum Td50b, NCAIM F001412 and T. asperellum T36 NCAIM F 001434, that were proved to be effective for phyllosphere colonization in our previous experiment done on P. caerulea [40]. The used strains produce lytic exo-enzymes and volatiles, including 6-pentyl-pyrone [43,44].
For cytocompatibility test the stabilized line of mouse fibroblast L929 cells (ATCC, cell line, NCTC clone 929), provided by the European Collection of Cell Cultures (ECACC), was used.
2.2. (Bio)Chemical Material
Potato dextrose agar (PDA), Potato dextrose broth (PDB), glycerol, and hydrochloric acid 1 M, were purchased from Scharlab (Barcelona, Spain). The ethanol 96% was supplied by ChimReactiv (Bucharest, Romania). The reagent used for the determination of total polyphenols (Folin-Ciocâlteu reagent, sodium carbonate), total flavonoids (aluminum chloride, potassium acetate), the antioxidant activity (DPPH, 2,2-diphenyl-1-picryl-hydrazyl-hydrate, 7 mM 2,2’-azino-bis (3-ethyl-benzothiazoline-6-sulfonic acid) diammonium salt, ABTS, potassium persulfate), and the standards used for calibration, i.e. gallic acid, quercitin and trolox, 6-hydroxy-2,5,7,8-tetramethylchroman-2-carboxylic acidwere acquired from Sigma-Aldrich (Merck Group, Darmstadt, Germany).
2.3. Fungal cultivation
The two Trichoderma strains T36 and Td50b were first replicated on PDA medium using fungal mycelium discs of 5 mm, obtained with a flame-sterilized core borer from older cultures. The incubation was done for 5 days at 28°C, in a static incubator (PHCbi MIR-254-PE, PHC, Tokyo, Japan). The PDB medium was prepared according to the producer recommendations (24 g of powder in 1 L of ddH2O). The cornmeal medium was prepared by adding 62.86 g cornmeal (finely ground in a M20 universal Mill, IKA, Staufen), and 7.54 mL glycerol to 927 mL ddH2O, followed by pH adjustment at pH 4.17 using 0.1 M HCl. All media were sterilized by autoclaving at 121°C for 15 min. After cooling to room temperature, the media were distributed in 500 mL Erlenmeyer flasks (200 mL medium / flask) and inoculated with a spore suspension of 106 conidia/mL of sterile physiological saline water (10% suspension in the final volume). The Erlenmeyer flasks were incubated at 28°C, 130 rpm agitation, for 7 days in an incubated rotary shaker (Unimax 2010, Heidolph, Schwabach, Germany).
2.4. Morphological analysis of T36 and Td50b biomass by optical microscopy
The hyphae and spores from the biomass of the two Trichoderma strain, T36 and Td50b were visualized with an optical microscope DM 1000 LED (Leica, Wetzlar, Germany) in brightfield (BF) module, 40X magnification. The microscope samples were mounted as fresh slide-coverslip preparations. The average diameter of chlamydospores (determined from 20 counts per variant from 10 images) and the average thickness of hyphae (determined from 20 counts per variant from 10 images) were measured with the microscope software LAS X 5.1.0.
2.5. Thermogravimetric analysis
Thermogravimetric analysis (TGA) was performed on dried fungal biomass using a Q5000IR equipment (TA Instruments, New Castle, DE, USA) on 16-25 mg sample in 100 µL platinum pan. For TGA, the mycelium samples were dried in sterile Petri dishes at room temperature. The samples were heated from 20°C to 700°C with a temperature ramp of 10°C/min under nitrogen (99.999%) purged with 50 mL/min. The purge gas was switched to synthetic air (99.999%) at 700°C in hi-res mode and kept isothermal for 5 min to determine the ash content.
2.6. Experimental treatments
The experiment included the following: V1—control (treated with water, spraying volume equivalent to 200 L/ha); V2—foliar treatment with the Trichoderma consortium obtained in cornmeal medium (TCM), a suspension normalized to 106 cfu/mL, in a spraying volume equivalent to 200 L/ha and to a dose of 2 × 10¹¹ spores/ha; V3—foliar treatment with Trichoderma consortium obtained in potato-dextrose broth medium (TPD), a suspension normalized to 108 cfu/mL, in a spraying volume equivalent to 200 L/ha and a dose of 2 × 10¹³ spores/ha; and, V4—foliar treatment with the Trichoderma consortium obtained in cornmeal medium (TCM), a suspension normalized to 108 cfu/mL, in a spraying volume equivalent to 200 L/ha and to a dose of 2 × 10¹³ spores/ha. Each experimental repetition included 21 M. charantia plants. The experimental treatment involved the application of two separate foliar spraying by using an SG20 backpack sprayer (Stihl AG, Waiblingen, Germany) at the beginning of June (beginning of male flowering) and, after 4 weeks, at the beginning of July (female flower development). The applied pressure of the back-up sprayer was 275 kPa. The nozzle used for spraying was a flat jet and low drift (TeeJett® flat-fan TT11002 model, Spraying Systems, Wheaton, IL, US). The yield was determined for all harvesting wave, from all plants in a plot and normalized as kg/ha.
2.7. Determination of plant physiological characteristics
The following physiological characteristics were determined one week after the 1st treatment and 4 weeks after the 2nd treatment (8 weeks after the 1st treatment): Maximum quantum yield of Photosystem II - PSII, Fv/Fm (by chlorophyll fluorescence – saturation of the photosynthetic centers from PSII), Net photosynthetic rate (Pn) (CO2 fixed in the photosynthesis) and stomatal conductance (rate of exchange of gases through stomata, including water vapors). A pulse-amplitude-modulated (PAM) fluorometer (Walz PAM 2500, Effertlich, Germany), was used to determine chlorophyll fluorescence on 10 leaves randomly selected from 21 plants of each repetition. According to the protocol for correctly determining the chlorophyll fluorescence parameters, the leaves were darkened for 30 min. After the darkening period, saturation light pulses were applied. The maximum photosystem II (PSII) quantum efficiency was determined as the ratio between Fv, variable fluorescence, and Fm, the maximum fluorescent yield in the dark-adapted state [45]. The net photosynthetic rate was determined using a leaf gas exchange unit (model LCpro T, ADC Bioscientific Ltd., Herts, England), equipped with a broadleaf chamber. A porometer (AP4, Delta-T Devices, Burwell, UK) was used to determine the stomatal conductance, according to manufacturer instructions. Each determination was repeated three times.
2.8. Determination of total polyphenols and total flavonoids
The plant materials, leaves, and fruits were sampled at the end of August, 12 weeks after the first treatment, and were dried at 50°C for 24 h, under vacuum (in a VD56 oven, Binder, Tuttlingen, Germany). The dried bitter gourd biomass was ground using a laboratory mill (SM2000, Retsch, Haan, Germany) and extracted by maceration in a 70% ethanol-water (v/v) solution for 10 days. After 10 days of maceration, the non-extracted plant material was separated by filtration. The Folin–Ciocâlteu method [46] with slight adaptation [47] was used to determine the total polyphenol content from the ethanolic extract. Briefly, to 150 µL of each sample, 750 µL of Folin–Ciocâlteu reagent, 4 mL of 15% Na2CO3, and 10.1 ml ddH2O were added to reach 15 ml final reaction volume. The reaction was incubated for 2 h at room temperature and in the dark. The optical density was read at λ = 756 nm and converted to polyphenol concentration using a calibration curve made with gallic acid (GA). The colorimetric method with aluminum chloride was used to determine the total flavonoids [48]. Briefly, 0.5 mL of bitter gourd macerate sample was mixed with 1.5 mL ethanol, 0.1 mL of 1 M potassium acetate, 0.1 mL of 10% aluminum chloride, and 2.8 mL ddH2O. The mixture was incubated for 30 min at room temperature. The optical density was measured at λ = 415 nm and converted to flavonoid concentrations using a calibration curve made with the known concentrations of quercetin (Q). All determinations were done in triplicate.
2.9. Antioxidant activity assay
Two different assays were used to determine the antioxidant activity: DPPH (2,2-diphenyl-1-picryl-hydrazyl-hydrate) free radical scavenging and determination of the Trolox equivalent antioxidant capacity (TEAC). Prior analysis, the water-ethanol macerate samples were evaporated to dryness, under vacuum (Rotavapor® R-300, Büchi, Flawil, Switzerland). Exact quantities of dried extracts were resolubilized using known volumes of absolute alcohols. All assays were performed in triplicate.
2.9.1. DPPH scavenging activity assay
The Huang et al. [52] method, with slight modifications, was used. Briefly, 150 μL DPPH methanolic solution (0.25 mM) was mixed with 15 µL of sample (resolubilized in methanol) and 90 µL of 0.1 M Tris-HCl buffer. The resulting mixture was incubated in the dark, at 37°C for 30 minutes. Butylated hydroxytoluene (BHT) was used as a positive control. The optical density of the sample absorbance (ODsample) was read using a microplate reader (Sunrise, Tecan, Männedorf, Switzerland) at λ = 520 nm against a blank with methanol (ODblank). DPPH inhibition (%) was calculated using the following equation:
% Inhibition = (1–ODsample / ODblank)×100.
2.9.2. Antioxidant capacity (TEAC) assay
The method of Re et al. [55] with slight modifications was used. Briefly, the ABTS [(2,2'-azino-bis(3-ethylbenzothiazoline-6-sulphonic acid)] radical was generated by reacting a 7 mM ABTS diammonium salt solution with a 2.45 mM potassium persulfate solution (1:1, v/v). The resulting mixture was incubated in the dark at room temperature for 16 h. The initial optical density of the ABTS radical solution was equilibrated to a value of 0.7 ± 0.02 at λ = 734 nm. Next, a 0.1 mL test sample was mixed with 1 mL of the ABTS radical solution and incubated for 6 min. After incubation, the absorbance was measured at λ = 734 nm. A calibration curve of Trolox (0–250 μM) was used to convert the absorbance into the equivalent activity of Trolox per mL sample (µg Trolox/mL).
2.10. Cell culture biocompatibility
The dried macerate sample from bitter gourd fruits were resuspended into phosphate saline buffer (PBS). The resulting PBS extracts of the M. charantia fruits were sterilized by filtration on 0.22 μm Millipore filters (Merck Millipore, Darmstadt, Germany). The in vitro cytocompatibility assays for bitter gourd fruits extract were done using a stabilized line of mouse fibroblast L929 cells (ATCC NCTC clone 929 cell line), provided by the European Collection of Cell Cultures (ECACC). The NCTC L-929 cells were cultivated as already described [40]. The NCTC L-929 cells were seeded in 24-well plates at a cell density of 5x10⁴ cells/mL for 24 hours to allow adherence. After 24 h, the cells were incubated for 24 and 48 h with different dilutions (50, 100, 200 µg/ml) of bitter gourd extracts. The cell viability was determined using a colorimetric method, based on the ability of viable cells to incorporate a supravital dye, Neutral Red, NR [49]. The absorbance of the solution in the wells was read at λ = 540 nm using a plate reader (Mithras LB 940, Berthold Technologies, Bad Wildbad, Germany). The results were reported as percent viability relative to the control sample (cells incubated without the plant extract) considered as 100% viable.
2.11. Statistical analysis
The data were statistically analyzed by analysis of variance (ANOVA) using the SPSS 21 software package (IBM, Armonk, NY, USA). The data were analyzed in evolution. A least significant difference (LSD) test was used to separate treatment means within each measured parameter at a significance level of p < 0.05.
3. Results and discussion
The morphological features of the Trichoderma strains used, T36 and Td50b, in both PDB and cornmeal medium were: long cylindrical hyphae, with straight or sinuous aspect, segmented in several compartments with one or more nuclei, green micro- and macroconidia with globular aspect, and spherical chlamydospores with thick wall, either intercalated or at the end of the hyphae (Figure 1).
The chlamydospores were more abundant in the culture with cornmeal than with PDB, in agreement with previous studies on corn flour and T. harzianum [50]. Another worth to mention observation was the presence of numerous vacuoles in the hyphae grown in the cornmeal medium (see blue arrows in Figure 1C,D) that were not observed in PDB. Overall, the aspect of mycelia from cornmeal samples had a glassy, bright aspect.
The average diameter of chlamydospores was slightly higher in the cornmeal medium (15.19±2.91 µm and 16.32±3.59 µm for T36 and Td50b, respectively) than in PDB (10.55±2.48 µm and 10.49±2.11 µm for T36 and Td50b, respectively)- Figure 2a,b. The hyphae developed in the cornmeal medium had a higher average thickness (7.49±.1.45 and 7.59±.1.79 µm for T36 and Td50b, respectively) than in PDB (5.20±1.75 µm and 5.26±0.86 µm for T36 and Td50b, respectively)- Figure 2c,d.
The thermogravimetric analysis revealed three main transitions in the thermograms of Trichoderma biomass (Table 1 and Figure 2).
The first transition was between 30°C and approximatimely 190°C for PDB and 220°C for cornmeal. The peak temperature of this transition (T1) was higher for the fungal biomass grown in cornmeal medium (142.0±10.5°C for T36 and 133.0±4.6°C for Td50b) than in PDB (116.5±9.5°C for T36 and 101.6±3.0°C for Td50b). These differences were statistically significant. The weight loss (WL) was slightly higher for T36 and Td50b in cornmeal than in PDB. This transition was very broad and can be assigned to bound water, volatiles, and thermolabile compounds. The increase in the transition temperature, without significant changes in WL suggests stronger bound water molecules, stronger interactions and/or the presence of more thermostable compounds in the mycelium grown in the cornmeal than in PDB.
The second transition was up to 330°C and 340°C for mycelium from cornmeal medium and from PDB, respectively. The peak temperature of this transition (T2) was higher for the fungal biomass grown in cornmeal medium (305.2±1.7°C for T36 and 307.2±0.7°C for Td50b) than in PDB (299.1±1.1°C for T36 and 302.1±0.4°C for Td50b). The WL was higher as well, by approximately 5-7% more for cornmeal medium compared to the PDB medium. This transition has been previously shown to have significant contribution from β-glucan in macromycetes [51,52] and it probably includes other polysaccharides, lipids and proteins as well. Our results indicate an increase in the biomass of T36 and Td50b mycelium represented by these compounds when the strains were grown in the cornmeal medium compared to the control in PDB.
The third transition was from 330/340°C to 700°C. This transition was characterized by a peak temperature (T3) slightly lower and WL slightly higher of mycelium from cornmeal medium compared to PDB. This transition has been shown to have contribution from chitin in macromycetes [51,52]. In our case, the standard chitin had the main peak at intermediate temperature (380°C) between T2 and T3, closer to T3. These data suggest that the chitin in these strains is more thermostable than the isolated chitin and the chitin from macromycetes.
A significant effect was observed for the residue and ash content that were significantly decreased in cornmeal compared with PDB (Table 1). This indicates lower accumulation of minerals. It is worth northly to mention that the ash of T36 was higher than of Td50b in PDB, but became similar in cornmeal. This indicates that the effect of cornmeal on ash accumulation was higher for T36 than for Td50b. The difference between the residue and the ash represents carbonaceous structures that formed upon thermal degradation. This was similar for T36 grown in PDB and cornmeal (11.63±0.30 versus 11.11±0.37%, respectively) but slightly lower for Td50b grown in cornmeal medium than in PDB (11.02±0.23 versus 13.42±0.45%, respectively). Td50b seems to accumulate less carbon in cornmeal than in PDB and the values in cornmeal were similar between T36 and Td50b.
The optical microscopy and the thermogravimetric analysis demonstrated a more significant proportion of chlamydospores in the biomass produced in cornmeal medium than in PDB. Chlamydospore presence in larger amount in the biomass produced in cornmeal than in PDB medium is demonstrated also by the thermogravimetric analysis. To the best of our knowledge, thermogravimetric analysis has not been previously used for the characterization of the Trichoderma biomass containing spores – only for the characterization of different types of Trichoderma formulations, such as T. harzianum LQC-99 encapsulated in cellulose nanocrystals (CNC) or in nanocomposite of CNC with carboxymethyl cellulose (CMC) [53] or T. harzianum UPM40 encapsulated in Ca-alginate — montmorillonite clay beads [54].
In the case of bacterial spores, the thermogravimetric analysis was used to demonstrate that water distribution is the key factor in spore resistance to adverse conditions such a high temperature [55]. Our TGA data revealed a higher evaporation temperature for the bound water in the biomass obtained from cornmeal than PDB medium — this demonstrates a higher proportion of spores with higher resistance (chlamydospores) in the biomass produced in cornmeal medium than in PDB.
Figure 4 illustrates the influence of different treatments with the Trichoderma consortium on M. charantia physiological parameters.
The foliar treatment with Trichoderma consortium improves the photosynthesis in M. charantia. The yield of PS II is slightly enhanced. A similar low increase, at the limit of the statistical significance is demonstrated for the net photosynthetic rate. The most significant effect is for the stomatal conductance, very significantly improved by the treatment with the Trichoderma consortium. In our previous work, we demonstrated a similar effect on blue passion flower, P. caerulea [40]. In this work we differentiate the effect of a compatible consortium, with strains showing different plasticity and adaptability to the highly variable conditions of the phyllosphere and the abundance of the chlamydospores. The treatment with chlamydospore formulation lasts for a longer period. The application of the lower dose of 106 ufc/mL from propagules resulted from biomass rich in chlamydospores, produced in cornmeal, is almost similar with the higher dose of 108 ufc/mL, produced in PDB. Trichoderma rich in chlamydospores determine a long lasting plant biostimulant effect. Higher survival rate of the chlamydospore in the harsh environment determine better Understanding the exact mechanism of such biostimulant action needs further investigations.
Trichoderma application in the rhizosphere was demonstrated to determine a a metabolic reprogramming. Application of T. harzianum T22 on zucchini squash (Cucurbita pepo L.) cv. ‘San Pasquale’ triggered ROS-mediated signaling processes and improved the photosynthetic process [56]. T. harzianum T6776 inoculated to root system of Micro-Tom tomatoes (Solanum lycopersicum) improved the photosynthetic activity – the quantum yield of PSII system, the net photosynthetic rate [57].
The yield of the different experimental treatments is presented in Table 2.
The yield also demonstrates the highest influence exerted by Trichoderma consortium grown in cornmeal medium (TCM), which contains a higher proportion of chlamydospores, more resistant to harsh environmental conditions than conidia. Such chlamydospores sustain the colonization of the phyllosphere by Trichoderma strains originating from soil and enhance the biostimulant effects. Very few studies are related to the use of Trichoderma as a plant biostimulant applied by foliar treatment. Trichoderma applied as foliar treatment increase the quality of the tomatoes grown in different hydroponic substrates [58].
Trichoderma was tested as foliar application mainly for plant pathogen control [59,60]. One of the mechanism involved in plant pathogen control was the activation of the plant defense system [59]. The activation of plant defense is also involved in biostimulant effect [40]. In several situations, the control of the plant pathogens following foliar application of Trichoderma was associated with an increase of the crop quality, e.g., accumulation of polyphenols in grape [28]. T. harzianum T39 controls Plasmopara viticola on susceptible grapevine, cv Pinot Noir, grown in pots, by activation of phenylalanine ammonia lyase (PAL) and stilbene synthase (STS) [61]. The activation of these stress related enzymes enhance the biosynthesis and the accumulation of resveratrol in grape [62,63]. However, till now, to the best of our knowledge, there are no reports on elicitation of the resveratrol biosynthesis and accumulation in grape following Trichoderma foliar treatment.
The foliar application of Trichoderma enhanced the accumulation of polyphenols and flavonoids in leaves of bitter gourd (Figure 5a) and the antioxidant activity (Figure 5b).
The chlamydospore formulations are more active than the control formulation from PDB medium on inducing biosynthesis and accumulation of antioxidant polyphenols/flavonoids. The low dose, of 106 ufc/ml, produced on cornmeal (TCM) has almost similar effect with the high dose produced in PBD (TPD). A similar effect, of higher accumulation of polyphenols in leaves, was demonstrated for the application of the same consortium, T36 and Td50b, on blue passion flower [40]. The application of Trichoderma strains on rhizosphere was demonstrated to induce accumulation of polyphenols [56]. The effect on inducing biosynthesis and accumulation of antioxidant polyphenols/flavonoids is similar for fruits – Figure 6.
The increase of the polyphenol content in fruits is not associated with an enhancement of the cytotoxic effect of fruit extracts – Figure 7.
4. Conclusions
The foliar application of a Trichoderma consortium chlamydospores formulation to M. charantia promote phyllosphere colonization and determine a long lasting biostimulant effect, more pronounced that the effect induce by the treatment with Trichoderma biomass with lower abundance of chlamydospores. More investigations related to mechanism involved in phyllosphere colonization will offer new possibilities for further improvement of the foliar treatment with plant biostimulant Trichoderma, including through “smart” controlled released formulations.
Supplementary Materials
The following supporting information can be downloaded at the website of this paper posted on Preprints.org, Figure S1: Optical microscopical images of T. asperellum T36 NCAIM F 001434 grown in PDB (a, b) and cornmeal medium (c, d); Figure S2: Optical microscopical images of T. harzianum, Td50b, NCAIM F001412 grown in PDB (a, b) and cornmeal medium (c, d); Figure S3: Thermogravimetric analysis of T. asperellum T36 NCAIM F 001434 (a, c) and T. harzianum, Td50b, NCAIM F001412 (b, d) grown in PDB (a, b) and cornmeal medium (c, d).
Author Contributions
Conceptualization, D.C.-A. and F.O.; methodology, I.A.B., A.O., O.C., M.G., C.-A.N. and D.C.-A.; validation, D.C-A., T.E.S and F.O.; formal analysis, D.C-A. and B.T.; investigation, I.A.B., A.O., O.C., M.G., I.R. and C.-A.N.; resources, F.O. and T.E.S; data curation, D.C.-A.; writing—original draft preparation, I.A.B. and T.E.S; writing—review and editing, D.C.-A. and F.O.; visualization, D.C.-A., I.A.B., and B.T.; supervision, F.O.; project administration, D.C.-A.; funding acquisition, D.C.-A. All authors have read and agreed to the published version of the manuscript.
Funding
This research was funded by the Ministry of Research, Innovation and Digitization, CNCS/CCCDI—UEFISCDI, project PN-III-P4-ID-PCE-2020-2780, contract 107PCE/2021 and project PN 23.06.02.01 InteGral, Nucleu Program. The APC was funded by project PN 23.06.02.01 InteGral
Institutional Review Board Statement
Not applicable
Data Availability Statement
Data are within the article
Conflicts of Interest
The authors declare no conflict of interest. The funders had no role in the design of the study; in the collection, analyses, or interpretation of data; in the writing of the manuscript; or in the decision to publish the results.
References
- Abdullah, N.S.; Doni, F.; Mispan, M.S.; Saiman, M.Z.; Yusuf, Y.M.; Oke, M.A.; Suhaimi, N.S.M. Harnessing <i>Trichoderma</i> in Agriculture for Productivity and Sustainability. Agronomy-Basel 2021, 11. [CrossRef]
- Guzmán-Guzmán, P.; Kumar, A.; de los Santos-Villalobos, S.; Parra-Cota, F.I.; Orozco-Mosqueda, M.D.; Fadiji, A.E.; Hyder, S.; Babalola, O.O.; Santoyo, G. <i>Trichoderma</i> Species: Our Best Fungal Allies in the Biocontrol of Plant Diseases-A Review. Plants-Basel 2023, 12. [CrossRef]
- Rodrigues, A.O.; De Mio, L.L.M.; Soccol, C.R. <i>Trichoderma</i> as a powerful fungal disease control agent for a more sustainable and healthy agriculture: recent studies and molecular insights. Planta 2023, 257. [CrossRef]
- Sharon, E.; Bar-Eyal, M.; Chet, I.; Herrera-Estrella, A.; Kleifeld, O.; Spiegel, Y. Biological control of the root-knot nematode <i>Meloidogyne javanica</i> by <i>Trichoderma harzianum</i>. Phytopathology 2001, 91, 687-693. [CrossRef]
- Sahebani, N.; Hadavi, N. Biological control of the root-knot nematode <i>Meloidogyne javanica</i> by <i>Trichoderma harzianum</i>. Soil Biology & Biochemistry 2008, 40, 2016-2020. [CrossRef]
- Rodríguez-González, A.; Casquero, P.A.; Suárez-Villanueva, V.; Carro-Huerga, G.; Alvarez-García, S.; Mayo-Prieto, S.; Lorenzana, A.; Cardoza, R.E.; Gutiérrez, S. Effect of trichodiene production by <i>Trichoderma harzianum</i> on <i>Acanthoscelides obtectus</i>. Journal of Stored Products Research 2018, 77, 231-239. [CrossRef]
- Rodriguez-Gonzalez, A.; Guerra, M.; Ramirez-Lozano, D.; Casquero, P.A.; Gutierrez, S. Germination and Agronomic Traits of <i>Phaseolus vulgaris</i> L. Beans Sprayed with <i>Trichoderma</i> Strains and Attacked by <i>Acanthoscelides obtectus</i>. Agronomy-Basel 2021, 11. [CrossRef]
- López-Bucio, J.; Pelagio-Flores, R.; Herrera-Estrella, A. <i>Trichoderma</i> as biostimulant: exploiting the multilevel properties of a plant beneficial fungus. Scientia Horticulturae 2015, 196, 109-123. [CrossRef]
- Woo, S.L.; Hermosa, R.; Lorito, M.; Monte, E. Trichoderma: A multipurpose, plant-beneficial microorganism for eco-sustainable agriculture. Nature Reviews Microbiology 2023, 21, 312-326. [CrossRef]
- Viterbo, A.; Ramot, O.; Chernin, L.; Chet, I. Significance of lytic enzymes from Trichoderma spp. in the biocontrol of fungal plant pathogens. Antonie Van Leeuwenhoek 2002, 81, 549-556. [CrossRef]
- Brotman, Y.; Briff, E.; Viterbo, A.; Chet, I. Role of swollenin, an expansin-like protein from Trichoderma, in plant root colonization. Plant physiology 2008, 147, 779-789. [CrossRef]
- Sharma, A.; Salwan, R.; Sharma, V. Extracellular proteins of Trichoderma and their role in plant health. South African Journal of Botany 2022, 147, 359-369. [CrossRef]
- Vinale, F.; Sivasithamparam, K. Beneficial effects of Trichoderma secondary metabolites on crops. Phytotherapy Research 2020, 34, 2835-2842. [CrossRef]
- Carillo, P.; Woo, S.L.; Comite, E.; El-Nakhel, C.; Rouphael, Y.; Fusco, G.M.; Borzacchiello, A.; Lanzuise, S.; Vinale, F. Application of Trichoderma harzianum, 6-pentyl-α-pyrone and plant biopolymer formulations modulate plant metabolism and fruit quality of plum tomatoes. Plants 2020, 9, 771. [CrossRef]
- Malmierca, M.; Cardoza, R.; Alexander, N.; McCormick, S.; Hermosa, R.; Monte, E.; Gutiérrez, S. Involvement of Trichoderma trichothecenes in the biocontrol activity and induction of plant defense-related genes. Applied and Environmental Microbiology 2012, 78, 4856-4868. [CrossRef]
- Shahriar, S.A.; Islam, M.N.; Chun, C.N.W.; Kaur, P.; Rahim, M.A.; Islam, M.M.; Uddain, J.; Siddiquee, S. Microbial metabolomics interaction and ecological challenges of Trichoderma species as biocontrol inoculant in crop rhizosphere. Agronomy 2022, 12, 900. [CrossRef]
- Elad, Y. Biological control of foliar pathogens by means of Trichoderma harzianum and potential modes of action. Crop Protection 2000, 19, 709-714. [CrossRef]
- Coppola, M.; Cascone, P.; Lelio, I.D.; Woo, S.L.; Lorito, M.; Rao, R.; Pennacchio, F.; Guerrieri, E.; Digilio, M.C. Trichoderma atroviride P1 Colonization of Tomato Plants Enhances Both Direct and Indirect Defense Barriers Against Insects. Frontiers in Physiology 2019, 10. [CrossRef]
- Salwan, R.; Sharma, A.; Kaur, R.; Sharma, R.; Sharma, V. The riddles of Trichoderma induced plant immunity. Biological Control 2022, 174, 105037. [CrossRef]
- Macías-Rodríguez, L.; Contreras-Cornejo, H.A.; Adame-Garnica, S.G.; del-Val, E.; Larsen, J. The interactions of <i>Trichoderma</i> at multiple trophic levels: inter-kingdom communication. Microbiological Research 2020, 240. [CrossRef]
- Nawrocka, J.; Małolepsza, U. Diversity in plant systemic resistance induced by Trichoderma. Biological Control 2013, 67, 149-156. [CrossRef]
- Morán-Diez, M.E.; Martínez de Alba, Á.E.; Rubio, M.B.; Hermosa, R.; Monte, E. Trichoderma and the Plant Heritable Priming Responses. Journal of Fungi 2021, 7, 318. [CrossRef]
- Tyśkiewicz, R.; Nowak, A.; Ozimek, E.; Jaroszuk-Ściseł, J. Trichoderma: The Current Status of Its Application in Agriculture for the Biocontrol of Fungal Phytopathogens and Stimulation of Plant Growth. International Journal of Molecular Sciences 2022, 23, 2329. [CrossRef]
- Pacheco-Trejo, J.; Aquino-Torres, E.; Reyes-Santamaría, M.I.; Islas-Pelcastre, M.; Pérez-Ríos, S.R.; Madariaga-Navarrete, A.; Saucedo-García, M. Plant Defensive Responses Triggered by Trichoderma spp. as Tools to Face Stressful Conditions. Horticulturae 2022, 8, 1181. [CrossRef]
- Shang, J.; Liu, B.; Xu, Z. Efficacy of Trichoderma asperellum TC01 against anthracnose and growth promotion of Camellia sinensis seedlings. Biological Control 2020, 143, 104205. [CrossRef]
- Coppola, M.; Diretto, G.; Digilio, M.C.; Woo, S.L.; Giuliano, G.; Molisso, D.; Pennacchio, F.; Lorito, M.; Rao, R. Transcriptome and Metabolome Reprogramming in Tomato Plants by Trichoderma harzianum strain T22 Primes and Enhances Defense Responses Against Aphids. Frontiers in Physiology 2019, 10. [CrossRef]
- Dini, I.; Pascale, M.; Staropoli, A.; Marra, R.; Vinale, F. Effect of Selected Trichoderma Strains and Metabolites on Olive Drupes. Applied Sciences 2021, 11, 8710. [CrossRef]
- Pascale, A.; Vinale, F.; Manganiello, G.; Nigro, M.; Lanzuise, S.; Ruocco, M.; Marra, R.; Lombardi, N.; Woo, S.L.; Lorito, M. Trichoderma and its secondary metabolites improve yield and quality of grapes. Crop protection 2017, 92, 176-181. [CrossRef]
- Guzmán-Guzmán, P.; Porras-Troncoso, M.D.; Olmedo-Monfil, V.; Herrera-Estrella, A. Trichoderma species: versatile plant symbionts. Phytopathology 2019, 109, 6-16. [CrossRef]
- Pacheco-Ordaz, R.; Wall-Medrano, A.; Goñi, M.G.; Ramos-Clamont-Montfort, G.; Ayala-Zavala, J.F.; González-Aguilar, G. Effect of phenolic compounds on the growth of selected probiotic and pathogenic bacteria. Letters in applied microbiology 2018, 66, 25-31. [CrossRef]
- Taylor, J.T.; Harting, R.; Shalaby, S.; Kenerley, C.M.; Braus, G.H.; Horwitz, B.A. Adhesion as a Focus in Trichoderma-Root Interactions. Journal of Fungi 2022, 8. [CrossRef]
- Vacher, C.; Hampe, A.; Porté, A.J.; Sauer, U.; Compant, S.; Morris, C.E. The Phyllosphere: Microbial Jungle at the Plant-Climate Interface. In Annual Review of Ecology, Evolution, and Systematics, Vol 47, Futuyma, D.J., Ed. 2016; Vol. 47, pp. 1-24.
- Xu, N.H.; Zhao, Q.Q.; Zhang, Z.Y.; Zhang, Q.; Wang, Y.; Qin, G.Y.; Ke, M.J.; Qiu, D.Y.; Peijnenburg, W.; Lu, T.; Qian, H.F. Phyllosphere Microorganisms: Sources, Drivers, and Their Interactions with Plant Hosts. Journal of Agricultural and Food Chemistry 2022, 70, 4860-4870. [CrossRef]
- Zhu, Y.G.; Xiong, C.; Wei, Z.; Chen, Q.L.; Ma, B.; Zhou, S.Y.D.; Tan, J.Q.; Zhang, L.M.; Cui, H.L.; Duan, G.L. Impacts of global change on the phyllosphere microbiome. New Phytologist 2022, 234, 1977-1986. [CrossRef]
- Sohrabi, R.; Paasch, B.C.; Liber, J.A.; He, S.Y. Phyllosphere Microbiome. Annual Review of Plant Biology 2023, 74, 539-568. [CrossRef]
- Mandal, S.D.; Jeon, J. Phyllosphere Microbiome in Plant Health and Disease. Plants-Basel 2023, 12. [CrossRef]
- Oancea, F.; Raut, I.; Sesan, T.E.; Cornea, P.C. Dry Flowable Formulation of Biostimulants <i>Trichoderma</i> strains. In Proceedings of 5th International Conference on Agriculture for Life, Life for Agriculture, Bucharest, ROMANIA, Jun 09-10; pp. 494-502.
- Kamble, M.V.; Joshi, S.M.; Hadimani, S.; Jogaiah, S. Biopriming with rhizosphere Trichoderma harzianum elicit protection against grapevine downy mildew disease by triggering histopathological and biochemical defense responses. Rhizosphere 2021, 19, 100398. [CrossRef]
- Martinez, Y.; Ribera, J.; Schwarze, F.W.; De France, K. Biotechnological development of Trichoderma-based formulations for biological control. Applied Microbiology and Biotechnology 2023, 107, 5595-5612. [CrossRef]
- Şesan, T.E.; Oancea, A.O.; Ştefan, L.M.; Mănoiu, V.S.; Ghiurea, M.; Răut, I.; Constantinescu-Aruxandei, D.; Toma, A.; Savin, S.; Bira, A.F. Effects of foliar treatment with a Trichoderma plant biostimulant consortium on Passiflora caerulea L. yield and quality. Microorganisms 2020, 8, 123. [CrossRef]
- Tan, S.P.; Kha, T.C.; Parks, S.E.; Roach, P.D. Bitter melon (Momordica charantia L.) bioactive composition and health benefits: A review. Food Reviews International 2016, 32, 181-202. [CrossRef]
- Richter, E.; Geetha, T.; Burnett, D.; Broderick, T.L.; Babu, J.R. The Effects of Momordica charantia on Type 2 Diabetes Mellitus and Alzheimer’s Disease. International Journal of Molecular Sciences 2023, 24, 4643.
- Oancea, F.; Mara, G.; Sesan, T.E.; Máthé. I.; Răut, I.; Ábrahám, B.; Lányi, S. Strain of Trichoderma harzianum and controlled release composition which contains said strain. EP2735607A1, 2014.
- Raut, I.; Badea-Doni, M.; Calin, M.; Oancea, F.; Vasilescu, G.; Sesan, T.E.; Jecu, L. Effect of volatile and non-volatile metabolites from Trichoderma spp. against important phytopathogens. Revista de Chimie 2014, 65, 1285-1288.
- Lichtenthaler, H.; Buschmann, C.; Knapp, M. How to correctly determine the different chlorophyll fluorescence parameters and the chlorophyll fluorescence decrease ratio R Fd of leaves with the PAM fluorometer. Photosynthetica 2005, 43, 379-393. [CrossRef]
- Huang, D.; Ou, B.; Prior, R.L. The chemistry behind antioxidant capacity assays. Journal of agricultural and food chemistry 2005, 53, 1841–1856. [CrossRef]
- Craciunescu, O.; Constantin, D.; Gaspar, A.; Toma, L.; Utoiu, E.; Moldovan, L. Evaluation of antioxidant and cytoprotective activities of Arnica montana L. and Artemisia absinthium L. ethanolic extracts. Chemistry Central journal 2012, 6, 97. [CrossRef]
- Chang, C.-C.; Yang, M.-H.; Wen, H.-M.; Chern, J.-C. Estimation of total flavonoid content in propolis by two complementary colorimetric methods. Journal of food and drug analysis 2002, 10.
- Repetto, G.; Del Peso, A.; Zurita, J.L. Neutral red uptake assay for the estimation of cell viability/cytotoxicity. Nature protocols 2008, 3, 1125. [CrossRef]
- Li, Y.-q.; Song, K.; Li, Y.-c.; Chen, J. Statistical culture-based strategies to enhance chlamydospore production by Trichoderma harzianum SH2303 in liquid fermentation. Journal of Zhejiang University-SCIENCE B 2016, 17, 619-627. [CrossRef]
- Girometta, C.; Dondi, D.; Baiguera, R.M.; Bracco, F.; Branciforti, D.S.; Buratti, S.; Lazzaroni, S.; Savino, E. Characterization of mycelia from wood-decay species by TGA and IR spectroscopy. Cellulose 2020, 27, 6133-6148. [CrossRef]
- Cartabia, M.; Girometta, C.E.; Milanese, C.; Baiguera, R.M.; Buratti, S.; Branciforti, D.S.; Vadivel, D.; Girella, A.; Babbini, S.; Savino, E.; Dondi, D. Collection and Characterization of Wood Decay Fungal Strains for Developing Pure Mycelium Mats. Journal of Fungi 2021, 7, 1008. [CrossRef]
- Brondi, M.; Florencio, C.; Mattoso, L.; Ribeiro, C.; Farinas, C. Encapsulation of Trichoderma harzianum with nanocellulose/carboxymethyl cellulose nanocomposite. Carbohydrate Polymers 2022, 295, 119876. [CrossRef]
- Adzmi, F.; Meon, S.; Musa, M.H.; Yusuf, N.A. Preparation, characterisation and viability of encapsulated Trichoderma harzianum UPM40 in alginate-montmorillonite clay. Journal of Microencapsulation 2012, 29, 205-210. [CrossRef]
- Tiburski, J.H.; Rosenthal, A.; Guyot, S.; Perrier-Cornet, J.-M.; Gervais, P. Water distribution in bacterial spores: a key factor in heat resistance. Food biophysics 2014, 9, 10-19. [CrossRef]
- Formisano, L.; Miras-Moreno, B.; Ciriello, M.; El-Nakhel, C.; Corrado, G.; Lucini, L.; Colla, G.; Rouphael, Y. Trichoderma and Phosphite Elicited Distinctive Secondary Metabolite Signatures in Zucchini Squash Plants. Agronomy 2021, 11, 1205. [CrossRef]
- Fiorini, L.; Guglielminetti, L.; Mariotti, L.; Curadi, M.; Picciarelli, P.; Scartazza, A.; Sarrocco, S.; Vannacci, G. Trichoderma harzianum T6776 modulates a complex metabolic network to stimulate tomato cv. Micro-Tom growth. Plant and Soil 2016, 400, 351-366. [CrossRef]
- Palacios-Torres, R.E.; Bustamante-Ortiz, A.G.; Prieto-Baeza, L.A.; Hernández-Hernández, H.; Ramírez-Seañez, A.R.; Yam-Tzec, J.A.; Díaz-Félix, G. Effect of foliar application of Trichoderma on the quality of tomato fruits grown in different hydroponic substrates. Folia Horticulturae 2019, 31, 355-364. [CrossRef]
- Elad, Y. Biological control of foliar pathogens by means of Trichoderma harzianum and potential modes of action. Crop protection 2000, 19, 709-714. [CrossRef]
- Lo, C.-T.; Nelson, E.; Harman, G. Improved biocontrol efficacy of Trichoderma harzianum 1295-22 for foliar phases of turf diseases by use of spray applications. Plant disease 1997, 81, 1132-1138. [CrossRef]
- Perazzolli, M.; Moretto, M.; Fontana, P.; Ferrarini, A.; Velasco, R.; Moser, C.; Delledonne, M.; Pertot, I. Downy mildew resistance induced by Trichoderma harzianum T39 in susceptible grapevines partially mimics transcriptional changes of resistant genotypes. BMC Genomics 2012, 13, 660. [CrossRef]
- Hasan, M.M.; Bae, H. An overview of stress-induced resveratrol synthesis in grapes: perspectives for resveratrol-enriched grape products. Molecules 2017, 22, 294. [CrossRef]
- Sun, Y.; Xi, B.; Dai, H. Effects of Water Stress on Resveratrol Accumulation and Synthesis in ‘Cabernet Sauvignon’Grape Berries. Agronomy 2023, 13, 633. [CrossRef]
Figure 1.
Optical microscopical images of T. asperellum T36 NCAIM F 001434 (a, c) and T. harzianum, Td50b, NCAIM F001412 (b, d) grown in PDB (a, b) and cornmeal medium (c, d). The blue arrows indicate the presence of vacuoles/droplets inside hyphae in the case of cornmeal medium.
Figure 1.
Optical microscopical images of T. asperellum T36 NCAIM F 001434 (a, c) and T. harzianum, Td50b, NCAIM F001412 (b, d) grown in PDB (a, b) and cornmeal medium (c, d). The blue arrows indicate the presence of vacuoles/droplets inside hyphae in the case of cornmeal medium.
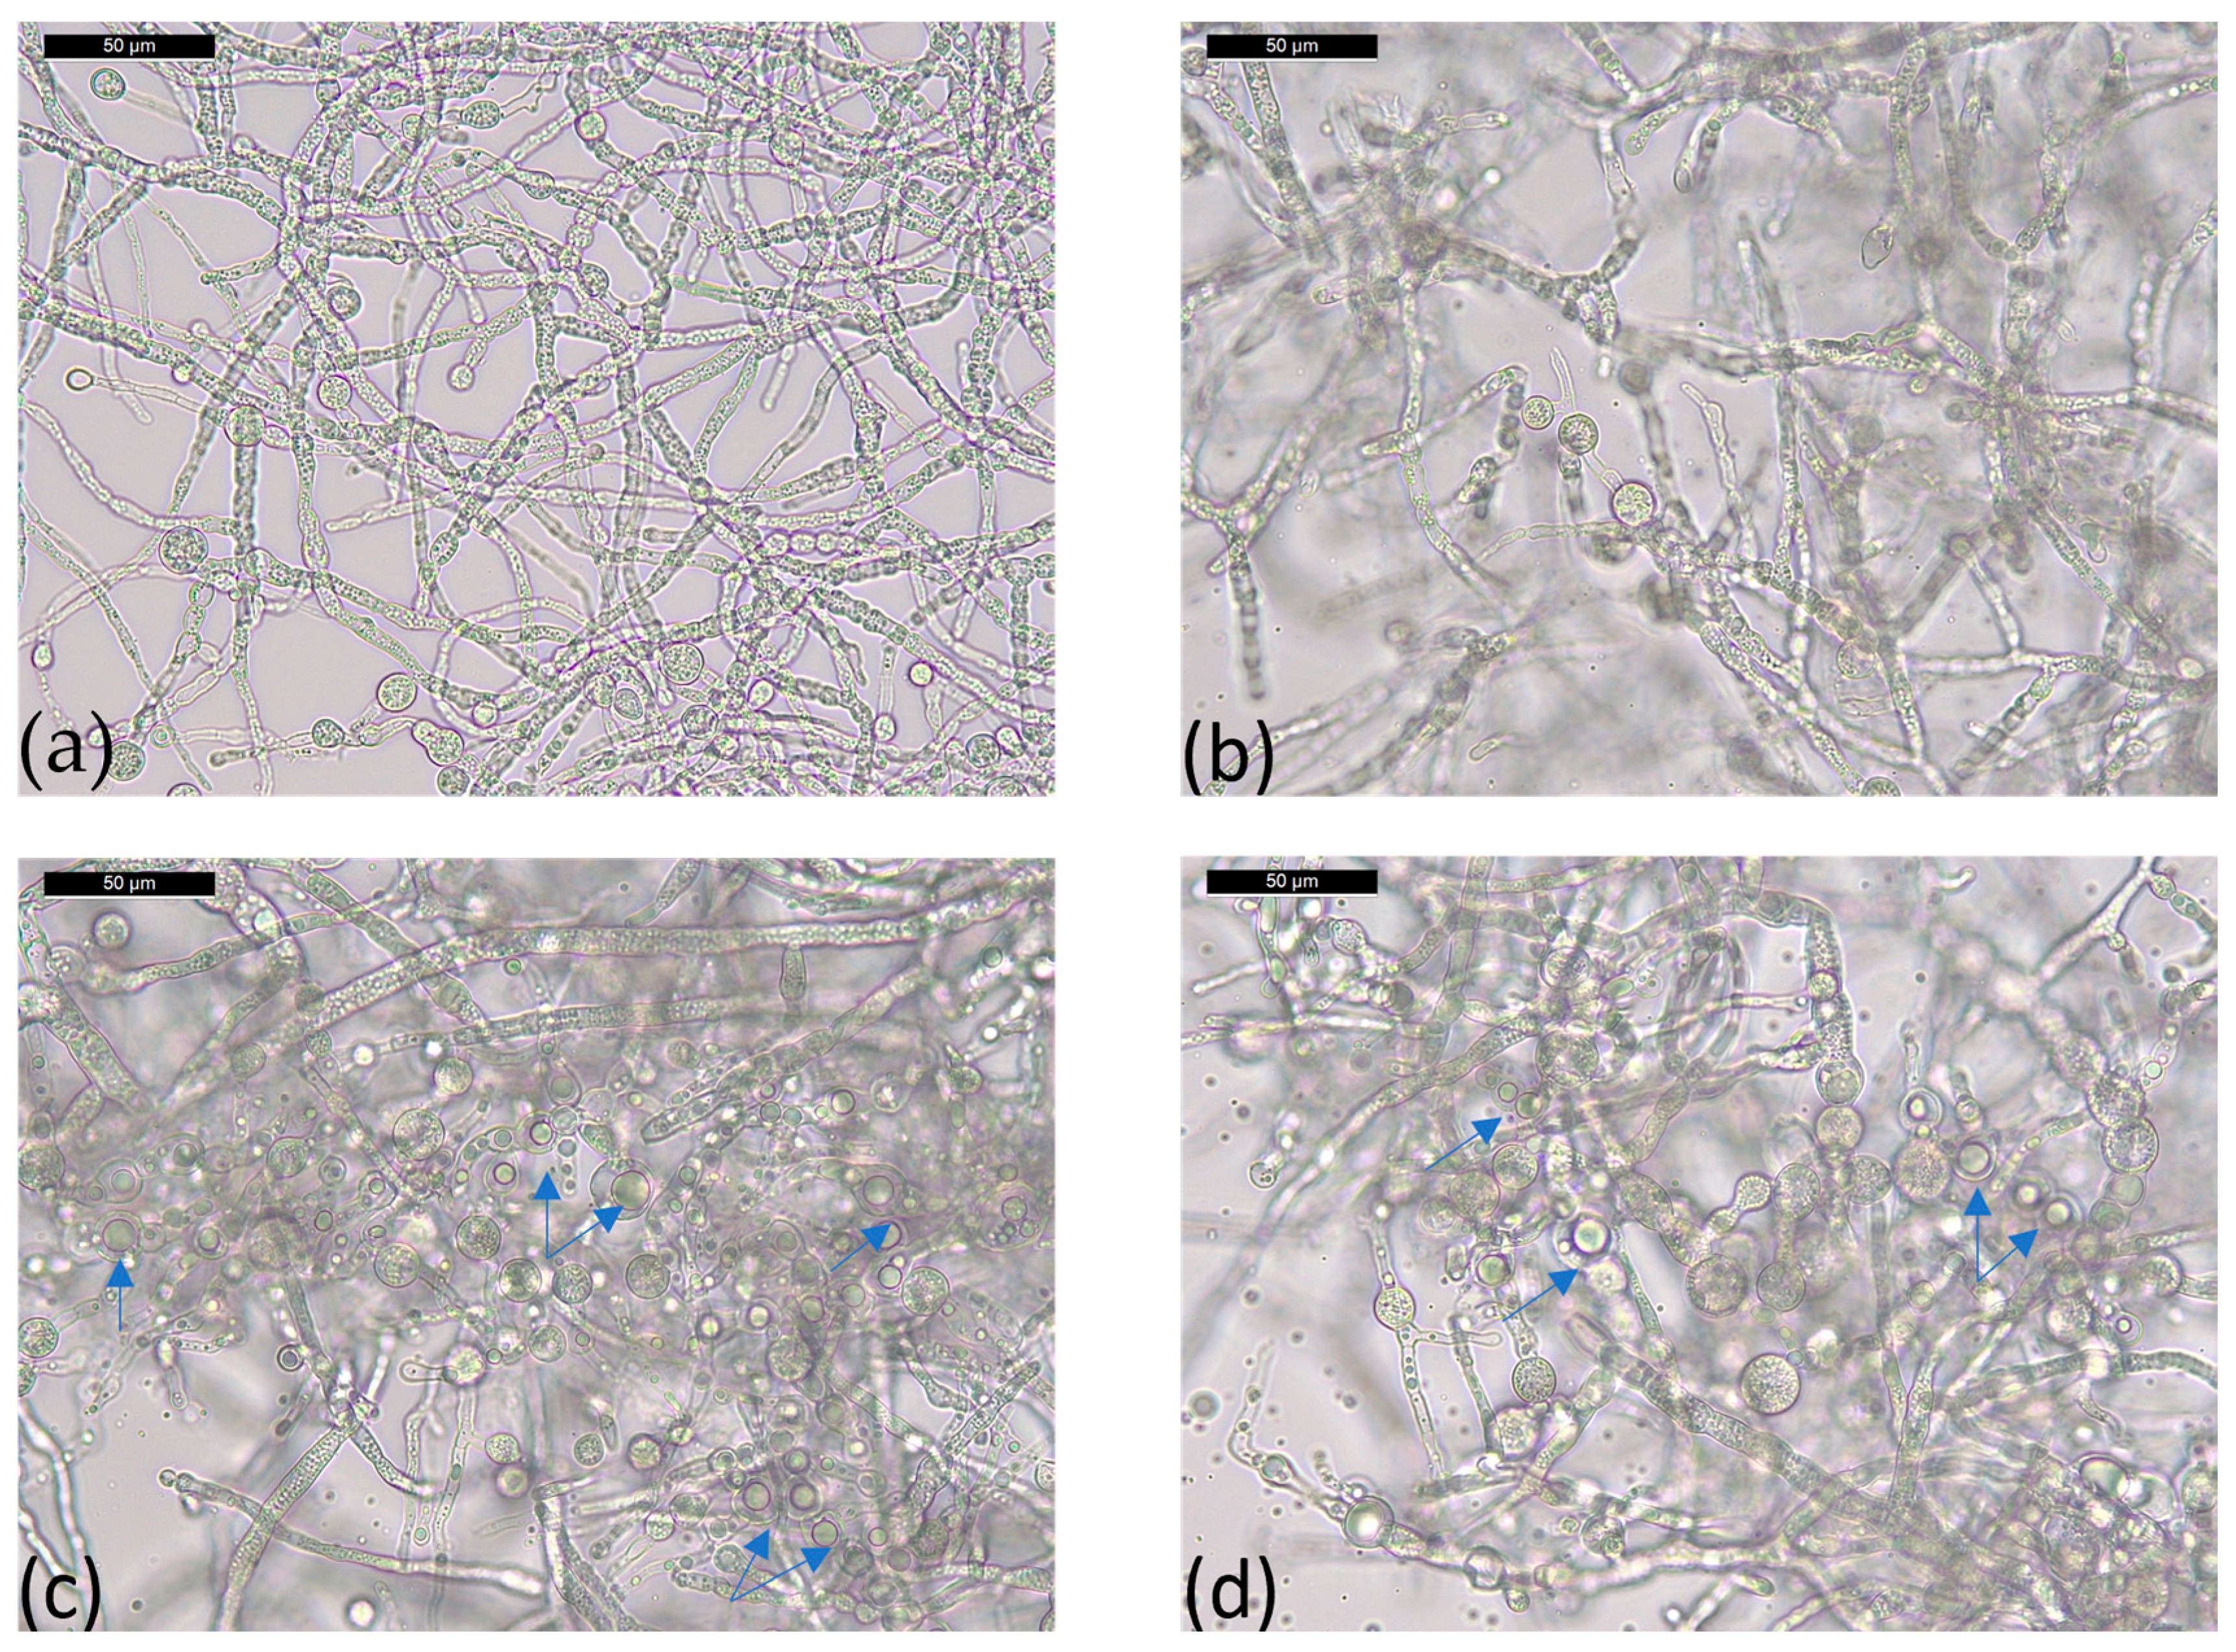
Figure 2.
The average diameter of chlamydospores of T. asperellum T36 NCAIM F 001434 and T. harzianum, Td50b, NCAIM F001412 (a) grown in PDB and cornmeal medium, respectively, and the average thickness of hyphae of T. asperellum T36 NCAIM F 001434 and T. harzianum, Td50b, NCAIM F001412 (b) grown in PDB and cornmeal meal, respectively (± standard bars, α=0.05, n= 20).
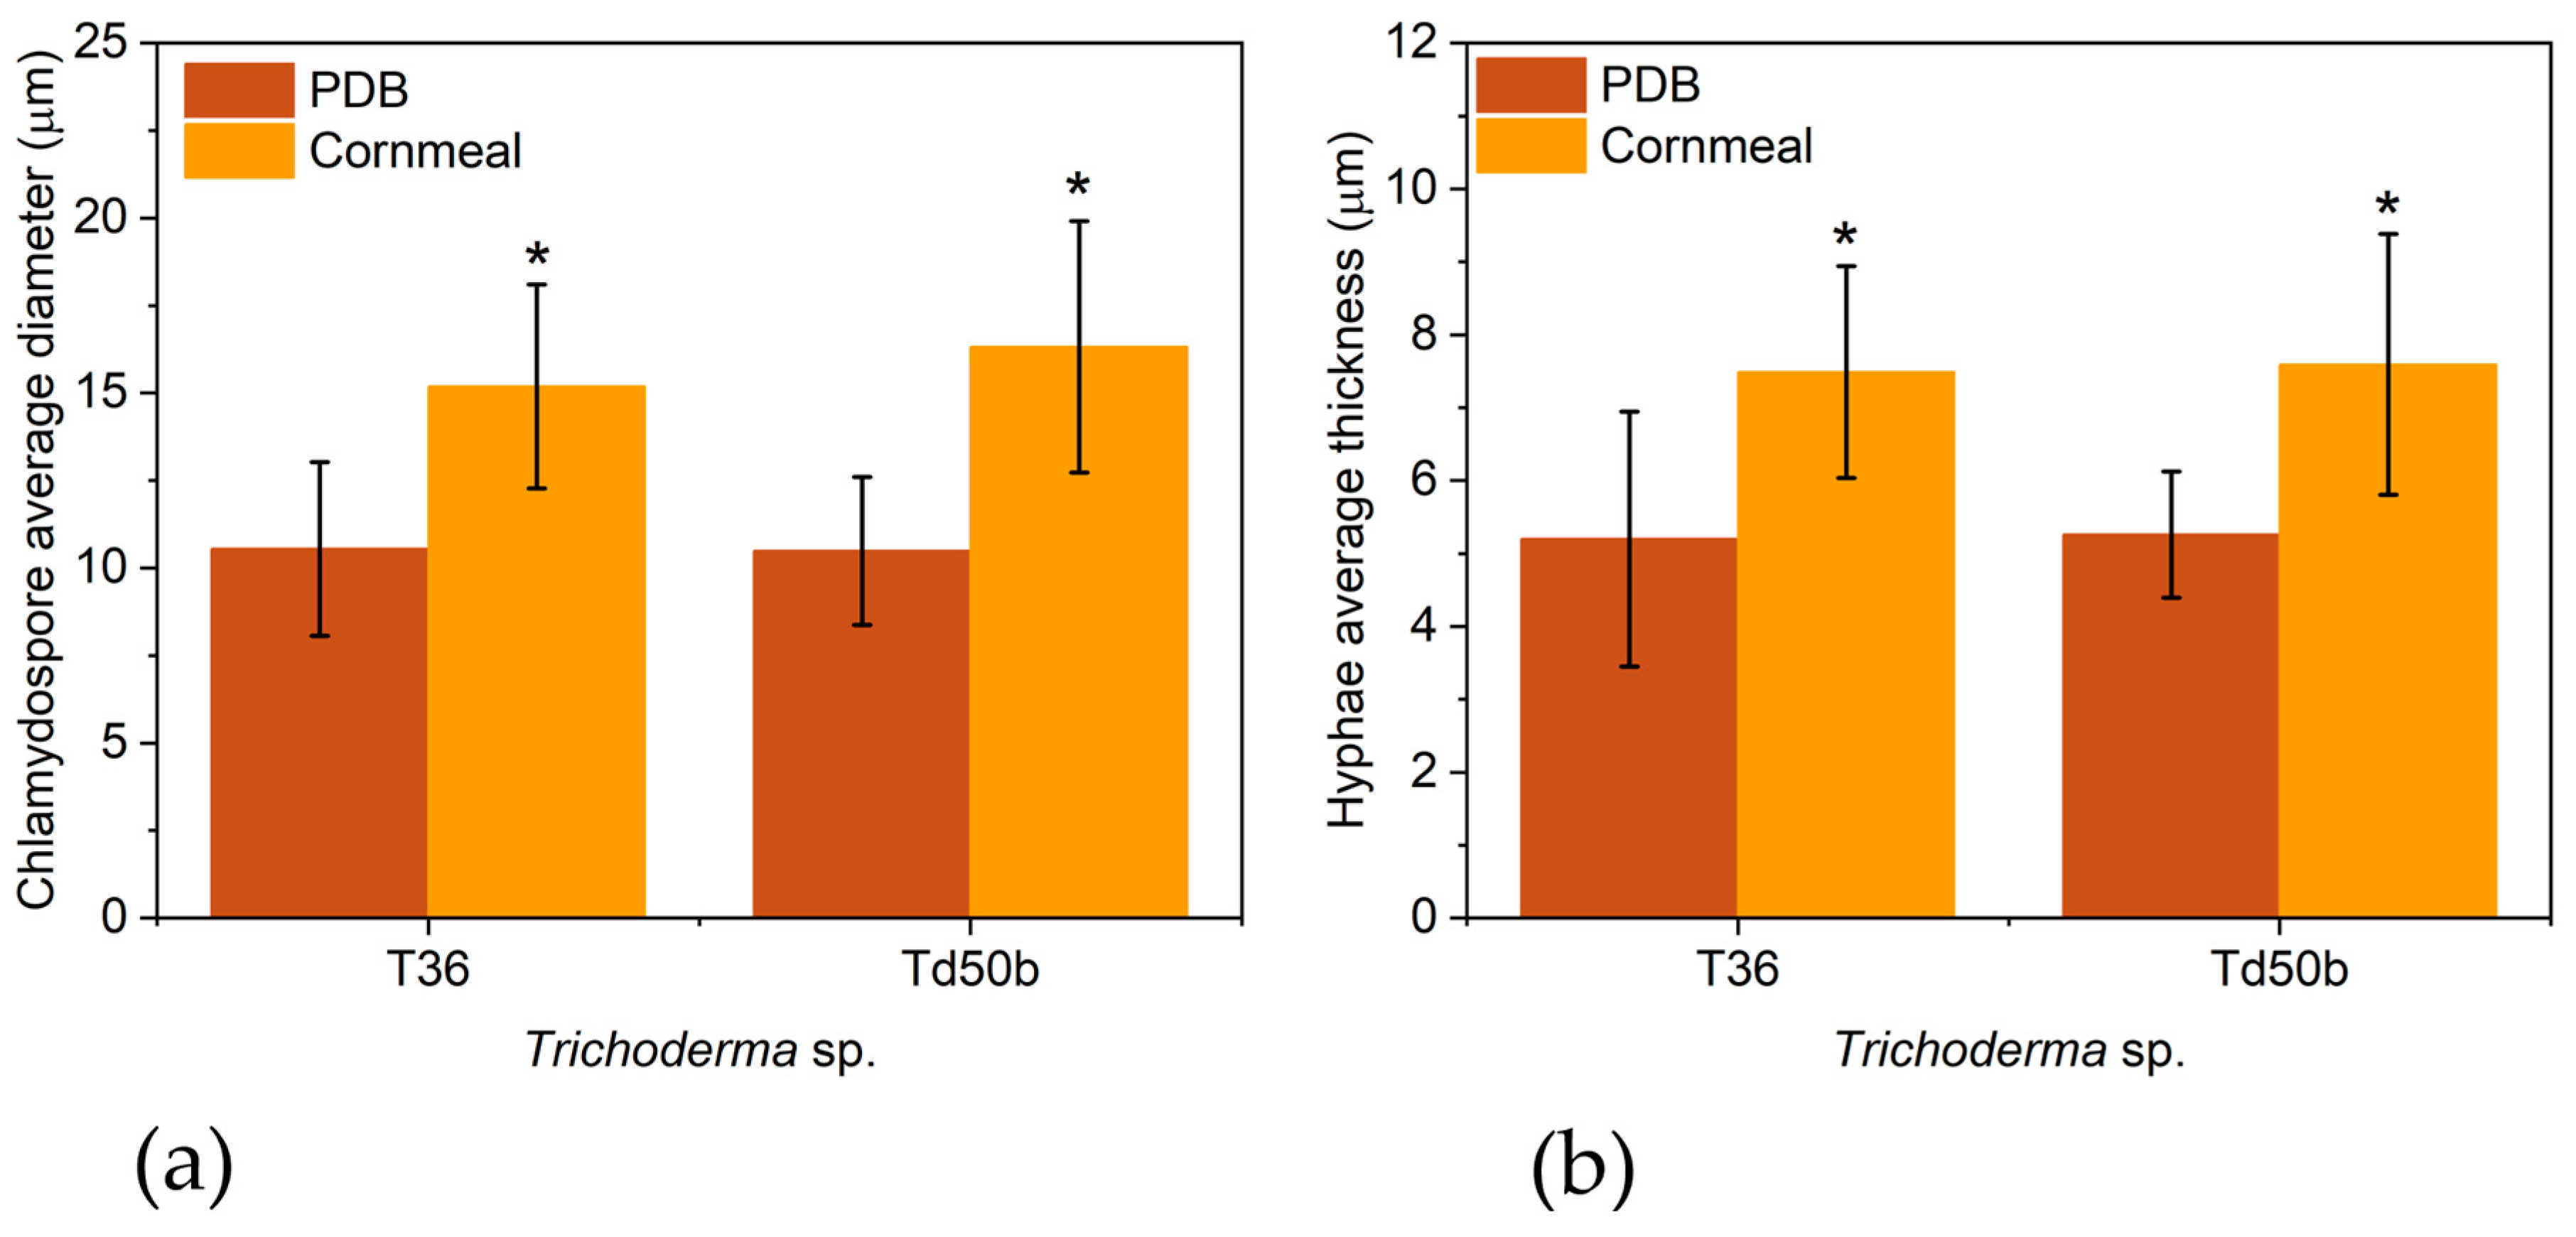
Figure 3.
The thermogravimetric analysis of T. asperellum T36 NCAIM F 001434 (a) and T. harzianum, Td50b NCAIM F001412 (b) grown in potato dextrose broth (PDB) or cornmeal medium. The weight (%) of T36 and Td50b is shown with the error bar limits (light contour, 95% interval confidence). FC – commercial fungal chitin.
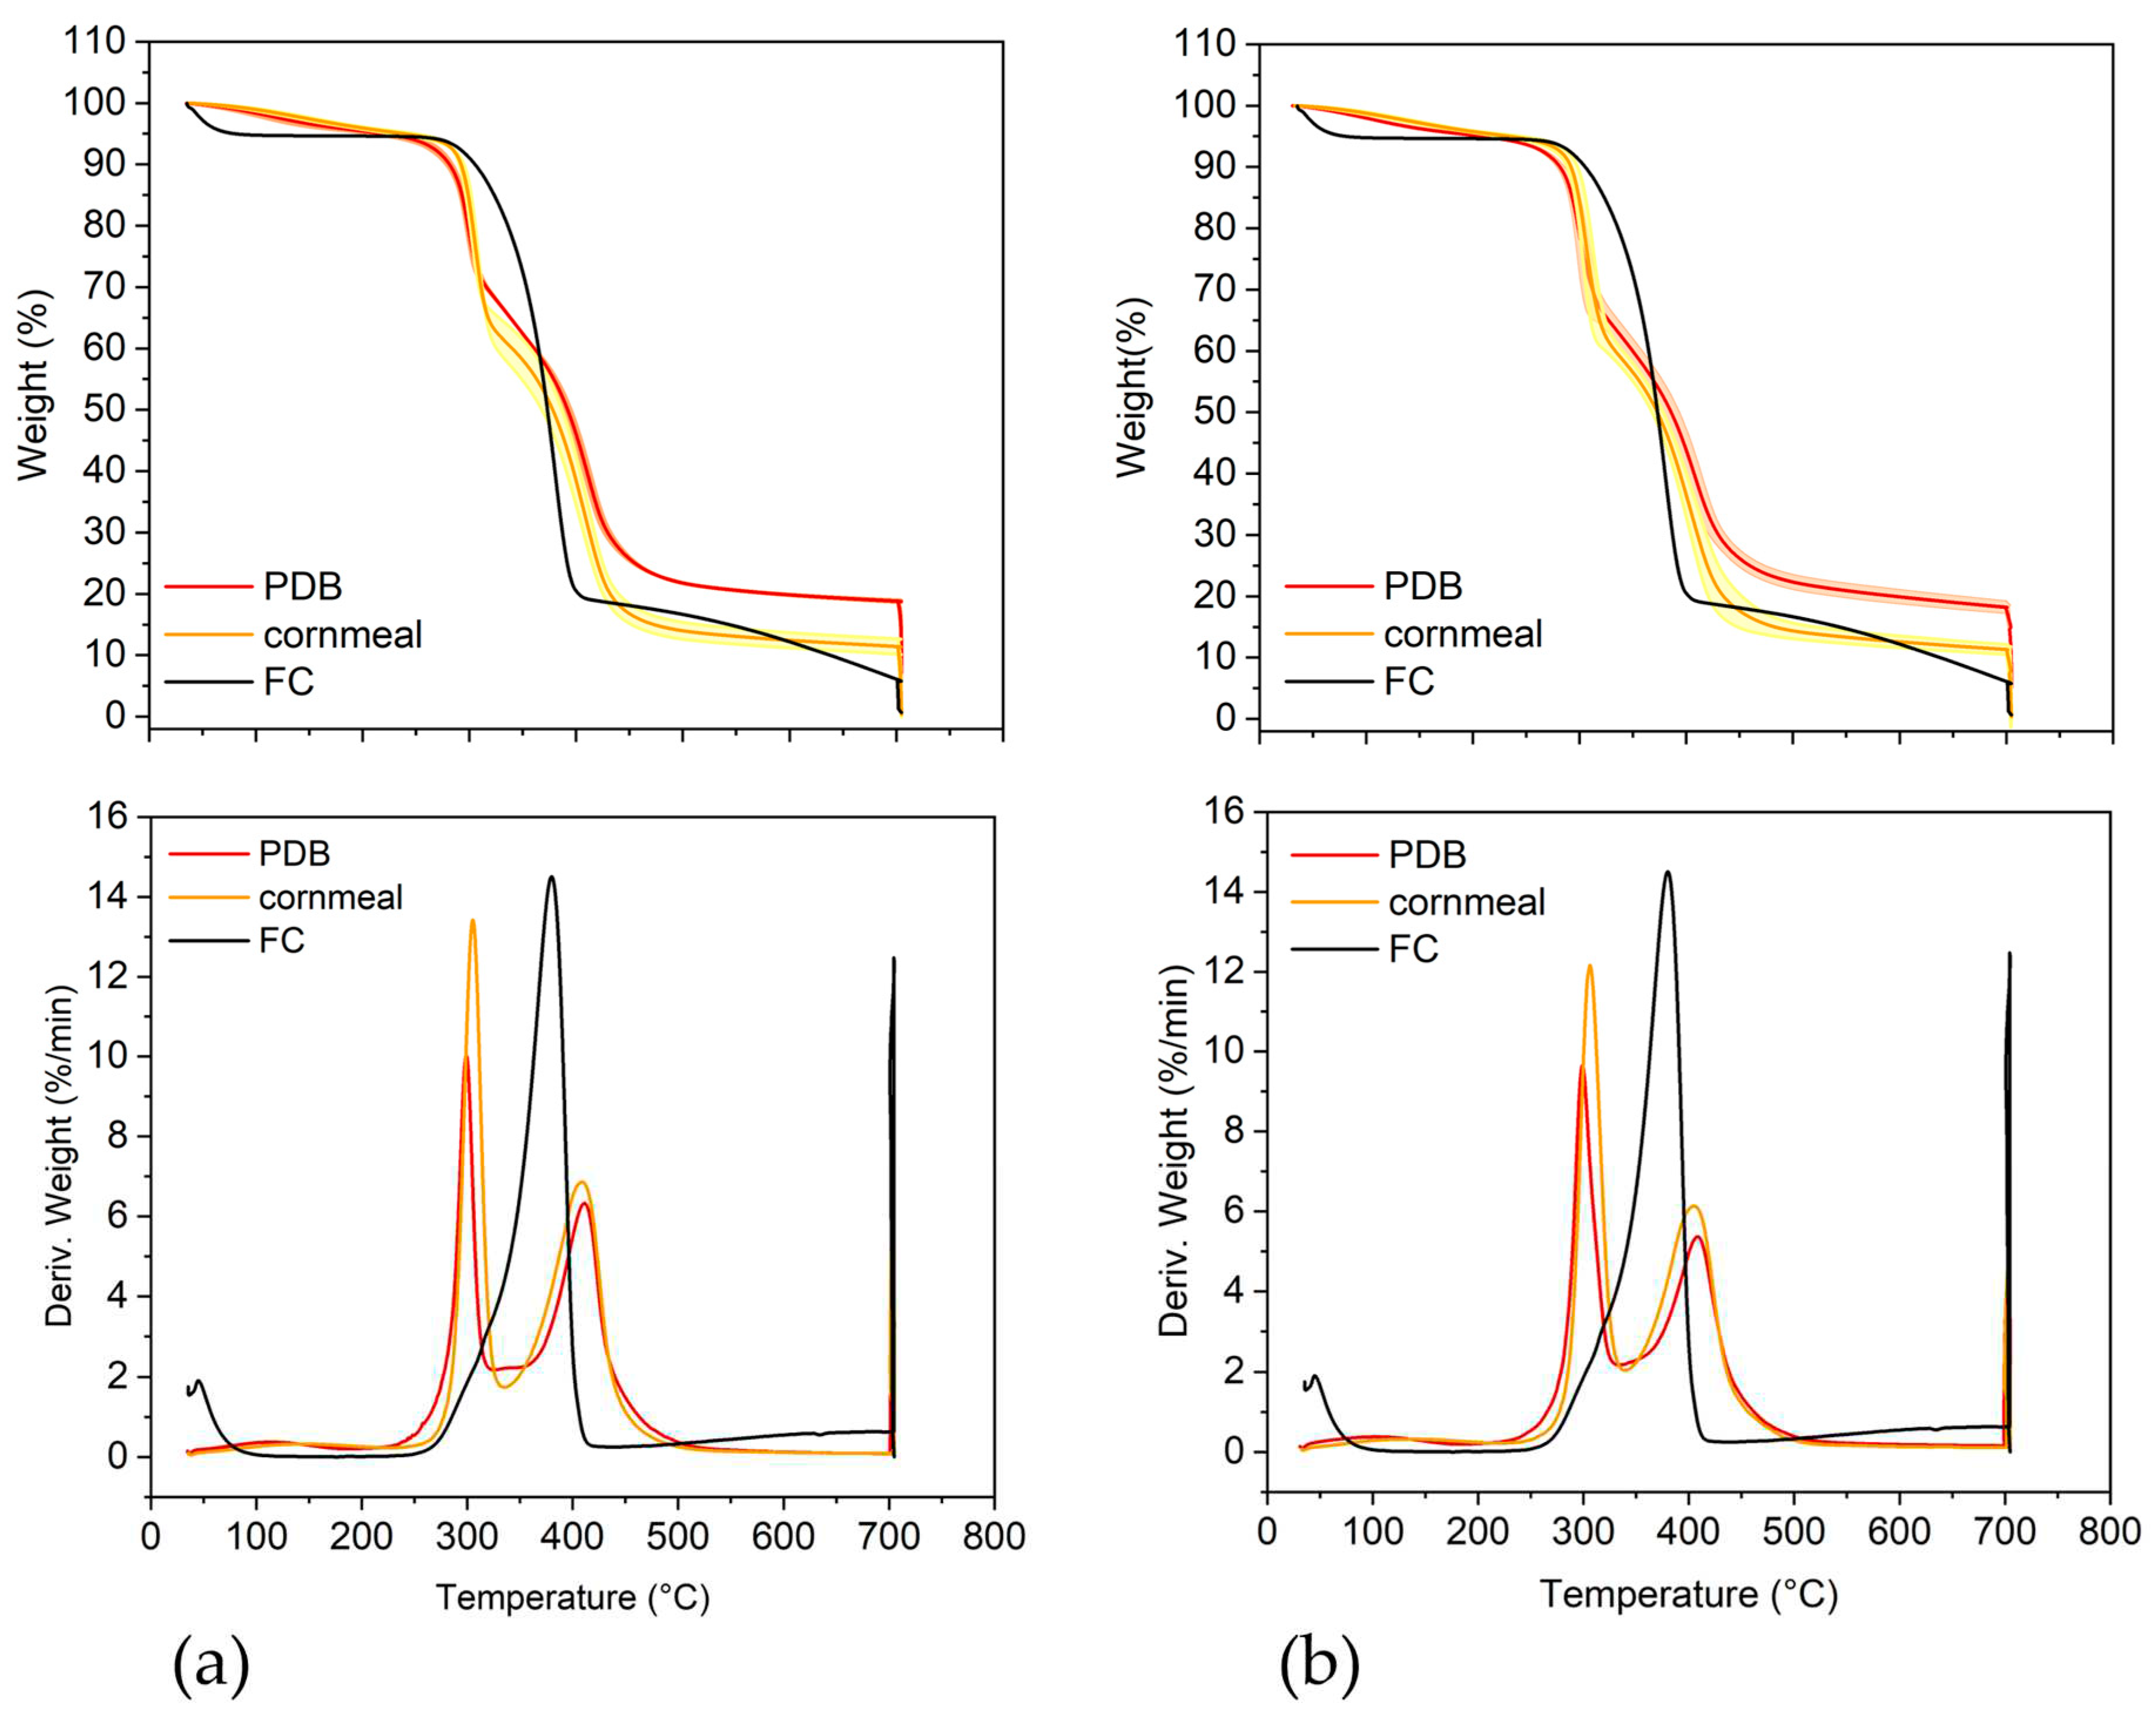
Figure 4.
The influence of different treatment with the Trichoderma consortium on M. charantia physiological parameters. V1—control (treated with water, spraying volume equivalent to 200 L/ha); V2—foliar treatment with the Trichoderma consortium obtained in cornmeal medium (TCM), 106 cfu/mL; V3—foliar treatment with Trichoderma consortium obtained in potato-dextrose broth medium (TPD), a suspension normalized to 108 cfu/mL, V4—foliar treatment with the Trichoderma consortium obtained in cornmeal medium (TCM), a suspension normalized to 108 cfu/mL. The values presented represent means ± standard errors (n = 30 plants). Columns labeled with different stars within each parameter are significantly different.
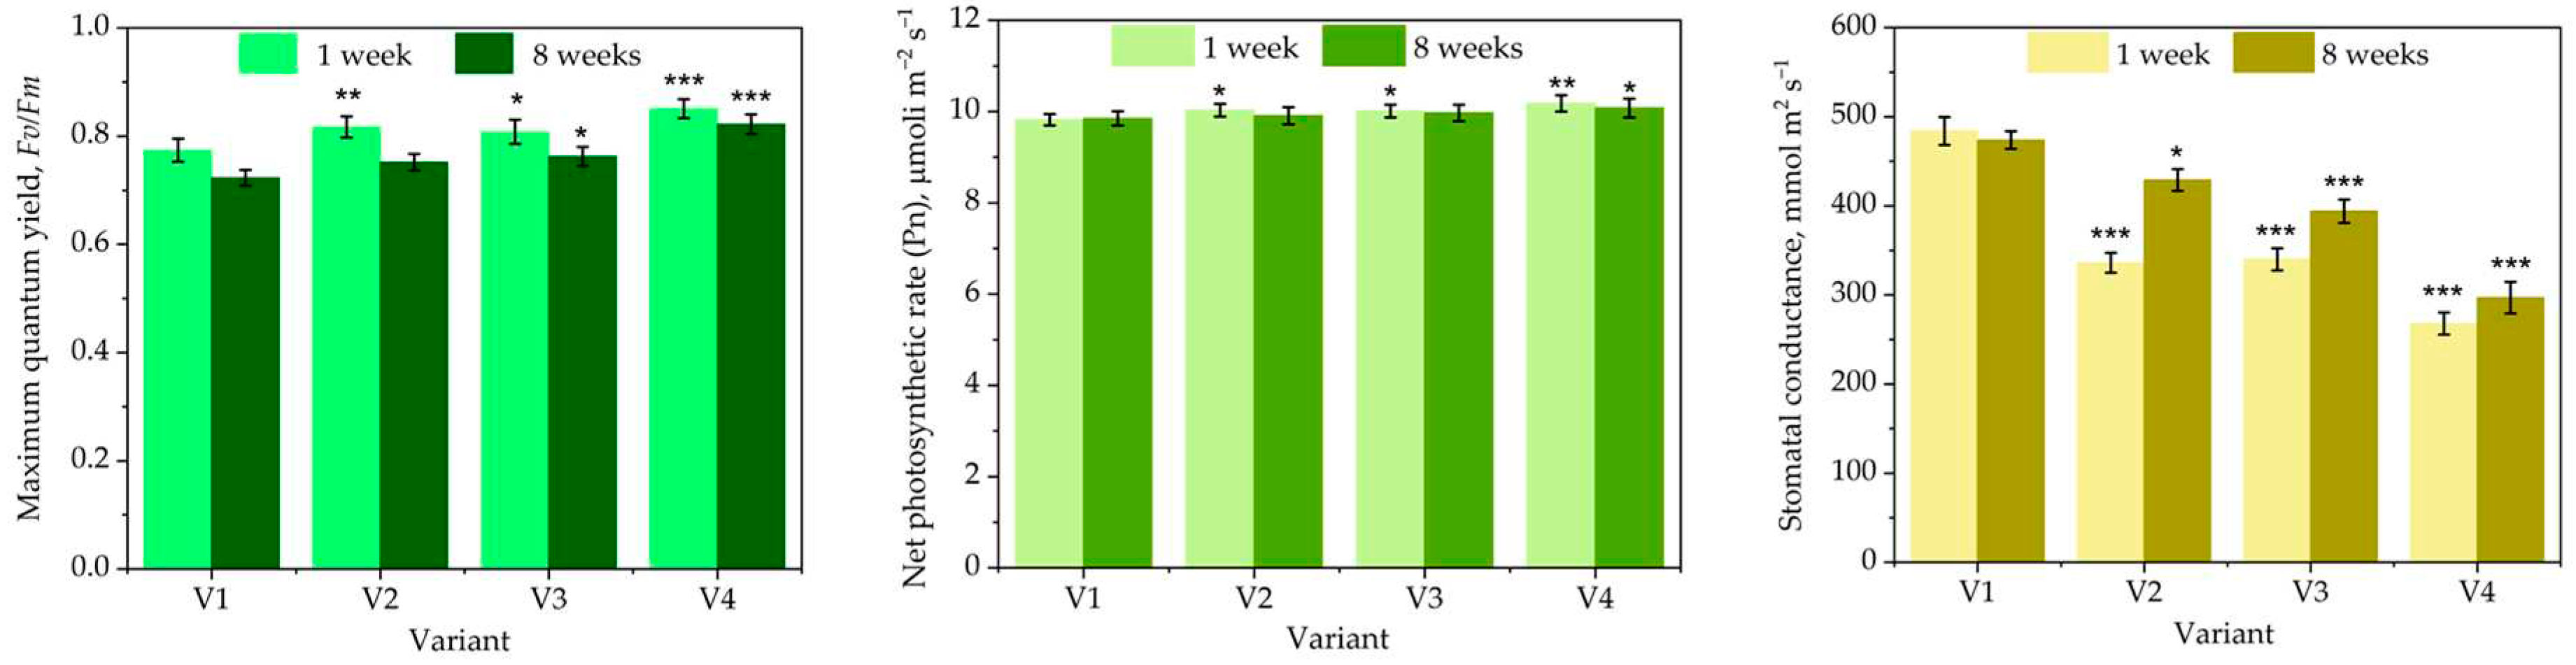
Figure 5.
The effects of different treatment with the Trichoderma consortium on the total polyphenols and total flavonoids content in leaves (a) and the extract antioxidant activity (b) of M. carnatina. V1—control (treated with water, spraying volume equivalent to 200 L/ha); V2—foliar treatment with the Trichoderma consortium obtained in cornmeal medium (TCM), 106 cfu/mL; V3—foliar treatment with Trichoderma consortium obtained in potato-dextose broth medium (TPD), a suspension normalized to 108 cfu/mL, V4—foliar treatment with the Trichoderma consortium obtained in cornmeal medium (TCM), a suspension normalized to 108 cfu/mL. The values presented represent means ± standard errors (n = 30 plants). Columns labeled with different stars within each parameter are significantly different.
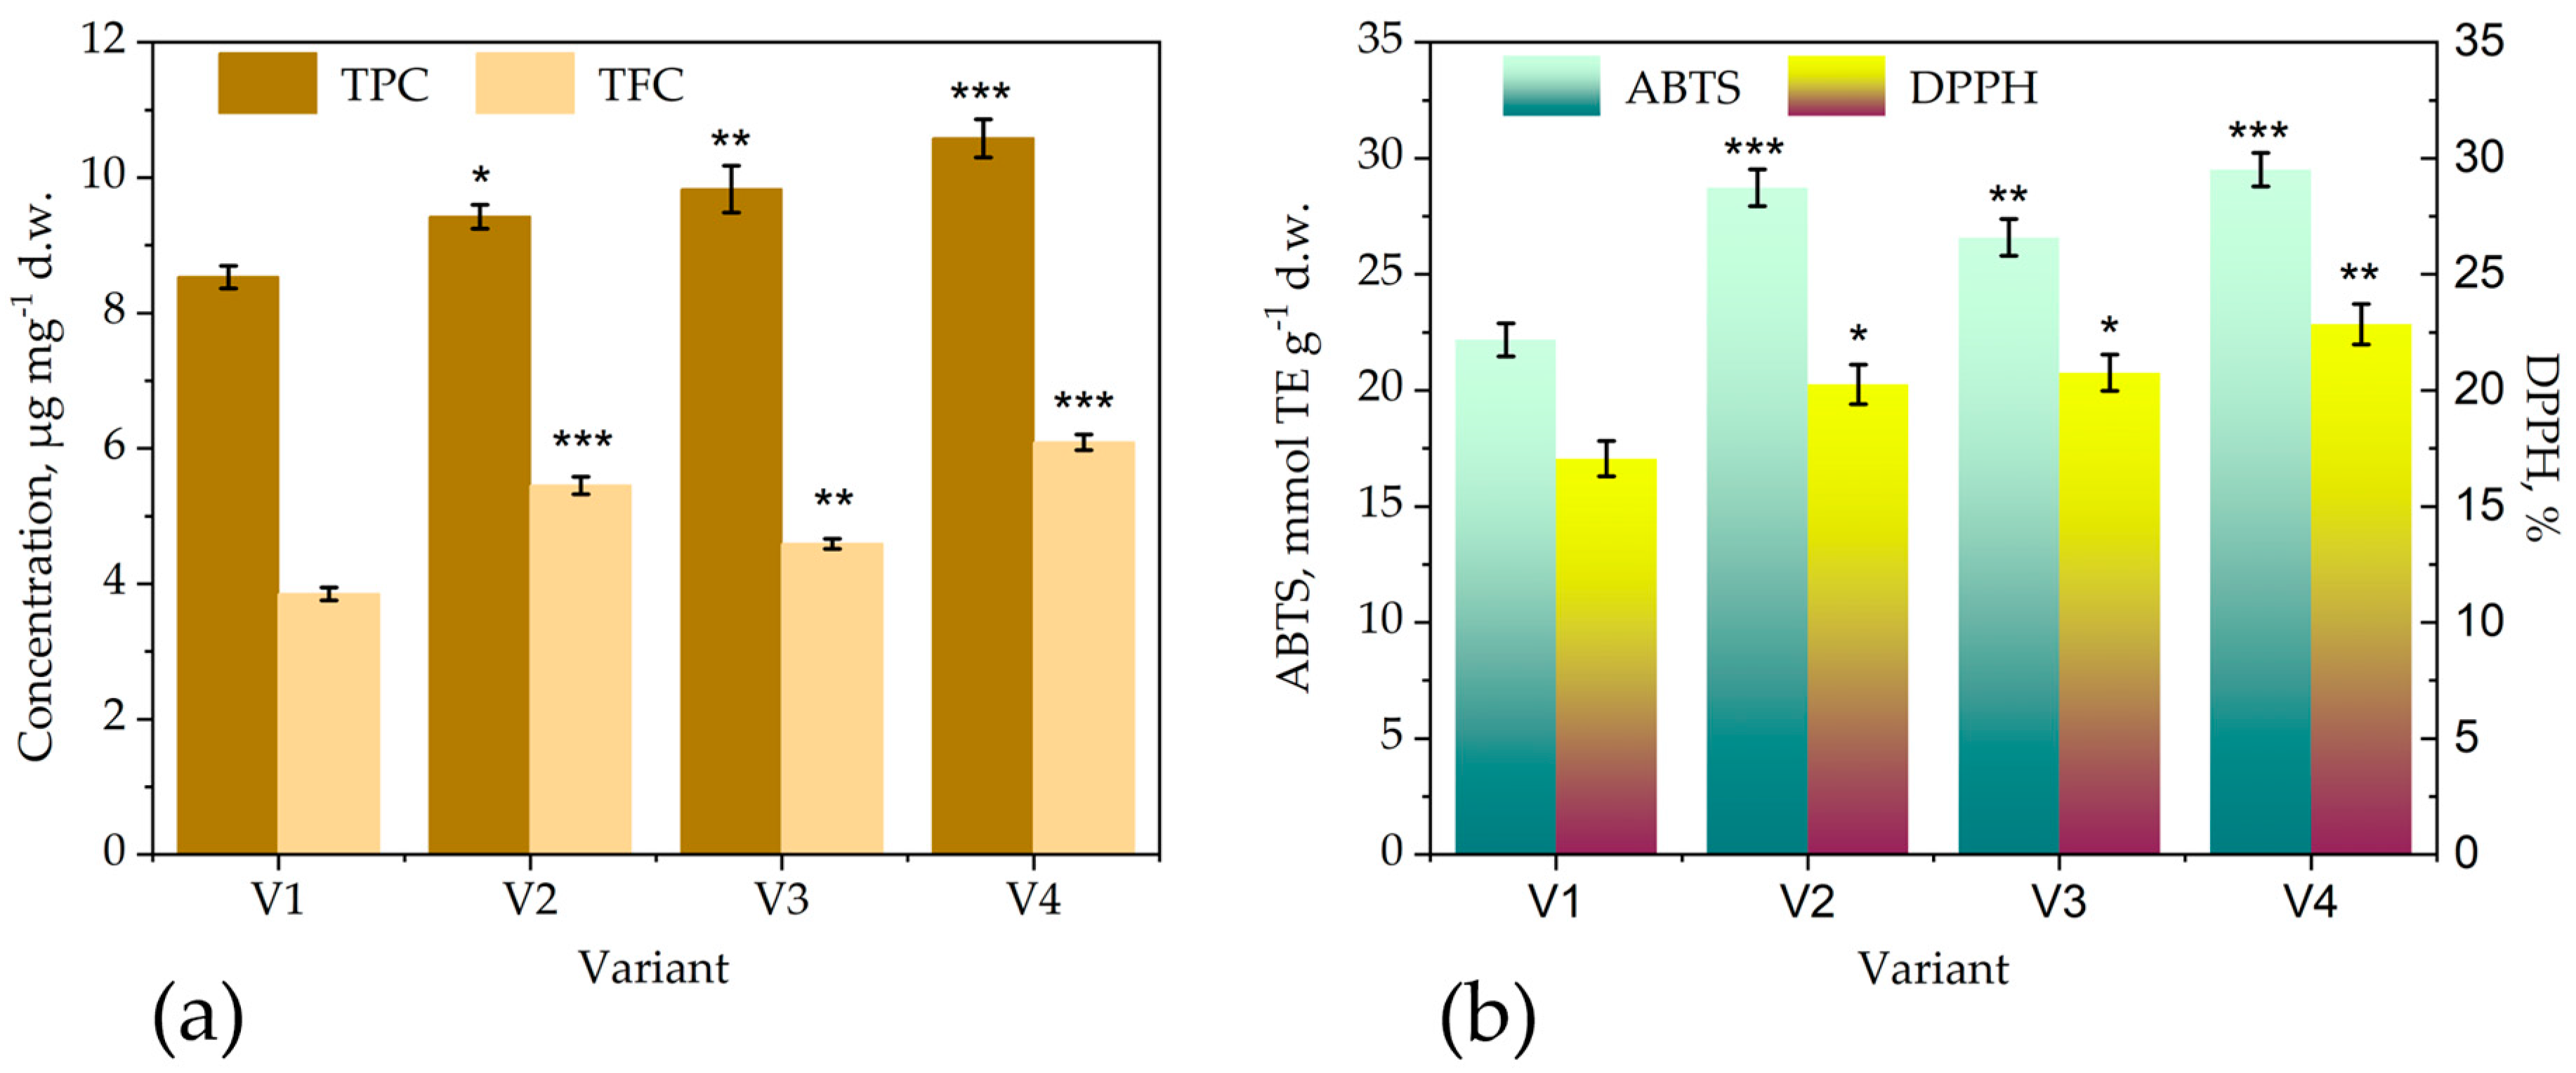
Figure 6.
The effects of different treatment with the Trichoderma consortium on the total polyphenols and total flavonoids content in bitter gourd fruits (a) and antioxidant activity (b). M. charantia. V1—control (treated with water, spraying volume equivalent to 200 L/ha); V2—foliar treatment with the Trichoderma consortium obtained in cornmeal medium (TCM), 106 cfu/mL; V3—foliar treatment with Trichoderma consortium obtained in potato-dextose broth medium (TPD), a suspension normalized to 108 cfu/mL, V4—foliar treatment with the Trichoderma consortium obtained in cornmeal medium (TCM), a suspension normalized to 108 cfu/mL. The values presented represent means ± standard errors (n = 30 plants). Columns labeled with different stars within each parameter are significantly different.
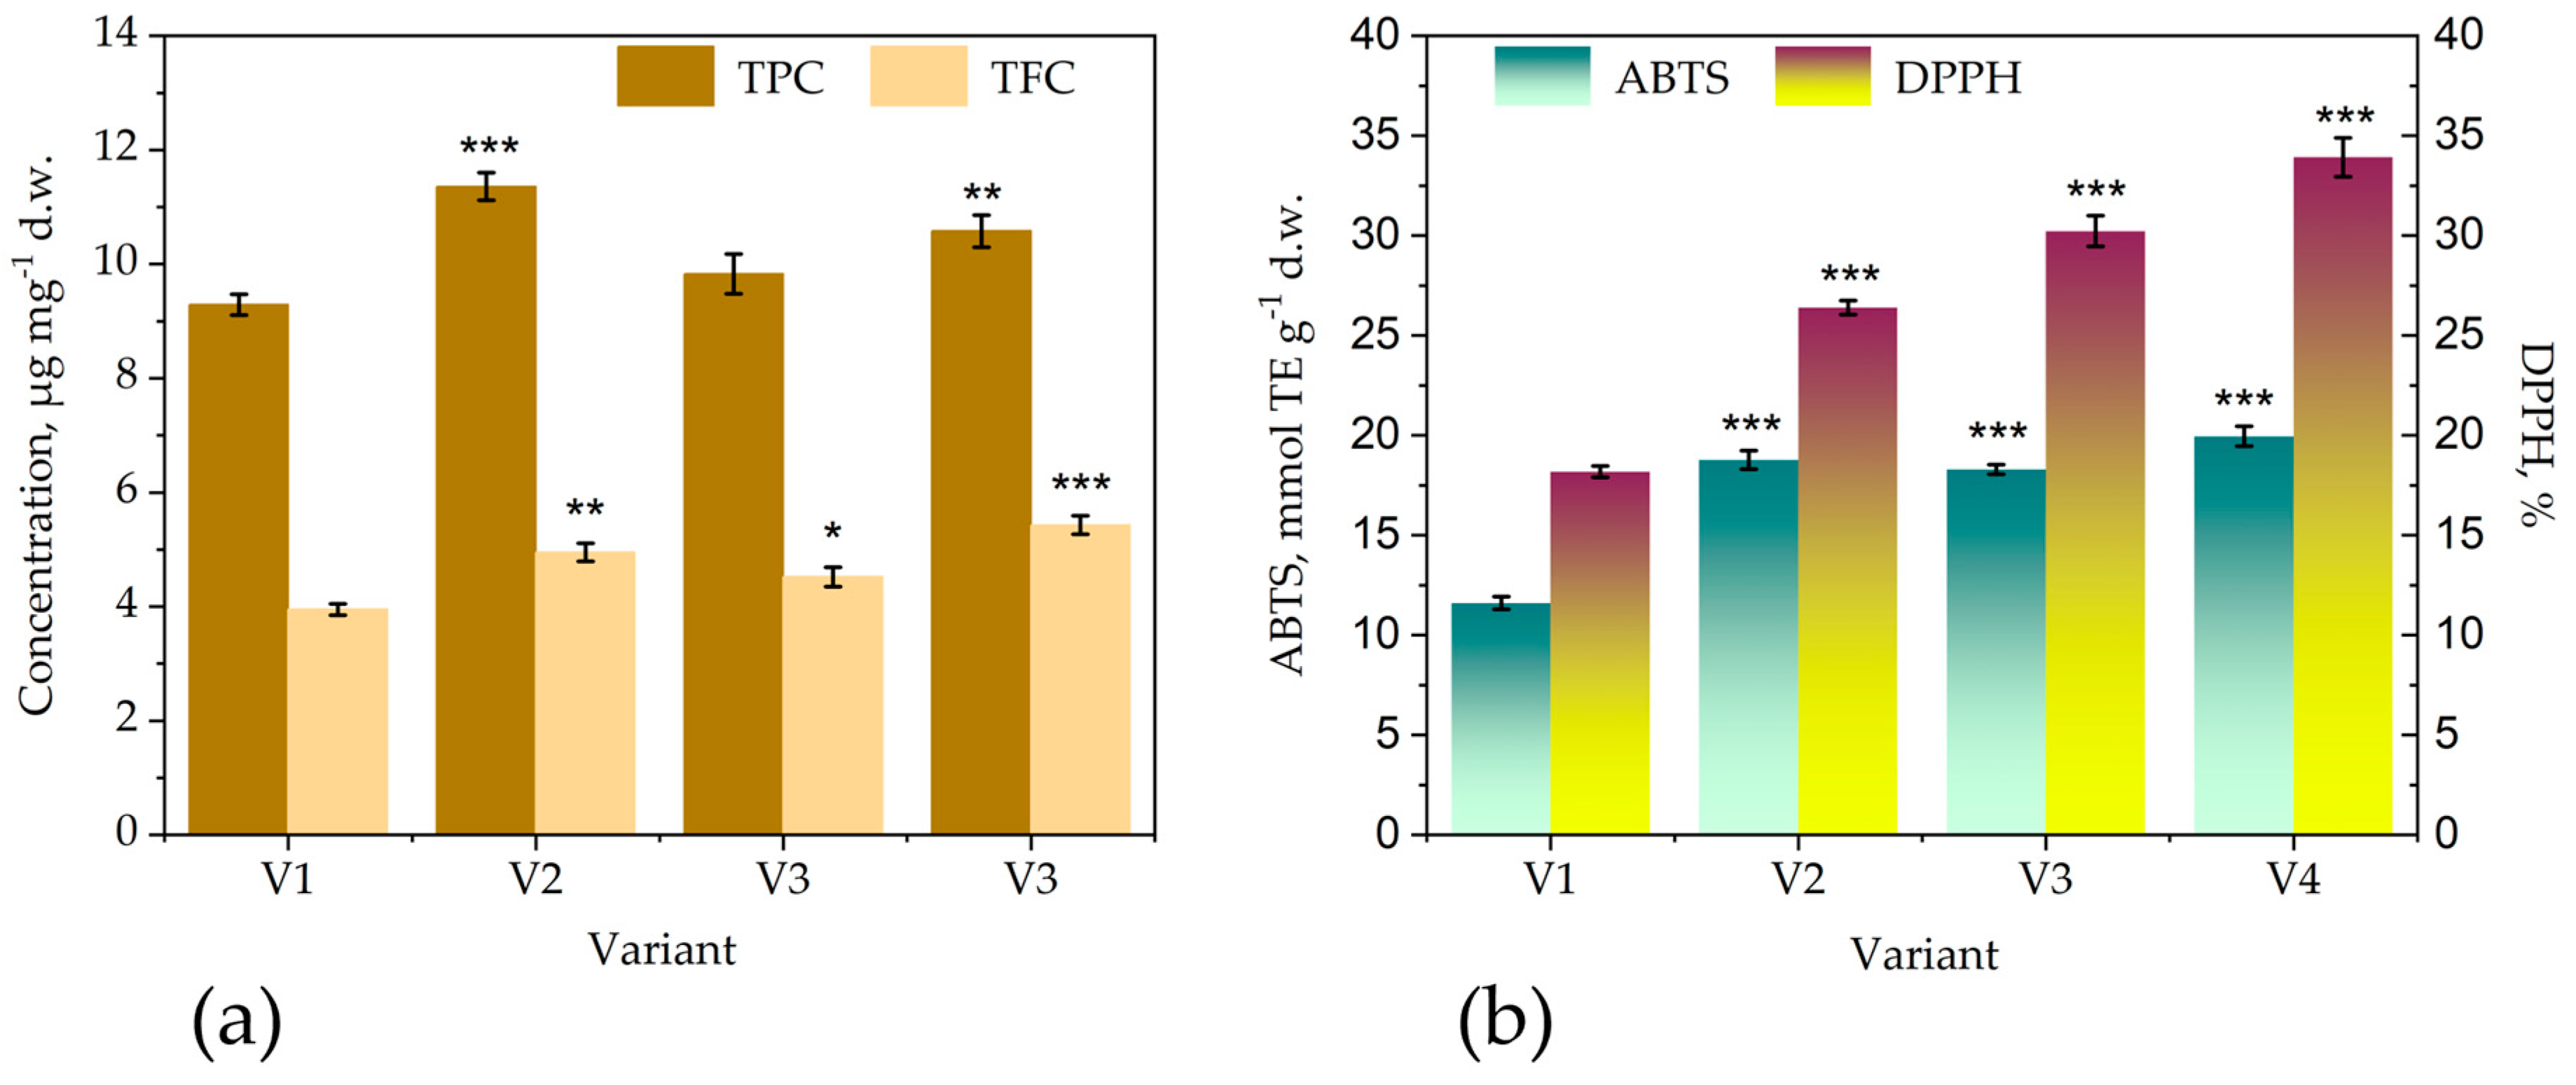
Figure 7.
The effects of different treatment with the Trichoderma consortium on the cytocompatibility of M. charantia fruit extracts. V1—control (treated with water, spraying volume equivalent to 200 L/ha); V2—foliar treatment with the Trichoderma consortium obtained in cornmeal medium (TCM), 106 cfu/mL; V3—foliar treatment with Trichoderma consortium obtained in potato-dextose broth medium (TPD), a suspension normalized to 108 cfu/mL, V4—foliar treatment with the Trichoderma consortium obtained in cornmeal medium (TCM), a suspension normalized to 108 cfu/mL. The values presented represent means ± standard errors (n = 30 plants). Columns labeled with different stars within each parameter are significantly different.
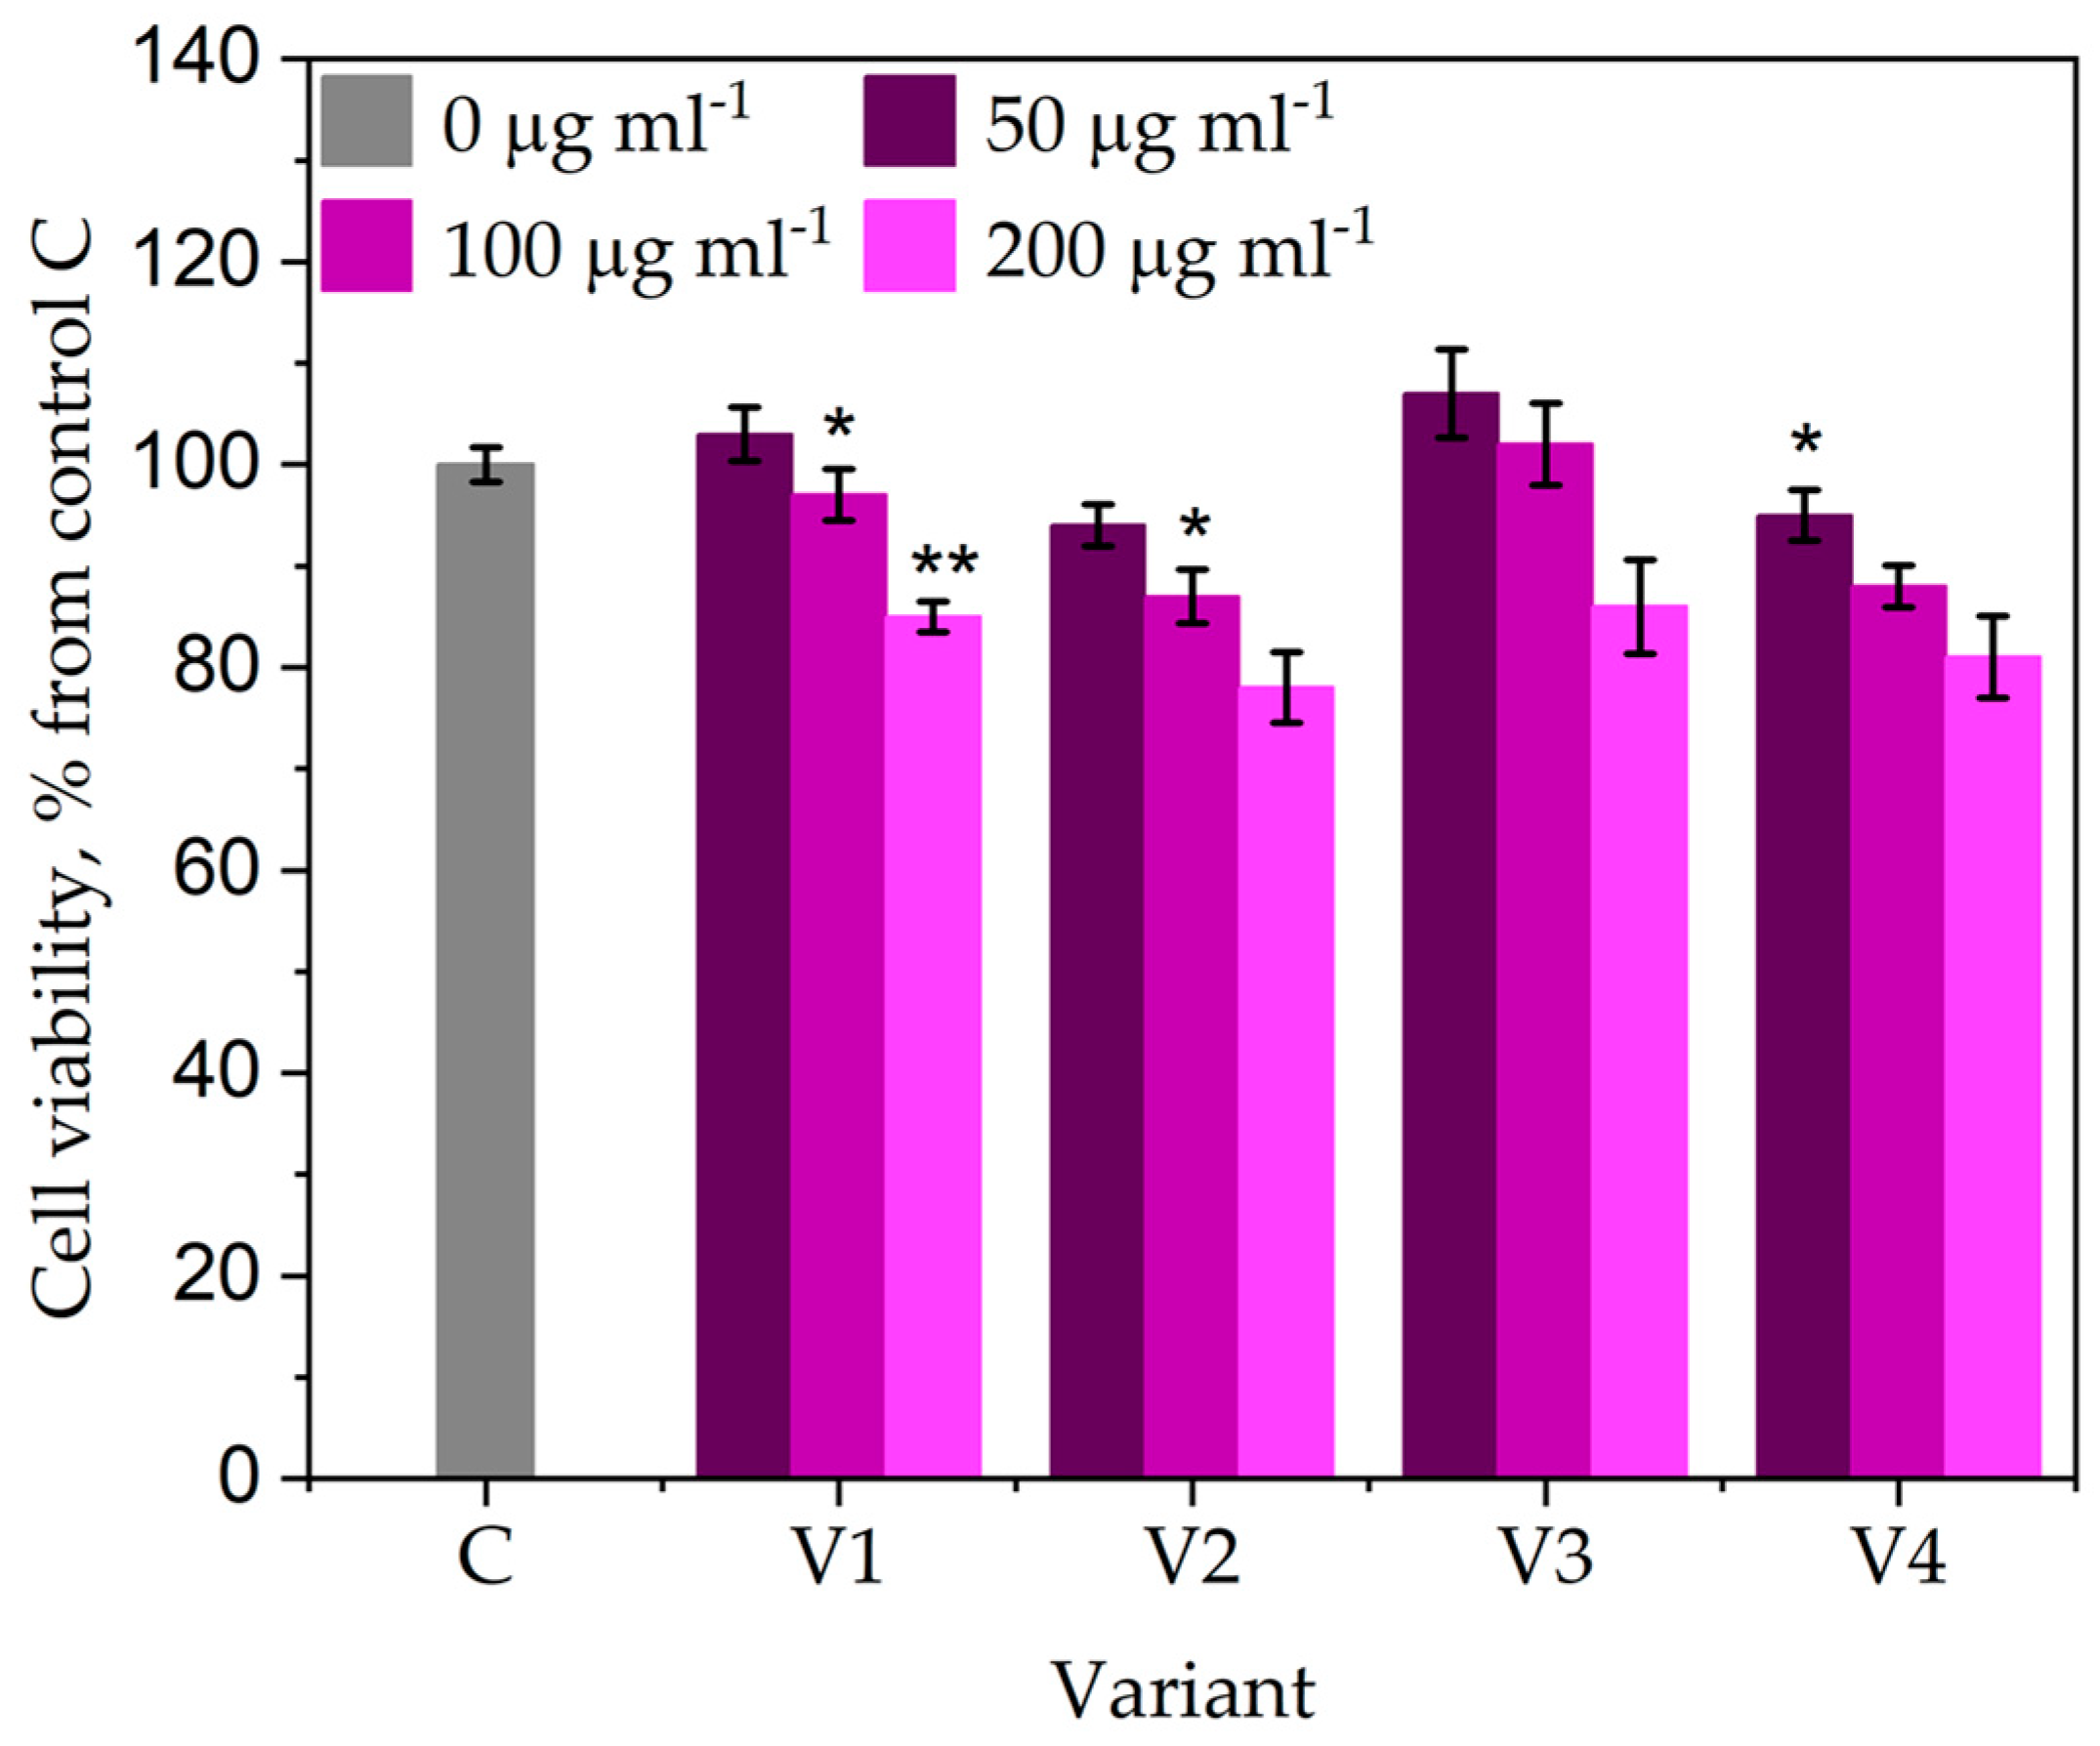

Table 1.
Quantitative parameters from TGA analysis of T36 and Td50b.
| Parameter | T36 PDB | T36 cornmeal | Td50b PDB | Td50b cornmeal | FC |
|---|---|---|---|---|---|
| T1 (°C) | 116.5±9.5 | 142.0±10.5 | 101.6±3.0 | 133.0±4.6 | 43 |
| WL1 (%) | 4.41±0.12 | 4.73±0.10 | 4.48±0.11 | 4.65±0.14 | 5.36 |
| T2 (°C) | 299.1±1.1 | 305.2±1.7 | 302.1±0.4 | 307.2±0.7 | 380.0 |
| WL2 (%) | 27.89±0.47 | 34.39±1.74 | 31.58±0.34 | 36.44±0.66 | 76.14 |
| T3 (°C) | 411.0±1.8 | 408.8±1.5 | 409.3±0.6 | 406.6±0.7 | 617.1 |
| WL3 (%) | 48.88±0.72 | 49.45±1.20 | 45.74±0.43 | 47.58±0.69 | 12.36 |
| Residue (%)# | 18.82±0.13 | 11.43±0.64 | 18.20±0.51 | 11.33±0.39 | 6.14 |
| Ash (%)## | 7.19±0.51 | 0.32±0.05 | 4.78±0.60 | 0.31±0.03 | 0.67 |
| Residue-Ash | 11.63±0.30 | 11.11±0.37 | 13.42±0.45 | 11.02±0.23 | 5.47 |
PDB - potato dextrose broth medium; WL – weight loss, FC – fungal chitin; # (700°C/N2); ## (700°C/Air)
Table 2.
The effect of different experimental treatments on the yield of bitter gourd Bucharest, greenhouse.
Table 2.
The effect of different experimental treatments on the yield of bitter gourd Bucharest, greenhouse.
| Nr. crt. | Treatment* | Dose | No. application | Production (kg/ha) | Additional yield | |
| kg/ha | % | |||||
| V1. | Control | - | - | 12019 | 100 | |
| V2. | Trichoderma TCM | 2×10¹¹ ufc/ha | 2 | 16962 | 4943*** | 141.13 |
| V3 | Trichoderma TPD | 2×10¹³ Kg/ha |
2 |
15064 | 5083*** | 142.29 |
| V4 | Trichoderma TCM | 2×10¹³ ufc/ha | 2 | 18398 | 6379*** | 1531.07 |
| DL 5% - 1465 kg/ha | ||||||
| DL 1% - 2013 kg/ha | ||||||
| DL 0,1% - 3059 kg/ha | ||||||
*V1, control, treated with water, spraying volume equivalent to 200 L/ha); V2, foliar treatment with the Trichoderma consortium obtained in cornmeal medium (TCM), a suspension normalized to 106 cfu/mL, in a spraying volume equivalent to 200 L/ha; V3—foliar treatment with Trichoderma consortium obtained in potato-dextose broth medium (TPD), a suspension normalized to 108 cfu/mL, in a spraying volume equivalent to 200 L/ha; and, V4—foliar treatment with the Trichoderma consortium obtained in cornmeal medium (TCM), a suspension normalized to 108 cfu/mL, in a spraying volume equivalent to 200 L/ha.
Disclaimer/Publisher’s Note: The statements, opinions and data contained in all publications are solely those of the individual author(s) and contributor(s) and not of MDPI and/or the editor(s). MDPI and/or the editor(s) disclaim responsibility for any injury to people or property resulting from any ideas, methods, instructions or products referred to in the content. |
© 2023 by the authors. Licensee MDPI, Basel, Switzerland. This article is an open access article distributed under the terms and conditions of the Creative Commons Attribution (CC BY) license (http://creativecommons.org/licenses/by/4.0/).
Copyright: This open access article is published under a Creative Commons CC BY 4.0 license, which permit the free download, distribution, and reuse, provided that the author and preprint are cited in any reuse.


