Submitted:
11 December 2023
Posted:
13 December 2023
You are already at the latest version
Abstract
As the international community attaches importance to environmental and climate issues, carbon dioxide emissions in various countries have been subject to constraints and limits. Carbon trading market, as a market tool to reduce greenhouse gas emissions, has gone through a development process from a pilot carbon market to a national carbon market in China. At present, the industries included in the national carbon market are mainly the electric power industry, and the carbon emissions of the electric power industry account for about 40% of the national carbon emissions. According to the construction history of foreign carbon markets, China's future carbon quota allocation will gradually transition from free allocation to auction allocation,the auction mechanism will bring a heavy economic burden to the electric power industry, especially the thermal power generation industry. Therefore, this study takes Guangdong Province as an example to optimize the power generation mix with the objective of minimizing the total economic cost after the innovative introduction of the carbon quota auction mechanism and constructs an optimization model of the power generation mix based on the auction ratio by comprehensively applying the system dynamics model and the multi-objective linear programming model and systematically researches the power generation structure under different auction ratios with the time scale of months and quantitatively evaluates the economic inputs needed to reduce the greenhouse gas emissions.The results of the study show that after comprehensively comparing the total economic cost, renewable energy development and carbon emissions, it is the most scientific and reasonable to set the auction ratio of carbon allowances at 20%, which achieves the best level of economic and environmental benefits.
Keywords:
carbon quota auction
; power generation industry
; renewable energy generation
; total economic cost
1. Introduction
As the international community attaches more attention to environmental and climate issues, carbon dioxide emissions have been limited, while fossil energy consumption is the main source of carbon dioxide emissions(Gao, 2019). Since coal occupies a large proportion of China's energy structure, the carbon emissions generated by the power industry, which is mainly coal-fired power generation, account for the largest share of carbon emissions from the combustion of fossil energy, so the economic development of China's power industry is facing severe pressure to reduce emissions(Udara Willhelm Abeydeera et al., 2019). At present, carbon emission reduction measures in the power sector are mainly focused on optimizing power supply structure and technology upgrading, Carbon Emissions Trading(CET) and Renewable Portfolio Standards(RPS) can promote the optimization of power supply structure and CCUS technology has been deployed in the first pilot and used to deal with greenhouse gas emissions from coal-fired power generation. Compared with upgrading power generation technology, optimizing power supply structure is more direct and economical in reducing carbon emissions(Xu et al., 2016).
The purpose of power generation structure optimization is to ensure the safe and stable operation of the power system and sustainable energy development and to achieve economic cost reduction simultaneously in terms of power supply. The program to build a new type of power system was released in 2021, which signals the future development of the power industry toward a more secure, efficient, clean and low-carbon direction(Wu, 2021). With the introduction of the dual carbon target and upgraded power generation technologies, the restructuring and optimization of the national and regional power generation mix will need to be flexible and responsive to environmental changes to enable power utilities to better serve other industries and promote sustainable development for the whole of society(Zhang et al., 2018).
What are the key future challenges facing the power sector? The primary challenge lies in the transition from free allocation to auction allocation as the method of carbon allowance distribution(Miao, 2019). Under the guidance of the Chinese government, all seven pilot carbon trading schemes (Beijing, Guangdong, Shanghai, Tianjin, Chongqing, Hubei, and Shenzhen) were initiated in 2014, followed by the national carbon trading system's official launch in 2017.In comparison to carbon capture, utilization, and storage(CCUS),carbon emission trading has made significant progress in driving carbon emission reduction within the power sector. Based on the construction practices of carbon trading markets in the European Union and other countries, China's carbon market is expected to further align with the international market in the near future, thereby gradually changing the allocation method of carbon quotas.Based on the construction experience of the European Union and other foreign carbon trading markets, it is expected that China's carbon market will gradually align with the international market in the near future(Ao et al., 2023). This means that there will be a shift in the method of allocating carbon quotas. Currently, the national carbon market in China predominantly utilizes the baseline method for carbon allowance allocation, which is a form of free allocation. This method combines bottom-up and top-down approaches for allocating allowances. However, as the allocation method shifts towards auction-based bidding, the introduction of auction-based carbon trading will incentivize high-carbon-emitting power generators to adopt more environmentally friendly production methods and optimize energy use due to the rising costs of emissions(Tang et al., 2017). The second major challenge lies in the increased costs for power producers resulting from the auctioning of carbon allowances(Zhao et al., 2016). This impact will be particularly pronounced for thermal power generators, as carbon emission reduction costs will become a significant component of their overall expenses in the future. Failure to optimize the power generation structure in the power generation sector with the objective of minimizing total economic costs will burden thermal power generation enterprises economically, hampering their sustainable development capacity and international competitiveness.In more severe cases, it may even pose a threat to national energy security.
In addressing the aforementioned challenges, this study aims to optimize the power generation mix with the objective of minimizing economic costs under different carbon allowance auction ratios. As depicted in Figure 1, the carbon allowance auction mechanism exerts influence on the power generation structure through two primary pathways. Firstly, in the short term, the carbon allowance auction mechanism induces carbon price distortions through the bidding process for power generation enterprises. This significantly increases the power generation costs and carbon emission reduction costs, with thermal power generation enterprises experiencing the largest cost escalation. The cost changes mentioned above have an impact on the power generation portfolios at a regional level. Secondly, the carbon quota auction mechanism plays a role in controlling the overall carbon emissions of power generation enterprises by regulating the carbon emission cap. This involves limiting both the direct carbon emissions from thermal power generation and the indirect carbon emissions from purchased electricity to a certain extent, thereby influencing the transformation of the power supply structure.
Although several studies have attempted to predict the power generation structure at both national and provincial levels, a consensus has not yet been reached. Existing literature on power generation portfolios has predominantly employed optimization methods and simulation tools such as the LEAP model, CGE model, Power Planning Optimization Model of China (PPOM-CHINA) (Chen et al., 2016), superstructure optimization model(Cai et al., 2007), and multi-regional optimization methods(Cheng et al., 2015). However, these models have primarily focused on minimizing the cost of power generation and have often overlooked the potential improvement and adjustment of the power generation structure resulting from the environmental shift in carbon allowance allocation methods, specifically from free allocation to auction allocation.In terms of originality, limited research has quantitatively examined the shadow price of carbon emission rights across different carbon allowance auction ratios and internalized the external costs associated with the power generation industry's greenhouse gas emissions. Moreover, there is a dearth of studies focusing on the optimization of the regional power structure at a monthly resolution. Building upon the traditional power structure analysis, which primarily considers power generation costs, this study introduces additional influencing factors, including the cost of carbon emission reduction, air pollution emission costs, and net costs of purchased power. These factors are derived from market practices such as carbon trading and the demand for policy support. Existing research suggests that as the potential for emission reduction decreases in China's electric power industry over time, the cost of carbon emission reduction will gradually escalate, eventually constituting a larger proportion of the power generation sector's total economic cost. It is essential to acknowledge that the exclusion of external costs, such as carbon abatement expenses, from the total economic cost is both mathematically illogical and incongruent with the principles of sustainable development in terms of environmental impacts. Currently, the electricity market inadequately internalizes carbon abatement costs, resulting in economic costs of power generation that solely reflect the private costs of the product or service, without considering the environmental and climate impacts of greenhouse gas emissions.Consequently, there is an urgent imperative to internalize the cost of carbon emission reduction through policy instruments or market mechanisms.By implementing such measures, power generation companies can be aptly incentivized to proactively address greenhouse gas emissions, leading to the mitigation of environmental impacts and the promotion of sustainable development.
In this study, we focus on Guangdong Province as the geographical scope, constructing a comprehensive auction-ratio-based power structure optimization model. This model allows for a systematic research of the power structure in the month-based time scale, enabling a quantitative assessment of the economic inputs required for greenhouse gas emissions reduction. Guangdong Province was selected due to its significant carbon trading activities, evident in its high carbon trading turnover and volume as reported by reputable statistical websites. Being the second-largest carbon trading market globally and the first large-scale domestic carbon trading market following the European Union, this province offers a valuable context for analysis(Chen and Xu, 2016). Notably, Guangdong Province stands out among other carbon trading pilots as it implemented the auctioning of allowances, a market base already exists when the auction percentage is 3-5%. Investigating the optimal generation portfolio under different carbon allowance auction ratios in Guangdong Province and quantitatively assessing the corresponding total economic costs associated with the power supply planning can contribute to minimizing economic losses in the region. The subsequent sections of this paper are organized as follows: Section 2 provides a review of relevant studies, Section 3 presents an optimization model of the power generation mix based on the auction ratio, Section 4 outlines the data sources and presents the analysis of results, and Section 5 concludes with the policy implications derived from this study. The table below presents the variables and coefficients employed in this research.
2. Literature review
The allocation of carbon allowances is a crucial aspect of carbon trading, which involves limiting and reducing greenhouse gas emissions, particularly carbon dioxide, through the trading of carbon allowances. This trading system aims to achieve global carbon emission reduction. In the carbon trading market, companies have the option to purchase carbon allowances to compensate for their inability to reduce greenhouse gas emissions or sell their excess allowances to other companies for profit. Carbon trading is widely recognized as an effective strategy in combating climate change. It encourages companies to adopt environmentally friendly production methods and promotes innovation while taking responsibility for emissions reductions. Currently, there are three primary carbon quota allocation schemes in the international arena: free allocation, auction allocation, and hybrid methods. Both auction allocation and hybrid methods involve non-free quota allocation.In order to enhance market acceptance and reduce regional economic pressure, most countries and regions adopt the strategy of free allocation of allowances when establishing the carbon market. This approach combines auctioning and free allocation, allowing more time for the emission control industry to prepare and making the decision-making on emission reduction less aggressive.Compared to the auctioning of all initial allowances to emission-control enterprises, the mixed allocation of carbon allowances provides the emission-control industry with additional time to prepare and adopts a less aggressive approach in making decisions regarding emission reduction. For instance, in the fourth phase of the European Union's Emissions Trading System (EU ETS), the proportion of carbon allowances auctioned will be set at 57 percent from 2021 to 2030. The Regional Greenhouse Gas Initiative (RGGI) in North America already auctions 90% of carbon allowances by 2020. Similarly, countries like New Zealand, South Korea, and Canada have also started introducing auction percentages in their carbon market construction. The revenue generated from these auctions is utilized for various programs such as improving energy efficiency, subsidizing end-users, and deploying renewable energy technologies. The carbon quota auction is expected to play a crucial role in China's efforts to reduce emissions and achieve international alignment. In this context, it is imperative for the power generation industry to closely monitor the uncertainty associated with the auction ratio, which holds greater significance than ever before.
The accurate measurement of the scarcity value of carbon allowances is crucial to internalize the external costs in the power generation industry. Currently, the carbon price in the carbon trading market does not fully account for the environmental cost. Additionally, the fluctuating auction transaction price makes it challenging to determine the true price of carbon emission rights. To better understand the cost burden imposed by carbon emission rights on the power industry's emission reduction cost and overall economic cost, numerous scholars have researched the shadow price of carbon dioxide emission rights. They have specifically analyzed the various impacts of each production element on the national or regional GDP to facilitate the measurement of the emission reduction cost in the power generation industry. The shadow price reflects the scarcity of resources and environmental value, although there is no consensus on the most accurate estimation method for the shadow price. In previous studies, the measurement of the shadow price of carbon emission rights has been conducted through various methods, including the marginal cost method, model estimation method, and transaction data method. The marginal cost method, as exemplified by Zhou, estimates the shadow price by considering the relationship between production cost and carbon emission intensity(Zhou et al., 2015). However, this method has limitations as it does not fully account for market supply and demand dynamics and may be subject to bias due to simplified assumptions. The model estimation method, as demonstrated by Lee, employs economic models and statistical techniques to calculate the shadow price of carbon emission rights(Lee et al., 2002). Nonetheless, this method necessitates extensive data requirements and may introduce uncertainties in parameter estimation, thereby affecting the accuracy of the results. The transaction data method, commonly utilized in certain reports, analyzes carbon trading activities and price fluctuations to infer future expectations of carbon emission rights prices.The main limitation of this method is that it relies on market participants' expectations, which can be influenced by various factors such as the overall economic environment. The uncertainty of these expectations can also impact the accuracy of the calculation results. This study proposes the use of the system dynamics model to calculate the shadow price of carbon emission rights. The system dynamics model is advantageous as it can comprehensively consider multiple factors and is dynamic and effective. This approach also addresses the limitations of existing research. Additionally, the SD model requires relatively fewer data and enables more accurate analysis and prediction when dealing with the complex nonlinear relationship between the auction ratio and the shadow price of carbon emission rights.
Regarding the application of carbon quota allocation theory in the power industry, existing studies can be broadly categorized into three main areas. Firstly, research focuses on decision-making in the power generation industry when faced with the choice between upgrading power generation equipment or purchasing carbon allowances when allowances are allocated free of charge. Secondly, studies explore the optimization of the power supply structure and the associated costs of carbon emission reduction when carbon allowances are allocated based on auction ratios. Lastly, investigations center on the amount of allowances that can be obtained by the power generation industry under different allocation methods, followed by a comparative analysis of the economic costs and benefits of power generation enterprises using publicly available power industry data.Over the past decade, with increasing energy demands and the imperative for carbon emission reduction, optimizing the power generation mix has become a prominent research focus in the power industry. This study further enriches the existing research and expands its depth by introducing the carbon quota auction ratio and considering economic costs. The introduction of the carbon quota auction ratio can significantly impact the power market's supply-demand relationship and price formation mechanism. As the auction ratio increases, both the power generation costs and emission reduction costs for power generation enterprises will also rise, thereby affecting the price and supply structure of the power market. From the perspective of the power generation sector, there are opportunities to alleviate economic pressures and achieve sustainable development by proactively addressing future carbon allowance allocation through auction ratios and devising comprehensive power generation portfolios on both monthly and annual scales.
Regarding the research on power generation structure, the existing papers have made innovative contributions in the following areas. Firstly, they have considered factors such as carbon constraints, carbon emission reduction, and the transition to a low carbon economy, which are all related to the control of greenhouse gas emissions(Sun,2021). Secondly, there have been improvements and upgrades in the algorithms used to solve the model. For example, Chen and others utilized the improved genetic algorithm (IGA) to explore the most effective approach for reducing carbon emissions and determining the optimal power supply planning for electric power companies(Chen et al., 2004). They aimed to minimize the total cost, including investment and operational expenses. Damien examined the impact of carbon constraints on the expansion of power sources and the problem of the optimal power structure(Crilly and Zhelev, 2008). Wen combined a production function with a genetic algorithm to optimize the energy mix of the power system, considering reliability constraints and focusing on cost minimization and redundancy optimization of coal-fired power stations(Dan-hui and Ji-ying, 2009).Shi employed the multi-objective planning theory to develop an optimization model for the coordinated development of socio-economics and the environment. The power generation mix in China was optimized in 2010, and power demand was forecasted under different scenarios(Shi and Liu, 2009). Cano and Ameli utilized the fuzzy optimization method and fuzzy logic method, respectively, to address the optimal allocation of distributed generation (DG) in the power distribution system(Ameli et al., 2010; Cano, 2007). To enhance global search capability and eliminate local optimal solutions, Niknam employed an improved multi-phase modified shuffled frog leaping algorithm (MSFLA) to optimize the power generation structure(Niknam et al., 2011). Xu utilized the Markov chain model to predict the power generation portfolios of the power sector within the context of low-carbon economic development. The model was validated using data from the Ningxia region(Xu et al., 2016). In the study on China's efficient power generation portfolios, Shuang Zhang employed portfolio theory to explore the optimal power generation mix in 2030(Zhang et al., 2018). It was found that preferences for non-fossil generation technologies were greatly influenced by the goals of pursuing cost or risk minimization and different policy targets. Utilizing multi-objective optimization and heuristic algorithms, Zhao et al. conducted a study on the short-term impact of the carbon quota auction ratio on the share of renewable power generation(Zhao et al., 2022). Their findings indicated that the inclusion of renewable power generation in the power generation mix did not exhibit significant changes when the auction ratio ranged from 0% to 5%. Building upon these existing studies and considering factors relevant to greenhouse gas emissions control, this paper introduces an innovative perspective by focusing on the carbon quota auction as a future trend in carbon trading. The study sets the auction ratio at intervals of 20% ranging from 0% to 100% to examine the optimal power structure of the region on a monthly time scale.
3. Methodology
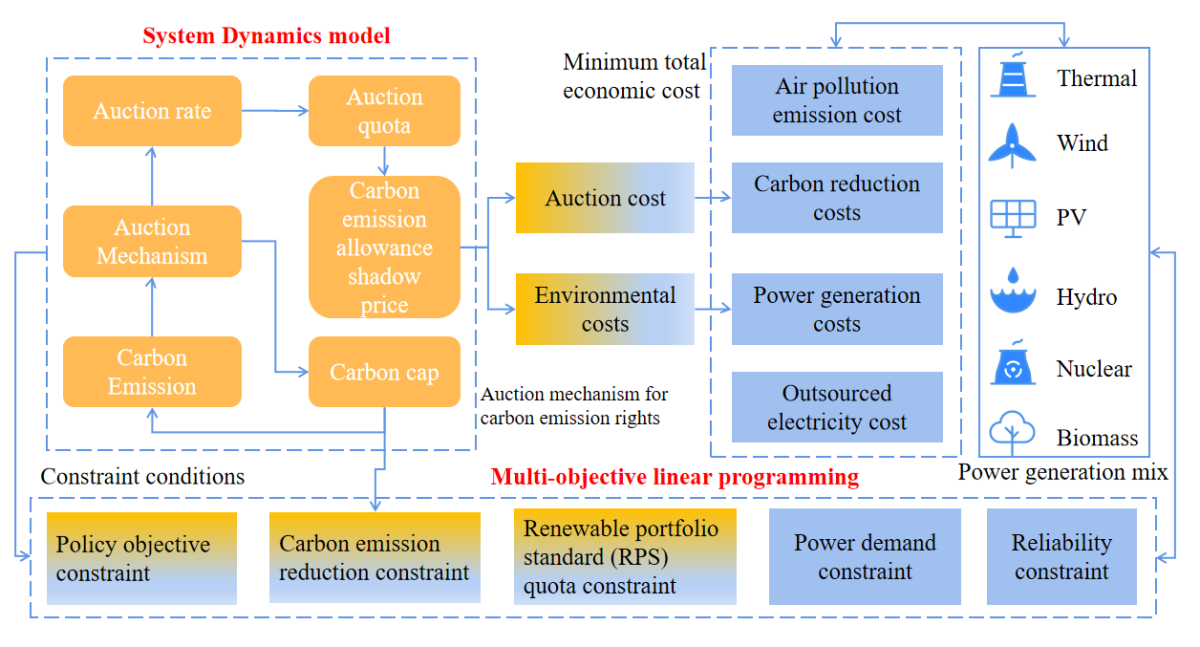
Based on the theory of mathematical dynamic systems, this paper utilizes the SD model to simulate the electric carbon market under the carbon allowance auction mechanism. The objective is to depict the shadow price of carbon emission rights under different ratios of carbon allowance auctions. In comparison to other models, the SD model offers several advantages such as requiring less data, considering multiple influencing factors and being dynamic. The interaction between the carbon allowance auction mechanism and the electricity carbon market is profound and multidimensional, making the SD model particularly suitable for studying the actual value of carbon emission rights in complex environment. The impact of the carbon allowance auction mechanism on the power generation mix is transmitted to the power generation structure through auction costs and environmental costs on the one hand, and through carbon cap on the other hand, which affect the production activities of electricity generation, such as the carbon emissions generated by thermal power generation. Using a multi-objective linear programming model, this study constructs a complete power generation structure optimization model based on the auction ratio to minimize the total economic cost, and its research framework is designed as follows (Figure 2):
3.1. System dynamics model
This paper employs a system dynamics model to estimate the actual price of carbon emission rights. The carbon emission rights pricing model is developed based on the auction ratio, specifically focusing on the electric carbon market and the incorporation of carbon quota auction ratios. Two key assumptions are considered: (1) Carbon emission caps are allocated below the total carbon emissions of the power generation sector to enhance the emission reduction effectiveness of the carbon trading market. (2) The primary source of profit for the clean energy generation sector is measured by the sale of Chinese Certified Emission Reductions(CCERs). Figure A1 presents the carbon emission rights pricing model, comprising a stock-flow diagram and a mathematical-logical relationship equation derived through diverse methodologies, including emission factor analysis, direct estimation, data fitting, and references to existing literature.
3.2. Multi-objective linear programming
In this paper, a multi-objective linear programming model is used to optimize the total economic cost under the introduction of carbon allowance auction mechanism.Existing literature widely agrees that as the allocation of carbon allowances shifts from free allocation to proportional auction allocation, power-producing companies will face growing economic pressure. Consequently, it becomes imperative to optimize the power generation mix to minimize the economic burden.
- (1)
- Objective function
To assist power generation enterprises in reducing cost pressure and achieving sustainable development, this research incorporates four objectives into the optimization scope: total power generation cost, total emission reduction cost, air pollution emission cost, and net cost of outsourced electricity. As all four objectives are cost functions related to the decision variables, it is feasible to consolidate them into a single objective function, namely optimizing the total economic cost :
is the total power generation cost of each energy generation technology in Guangdong Province; is the total carbon emission reduction cost of each energy generation; is the air pollution emission cost; is the net cost of outsourced electricity; denotes the various power generation technologies, , which stands for thermal power generation, hydroelectric power generation, wind power generation, nuclear power generation, solar power generation, and biomass power generation, respectively. The implications represented by the other variables have been explained in detail in Table 1.
When evaluating the overall abatement cost of both thermal power generation and clean energy generation, the total abatement cost consists of two components.Firstly, it includes the cost incurred by thermal power enterprises when participating in the auction to acquire allowances at the initial stage. Secondly, it encompasses the cost that needs to be paid when the total carbon emissions of the power generation industry exceed the allocated allowances (Zhang et al., 2012). represents the total cost of carbon emission reduction for each energy source used in power generation.
In order to effectively address policies pertaining to the development of a new power system and facilitate the transition towards a cleaner and low-carbon power sector, it is crucial to consider the costs associated with air pollution emissions during the optimization of power generation mix. This entails accounting for the pollutants released into the atmosphere during the power generation process, specifically from thermal power plants and biomass power plants. These pollutants can be represented by the indexs corresponding to sulfur dioxide, nitrogen oxides, smoke and dust, and PM2.5, respectively. is the air pollution emission cost.
Annually, Guangdong power generation sector procures electricity from external regions to address occasional electricity shortages. The purchased electricity is then supplied to the province. According to the Guangdong Statistical Yearbook 2022, the share of purchased electricity concerning the province's total electricity demand has shown a steady increase, rising from 9.5% in 2002 to 30.5% in 2018. Consequently, it becomes crucial and imperative to consider the cost associated with the procurement of electricity to meet the province's demand.
- (2)
- Constraint conditions
Electricity balance constraint. Local power generation plus outsourced electricity in Guangdong Province should be equal to the total social power demand plus the exported electricity (Yu et al., 2019).
Reliability constraint. The total available installed capacity should be not less than the maximum electricity load demand and the exported power demand in period , and includes the installed capacity of the constructed units and the outsourced electricity. (Yu Xinmei, 2010)
System reserve margin constraint. The power system should have a certain amount of reserve capacity to meet the demand of power users in case of equipment maintenance or unexpected accidents; however, too much backup capacity will lead to overcapacity and waste of resources, so it is necessary to set a reasonable reserve margin.
Renewable portfolio standard quota constraint. According to the document issued by the National Energy Administration (NEA) in 2022,“Circular of the National Energy Administration on the Completion of the Responsibility Weights for Renewable Energy Electricity Consumption in 2021”, each province should complete the assigned responsibility weights for total renewable energy electricity consumption. This means that the weight of responsibility for total renewable electricity consumption is located between the minimum value and the incentive value.
Peaking constraint.When a significant share of renewable power sources are integrated into the grid, the conflict is intensified between peaking demand and the regulation of renewable energy. To ensure the secure operation of the grid, the depth of thermal power peaking needs to adhere to the following constraints(Wei et al., 2021).
Policy objective constraint.To curtail thermal power generation and promote renewable energy generation, government departments will further restrict the proportion of electricity generated from non-fossil energy sources and non-water renewable energy sources, with the following corresponding constraints:
Carbon emission reduction constraints. According to the 14th Five-Year Plan of Guangdong Province, carbon emissions from the power generation sector must be kept below the carbon cap: (Zhang et al., 2020)
Actual constraint.The amount of power generation under various energy generation technologies should also be constrained by the corresponding installed capacity and equipment utilization hours. (Zhang et al., 2020)
Non-negative constraint. The amount of power generation from energy type in month should not be less than zero and outsourced electricity in month should not be less than zero.
4. Data and Empirical results
4.1. Data collection
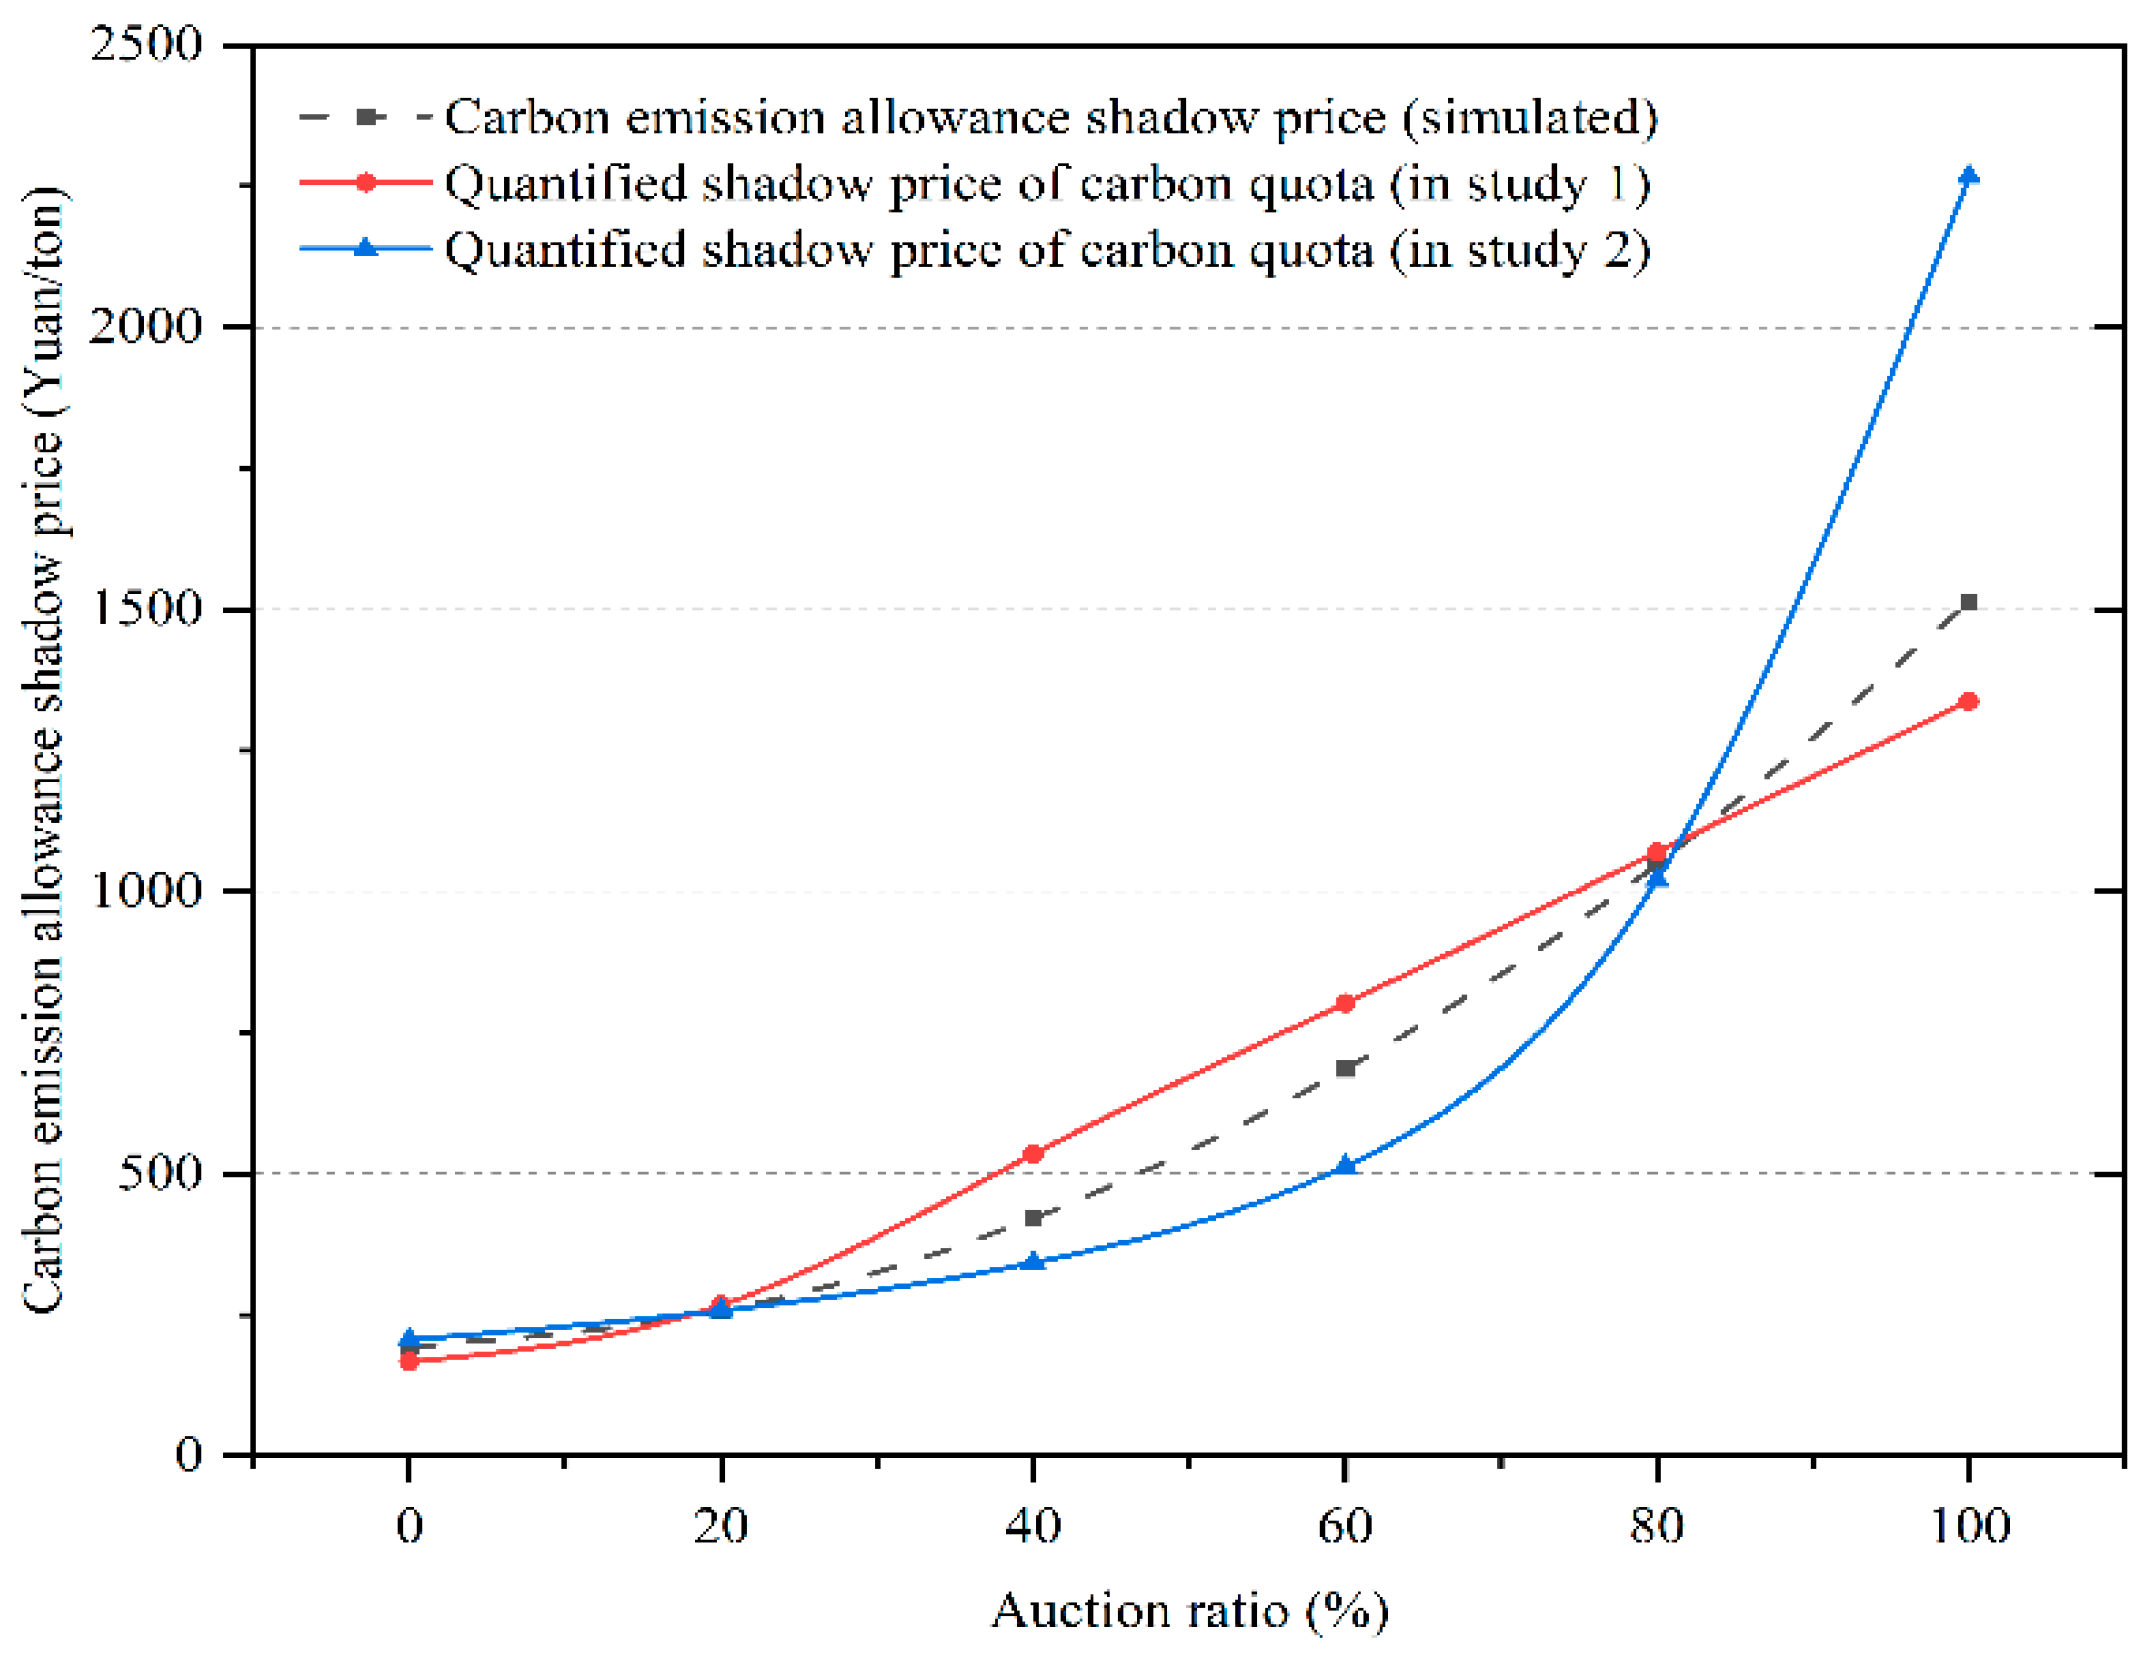
(1) The carbon emission rights pricing model was constructed based on the carbon allowance auction mechanism and the overall operation of the power industry using system dynamics model. To clarify the boundaries of the system, the changes in the shadow price of carbon emission rights in Guangdong Province under the carbon allowance auction mechanism are analyzed using auction ratio, therma power CO2 emission coefficient as external factors. A simulation model of the electric-carbon industry based on the carbon allowance auction ratio is constructed using a combination of qualitative description and quantitative research, and the stock flow diagrams are shown in Figure A1. Through the sensitivity analysis, the Output results of the simulation model of the electric carbon industry based on the carbon quota auction ratio passed the test and proved the accuracy, and the simulation values of some of the variables could not be compared with the historical values, so the data results from similar studies were chosen to compare with the simulation values. By comparing with existing studies, it is found that the simulation results of the model on the shadow price of carbon allowances are reasonable under different auction ratios. The shadow prices of carbon allowances under different auction ratios are shown below:
Figure 3.
Shadow price of carbon allowances under different auction ratios.
(2) The table below presents data on the environmental costs associated with the reduction of emissions for different pollutants, as discussed in the relevant literature(Fang, 2017; Li et al., 2021).

Table 2.
Environmental costs resulting from the emission of various pollutants.
| Pollutants | Unit | ||||
| Average emission factor for thermal power generation | g/kWh | 1.65 | 6.36 | 0.5 | 1.06 |
| Average emission factor for biomass power generation | g/kWh | 0.357 | 0.742 | / | 0.103 |
| Environmental costs | Yuan/kg | 6 | 8 | 2.2 | 0.12 |
(3) Other data that were used in the study, including basic operating costs, power generation subsidies, and carbon emission coefficients, are shown in Table 3. The basic operating costs include depreciation expenses, operating costs, and daily operating expenses, of which depreciation expenses are measured using straight line depreciation method and daily operating expenses mainly include fuel costs and labor costs. The data on power generation subsidy refer to the benchmark on-grid tariff published on the government website. The data on average carbon price is obtained from Polaris Power Network.
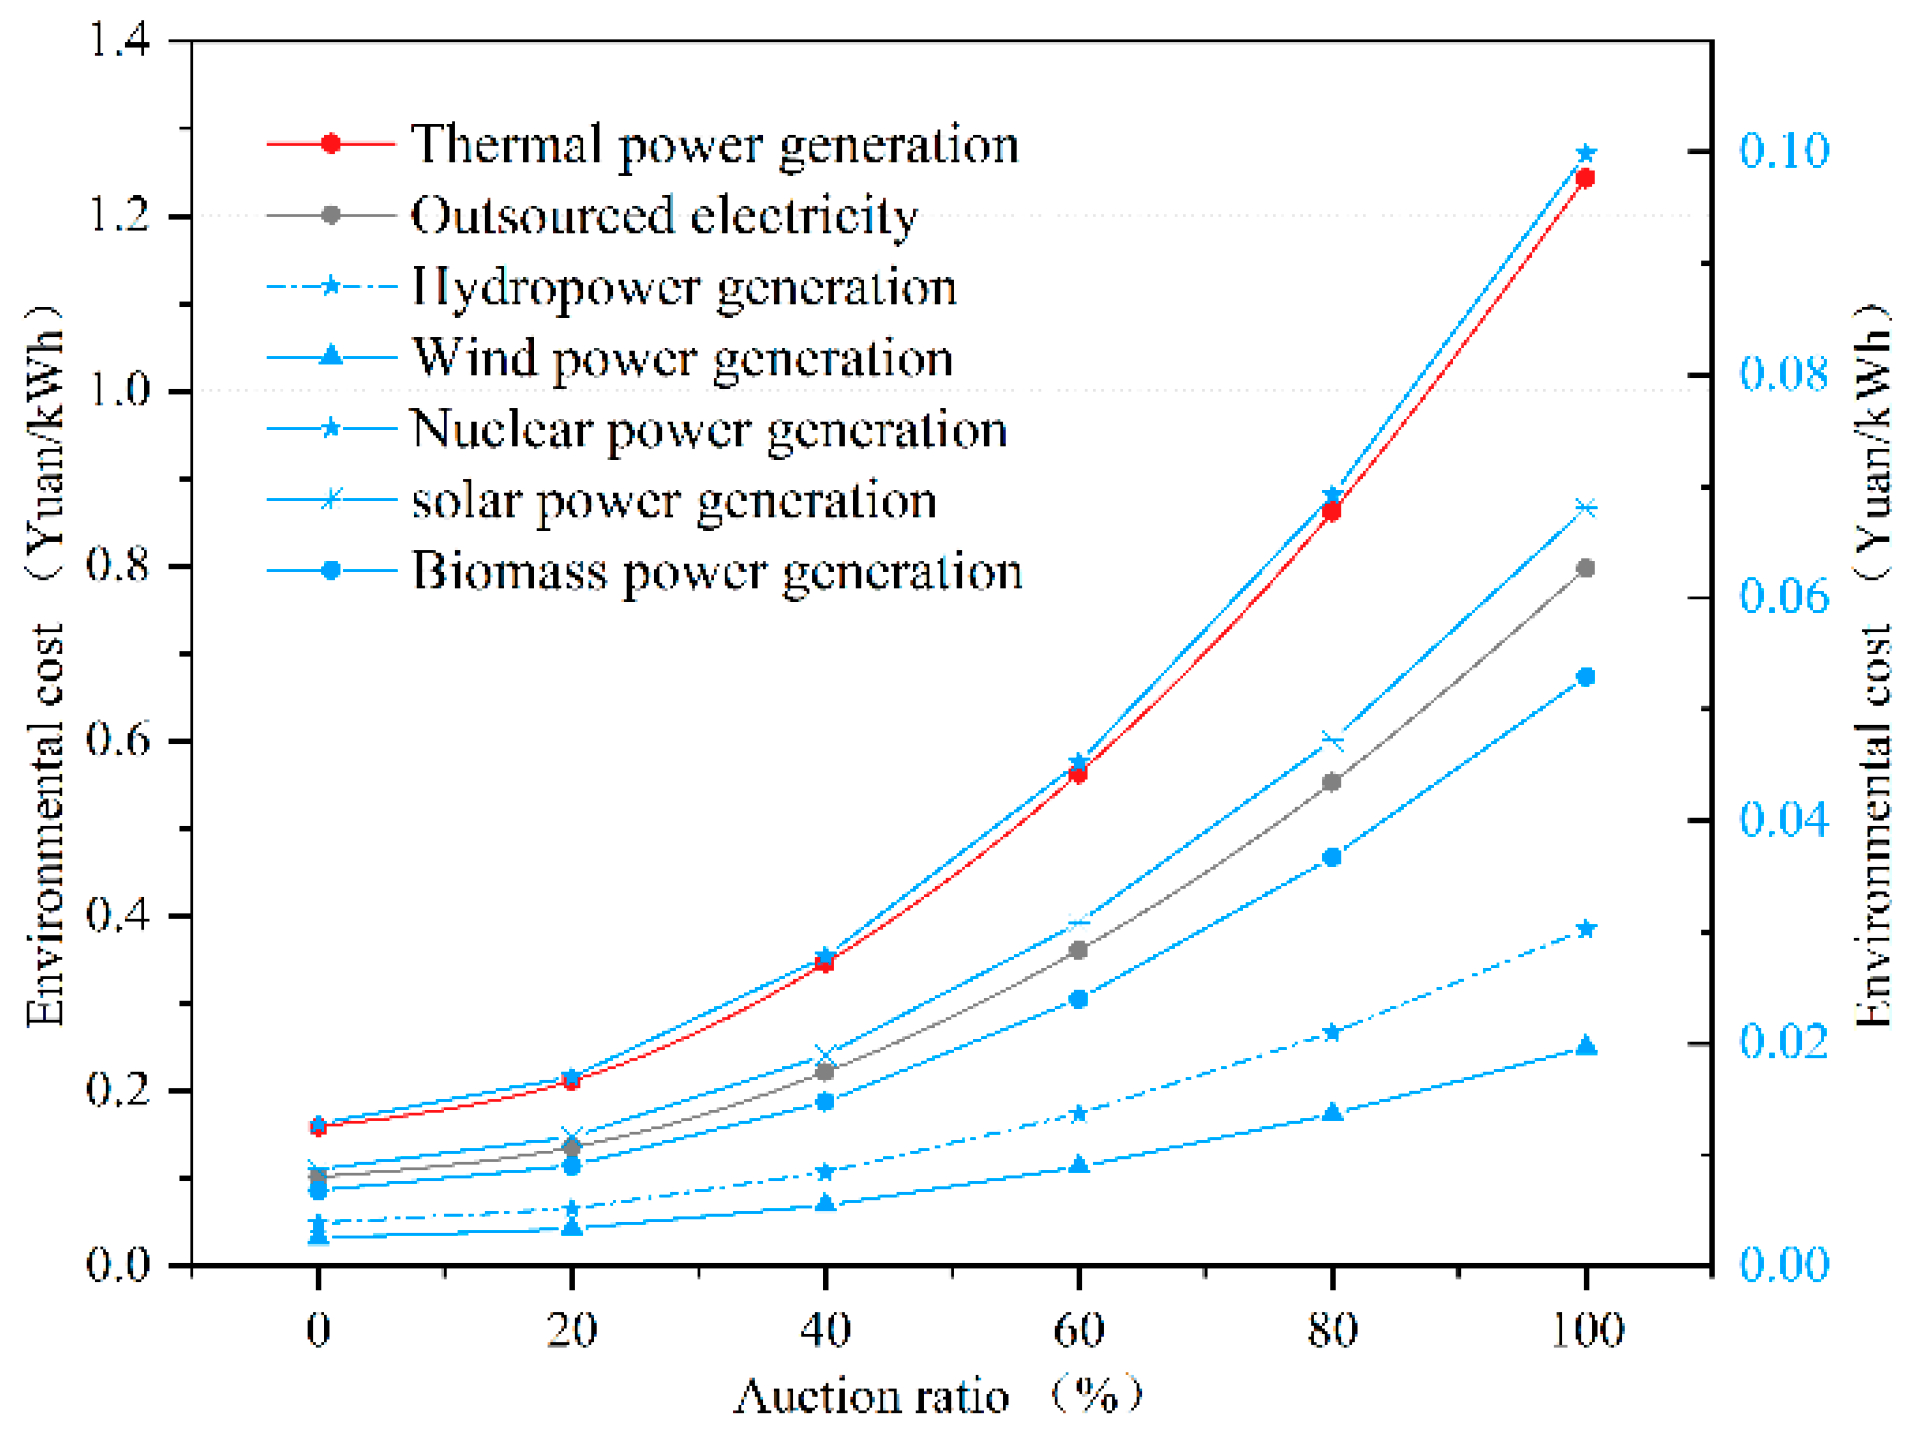
(4) The environmental cost is measured by equation (5). It can be found that the environmental cost of thermal power generation and outsourced electricity increases the most as the auction ratio grows, while the maximum environmental cost of other energy generation technologies does not exceed 0.1 Yuan/kWh.
Figure 4.
Environmental cost of power generation from different energy sources under different auction ratios of carbon quotas.
Figure 4.
Environmental cost of power generation from different energy sources under different auction ratios of carbon quotas.
Other data related to this research have been presented in the Appendixes, specifically Table A1 and Table A2. For instance, the data on carbon emission intensity primarily comes from the studies conducted by Fan Jinlu, Wang Shuo, Song Haitao, Jacobson, M.Z, Yuxuan Wang, and others. Carbon emission intensity refers to the amount of carbon emitted per unit of power generation during the operational phase, and it is currently used as a measure of carbon emissions in the construction of the carbon trading market. The data on installed capacity, unit output coefficient, plant electricity consumption rate and line loss rate primarily originate from the wind database. The data on average carbon price is obtained from the Carbon Trading Platform.The calculation of carbon emission cap is based on the government's planning documents and the characteristics of thermal power generation. The electricity consumption rate per unit of GDP in Guangdong Province is determined using provincial GDP and electricity consumption data from the Wind database. The data for the overall electricity power demand is derived from literature sources, following the principle of “Electricity Consumption Rate per Unit of GDP GDP × (1 + Economic Growth Rate)”. The maximum power load for each month is obtained from the “Typical Power Load Curve of Provincial Power Grids” published by the National Development and Reform Commission(Albadi and El-Saadany, 2008).
4.2. Empirical results
Using the aforementioned data, the carbon quota auction mechanism is integrated into the power generation structure optimization process, with the aim of minimizing the total economic cost and optimizing the power generation mix of Guangdong Province on a monthly time scale. In this paper, a combination of system dynamics model and multi-objective linear programming model is employed, and the resulting model is solved using a genetic algorithm. The empirical results are as follows:
- (1)
- Unit electricity cost
After considering the total power generation cost, total emission reduction cost, air pollution emission cost, and net cost of outsourced electricity, we obtained the following results of the unit electricity cost for each energy generation in different months under different carbon allowance auction ratios (as shown in Figure 5). From the figure, it can be observed that the unit electricity cost for the six major power generation technologies in Guangdong Province changes slightly in different months under the same carbon quota auction ratio. The changes in the unit electricity cost for various power generation technologies are relatively moderate. This phenomenon may be attributed to the government subsidizing the electricity price of renewable energy generation based on the benchmark on-grid tariff. This measure aims to enhance the competitiveness and sustainability of renewable energy power generation. With the implementation of the carbon allowance auction mechanism and the gradual increase in the auction ratio, the unit electricity cost for all power generation technologies has increased simultaneously. Among them, unit electricity cost for thermal power generation reaches its maximum value of 1.66 Yuan/kwh when the auction ratio is 100%, which is nearly three times higher than the auction ratio is zero. According to the carbon emission accounting method in the carbon market, the outsourced electricity should be measured using the indirect emission method based on Scope2. As a result, the unit cost of outsourced electricity rises as the auction ratio increases. The unit cost of outsourced electricity nearly doubles when the auction percentage climbs from 0% to 100%. From the trend of the unit cost of outsourced electricity, it can be observed that the unit electricity cost in Guangdong Province is highest in July, August, and December, coinciding with the highest electricity consumption in these three months. From the above, it can be deduced that the high electricity demand in July, August and December stimulates the demand for outsourced electricity, and the increase in the demand for outsourced electricity raises the average transaction price of outsourced electricity, which ultimately results in the phenomenon that the unit electricity cost is even higher in these three months. In exception of thermal power and outsourced electricity, the unit electricity cost for other energy generation technologies changes relatively modestly as the proportion of auctions rises, and basically remains below 0.6 Yuan/kWh.
- (2)
- Optimization results of the power generation mix
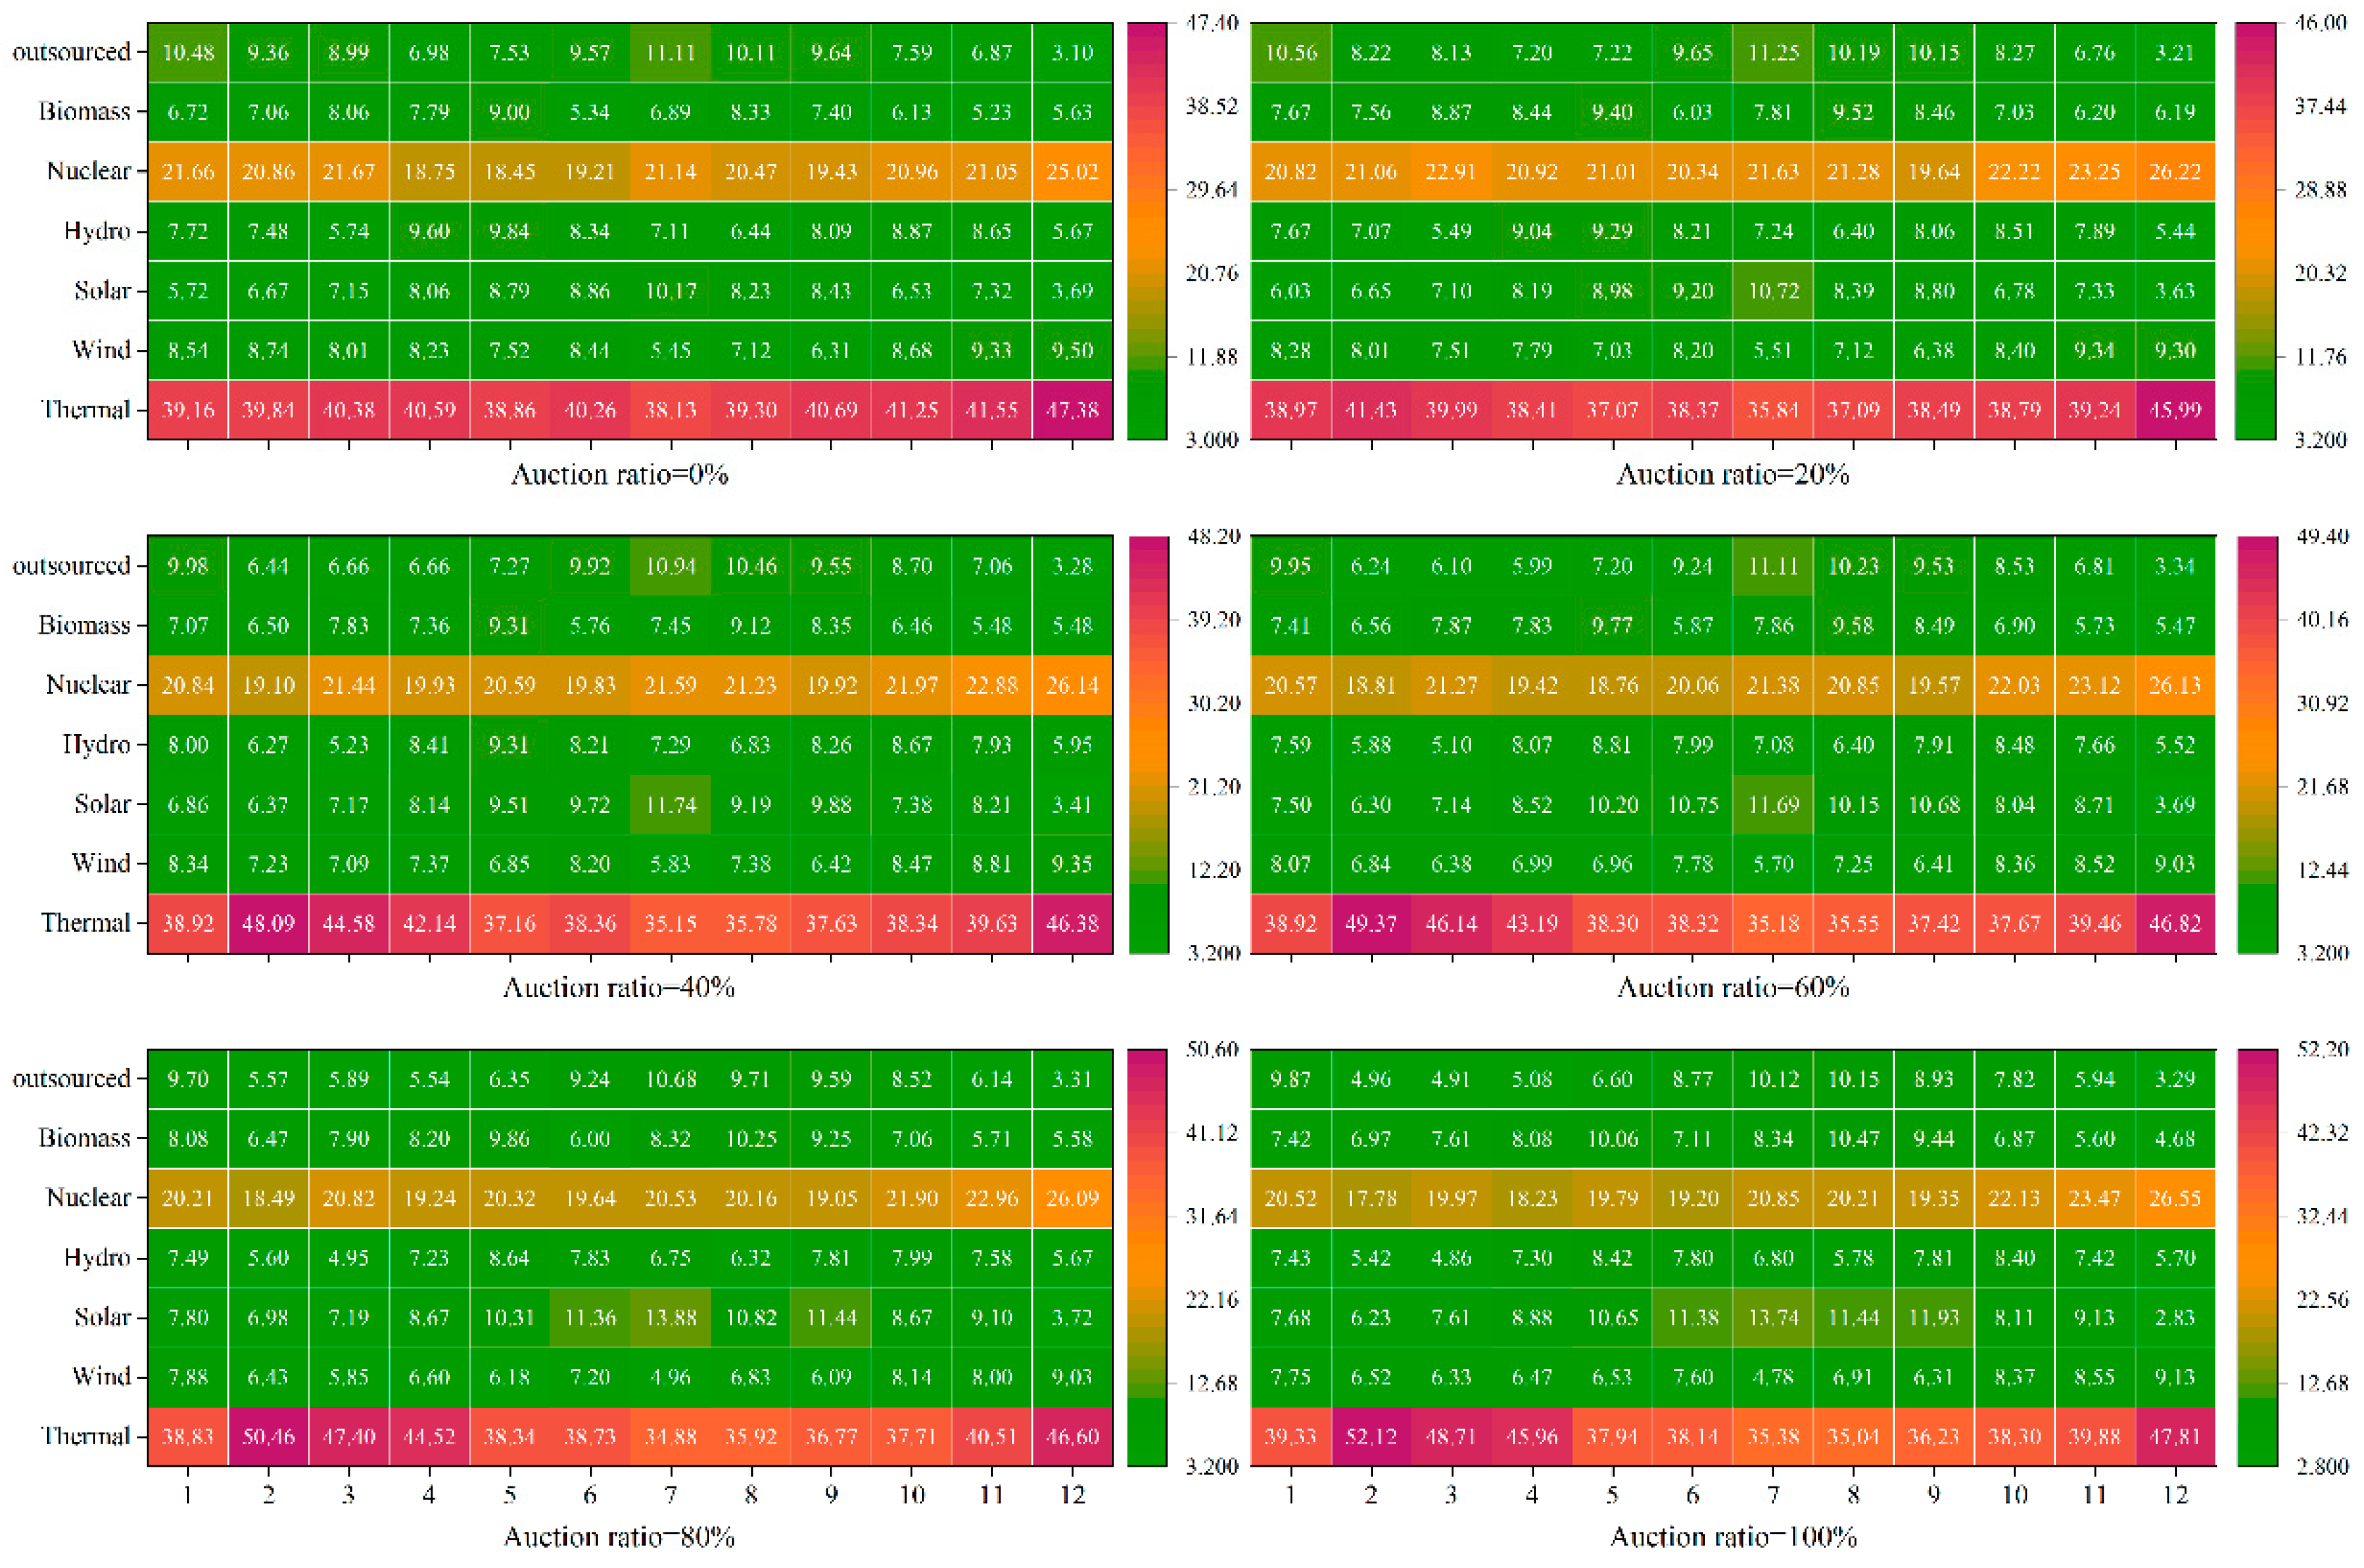
After the introduction of the carbon allowance auction mechanism, this paper optimizes the power generation structure to minimize the total economic cost and finally obtains the output results with the time scale of months, as shown in Figure 6. From the heat map, it can be seen that when the auction ratio ascends from 0% to 100%, Power generation by thermal power and nuclear power contribute a higher share of the amount of power generation. In terms of months, when the auction ratio is 100%, Power generation by thermal power peaks at 52.12 kWh in February; meanwhile, Power generation by nuclear power peaks at 26.55 kWh in December. In other words, to ensure that the total economic burden of the power generation industry is minimized, when the carbon allowance auction mechanism is aligned with the international carbon market in the future, each month thermal power and nuclear power generation should prepare at least 52.12 kWh and 26.55 kWh of stabilized power supply.
The share of Power generation of various power generation technologies in the whole society's electricity consumption is shown in Figure 7. The horizontal axis of each graph represents months 1-12, and the vertical axis represents the share of electricity generated by each energy source. Each month corresponds to a bar chart, and the proportion represented by the bar chart is the share of total electricity demand accounted for by each power generation technologies. Figure 7 is a composite of six subfigures representing the power generation mix for each month when the auction ratio is 0%, 20%, 40%, 60%, 80%, and 100%. Each bar graph consists of different color block, representing thermal, wind, solar, hydro, nuclear, biomass and outsourced electricity from bottom to top. As can be seen from the graph, the share of thermal power generation has remained largely at 40% even when considering outsourced electricity. When the auction percentage rises from 0% to 100%, from the monthly power generation structure, the smallest share of thermal power generation is 34.88% (auction ratio is 80%, July), and the largest share is 52.12% (auction ratio is 100%, February).In other words, to meet the challenge of the carbon quota auction mechanism, the Guangdong power sector should train in advance to reduce the share of thermal power generation to 34.88% per month, as Participating in the carbon quota auction can help alleviate the economic burden on the power generation sector to some extent.
Another noteworthy phenomenon requires attention. Regardless of how the auction ratio fluctuates, February, November, and December consistently exhibit the highest proportion of thermal power generation each year. The elevated share of thermal power in February might be attributed to the surge in electricity consumption due to the approaching New Year, where an increase in thermal power generation is needed to meet the demand for electricity consumption more flexibly. Similarly, the peak share of thermal power generation in November and December could be associated with the rise in energy demand during winter, leading to an increase in electricity consumption, and subsequently an escalation in thermal power generation as one of the primary sources of electricity supply. Moreover, the decline in rainfall during November and December in Guangdong contributes to reduced hydropower generation, which is compensated by increased thermal power generation to meet the electricity demand.
Another significant discovery is the consistent decline in the share of annual outsourced electricity as the auction ratio increases. As depicted in Figure 8, when the auction ratio is set at 0%, the share of outsourced electricity amounts to 8.55%, whereas with a rise in the auction ratio to 100%, the share of outsourced electricity diminishes to 7.28%. This trend is attributed to the constraints imposed on indirect carbon emissions associated with outsourced electricity under the carbon trading market mechanism. The more purchased electricity a power generation company buys, the greater the pressure to reduce emissions when accounting for carbon emissions, which will impose a heavier financial burden on the company. Consequently, to alleviate the overall economic burden of power generation enterprises, the share of outsourced power continues to be curtailed. Currently, the share of outsourced electricity in Guangdong Province comprises nearly 30% of the total electricity consumption in the entire society. To further alleviate the economic burden on power generation enterprises, the proportion of outsourced electricity must be reduced by two-thirds, thereby enhancing the self-sufficiency rate of electricity to 92.72%.
It can be observed in Figure 8 that the proportion of electricity generated from renewable sources does not exhibit a consistent increasing trend as the auction ratio rises. With the auction ratio increasing from 0% to 20%, the share of electricity generated from renewable energy sources increased by 0.46%; however, when the auction ratio was further raised from 20% to 100%, the share of electricity generated from renewable sources declined by 0.98%. Furthermore, in conjunction with Figure 9, the monthly data on renewable energy generation reveals that the average share of renewable electricity generation is higher when the auction ratio is set to 20% or 80%. When the auction ratio is 0%, the proportion of renewable power generation is more concentrated in each month, and the distribution of the share of renewable power generation gradually becomes more dispersed as the auction ratio increases. Notably, at auction percentages of 0%, 20%, and 40%, the corresponding box plots appear as outliers, attributed to the more concentrated distribution of the share data at the median level of 40%. As depicted in Figure 8 and Figure 9, the annual share of renewable power generation exhibits a slight downward trend when the auction ratio exceeds 20%, while the fluctuations in the change of the monthly share of renewable power generation tend to stabilize.
- (3)
- Results of cost indicators
Figure 10 represents the cost indicators at different auction ratios, which are the various costs associated with the objective function for this study. The horizontal scale of Figure 10 represents the auction ratios from 0% to 100%, and the vertical scale represents the cost. As can be shown in the figure, the total economic cost is strongly influenced by the total generation cost, and their trends are particularly similar. Within the composition of total economic costs, total generation costs are an order of magnitude higher than total carbon abatement costs, air pollution emission costs, and outsourced electricity costs, and are therefore measured using two different cost scales in the figure.
Figure 10 presents the trends of various costs under different auction ratios. As the auction ratio grows, the total power generation cost shows an obvious growth trend, and the total carbon emission reduction cost also shows a dramatic growth trend, yet the change in the air pollution emission cost is relatively moderate, and the cost of outsourced power even shows a decreasing trend. Further analysis of the modeling results reveals that the air pollution emission cost is mainly bound to the pollutants generated by thermal power generation and biomass power generation, while the results from Figure 8 show that with the increase of the auction ratio, the range of the share change of thermal power generation is from 38.99% to 41.14%, and the range of the proportion change of biomass power generation is from 6.99% to 7.81%, and the fluctuation of the changes is not particularly drastic, therefore the corresponding cost of air pollution emissions will not change particularly significantly. The reason for the decrease in the cost of outsourced electricity is mainly due to the requirement to prioritize power generation technologies with low unit cost under the constraint of minimizing the total economic cost. A comparison of Figure 5 shows that when the auction ratio is increased from 0 to 60%, the unit cost of outsourced electricity is higher than the unit cost of thermal generation in all cases, by 41.4%, 34.9%, 22.3%, and 9.3%, respectively. Even when the auction ratio is set to 80% and 100%, the difference between the unit cost of outsourced electricity and thermal power generation is only 0.02 and 0.15 Yuan/kWh. So the total economic cost can be minimized by the reduction of outsourced electricity purchase.
This research examines the correlation between total economic cost and carbon emissions, illustrated by the black and blue curves respectively in Figure 11. The graph reveals that despite optimization efforts, the total economic cost exhibits a notable upward trend as the auction ratio increases. Specifically, when the auction ratio rises from 0% to 100%, the total economic cost of the power generation sector nearly doubles. In contrast, the trend in carbon emissions follows a 'V' shape as the proportion of auctions increases. The lowest carbon emissions, at 192.98 Million tons, are observed when the auction ratio is set at 20%. Beyond this point, carbon emissions gradually increase. This phenomenon can be attributed to the current carbon emission cap of 250 million tons, which is considered non-strict according to relevant documents. After successfully achieving the emission reduction target, the power generation sector can still strive for maximum benefits in the carbon control space and have a certain degree of flexibility in emission reduction. It is essential to set appropriate carbon emission cap and auction ratio, which will contribute to the carbon emission reduction of power generation enterprises and facilitate the achievement of greenhouse gas emission mitigation objectives.
5. Conclusions and Policy implications
This paper presents a comprehensive power generation structure optimization model based on auction ratios, focusing on Guangdong Province as the research area. The model systematically optimizes the power generation mix on a monthly time scale and provides a quantitative evaluation of the economic inputs needed to reduce greenhouse gas emissions. Through empirical research, the following conclusions are drawn:
After considering the costs of power generation, emission reduction, air pollution emission, and outsourced electricity, the unit cost of electricity for thermal power generation is projected to increase by approximately three times, while the unit cost of outsourced electricity will nearly double when the auction ratio of carbon allowances rises from 0% to 100%. Specifically, the unit cost of electricity for thermal power generation at a 100% auction ratio is estimated to be 1.66 Yuan/kwh, and the unit cost of outsourced electricity is projected to be 1.51 Yuan/kwh. These figures represent a 58.1% and 43.8% increase, respectively, compared to the average peak price set by the Guangdong Development and Reform Commission (1.05 Yuan/kwh). Consequently, the power sector should proactively prepare and plan for the future tariffs of thermal power and outsourced electricity to address the potential challenge of high tariffs and enhance tariff competitiveness.
Secondly, with the increase of the auction ratio, July is the month with the least thermal power generation and February is the month with the highest thermal power generation from the monthly results, and its share of power generation fluctuates between 34.88% and 52.12% respectively. In other words, after the implementation of the carbon quota auction mechanism, to maximize the reduction of economic burden for the power generation sector, if it is difficult to meet the requirement of 34.88% of thermal power generation share in each month, then it should try its best to ensure that the share of thermal power generation in July reaches the level of 34.88%, this approach enables the sustainable and healthy development of the power sector. Additionally, to address the decrease in rainfall and the surge in power demand, additional thermal power generation is required during the months of November and December, with the exception of February.
Thirdly, from the annual results, the carbon allowance auction mechanism is able to promote the development of renewable energy power generation when the auction ratio increases between 0% and 20%, and the promotion effect diminishes in the short term after exceeding the 20% ratio red line. Intuitively, we would expect the share of renewable energy to surge as the auction percentage grows. However, the results of the optimization provide new insights for policy makers, namely the coordinated carbon reduction problemof the Renewable Portfolio Standards and the carbon auction mechanism. According to the optimization results, if these two mechanisms are not improved, it will be difficult to achieve the Emission Reduction Effect of one plus one is greater than two emission reduction in the future.
Fourthly, the total economic cost of the power generation sector almost doubled, and the total carbon emission reduction cost increased by nearly 40 times from 0% to 100% auction ratio. However, the cost of outsourced electricity gradually decreased as the ratio increased. The total carbon abatement cost is a significant component of the overall economic cost. The reason for the substantial increase in carbon abatement cost is the dramatic growth in the cost of carbon quota auction and compliance cost for the power generation sector, which puts pressure on the sector. The decreasing cost of outsourced electricity is due to the unit cost of outsourced electricity being higher than the unit cost of thermal power as the ratio increases. This leads to a suppresses in outsourced electricity purchases and an expected increase in the self-sufficiency rate of local electricity in Guangdong Province in the future.
Finally, a comprehensive comparison of the indicators of total economic cost, renewable energy development and carbon emissions reveals that setting the carbon allowance auction ratio at 20% is scientific and reasonable. When the ratio of carbon quota auction is 20%, the total economic cost has the smallest growth rate of 5.92% compared with the auction ratio of 0%; when the ratio rises to 40%, 60%, 80%, and 100%, the growth rate of the total economic cost reaches 24.08%, 50.57%, 87.59%, and 134.77%, correspondingly. For renewable energy development, the percentage of renewable energy generation reaches its highest value of 39.31% when the auction ratio is 20%. For carbon emissions,the smallest amount of carbon emissions can be realized when the auction ratio is 20%, reaching 192.98 Million ton under the current cap of 250 million tons of carbon emissions.
The conclusions are further analyzed and discussed, and the policy recommendations of this research are as follows:
Firstly, the conclusions of this research suggest that the Guangdong provincial government should consider increasing investment in clean energy power generation, with a particular focus on nuclear power. This would serve as a key strategy for reducing high carbon emission costs. It is observed that the carbon abatement cost associated with thermal power and outsourced power in Guangdong province is considerably high. In light of sustainable development, the government can address the issue by allocating more resources to clean energy power generation. Due to the significant initial investment required for carbon emission reduction, it is possible that numerous thermal power enterprises may not actively participate in the carbon trading market. However, this situation provides clean energy power generation enterprises a comparative advantage, especially after introducing the auction ratio of carbon quotas. Leveraging its existing geographical and resource advantages, Guangdong Province can gradually expand the scale of clean energy power generation. The Daya Bay Nuclear Power Station in Guangdong Province is China's largest nuclear power facility, boasting the highest operational installed capacity. As a result, the government can give priority to the development of nuclear power while considering other forms of clean energy generation as supplementary sources. Subsequently, the focus can be gradually shifted towards the development of other clean energy power generation.
Secondly, in order to alleviate the economic pressure brought about by the cost of carbon emission reduction, and in response to the new power system reformation program "Several Opinions on Further Deepening the Reform of Power System" (referred to as "No. 9 Government Document"), the Guangdong provincial government can liberalize the decision-making power of electricity pricing to a certain extent. To address this problem, it is necessary to appropriately incorporate the costs of carbon emission reduction into residential and industrial electricity prices through a reasonable auction ratio. These measures would incentivize the production and consumption of clean energy, facilitating energy transformation. For instance, setting the auction ratio of carbon quotas to 100% would result in thermal power generation and outsourced electricity having unit electricity costs that are 58.1% and 43.8% higher than the average peak electricity price, respectively. Therefore, it is crucial for the government to respond to the policy outlined in the "No. 9 Government Document" and promote reforms and improvements in the electricity trading mechanism. This includes a gradual and regional adjustment of electricity prices.
Thirdly, the Guangdong provincial government aims to address the mutual constraints between Carbon Emissions Trading and Renewable Portfolio Standards. This research presents the carbon quota auction mechanism and considers the constraints imposed by the Renewable Portfolio Standards. Our research identifies a potential issue where the minimum and incentive responsibility weights of the Renewable Portfolio Standards might limit the emission reduction impact that the carbon quota auction mechanism should have achieved. Moreover, increasing the auction ratio may not effectively promote the utilization of renewable energy when the carbon emissions cap in the auction mechanism is not strictly set.
Fourthly,the relevant government departments can set the auction ratio at 20% in the short term to achieve various policy objectives considering the total economic cost renewable energy development and carbon emission indicators.Compared to an auction ratio of 0%, ratio at 20% will minimize the increase in total economic costs and impose a minimal and acceptable economic burden on the power generation sector. Additionally, the share of electricity generated from renewable sources peaks and carbon emissions are reduced to a minimum level when the auction ratio is 20%. If the auction ratio exceeds 20%, it will be necessary to redesign the cap on carbon emissions for the auction mechanism, as well as adjust the minimum value and incentive value under the Renewable Portfolio Standards. These adjustments are crucial to realizing the expected emission reduction targets while reducing the economic burden on the power generation sector.
The power generation mix optimization model based on the auction ratio, constructed in this research, can serve as a benchmark for the government in the allocation of carbon quota auctions in Guangdong province in the future. Additionally, it provides a reference and suggestion for including more industries in the national carbon trading market.
Acknowledge
This research was supported by the National Natural Science Foundation of China (71673086).The authors would like to express their appreciation to the editors and anonymous reviewers for the valuable insights and constructive feedback they provided.
Appendix
In Section 3, the coupling of the carbon emission rights pricing model based on system dynamics and power generation structure optimization model provides theoretical support for the power generation sector to respond to future carbon allowance auction ratios and to make reasonable planning about power generation decisions. In this module, we mainly want to explore the characteristics of the changes in the real price level of carbon allowances as the auction ratio increases and evolves, as well as the variation trends of other related factors. As shown in Figure A1, after referring to existing studies, this research constructs a system dynamics model based on carbon pricing according to complex system thinking. In the stock-flow diagram shown, a variable that accumulates with time is represented by a box, a variable that influences the state of volume variable through inflow and outflow is marked by "", and variables not pointed to by arrows is represent exogenously given variables. When doing the simulation analysis, it is necessary to establish the differential equation, difference equation or algebraic equation of the relationship between the variables, and then determine the initial values and parameters in the model by reviewing the information and literature, after the output results of the simulation model are consistent with the real data, and then finally the sensitivity analysis is carried out by using Vensim in order to further adjust the parameters and optimize the model. The output of the final model is shown in Figure 3.
Figure A1.
The carbon emission rights pricing model based on system dynamics.
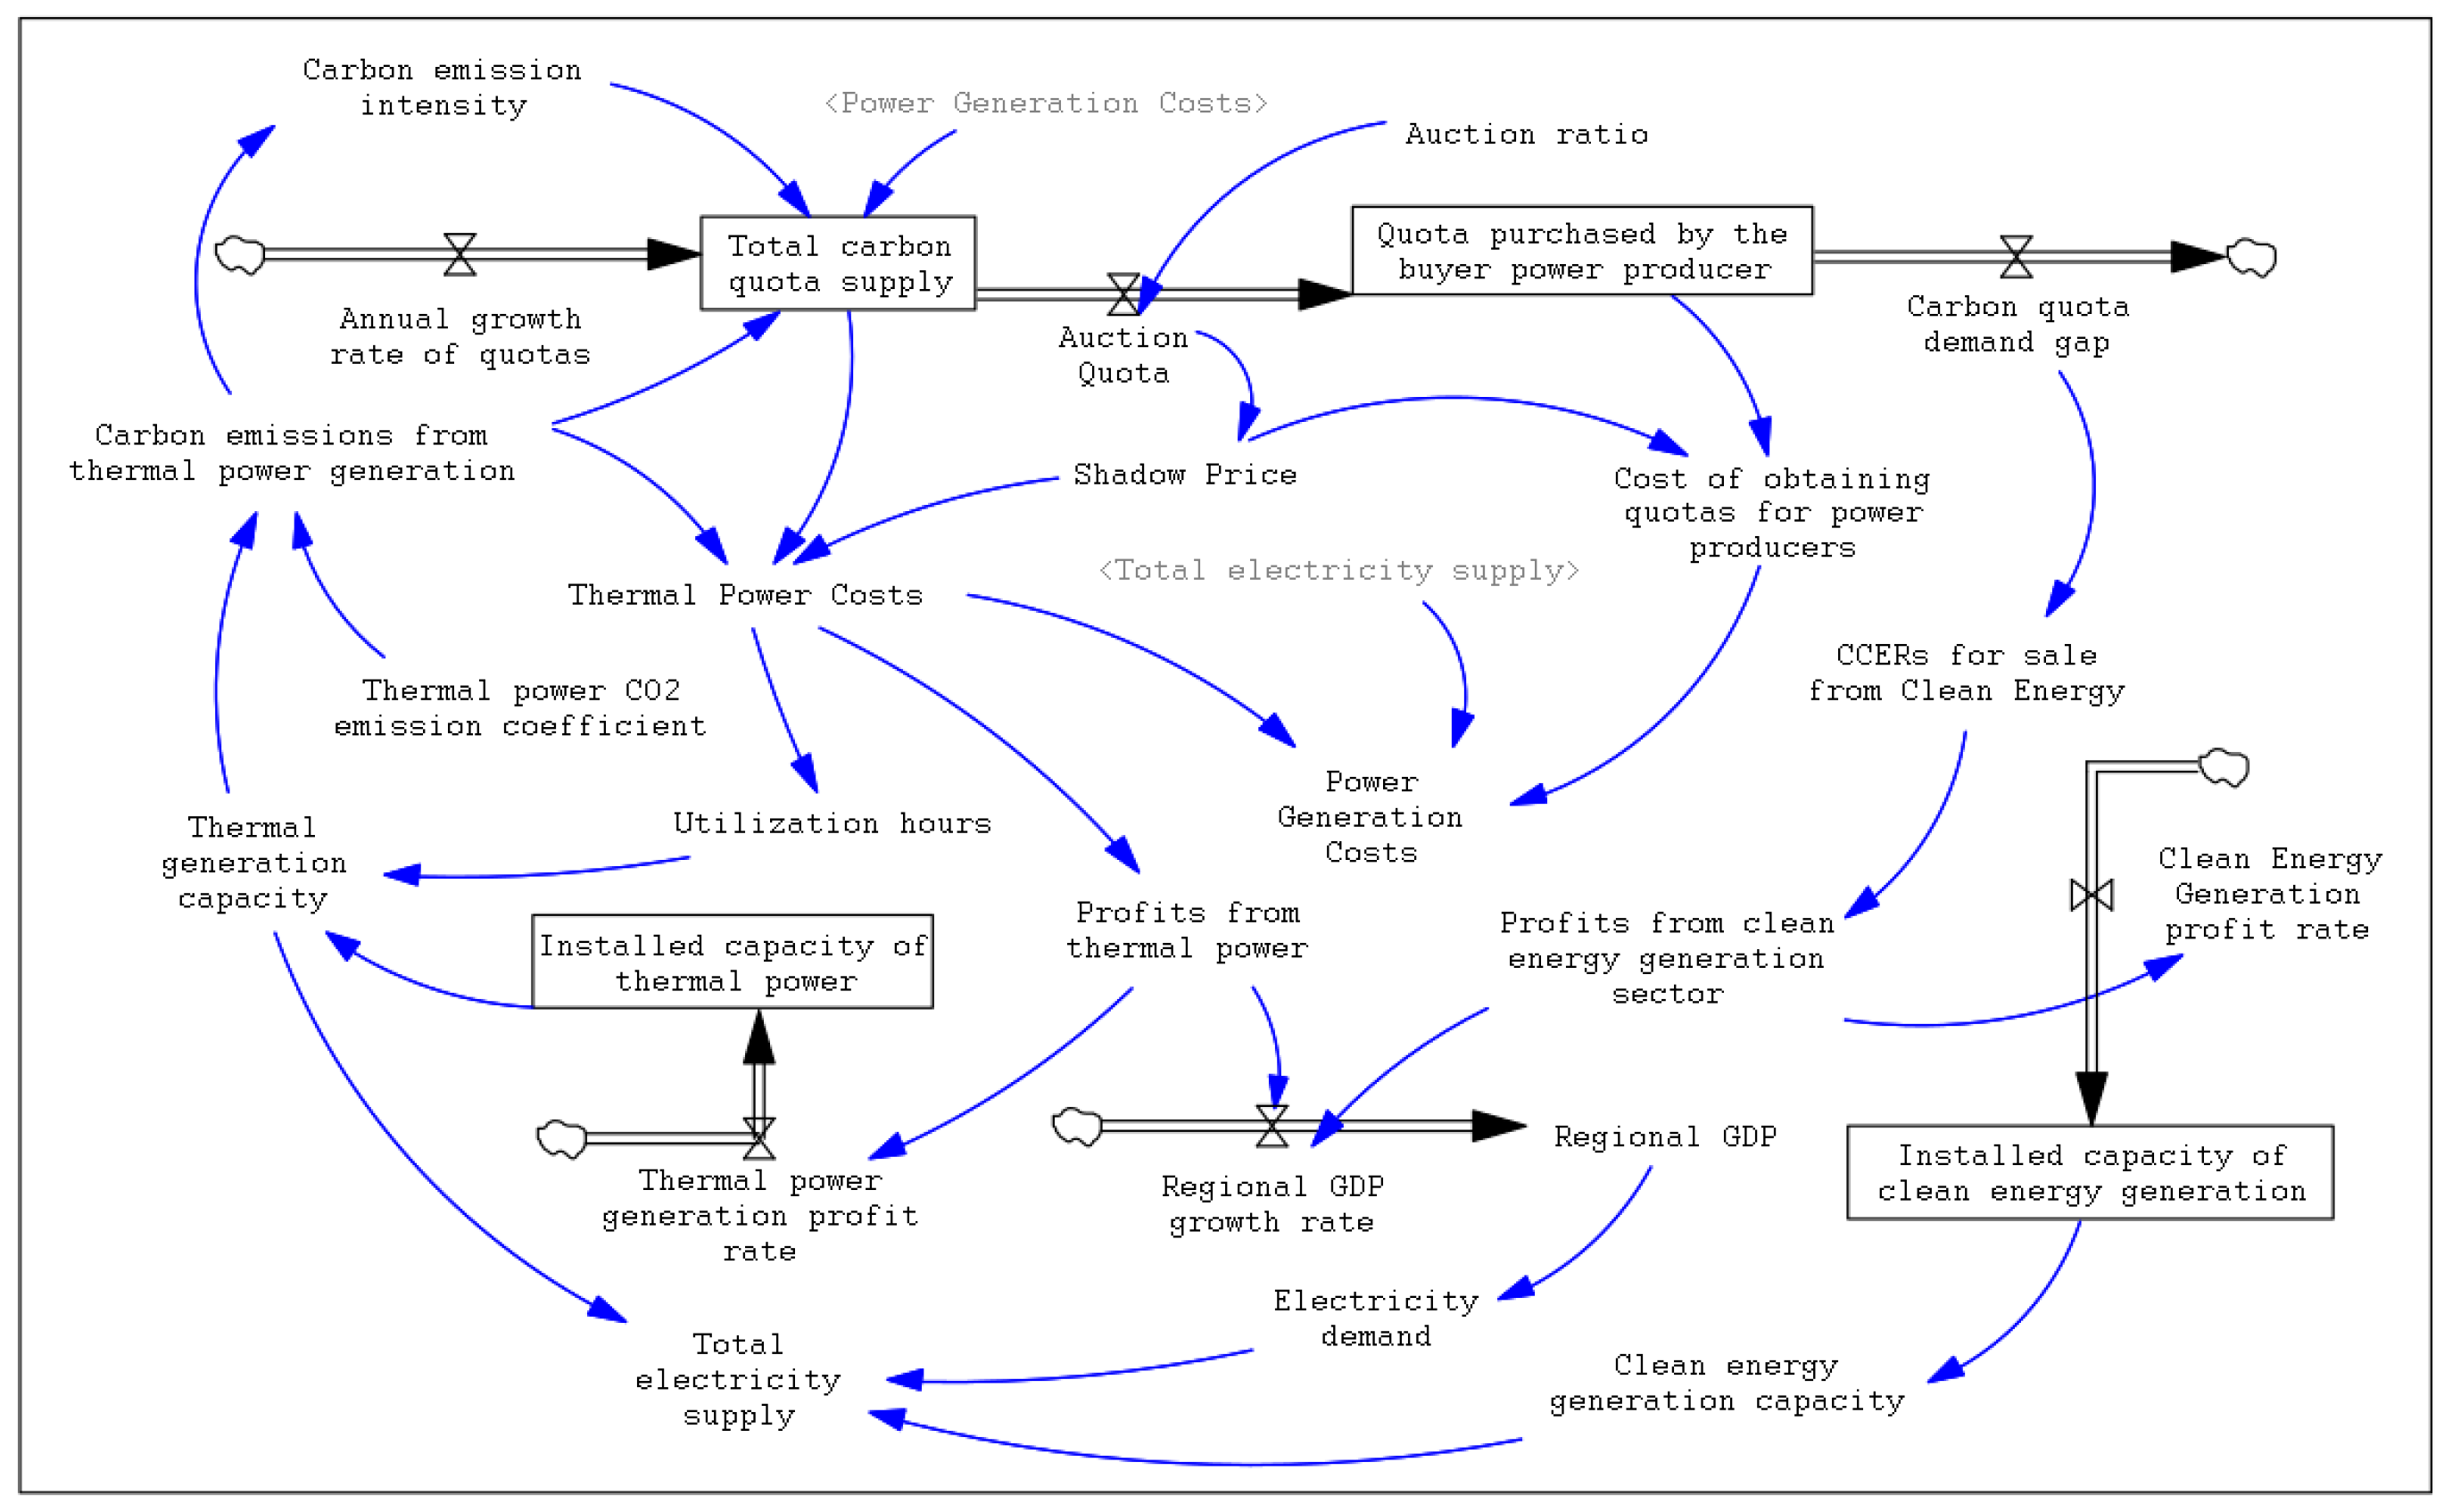
Our research utilizes data on the historical development of carbon emission trading and power systems in Guangdong Province and related literature to set the basic parameters for variables like Annual growth rate of quotas、Auction ratio、Thermal power CO2 emission coefficient, and constructs a quantitative model consisting of 25 equations and 4 level variables using Vensim software. The Annual growth rate of quotas is set according to "Guangdong Provincial Carbon Emission Quota Allocation Plan for 2022", the Thermal power CO2 emission coefficient is set based on "Regional Grid Baseline Emission Factors for Emission Reduction Projects in China in 2019", and the Auction ratio is set concerning existing research(Liu et al., 2016). In addition, the author has also consulted colleagues working at the Guangzhou Power Supply Bureau in Guangdong and examined a large amount of materials pertaining to power system and carbon trading systems to obtain reliable data and understand Guangdong's power generation planning and carbon quota auction situation.
In Section 4.1, the other parameters utilized in the model are presented as shown below (refer to Table A1 and Table A2). The Carbon emission intensity during various energy generation periods are sourced from reputable scholars or websites, such as (Fan et al., 2017; Jacobson, 2009; SONG et al., 2011; Wang and Sun, 2012). The Average carbon price is obtained from the carbon trading website, while the data of Carbon emission cap is derived from the Guangdong Provincial Bureau of Statistics. The data of Line loss rate originates from the Wind database, and maximum electricity load is collected from the typical power load curves of provincial-level power grids. The specific data presentation is as follows:
Table A1.
Relevant parameters used in the power generation structure optimization model.
| Variable or Parameter | Unit | Thermal | Wind | Solar | Hydro | Nuclear | Biomass | Outsourced |
| Carbon emission intensity | g/kWh | 584.658 | 0.030 | 20.000 | 16.500 | 24.400 | 0.106 | 527.100 |
| Installed capacity | Billion kW | 106.50 | 13.57 | 15.90 | 19.06 | 16.14 | 3.01 | 15.88 |
| Output coefficient | % | 100 | 60 | 30 | 70 | 90 | 50 | 100 |
| Plant electricity consumption rate | % | 5.4 | 2.95 | 1.9 | 0.4 | 6.58 | 11.73 | 0 |
Table A2.
Other operational data of power plants in the model.
| Month | Average carbon price(Yuan/ton) | Carbon emission cap(10^4 ton) | Line loss rate | Power consumption per unit GDP (kWh/10^4 Yuan) | Electricity demand of the whole society (10^2 million kWh) | maximum electricity load (million kW) |
| 1 | 18.170 | 851.91 | 3.20% | 588.81 | 659.39 | 212.249 |
| 2 | 19.505 | 762.67 | 4.07% | 588.15 | 650.81 | 195.740 |
| 3 | 20.315 | 1042.15 | 3.13% | 587.49 | 645.24 | 178.750 |
| 4 | 19.750 | 1030.37 | 4.51% | 586.83 | 702.12 | 187.330 |
| 5 | 20.453 | 1087.61 | 6.10% | 586.18 | 695.89 | 187.350 |
| 6 | 22.220 | 1212.20 | 7.61% | 585.52 | 689.68 | 202.080 |
| 7 | 19.170 | 1402.45 | 8.58% | 586.18 | 695.85 | 222.780 |
| 8 | 20.005 | 1346.89 | 7.79% | 585.52 | 689.52 | 219.310 |
| 9 | 20.030 | 1319.95 | 3.65% | 584.86 | 683.20 | 210.060 |
| 10 | 21.063 | 1119.60 | 3.68% | 584.20 | 792.96 | 186.550 |
| 11 | 21.358 | 1035.42 | 3.87% | 583.54 | 785.64 | 177.690 |
| 12 | 21.995 | 1038.79 | 4.50% | 582.89 | 778.34 | 123.675 |
In Section 4.2, we employed both a heatmap and a bar chart to illustrate the optimization results of the power generation mix. To enhance the clarity and visual representation of the extent of changes in the the power generation structure, presented in proportional terms, are shown as follows (refer to Figure A2). From the graph, it is evident that greater attention should be directed towards nuclear power regardless of variations in auction ratios, in order to minimize the overall economic burden of the power generation sector. This discovery further substantiates the first policy recommendation.
Figure A2.
The power generation optimal mix of Guangdong provinces in different months under different auction ratios of carbon quotas.
Figure A2.
The power generation optimal mix of Guangdong provinces in different months under different auction ratios of carbon quotas.
References
- Albadi, M.H., El-Saadany, E.F., 2008. A summary of demand response in electricity markets. Electric Power Systems Research 78, 1989–1996. [CrossRef]
- Ameli, M.T., Shokri, Vahid., Shokri, Saeed., 2010. Using Fuzzy Logic & Full Search for Distributed generation allocation to reduce losses and improve voltage profile, in: 2010 International Conference on Computer Information Systems and Industrial Management Applications (CISIM). Presented at the 2010 International Conference on Computer Information Systems and Industrial Management Applications (CISIM), IEEE, Krackow, Poland, pp. 626–630. [CrossRef]
- Ao, Z., Fei, R., Jiang, H., Cui, L., Zhu, Y., 2023. How can China achieve its goal of peaking carbon emissions at minimal cost? A research perspective from shadow price and optimal allocation of carbon emissions. Journal of Environmental Management 325, 116458. [CrossRef]
- Cai, W., Wang, C., Wang, K., Zhang, Y., Chen, J., 2007. Scenario analysis on CO2 emissions reduction potential in China’s electricity sector. Energy Policy 35, 6445–6456. [CrossRef]
- Cano, E.B., 2007. Utilizing fuzzy optimization for distributed generation allocation, in: TENCON 2007 - 2007 IEEE Region 10 Conference. Presented at the TENCON 2007 - 2007 IEEE Region 10 Conference, IEEE, Taipei, Taiwan, pp. 1–4. [CrossRef]
- Chen, H., Tang, B.-J., Liao, H., Wei, Y.-M., 2016. A multi-period power generation planning model incorporating the non-carbon external costs: A case study of China. Applied Energy 183, 1333–1345. [CrossRef]
- Chen, S.-L., Zhan, T.-S., Tsay, M.-T., 2004. An improved genetic algorithm for utility generation expansion planning in a competitive market. International journal of engineering intelligent systems for electrical engineering and communications 12, 167–174.
- Chen, Y., Xu, X., 2016. Research Report on Carbon Trading Pilot in Seven Provinces and Cities of China. Modern Business 53–54. [CrossRef]
- Cheng, R., Xu, Z., Liu, P., Wang, Z., Li, Z., Jones, I., 2015. A multi-region optimization planning model for China’s power sector. Applied Energy 137, 413–426. [CrossRef]
- Crilly, D., Zhelev, T., 2008. Emissions targeting and planning: An application of CO2 emissions pinch analysis (CEPA) to the Irish electricity generation sector. Energy 33, 1498–1507. [CrossRef]
- Dan-hui, W., Ji-ying, L., 2009. Carbon reduction costs analysis in China power industry, in: 2009 16th International Conference on Industrial Engineering and Engineering Management. Presented at the EM), IEEE, Beijing, China, pp. 424–428. [CrossRef]
- Fan, J., Sun, J., Zhao, Y., 2017. Carbon emission and carbon circulation map of the whole life cycle of China’s coal industry. Coal Economic Research 37, 34–37. [CrossRef]
- Fang, Y., 2017. An analysis of the estimation of environmental value criteria for emission reduction of pollutants in thermal power generation industry. Technology and Innovation 41. [CrossRef]
- Gao, J., 2019. Research on the Forecast and Optimization of Power Supply Structure in Jiangsu Considering Renewable Energy Power (D). China University of Mining and Technology, Beijing.
- Jacobson, M.Z., 2009. Review of solutions to global warming, air pollution, and energy security. Energy Environ. Sci. 2, 148–173. [CrossRef]
- Lee, J.-D., Park, J.-B., Kim, T.-Y., 2002. Estimation of the shadow prices of pollutants with production/environment inefficiency taken into account: a nonparametric directional distance function approach. Journal of Environmental Management 64, 365–375. [CrossRef]
- Li, Z., Fang, T., Chen, C., 2021. Research on Environmental Cost fromthe Perspective of Coal-Fired Power Plant. Pol. J. Environ. Stud. 30, 1695–1705. [CrossRef]
- Liu, L., Sun, X., Chen, C., Zhao, E., 2016. How will auctioning impact on the carbon emission abatement cost of electric power generation sector in China? Applied Energy 168, 594–609. [CrossRef]
- Miao, Y., 2019. Research on Optimization System of Carbon Abatement Costs in Guangdong Province under paid allowance (D). North China Electric Power University (Beijing), Beijing.
- Niknam, T., Firouzi, B.B., Mojarrad, H.D., 2011. A new evolutionary algorithm for non-linear economic dispatch. Expert Systems with Applications 38, 13301–13309. [CrossRef]
- Shi, Y., Liu, Y. (Eds.), 2009. Power structure optimization based on environmental constraints. Electric Power, Communications in Computer and Information Science 42, 16–19. [CrossRef]
- SONG, H., QU, H., ZHANG, Z., WANG, Z., 2011. Analyzing carbon emissions from nuclear power generation from a life cycle perspective, in: China Nuclear Science and Technology Progress Report (Volume II) - Proceedings of the 2011 Annual Academic Conference of the Chinese Nuclear Society, Volume 10 (Nuclear Intelligence (Including Computer Technology) Sub-Volume, Nuclear Technology Economics and Management Modernization Sub-Volume). China Nuclear Society, pp. 233–239.
- Sun, B., 2021. A multi-objective optimization model for fast electric vehicle charging stations with wind, PV power and energy storage. Journal of Cleaner Production 288, 125564. [CrossRef]
- Tang, L., Wu, J., Yu, L., Bao, Q., 2017. Carbon allowance auction design of China’s emissions trading scheme: A multi-agent-based approach. Energy Policy 102, 30–40. [CrossRef]
- Udara Willhelm Abeydeera, L.H., Wadu Mesthrige, J., Samarasinghalage, T.I., 2019. Global Research on Carbon Emissions: A Scientometric Review. Sustainability 11, 3972. [CrossRef]
- Wang, Y., Sun, T., 2012. Life cycle assessment of CO2 emissions from wind power plants: Methodology and case studies. Renewable Energy 43, 30–36. [CrossRef]
- Wei, Y., Ye, Q., Ding, Y., Ai, B., Tan, Q., Song, W., 2021. Optimization model of a thermal-solar-wind power planning considering economic and social benefits. Energy 222, 119752. [CrossRef]
- Wu, F., 2021. Analysis and optimization of power supply structure in Guangdong in the 14th Five-Year Plan. China Energy 43, 64–73. [CrossRef]
- Xu, X., Niu, D., Qiu, J., Wang, P., Chen, Y., 2016. Analysis and Optimization of Power Supply Structure Based on Markov Chain and Error Optimization for Renewable Energy from the Perspective of Sustainability. Sustainability 8, 634. [CrossRef]
- Zhang, S., Zhao, T., Xie, B.-C., 2018. What is the optimal power generation mix of China? An empirical analysis using portfolio theory. Applied Energy 229, 522–536. [CrossRef]
- Zhang, Y., Wang, J., Zhang, L., Liu, J., Zheng, H., Fang, J., Hou, S., Chen, S., 2020. Optimization of China’s electric power sector targeting water stress and carbon emissions. Applied Energy 271, 115221. [CrossRef]
- Zhao, E.-D., Song, J.-C., Chen, J.-M., Liu, L.-W., Chen, M.-S., 2022. Will auctioning promote the renewable energy generation in China? Advances in Climate Change Research 13, 107–117. [CrossRef]
- Zhao, J.J., Gan, Y.H., Ma, X.Q., Yang, Z.L., 2016. The cost of electric power generation in Guangdong Province. Energy Sources, Part B: Economics, Planning, and Policy 11, 1014–1019. [CrossRef]
- Zhou, X., Fan, L.W., Zhou, P., 2015. Marginal CO2 abatement costs: Findings from alternative shadow price estimates for Shanghai industrial sectors. Energy Policy 77, 109–117. [CrossRef]
Figure 1.
Path analysis of carbon emission allowance auction mechanisms impacting the power generation structure.
Figure 1.
Path analysis of carbon emission allowance auction mechanisms impacting the power generation structure.
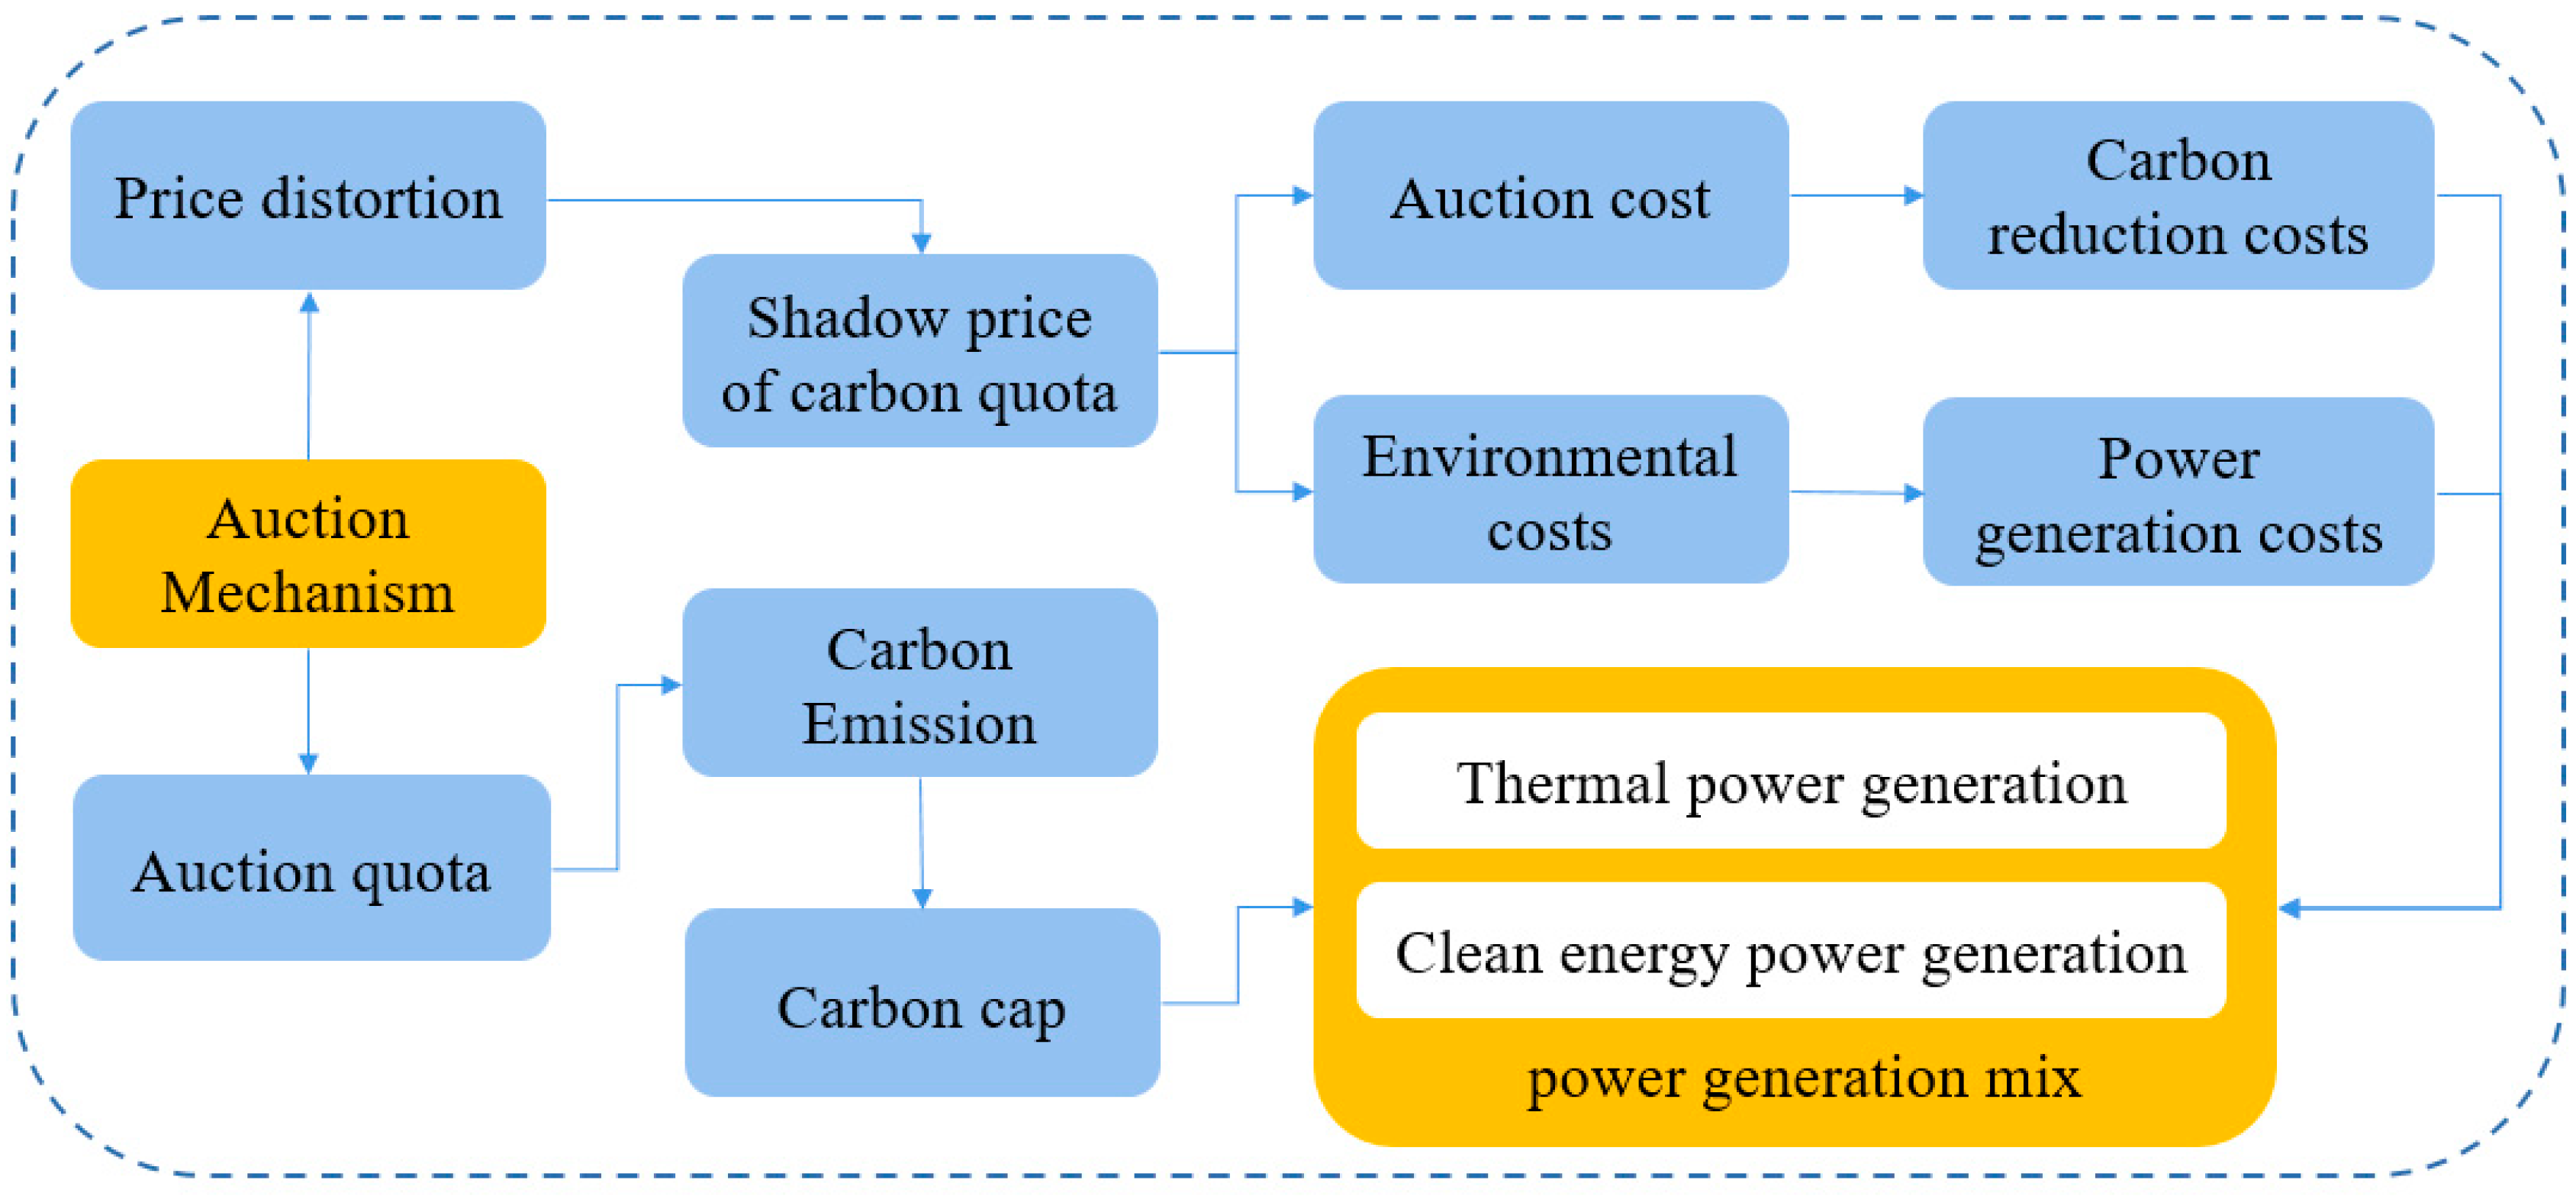
Figure 2.
Framework design for power generation structure optimization under carbon auction mechanism.
Figure 2.
Framework design for power generation structure optimization under carbon auction mechanism.
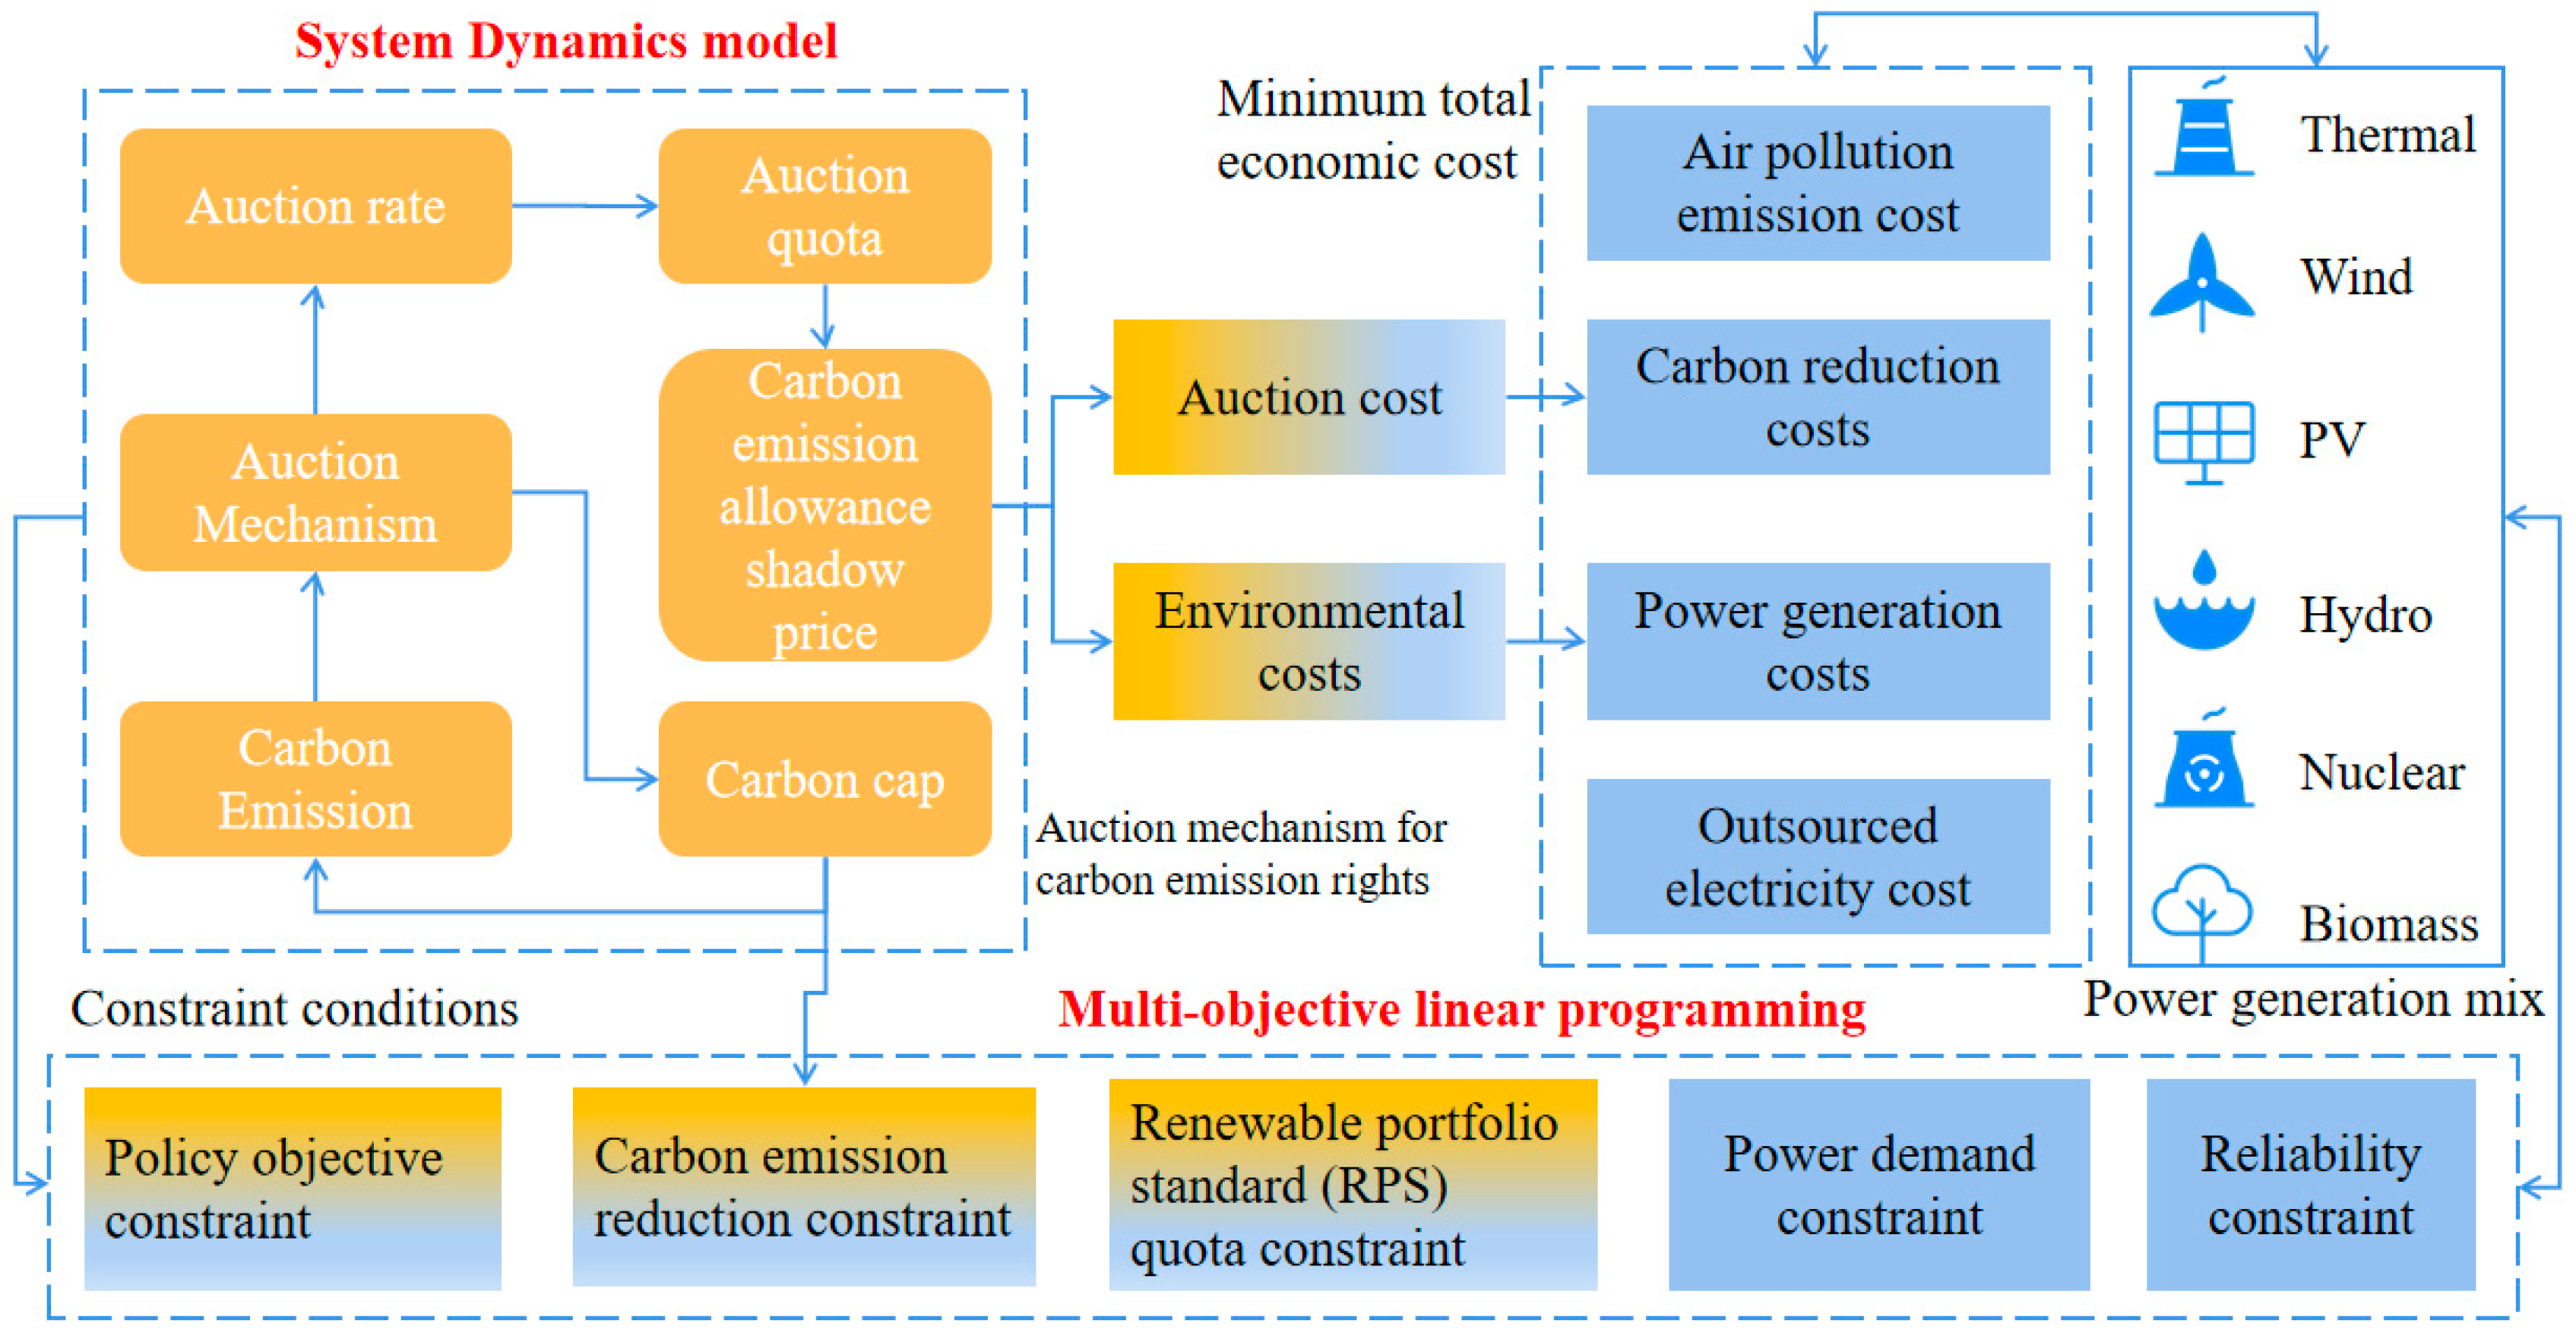
Figure 5.
Unit electricity cost of various power generation technologies in different months under different carbon allowance auction ratios.
Figure 5.
Unit electricity cost of various power generation technologies in different months under different carbon allowance auction ratios.
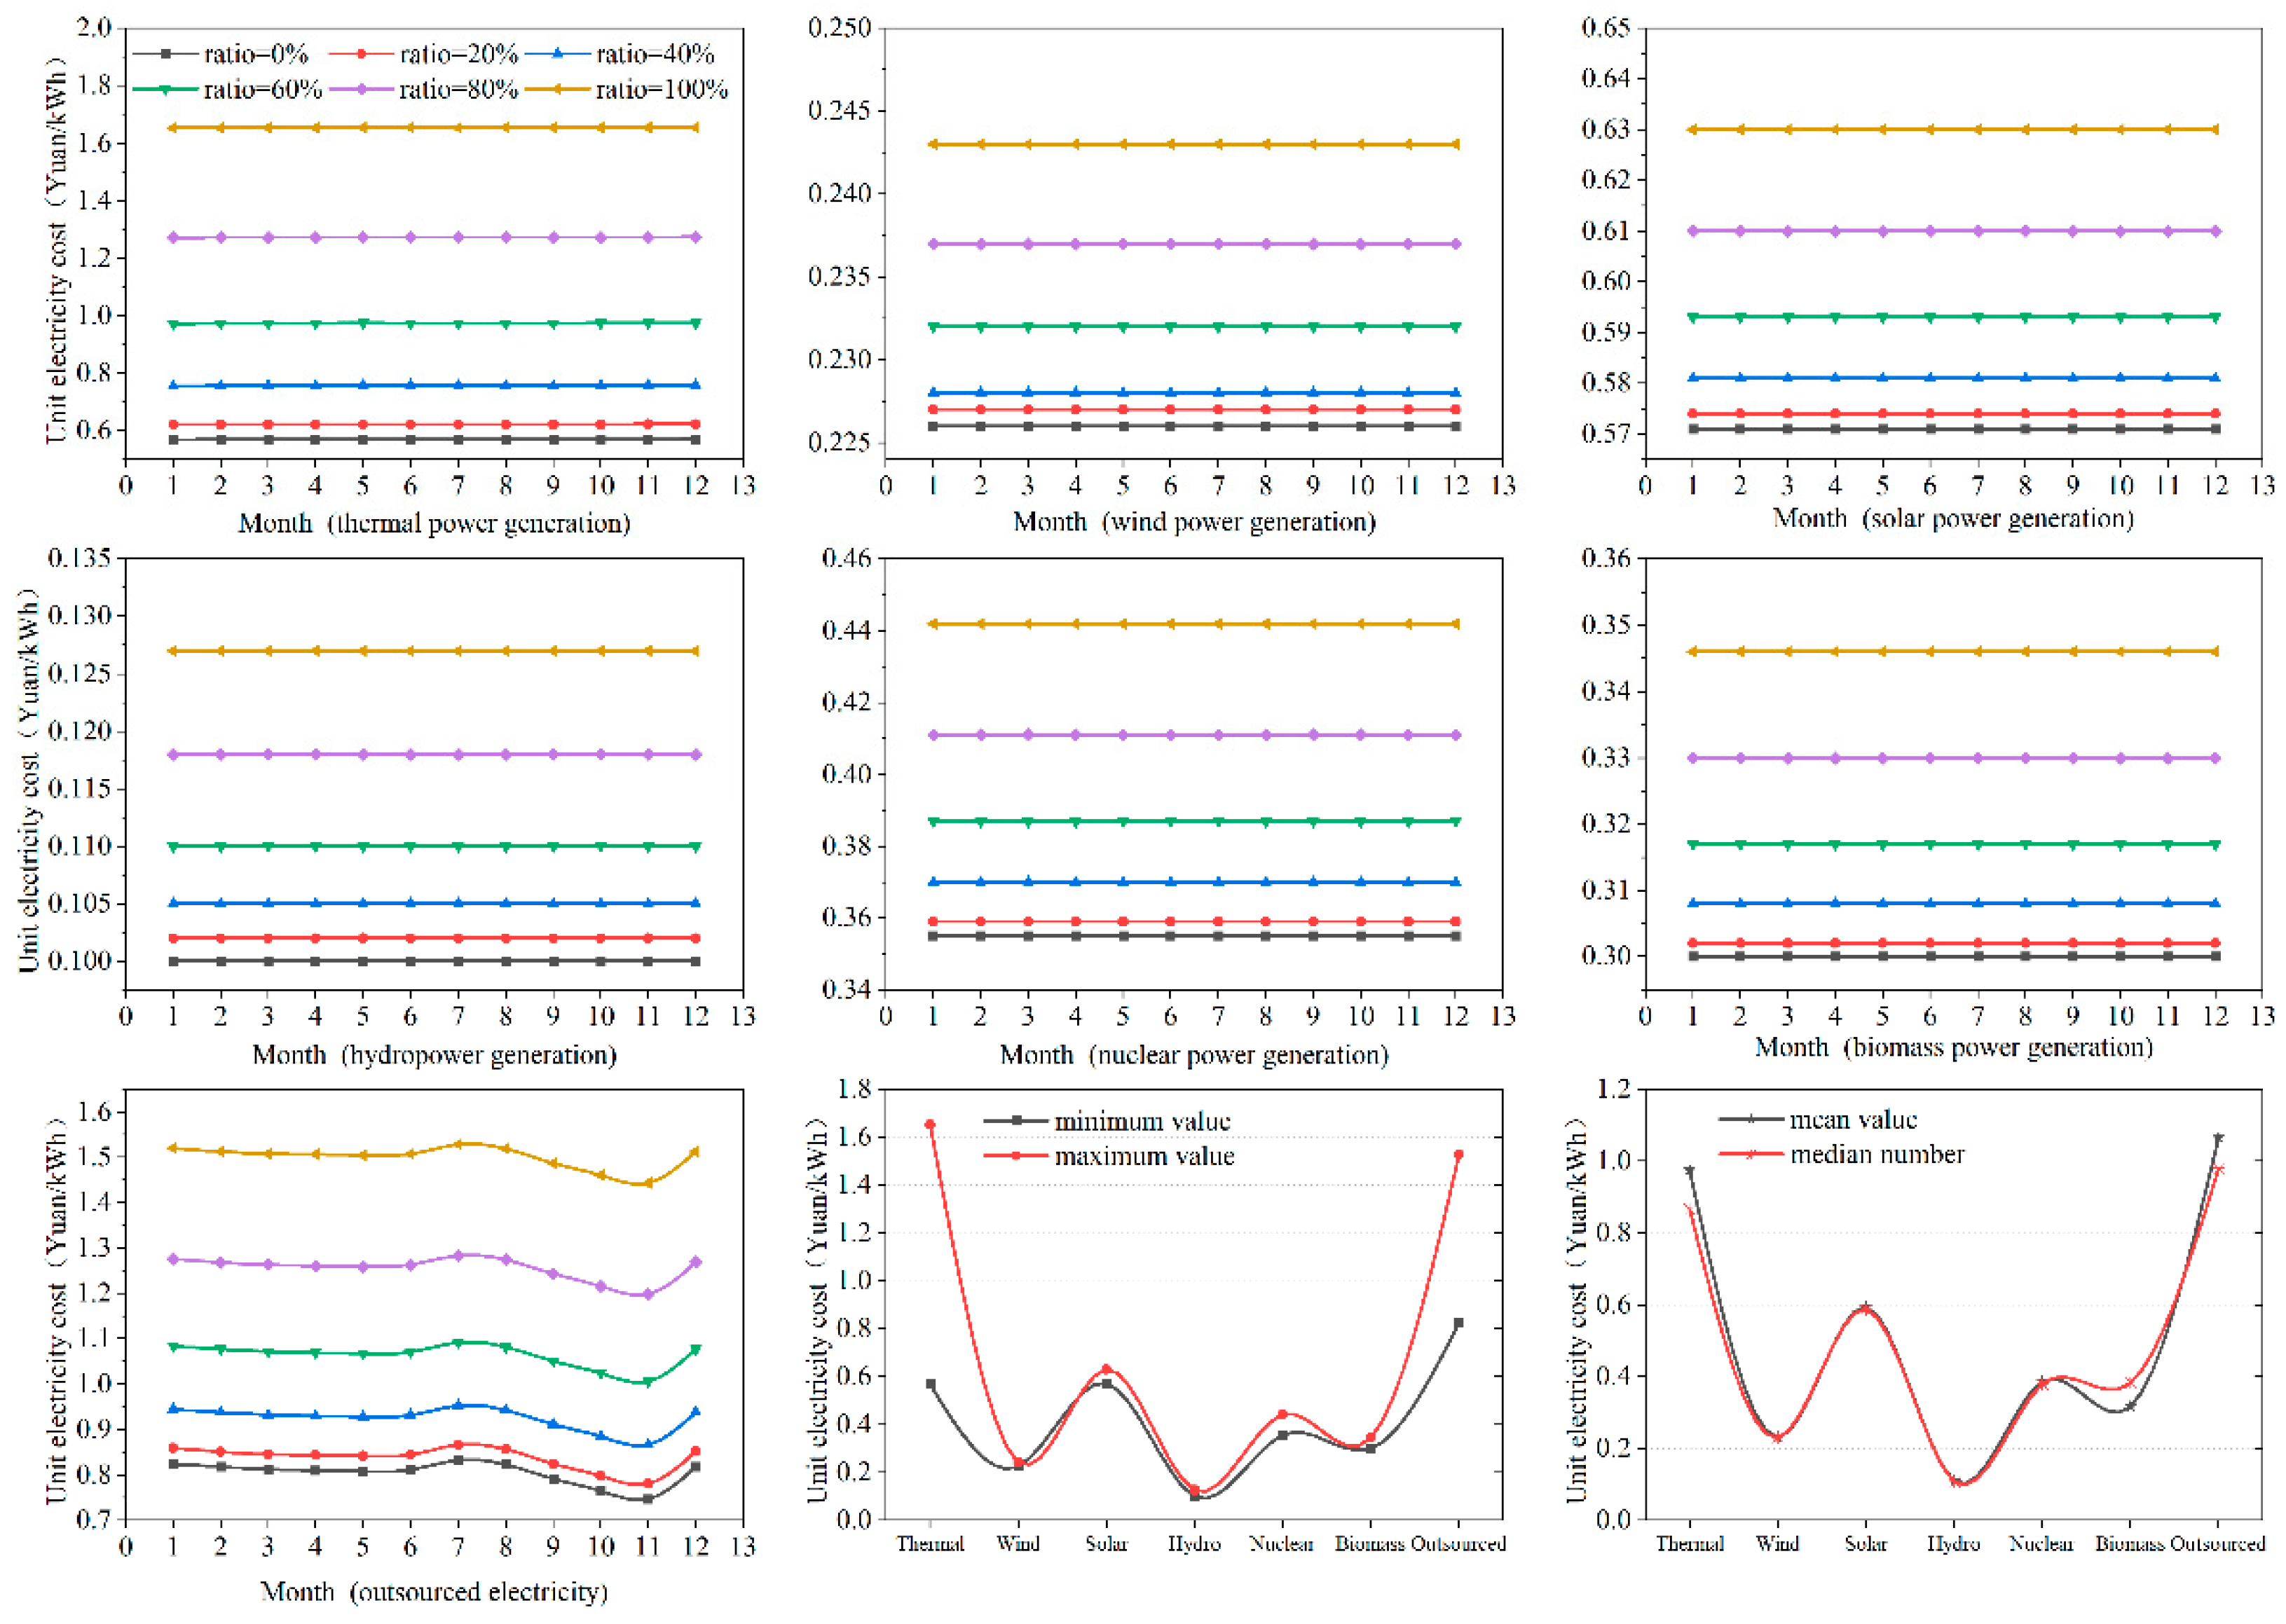
Figure 6.
The power generation structure of Guangdong provinces in different months under different auction ratios of carbon quotas.
Figure 6.
The power generation structure of Guangdong provinces in different months under different auction ratios of carbon quotas.
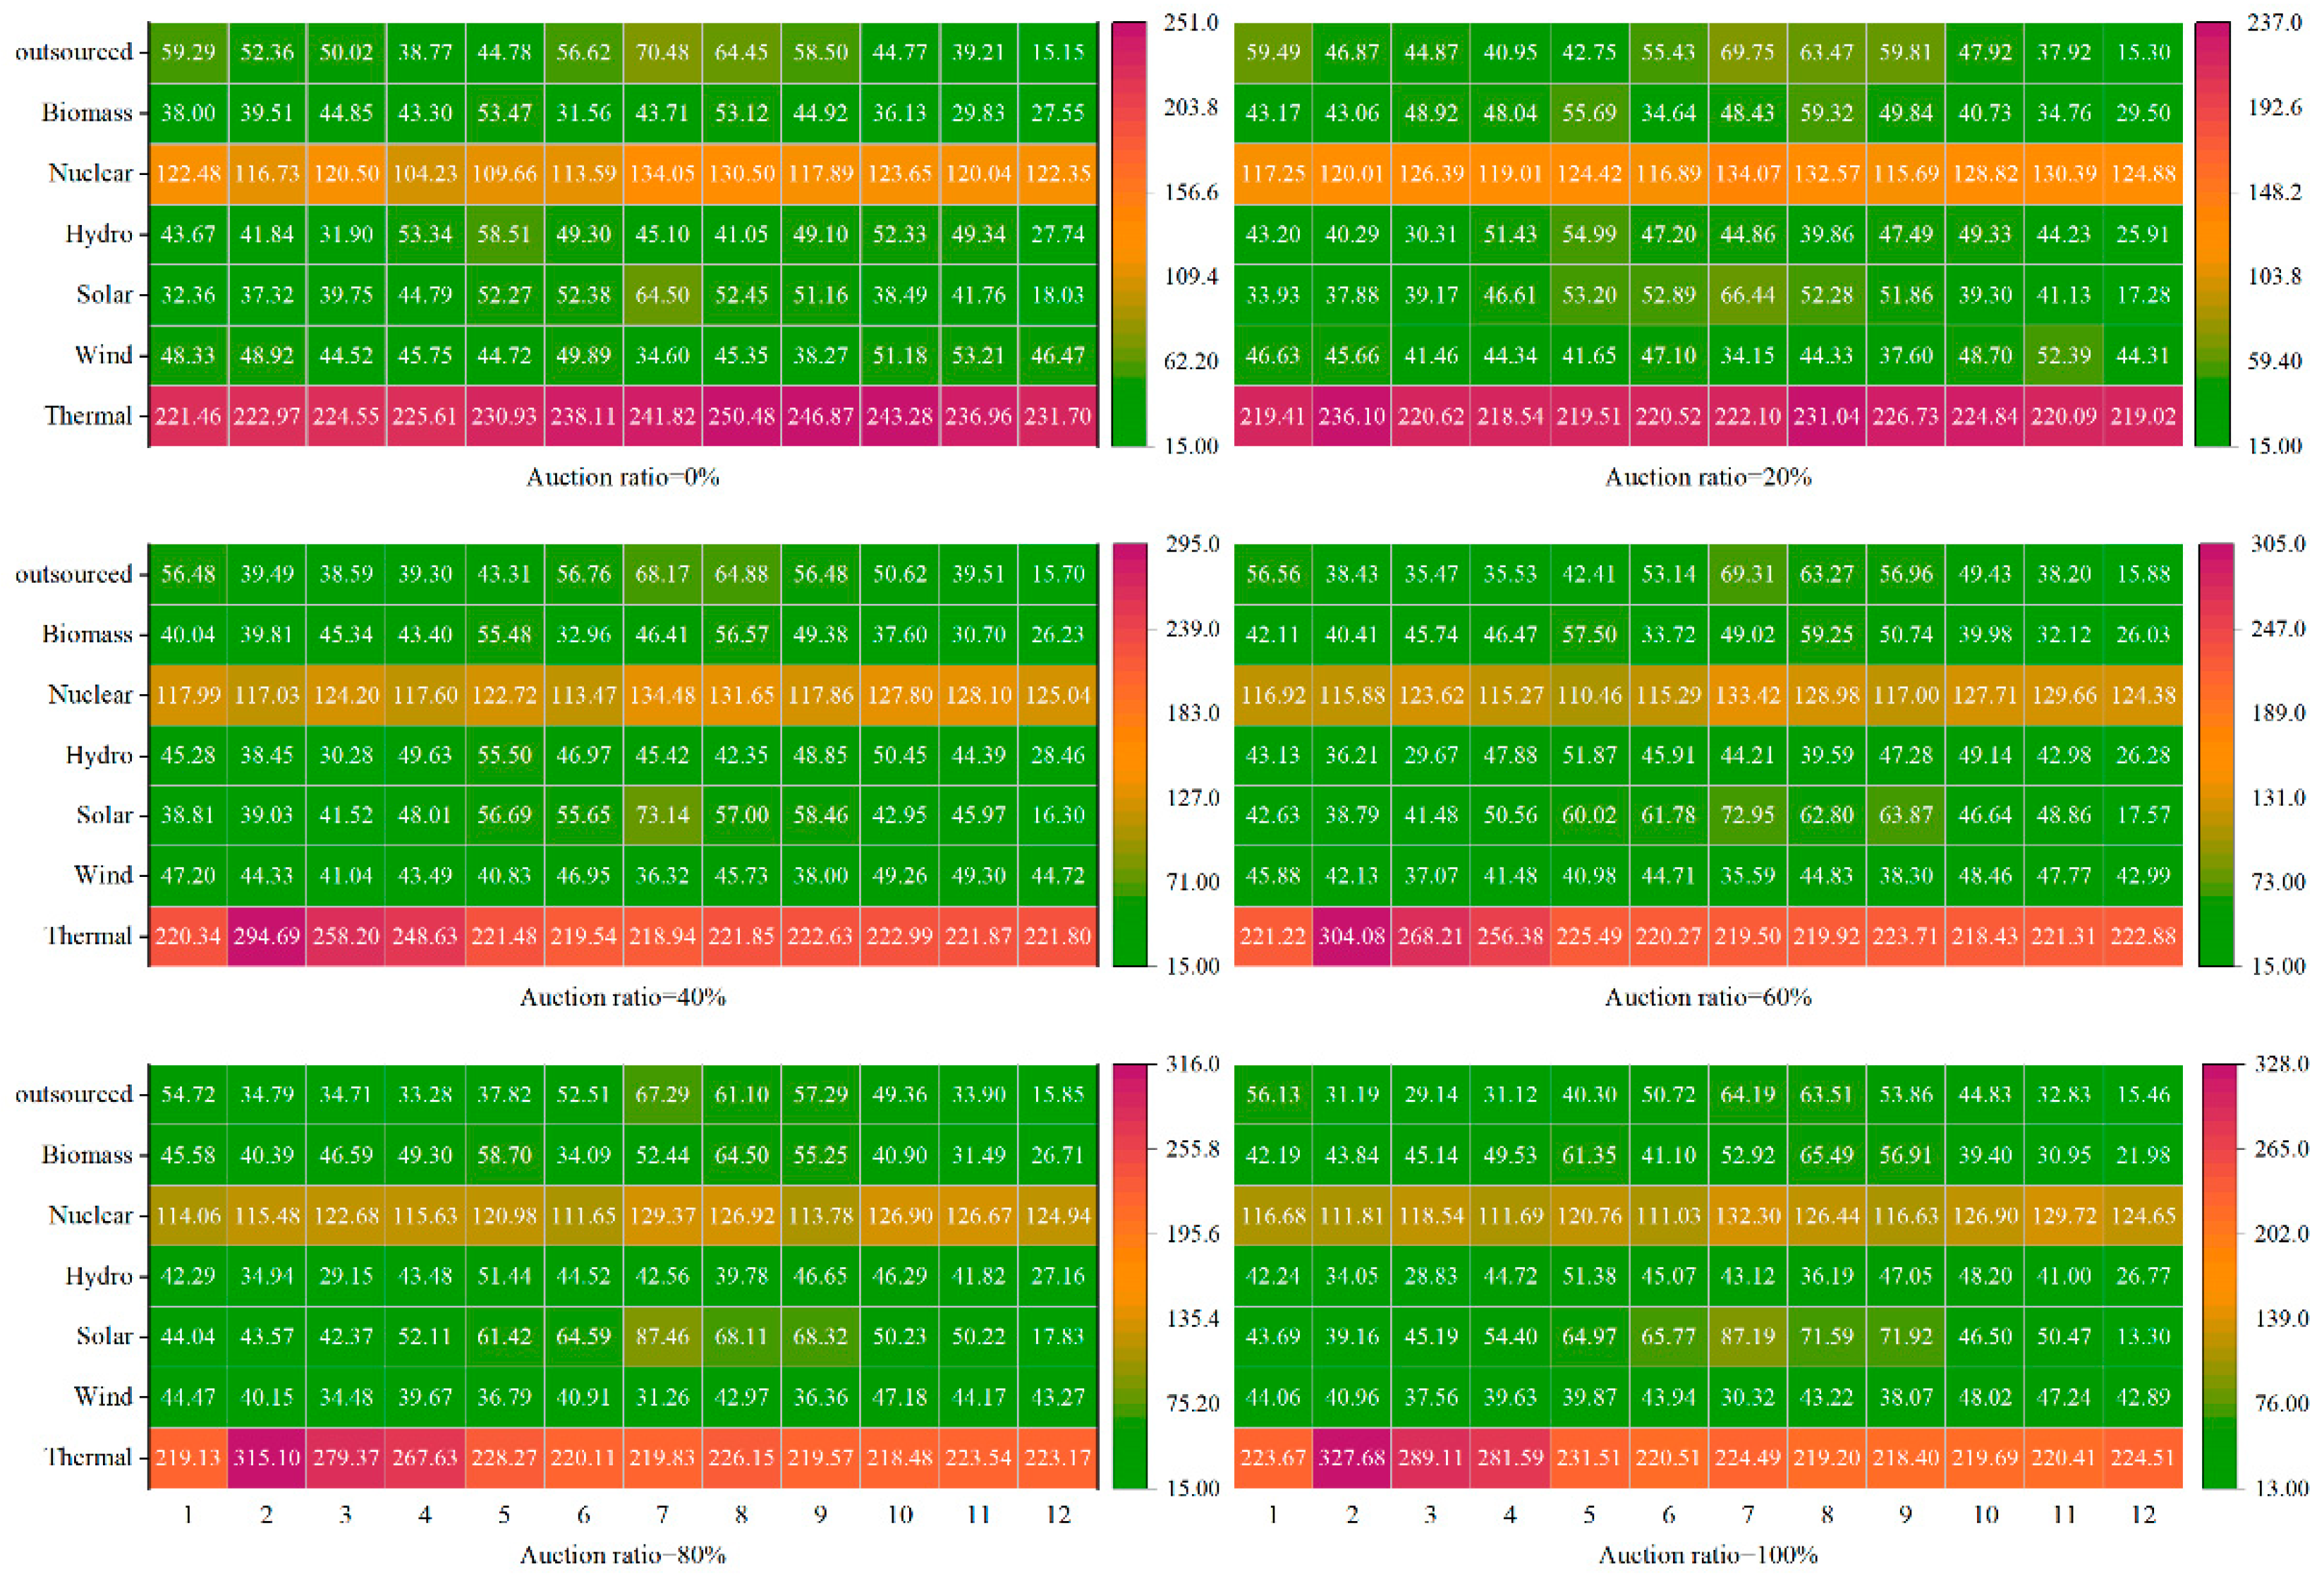
Figure 7.
Share of energy power generation in different months under different auction ratios of carbon quotas.
Figure 7.
Share of energy power generation in different months under different auction ratios of carbon quotas.
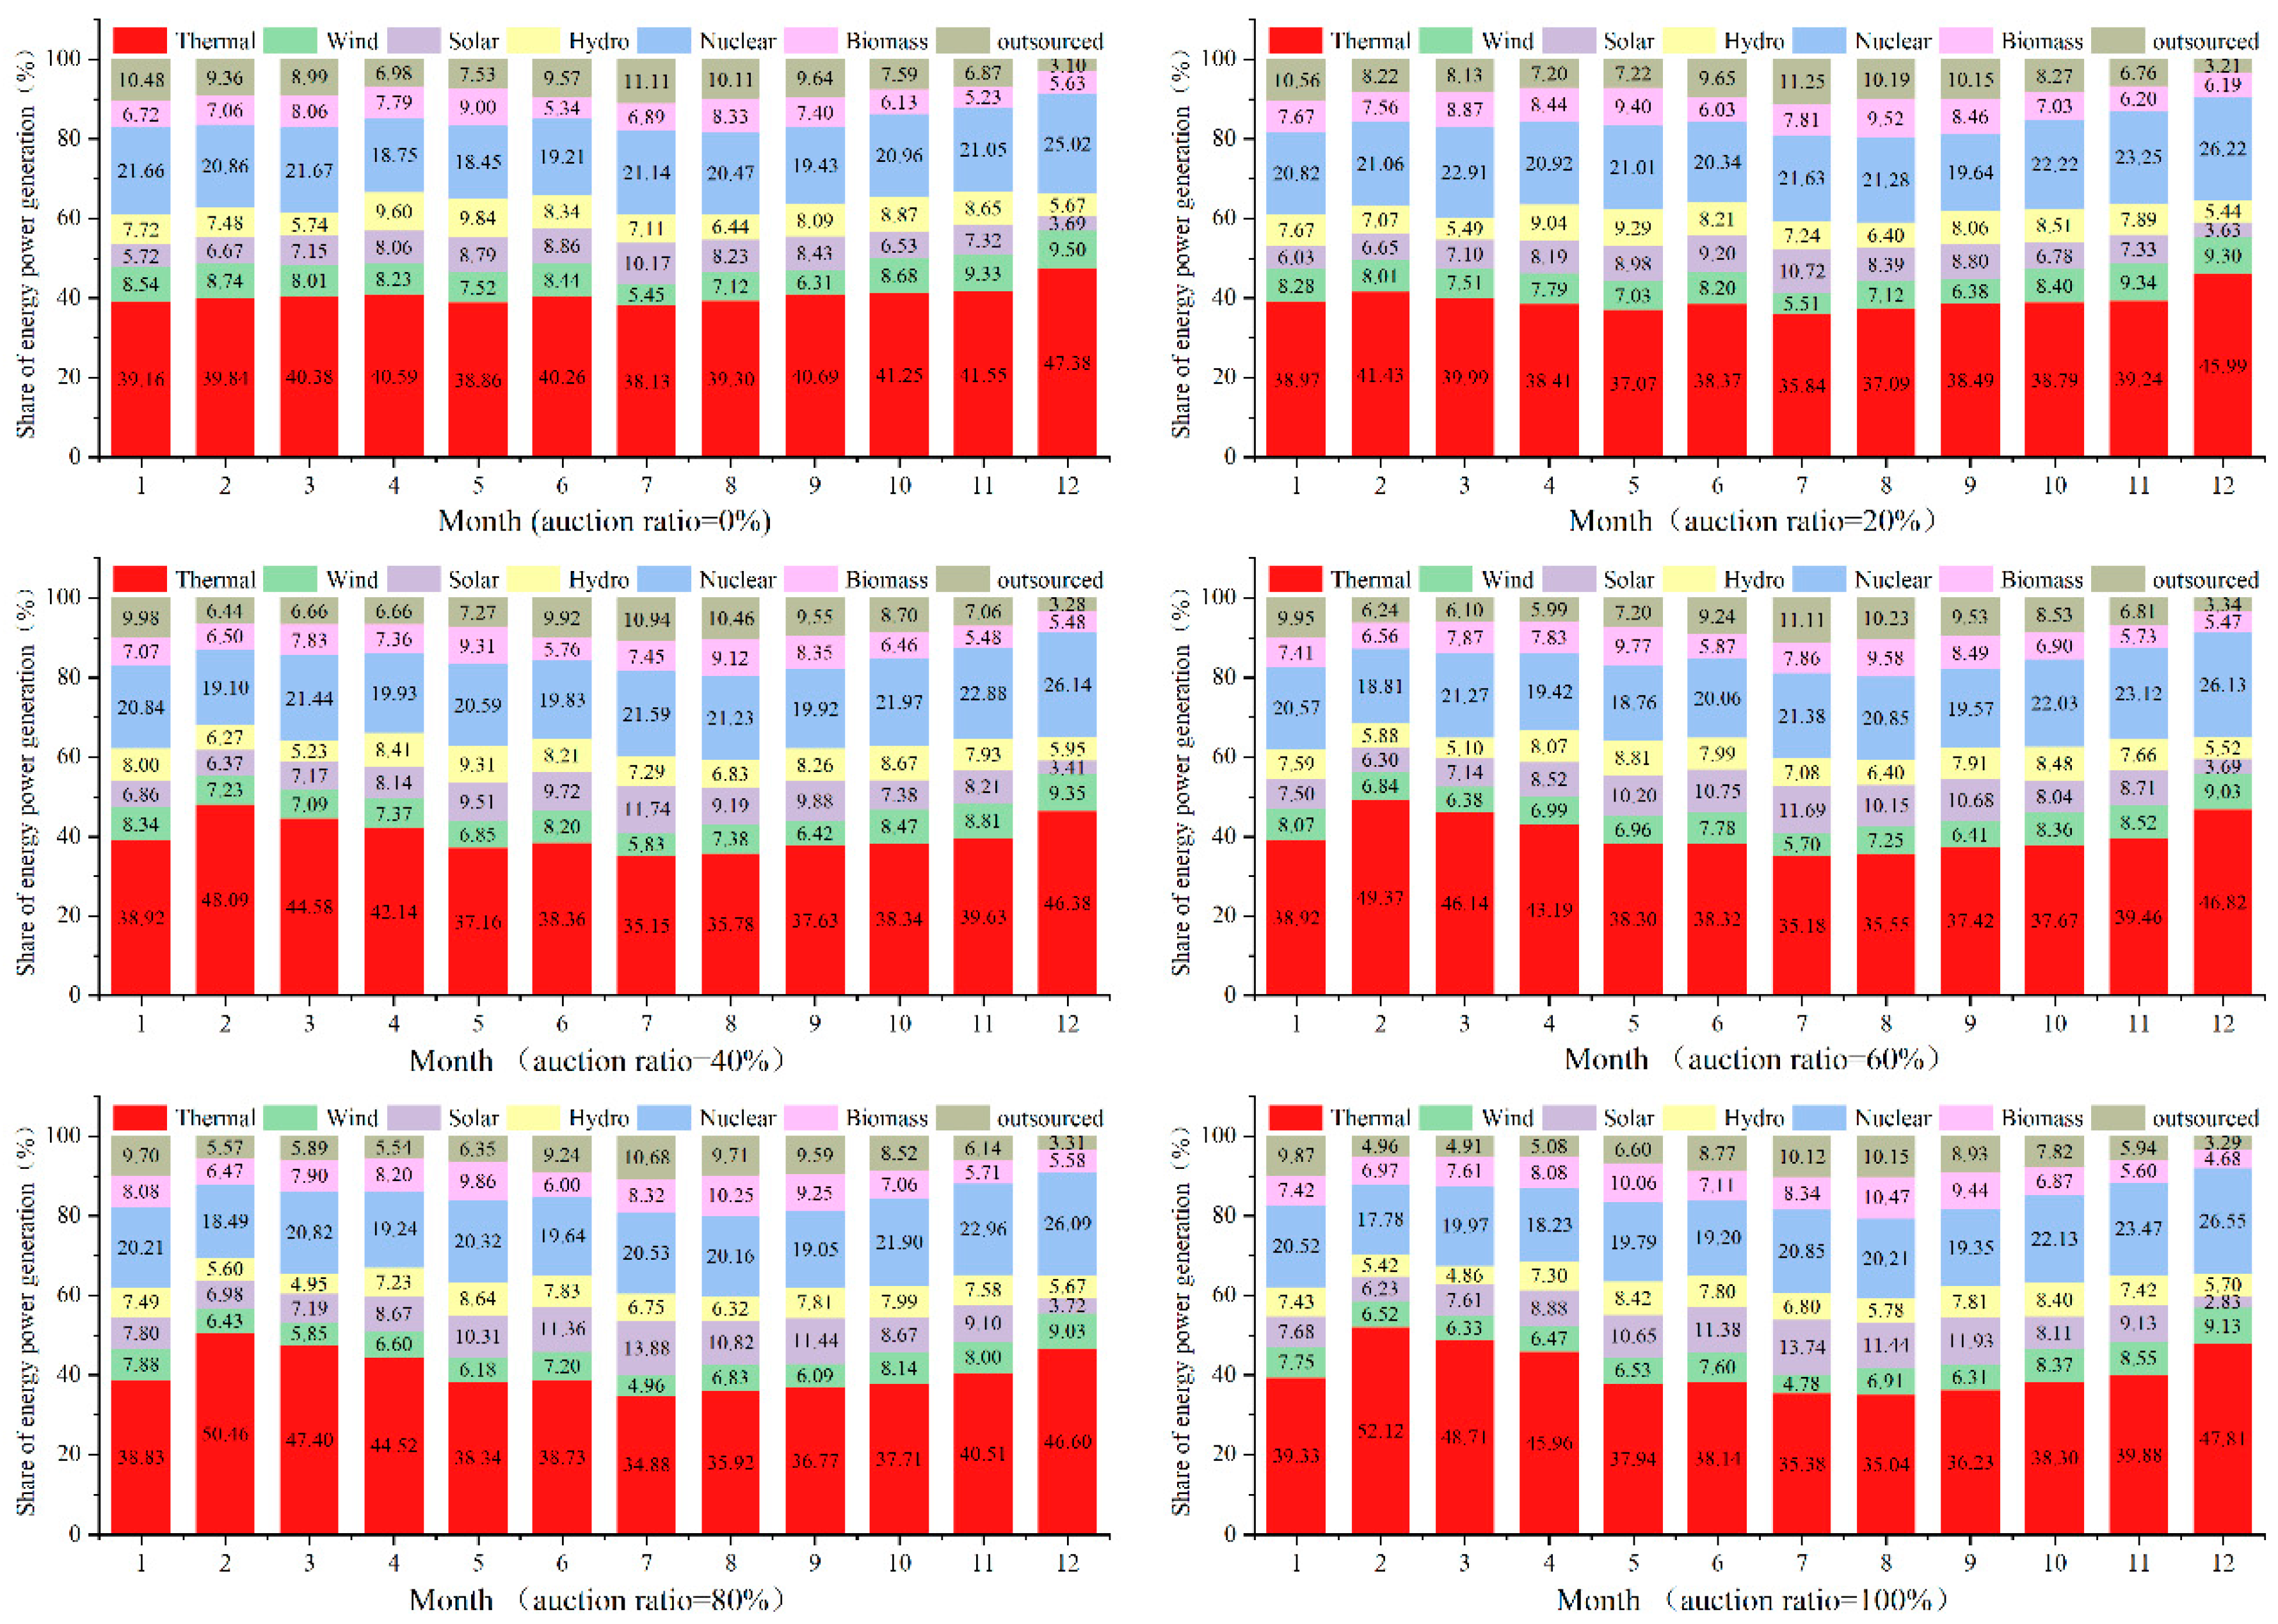
Figure 8.
The power generation structure and share of renewable energy power generation under different carbon quota auction ratios.
Figure 8.
The power generation structure and share of renewable energy power generation under different carbon quota auction ratios.
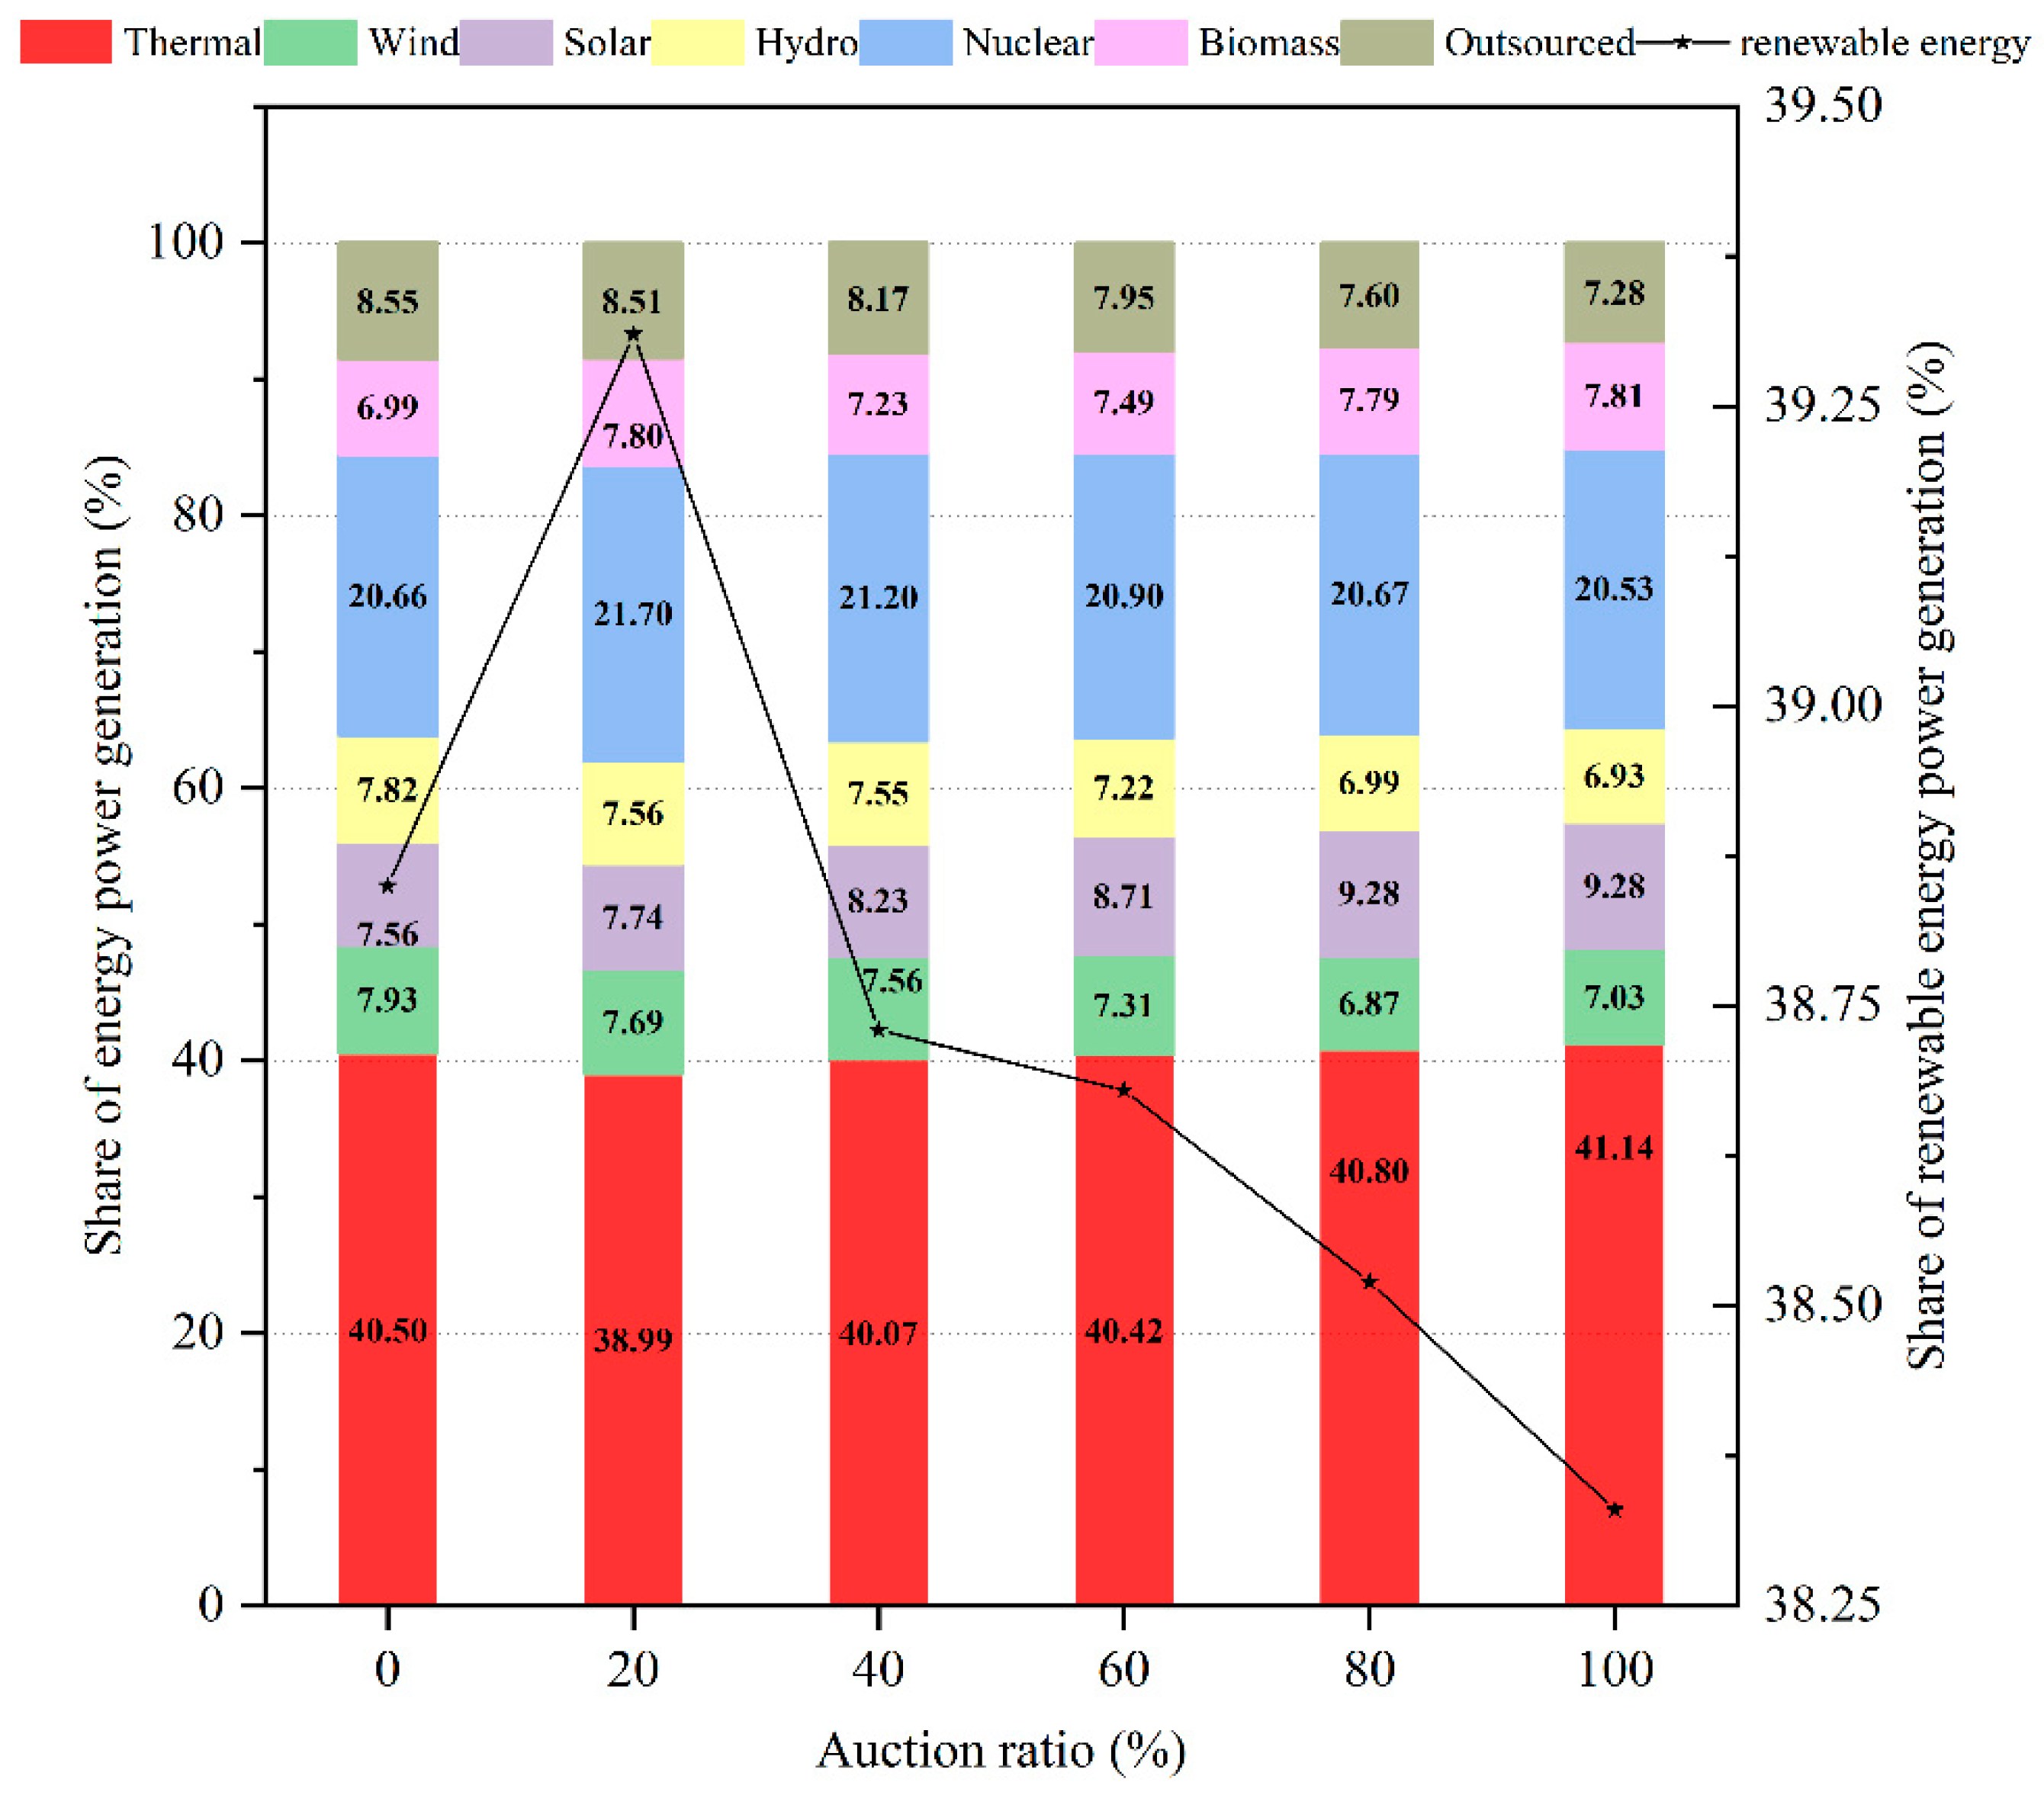
Figure 9.
Share of renewable power generation in different months with different carbon allowance auction ratios.
Figure 9.
Share of renewable power generation in different months with different carbon allowance auction ratios.
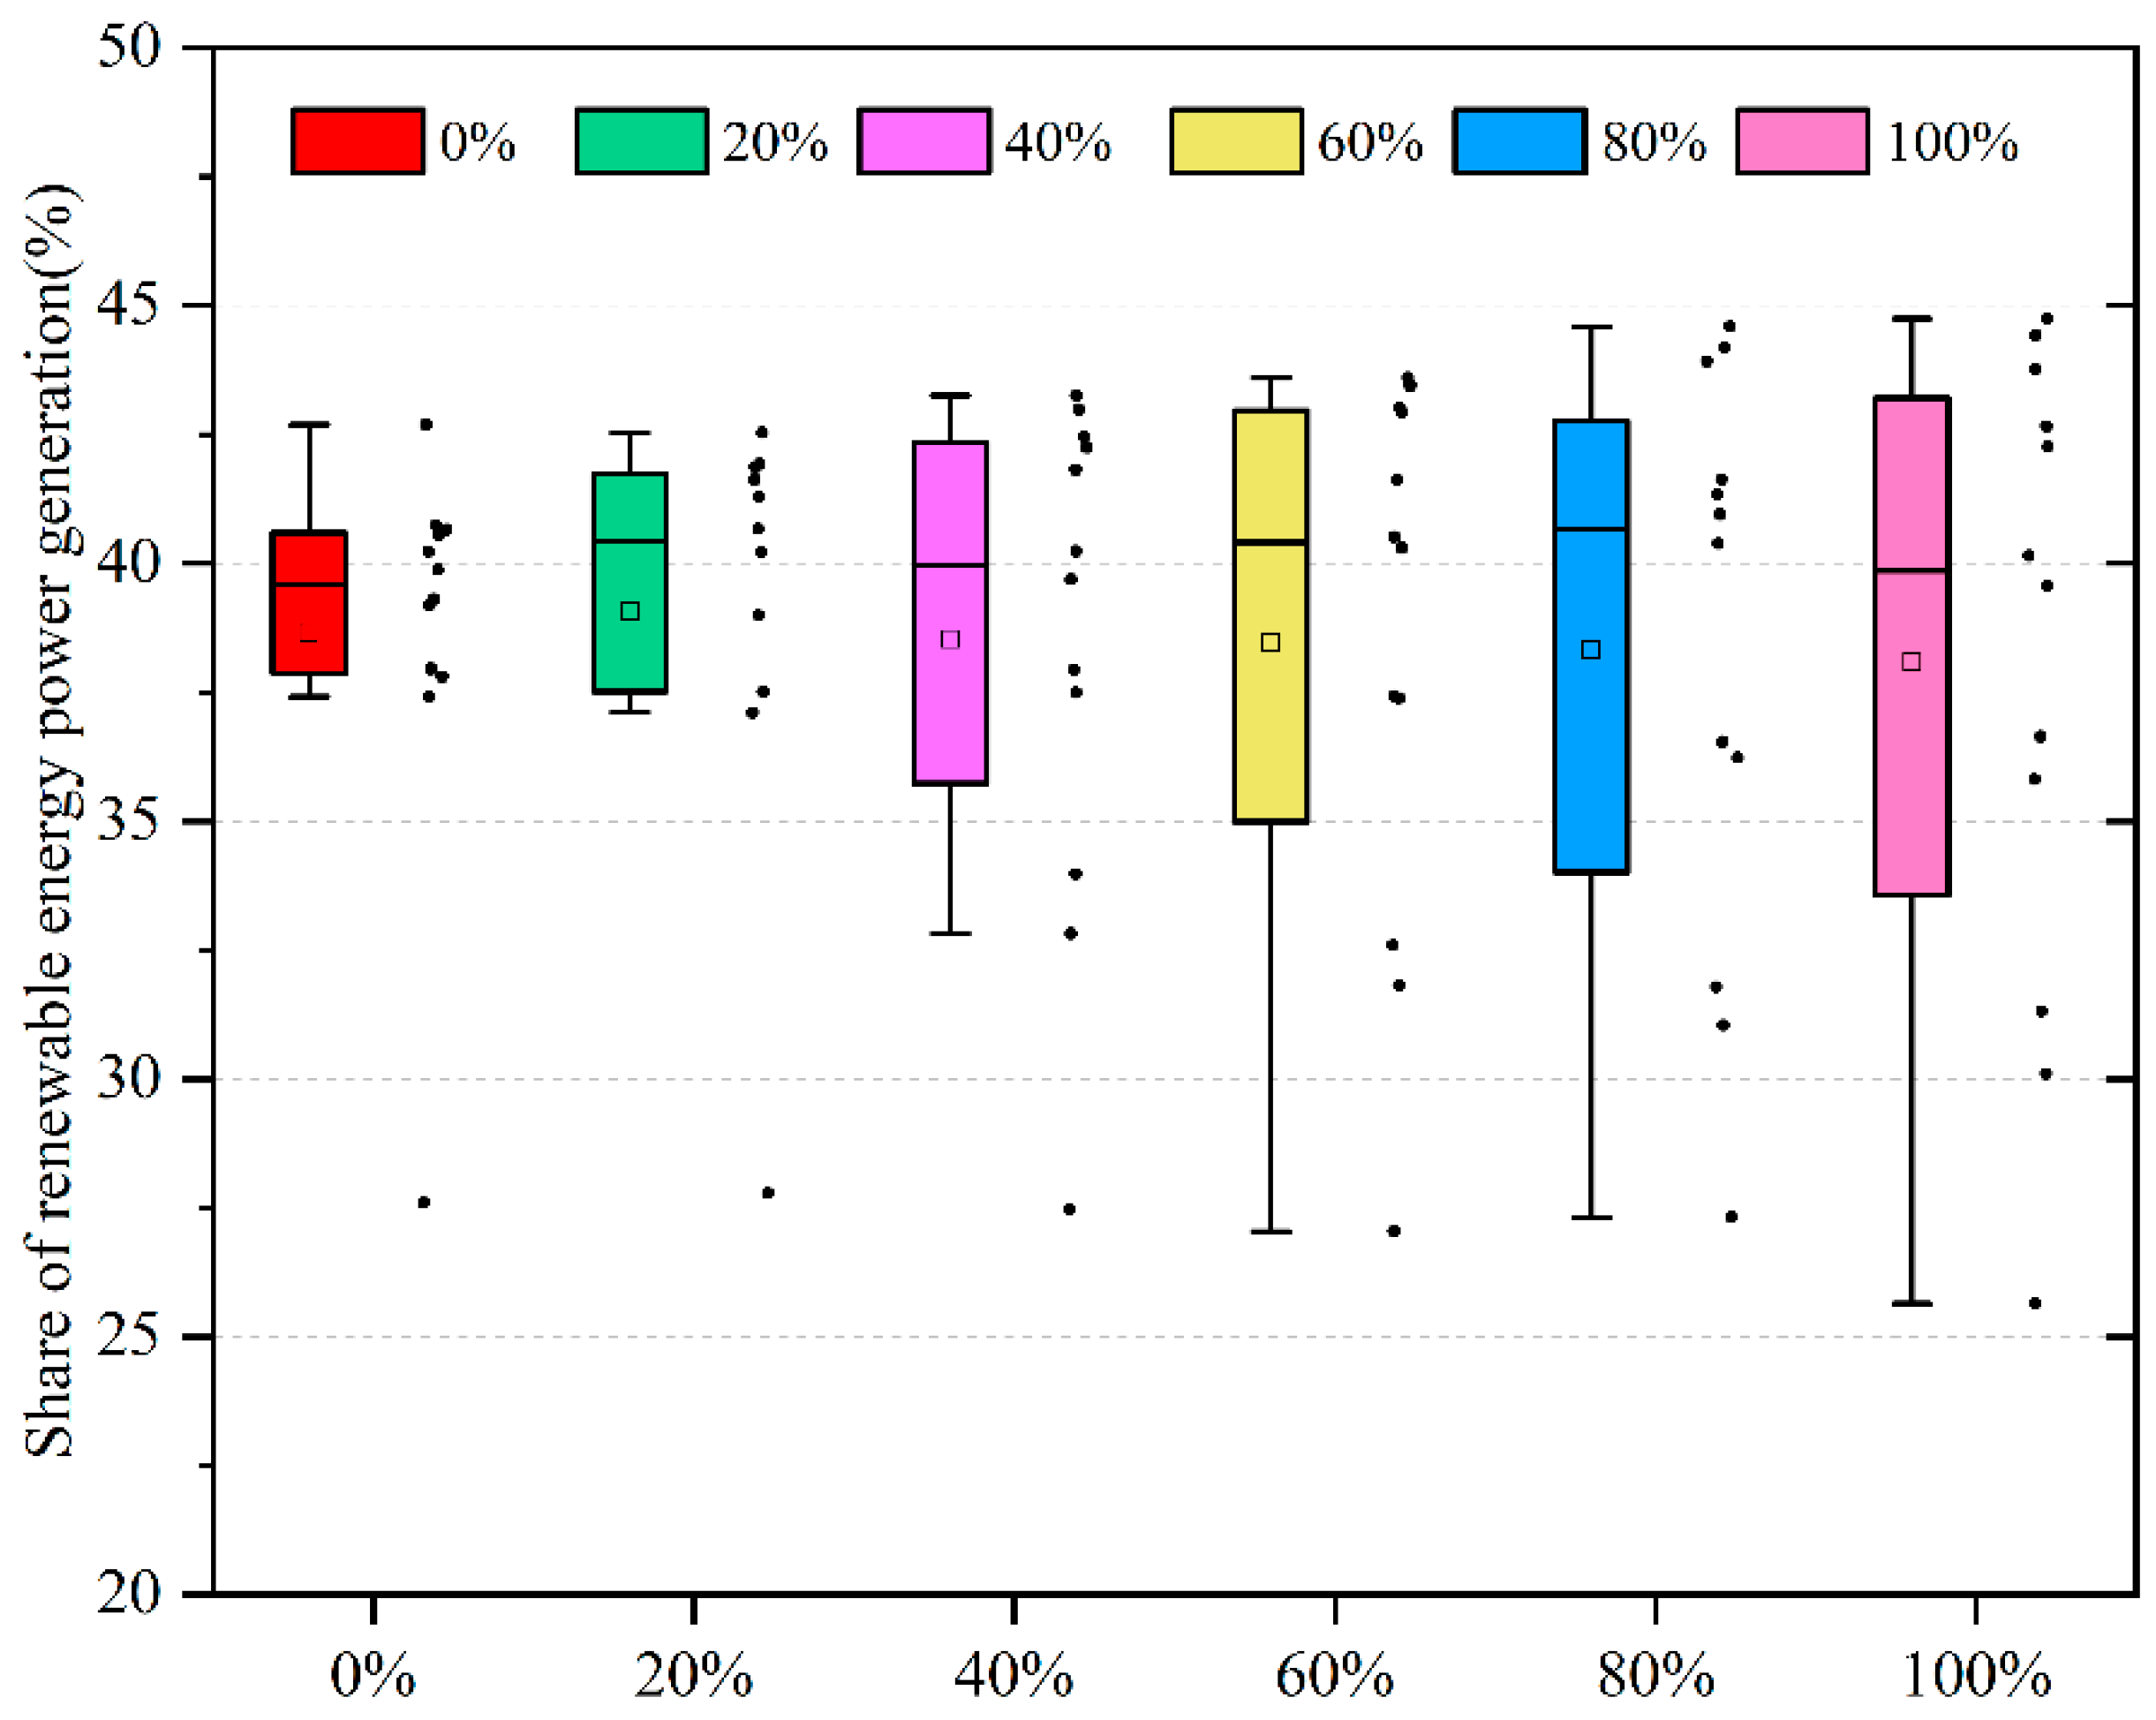
Figure 10.
Cost indicators for different carbon allowance auction ratios.
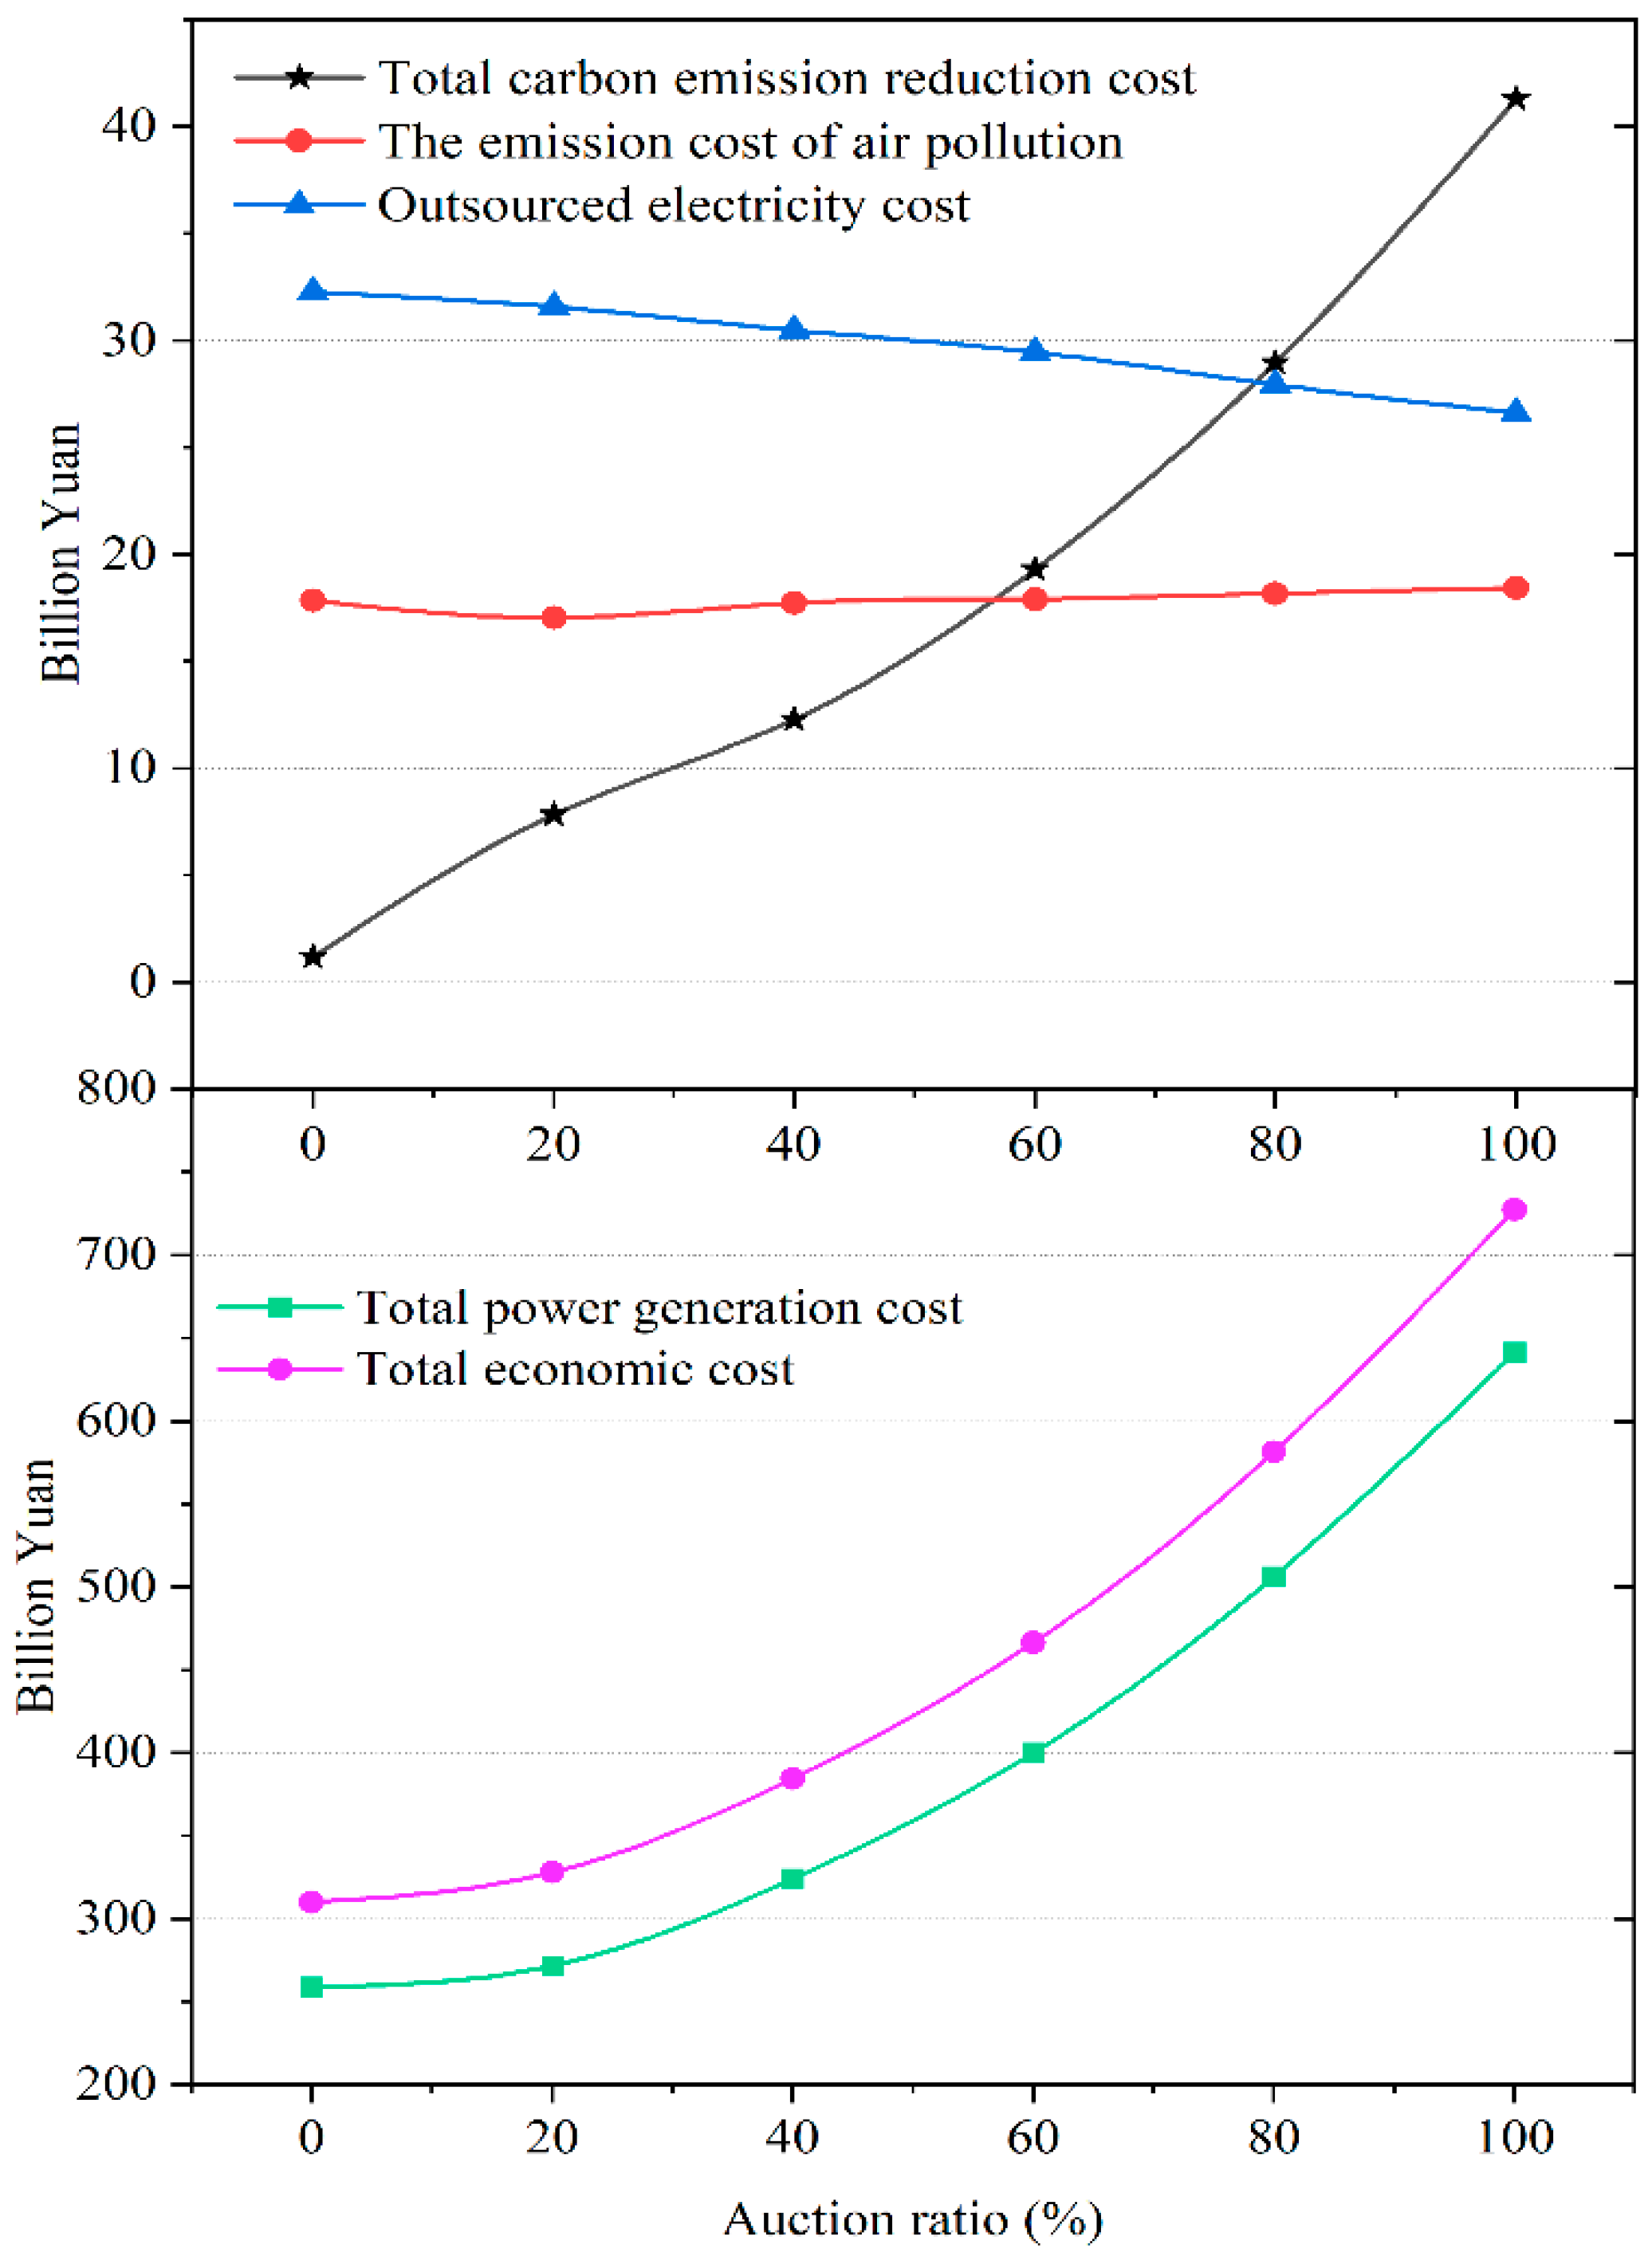
Figure 11.
The total economic costs and carbon emissions under different carbon allowance auction ratios.
Figure 11.
The total economic costs and carbon emissions under different carbon allowance auction ratios.
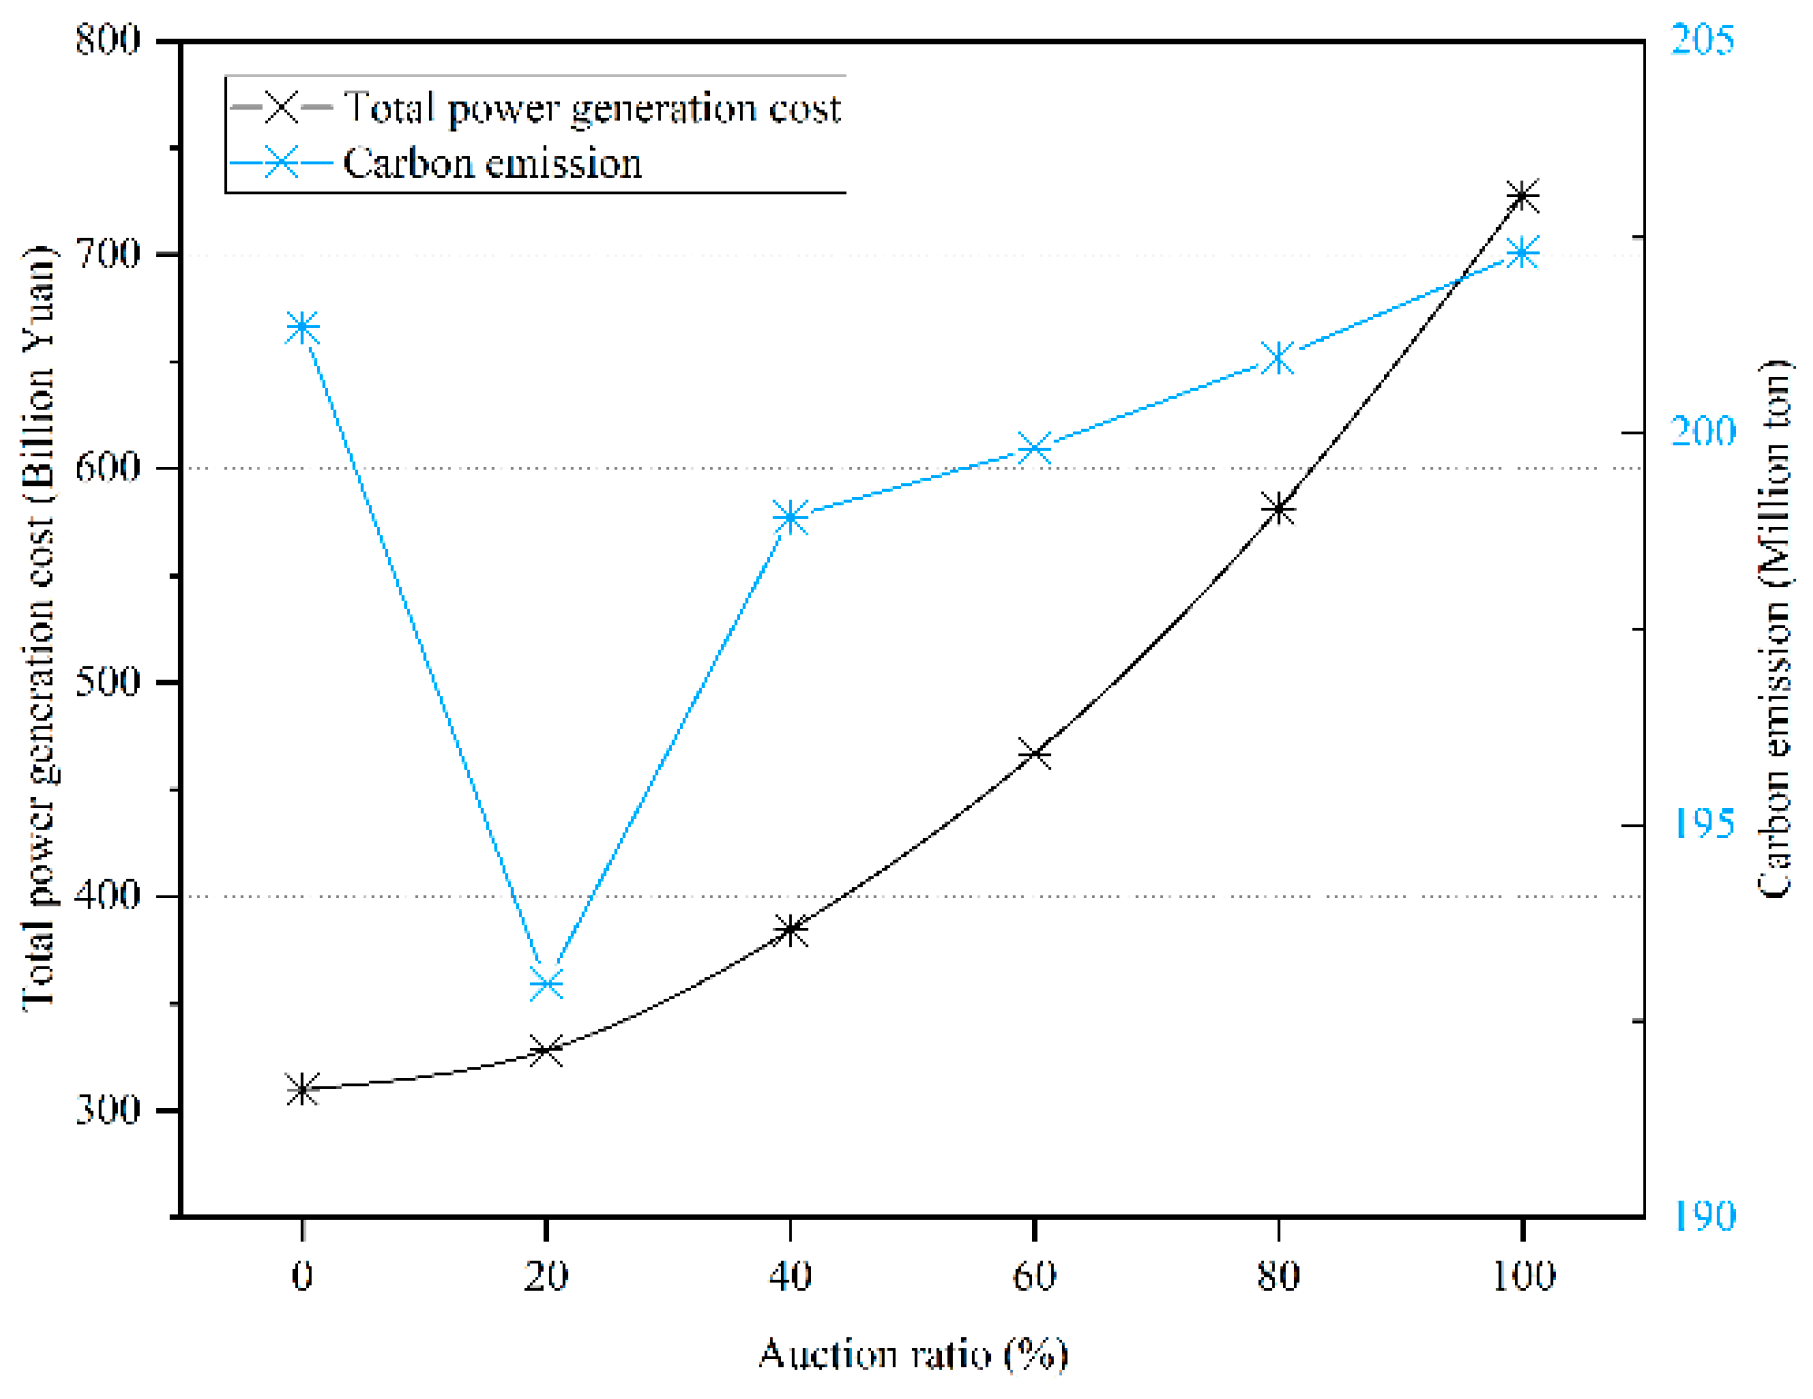
Table 1.
Standardization and explanation of the indexs, parameters and variables used in modeling.
| Index | Explanation |
| the set of electricity generation types | |
| a period of time | |
| carbon quota auction ratio | |
| the set of pollutants types generated by power generation | |
| Parameter | Explanation |
| CO2 emissions per unit of energy generated | |
| subsidized unit price for technology | |
| unit output coefficient for technology | |
| 0-1 variables, indicates that no subsidy policy is considered for technology ; When , it means the opposite situation. | |
| carbon emission intensity coefficient for technology during equipment operation | |
| regional grid average CO2 emission factor | |
| average emission factor of pollutant P generated by electricity generation for technology | |
| plant electricity consumption rate of generator set for technology | |
| line loss rate of generator set for technology | |
| power reserve ratio | |
| minimum weighted responsibility for renewable energy power integration | |
| peak shaving depth of thermal power generators | |
| Variable | Explanation |
| the amount of power generation by technology in month | |
| the outsourced electricity in month | |
| total economic cost | |
| total generation cost of various power generation technologies | |
| total carbon abatement cost of various power generation technologies | |
| cost of atmospheric pollution emissions | |
| net cost of the outsourced electricity | |
| unit cost of electricity generation by technology in month | |
| Total subsidy of electricity generation for technology in month | |
| basic operating costs for technology | |
| environmental costs for technology in month | |
| depreciation cost of thermal power generation units | |
| fuel cost of thermal power generation | |
| operation and maintenance costs of thermal power generation | |
| the shadow price of carbon emissions when the carbon quota auction ratio is | |
| average carbon price in Carbon emission trading market in month | |
| carbon emission quota allocated to thermal power units in month | |
| environmental costs of pollutant | |
| average transaction price of the outsourced electricity in month | |
| average transaction price of the exported electricity in month | |
| the exported electricity in month | |
| total social electricity demand in month | |
| maximum electricity load demand in month | |
| peak-to-valley difference of grid load | |
| exported electricity load | |
| available installed capacity | |
| output power fluctuation range | |
| grid load peak-to-valley difference | |
| the proportion of the -th energy generation in the t-th month to the annual generation | |
| non-fossil energy generation as a percentage of total electricity generation | |
| non-hydro renewable energy generation as a percentage of total electricity generation | |
| carbon emissions from the power generation sector | |
| carbon emission cap for the power generation sector | |
| historical average installed capacity | |
| minimum utilization hours for technology in month | |
| maximum utilization hours for technology in month | |
| historical average installed capacity of the outsourced electricity | |
| minimum utilization hours for the outsourced electricity in month | |
| maximum utilization hours for the outsourced electricity in month |
Table 3.
Results of cost-related data measurements in the research.
| Power generation technology | Useful life (Year) | The basic operating costs (Yuan/kWh) | Power generation subsidy (Yuan/kWh) | Carbon emission coefficients (g/kWh) |
| Thermal | 25 | 0.3363 | 0 | 822 |
| Hydro | 50 | 0.0966 | 0 | 20 |
| Wind | 20 | 0.4150 | 0.192 | 13 |
| Nuclear | 45 | 0.3420 | 0 | 66 |
| Solar | 30 | 0.7000 | 0.1377 | 45 |
| Biomass | 25 | 0.4648 | 0.1795 | 35 |
Disclaimer/Publisher’s Note: The statements, opinions and data contained in all publications are solely those of the individual author(s) and contributor(s) and not of MDPI and/or the editor(s). MDPI and/or the editor(s) disclaim responsibility for any injury to people or property resulting from any ideas, methods, instructions or products referred to in the content. |
© 2023 by the authors. Licensee MDPI, Basel, Switzerland. This article is an open access article distributed under the terms and conditions of the Creative Commons Attribution (CC BY) license (http://creativecommons.org/licenses/by/4.0/).
Copyright: This open access article is published under a Creative Commons CC BY 4.0 license, which permit the free download, distribution, and reuse, provided that the author and preprint are cited in any reuse.


