
Submitted:
11 December 2023
Posted:
12 December 2023
You are already at the latest version
Abstract
Localized jawbone invasion is a milestone in the progression of oral squamous cell carcinoma (OSCC). The factors that promote this process are not well understood. Sclerostin is known to be involved in bone metabolism and there are preliminary reports of its involvement in bone tumors and metastasis. To identify a possible involvement of sclerostin in the bone invasion process of OSCC, sclerostin expression was analyzed in vitro in two different human OSCC tumor cell lines by qRT-PCR, and the effect of recombinant human (rh)-sclerostin treatment on tumor cell capabil-ities was evaluated using proliferation, migration, and invasion assays. Undifferentiated human mesenchymal stem cells (hMSCs) were osteogenically differentiated and co-cultured with OSCC tumor cells to demonstrate potential interactions on migration characteristics. Sclerostin expres-sion was evaluated in clinical cases by immunohistochemistry at the OSCC jawbone interface in a cohort of 15 patients. Sclerostin expression was detected in both OSCC tumor cell lines in vitro and was also detected at the OSCC jawbone interface in clinical cases. Tumor cell proliferation rate, migration and invasion ability were increased by rh-sclerostin treatment. The migration rate of tumor cells co-cultured with osteogenically differentiated hMSCs was increased. The re-sults presented are the first data suggesting a possible involvement of sclerostin in the bone inva-sion process of OSCC, which needs to be further investigated
Keywords:
oral squamous cell carcinoma
; bone invasion
; sclerostin
; SOST
1. Introduction
Oral squamous cell carcinoma (OSCC) is a prevalent form of malignant head and neck cancer with a global impact [1]. In advanced tumor stages, it is associated with poor patient prognosis and reduced health-related quality of life [2,3,4]. It is known to invade the local jawbone in a significant percentage of cases, ranging from 12% to 56% [5,6]. The biological significance of bone invasion in OSCC has been highlighted by studies showing a correlation with the frequency of lymph node metastasis and poor prognosis [7,8,9].
Destroyed adjacent jaw bone requires resection of the affected jaw sections and reconstruction with free vascularized bone grafts, mainly from the fibula [10], scapula [11] or iliac crest [12]. Such procedures are time-consuming, surgically complex, and associated with functional (chewing, swallowing, speaking) and esthetic limitations and patient morbidity [13]. OSCC bone invasion is a complex process involving a variety of different cellular and molecular mechanisms that are still poorly understood.
Sclerostin is the protein product of the SOST gene and a key regulator of bone homeostasis [14]. It binds to the LRP5/6 receptor and suppresses Wnt signaling in osteoblasts, thereby reducing bone formation and promoting bone resorption by activating osteoclasts [14]. This effect is likely due to antagonism of bone morphogenetic proteins (BMPs), a group of growth factors that can stimulate bone growth [14].
Sclerostin has been implicated in the pathogenesis of several Wnt-related musculoskeletal disorders and is an interesting target for therapeutic intervention [15]. In addition, there is a growing body of literature linking sclerostin to the biology of bone metastases and primary bone tumors of various entities. Several effects have been demonstrated. For example, in breast cancer, the second leading cause of cancer-related death in women worldwide, bone metastasis and osteolytic bone destruction often occur during tumor progression [16]. This process is largely caused by stimulating osteoclasts to resorb bone and preventing osteoblasts from forming new bone [16]. Sclerostin is overexpressed in breast cancer tumor tissues and cells and promotes migration, invasion, and bone osteolysis [17]. Inhibition of sclerostin reduces migration and invasion of this tumor entity in a time- and dose-dependent manner [17]. The transcription factor Runx2 is known to mediate activation of osteoclast activity and inhibition of osteoblast differentiation by metastatic breast cancer cells [16]. Runx2 requires the co-activator core-binding factor beta (CBFb) to regulate gene expression in breast cancer cells. The combination of Runx2/CBFb mediates the inhibition of osteoblast differentiation through the induction of sclerostin [16]. In vivo models in mice with breast cancer-related bone metastases have shown that pharmacological sclerostin inhibition reduces metastatic burden [18], prolongs animal survival [17] and prevents cancer-related bone destruction [17,19].
A similar effect as in breast cancer has also been demonstrated in multiple myeloma. Myeloma cells are known to produce and shed sclerostin into the serum/plasma of patients [20]. Increased serum sclerostin levels correlate with more extensive bone disease and negative myeloma features [20]. Pharmacologic sclerostin inhibition prevented bone loss and preserved bone strength in preclinical studies without significantly affecting tumor growth [21]. Several risk factors and causative genes for the development of osteosarcoma have been reported in the literature [18]. However, the etiology remains largely unknown. Bone formation is a common phenomenon in all types of osteosarcoma. Sclerostin has also been shown to suppress the proliferative and migratory capacity of osteosarcoma cells, and administration of sclerostin inhibits tumor growth in mice and prolongs animal survival [18]. In prostate cancer, sclerostin expression is reduced and can be used in combination with BMP-6 and noggin expression as a prognostic factor for metastatic progression [20].
No studies have been published yet on the involvement of sclerostin in the bone invasion process of OSCC. In a preliminary pilot study, we have shown that a human OSCC tumor cell line under TGF-β treatment upregulates the expression of the SOST gene and that sclerostin protein expression in these tumor cells has a significant prognostic impact for patients [22]. To gain further insight into the bone invasiveness of OSCC, we used an in vitro approach to investigate the influence of sclerostin on tumor cell proliferation, migration, and invasion capabilities, and evaluated sclerostin expression at the OSCC jaw-bone interface in clinical cases by immunohistochemistry.
2. Materials and Methods
In this study, a possible influence of sclerostin on the bone invasiveness of OSCC was evaluated using three different approaches: 1.) Treatment of OSCC tumor cells with rh-sclerostin and its influence on cellular characteristics proliferation, migration and invasion. 2.) Co-cultivation of OSCC tumor cells with osteogenically differentiated human bone marrow-derived mesenchymal stem cells (hMSCs) and its influence on tumor cell migration. 3.) Immunohistochemical analysis of the OSCC jawbone interface in human tissue samples.
2.1. Cell Culture
PCI-13 (UPCI, Pittsburgh, PA, USA) [23] and UPCI-SCC-040 (SCC-040) cells (DSMZ, Braunschweig, Germany) were cultured in DMEM + GlutaMAX (31966021, Thermo Fisher, Waltham, Massachusetts, USA) and MEM Earle's (FG0325, Merck, Darmstadt, Germany) with 10% fetal bovine serum (v/v) and 1% penicillin/streptomycin (v/v), respectively (37°C, 5% CO2, 80% humidity). For cell expansion or cell seeding, cells were enzymatically detached from the surface using 0.05% (w/v) trypsin/0.02% (w/v) EDTA and resuspended in serum-free medium.
HMSCs were provided by the Bader laboratory of the Centre for Biotechnology and Biomedicine, Leipzig, Germany. The isolation of hMSCs from donors was approved by the local ethics committee (Saxony Regional Authority, EK-BR-86/14-1). HMSCs were cultured in DMEM (P04-01159, PAN-Biotech, Aidenbach, Germany) containing 10% fetal bovine serum (v/v), 0.2% gentamicin/ampicillin (v/v) and 4 mM glutamine (37°C, 5% CO2, 80% humidity). For differentiation, further supplements were added to the medium (2 mM glutamine; 0.05 µM sodium ascorbate; 0.1 dexamethasone; 10 mM β-glycerol phosphate; 0.015 mM CaCl2; 0.05 µM vitamin D3). (Before each experiment, cells were stained with trypan blue and counted using a cell counter (Logos biosystems, Anyang-si, South Korea). All cell biological experiments were performed in triplicate in at least three separate experiments.
2.2. qRT-PCR analysis
For qRT-PCR analysis, RNA was isolated from cells using a QIAGEN RNA Isolation Kit (74104, Qiagen, Hilden, Germany) according to the manufacturer's instructions. Prior to RNA isolation, the analysed cells were seeded in a 6-well plate and cultured to 80% to confluence. For the analysis of differentiated hMSCs, cells were cultured as described above and RNA was isolated after 14 days of cultivation with differentiation media.
The isolated RNA was used as input for subsequent cDNA synthesis using RevertAid first strand cDNA synthesis from Thermo Fisher (K1622, Thermo Fisher, Waltham, Massachusetts, USA). From each sample, 1 µg of RNA was used for reverse transcription. Finally, 10 ng of cDNA was used for each SYBR green qRT-PCR reaction. A 25 µl reaction volume was prepared for each well of a 96-well plate using Luna® Universal Probe qPCR Master Mix (New England Biolabs, Ipswich, Massachusetts, USA) according to the manufacturer's instructions. The Ct value was determined using a QuantStudio 3 (Thermo Fisher, Waltham, Massachusetts, USA). GAPDH was used as an endogenous housekeeper for the calculation of relative expression.
2.3. Proliferation assay
Cell proliferation was measured using the RealTime GloTM assay (G9711, Promega, Madison, Wisconsin, USA). The assay was performed according to the manufacturer's instructions and the luciferase reaction was measured every 24 hours. To analyse the influence of recombinant human (rh)-sclerostin (100-49, Peprotech, Hamburg, Germany) on cell proliferation, 1,500 cells were seeded per well of a 96-well plate and four different concentrations of sclerostin (0; 1; 5; 10 ng/ml) were tested. To achieve a critical number of technical replicates in each independent experiment, six wells were seeded per concentration. After initial seeding, proliferation was measured every 24 hours. The medium was completely changed before each measurement and new sclerostin was added with each medium change. Reduction of luciferase substrate was measured using a microtiter plate reader (Biotek, Winooski, VT, USA).
2.4. Migration and invasion assays
Migration and invasion were performed as described elsewhere [24] with some modifications. Briefly, for migration and invasion, 20,000 PCI-13 cells were seeded in the upper volume of a transwell insert with a pore size of 8.0 µm for a 12-well plate (9318012 cellQART®, Northeim, Germany, Figure 1). For invasion analysis, the membrane of each transwell insert was additionally coated with 1 mg/ml collagen type 1 solution (50301, Matrix Bioscience, Maerlenbach, Germany). The collagen was diluted in 0.1% acetic acid and 200 µl of the solution was added to each membrane. All membranes were then incubated for a further 2 hours under cell culture conditions. Excess collagen was again removed and 1 ml of cell culture medium was added to the transwell to neutralise the membrane-bound collagen. The inserts were then incubated for a further 2 hours under cell culture conditions. The cells were diluted in 400 µl of serum-free cell culture medium. The lower compartment was filled with 1 ml of cell culture medium containing 10% fetal calf serum. In addition, the medium in the lower compartment was supplemented with sclerostin. To investigate the sensitivity of the cells to sclerostin, three different concentrations (0, 1, 5 ng/ml) were prepared for each experiment. After seeding, cells were incubated for 24 h, fixed with 4% PFA for 20 min at room temperature, stained with 5 µg/ml Hoechst 33258 (K1622, Thermo Fisher, Waltham, Massachusetts, USA) and washed three times with PBS. After staining, cells on the top of the membrane were removed from the insert using an ear swab. Migrated/invaded cells on the underside of the membrane were imaged and automated cell counting was performed using Aivis4D version 3.2. To avoid side effects, a region of interest was defined and positioned in the central region of each stitched image. Stained nuclei were finally counted using a particel detection tool.
2.5. Co-cultivation experiments
Co-cultivation was performed as described above with slight modifications regarding the cultivation of hMSCs in the lower compartment of the transwell. For the differentiation of hMSCs, 31,500 cells were seeded in a 12-well and after three days of cultivation with proliferation medium, the cells were further incubated with differentiation medium until day 14. The medium was changed every three days, the last time two days before the start of co-culture. After this period, the transwell was placed in the well and PCI-13 cells were seeded at the same density in the upper compartment of the transwell as described above. The co-culture was incubated for 24 hours and analysed as described above.
2.6. Scratch assay
For the scratch assay, a confluent cell monolayer was established by seeding 47,500 PCI-13 cells in a well of a 24-well plate and incubated for 24 hours under cell culture conditions. The monolayer was scraped by hand with a 2.5 ml pipette tip to set the scratch. Immediately after scraping, a first image was taken at 4x magnification (Olympus IX81, EVIDENT, Hamburg, Germany). Further images were taken every 12 h over a period of 36 h. To test the effect of sclerostin on the cell phenotype, cells were incubated in media containing three different concentrations of sclerostin (0, 1 and 5 ng/ml). Scratch size was analysed using Fiji Image J (https://fiji.sc/) and cell free area was measured using the wound healing size tool. Before using the tool, a region of interest (ROI) of a defined size was placed in the center of the image for all images, and only the area within the ROI was finally analyzed.
2.7. Semi-quantitative immunohistochemical evaluation of sclerostin expression at the OSCC jaw bone interface in clinical cases
Tissue samples from 15 OSCC patients undergoing primary surgical treatment between 2016 and 2020 were retrospectively used for visualization of the OSCC jawbone interface and immunohistochemical sclerostin evaluation. The clinical characteristics of the patients are given in Table 1. Patients provided written informed consent before participation in the study. The study was approved by the clinical ethics committee of the University Medical Center Goettingen (vote no. 07/06/09, updated April 2018).
Tissue samples were collected immediately after tumor resection, fixed in neutral buffered 4% formalin, and embedded in paraffin. Immunohistochemical reactions (Table 2) were performed on 2-μm sections using a fully automated slide stainer (Agilent Technologies, Santa Clara, CA, USA). Tissue slides were digitized using a Motic EasyScan One slide scanner (Motic, Hong Kong, China) at 80× magnification and 0.13 μm/pixel resolution. For semi-automated, semi-quantitative immunohistochemical analysis, we used the open-source image analysis software quPath [25]. In each case, three different regions of interest (ROIs) were digitally defined at the OSCC jawbone interface. Each ROI was approximately 1 cm2 in size. Automated cell detection was used to identify cells in all ROIs based on cell and membrane staining. Intensity thresholds were set to further subclassify tumor cells with negative, weak, moderate, or strong positive sclerostin staining based on mean DAB optical densities. For each ROI, an H-score was calculated by adding 3x% strongly stained tumor cells, 2x% moderately stained tumor cells, and 1x% weakly stained tumor cells [26], resulting in scores ranging from 0 (all tumor cells negative) to 300 (all tumor cells strongly positive). The means of the three different ROIs were calculated for statistical analysis.
2.8. Statistical analysis
All data were tested for normal distribution using the Shapiro-Wilk test. Since all data were normally distributed, group comparisons were performed using one-way ANOVA analysis. All statistical analyses were performed at a significance level of α = 5% using Prism 10.10 software (GraphPad, La Jolla, CA, USA). A p-value less than 0.05 was considered statistically significant.
3. Results
3.1. Sclerostin expression in different OSCC tumor cell lines
To detect sclerostin expression in the two different OSCC tumor cell lines (SCC-040 and PCI-13), qRT-PCR analysis was performed and cycle threshold (CT) values were determined as shown in Figure 3. Sclerostin expression was detected in both cell lines, although its expression was higher in the OSCC cell line SCC-040 (MV 24.57) than in the PCI-13 cell line (MV 31.26).
3.2. Evidence of osteogenic differentiation of hMSCs and their sclerostin expression
For co-culture experiments, hMSCs were cultured in osteogenic differentiation medium (DMEM) for 14 days. To demonstrate successful differentiation, qRT-PCR analysis of known osteogenic markers (ALPL, COL1A1, osteocalcin, osteopontin, asterix, and RUNX2) [27] and sclerostin expression was performed. Undifferentiated hMSCs were used as a control and GAPDH was used as endogenous reference gene. The analysis revealed overexpression of the known osteogenic markers ALPL, Osteocalcin and Osterix, indicating successful differentiation of the hMSCs. In addition, higher sclerostin expression was detected in the osteogenic differentiated hMSCs compared to the undifferentiated controls (Figure 4).
3.3. Effect of sclerostin treatment on tumor cell proliferation
To evaluate the influence of sclerostin on tumor cell proliferation, the two OSCC tumor cell lines SCC-040 and PCI-13 were treated with different concentrations (1 ng/ml, 5 ng/ml, and 10 ng/ml) of rh-sclerostin for different time periods (24h, 36h, 48h, 60h, and 72h). The experiments showed a significant increase in tumor cell proliferation for the SCC-040 tumor cell line at the higher sclerostin concentrations (5 and 10 ng/ml) after all treatment times (24h, 36h, 48h, 60h and 72h, all p-values < 0.05). In addition, a significant effect was also demonstrated for the highly proliferative PCI-13 tumor cell line for all sclerostin concentrations after treatment periods of 24h, 36h and 48h (all p-values < 0.05, Figure 5).
3.4. Effect of sclerostin treatment on tumor cell migration and invasion
A Boyden chamber assay was performed to evaluate the influence of sclerostin on tumor cell migration and invasion. Preliminary experiments have shown that the low proliferative SCC-040 tumor cell line grows strongly in clusters, and evaluation of migration and invasion using the described assay was not practical. For this reason, migration and invasion assays were performed only on the PCI-13 cell line. For this purpose, PCI-13 cells were placed in the upper compartment of Boyden chambers and treated with different concentrations of sclerostin (1 and 5 ng/ml). After a period of 24h, the migration of the tumor cells to the lower compartment of the chamber was evaluated, by using fluorescence microscopy and cell nucleus counting with Fiji imageJ.
The analysis revealed significantly increased PCI-13 tumor cell migration for the higher concentration of sclerostin (5 ng/ml) compared to the low concentration (1 ng/ml) and the untreated controls (0 ng/ml) as shown in Figure 6a (all p-values < 0.05). Subsequently, the porous membrane of the Boyden chamber assay was additionally coated with collagen to simulate tumor cell invasion into the extracellular matrix. The tumor cells were treated with 1 and 5 ng/ml rh-sclerostin, equivalent to the migration assay, and tumor cell invasion into the membrane was evaluated by fluorescence microscopy. The results showed increased tumor cell invasiveness with increasing sclerostin concentration, with only the higher dose of sclerostin (5 ng/ml) showing a statistically significant result (p < 0.05), as shown in Figure 6b.
3.5. Migration analysis by Scratch Assay
To additionally evaluate PCI-13 cell migration, a scratch assay was performed under sclerostin treatment of tumor cells at different concentrations (1, 5 ng/ml) and time periods (0h, 12h, 24h, 36h, 41h, 54h, and 60h). As shown in Figure 7, scratch closure was observed regardless of the sclerostin concentration.
3.6. Tumor cell migration in co-culture with osteogenic differentiated hMSC cells
To simulate the influence of osteogenic active cells on tumor cell characteristics, PCI-13 cells were co-cultured with osteoganically differentiated and undifferentiated hMSCs and the tumor cell migration rate was evaluated equivalently as described in the previous experiments. In addition, tumor cells were treated with differentiation medium alone. Monocultured PCI-13 in normal cell culture medium served as a control. The study revealed the highest tumor cell migration rate for the PCI-13 cells co-cultured with osteogenic differentiated hMSCs (p-value < 0.05) as shown in Figure 8. Lower tumor cell migration rates were observed both in co-culture with undifferentiated hMSCs and in monoculture with the differentiation medium, but still higher than the untreated controls.
3.7. Sclerostin expression of tumor cells at the OSCC jawbone interface
To evaluate sclerostin expression in tumor cells at the OSCC jawbone interface in clinical cases, histologic slides from 15 patients with bone-invasive OSCC were prepared and immunohistochemically evaluated. H-score values ranged from 61 to 127 (MV 94, SD 21), indicating significant sclerostin expression in tumor cells at the OSCC jawbone interface. The results of all H-score values are shown in Table 1. H-score values range from 0 to 300, with 0 indicating that no cells are positive and 300 indicating that all cells are strongly positive. The OSCC jawbone interface is highlighted in Figure 9, indicating significant sclerostin expression in tumor cells and bone-associated osteoclasts.
4. Discussion
The process of local jawbone invasion in OSCC is a milestone in tumor progression [9], indicating aggressive tumor biology [28], and is considered a prognostic indicator associated with increased recurrence frequency and decreased survival rates [28,29,30,31]. The negative clinical impact in terms of impaired functionality, aesthetics and associated reduced health-related quality of life [32] is a major challenge that requires aggressive treatment with resection of the involved bone sections and functional and aesthetic plastic reconstruction [33]. The clinical significance has led to the inclusion of bone invasion status in the T-status of the International Union Against Cancer (UICC) and American Joint Committee on Cancer (AJCC) OSCC staging systems, reflecting its importance in disease staging and treatment decision making [34]. However, the mechanisms of OSCC bone invasion involve complex cellular and molecular processes, including regulation of osteoclast differentiation [35], bone resorption [9], and expression of various molecular targets such as parathyroid hormone-related protein [36], fractalkine [37], and Axin2-snail axis [38], and remain poorly understood [9].
The invasion of solid tumors into bone is known to be based on a complex interaction between tumor cells, bone-forming osteoblasts, and bone-resolving osteoclasts [39]. Tumor-derived cytokines in the tumor microenvironment (TME) alter the balance of osteoclast and osteoblast activity, disrupting physiological bone homeostasis and promoting bone destruction by enhancing osteoclast and inhibiting osteoblast function [39,40,41]. Osteolytic bone lesions provide niches for tumor cells to further interact with osteoblasts and osteoclasts, creating a vicious cycle that perpetuates tumor growth in bone [41,42]. While the interaction between tumor cells and osteoclasts is well established, the influence of tumors on osteoblasts at sites of bone invasion has received less attention [43,44].
There is increasing evidence in the literature for the involvement of sclerostin in various Wnt-related musculoskeletal disorders [15,21], primary bone tumors of various entities [18,20] and the development of bone metastases [16,17,18,19]. Mendoza-Villanueva and colleagues have shown that Runx2 and CBFb inhibit osteoblast differentiation in bone metastatic breast cancer cells and that this inhibition is mediated by the induction of sclerostin expression [16]. In addition, two target genes, IL-11 and GM-CSF, were identified as being involved in the enhanced osteoclast activation [16]. Wijenayaka and colleagues treated human pre-osteocyte cultures and mouse osteocyte-like cells with recombinant sclerostin and observed that it upregulates the expression of receptor activator of nuclear factor kappa B (RANKL) mRNA and downregulates osteoprotegerin (OPG) mRNA, resulting in increased osteoclast activity [45]. These data suggest that sclerostin may be involved in the establishment of a pro-tumorigenic microenvironment by inhibiting osteoblast differentiation and function and promoting osteoclast formation and activity at the site of tumor invasion [16,45].
To date, no studies have been published that have directly investigated the involvement of sclerostin in the bone invasiveness of OSCC. The data presented here provide the first evidence of such an association. We have recently shown that human OSCC tumor cells upregulate sclerostin expression under TGF-β treatment and that sclerostin expression has a significant prognostic impact for patients [22]. Tumor cells that increase their migration and invasion capabilities undergo an epithelial-mesenchymal transition (EMT) process, and the TGF-β signaling pathway is known to be primarily involved [46].
We demonstrate significant sclerostin expression in tumor cells at the OSCC jawbone interface in patients with locally advanced, bone-invasive, growing OSCC. OSCC tumor cells can actively synthesize sclerostin in vitro, and their cellular properties in terms of proliferation, migration, and invasion can be enhanced by sclerostin treatment, which appears to be dose- and time-dependent, with these effects most evident at higher doses of sclerostin and longer treatment times. Initial data from our co-culture experiments with osteogenic differentiated hMSCs confirm this effect. Similar results have been reported by Zhu and colleagues [17]. The effect of sclerostin on the proliferation, migration, and invasion abilities of two different breast cancer cell lines (MCF-7 and MDA-MB-231) was investigated by inhibiting sclerostin with an inhibitory antibody at different doses (1 and 4 µg/ml) and time periods (1, 2 and 3 days). While no effect on tumor cell proliferation was observed, migration and invasion rates were significantly reduced. The authors concluded that sclerostin inhibition may reduce the potential of breast cancer tumor cells to form bone metastases [17].
From the data presented here and previous reports in the literature, we hypothesize that sclerostin, which is involved in physiological bone metabolism, may also be a key player in OSCC bone invasion. However, additional functional studies are needed to further substantiate this effect and to understand the molecular background. With anti-sclerostin drugs already approved for various other diseases, such as romosozumab [47] and raloxifene [48] for manifest postmenopausal osteoporosis, there are drugs already available that should also be tested for the treatment of primary bone tumors or for reducing bone metastasis formation or local bone invasion in solid tumors.
5. Conclusions
The data presented here provide a first indication for a possible involvement of sclerostin in OSCC bone invasion by altering the cellular properties of tumor cells towards a more aggressive phenotype. The immunohistochemical data confirm high levels of sclerostin expression at the OSCC jawbone interface, which may maintain a pro-tumorigenic microenvironment. Further functional studies are needed to clarify the molecular background and to potentially translate drug-induced sclerostin inhibition therapeutically to reduce local jawbone destruction.
Author Contributions
Conceptualization, U.S., K.L. and P.B.; methodology, U.S., S.A.S., F.B. and P.B.; software, U.S., T.K. and P.B.; validation, F.B., B.S., H.S. and P.B.; formal analysis, U.S., S.A.S. and P.B.; investigation, U.S., K.L. and P.B.; resources, K.L. and H.S.; data curation, U.S., T.K. and P.B.; writing—original draft preparation, U.S. and P.B.; writing—review and editing, T.K., B.S., K.L. and H.S.; visualization, U.S. and P.B.; supervision, U.S., K.L. and P.B.; project administration, U.S. and P.B.; funding acquisition, K.L. and H.S.. All authors have read and agreed to the published version of the manuscript.
Funding
We acknowledge support from the Open Access Publication Funds/Transformative Agreements of the University of Goettingen.
Institutional Review Board Statement
The study was conducted in accordance with the Declaration of Helsinki and approved by the Institutional Ethics Committee of University Medical Center Goettingen (vote no. 07/06/09, updated April 2018).
Informed Consent Statement
Informed consent was obtained from all subjects involved in the study.
Data Availability Statement
All data can be obtained from the corresponding author.
Acknowledgments
We thank Olga Dschun for her scientific and practical assistance in conducting trials.
Conflicts of Interest
The authors declare no conflict of interest.
References
- Sung, H.; Ferlay, J.; Siegel, R.L.; Laversanne, M.; Soerjomataram, I.; Jemal, A.; Bray, F. Global cancer statistics 2020: GLOBOCAN estimates of incidence and mortality worldwide for 36 cancers in 185 countries. CA Cancer J Clin 2021. [Google Scholar] [CrossRef] [PubMed]
- Ferrans, C.E. Quality of life: conceptual issues. Semin Oncol Nurs 1990, 6, 248–254. [Google Scholar] [CrossRef]
- Morton, R.P.; Izzard, M.E. Quality-of-life outcomes in head and neck cancer patients. World J Surg 2003, 27, 884–889. [Google Scholar] [CrossRef]
- Calman, K.C. Quality of life in cancer patients--an hypothesis. J Med Ethics 1984, 10, 124–127. [Google Scholar] [CrossRef]
- Kral, D.; Pink, R.; Saskova, L.; Michalek, J.; Tvrdy, P. Bone invasion by oral squamous cell carcinoma. Acta Chir Plast 2021, 63, 139–144. [Google Scholar] [CrossRef] [PubMed]
- Kasahara, Y.; Endo, K.; Ueno, T.; Ueno, H.; Moriyama-Kita, M.; Odani, A.; Yoshizaki, T. Bone invasion-targeted chemotherapy with a novel anionic platinum complex (3Pt) for oral squamous cell carcinoma. Cancer Science 2019, 110, 3288–3295. [Google Scholar] [CrossRef] [PubMed]
- Kawamata, H.; Nakashiro, K.i.; Uchida, D.; Harada, K.; Yoshida, H.; Sato, M. Possible contribution of active MMP2 to lymph-node metastasis and secreted cathepsin L to bone invasion of newly established human oral-squamous-cancer cell lines. International journal of cancer 1997, 70, 120–127. [Google Scholar] [CrossRef]
- Yamamoto, G.; Irie, T.; Aida, T.; Nagoshi, Y.; Tsuchiya, R.; Tachikawa, T. Correlation of invasion and metastasis of cancer cells, and expression of the RAD21 gene in oral squamous cell carcinoma. Virchows Archiv 2006, 448, 435–441. [Google Scholar] [CrossRef]
- Quan, J.; Johnson, N.W.; Zhou, G.; Parsons, P.G.; Boyle, G.M.; Gao, J. Potential molecular targets for inhibiting bone invasion by oral squamous cell carcinoma: a review of mechanisms. Cancer and Metastasis Reviews 2012, 31, 209–219. [Google Scholar] [CrossRef]
- Taylor, G.I.; Miller, G.D.; Ham, F.J. The free vascularized bone graft. A clinical extension of microvascular techniques. Plast Reconstr Surg 1975, 55, 533–544. [Google Scholar] [CrossRef]
- Dos Santos, L. The scapular flap: a new microsurgical free flap. Bol Chir Plast 1980, 70, 133. [Google Scholar]
- Taylor, G.I.; Townsend, P.; Corlett, R. Superiority of the deep circumflex iliac vessels as the supply for free groin flaps. Plast Reconstr Surg 1979, 64, 595–604. [Google Scholar] [CrossRef]
- Johnson, D.E.; Burtness, B.; Leemans, C.R.; Lui, V.W.Y.; Bauman, J.E.; Grandis, J.R. Head and neck squamous cell carcinoma. Nat Rev Dis Primers 2020, 6, 92. [Google Scholar] [CrossRef]
- Holdsworth, G.; Roberts, S.J.; Ke, H.Z. Novel actions of sclerostin on bone. J Mol Endocrinol 2019, 62, R167–R185. [Google Scholar] [CrossRef]
- Yu, S.; Li, D.; Zhang, N.; Ni, S.; Sun, M.; Wang, L.; Xiao, H.; Liu, D.; Liu, J.; Yu, Y.; et al. Drug discovery of sclerostin inhibitors. Acta Pharm Sin B 2022, 12, 2150–2170. [Google Scholar] [CrossRef]
- Mendoza-Villanueva, D.; Zeef, L.; Shore, P. Metastatic breast cancer cells inhibit osteoblast differentiation through the Runx2/CBFβ-dependent expression of the Wnt antagonist, sclerostin. Breast Cancer Research 2011, 13, 1–14. [Google Scholar] [CrossRef]
- Zhu, M.; Liu, C.; Li, S.; Zhang, S.; Yao, Q.; Song, Q. Sclerostin induced tumor growth, bone metastasis and osteolysis in breast cancer. Sci Rep 2017, 7, 11399. [Google Scholar] [CrossRef]
- Ideta, H.; Yoshida, K.; Okamoto, M.; Sasaki, J.; Kito, M.; Aoki, K.; Yoshimura, Y.; Suzuki, S.; Tanaka, A.; Takazawa, A. , et al. Antitumor Effect of Sclerostin against Osteosarcoma. Cancers (Basel) 2021, 13. [Google Scholar] [CrossRef] [PubMed]
- Hesse, E.; Schroder, S.; Brandt, D.; Pamperin, J.; Saito, H.; Taipaleenmaki, H. Sclerostin inhibition alleviates breast cancer-induced bone metastases and muscle weakness. JCI Insight 2019, 5. [Google Scholar] [CrossRef] [PubMed]
- Gkotzamanidou, M.; Dimopoulos, M.A.; Kastritis, E.; Christoulas, D.; Moulopoulos, L.A.; Terpos, E. Sclerostin: a possible target for the management of cancer-induced bone disease. Expert Opin Ther Targets 2012, 16, 761–769. [Google Scholar] [CrossRef] [PubMed]
- McDonald, M.M.; Delgado-Calle, J. Sclerostin: an Emerging Target for the Treatment of Cancer-Induced Bone Disease. Curr Osteoporos Rep 2017, 15, 532–541. [Google Scholar] [CrossRef]
- Schminke, B.; Shomroni, O.; Salinas, G.; Bremmer, F.; Kauffmann, P.; Schliephake, H.; Oyelami, F.; Rahat, M.A.; Brockmeyer, P. Prognostic factor identification by screening changes in differentially expressed genes in oral squamous cell carcinoma. Oral Dis 2021. [Google Scholar] [CrossRef]
- Heo, D.S.; Snyderman, C.; Gollin, S.M.; Pan, S.; Walker, E.; Deka, R.; Barnes, E.L.; Johnson, J.T.; Herberman, R.B.; Whiteside, T.L. Biology, cytogenetics, and sensitivity to immunological effector cells of new head and neck squamous cell carcinoma lines. Cancer Res 1989, 49, 5167–5175. [Google Scholar] [PubMed]
- Pijuan, J.; Barceló, C.; Moreno, D.F.; Maiques, O.; Sisó, P.; Marti, R.M.; Macià, A.; Panosa, A. In vitro cell migration, invasion, and adhesion assays: from cell imaging to data analysis. Frontiers in cell and developmental biology 2019, 7, 107. [Google Scholar] [CrossRef] [PubMed]
- Bankhead, P.; Loughrey, M.B.; Fernandez, J.A.; Dombrowski, Y.; McArt, D.G.; Dunne, P.D.; McQuaid, S.; Gray, R.T.; Murray, L.J.; Coleman, H.G.; et al. QuPath: Open source software for digital pathology image analysis. Sci Rep 2017, 7, 16878. [Google Scholar] [CrossRef] [PubMed]
- Goulding, H.; Pinder, S.; Cannon, P.; Pearson, D.; Nicholson, R.; Snead, D.; Bell, J.; Elston, C.; Robertson, J.; Blamey, R. A new immunohistochemical antibody for the assessment of estrogen receptor status on routine formalin-fixed tissue samples. Human pathology 1995, 26, 291–294. [Google Scholar] [CrossRef] [PubMed]
- Huang, W.; Yang, S.; Shao, J.; Li, Y.-P. Signaling and transcriptional regulation in osteoblast commitment and differentiation. Frontiers in bioscience: a journal and virtual library 2007, 12, 3068. [Google Scholar] [CrossRef] [PubMed]
- Shaw, R.J.; Brown, J.S.; Woolgar, J.A.; Lowe, D.; Rogers, S.N.; Vaughan, E.D. The influence of the pattern of mandibular invasion on recurrence and survival in oral squamous cell carcinoma. Head & Neck: Journal for the Sciences and Specialties of the Head and Neck 2004, 26, 861–869. [Google Scholar]
- Patel, R.S.; Dirven, R.; Clark, J.R.; Swinson, B.D.; Gao, K.; O'Brien, C.J. The prognostic impact of extent of bone invasion and extent of bone resection in oral carcinoma. The Laryngoscope 2008, 118, 780–785. [Google Scholar] [CrossRef]
- Brown, J.S.; Lowe, D.; Kalavrezos, N.; D'Souza, J.; Magennis, P.; Woolgar, J. Patterns of invasion and routes of tumor entry into the mandible by oral squamous cell carcinoma. Head & Neck: Journal for the Sciences and Specialties of the Head and Neck 2002, 24, 370–383. [Google Scholar]
- Fives, C.; Nae, A.; Roche, P.; O'Leary, G.; Fitzgerald, B.; Feeley, L.; Sheahan, P. Impact of mandibular invasion on prognosis in oral squamous cell carcinoma four centimeters or less in size. The Laryngoscope 2017, 127, 849–854. [Google Scholar] [CrossRef] [PubMed]
- Hoene, G.; Gruber, R.M.; Leonhard, J.J.; Wiechens, B.; Schminke, B.; Kauffmann, P.; Schliephake, H.; Brockmeyer, P. Combined quality of life and posttraumatic growth evaluation during follow-up care of patients suffering from oral squamous cell carcinoma. Mol Clin Oncol 2021, 15, 189. [Google Scholar] [CrossRef] [PubMed]
- Hoene, G.; Moser, N.; Schminke, B.; Wiechens, B.; Leha, A.; Khromov, T.; Schliephake, H.; Brockmeyer, P. Postoperative facial appearance of patients with extensive oral squamous cell carcinoma can be adequately preserved with in-house virtually planned mandibular reconstruction. Molecular and Clinical Oncology 2023, 19, 1–10. [Google Scholar] [CrossRef] [PubMed]
- Okura, M.; Yanamoto, S.; Umeda, M.; Otsuru, M.; Ota, Y.; Kurita, H.; Kamata, T.; Kirita, T.; Yamakawa, N.; Yamashita, T. Prognostic and staging implications of mandibular canal invasion in lower gingival squamous cell carcinoma. Cancer Medicine 2016, 5, 3378–3385. [Google Scholar] [CrossRef]
- Tada, T.; Jimi, E.; Okamoto, M.; Ozeki, S.; Okabe, K. Oral squamous cell carcinoma cells induce osteoclast differentiation by suppression of osteoprotegerin expression in osteoblasts. International journal of cancer 2005, 116, 253–262. [Google Scholar] [CrossRef]
- Takayama, Y.; Mori, T.; Nomura, T.; Shibahara, T.; Sakamoto, M. Parathyroid-related protein plays a critical role in bone invasion by oral squamous cell carcinoma. International journal of oncology 2010, 36, 1387–1394. [Google Scholar]
- Zureikat, A.H.; Beane, J.D.; Zenati, M.S.; Al Abbas, A.I.; Boone, B.A.; Moser, A.J.; Bartlett, D.L.; Hogg, M.E.; Zeh, H.J., 3rd. 500 Minimally Invasive Robotic Pancreatoduodenectomies: One Decade of Optimizing Performance. Ann Surg 2021, 273, 966–972. [Google Scholar] [CrossRef]
- An, Y.-Z.; Cho, E.; Ling, J.; Zhang, X. The Axin2-snail axis promotes bone invasion by activating cancer-associated fibroblasts in oral squamous cell carcinoma. BMC cancer 2020, 20, 1–11. [Google Scholar] [CrossRef]
- Guise, T.A.; Mohammad, K.S.; Clines, G.; Stebbins, E.G.; Wong, D.H.; Higgins, L.S.; Vessella, R.; Corey, E.; Padalecki, S.; Suva, L. Basic mechanisms responsible for osteolytic and osteoblastic bone metastases. Clinical cancer research 2006, 12, 6213s–6216s. [Google Scholar] [CrossRef]
- Lu, X.; Wang, Q.; Hu, G.; Van Poznak, C.; Fleisher, M.; Reiss, M.; Massagué, J.; Kang, Y. ADAMTS1 and MMP1 proteolytically engage EGF-like ligands in an osteolytic signaling cascade for bone metastasis. Genes & development 2009, 23, 1882–1894. [Google Scholar]
- He, Y.; Luo, W.; Liu, Y.; Wang, Y.; Ma, C.; Wu, Q.; Tian, P.; He, D.; Jia, Z.; Lv, X. IL-20RB mediates tumoral response to osteoclastic niches and promotes bone metastasis of lung cancer. The Journal of Clinical Investigation 2022, 132. [Google Scholar] [CrossRef] [PubMed]
- Yang, Z.; Yue, Z.; Ma, X.; Xu, Z. Calcium homeostasis: a potential vicious cycle of bone metastasis in breast cancers. Frontiers in oncology 2020, 10, 293. [Google Scholar] [CrossRef]
- Yu, L.; Sui, B.; Fan, W.; Lei, L.; Zhou, L.; Yang, L.; Diao, Y.; Zhang, Y.; Li, Z.; Liu, J. Exosomes derived from osteogenic tumor activate osteoclast differentiation and concurrently inhibit osteogenesis by transferring COL1A1-targeting miRNA-92a-1-5p. Journal of extracellular vesicles 2021, 10, e12056. [Google Scholar] [CrossRef] [PubMed]
- Bodenstine, T.M.; Beck, B.H.; Cao, X.; Cook, L.M.; Ismail, A.; Powers, J.K.; Mastro, A.M.; Welch, D.R. Pre-osteoblastic MC3T3-E1 cells promote breast cancer growth in bone in a murine xenograft model. Chinese journal of cancer 2011, 30, 189. [Google Scholar] [CrossRef]
- Wijenayaka, A.R.; Kogawa, M.; Lim, H.P.; Bonewald, L.F.; Findlay, D.M.; Atkins, G.J. Sclerostin stimulates osteocyte support of osteoclast activity by a RANKL-dependent pathway. PloS one 2011, 6, e25900. [Google Scholar] [CrossRef] [PubMed]
- Katz, L.H.; Li, Y.; Chen, J.-S.; Muñoz, N.M.; Majumdar, A.; Chen, J.; Mishra, L. Targeting TGF-β signaling in cancer. Expert opinion on therapeutic targets 2013, 17, 743–760. [Google Scholar] [CrossRef]
- Fabre, S.; Funck-Brentano, T.; Cohen-Solal, M. Anti-sclerostin antibodies in osteoporosis and other bone diseases. Journal of clinical medicine 2020, 9, 3439. [Google Scholar] [CrossRef]
- Chung, Y.; Lee, S.; Lee, S.-Y.; Kim, S.-Y.; Kim, H.-H.; Mirza, F.; Lee, S.-K.; Lorenzo, J.; Kim, G.; Koh, J.-M. Long-term treatment with raloxifene, but not bisphosphonates, reduces circulating sclerostin levels in postmenopausal women. Osteoporosis International 2012, 23, 1235–1243. [Google Scholar] [CrossRef]
Figure 1.
Illustration of the Boyden chamber assay used for migration, invasion, and co-cultivation experiments.
Figure 1.
Illustration of the Boyden chamber assay used for migration, invasion, and co-cultivation experiments.
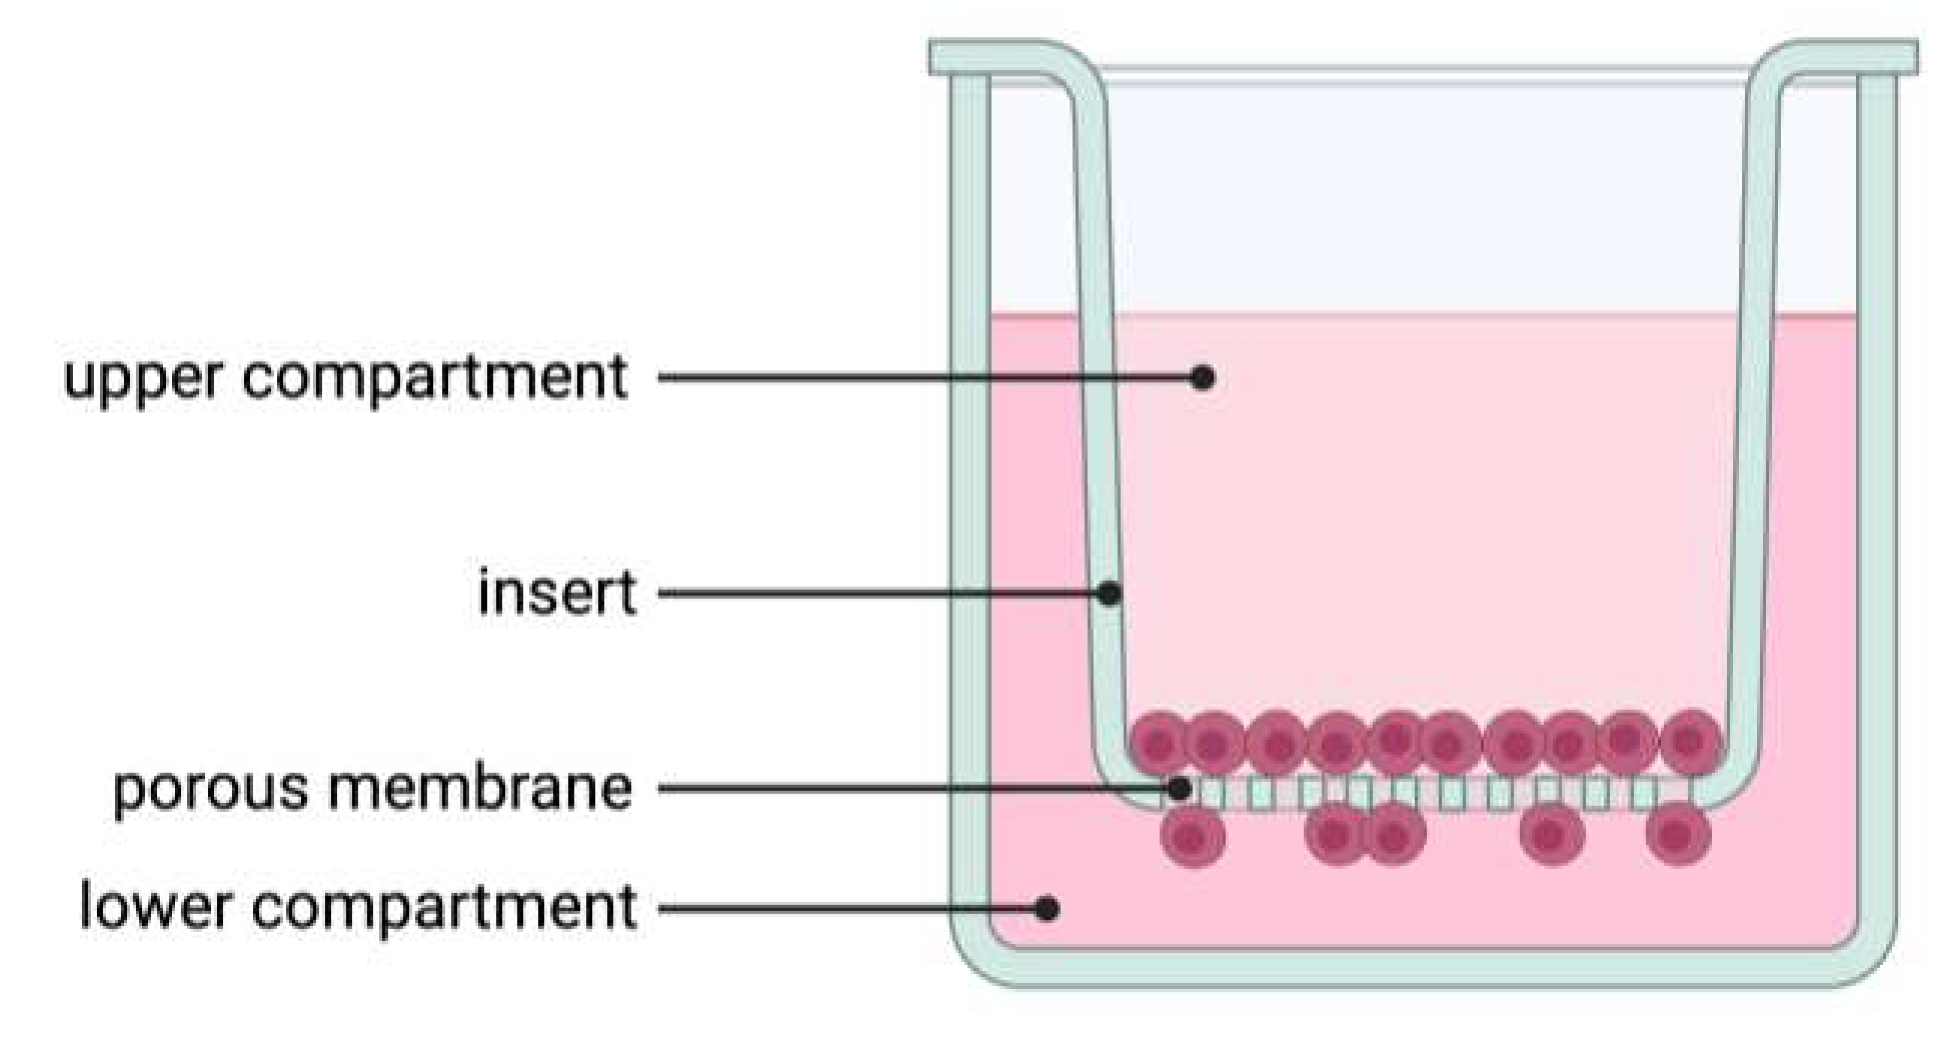
Figure 2.
Illustration of the scratch assay performed to verify migration characteristics for the PCI-13 OSCC tumor cell line with (1 and 5 ng/ml) and without (0 ng/ml, control) sclerostin treatment.
Figure 2.
Illustration of the scratch assay performed to verify migration characteristics for the PCI-13 OSCC tumor cell line with (1 and 5 ng/ml) and without (0 ng/ml, control) sclerostin treatment.
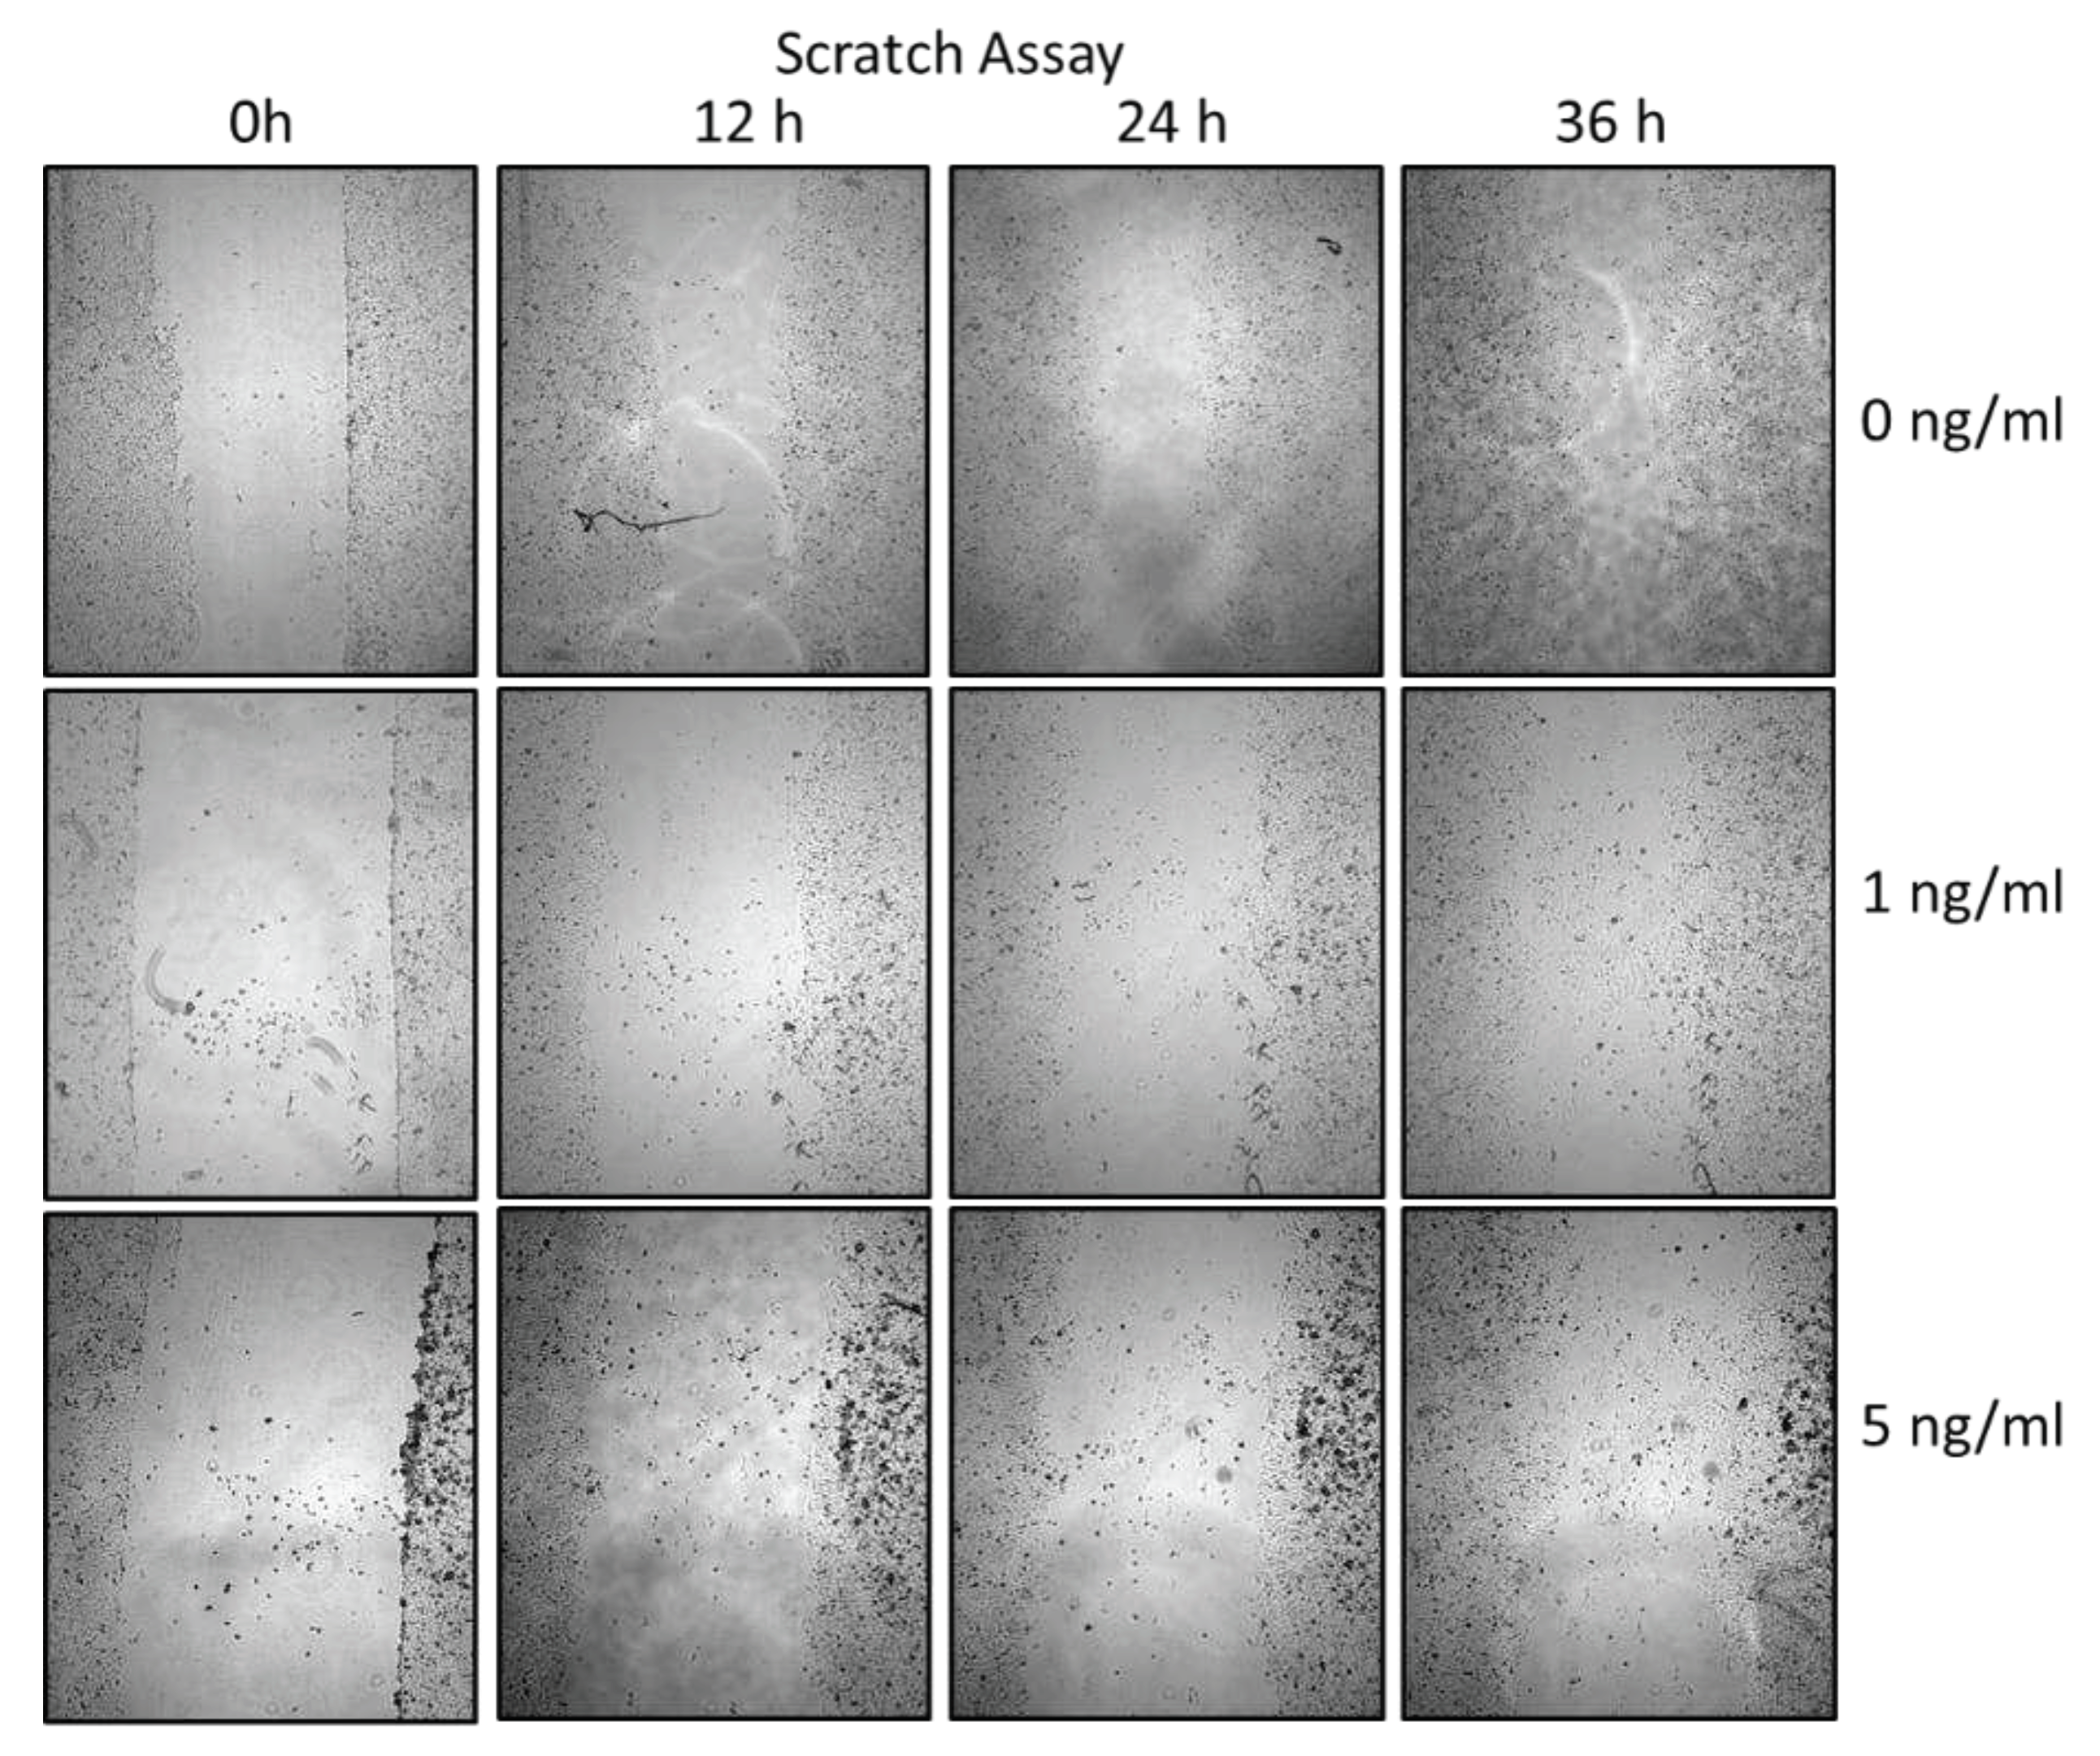
Figure 3.
Graphical representation of the averaged CT values from the qRT-PCR experiments for the two different OSCC tumor cell lines (SCC-040 and PCI-13). Higher CT values indicate low sclerostin expression, while lower values indicate higher expression.
Figure 3.
Graphical representation of the averaged CT values from the qRT-PCR experiments for the two different OSCC tumor cell lines (SCC-040 and PCI-13). Higher CT values indicate low sclerostin expression, while lower values indicate higher expression.
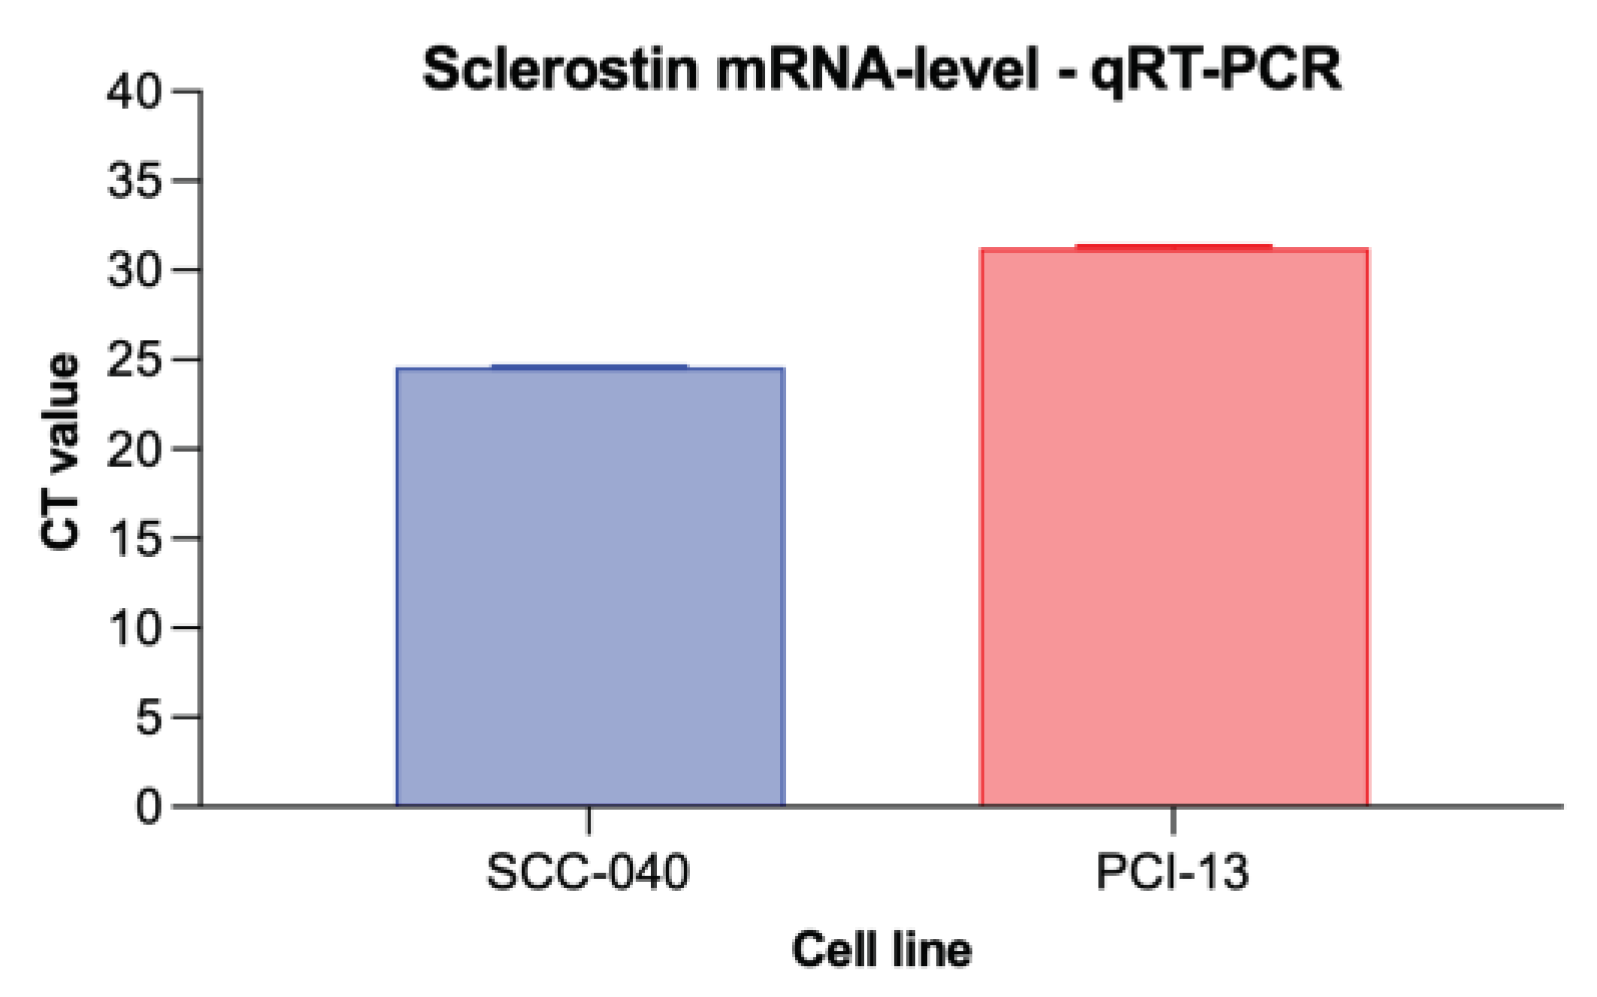
Figure 4.
Graphical representation of the relative mRNA expression from the qRT-PCR experiments for the different osteogenesis markers ALPL, COL1A1, osteocalcin, osteopontin, osterix, Runx2 as well as sclerostin expression. undifferentiated hMSCs served as controls, GAPDH as internal housekeeping gene.
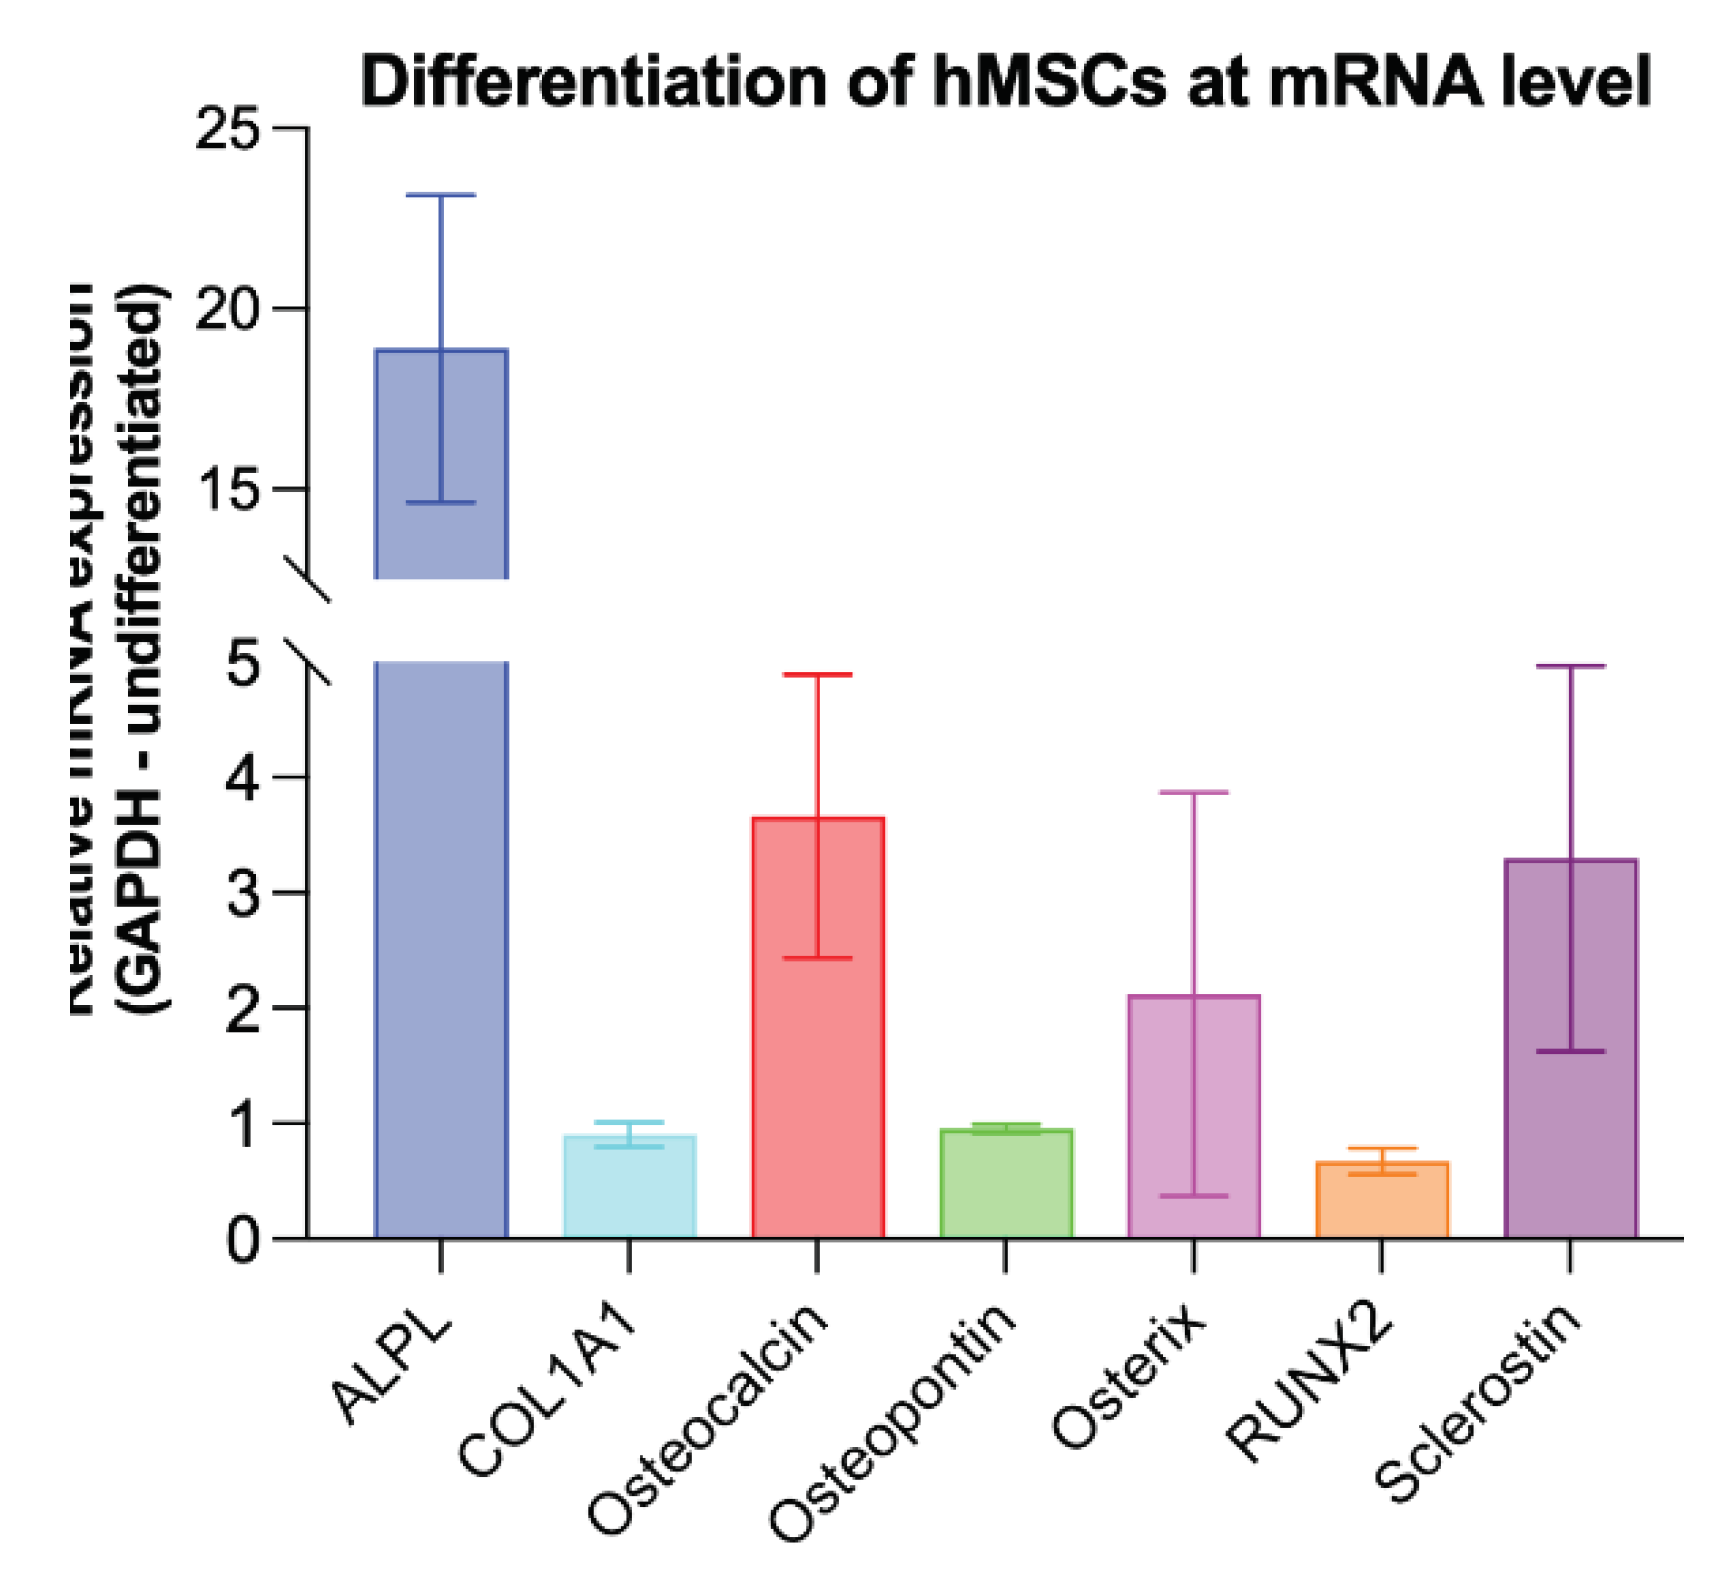
Figure 5.
Illustration of tumor cell proliferation under sclerostin treatment at different concentrations (1, 5, and 10 ng/ml) and time periods (24h, 36h, 48h, 60h, and 72h). Untreated tumor cells (0 ng/ml) were used as controls: (a) SCC-040 cell line; (b) PCI-13 cell line. Statistical test: One-way ANOVA, * indicates p-values between 0.01 and 0.05 (significant), ** indicates p-values between 0.001 and 0.01 (very significant).
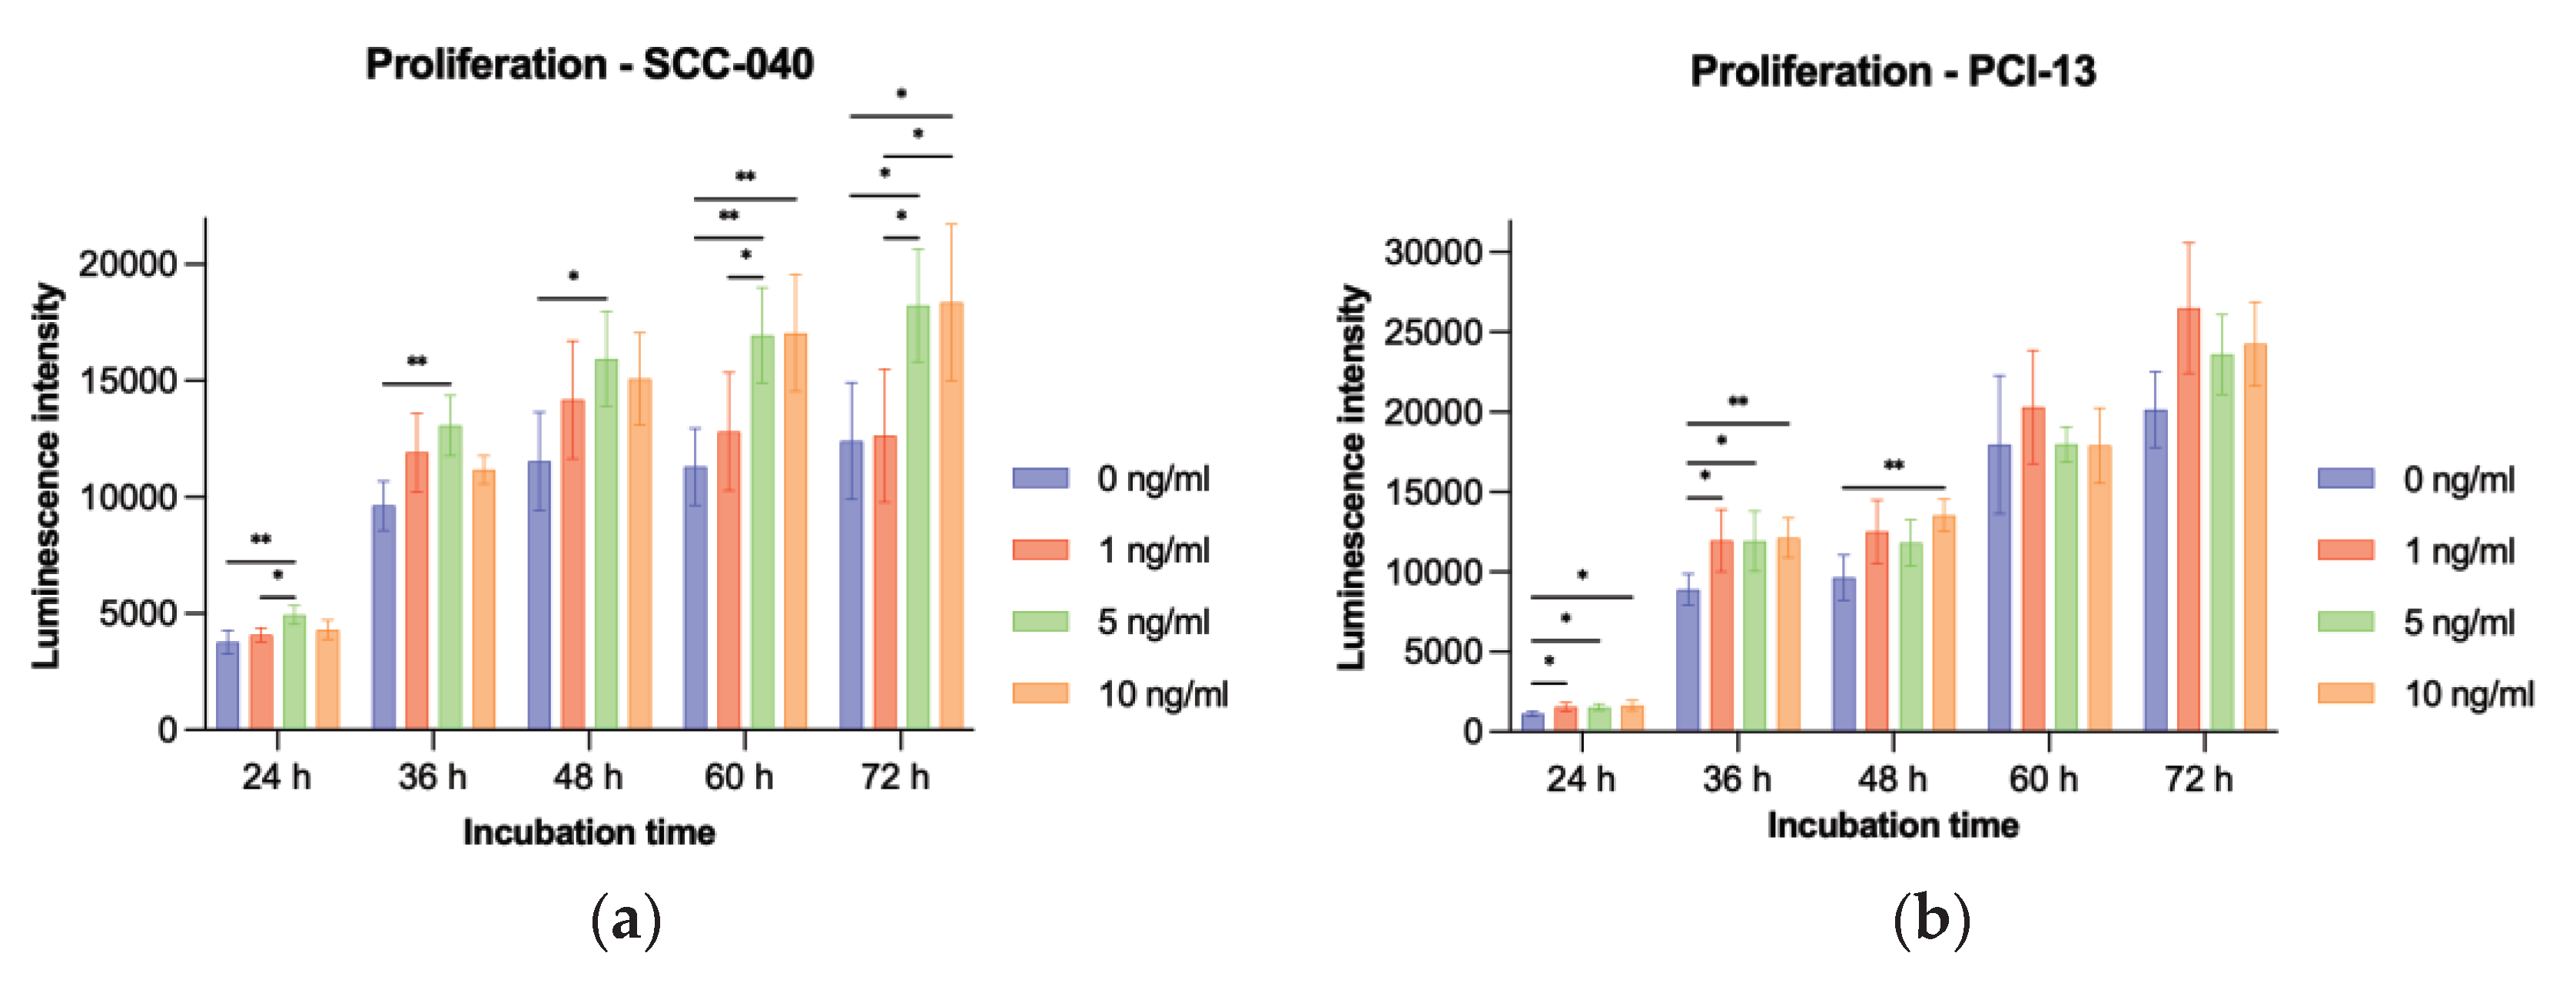
Figure 6.
Illustration of PCI-13 tumor cell migration and invasion after 24 hours under sclerostin treatment at different concentrations (1 and 5 ng/ml). Untreated tumor cells (0 ng/ml) were used as controls: (a) Migration of PCI-13 tumor cells; (b) Invasion of PCI-13 tumor cells. Statistical test: One-way ANOVA, ** indicates p-values between 0.001 and 0.01 (very significant), **** indicates p-values < 0.0001 (extremely significant).
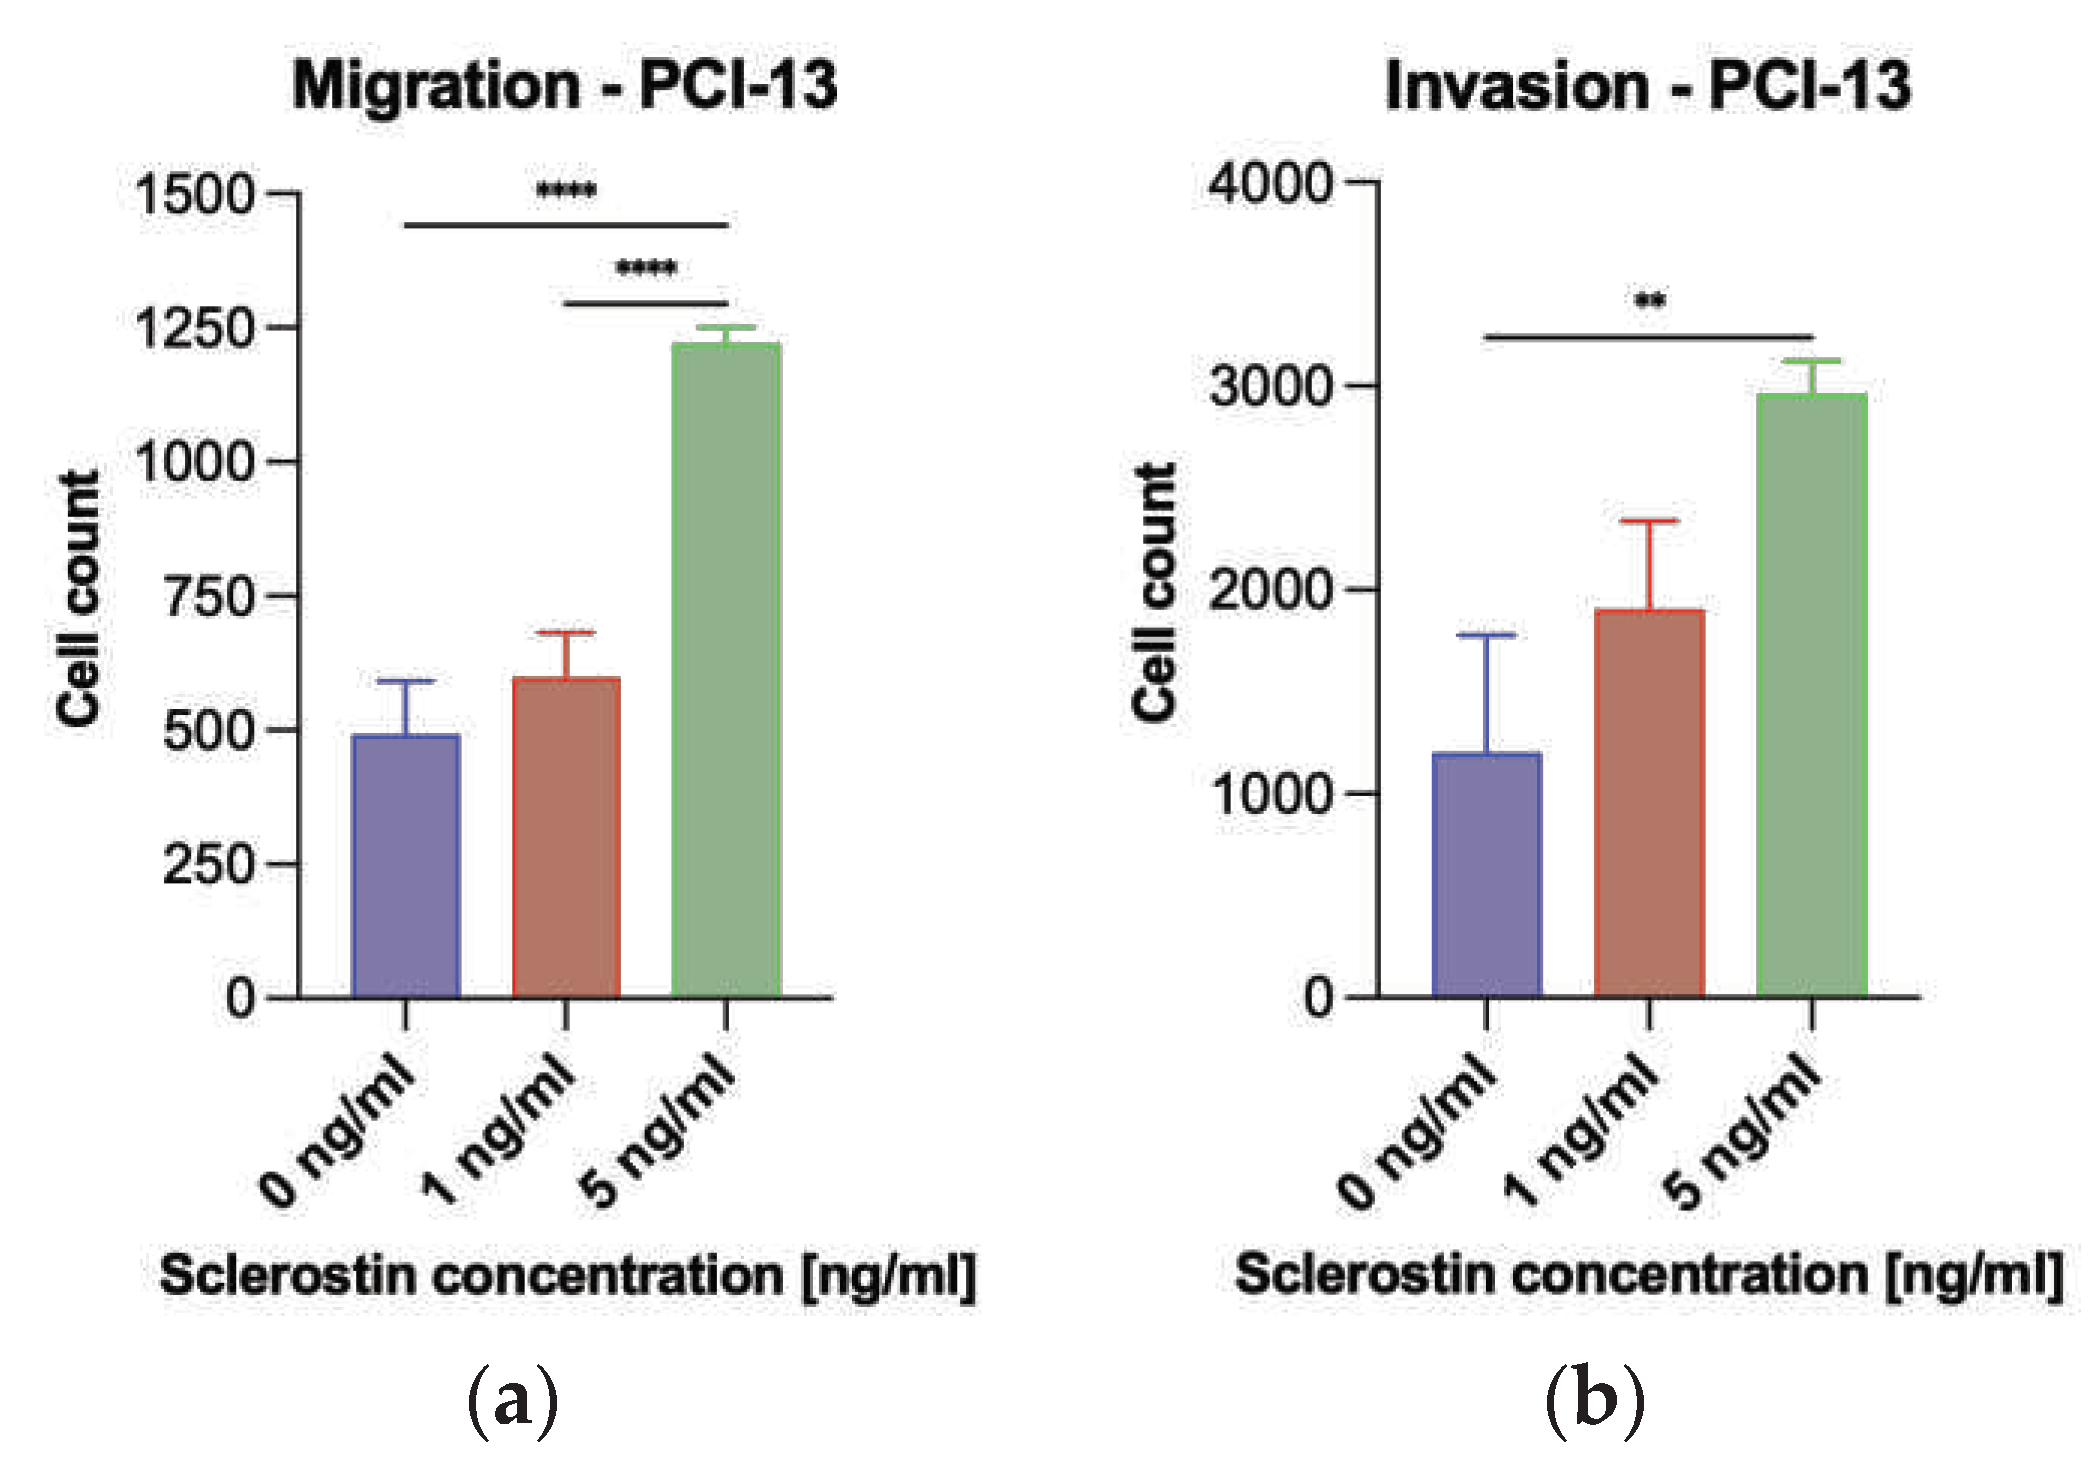
Figure 7.
Scratch assay to visualize the migration rate of PCI-13 tumor cells under sclerostin treatment at different concentrations (1 and 5 ng/ml) over different time periods (0h, 12h, 24h, 36h, 41h, 54h, and 60h).
Figure 7.
Scratch assay to visualize the migration rate of PCI-13 tumor cells under sclerostin treatment at different concentrations (1 and 5 ng/ml) over different time periods (0h, 12h, 24h, 36h, 41h, 54h, and 60h).
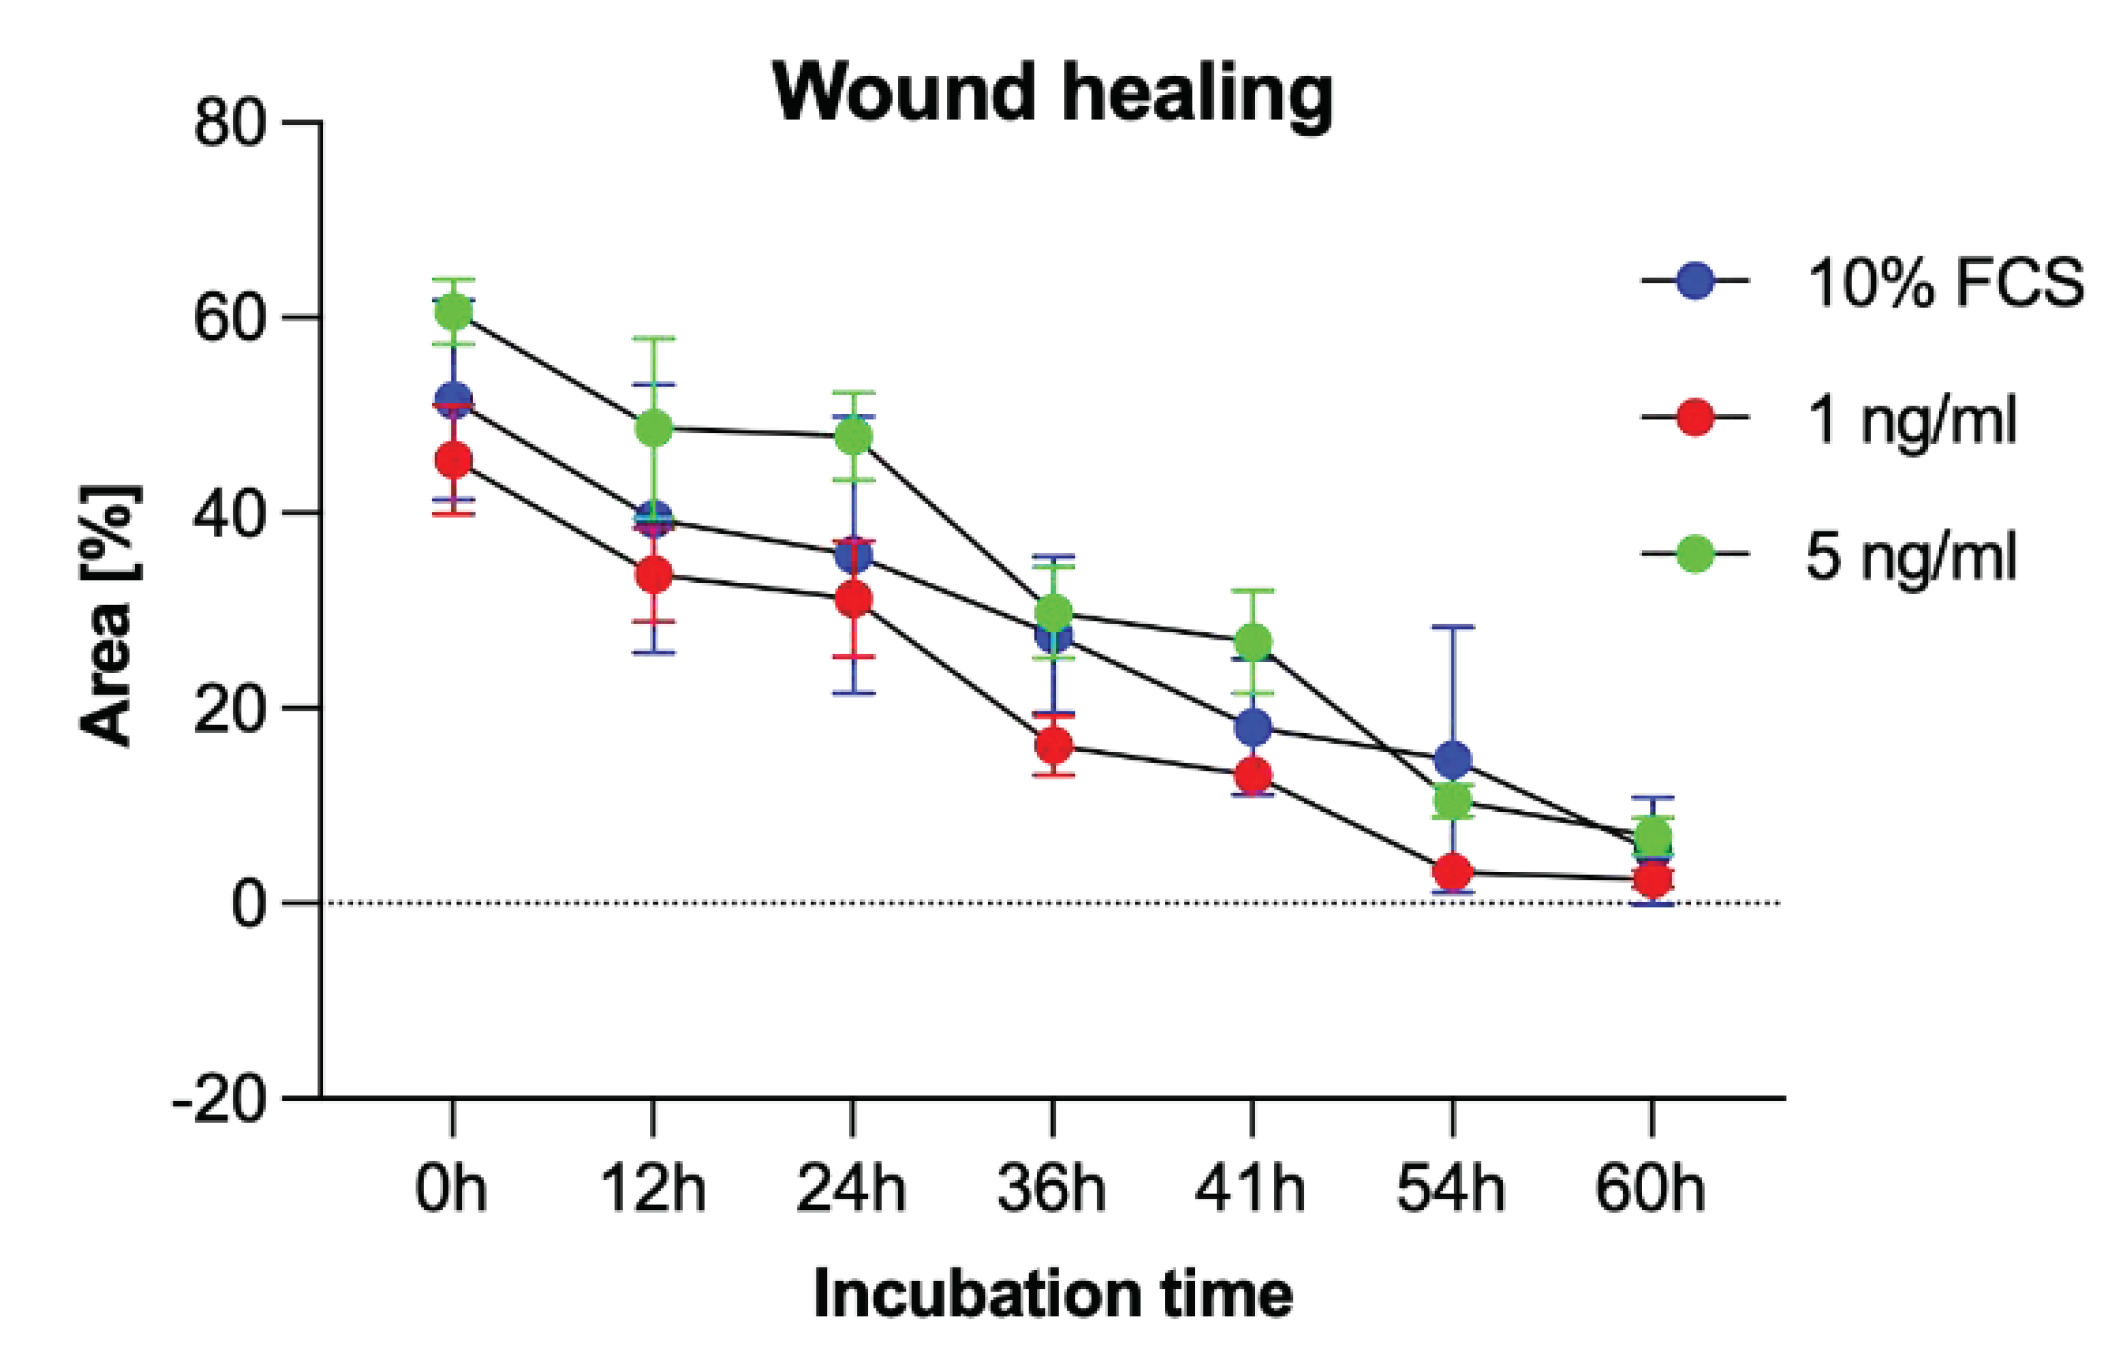
Figure 8.
Illustration of the migration rate of PCI-13 tumor cells in co-culture with osteogenic differentiated and undifferentiated hMSCs as well as in monoculture treated with differentiation medium. Monocultured PCI-13 cells in normal cell culture medium serve as control. Statistical test: One-way ANOVA, * indicates p-values between 0.01 and 0.05 (significant).
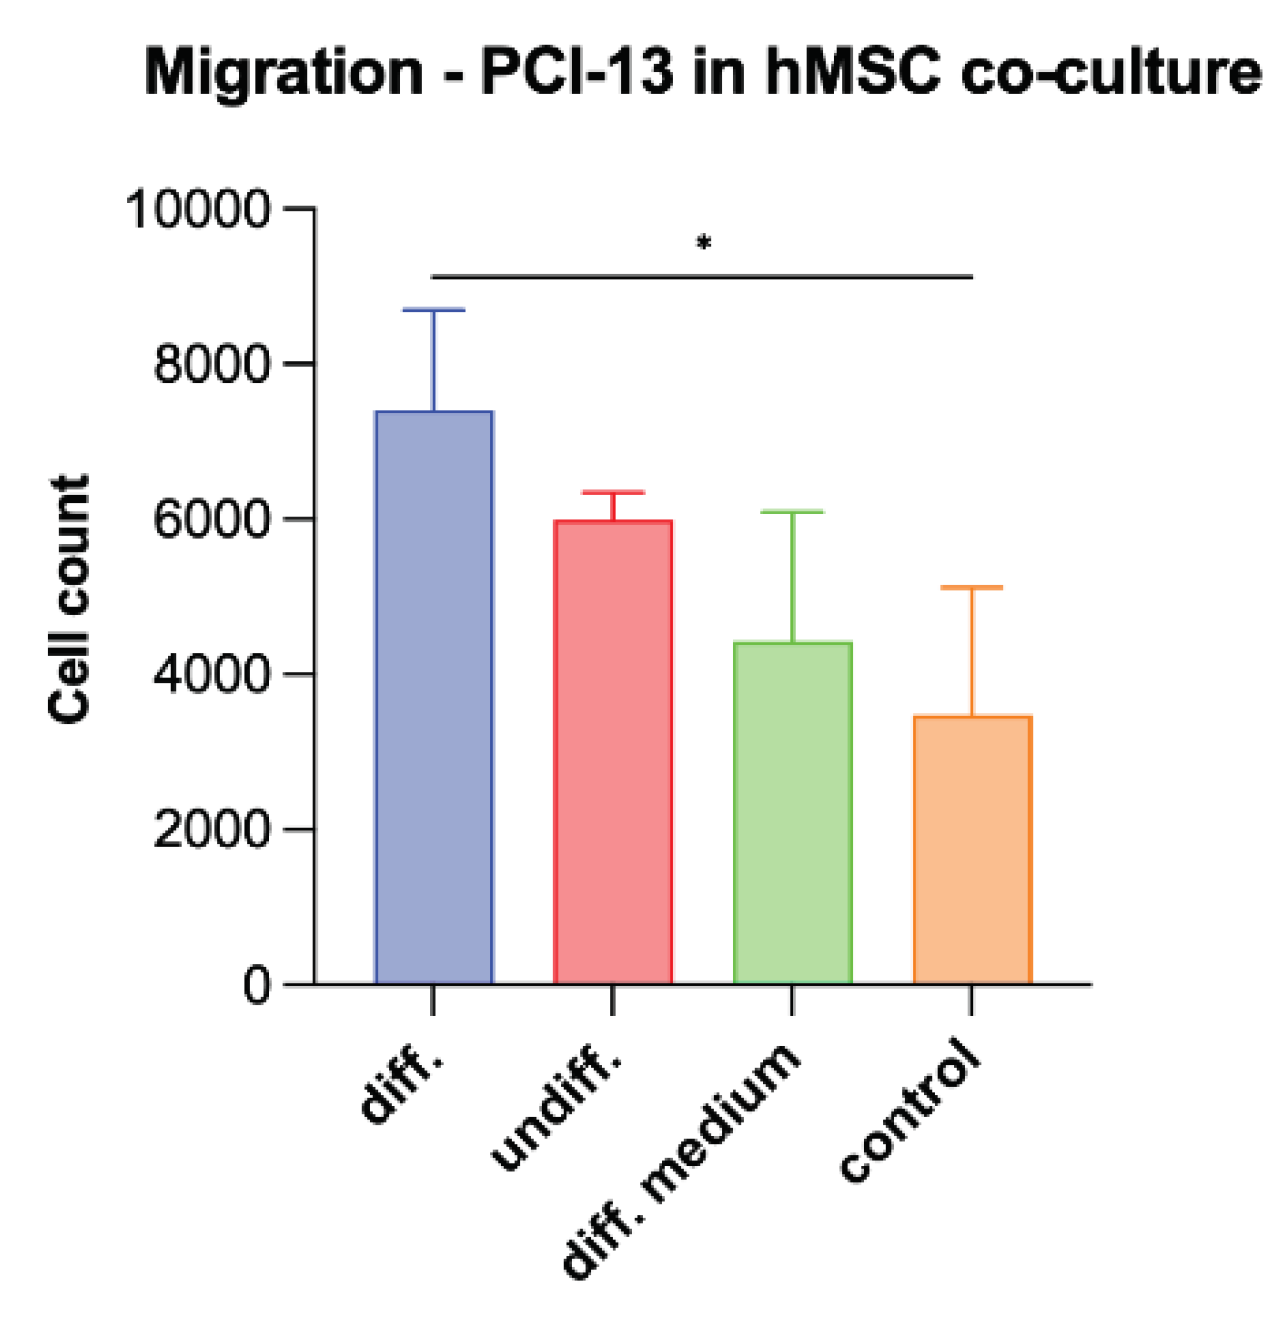
Figure 9.
Representation of the OSCC jawbone interface, sclerostin immunohistochemistry. (A) Overview of the boundary between the local jawbone and the surrounding tumor cell clusters of OSCC; (B) Enlarged view; (C) Highly magnified image of direct tumor cell-bone contact with osteolysis lacunae; (D) Visualization of multinucleated osteoclasts within osteolysis lacunae (OL).
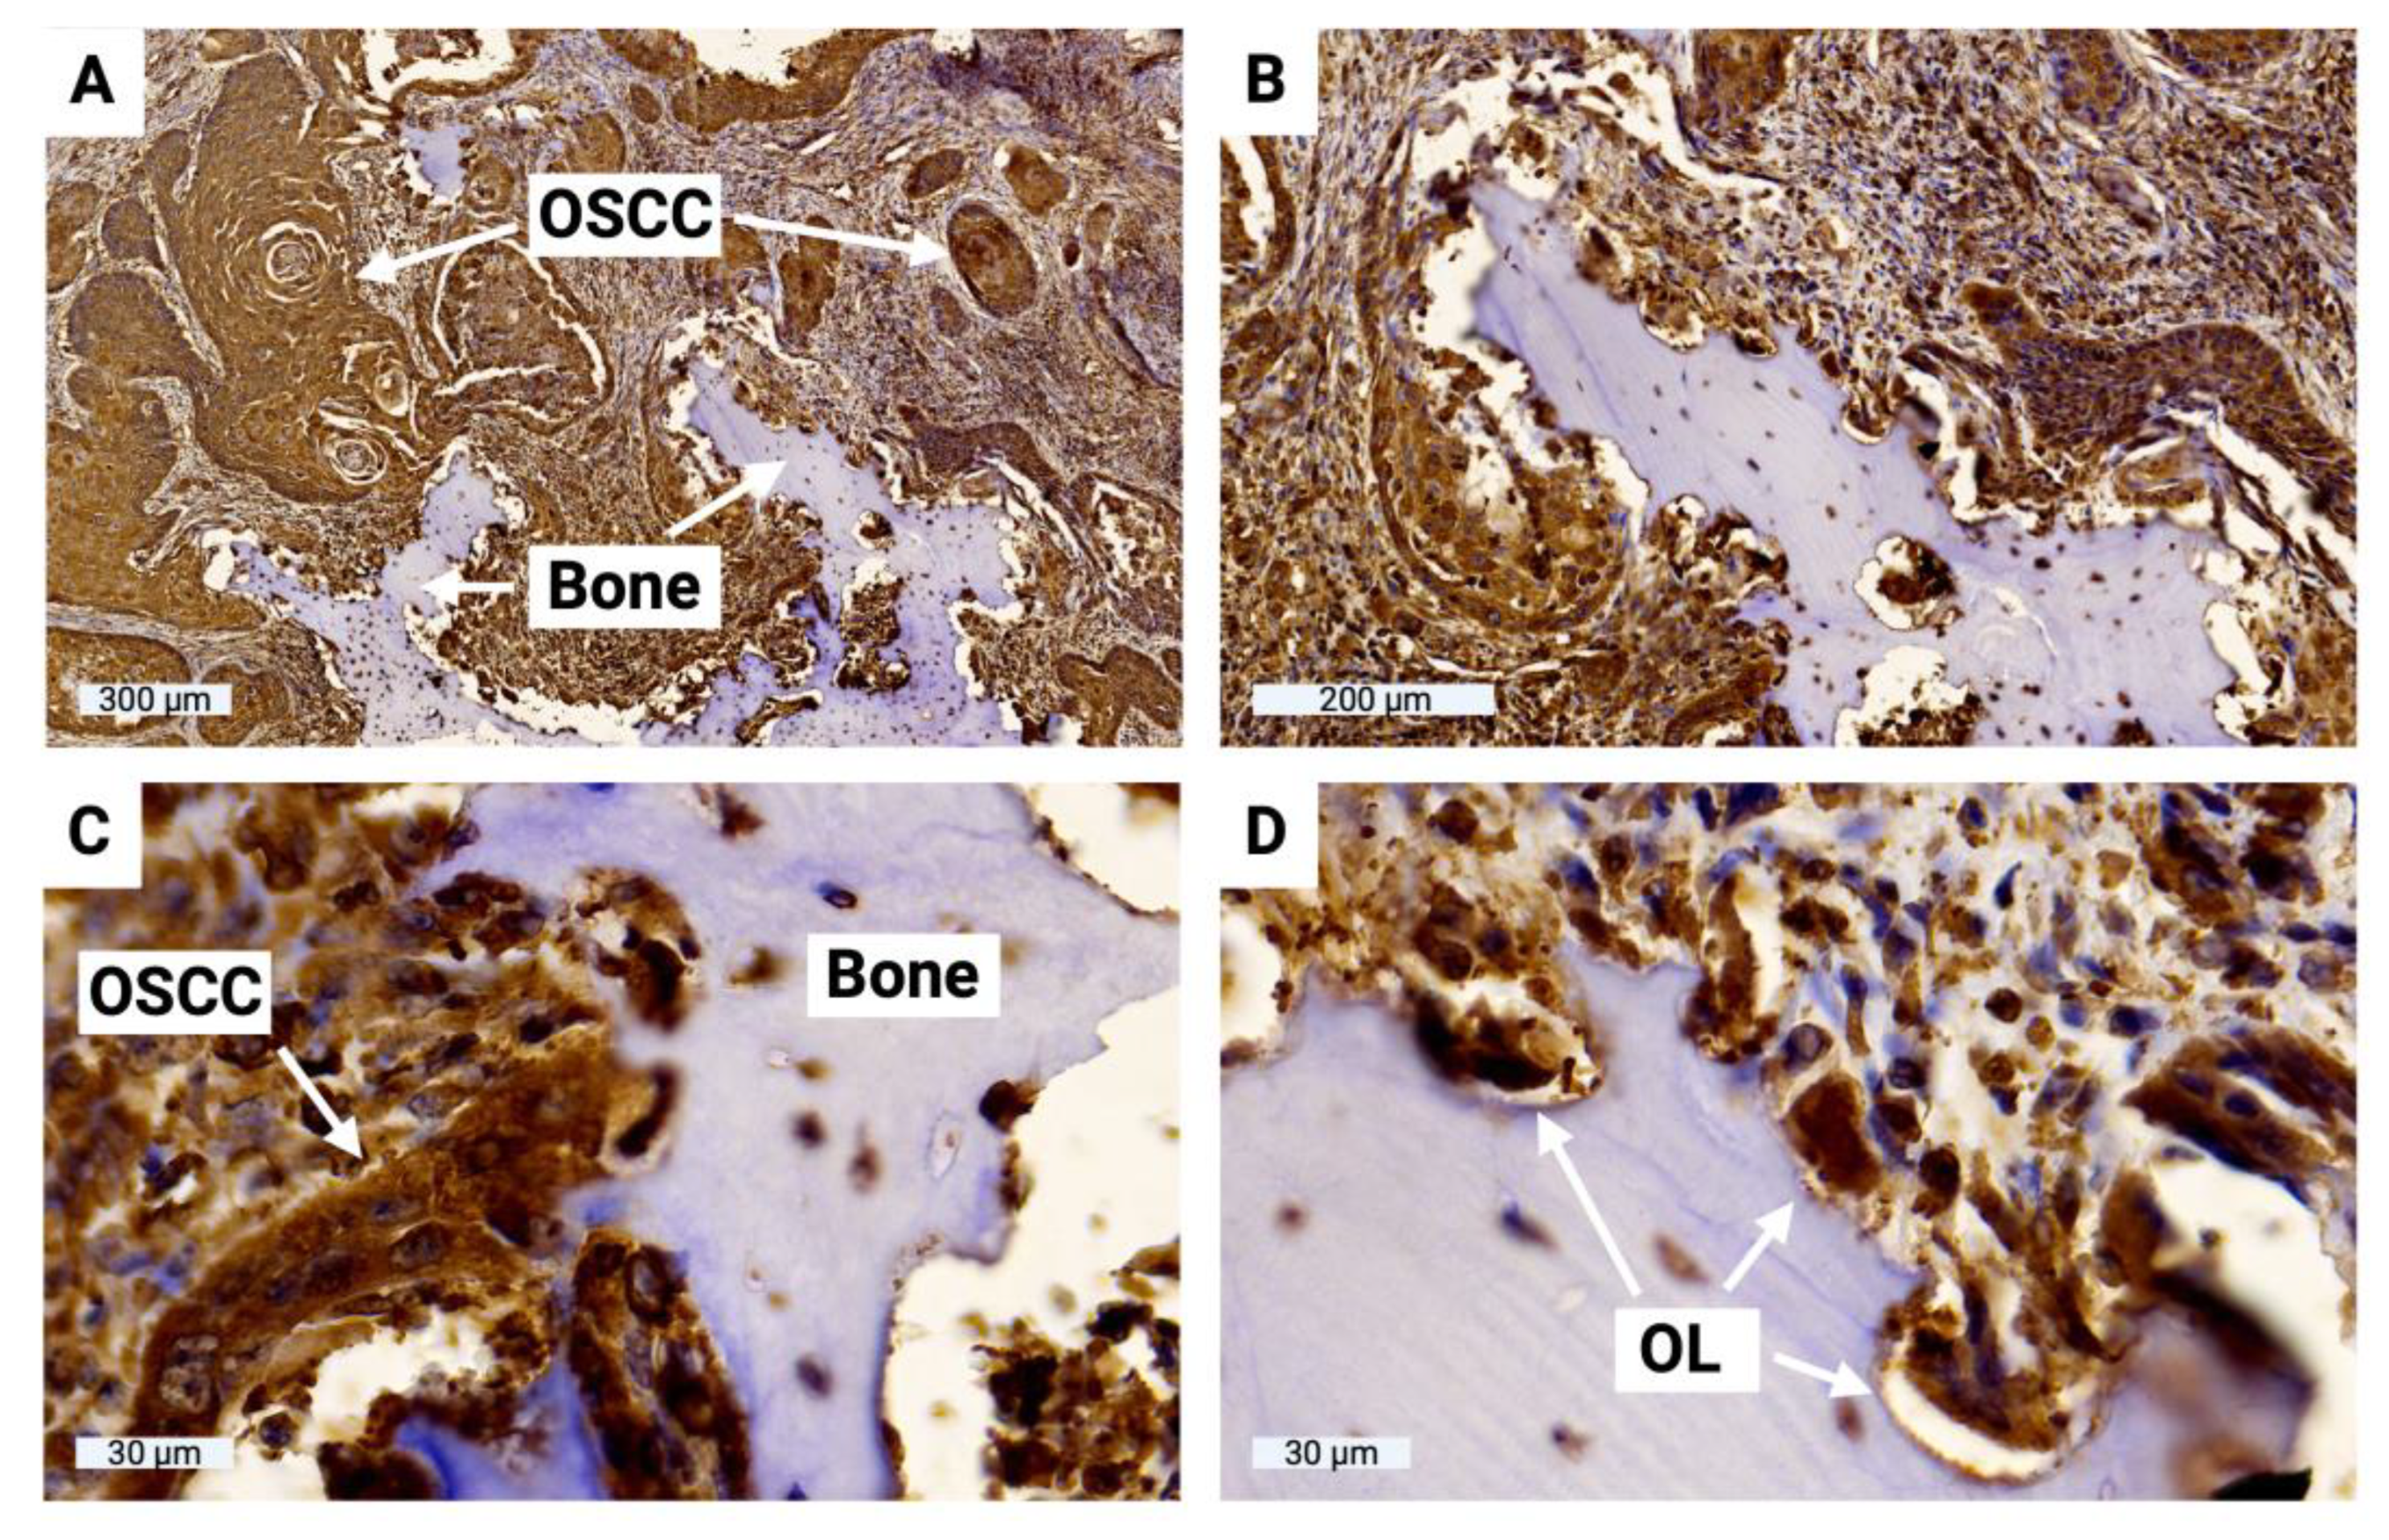

Table 1.
Clinical patient characteristics and H-score values derived from semiquantitative immunohistochemical evaluation of sclerostin expression at the OSCC jawbone interface. H-score values range from 0 to 300, with 0 indicating that no cells are positive and 300 indicating that all cells are strongly positive.
| Sex | Age | Localization | pT | pN | pM | Grading | AJCC Stage | H-score |
|---|---|---|---|---|---|---|---|---|
| Male | 65 | Gum | 4a | 0 | 0 | 1 | IVA | 61 |
| Female | 54 | Gum | 4a | 2b | 0 | 2 | IVA | 93 |
| Male | 67 | Gum | 4a | 0 | 0 | 2 | IVA | 120 |
| Male | 59 | Cheek mucosa | 4a | 3b | 0 | 3 | IVB | 112 |
| Female | 65 | Gum | 4a | 0 | 0 | 2 | IVA | 109 |
| Female | 81 | Gum | 4a | 0 | 0 | 2 | IVA | 61 |
| Female | 72 | Floor of mouth | 4a | 2c | 0 | 2 | IVA | 105 |
| Female | 75 | Gum | 3 | 2b | 0 | 3 | IVA | 92 |
| Male | 63 | Gum | 4a | 2b | 0 | 2 | IVA | 84 |
| Female | 86 | Gum | 4a | 0 | 0 | 2 | IVA | 107 |
| Male | 77 | Gum | 2 | 0 | 0 | 2 | II | 60 |
| Male | 76 | Palate | 4a | 0 | 0 | 2 | IVA | 81 |
| Male | 81 | Gum | 3 | 2b | 0 | 2 | IVA | 94 |
| Female | 48 | Palate | 4a | 2b | 0 | 2 | IVA | 100 |
| Male | 56 | Floor of mouth | 4a | 2c | 0 | 2 | IVA | 127 |
Table 2.
Immunhistochemical staining protocol.
| Antigen | Antibody | Pretreatment | Detection Method | Source |
|---|---|---|---|---|
| Sclerostin | Mouse, monoclonal, clone AbD09097_h/mIgG 2a, 1:1200 | HIER (pH 9) | Dako EnVision FLEX | BioRad (HCA230Z) |
Disclaimer/Publisher’s Note: The statements, opinions and data contained in all publications are solely those of the individual author(s) and contributor(s) and not of MDPI and/or the editor(s). MDPI and/or the editor(s) disclaim responsibility for any injury to people or property resulting from any ideas, methods, instructions or products referred to in the content. |
© 2023 by the authors. Licensee MDPI, Basel, Switzerland. This article is an open access article distributed under the terms and conditions of the Creative Commons Attribution (CC BY) license (http://creativecommons.org/licenses/by/4.0/).
Copyright: This open access article is published under a Creative Commons CC BY 4.0 license, which permit the free download, distribution, and reuse, provided that the author and preprint are cited in any reuse.


