
Submitted:
11 December 2023
Posted:
12 December 2023
You are already at the latest version
Abstract
Thermoplastic composites are continuously replacing thermosetting composites in lightweight structures. However, the accomplished work on the fatigue behavior of thermoplastics is quite limited. In the present work, we propose a numerical modeling approach for simulating fatigue delamination growth and predicting the residual tensile strength of quasi-isotropic TC 1225 LM PAEK thermoplastic coupons. The approach is supported and validated by tension and fatigue (non-interrupted and interrupted) tests. Fatigue delamination growth is simulated using a mixed-mode fatigue crack growth model, which is based on the cohesive zone modeling method. All interfaces between the thermoplastic plies were modelled using cohesive elements. Quasi-static tension analyses on pristine and fatigued coupons were performed using a progressive damage model implementing a set of Hashin-type strain-based failure criteria and a damage mechanics-based material property degradation module. Using the fatigue model, delamination growth was predicted as a function of number of cycles at all interfaces. The results agree well with C-scan images taken on fatigued coupons during interruptions of fatigue tests. An unequal and unsymmetric delamination growth was predicted due to the quasi-isotropic lay-up. Moreover, the combined models capture the decrease in the residual tensile strength of the coupons. In the quasi-static tension analysis of the fatigued coupons, the driving failure mechanisms are the fast propagation of the pre-existing delamination and the severe matrix cracking.
Keywords:
Thermoplastic composites
; Delamination
; Residual strength
; Cohesive zone modeling
; Progressive damage modeling
; Finite element analysis
1. Introduction
Composite materials and especially Carbon Fiber Reinforced Plastics (CFRPs) have become the major structural material in aerospace applications [1]. Although in most applications thermoset CFRPs have been used, thermoplastics find an increasing use due to specific characteristics such as the increased impact performance, the recyclability, and the weldability. However, the benefits of thermoplastics in the weight reduction and the lowering of recurring costs in aircraft production can be achieved only by the integration of several disciplines and the production of large integral parts. This means that focusing on small parts alone cannot achieve the full benefit of thermoplastic technology. In 2019, the Clean Sky 2 project STUNNING (Next Generation Multifunctional Fuselage Demonstrator) (https://www.clean-aviation.eu/media/results-stories/the-next-generation-multifunctional-fuselage-demonstrator-leveraging-thermoplastics-for-cleaner), aiming to build an 8-meter long narrow-body airliner fuselage from thermoplastic composites, was launched. After four years of development, a full thermoplastic fuselage part has been built using innovative manufacturing methods and incorporating novel joining techniques such as welding and co-consolidation. Characterization of the mechanical performance of the fuselage part is scheduled for the next phase of the program. In this process, the availability of efficient numerical models capable for simulating fatigue damage and predicting the residual strength of thermoplastics and their joints is of crucial importance as it could lead to a significant reduction of characterization time and cost.
Delamination, together with matrix cracking, are the primary fatigue failure modes in CFRPs, especially for high cycle fatigue. It is therefore very important to be able to simulate fatigue delamination propagation in CFRPs. Contrary to thermoset CFRPs, there have been reported only a few experimental and numerical works on delamination of thermoplastics; most of them have considered quasi-static loads. In the first effort, O’Brien [2] has conducted delamination tension fatigue tests on AS4/PEEK composite laminates. Uematsu et al. [3] have studied experimentally the behavior of delamination crack propagation of a carbon-fiber-reinforced thermoplastic polymer at high temperatures. Lachaud et al. [4] have conducted experimental and numerical studies of delamination caused by local buckling on thermoset and thermoplastic carbon-fibre composites. Zhou et al. [5] have described the mode I delamination behaviour of a unidirectional carbon-fibre/polyphenyleneetherketone (PEK-C) composite experimentally. Dube et al. [6] have performed an experimental investigation characterising the fatigue failure mechanisms of resistance-welded thermoplastic composites skin/stringer joints. Delamination has been found to be a major failure mechanism of the joints. Ruzek et al. [7] have conducted an experimental investigation of the effects of the loading frequency on the temperature change, fatigue behaviour, and failure mechanisms of carbon-fibre-fabric-reinforced polyphenylenesulphide (PPS) laminates, the thicknesses of which were varied by ply drops.
The numerical works are much less than the experimental ones and they have mainly considered quasi-static and impact loads. Keiichi et al. [8] have investigated the stress-strain response and the damage initiation/propagation mechanisms of the T700G/LM-PAEK material, in an open-hole configuration, experimentally and numerically. Liu et al. [9] have developed 3D FE models using the LS-DYNA program to study the effects of impact energy, ply angle and interfacial strength on the low-velocity impact performance of thermoplastic laminates. Sun et al. [10] have made comparisons between experimental and numerical studies of low-velocity impact damage for thermoplastic (IM7/PEEK) composites. Three LS-DYNA FE models (standard, continuum damage mechanics (CDM) and discrete) were developed, all using cohesive interface elements for delamination. Recently, Sioutis and Tserpes [11] have developed a fatigue interfacial crack growth model based on the cohesive zone modeling method which has been proven capable of efficiently simulating fatigue interfacial fracture of co-consolidated thermoplastic joints. Provided the co-consolidated interfaces have the same mechanical performance with the ply interfaces, the model of [11] could be used for simulating fatigue delamination of thermoplastic coupons.
The objective of the present paper is twofold: to examine whether the model of [9] could be used for simulating fatigue delamination propagation and to combine the fatigue model with quasi-static progressive damage models to develop a tool capable of predicting the residual tensile strength of thermoplastic coupons which when upscaled it may be used in the characterization process and the damage tolerant design of thermoplastic structures.
2. Experimental methods
The composite coupons were made from thermoplastic TC 1225 LM PAEK prepreg plies with a fiber volume fraction of 66%. The coupons were approximately 250 mm long, 25 mm wide and 2.24 thick. Tabs from the same material with dimensions of 50 mm x 25 mm x 2.24 mm were bonded to the coupons. The 0.14 mm-thick plies were stacked in a quasi-isotropic stacking sequence following a lay-up of [-45/0/45/90]2s [12].
Tension tests were conducted according to the ASTM D3039 standard [13] and fatigue tests according to the ASTM D3479 standard [14]. All tests were conducted using an MTS Universal Testing machine with a load cell of 100 kN and a data acquisition program. Tension tests were conducted in displacement control at a 0.5 mm/min loading rate. Fatigue tests were conducted in force control using a frequency of 5 Hz, a stress ratio of 0.1 and a maximum stress equal to 0.6 of the static strength.
The following test series were conducted:
- Five coupons were tested in tension to characterize the reference tensile behavior of the thermoplastic material.
- Five coupons were tested in fatigue to characterize the reference tension-tension fatigue behavior of the thermoplastic material.
- Six specimens were subjected to fatigue up to cycles equal to 0.1, 0.2, 0.3, 0.4, 0.5 and 0.6 of the average fatigue life of the coupons.
- The six fatigued coupons were tested in tension to measure the residual tensile stiffness and strength of the coupons.
3. Modelling approach
The adopted modeling approach is based on the work of Tserpes et al. [15]. It combines a quasi-static progressive damage model (PDM) [16,17], the cohesive zone modeling (CZM) method and a fatigue interfacial crack growth model [11]. The PDM is used to simulate intralaminar damage and the CZM method together with the fatigue crack growth model to simulate fatigue delamination. The execution of the models follows the experimental procedure described in Section 2. Initially, the PDM is used to simulate the tensile behavior of the thermoplastic material. Then, the fatigue crack growth model is used to simulate fatigue delamination. Finally, the PDM is used to predict the residual tensile strength of the thermoplastic coupons at various fatigue delamination states. At all stages, the numerical results are compared with the experimental ones for the models’ validation.
4. Numerical models
4.1. Quasi-static progressive damage model
To simulate the tensile behavior of the thermoplastic coupons, a progressive damage model (PDM) was used. The PDM was realized through the material model MAT-162 [18] of the LS-Dyna, which comprises a set of Hashin-type strain-based failure criteria [19] along with a damage mechanics-based material property degradation module proposed by Matzenmiller et al. [20]. The Hashin-type strain-based failure criteria considered are listed below.
Tension-Shear fiber mode 1
Compression fiber mode 2
Crush mode 3
Transverse compressive matrix mode 4
Perpendicular matrix mode 5
Parallel matrix (delamination) mode 6
where ⟨ ⟩ are the Macaulay brackets, SaT and SaC are the tensile and compressive strengths in the fiber direction, and SFS and SFC are the layer strengths associated with the fiber shear and crush failure, respectively, SbT and ScT are the transverse tensile strengths of the corresponding tensile modes (εb > 0 or εc > 0), and Sab0, Sbc0, and Sca0 are the quasi-static shear strength values. Note that a scale factor Sdelm is introduced to provide a better correlation of the delamination area with the experiments. The scale factor Sdelm can be determined by fitting the analytical prediction to the experimental data for the delamination area.
Under compressive transverse strain, εb < 0 or εc < 0, the damaged surface is considered to be “closed”, and the shear strengths are assumed to depend on the compressive normal strains based on the Mohr-Coulomb theory
where φ is a material constant as tan(φ) is similar to the coefficient of friction. The damage thresholds rj, j = 1,…,6, have the initial values equal to 1 before the damage is initiated and are updated due to damage accumulation of the associated damage modes.
A set of damage variables with i = 1, …, 6; are introduced to correlate the onset and growth of damage to stiffness losses in the material. The compliance matrix is related to the damage variables as
The stiffness matrix [C] is obtained by inverting the compliance matrix, i.e., . As suggested in [20], the growth rate of damage variables, , is governed by the damage rule of the form:
where the scalar damage functions controls the amount of growth and the vector-valued matrix (i = 1,…,6, j = 1, …, 6) provide the coupling between the individual damage variables (i) and the various damage modes (j). The damage criteria of Eqs. (1) to (6) provide the damage surfaces in strain space for the unidirectional and fabric lamina models, respectively. Damage growth, , will occur when the strain path crosses the updated damage surface and the strain increment has a non-zero component in the direction of the normal to the damage surface, i.e., . Combined with damage growth functions , is assumed to have the form:
Choosing
And noting that
for the quadratic functions given by Equations (2.53) to (2.58) lead to:
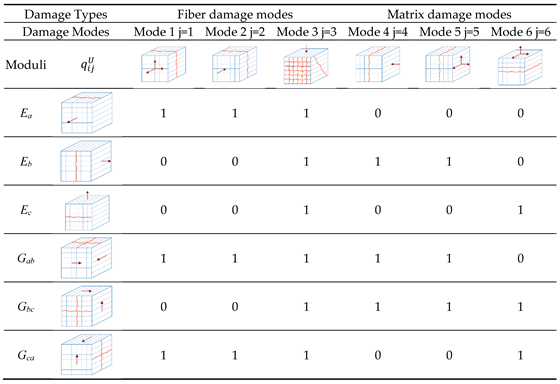
Eq. (14) is the damage coupling matrix, and Eq. (15) and Table 1 explain how it is associated with the modulus reduction for the unidirectional lamina model.
𝜑𝑗=𝑖𝛾𝑗𝜕𝑓𝑗𝜕𝜀𝑖𝜀𝑖
4.2. Fatigue crack growth model
This section may be divided by subheadings. It should provide a concise and precise description of the experimental results, their interpretation, as well as the experimental conclusions that can be drawn.
To simulate fatigue delamination growth, a recently developed fatigue crack growth model for co-consolidated thermoplastics [11] was used. The model relies on a modified Paris’ law, which is used for the calculation of fatigue crack growth rate in form of
The intermediate mixed-mode c and m parameters are derived using the prediction model of Russel & Street [21], which requires as input only pure mode I and mode II fatigue data.
The numerical fatigue degradation has been implemented via the method of cumulative static and fatigue element damage parameter given by
where is the total damage variable (0: undamaged, 1: failed), while and are the static and fatigue contributing damage variables, respectively. The stress state σ for each element in the fatigue activated zone has been degraded by
where is the maximum traction of the affected element.
The fatigue loading is based on the loading envelope technique [22], where the actual sinusoidal spectrum is approached by a constant force which corresponds to the maximum fatigue loading value as can be seen in Figure 1. The iterative numerical procedure for the fatigue crack growth model is graphically presented in Figure 2.
The pure mode I and mode II modified Paris’ laws that have been used in the present application are:
where , and , are the fatigue crack growth rates and the maximum energy release rates per cycle for mode I and mode II, respectively. Figure 3 depicts the experimental from which the modified Paris laws were derived. More details on the derivation of equations (19) and (20) and the respective graphs in Figure 3 can be found in [11].
4.3. FE models
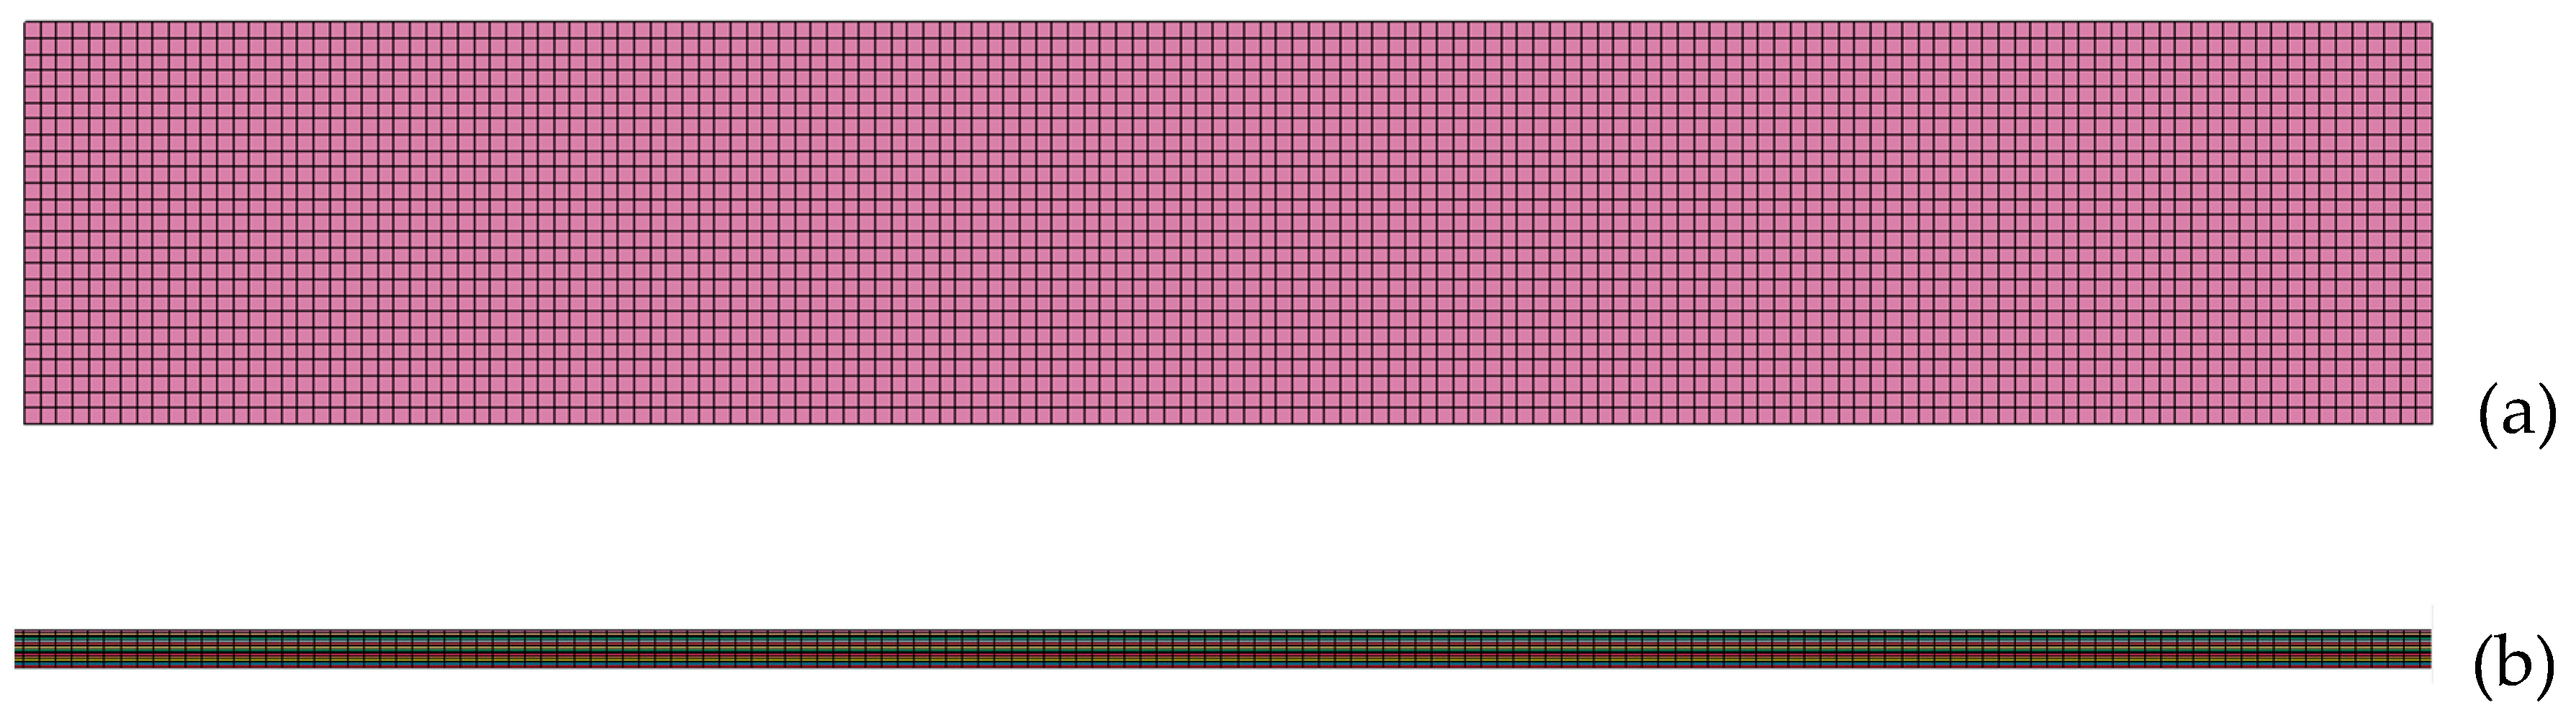
The specimens modeled had the same dimensions as the coupons tested (see Section 2). 8-noded solid elements were at all FE models. The global damping for the models was specified at 800 for the entire analysis, while a Rayleigh damping coefficient of 0.1 was applied to achieve a higher structural rigidity. Furthermore, to eliminate non-physical hourglass instabilities, a Flanagan-Belytschko integration stiffness formulation was selected with a coefficient of 0.1. The mechanical properties of the thermoplastic layer assigned to the elements are listed in Table 2. The ply interfaces of the fatigue and residual strength FE models were modeled using intermediate cohesive layers. The cohesive elements were modeled using the UMAT 43c material model [18], designed for three-dimensional cohesive elements, and implemented as zero-thickness elements. The quasi-static tensile load was modeled by fixing the nodes at one end and applying an incremental displacement at the other end. The fatigue load was modeled by increasing the applied displacement until the maximum load is reached.
Figure 4.
Mesh density of quasi-static tension model (a) front view and (b) side view.
To predict the residual tensile strength of the thermoplastic coupons, the PDM and the fatigue model are combined by means of the numerical procedure described in the flowchart of Figure 5. For each fatigue state of interest, a dynain.ASCII keyfile was extracted, encompassing the geometry and the deleted cohesive elements, which delineate the delamination area of the state. Subsequently, the isolated deleted cohesive elements were imported into the initial fatigue model. Following this, the restoration of deleted elements to their original geometry was selected, resulting in the creation of double nodes at locations where delamination had occurred. The cohesive elements were then merged and removed, and tensile loading using MAT_162 (with properties identical to those in the model validation) was applied to extract the residual strength.
The failure mode of matrix cracking presents a challenge in precise modeling, as it does not conform neatly to established fatigue model or pre-existing damage state within residual strength prediction model. The information gleaned from experimental photos and C-Scan data, while valuable, remains insufficient to offer a clear and objective understanding of the evolution of matrix cracking. Consequently, MAT_162 has been chosen as the material model for both quasi-static models. This selection is based on its capability to delineate the evolution of matrix cracking and delamination at each layer, thereby providing a more comprehensive insight into the intricate mechanisms underlying these phenomena.
5. Numerical results
5.1. Tensile behavior
Figure 6 plots the experimental and numerical tensile force-displacement curves of the thermoplastic coupons. The observed scatter of the experimental curves is acceptable. The average tensile longitudinal strength is 917 MPa and the average longitudinal modulus is 59.75 Mpa. Regarding the numerical results, these represent very well the initial stiffness of the coupons, the maximum applied displacement, and the tensile strength. However, it does not capture accurately the decrease in the slope of the curves that takes place after the applied displacement of 1 mm, while the curvature of the experimental curve is due to visco-elastic behavior of the thermoplastic matrix and cannot be modelled precise, while knowledge about this behavior is not available from the manufacturer.
The main damage modes that drove the tensile failure of the coupons are matrix cracking and delamination. Matrix cracking initiated at 25 kN at the supported end of the coupon as can be seen in Figure 7. Specifically, it started at the middle 90˚ layers and propagated to the other 90˚ and ±45˚ layers. On the other hand, delamination initiated at 46 kN to a large extent and caused a sudden load-drop in the numerical curve, which does not appear in the experimental curves. Delamination started in the middle area of the coupon (Figure 8) at the middle 90˚/90˚ interface and propagated at the 90˚/±45˚ interfaces towards the supported end of the coupon.
5.2. Fatigue life
Figure 10 summarizes the results from the non-interrupted fatigue tests. The purpose of this test series was to measure the average fatigue life based on which the settings (number of intervals and number of cycles between intervals) of the interrupted fatigue tests will be determined. The average fatigue life is 106612 cycles, and the standard deviation is 25514 cycles. The relatively high standard deviation is attributed to the complexity of the fatigue failure mechanisms and the manufacturing defects which were present in the coupons. Figure 11 presents the fatigue lives of the coupons that have undergone the interrupted fatigue testing. In this case, the average fatigue life is 140037 cycles, and the standard deviation is 46640 cycles. The increase in the standard deviation compared to the non-interrupted tests is probably due to the processing errors that were introduced during the several stops and restarts of the testing process.
5.3. Fatigue delamination
The use of cohesive elements at each interface enables the simulation of delamination propagation as a function of the number of cycles in the entire coupon. For validation purposes, the predicted delamination propagation at the -45˚/90˚ interface is compared with C-scan images taken during interruptions of the fatigue test in Figure 12. As revealed, the model captures accurately both the initiation of delamination at the coupon’s edges at 10000 cycles and the propagation rate of delamination towards the middle of the coupon.
Figure 13 depicts the delamination propagation at all interfaces of the coupon for every 50000 cycles. The quasi-isotropic lay-up of the coupons has caused an unsymmetric and unequal delamination propagation between the interfaces. Delamination is mainly propagating to the -45˚/90˚ and the 90˚/45˚ interfaces at one side of the coupon and at the interfaces of the 90o layers, while it is almost absent from interfaces of the 0˚ layers. The different delamination propagation between the symmetric interfaces is confirmed by the experiments as can be seen in Figure 14 in the side-view photos taken from two coupons during the interruption of the tests. In the photos, the one-side extensive delamination at the neighboring 45˚/90˚ and 90˚ /45˚ interfaces is clearly visible. Also, at the later stages of fatigue loading, matrix cracking is also visible as for instance in Figure 14(a) at 100000 cycles.
5.4. Residual tensile strength
Combining the fatigue delamination model and the PDM, the residual tensile strength of the coupons was predicted. The numerical predictions are compared with the experimental measurements in Figure 15. As expected, both methods show a degradation of residual tensile strength with increasing fatigue cycles. The numerical values deviate from the experimental ones for the percentages of fatigue life of 0.2, 0.4 and 0.6. From 0.6 to 1.0 a very good agreement is observed between the two methods. The main difference between the model and the tests is that the model considers delamination, thus neglecting all other fatigue damage modes such as matrix cracking and fiber/matrix interface failure. However, this assumption should have led to an overestimation of residual tensile strength, which is not the case. The fact that the model underestimates the residual tensile strength for the percentages of fatigue life of 0.2, 0.4 and 0.6 reveals that the neglected failure modes have not accumulated significantly at those stages and that the modeling approach for delamination (nodes release) is too severe. Moreover, the good agreement at the high fatigue stages is because delamination in the tested coupons has become severe.
Regarding the predicted damage propagation in the coupons subjected to tension after fatigue, the pre-existing delamination is causing an extensive matrix cracking, which should have been already present if it has been considered by the fatigue model, and a fast propagation of delamination, especially close to the loaded ends. This has led to the fracturing of the coupons in two different areas located close to the two ends, as shown in Figure 16(a). This finding is verified by the tested coupons (Figure 16(b) and (c)).
6. Conclusions
In the present work, we have proposed a numerical modeling approach for simulating fatigue delamination growth and predicting the residual tensile strength of quasi-isotropic thermoplastic coupons. The development and implementation of the models was supported by quasi-static tension tests and fatigue tests. The model is capable of simulating fatigue delamination growth at all interfaces, thus giving a detailed insight of delamination, which is a crucial failure mechanism in fatigue of CFRPs. The respective results have been validated successfully against C-scan images taken on fatigued coupons at interruptions of fatigue tests. The fatigue model does not account for the other types of damage except for delamination. The combination of the fatigue model with the quasi-static PDM has led to accurate predictions of residual tensile strength of the coupons. This finding is an indication that the consideration of delamination alone is sufficient for capturing the degradation of residual strength in thermoplastic coupons. The proposed modeling approach if upscaled to be applicable to structural parts can be proved useful in the damage tolerant design and the development of structural health monitoring systems of composite structures.
Author Contributions
Conceptualization, N.T., K.T. and I.S.; methodology, N.T., K.T. and I.S.; software, N.T. and I.S.; validation, N.T. and I.S.; formal analysis, N.T. and I.S.; investigation, N.T., K.T. and I.S.; resources, N.T. and I.S.; data curation, N.T. and I.S.; writing—original draft preparation, K.T.; writing—review and editing, N.T., K.T. and I.S.; visualization, N.T., K.T. and I.S.; supervision, K.T.; project administration, K.T.; funding acquisition, K.T. All authors have read and agreed to the published version of the manuscript.
Funding
This research received no external funding.
Institutional Review Board Statement
Not applicable.
Informed Consent Statement
Not applicable.
Data Availability Statement
Not applicable.
Acknowledgments
The authors would like to thank Professor Th. Loutas of the University of Patras for providing access to the Ultrasonic C-Scan machine.
Conflicts of Interest
The authors declare no conflict of interest.
References
- Pantelakis, S.; Tserpes, K. (Eds.) Revolutionizing Aircraft Materials and Processes; Springer International Publishing: Cham, 2020; ISBN 978-3-030-35345-2. [Google Scholar]
- O’Brien TK Fatigue Delamination Behavior of PEEK Thermoplastic Composite Laminates., Journal of Reinforced Plastics and Composites, 1988, 341–359.
- Uematsu, Y.; Kitamura, T.; Ohtani, R. Delamination Behavior of a Carbon-Fiber-Reinforced Thermoplastic Polymer at High Temperatures. Composites Science and Technology 1995, 53, 333–341. [Google Scholar] [CrossRef]
- Lachaud, F.; Lorrain, B.; Michel, L.; Barriol, R. Experimental and Numerical Study of Delamination Caused by Local Buckling of Thermoplastic and Thermoset Composites. Composites Science and Technology 1998, 58, 727–733. [Google Scholar] [CrossRef]
- Zhou, J.; He, T.; Li, B.; Liu, W.; Chen, T. A Study of Mode I Delamination Resistance of a Thermoplastic Composite. Composites Science and Technology 1992, 45, 173–179. [Google Scholar] [CrossRef]
- Dubé, M.; Hubert, P.; Yousefpour, A.; Denault, J. Fatigue Failure Characterisation of Resistance-Welded Thermoplastic Composites Skin/Stringer Joints. International Journal of Fatigue 2009, 31, 719–725. [Google Scholar] [CrossRef]
- Růžek, R.; Kadlec, M.; Petrusová, L. Effect of Fatigue Loading Rate on Lifespan and Temperature of Tailored Blank C/PPS Thermoplastic Composite. International Journal of Fatigue 2018, 113, 253–263. [Google Scholar] [CrossRef]
- Shirasu, K.; Tsuyuki, J.; Higuchi, R.; Onodera, S.; Okabe, T. Experimental and Numerical Study on Open-Hole Tension/Compression Properties of Carbon-Fiber-Reinforced Thermoplastic Laminates. Journal of Composite Materials 2022, 56, 2211–2225. [Google Scholar] [CrossRef]
- Liu, L.; Hu, D.; Wan, D.; Hu, X.; Han, X. Low Velocity Impact Behavior and Simulation of Parametric Effect Analysis for UHMWPE/LLDPE Thermoplastic Composite Laminates. Composite Structures 2021, 258, 113180. [Google Scholar] [CrossRef]
- Sun, X.C.; Kawashita, L.F.; Kaddour, A.S.; Hiley, M.J.; Hallett, S.R. Comparison of Low Velocity Impact Modelling Techniques for Thermoplastic and Thermoset Polymer Composites. Composite Structures 2018, 203, 659–671. [Google Scholar] [CrossRef]
- Sioutis, I.; Tserpes, K. A Mixed-Mode Fatigue Crack Growth Model for Co-Consolidated Thermoplastic Joints. International Journal of Fatigue 2023, 173, 107682. [Google Scholar] [CrossRef]
- Toray Cetex Datasheet of TC 1225 LM PAEK, Toray Cetex; p. 5.
- 13. D30 Committee. Test Method for Tensile Properties of Polymer Matrix Composite Materials. ASTM International. [CrossRef]
- 14. D30 Committee. Test Method for Tension-Tension Fatigue of Polymer Matrix Composite Materials. ASTM International. [CrossRef]
- Tserpes, K.I.; Papanikos, P.; Labeas, G.; Pantelakis, S. Fatigue Damage Accumulation and Residual Strength Assessment of CFRP Laminates. Composite Structures 2004, 63, 219–230. [Google Scholar] [CrossRef]
- Tserpes, K.I.; Papanikos, P.; Kermanidis, T. A Three-dimensional Progressive Damage Model for Bolted Joints in Composite Laminates Subjected to Tensile Loading. Fatigue & Fracture of Engineering Materials & Structures 2001, 24, 663–675. [Google Scholar] [CrossRef]
- Tserpes, K.I.; Labeas, G.; Papanikos, P.; Kermanidis, T. Strength Prediction of Bolted Joints in Graphite/Epoxy Composite Laminates. Composites Part B: Engineering 2002, 33, 521–529. [Google Scholar] [CrossRef]
- LS-DYNA: Theory Manual; Hallquist, J.O., Ed.; Livermore Software Technology Corp: Livermore, Calif, 2006; ISBN 978-0-9778540-0-4. [Google Scholar]
- Hashin, Z. Failure Criteria for Unidirectional Fiber Composites. Journal of Applied Mechanics 1980, 47, 329–334. [Google Scholar] [CrossRef]
- Matzenmiller, A.; Lubliner, J.; Taylor, R.L. A Constitutive Model for Anisotropic Damage in Fiber-Composites. Mechanics of Materials 1995, 20, 125–152. [Google Scholar] [CrossRef]
- Russell, A.J.; Street, K.N. Predicting Interlaminar Fatigue Crack Growth Rates in Compressively Loaded Laminates. In Proceedings of the Composite Materials: Fatigue and Fracture, Second Volume; ASTM International; pp. 162–178.
- Robinson, P.; Galvanetto, U.; Tumino, D.; Bellucci, G.; Violeau, D. Numerical Simulation of Fatigue-Driven Delamination Using Interface Elements. International Journal for Numerical Methods in Engineering 2005, 63, 1824–1848. [Google Scholar] [CrossRef]
Figure 1.
The load envelope for the modeling of fatigue loading.
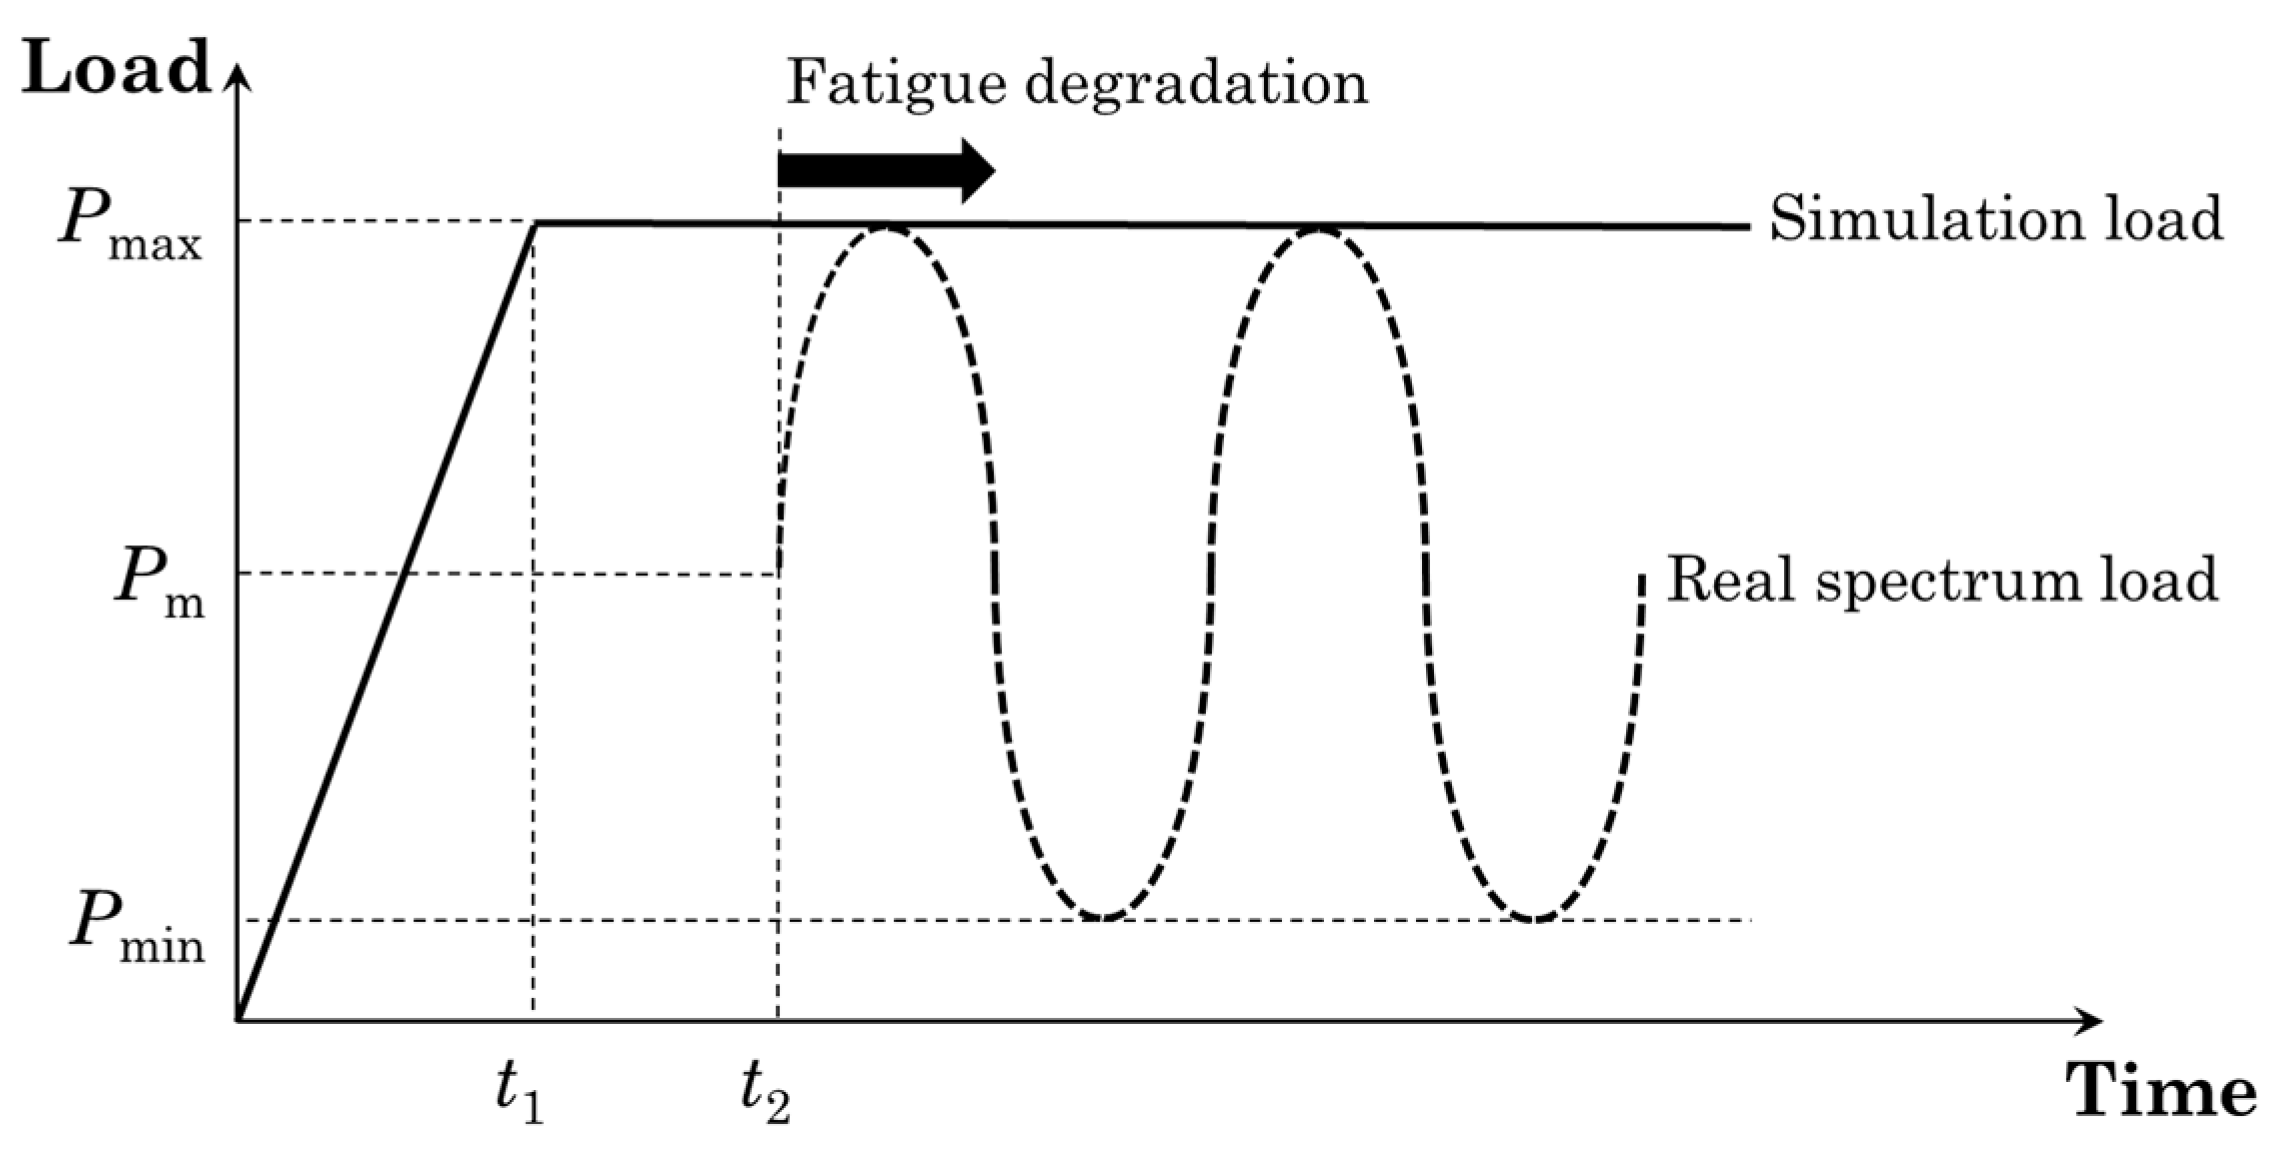
Figure 2.
Flowchart of the fatigue crack growth model.
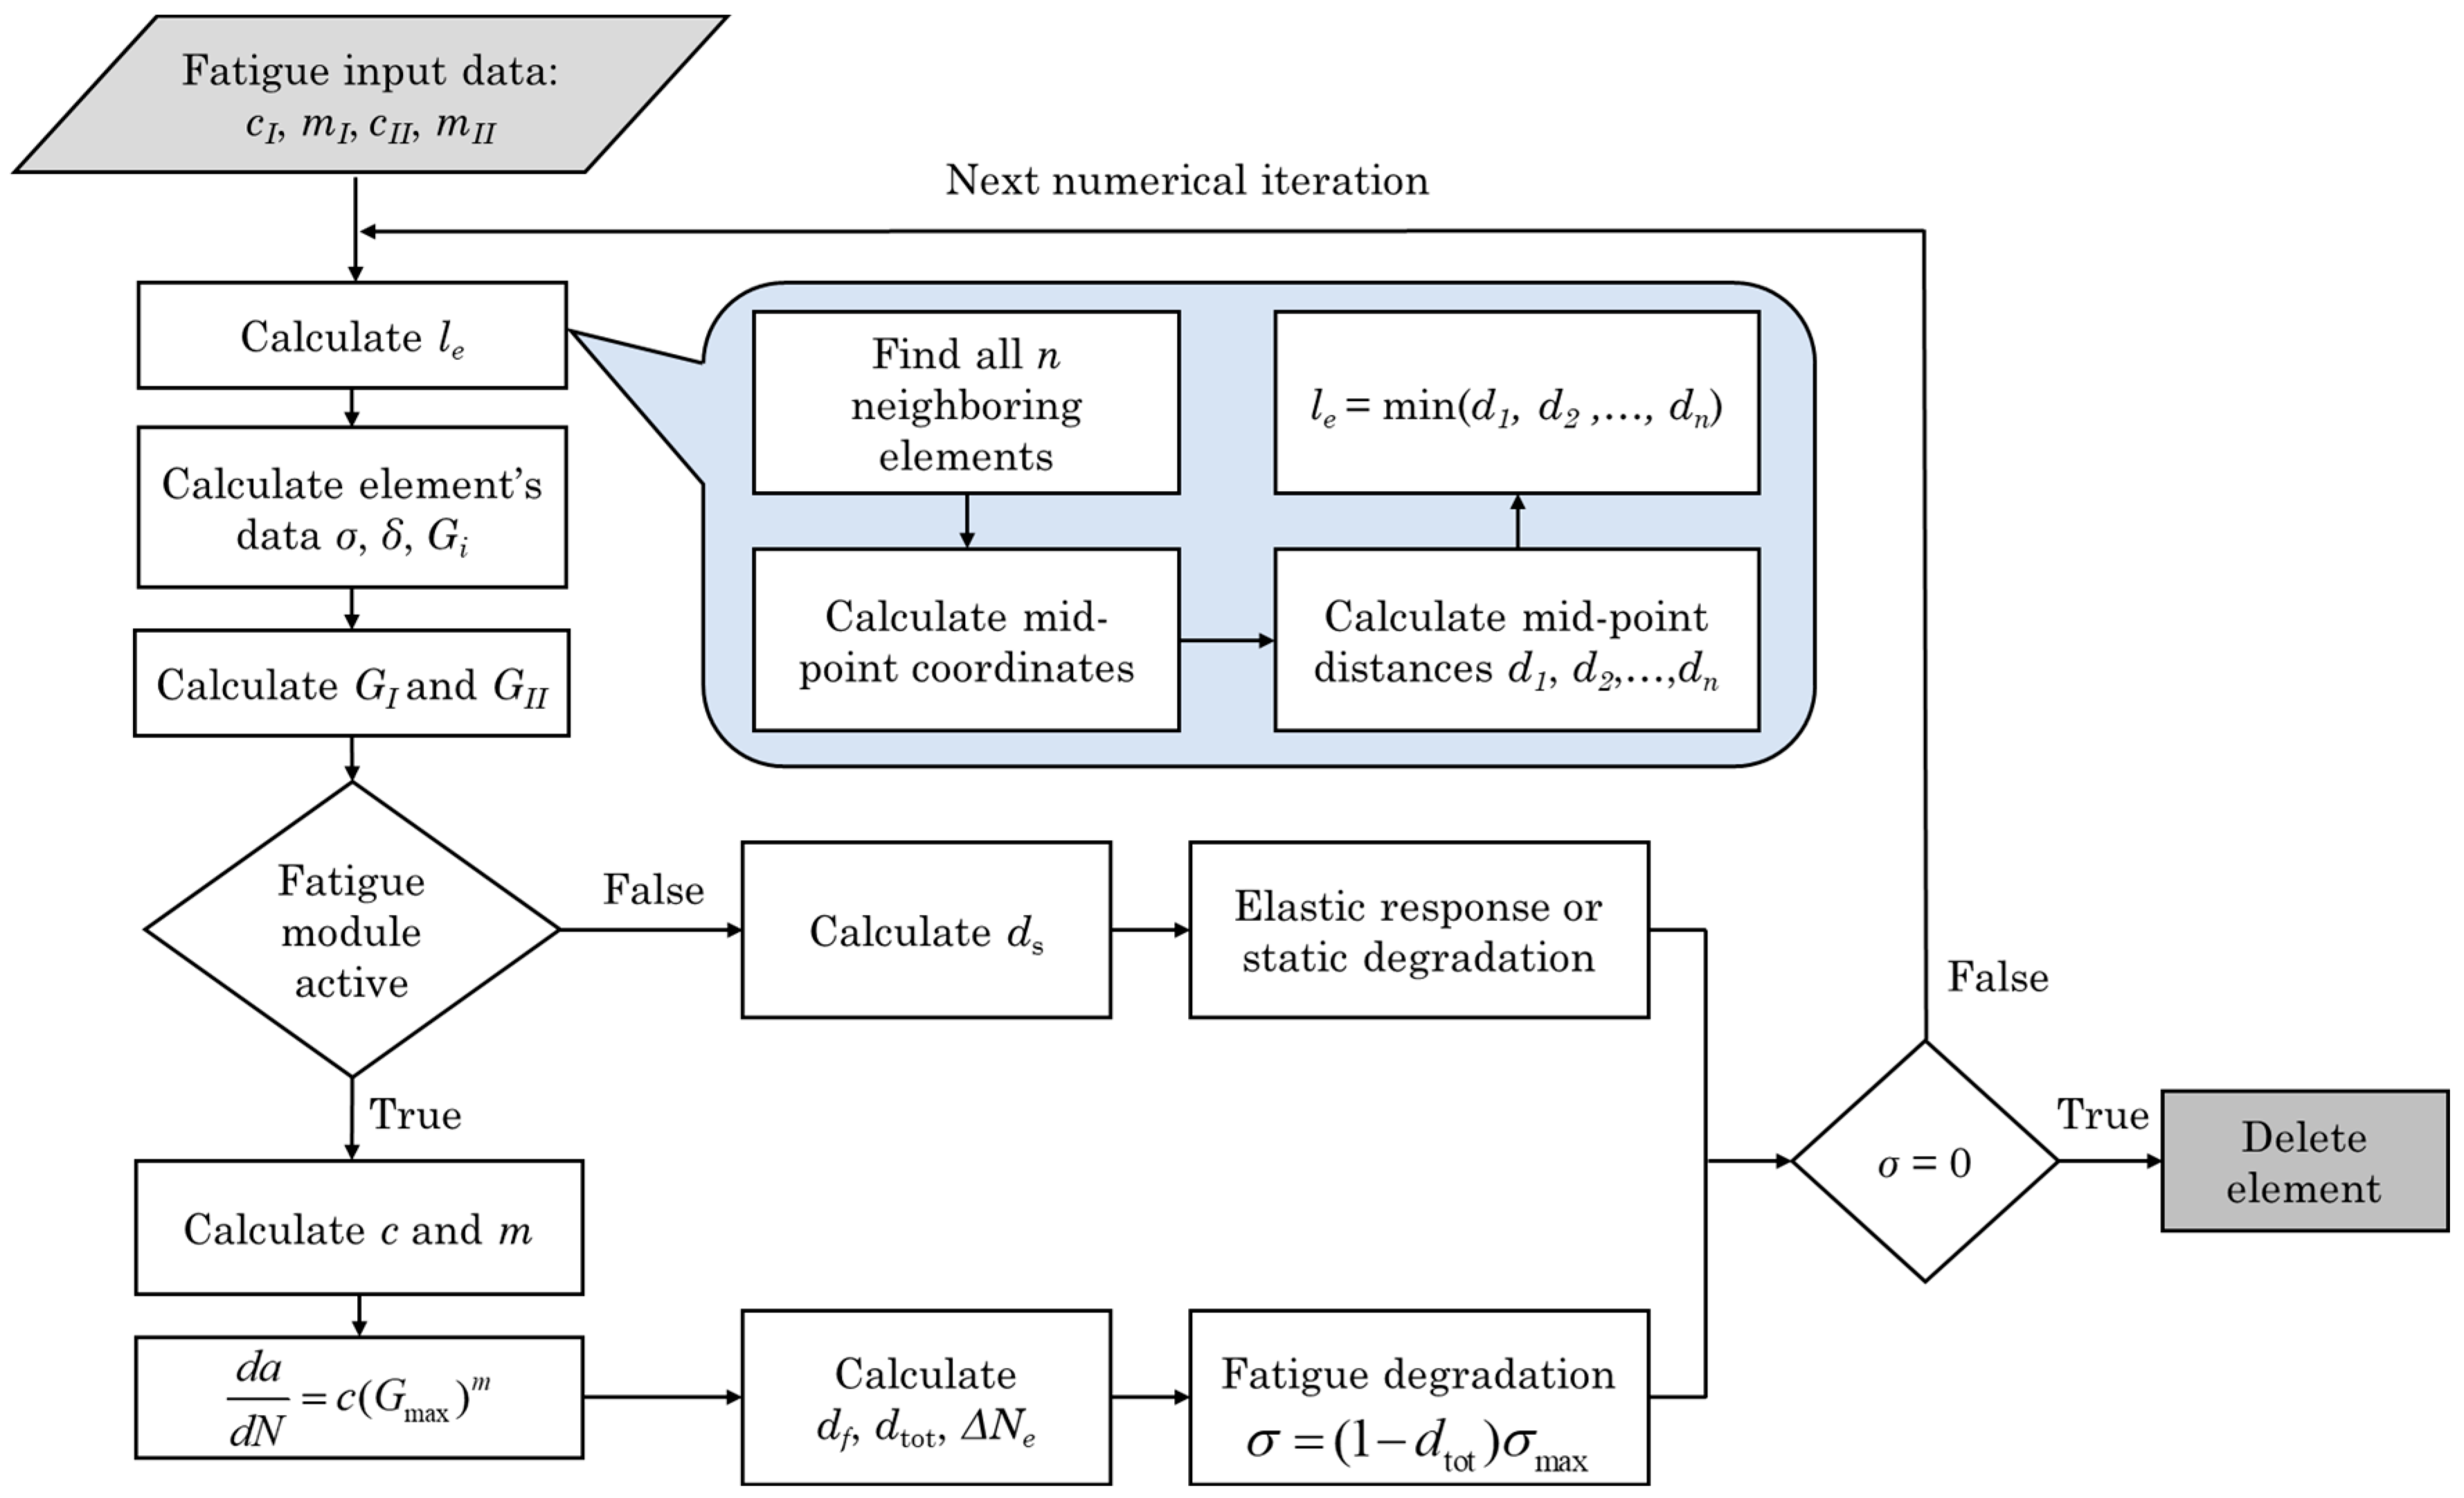
Figure 3.
The modified Paris’ law for (a) the pure mode I and (b) the pure mode II fatigue load cases.
Figure 3.
The modified Paris’ law for (a) the pure mode I and (b) the pure mode II fatigue load cases.
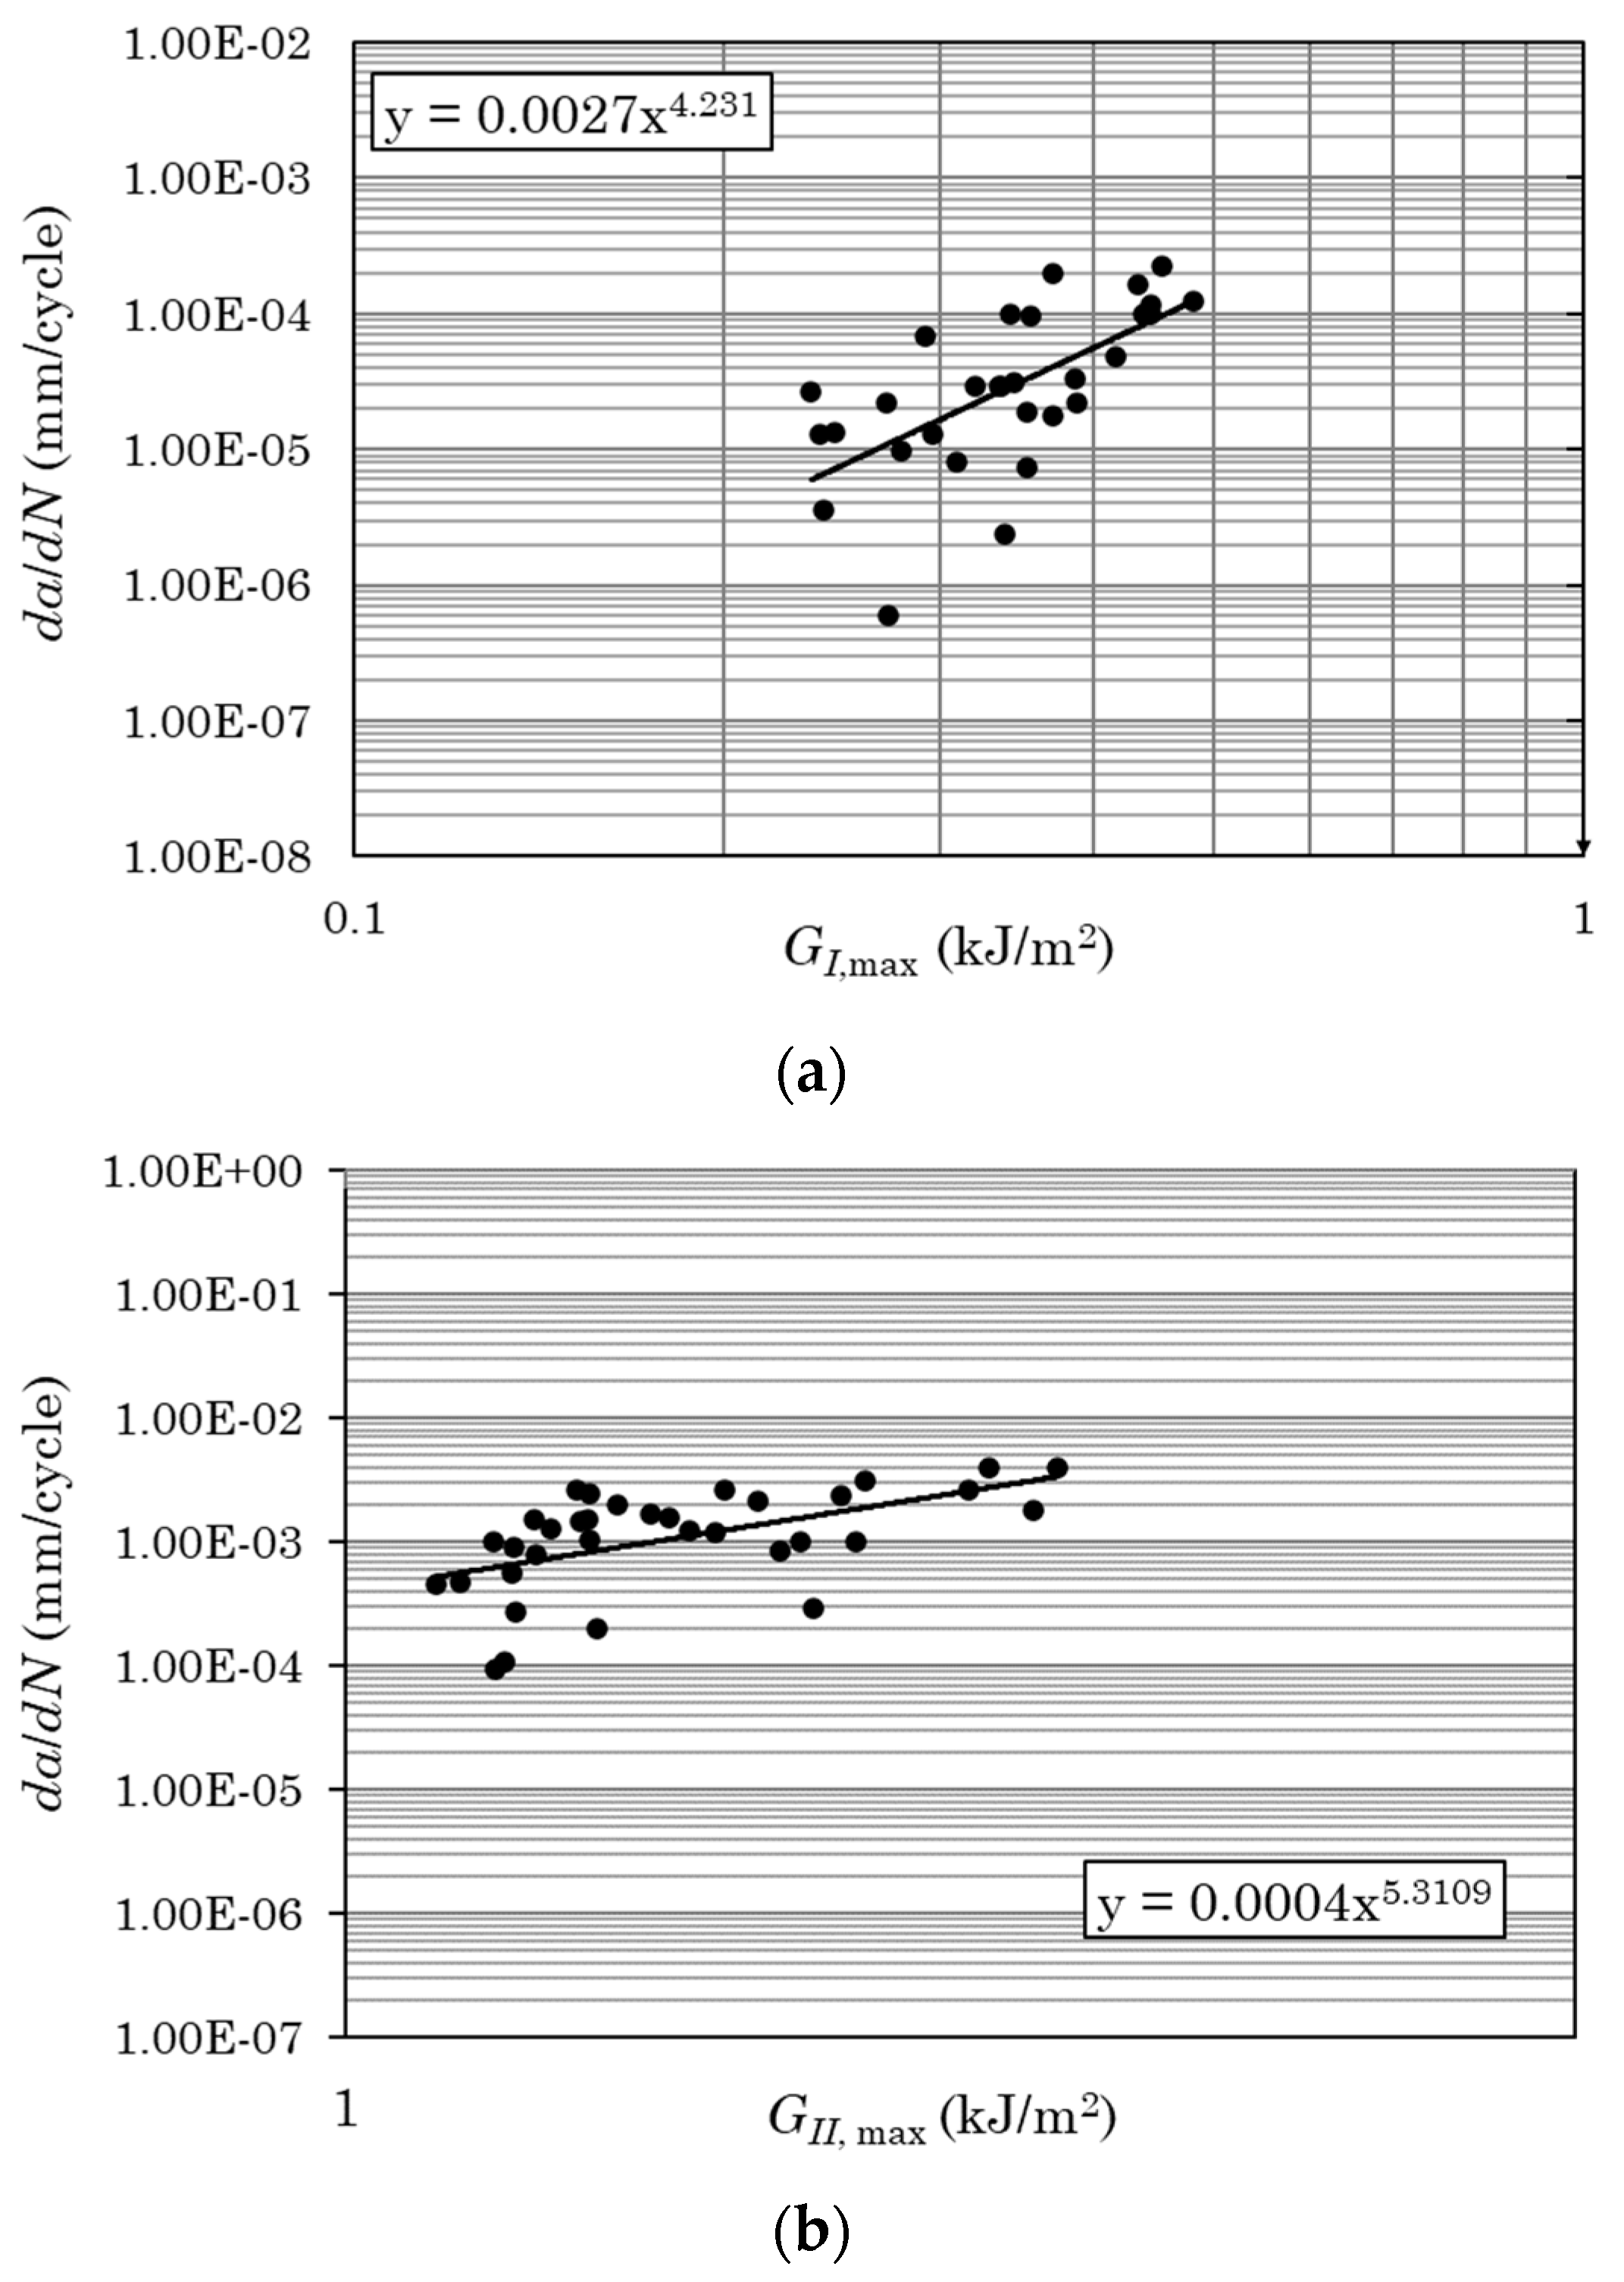
Figure 5.
Schematics of (a) of the orthotropic plies (tension models), (b) the cohesive layers (fatigue model).
Figure 5.
Schematics of (a) of the orthotropic plies (tension models), (b) the cohesive layers (fatigue model).
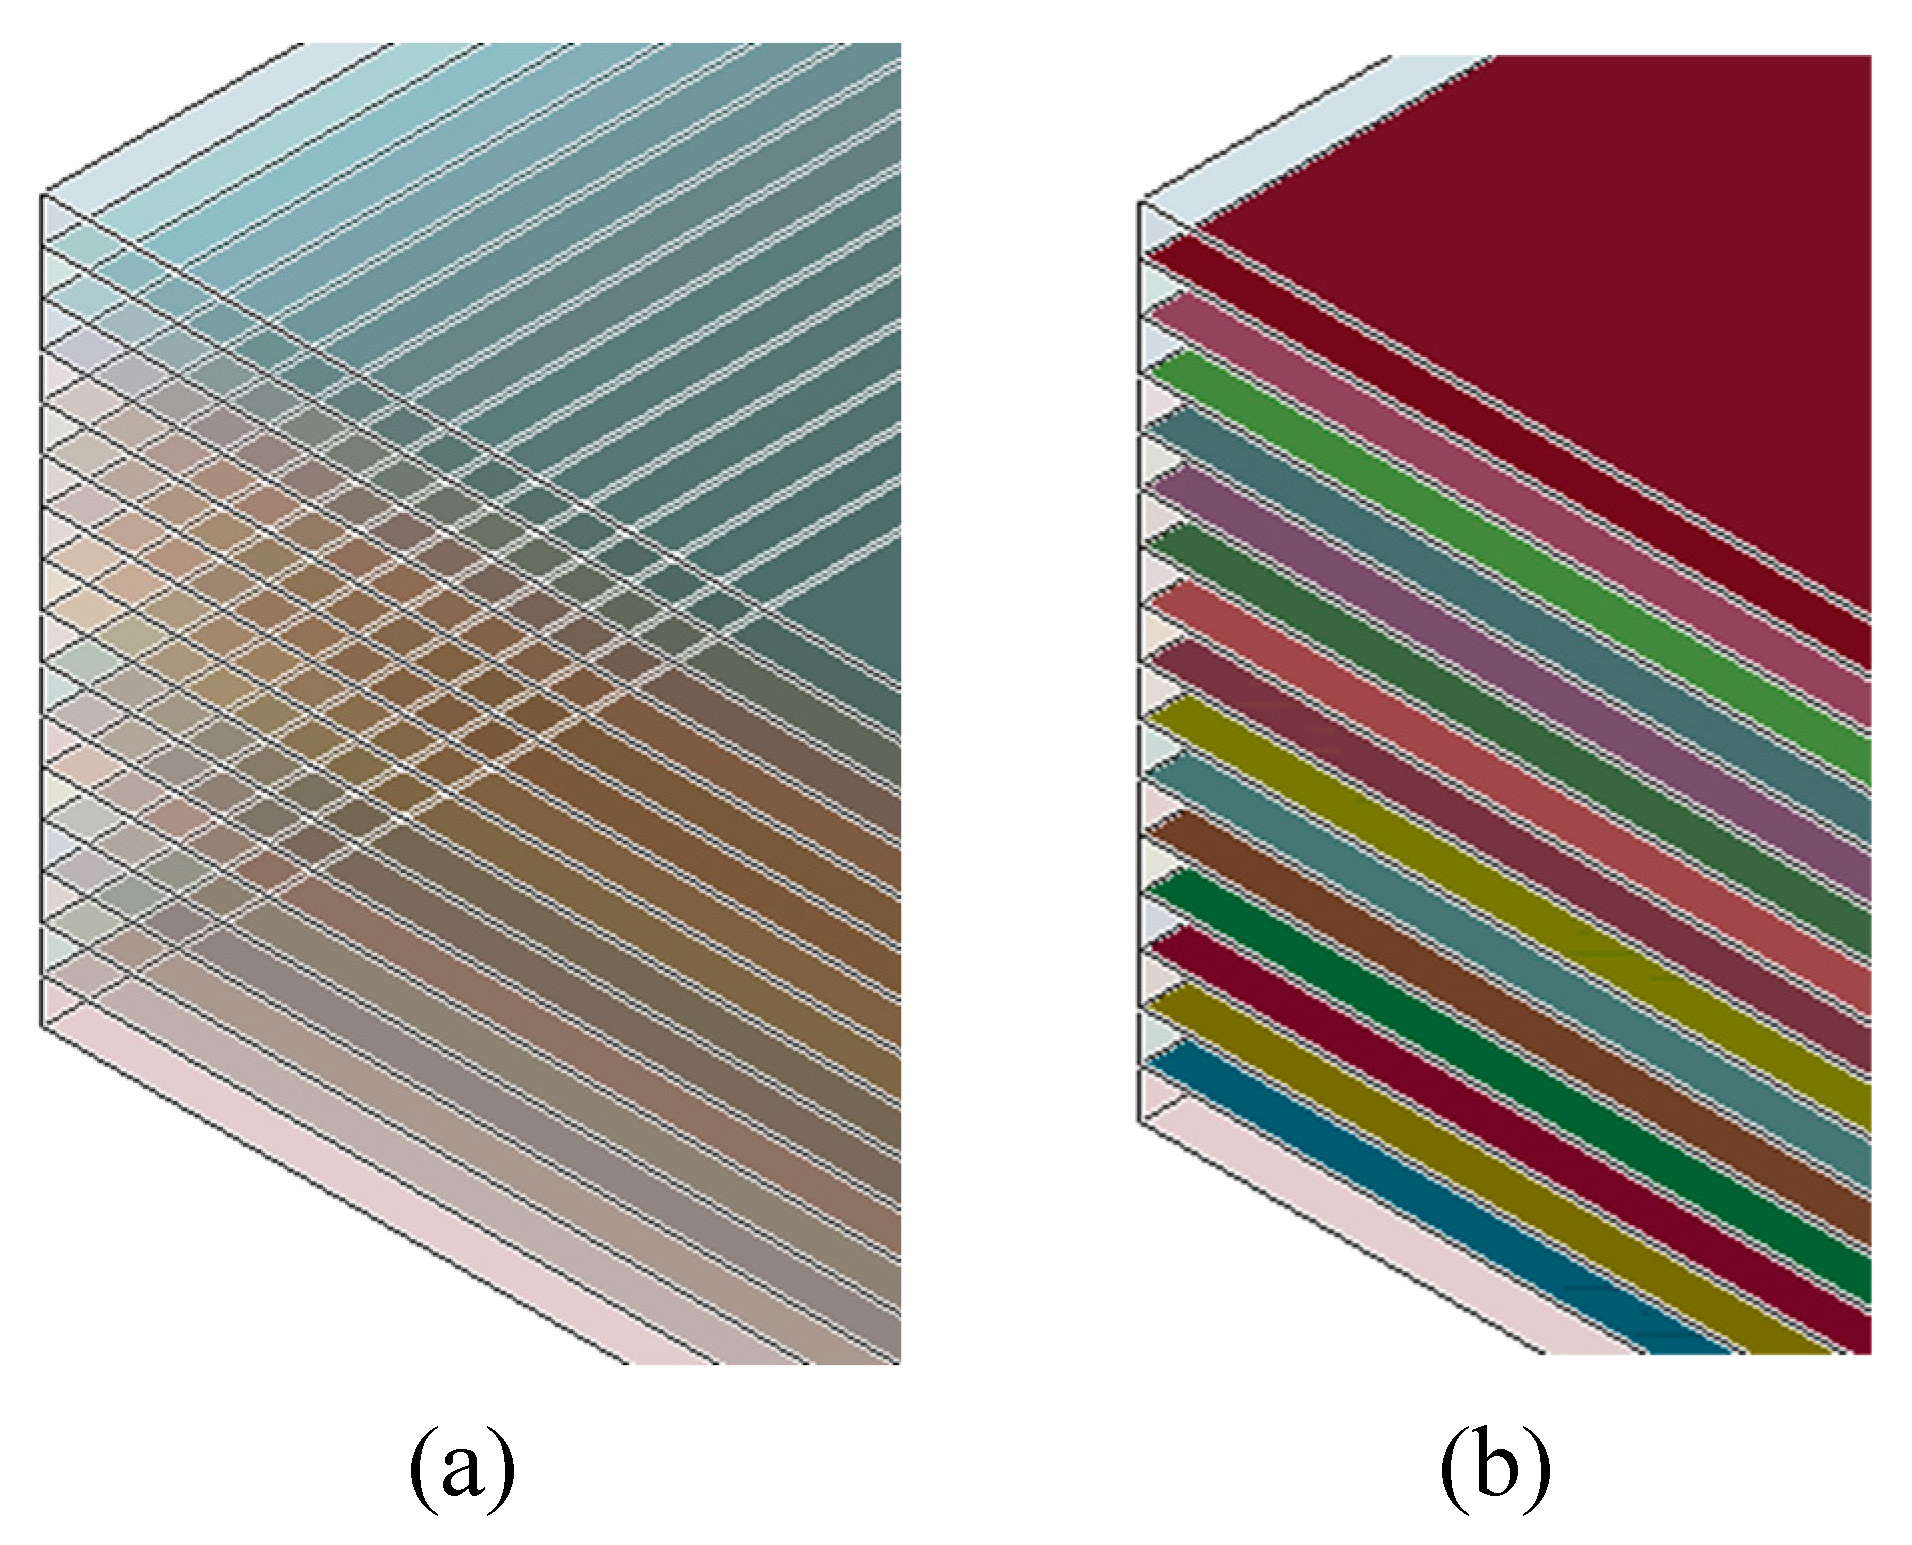
Figure 6.
Flowchart of the numerical process of the residual strength model.
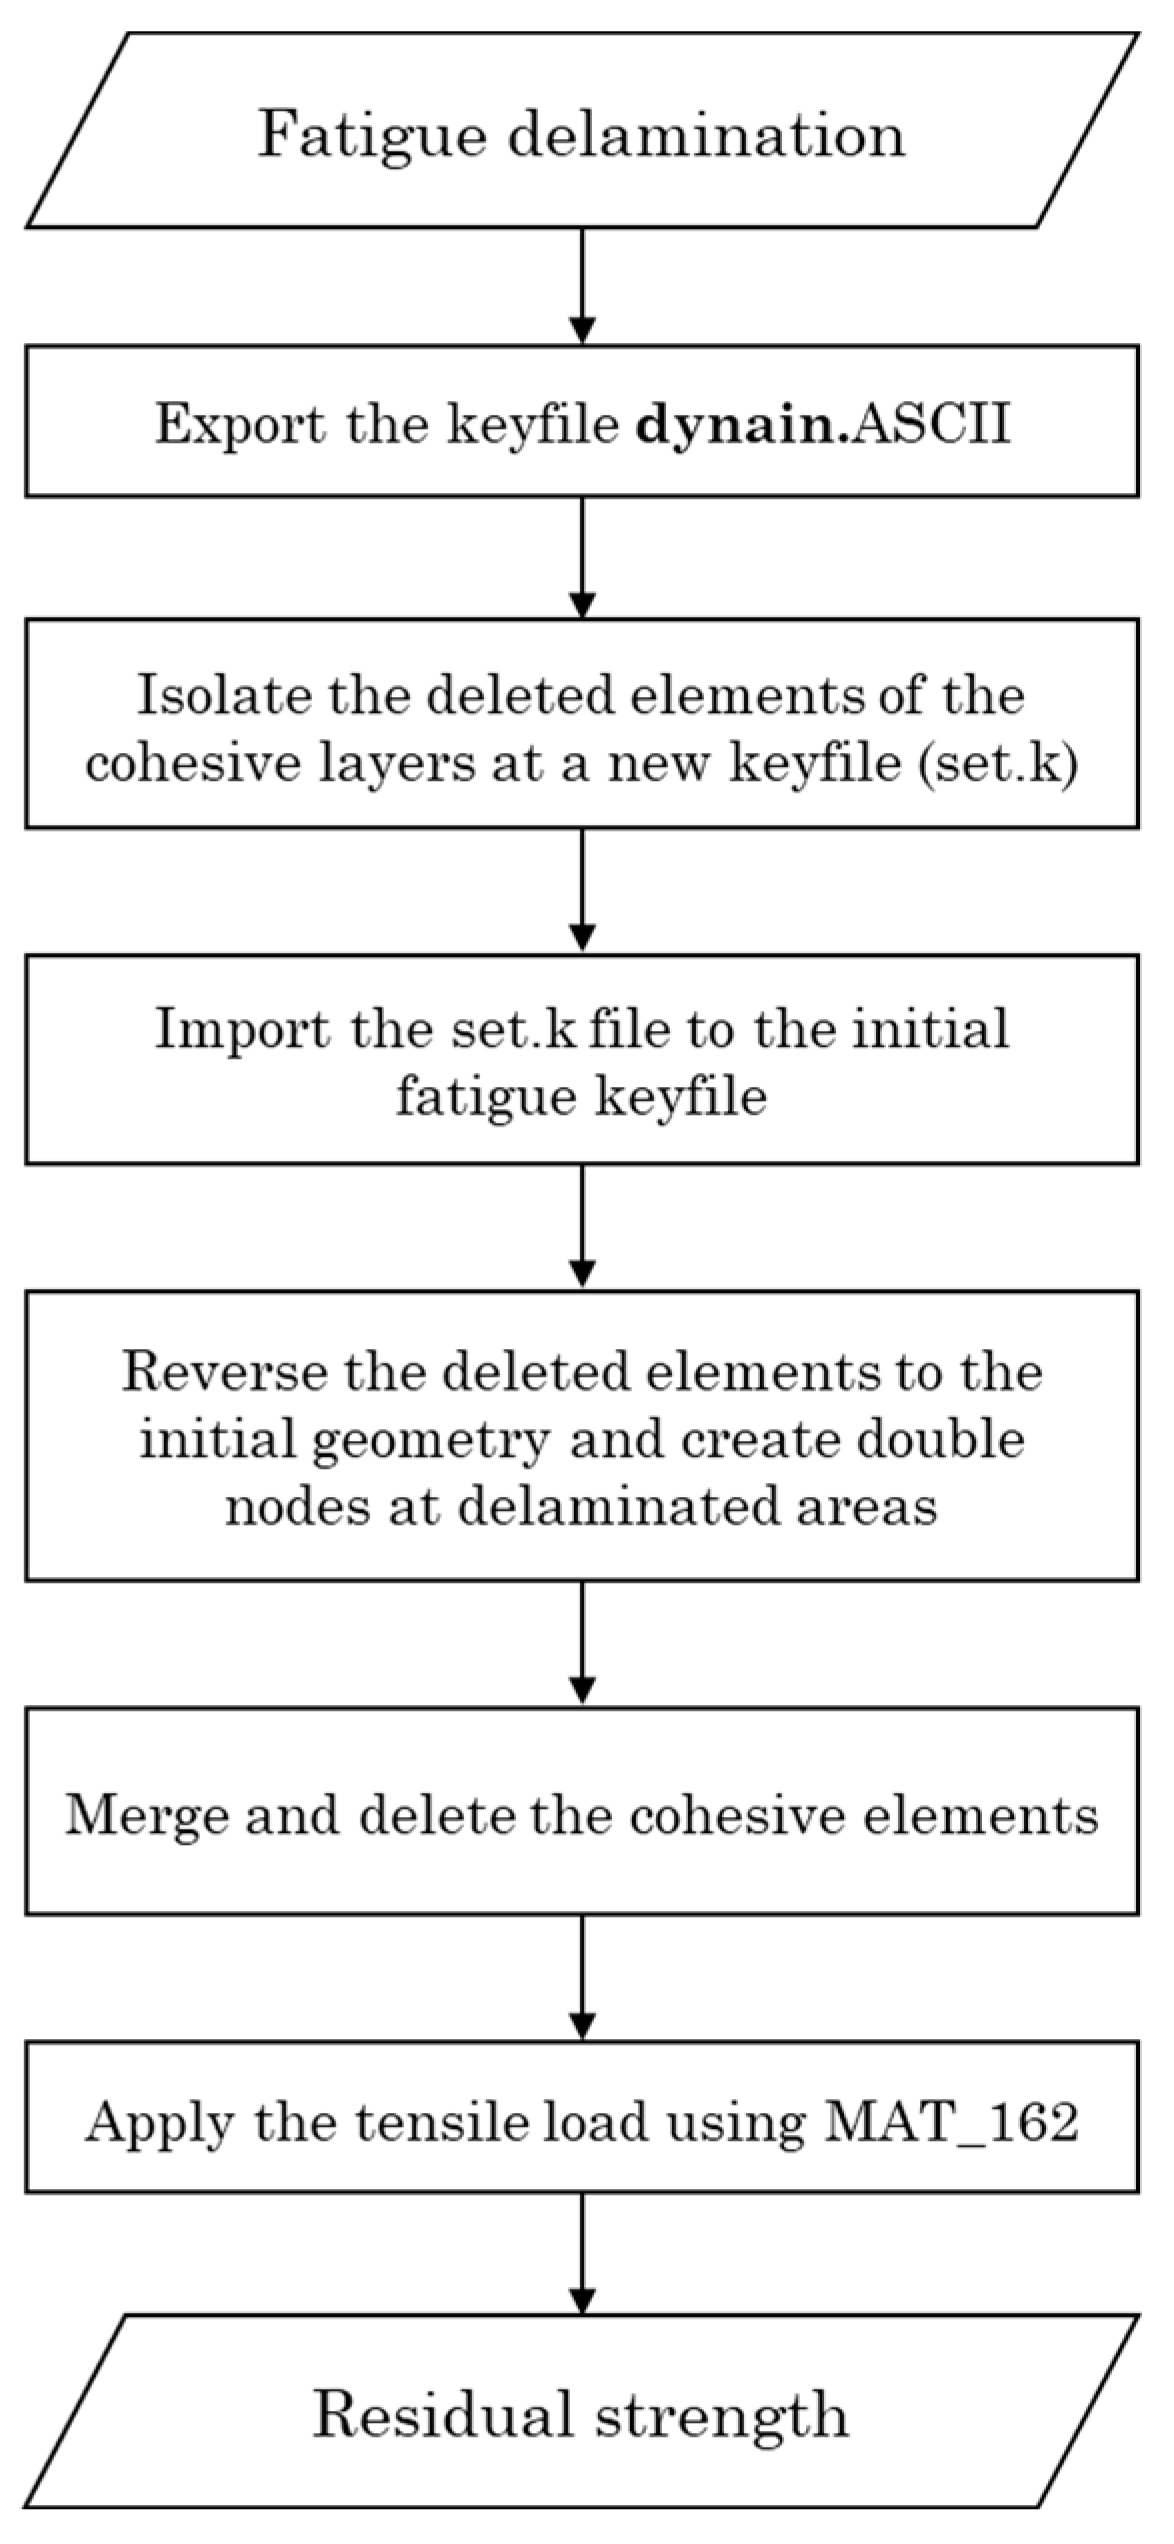
Figure 7.
Experimental and numerical tensile force-displacement curves of the thermoplastic coupons.
Figure 7.
Experimental and numerical tensile force-displacement curves of the thermoplastic coupons.
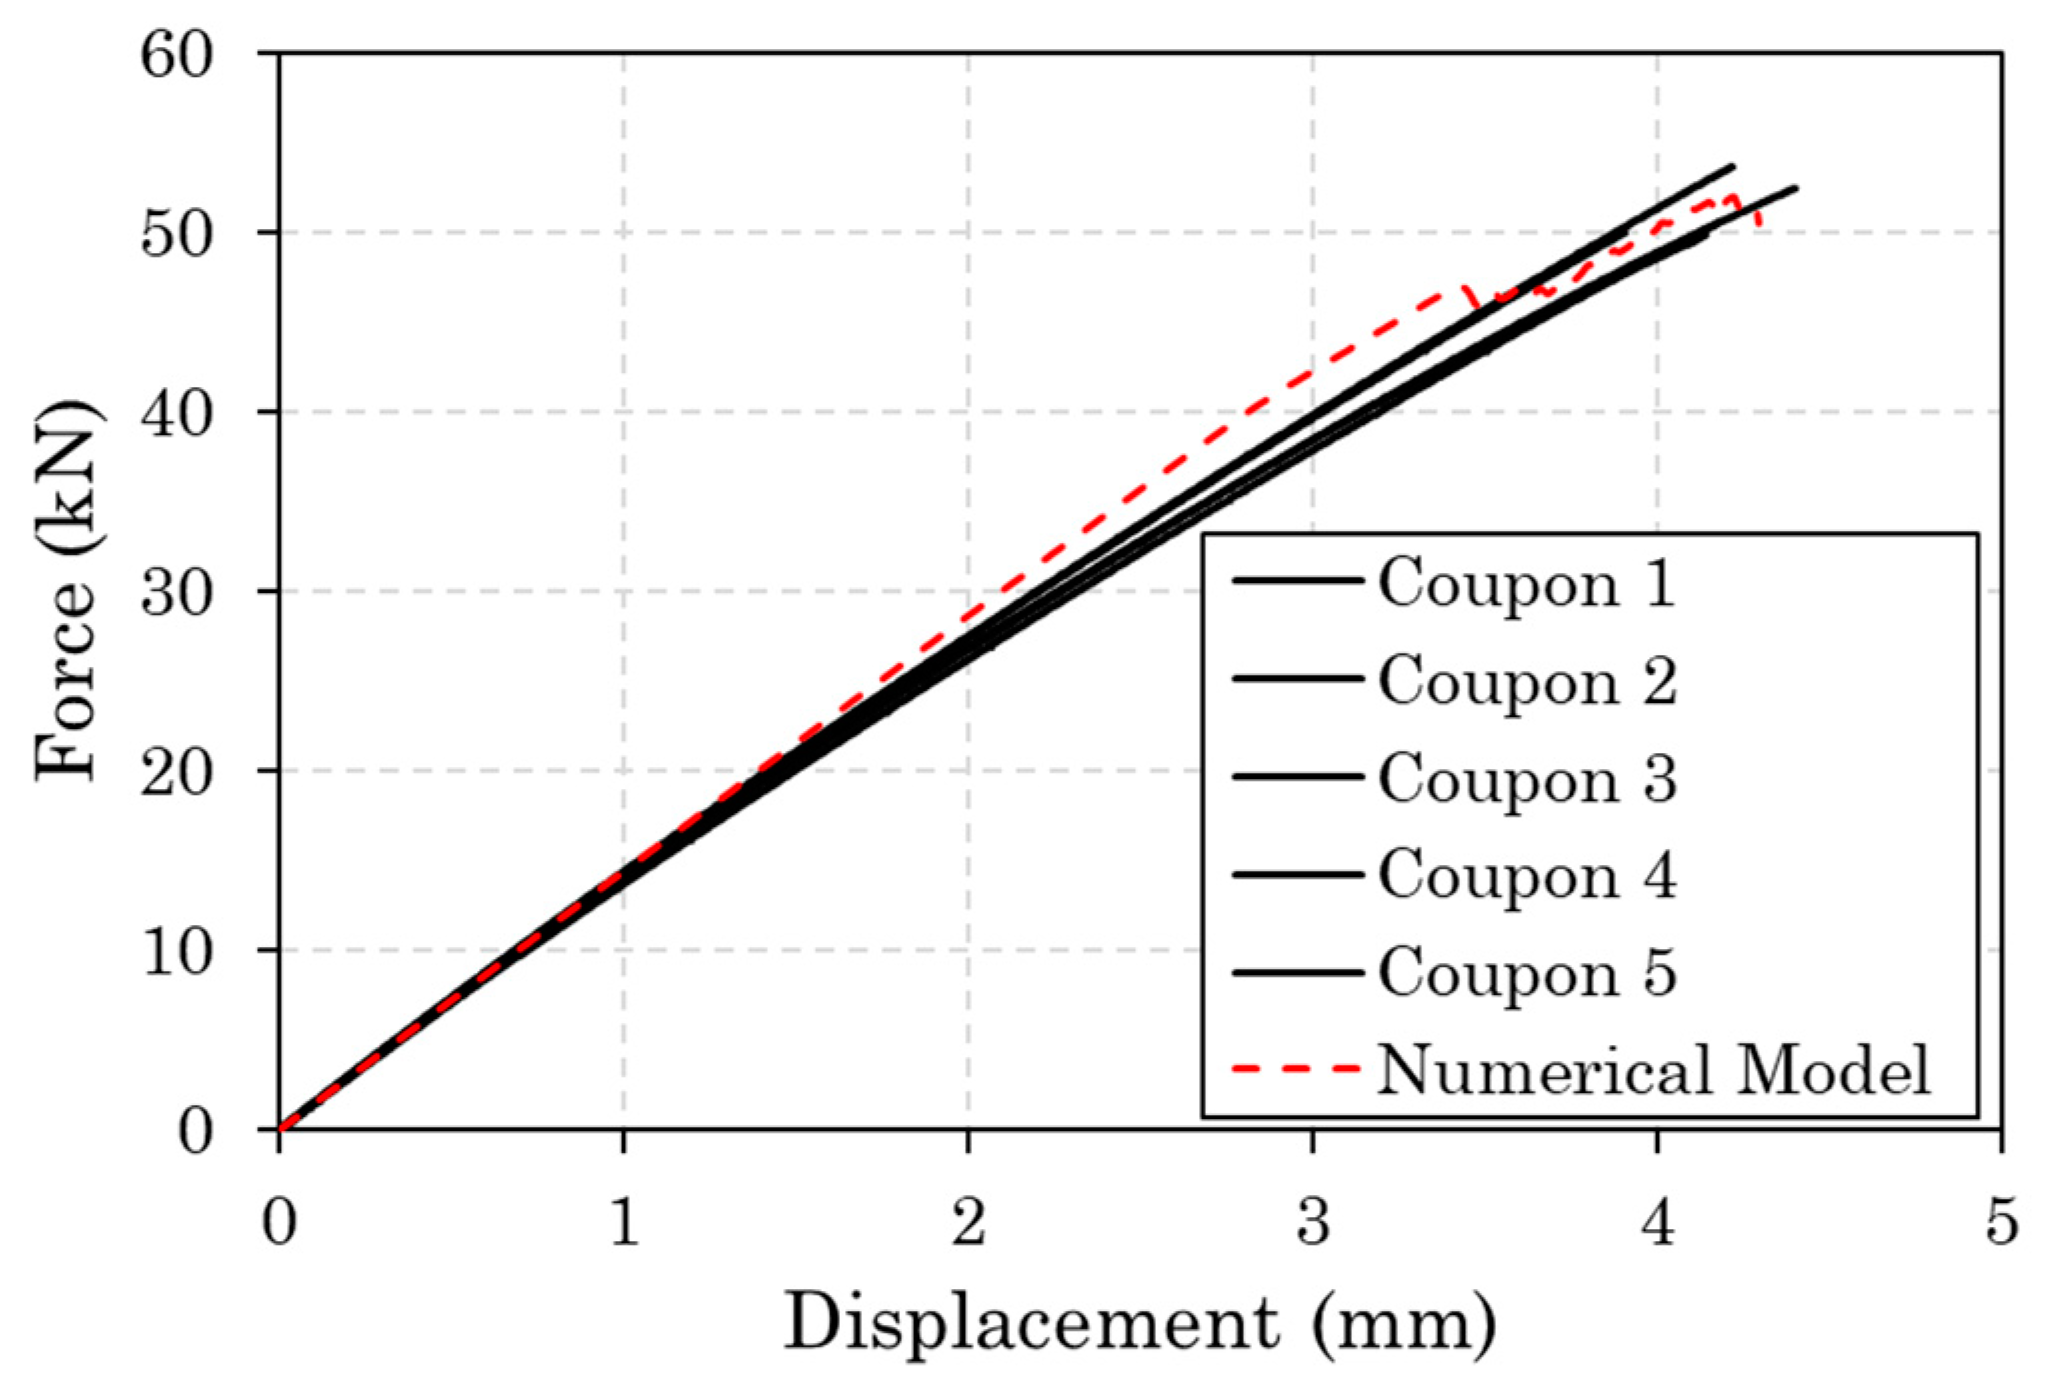
Figure 8.
Matrix cracking propagation due to quasi-static tension. At the top of the figure the monitoring area of the coupon is shown.
Figure 8.
Matrix cracking propagation due to quasi-static tension. At the top of the figure the monitoring area of the coupon is shown.
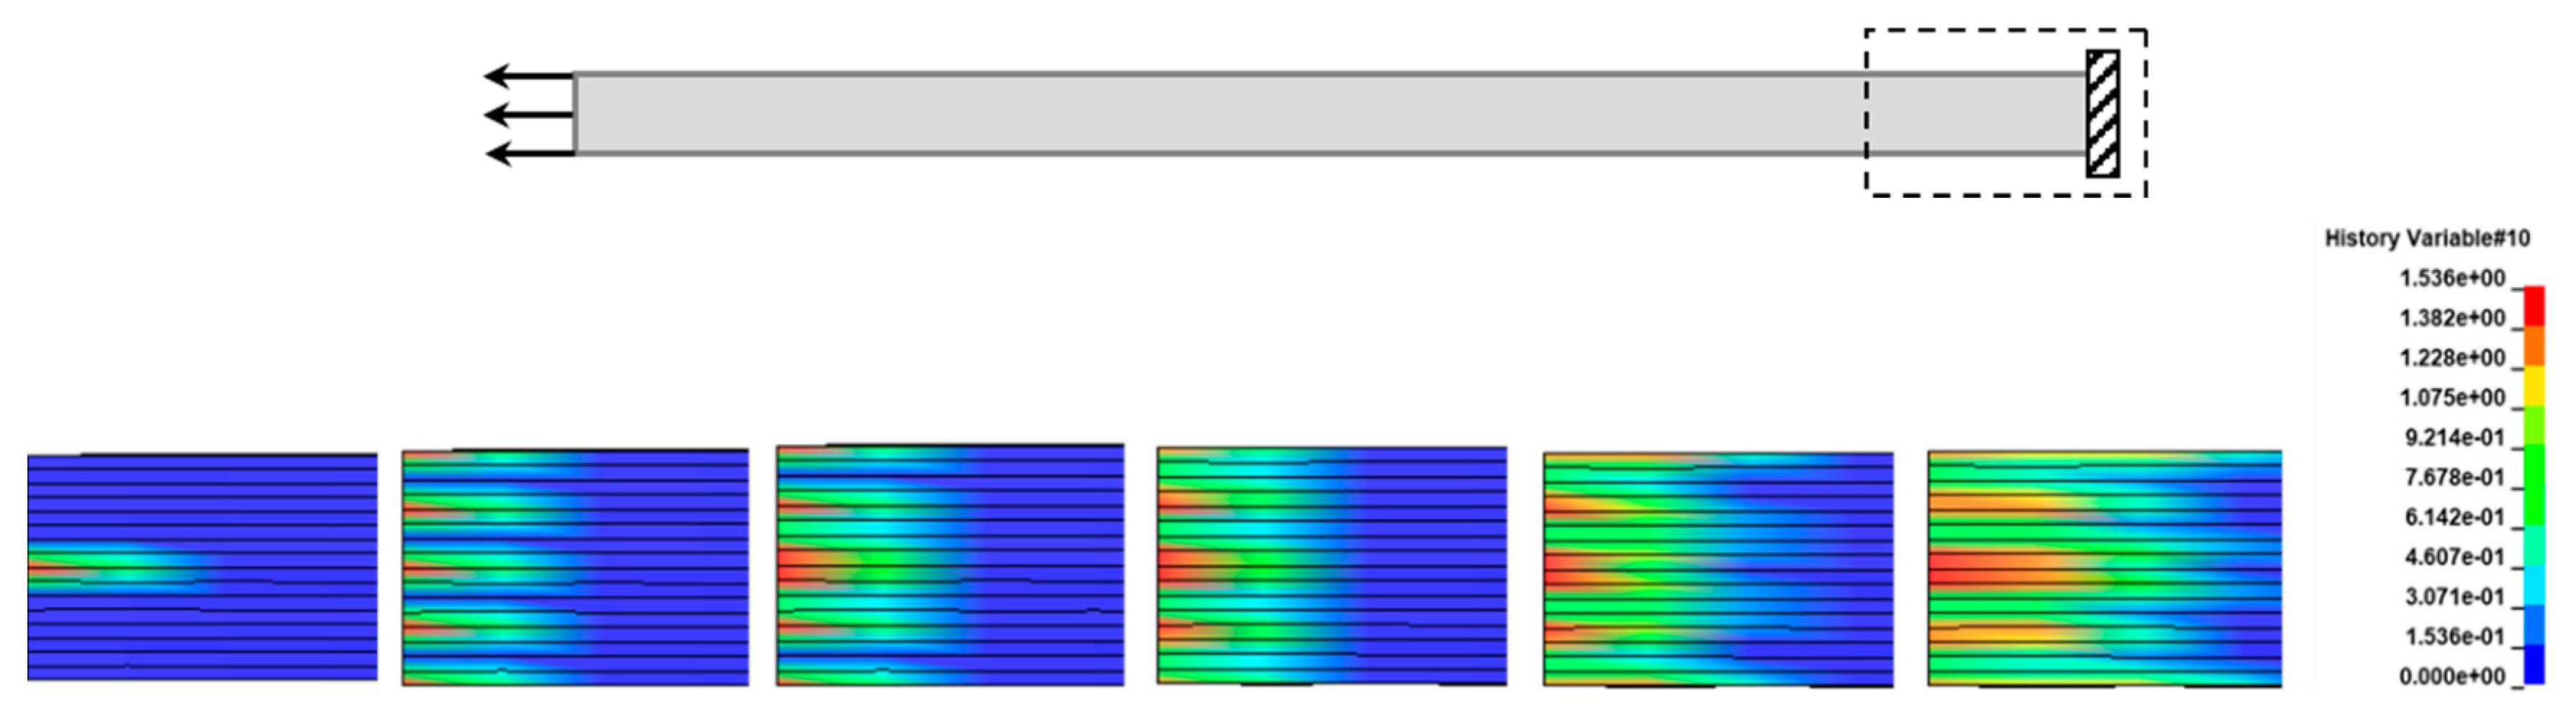
Figure 9.
(a) Delamination propagation due to quasi-static tension (numerically), (b) Delamination in the middle interface due to quasi-static tension (experimentally).
Figure 9.
(a) Delamination propagation due to quasi-static tension (numerically), (b) Delamination in the middle interface due to quasi-static tension (experimentally).
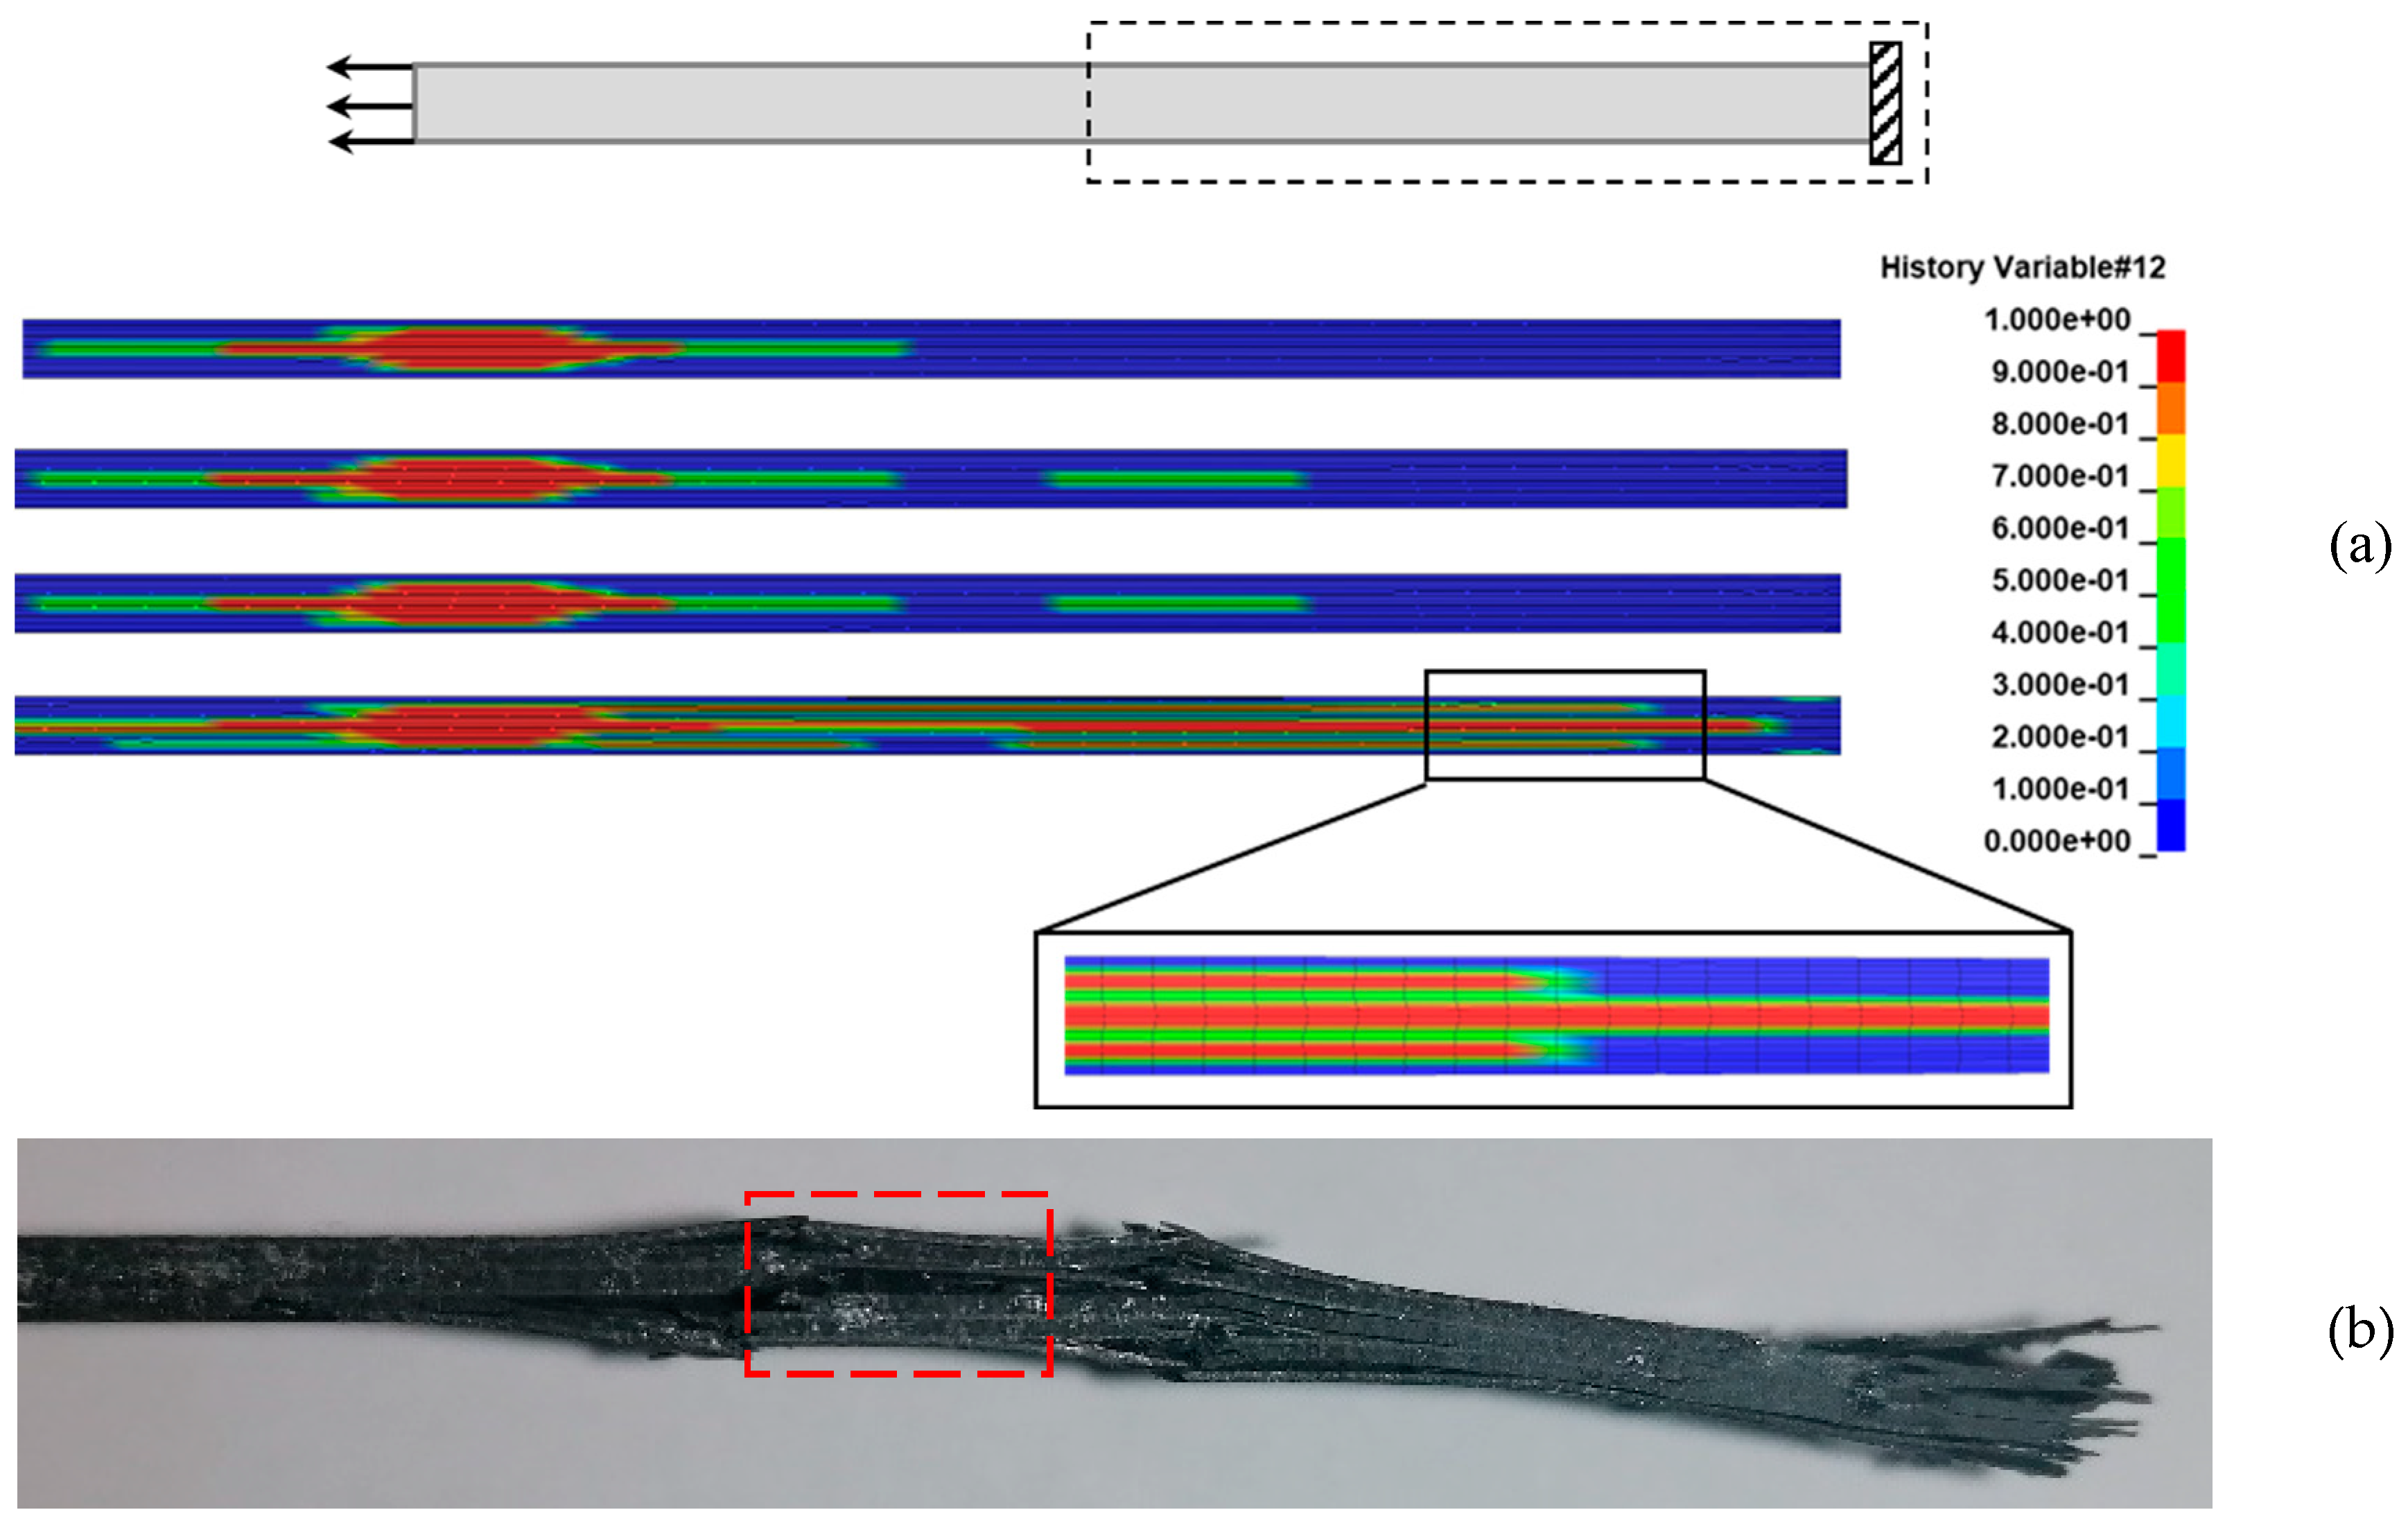
Figure 10.
Fatigue lives of the coupons of the non-interrupted tests.
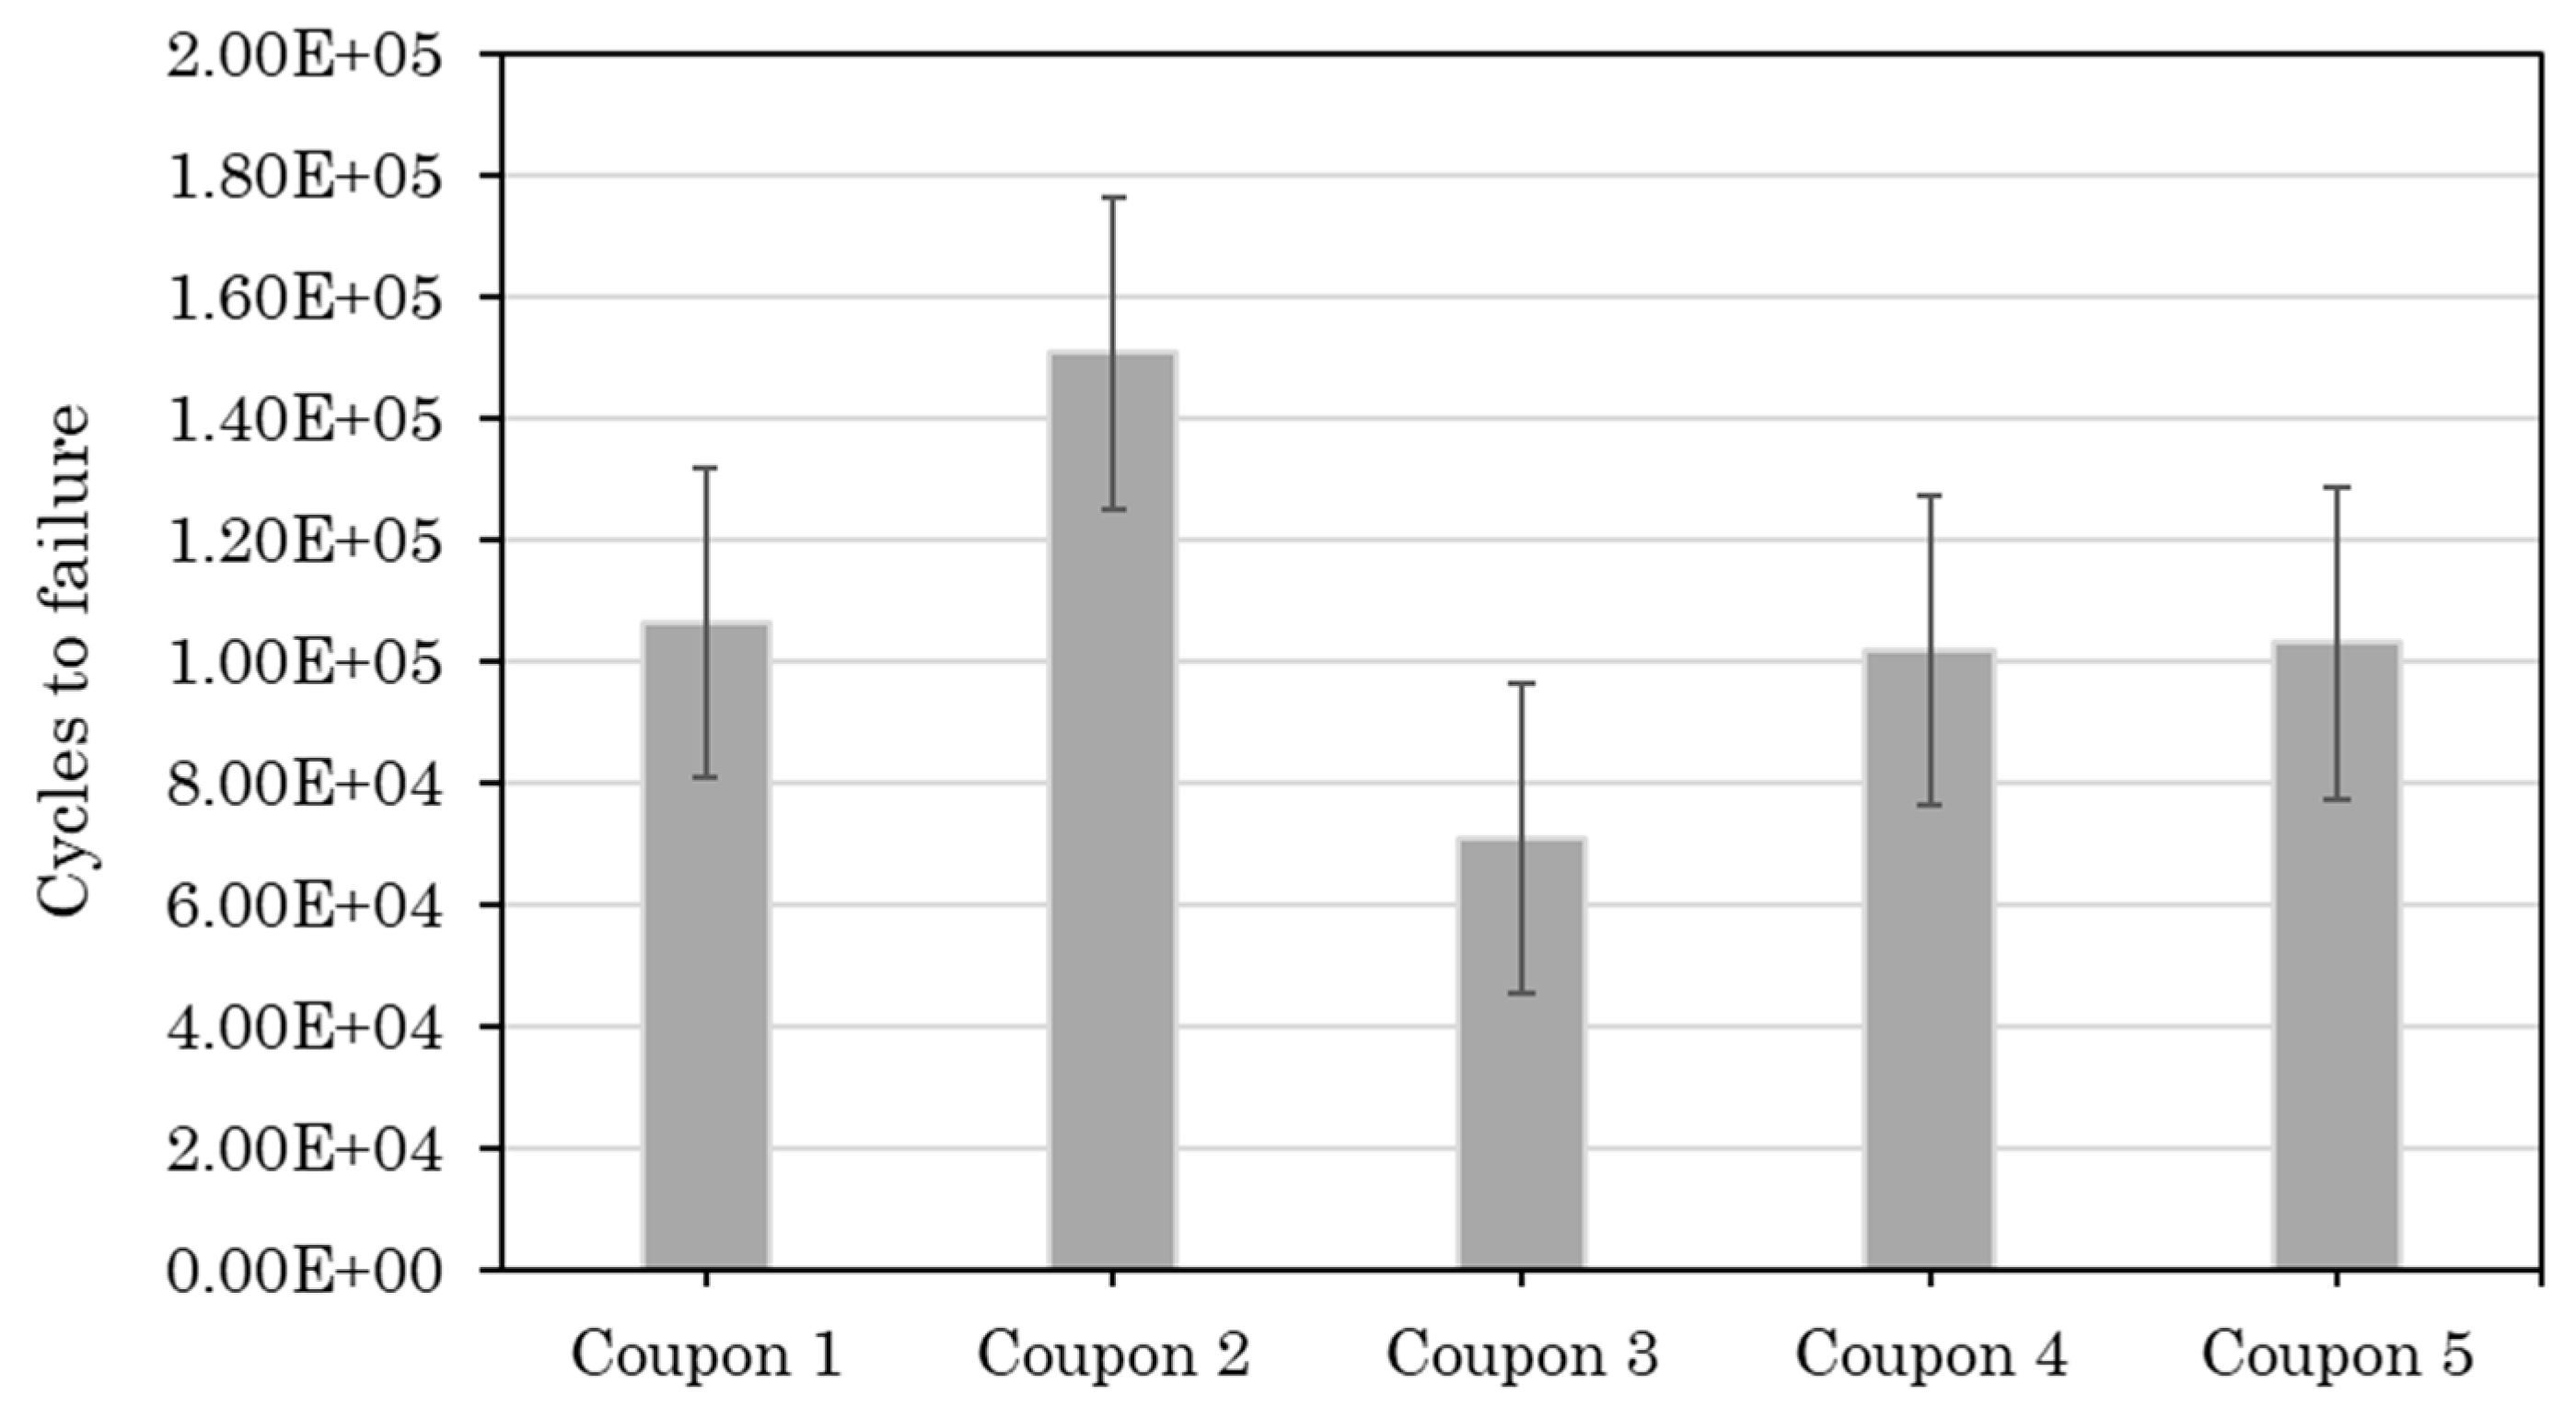
Figure 11.
Fatigue lives of the coupons of the interrupted test.
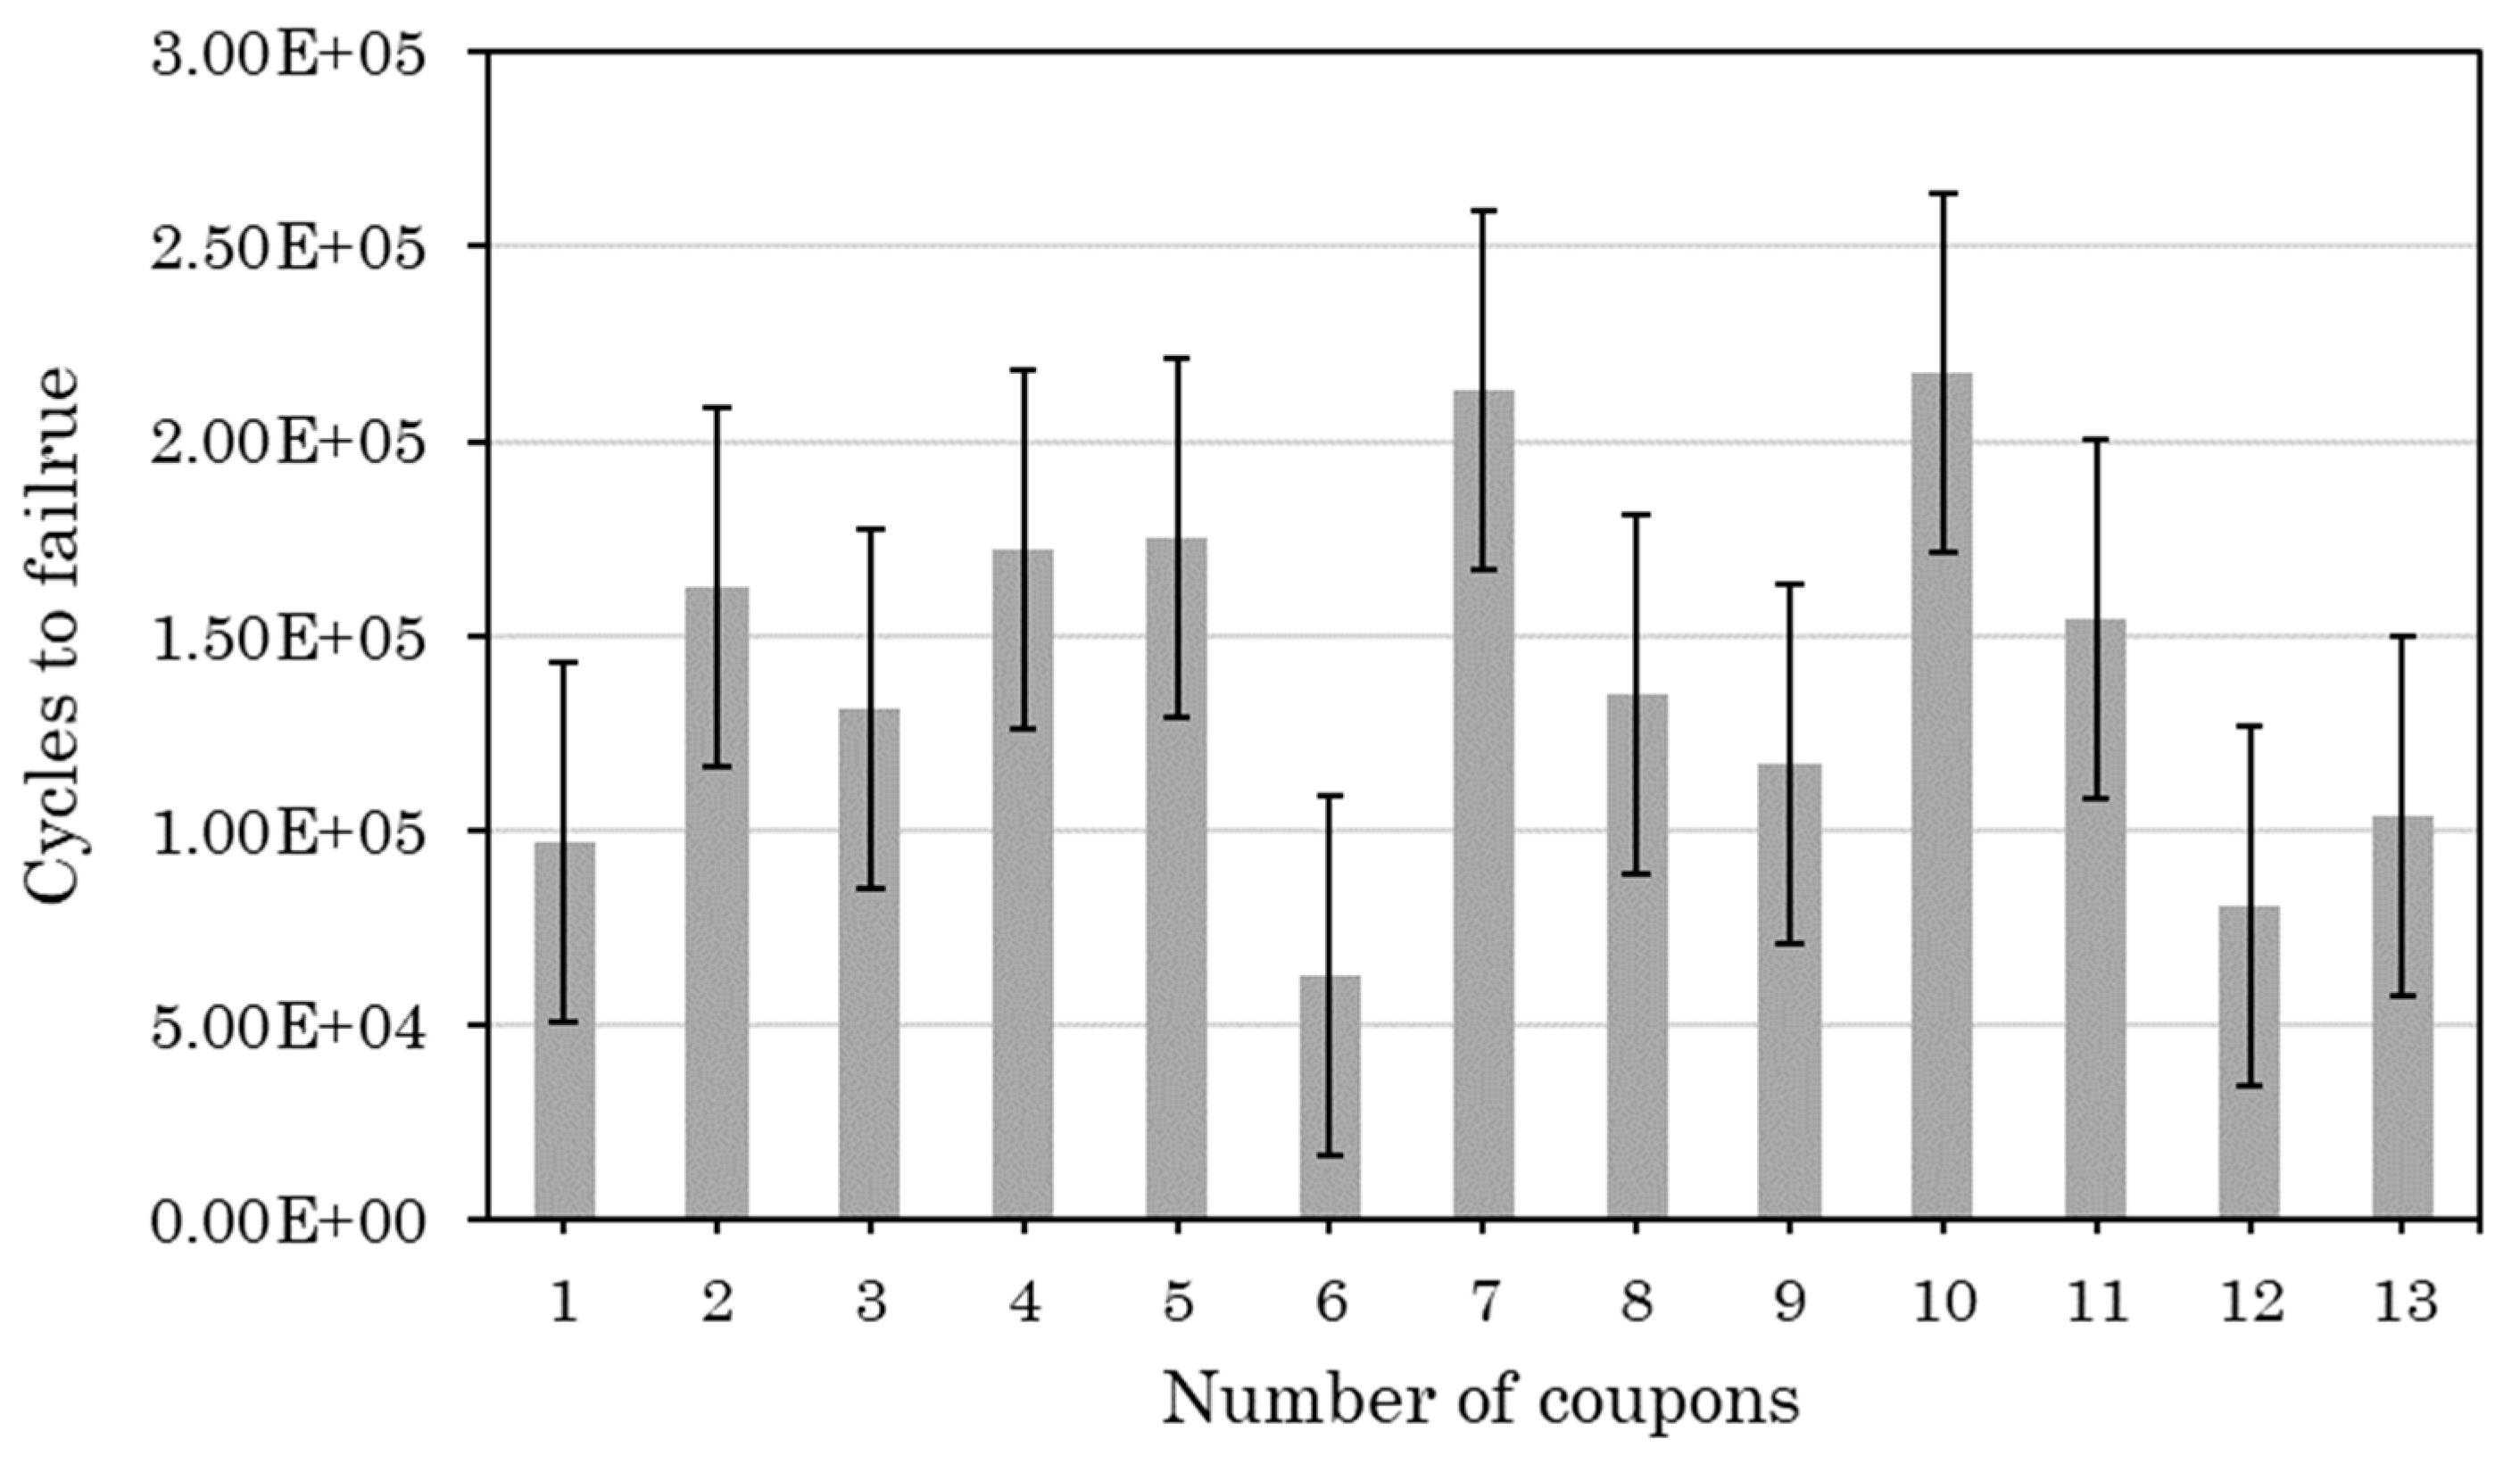
Figure 12.
Comparison between the experimental fatigue delamination growth as detected by C-scanning (images with blue and green color – C-Scan color map at left of the image) and the numerically (images with white and brown color) predicted (-45/90 interface).
Figure 12.
Comparison between the experimental fatigue delamination growth as detected by C-scanning (images with blue and green color – C-Scan color map at left of the image) and the numerically (images with white and brown color) predicted (-45/90 interface).
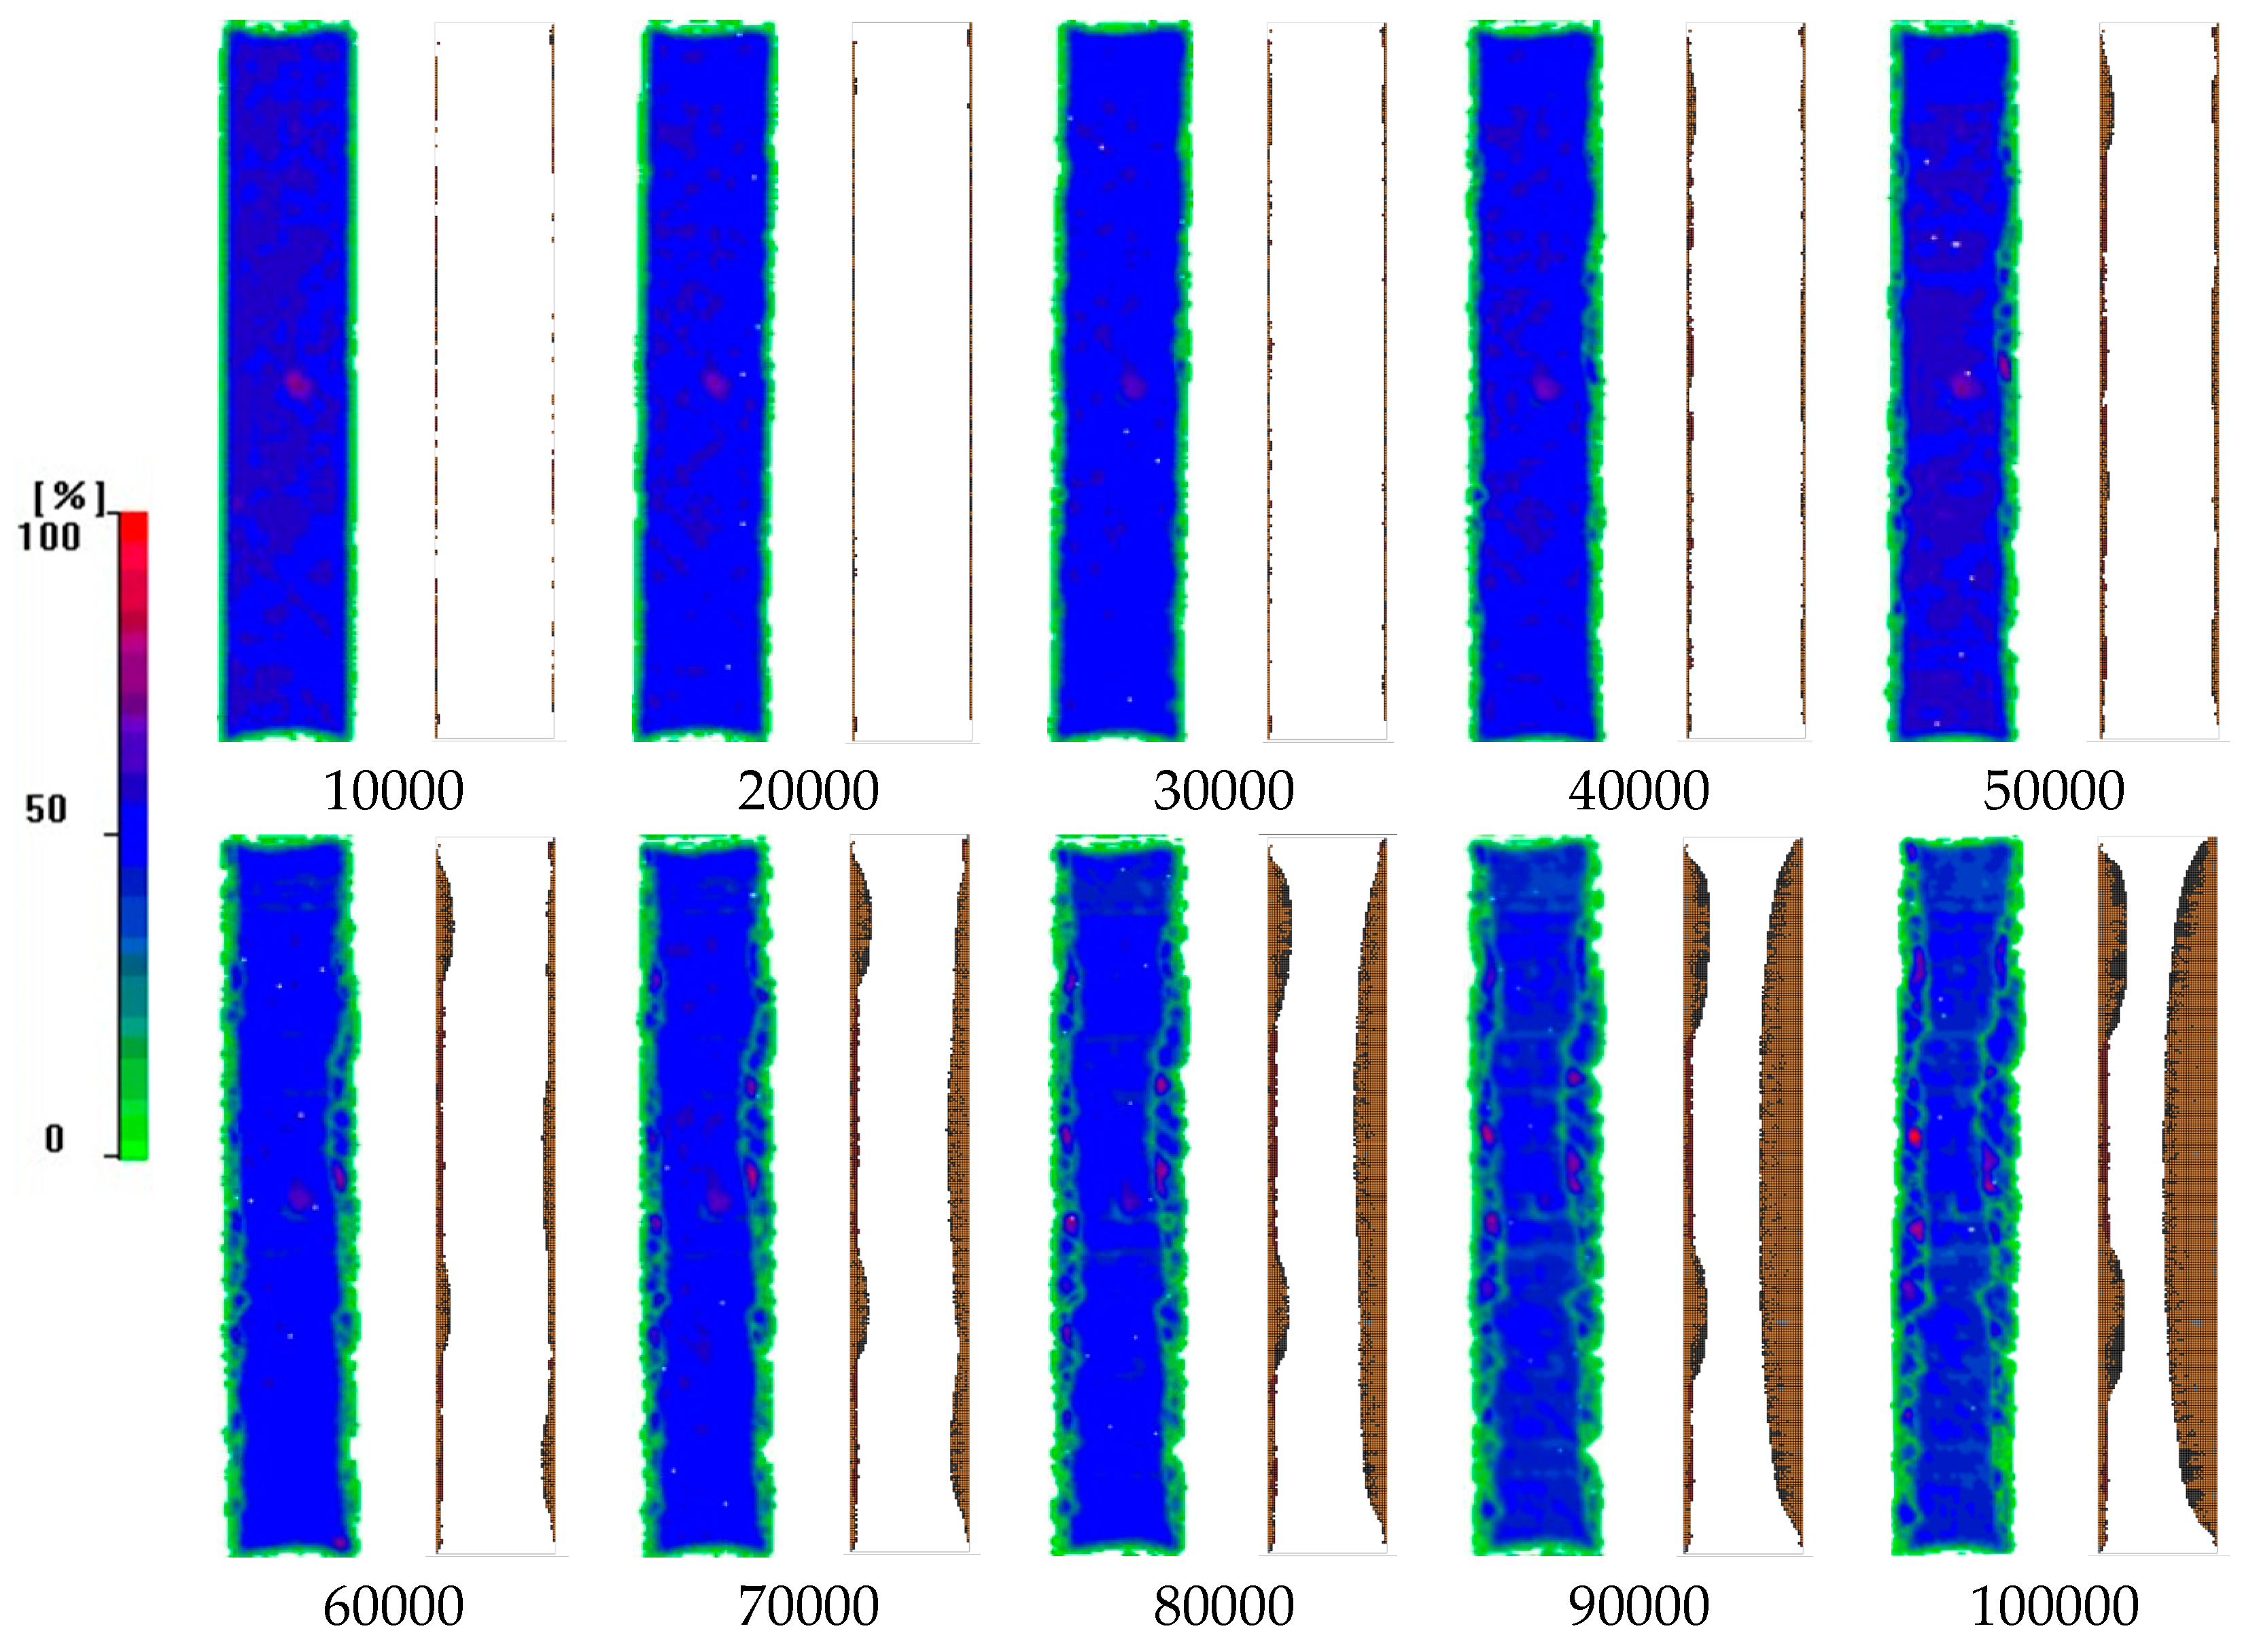
Figure 13.
Predicted fatigue delamination growth at the different ply interfaces.
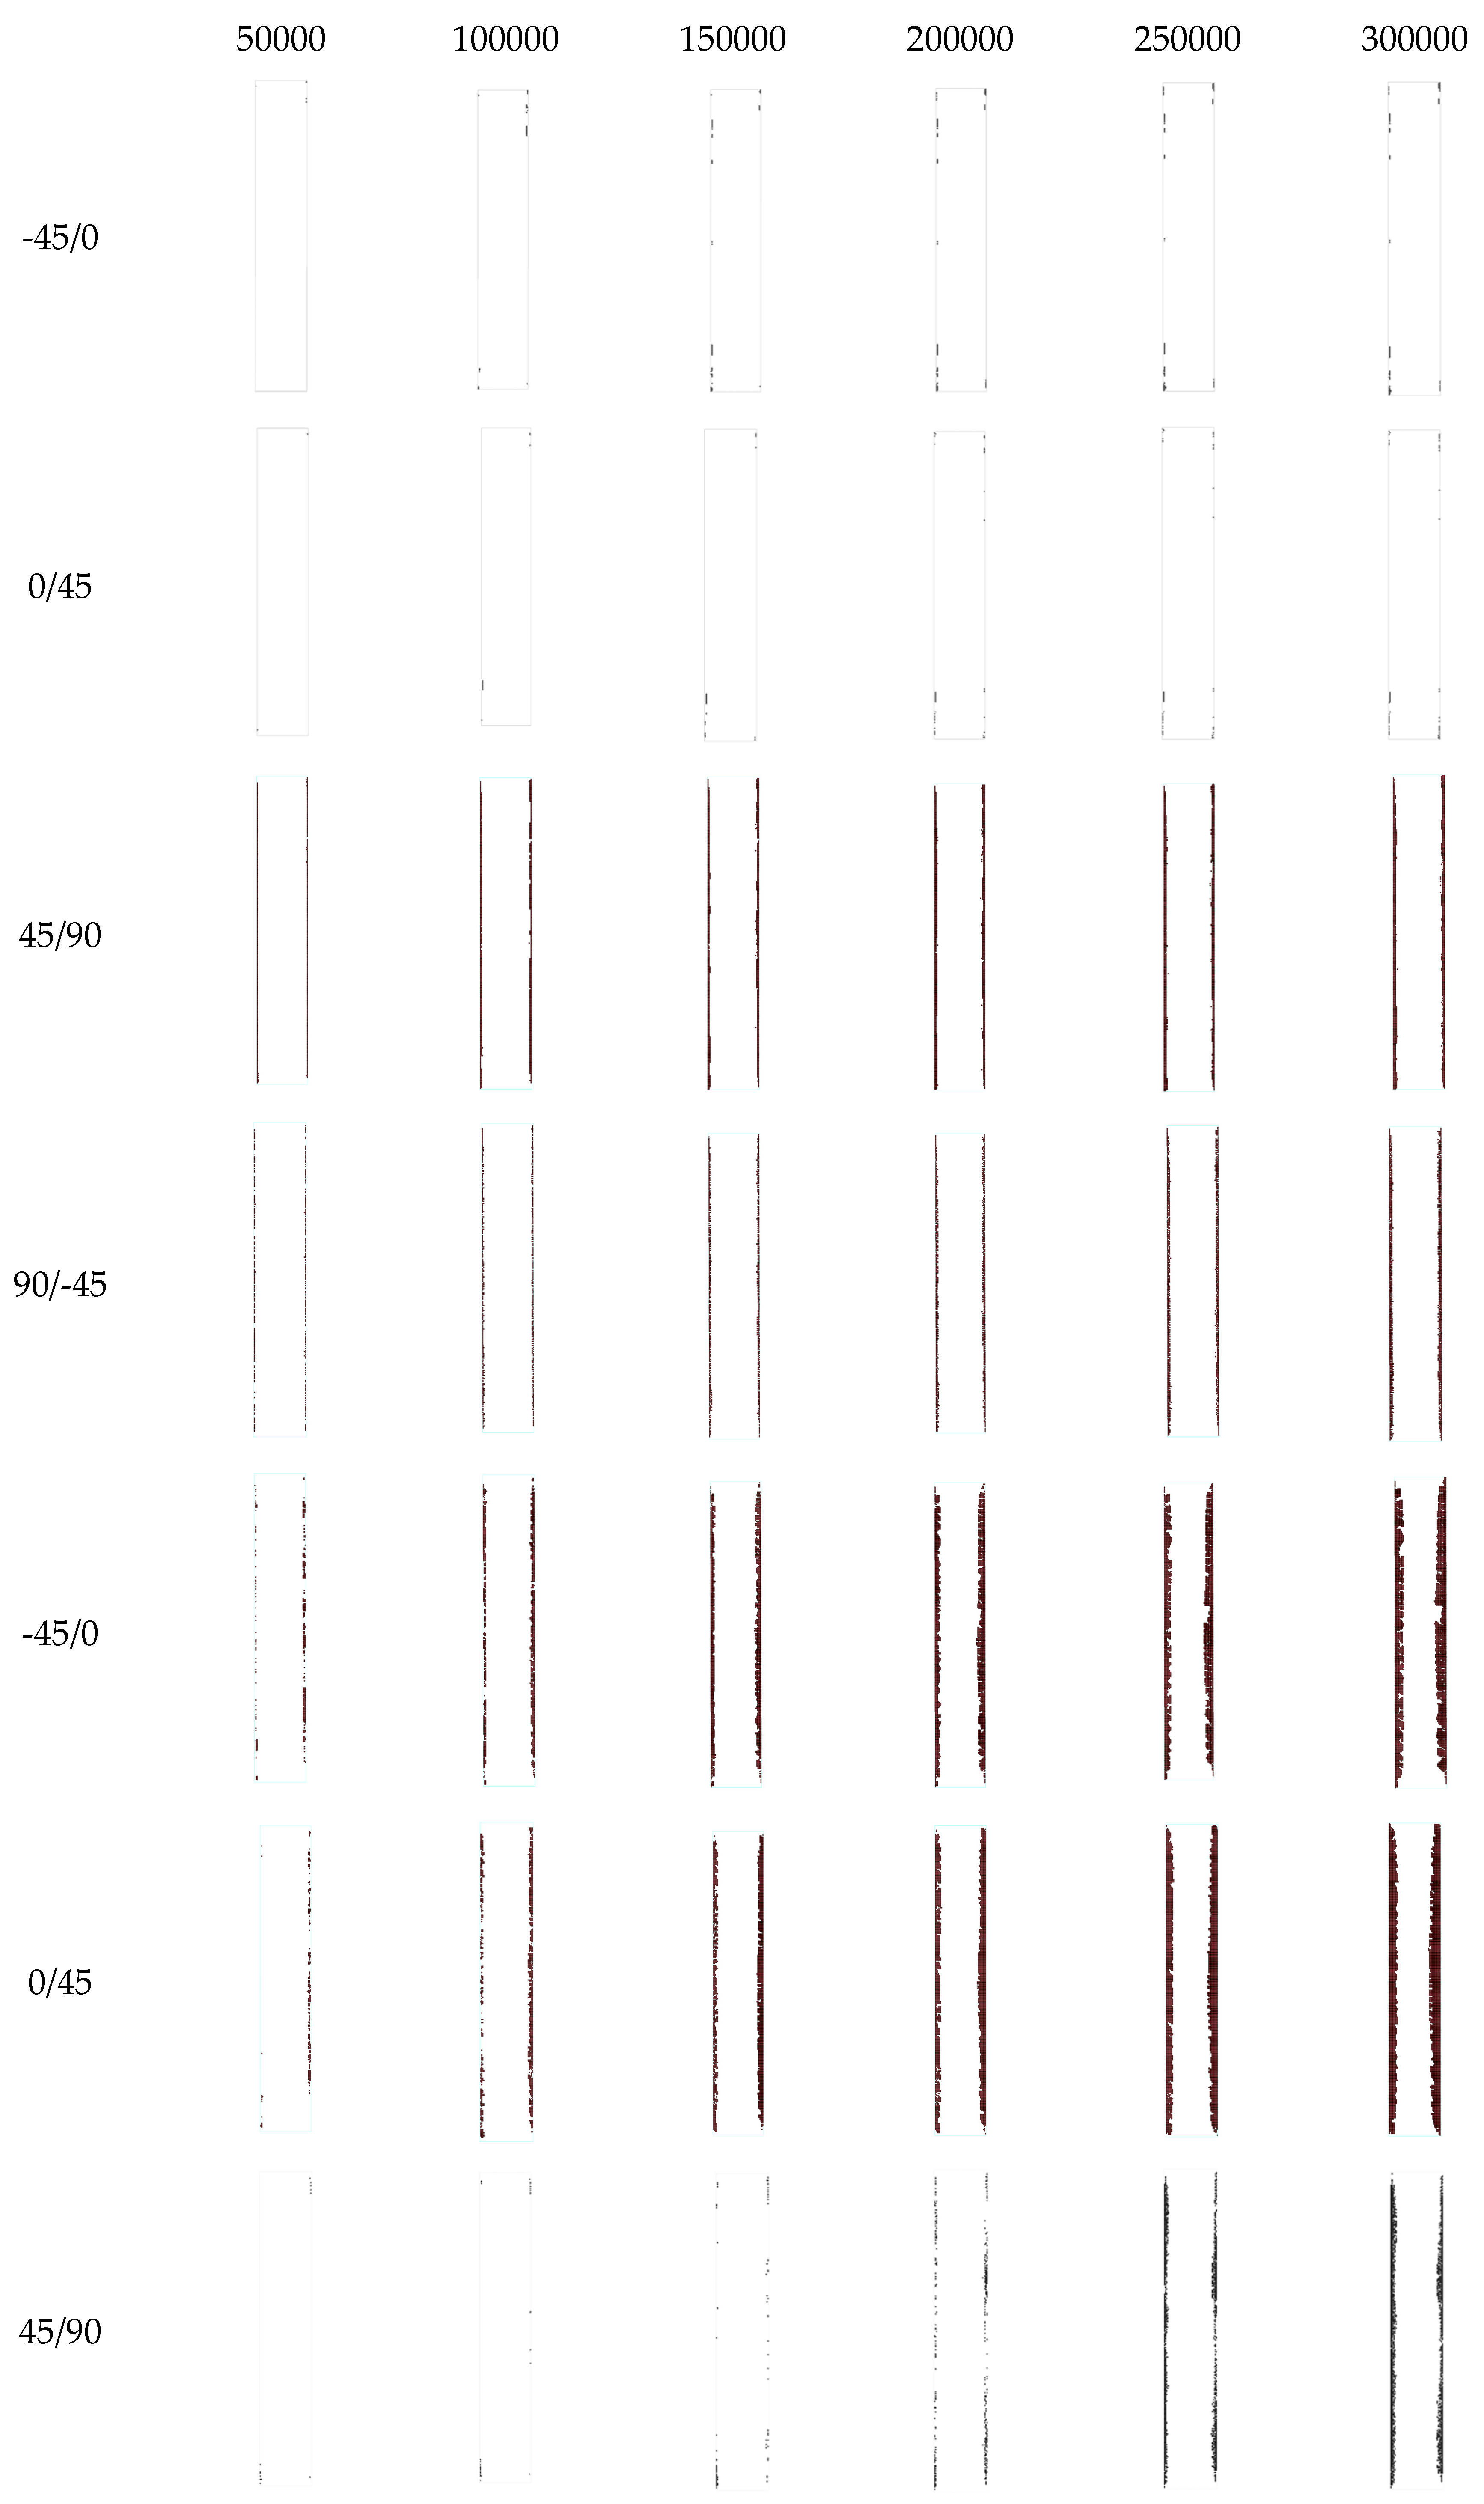
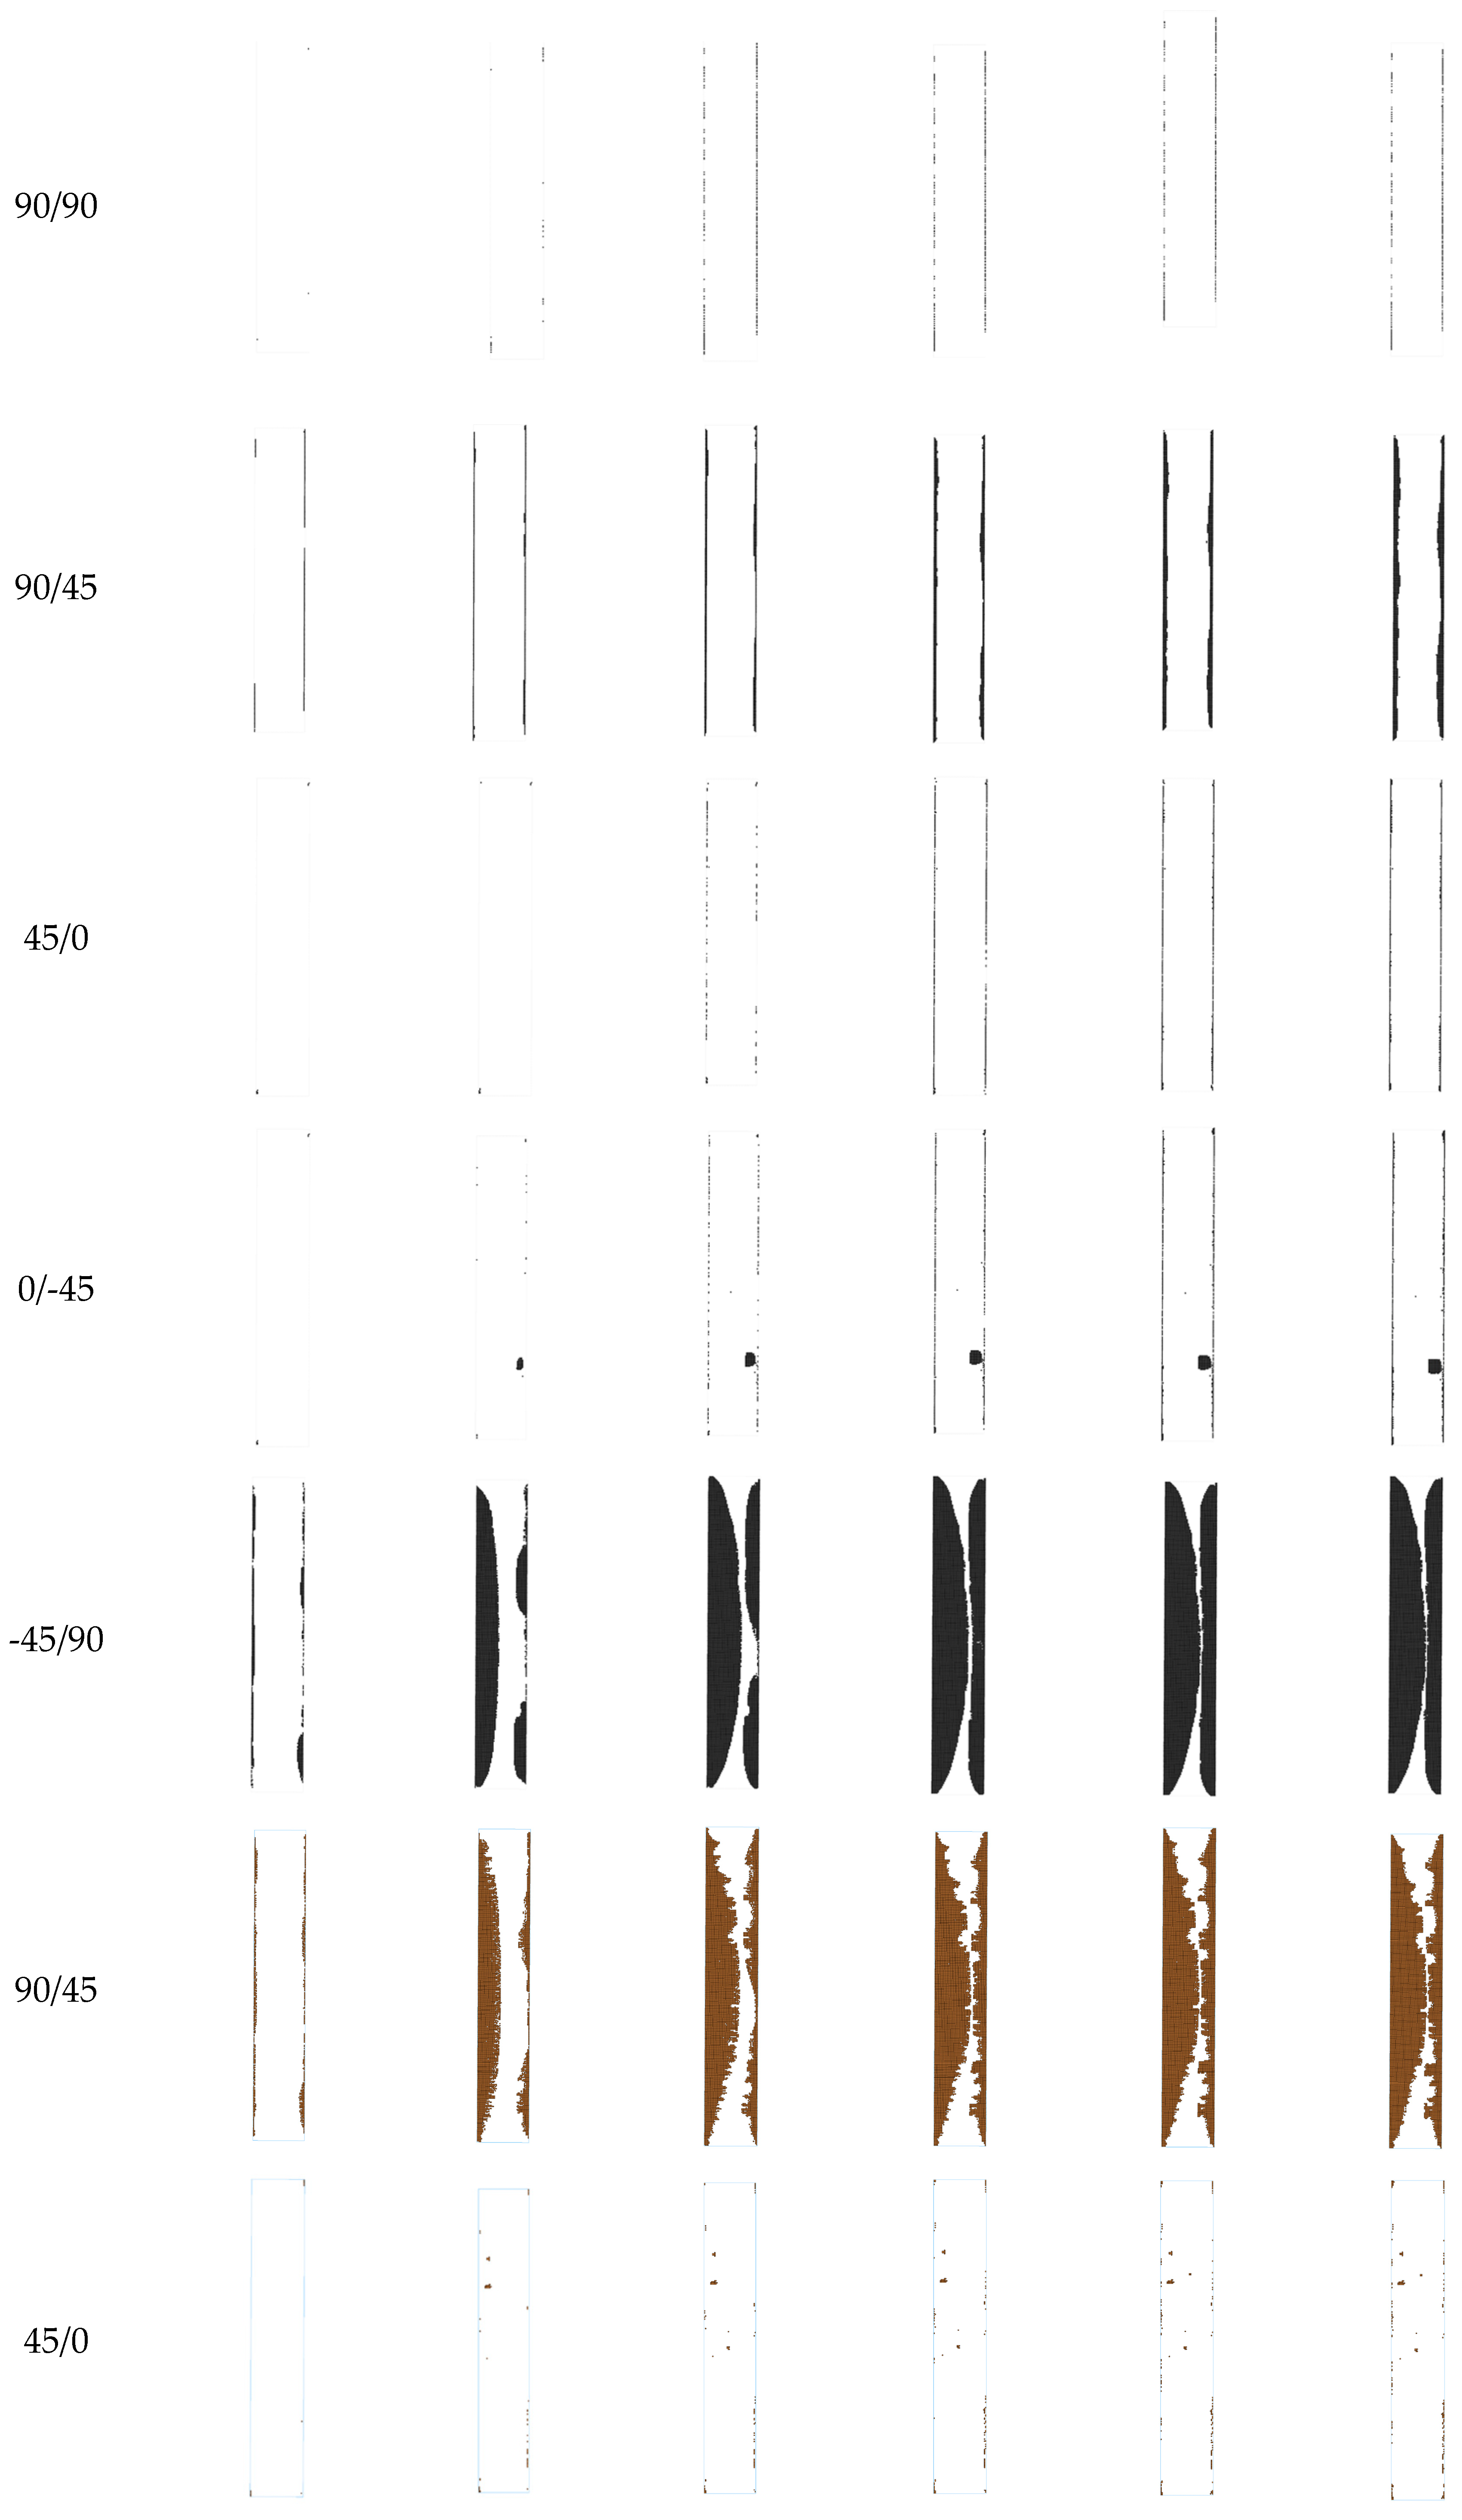
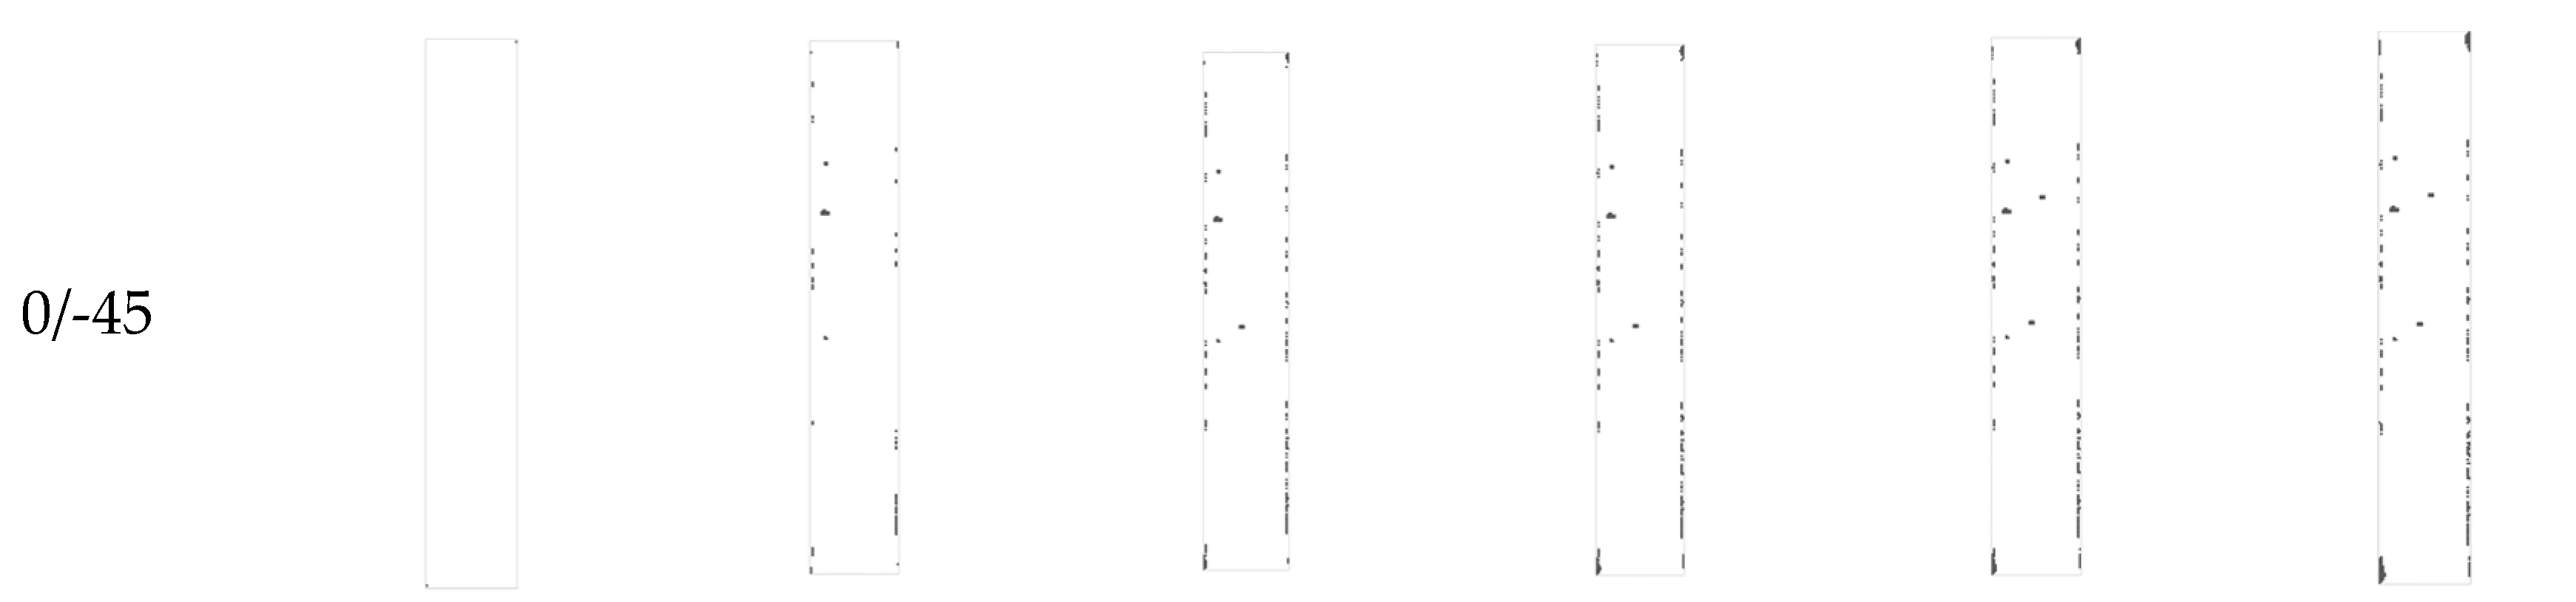
Figure 14.
Side-view images at different fatigue stages of (a) coupon 13 and (b) coupon 10 showing delamination and matrix cracking.
Figure 14.
Side-view images at different fatigue stages of (a) coupon 13 and (b) coupon 10 showing delamination and matrix cracking.
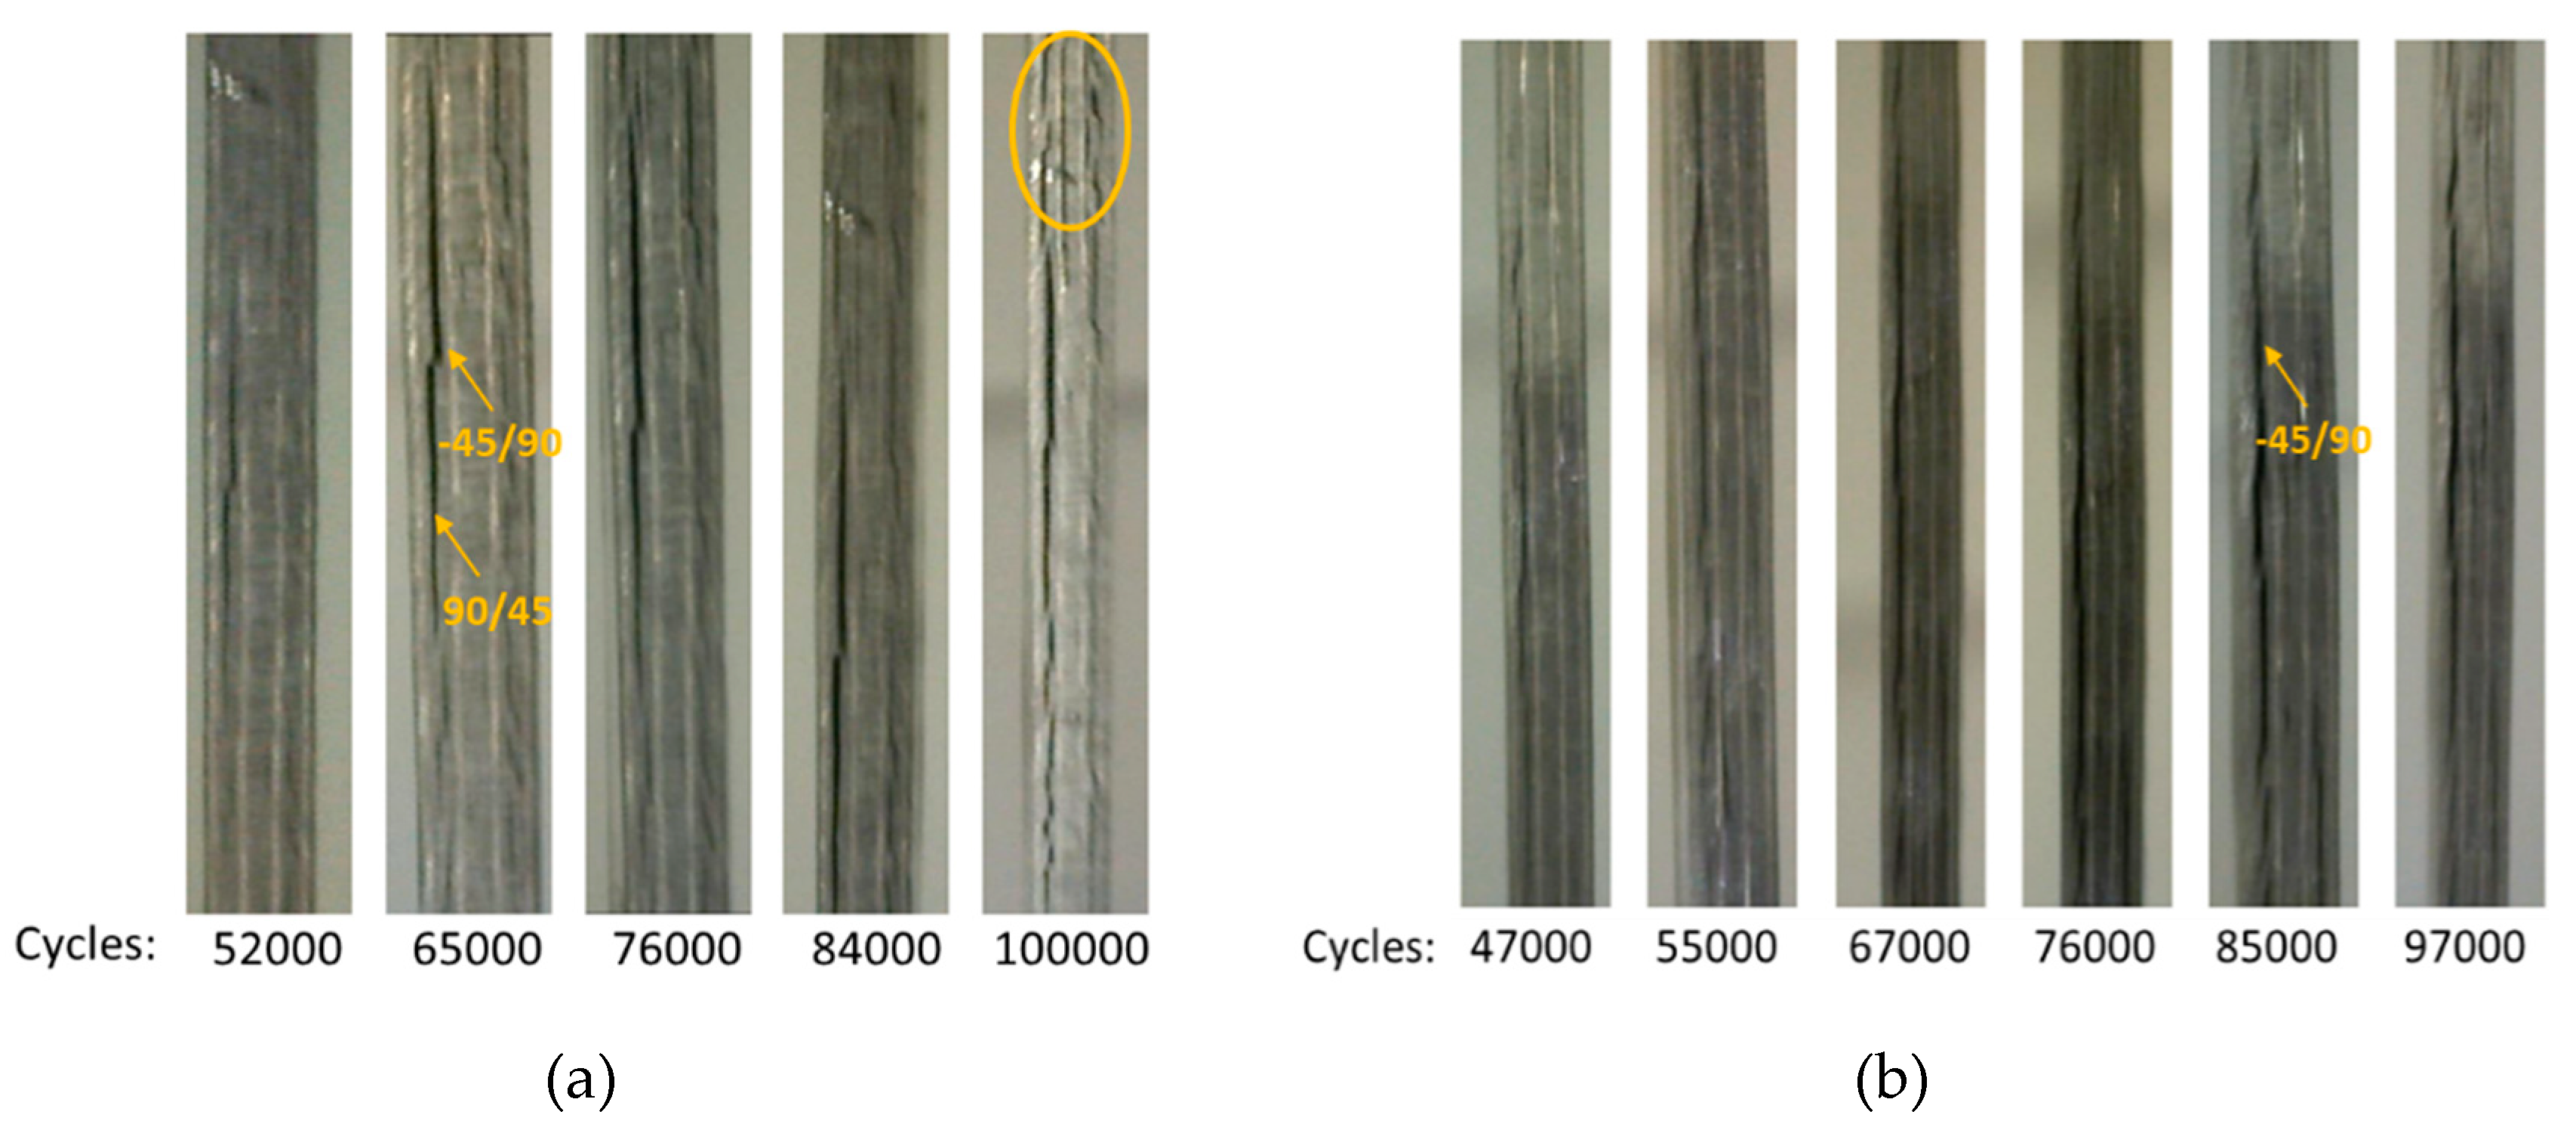
Figure 15.
Experimental vs. numerical residual tensile strength values.
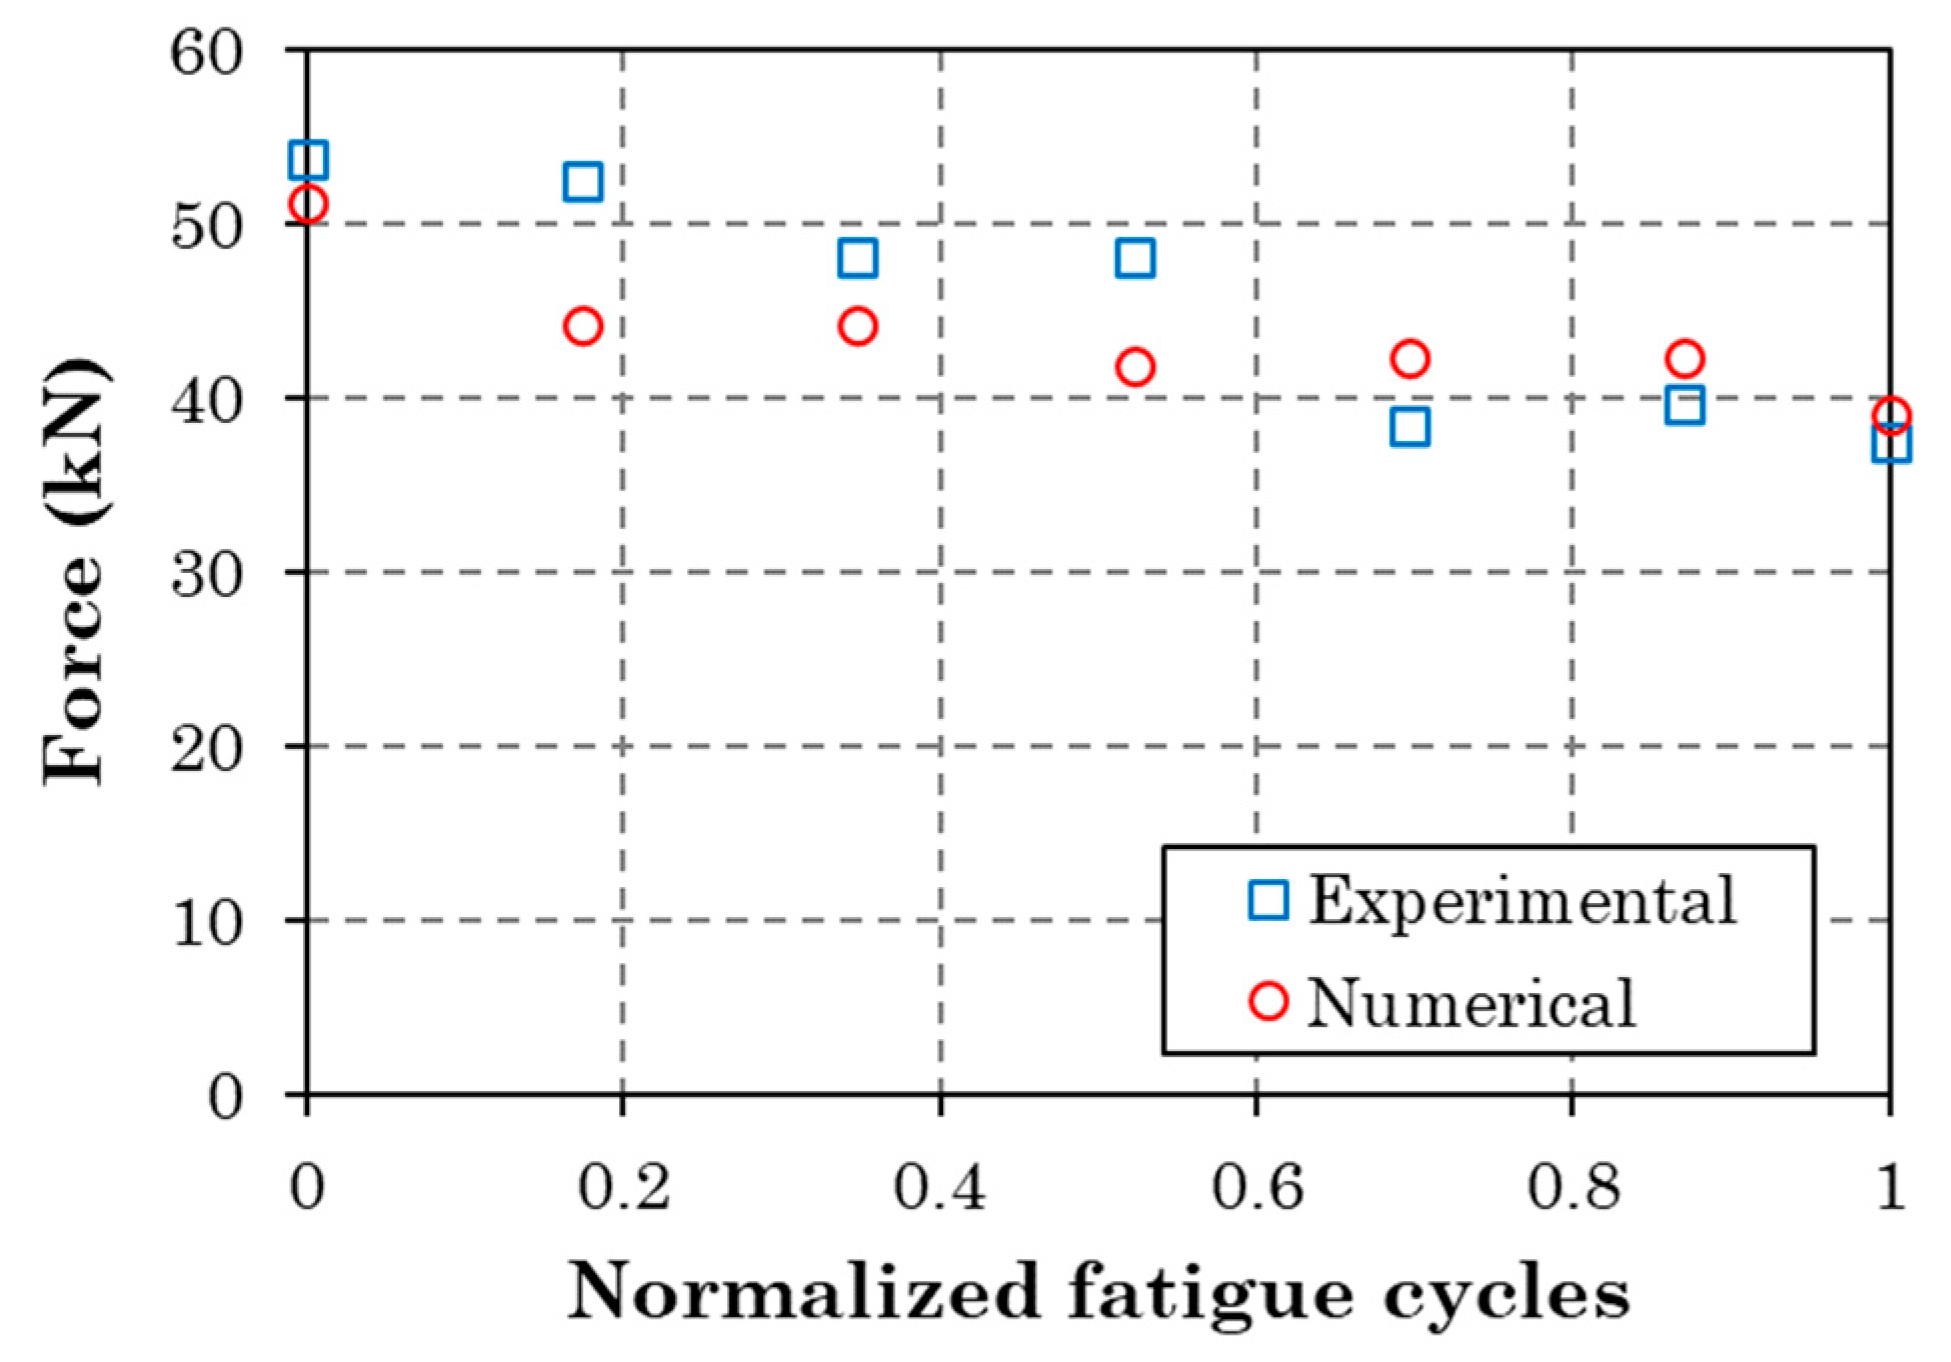
Figure 16.
(a) Predicted deformed shape and fracture areas of a coupon subjected to tension after it has been fatigued for 80 000 cycles, (b) Left fracture area in the coupon after the test, (c) Right surface area in the coupon after the test.
Figure 16.
(a) Predicted deformed shape and fracture areas of a coupon subjected to tension after it has been fatigued for 80 000 cycles, (b) Left fracture area in the coupon after the test, (c) Right surface area in the coupon after the test.
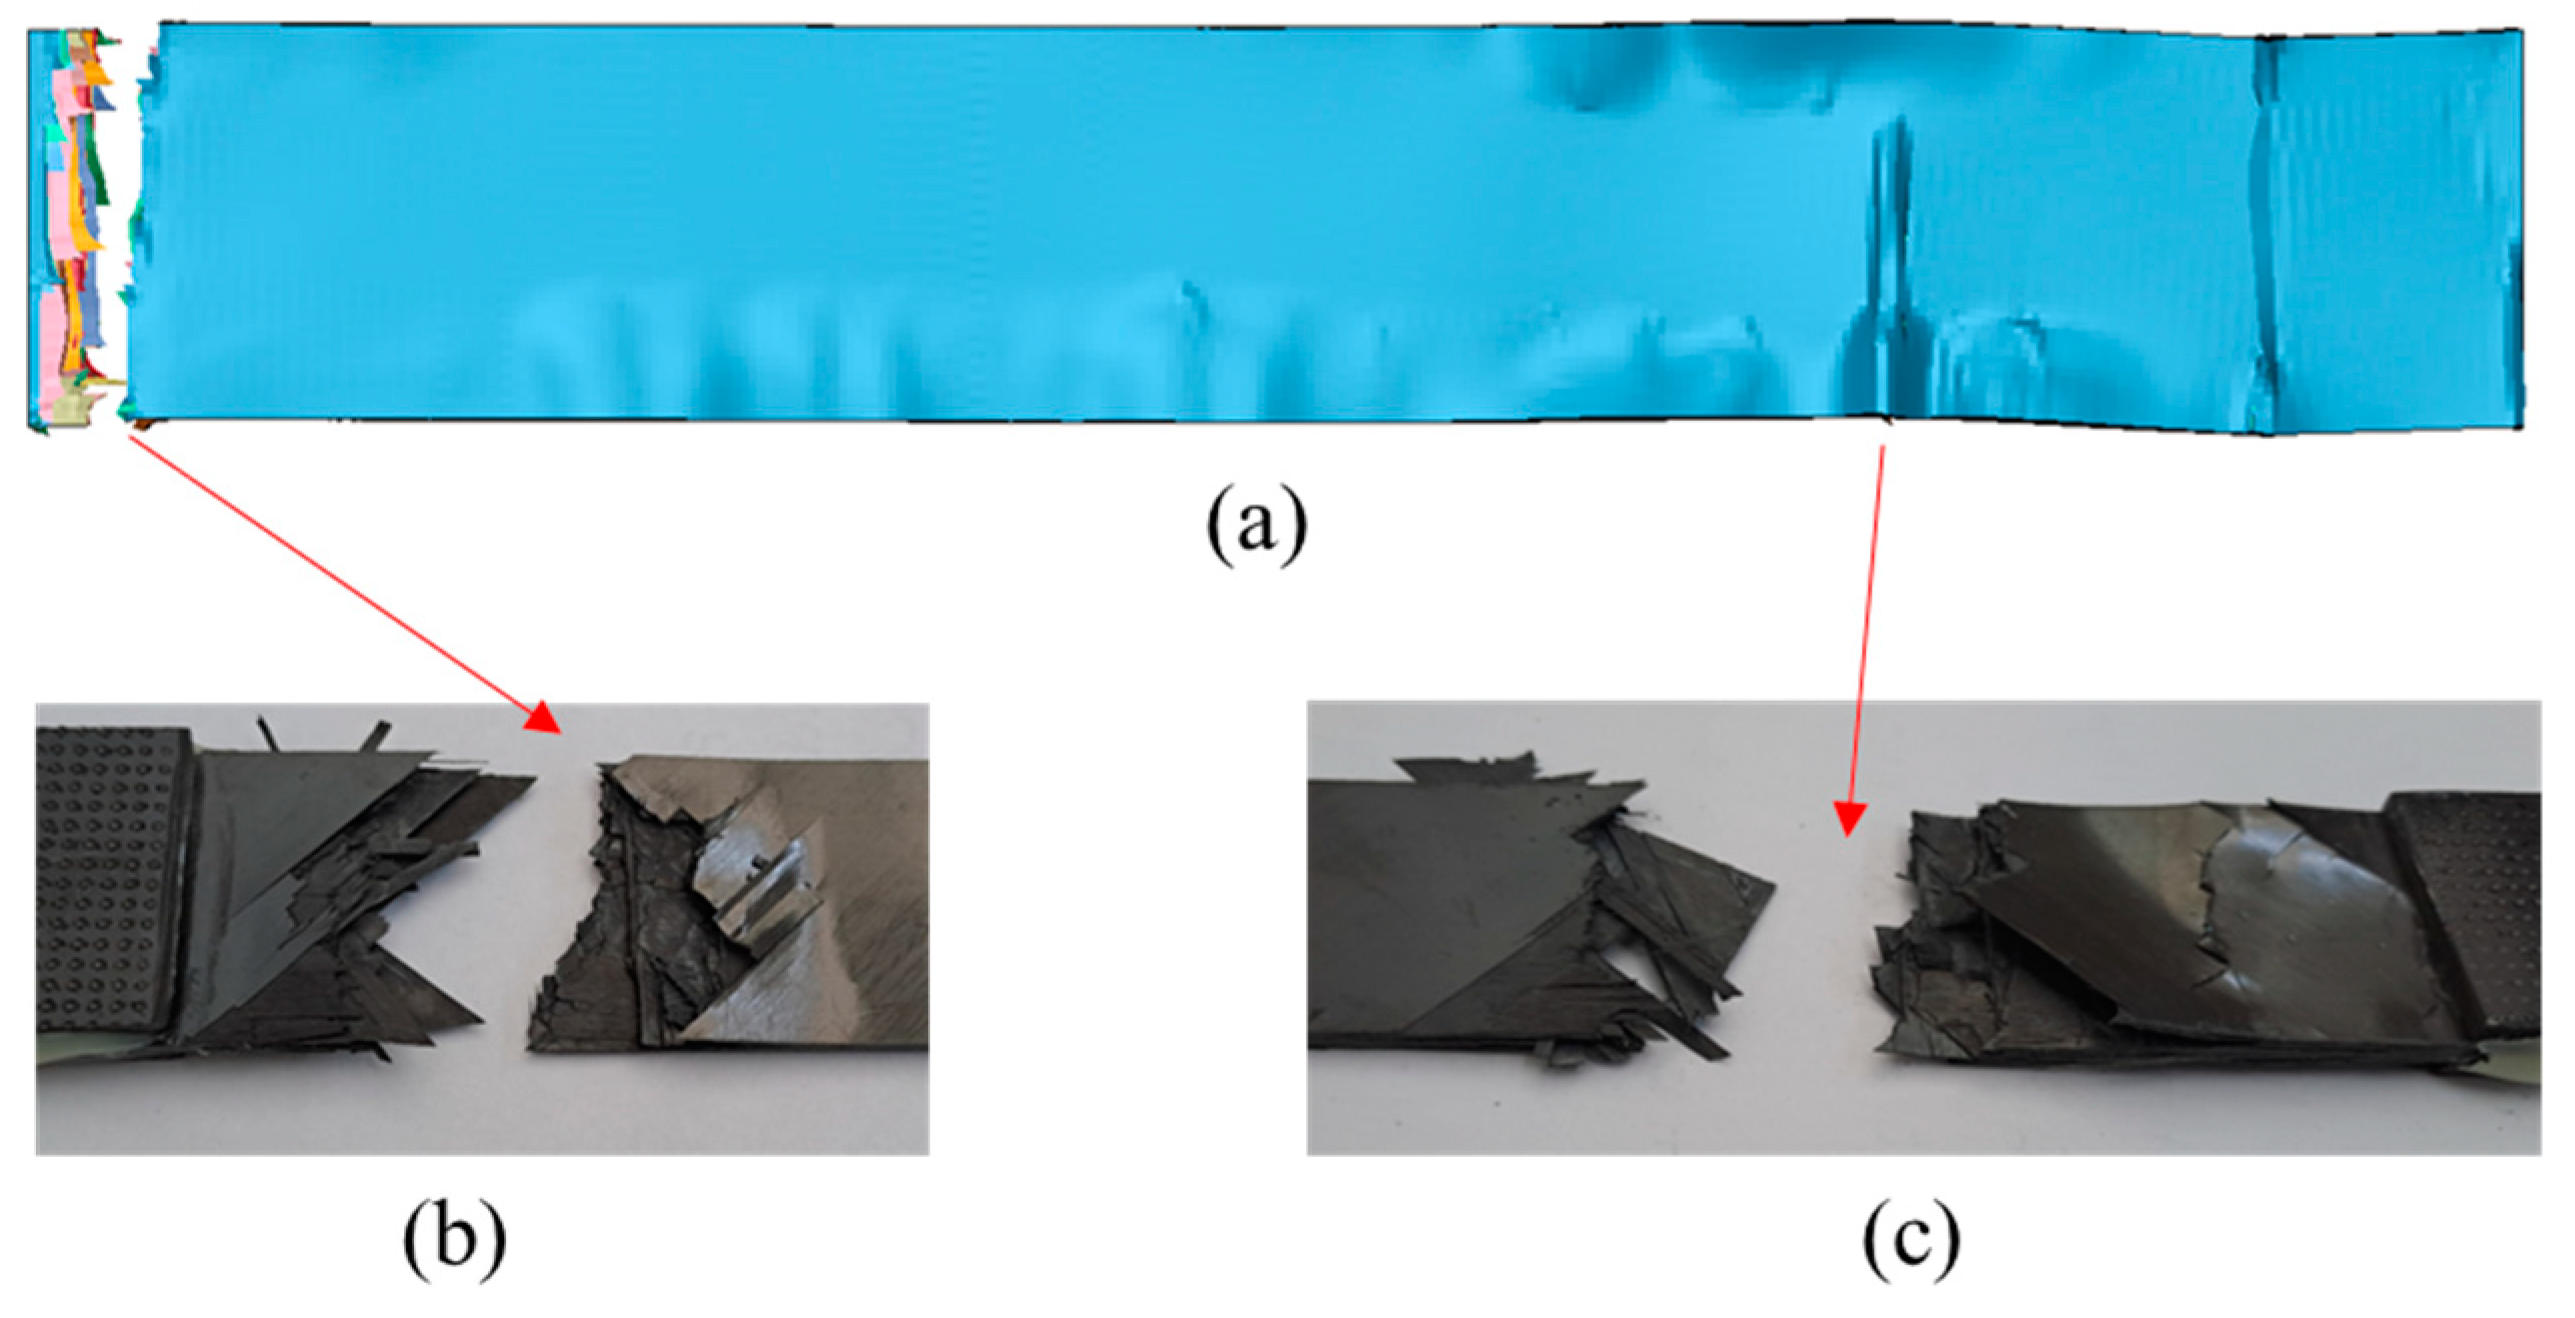

Table 1.
Damage modes of the Hashin and Matzenmiller progressive damage failure modes [18].
Table 1.
Damage modes of the Hashin and Matzenmiller progressive damage failure modes [18].
 |
| Mechanical Property | Value |
| ρ [ton/mm3] | 1.75-9 |
| E11 [MPa] | 95 000 |
| E22 [Mpa] | 8 500 |
| E33 [Mpa] | 8 500 |
| v21 [-] | 0.027 |
| v31 [-] | 0.024 |
| v32 [-] | 0.172 |
| G12 [Mpa] | 4 300 |
| G23 [Mpa] | 3 571.4 |
| G13 [Mpa] | 4 300 |
| SAT [Mpa] | 4 000 |
| SBT [Mpa] | 150 |
| SCT [Mpa] | 300 |
| Traction – Normal direction [Mpa] | 86 |
| Traction – Transverse direction [Mpa] | 42 |
| GI,c [N•mm] | 2.1 |
| GII,c [N•mm] | 2.6 |
Disclaimer/Publisher’s Note: The statements, opinions and data contained in all publications are solely those of the individual author(s) and contributor(s) and not of MDPI and/or the editor(s). MDPI and/or the editor(s) disclaim responsibility for any injury to people or property resulting from any ideas, methods, instructions or products referred to in the content. |
© 2023 by the authors. Licensee MDPI, Basel, Switzerland. This article is an open access article distributed under the terms and conditions of the Creative Commons Attribution (CC BY) license (http://creativecommons.org/licenses/by/4.0/).
Copyright: This open access article is published under a Creative Commons CC BY 4.0 license, which permit the free download, distribution, and reuse, provided that the author and preprint are cited in any reuse.


