Submitted:
10 December 2023
Posted:
11 December 2023
Read the latest preprint version here
Preprints on COVID-19 and SARS-CoV-2
Abstract
Background: In America, vaccine-related deaths constitute a significant contributor to child mortality. An essential means of reducing this is through broad vaccine coverage. The COVID-19 pandemic has posed a potential disruption to vaccine coverage due to its effects on the healthcare system. Objectives: This study aims to evaluate the impact of the COVID-19 pandemic on DTP3 vaccination coverage in the Americas, investigating trends from 2012 to 2022 to identify significant changes, regional disparities, and the overall effect of the pandemic on progress towards global immunization targets. Methods: This study used the coverage data for the third dose of the Diphtheria, Tetanus, and Pertussis Vaccine (DTP3) pulled from UNICEF databases spanning 2012 to 2022. We conducted a JoinPoint regression to identify points of significant trend changes. The annual percentage change (APC) and 95% confidence intervals (95% CI) were calculated for America and its regions. We also used segmented regression analysis. Using the Chi-square test, we compared DTP3 vaccination coverage for each country between 2019 and 2022. Results: Overall, America saw a decrease in vaccine coverage during this period, with an APC of -1.4 (95% CI -1.8.; -1.0). This trend varied across regions. In North America, the decrease was negligible (-0.1% APC). South America showed the steepest decrease, with an APC of -2.5%. Central America also signif-icantly declined, with an APC of -1.3%. Our findings suggest a concerning trend of declining DTP vaccination rates in the Americas, exacerbated in certain regions, in the wake of the COVID-19 pandemic. The absolute decrease in vaccine coverage in the Americas was -4 % between 2019 and 2022, with the most significant drop observed in Central America (-7 %). However, six countries reported increased vaccination rates post-COVID-19, led by Brazil, with a 7% increase. Conversely, twenty-two countries registered a decline in DTP3 vaccine coverage, with the average decrease being -7.37%. This decline poses a significant challenge to achieving the WHO's target of 90% coverage for the third dose of DTP by 2030, as evidenced by the reduction in the number of countries meeting this target from 2019 to 2022.
Conclusions: The COVID-19 pandemic has impacted vaccine coverage in America, leading to a decrease, especially across Central America.
Keywords:
DTP vaccine
; America
; COVID-19
; Vaccine coverage
; Joinpoint regression
; Health care system
; Vaccination rates
; Trends
; Segmented regression
1. Introduction
Immunization is a cornerstone in public health, pivotal in diminishing the prevalence and severity of infectious diseases and their effects on health outcomes[1,2,3]. Vaccine-preventable diseases remain a significant public health concern globally. Diphtheria, Tetanus, and Pertussis (DTP) vaccines prevent these life-threatening diseases, especially among children. The DTP vaccine's broad coverage is imperative for public health protection. However, the COVID-19 pandemic, emerging in early 2020, posed significant challenges to healthcare systems globally[4], potentially impacting routine immunization services, including DTP vaccination. Programs emphasizing immunization, especially those incorporating the DTP vaccine, are central to reducing the worldwide incidence of diseases preventable by vaccines, thereby improving the lives of countless individuals[5,6,7,8]. The World Health Organization (WHO) launched in response to this global health challenge, the Global Vaccine Action Plan (GVAP) for the period 2011-2020, initiated in 2012, to achieve widespread routine immunization for children across the globe[9]
Child mortality due to vaccine-preventable diseases is a significant concern, with pertussis alone accounting for over 300,000 deaths annually[10]. Factors influencing disparities in vaccination rates include geographic location (urban vs. rural), socioeconomic status, educational level [11,12] and the regularity of maternal prenatal care[13]. Parents in rural areas believe vaccine-preventable diseases (VPD) are not severe enough to justify vaccination[14]. The emergence of the COVID-19 pandemic has placed an extraordinary burden on global healthcare infrastructures, potentially impacting the continuity of standard immunization efforts[15,16,17,18,19,20]. Disruptions in the supply chain of vaccines, the redirection of healthcare resources and personnel to COVID-19 management[21], the logistic challenges of COVID-18 immunization[22], and heightened public reluctance to visit medical facilities due to infection risk have all been implicated in the observed decrease in vaccination rates[23,24,25,26,27,28]. Such a downturn in immunization coverage poses a severe risk to millions of children, leaving them vulnerable to diseases preventable by vaccines[29]. The pandemic has increased the likelihood of outbreaks of VPD [12]. Lower-middle-income regions with low vaccine coverage and circulating vaccine-derived viral strains, such as polio, bore an additional burden of zero-dose children. All over the world, there were 18.2 million zero-dose children in 2021[30] that are more vulnerable to VPDs.[12] Understanding the extent of this disruption is crucial to guide public health policies and strategies for crisis preparedness[31]. Research has shown a global decline of 7.7% in DTP3 coverage and 7.9% in MCV1 (first dose of Measles-Containing Vaccine) coverage up to December 2020[32].
In assessing the success of DTP vaccination programs, we focus on the proportion of infants receiving DTP3, a standard and widely recognized metric[33]. This indicator reflects the effectiveness of the immunization programs in reaching target demographics and completing the primary vaccination series, providing optimal protection against diphtheria, tetanus, and pertussis[34]. The analysis of both DTP1 and DTP3 coverages is essential, with DTP1 coverage indicating the initial reach and engagement of health services [35,36] and DTP3 demonstrating the success in administering the entire course of the vaccine[37]. For instance, a meta-analysis highlighted a significant dropout rate in vaccinations in Africa, with notable variations between countries [35,36]. Discrepancies between DTP1 and DTP3 coverages can shed light on challenges in patient retention and other barriers such as healthcare access, affordability, and education[37]
Two countries in America were included in the Immunization Agenda 2030 in 2021: Brazil was ranked seventh, and Mexico in 15th. In 2022, Mexico disappeared from the list, and Brazil descended to the eighth position[38].
The pandemic's disruption had widespread implications for DTP vaccination coverage. Healthcare resources were reallocated to address the pandemic, leading to the neglect of routine vaccination programs. Social distancing and lockdowns are public health measures that may have hindered access to vaccination services. Moreover, the pandemic could have affected public perception and confidence in vaccines, further challenging vaccination efforts. In the United States, during the pandemic, there was a decrease in pediatric primary care visits[39]. Recent data points to a substantial impact of the COVID-19 pandemic on DTP vaccination trends[40]. A significant decline in administered doses of DTP-containing vaccines was observed in the first half of 2020. This trend was not limited to specific regions but was a global phenomenon with varying degrees of impact across various parts of the world. In Africa, for instance, there was a notable decrease in DTP3 coverage post-2019[41].
Similarly, a decline in vaccination coverage for multiple vaccines was observed in Latin America, with catch-up strategies implemented to address missed vaccinations[42]. Reports from WHO and UNICEF indicate a notable global decrease in child vaccinations, with DTP3 coverage falling by 5% between 2019 and 2021[30]. The CDC's 2021 data confirms this trend, showing the lowest global DTP3 coverage since 2008[43]. From 2021 to 2022, there was a notable increase in global vaccination coverage for the first dose of the DTP vaccine, from 86% to 89%, and measles-containing vaccine, from 81% to 84%. However, these levels did not return to the pre-pandemic coverage rates of 90% and 86%, respectively. Despite the challenges of the pandemic, there have been signs of recovery. By 2022, global DTP immunization coverage nearly returned to pre-pandemic levels, although millions of infants still lacked initial or complete vaccination[35,44]. This recovery highlights the resilience of health systems and the importance of ongoing assessment and implementation of catch-up vaccination strategies, particularly for vulnerable populations, to ensure vaccine coverage equity and health system resilience. This recovery in vaccination coverage was uneven across different regions and countries, with slower progress in low-income countries[45]. This data, part of the World Health Assembly's endorsement of the Immunization Agenda 2030 (IA2030), highlights the ongoing challenge of restoring and improving global vaccination coverage after the COVID-19 pandemic, particularly among low- and lower–middle–income countries[46].
This study aims to analyze the trends in DTP3 vaccination coverage in America from 2012 to 2022, emphasizing the influence of the COVID-19 pandemic. Based on the evidence discussed, we posit that the pandemic has adversely affected vaccination rates [43,46].
Considering the available data, we observe a significant global impact of the COVID-19 pandemic on DTP vaccination trends. Reports from WHO and UNICEF highlight a worldwide decline in child vaccinations during this period[47]. The risk for children in developing vaccine-preventable diseases is thus elevated. This study aims to assess the impact of the COVID-19 pandemic on DTP vaccination coverage in the Americas. We hypothesize that the pandemic has led to declining vaccination rates, potentially reversing previous progress toward global immunization targets. This paper examines trends in DTP3 vaccine coverage across the Americas from 2012 to 2022, identifying significant changes and regional disparities considering the pandemic. The findings aim to provide a detailed understanding of the pandemic's impact on DTP vaccination and guide public health strategies to address these challenges, ensuring continued progress towards global vaccination goals. We will focus primarily on the repercussions of the COVID-19 pandemic under the hypothesis that pandemic-related disruptions have affected vaccination programs[43].
2. Materials and Methods
Vaccination rates for each country were extracted from the UNICEF databases, covering 2012 to 2022 [48]. We excluded the following territories: French Guiana, Greenland, Alaska, Anguilla, Aruba, Bermuda, Bonaire, Curaçao, and Guadeloupe. We also obtained regional estimations from the UNICEF database [48]. The data on the number of newborns per country per year was sourced from the UNICEF database[49]. Population figures for the respective countries and years under study were obtained from the World Bank. [50]
2.1. Regional analysis
In an analysis focusing on DTP3 vaccination in the Americas, regional data for South America, Central America, and the Caribbean were computed using vaccination rates population-weighted calculations due to the absence of specific regional information from UNICEF. The countries included in each region were as follows: North America included Canada, Mexico, and the United States. Central America included Belize, Costa Rica, El Salvador, Guatemala, Honduras, Nicaragua, and Panama. In the Caribbean, the study encompassed Antigua and Barbuda, Bahamas, Barbados, Cuba, Dominica, Dominican Republic, Grenada, Haiti, Jamaica, Saint Kitts and Nevis, Saint Lucia, Saint Vincent and the Grenadines, and Trinidad and Tobago. For South America, the countries analyzed were Argentina, Bolivia, Brazil, Chile, Colombia, Ecuador, Guyana, Paraguay, Peru, Suriname, Uruguay, and Venezuela. This method of calculating data, based on the population of each country, was essential for deriving accurate estimations of DTP3 vaccination coverage in these regions. This approach ensured a comprehensive and representative analysis of DTP3 vaccination coverage across the diverse regions of the Americas.
2.2. Statistical analysis
We employed JoinPoint regression analysis for a widely recognized method for analyzing regional and country trends and detecting changes in various data types. Using this method allowed us to detect periods of sustained changes in incidence rates and quantify the magnitude of change in each trend. Joint point regression is a statistical technique that detects points where there is a change in the trend, the so-called "joinpoints." It has been used to study the evolution of vaccinations[41]. Using joint point regression, the annual percentage change (APC) and 95% confidence intervals were estimated to quantify the magnitude of change in each trend. In these models, the vaccine coverage was the dependent variable, while the year was the independent variable. We used the Durbin-Watson to assess the existence of autocorrelation in the time series data [51].
We also used an interrupted time series analysis. Interrupted time series analysis is the most robust quasi-experimental approach for evaluating external events such as the COVID-19 pandemic or interventions[52,53,54]. In our study, there were eleven years, seven years 2012-2019 preCovid, and three years, 2020-2022, post-Covid. The model of the analysis follows the following equation.
Where DTP3t is the number of DTP3 doses administered at year t, Yt is a variable indicating the year of the observation period (2012–2022). Pt is a dummy variable indicating Pandemic at time t coded as "0" for the periods before COVID-19 (2012–2019), and "1" is the code for the period after COVID-19 (2020–2022); YtPt is an interaction term between the time and COVID-19 dummy. εt is the error term, β0 estimates the baseline level DTP3 at the beginning of the period, β1 estimates the change in the number of DPT3 vaccinated children until the start of the COVID-19 pandemic, β2 is the change in the DTP3 number of vaccinated children after the COVID-19 pandemic, and β3 is the difference in the trends of DTP3 vaccinated children before and after the pandemic (effect of COVID-19 during the pandemic).
DTP3𝑡 =𝛽0 + 𝛽1Y𝑡 + 𝛽2P𝑡 + 𝛽3Y𝑡P𝑡 + 𝜀𝑡
We also compared the DTP3 vaccination coverage for each nation in 2019 and their corresponding coverage figures in 2022. Paired sample tests were used to compare DTP coverage between 2019 and 2022. We evaluated the DTP3 vaccination coverage in America by country, comparing the coverage rates across different countries for 2019 and 2022. We used the Chi-Square test, wherein the coverage rates were weighted by the number of newborns in each country for the respective year.
2.3. Software
All joint point computations were done with Joinpoint Regression software (Joinpoint Regression Program, Version 5.0.2. May 2023; Statistical Research and Applications Branch, National Cancer Institute[55,56]. The statistical analysis comparing rates from 2019 to 2022 used IBM SPSS Statistics, version 27 (IBM Corp., Armonk, NY, USA). The interrupted time series analysis was computed as a 'segmented' [57,58,59,60]package in R (version 4.3.1, 2023-06-16 ucrt)[61], under Rstudio ( Version 2023.09.1 Build 494)[62]. This was complemented using the 'ggplot2' package for advanced graphical representations[63] and the 'readxl' package for seamlessly importing Excel data files[64]. Maps were created with Mapchart (v 4.3.2.)[65]. The scale of colors for the maps was elaborated with Colorbrewer (v.2.0)[66,67].
3. Results
Between 2012 and 2021 in the Americas, the third dose DTP vaccination rates displayed an overall annual percentage change (APC) of -1.4%. This decline was statistically significant, with a 95% confidence interval (CI) ranging from -1.8 to 1.0 and a p-value of less than 0.001. The JoinPoint analysis identified two distinct periods within this period. From 2012 to 2016, the APC was -0.7% during the first period, indicating a slight decrease, but this change was not statistically significant (95% CI: -2.9 to 1.5; p=0.464). In contrast, a marked decline was observed in the second period, from 2016 to 2022, where the APC steepened to -1.8% (95% CI: -2.9 to -0.7) with a p-value of 0.008, indicating a significant downward trend. These findings suggest a shift in the trajectory of vaccination rates over the decade, with a notable decline in the latter half of the period (Table 1, Figure 1).
The JoinPoint analysis for regional third DTP dose coverage in America from 2012 to 2022 reveals varied trends across different regions. In North America, the overall annual percentage change (APC) for the total period was -0.1% (95% CI: 0.2 to 0), indicating a negligible decrease in vaccination rates. (Table 2), The change was not statistically significant (p=0.136). There was JoinPoint in 2014. From 2012-14, there was a slight increase; from then on, there was a decrease, as depicted in Figure 2.
In contrast, Latin America and the Caribbean exhibited a more pronounced decline in vaccination rates. The total period APC was -2.1% (95% -2.7 to -1.5, with a statistically significant change (p < 0.001). Further analysis within this region revealed a joint point in 2016. There were two distinct periods: the first period (2012-2016) showed an APC of -0.9%, which was not statistically significant (95% CI: -4.4, 2.6, p=0.531), indicating a stable trend. However, during the second period (2016-2022), the decline in vaccination rates was more substantial, with an APC of -2.7% (95% CI: -4.5, -0.9, p=0.010), indicating a significant decrease in vaccination rates, as shown in Figure 3. These findings highlight substantial regional differences in third DTP dose coverage trends within Latin America and the Caribbean, which are visually depicted in Figure 4, Figure 5 and Figure 6, illustrating the third DTP dose vaccination rate trends in Central America, the Caribbean, and South America, respectively, highlighting the joinpoints.
In the study period from 2012 to 2022, the trends in vaccination rates with the third dose of DTP varied significantly across regions in Central America, the Caribbean, and South America.
In Central America, the overall annual percentage change (APC) was -1.3% (95% CI -2.1, -0.4; P=0.009), with a statistically significant decrease noted. There was a JoinPoint in 2019. This region experienced a more pronounced decline in the latter period (2019-2022) with an APC of -2.6% (95% CI -8.6, 3.8; P=0.354), though this change was not statistically significant. (Figure 4)
The Caribbean region showed a different pattern, with an overall decrease in the vaccination rate with an APC of -0.7% (95% CI -1.1, -0.4; P=0.001). There was a JoinPoint in 2016. This decrease became statistically significant in the second period (2016-2022), with an APC of -1.1% (95% CI -2.1, -0.1; P=0.031).
In South America, the total period saw a significant decline in vaccination rates with an APC of -2.5% (95% CI -3.1, -1.8; P < 0.001). There was a JoinPoint in 2015. The trend intensified in the second period (2015-2022), with an APC of -3.1% (95% CI -4.4, -1.8; P=0.001).
These findings suggest region-specific variations within Latin America and the Caribbean region, with South America experiencing the most significant decline over the study period(Figure 5). The absolute decrease in vaccine coverage in America between 2019 and 2022 was -4%. The coverage remained equal in North America, South America, and the Caribbean, while the more significant decrease occurred in Central America with -7%. (Table 3)
Table 4 presents the DTP third dose coverage in 2019 and 2022. The average country decrease was -4.20% (SD=6.08), p <0.001. In Figure 8, Figure 9 and Figure 10, we present the map of America indicating the absolute differences in vaccine coverage between 2012 and 2022. Between 2019 and 2022, the DTP3 vaccination rates showed a significant decline, as observed in the dataset, which revealed that twenty-two countries(61.1%) in America registered a decrease, while only six countries (16.7%) indicated an increase and 8 (22.2%) remained unchanged.
Although COVID-19 impacted vaccine coverage, six countries had increased vaccination coverage after the COVID-19 pandemic. Brazil led this trend with a notable 7% increase in coverage. Following Brazil, Antigua and Barbuda saw a 4% rise, while Jamaica experienced a 2% increase. Canada and Mexico also reported modest increases of 1% each.
Conversely, eight countries demonstrated stability in their DTP3 vaccine coverage during the same period. Countries such as Chile, Costa Rica, Cuba, Haiti, Suriname, Trinidad and Tobago, the United States, and Uruguay maintained their coverage levels, with no percentage change observed. However, the study also identified 22 American countries where there was a decline in DTP3 vaccine coverage (Argentina, Bahamas, Barbados, Belize, Saint Kitts and Nevis, Bolivia, Colombia, Dominican Republic, Ecuador, El Salvador, Dominica, Grenada, Saint Lucia, Saint Vincent and the Grenadines, Guatemala, Guyana, Honduras, Nicaragua, Panama, Paraguay, Peru, and Venezuela). The Dominican Republic, Guyana, Panama, Saint Kitts and Nevis experienced a 1% decrease, while Argentina faced a 2% decline. In countries where vaccination coverage decreased, the absolute decrease had a mean of -7.37% (SD = 5.39)(P < 0.01). (Table 4) (Figure 8, Figure 9 and Figure 10)
In North America, in two countries, Canada and Mexico, the DTP3 vaccine coverage slightly increased by 1% between 2019 and 2022, while in the United States, it remained the same. In South America, Brazil increased the coverage by 7%, and three countries, Chile, Suriname, and Uruguay, remained at the same level. In the other countries, the coverage decreased. In Central America, except for Costa Rica, whose rate remained equal, all the countries fell their coverage. The same happened in the Caribbean. All the countries decreased; the only exceptions were Antigua, Barbuda, and Jamaica, which increased 4% and 2%, respectively, and Cuba, Haiti, and Trinidad and Tobago, which remained at the same level. (Figure 10)
By 2019, 14 American countries (Antigua and Barbuda, Barbados, Belize, Canada, Chile, Colombia, Costa Rica, Cuba, Dominica, El Salvador, Grenada, Guyana, Jamaica, Nicaragua, Saint Lucia, Saint Kitts and Nevis, Saint Vincent and the Grenadines, Trinidad and Tobago, United States and Uruguay) had reached the WHO target of 90% coverage for the third dose of DTP by 2030. Following the pandemic, by 2022, six countries (Barbados, Belize, Colombia, El Salvador, Grenada, Saint Lucia) dropped out of the countries that achieved the 90% DTP coverage target in 2022 compared to the 2019 list. (Figure 11 and Figure 12)
Twenty countries had a Joint point close to 2019 (Table 5, Figure 13, Figure 14, Figure 15, Figure 16, Figure 17, Figure 18, Figure 19, Figure 20, Figure 21, Figure 22, Figure 23, Figure 24, Figure 25, Figure 26, Figure 27, Figure 28, Figure 29, Figure 30, Figure 31 and Figure 32). In five countries: Antigua and Barbuda, Costa Rica, Haiti, Peru, Saint Vincent and the Grenadines, there was a JoinPoint in 2017 (95% I.C. 2014-2020). In five countries: Canada, Ecuador, Grenada, Jamaica, Nicaragua, and Paraguay, the JoinPoint was in 2018 (95% I.C. 2016-2019). In three countries, Belize, Colombia, and Saint Lucia, there was a JoinPoint in 2019 (95% I.C. 2017-2020). Finally, there were six countries: Bahamas, Dominica, Mexico, Saint Kitts and Nevis, Suriname, and Uruguay, with a JoinPoint in 2020 (95% I.C. 2014-2020). In all these countries, there was a decrease in the APC. The only exceptions were four countries, Canada, Bahamas, Mexico, and Suriname, which managed to have an increase in the period after the JoinPoint.
Using interrupted time series analysis, we detected changes, although not significant, in all the regions of America. Table 6 presents the segmented regression analysis of DTP3 vaccine coverage parameters. (Figure 33, Figure 34, Figure 35 and Figure 36)
In the Americas (Figure 33), the year's coefficient was -271,700 (p = 0.002), suggesting a decreasing trend in DTP3 vaccinations over the years. The COVID-19 coefficient is negative, approximately -3,824,000, indicating a decrease during the pandemic, but it is not statistically significant, with a p-value of 0.082.
In North America, the COVID-19 coefficient is negative, approximately -960,900, but it is not statistically significant, with a p-value of 0.140. (Figure 34)
In Latin America and the Caribbean, the coefficient of COVID-19 was -3,408,000, indicating a decrease during the pandemic. (Figure 35) However, the p-value for this coefficient was 0.078, which is marginally above the typical significance level of 0.05.
In Central America, the coefficient of COVID-19 was -73,740, but it was not statistically significant. (Figure 36)
In the Caribbean, the COVID-19 coefficient was negative, -94,750, but it was not statistically significant, with a p-value of 0.195. (Figure 37)
In the Caribbean, the COVID-19 coefficient was negative, -2,071,000, but it was not statistically significant (Figure 38).
In the segmented regression, we also detected four American countries, Belize, Grenada, Peru, and Suriname, which significantly decreased the number of children vaccinated with DTP3 after the COVID-19 pandemic. (Table 7). The United States and Mexico experienced a negative decrease close to signification. 18 American countries such as Antigua and Barbuda, Argentina, Bahamas, Barbados, Bolivia, Brazil, Canada, Chile, Dominican Republic, Ecuador, El Salvador, Haiti, Honduras, Jamaica, Nicaragua, Panama, Saint Vincent and the Grenadines, Uruguay, Venezuela also experienced a decrease in the number of children vaccinated with DTP3. However, this decrease was not statistically significant.
The segmented regression model explains a high proportion of the variance in the number of children who received DTP3 doses in Belize (Figure 39), with an R2 value of 0.937, suggesting a good fit. The COVID-19 variable is significant (p < 0.05), with a coefficient of approximately -3,833. This suggests that the COVID-19 pandemic is associated with a decrease in the number of DTP3 vaccinations. The Interaction term has a positive coefficient of approximately 240, but this is not statistically significant.
For the data from Grenada (Figure 40), the segmented regression analysis has been conducted, yielding the following results: The R2 value of the model is 0.983, indicating that the model explains a remarkably high portion of the variance in the DTP3 vaccination numbers, suggesting a perfect fit. The coefficient for the COVID-19 variable is statistically significant (p < 0.05) with a value of approximately -837.68, indicating that the start of the COVID-19 pandemic is associated with a significant decrease in the number of DTP3 vaccinations. The Year variable has a negative coefficient of -12.09 and is approaching statistical significance (p = 0.067). This suggests a decrease in vaccinations over the years, but this trend is not statistically significant at 0.05. The Interaction term, which represents the interaction between the year and the occurrence of COVID-19, has a positive coefficient of 41.60, but this is not statistically significant (p > 0.05). This suggests that the interaction effect does not contribute significantly to the model.
The model for Peru (Figure 41) has an R2 value of 0.803, which is considered a good fit, meaning that the model explains a considerable proportion of the variance in the DTP3 vaccination numbers. The coefficient for COVID-19 is significantly negative (p < 0.05) with a value of approximately -372,300, indicating that the onset of the COVID-19 pandemic is associated with a substantial decrease in the number of DTP3 vaccinations. The Interaction term is significant (p < 0.05) with a coefficient of approximately 34,450, indicating that the interaction between the year and the occurrence of COVID-19 has a statistically significant effect on the number of vaccinations.
In the segmented regression analysis for Suriname (Figure 42), the model's R2 value is 0.733, indicating that it explains a good portion of the variance in the DTP3 vaccination numbers. The coefficient for COVID-19 is significantly negative (p < 0.05) with a value of approximately -15,210, which implies that the onset of the COVID-19 pandemic is associated with a significant decrease in the number of DTP3 vaccinations. The Interaction term is significant (p < 0.05) with a coefficient of approximately 1420, indicating that the interaction between the year and the occurrence of COVID-19 has a statistically significant effect on the number of vaccinations.
In Mexico (Figure 43), the model has a good fit with an R2 value of 0.884, suggesting a perfect fit. The coefficient for Year is significantly negative (p < 0.05) with a value of approximately -63,130, indicating a significant decline in DTP3 vaccinations over the years.<The COVID-19 coefficient is negative with a value of approximately -1,379,000. Although this suggests a substantial decrease in vaccinations during the pandemic, it is not statistically significant (p = 0.098).
The segmented regression analysis for the United States data (Figure 44) provides the following insights: the model has a good fit with an R2 value of 0.848. The coefficient for Year is significantly negative (p < 0.01) with a value of approximately -44,760, suggesting a declining trend in the number of DTP3 vaccinations over the years. The COVID-19 coefficient is negative with a value of approximately -1,093,000, which would indicate a substantial decrease in the number of vaccinations during the pandemic, but it is not statistically significant (p = 0.092). The Interaction term has a positive coefficient of approximately 108,000, indicating a potential interaction effect between the year and the occurrence of COVID-19 on the number of vaccinations, but it is also not statistically significant (p = 0.099).
4. Discussion
Our study aimed to analyze the impact of the COVID-19 pandemic on DTP vaccination trends in America. The results indicate that the pandemic has adversely affected vaccination coverage in several American countries, especially Central America.
4.1. Overview of the Study and Its Context
4.1.1. Methodological Considerations and Data Limitations
Our methodologies included comparing country-specific vaccination coverage between 2019 and 2022 and analyzing trends using joint points and segmented regression, which makes our findings more robust.
While acknowledging the constraints of available data and potential inconsistencies in reporting, the significance of UNICEF's dataset for this investigation remains paramount. Despite UNICEF's consistent methodology in data collection and reporting, variations in national healthcare infrastructures and reporting systems might lead to discrepancies in data quality and precision, potentially influencing the interpretations of our analysis. Furthermore, the data's compilation at national and regional scales could mask local nuances in vaccination trends, especially in areas with healthcare accessibility issues or socioeconomic disparities. Nevertheless, in the last 20 years, global immunization coverage data quality improved[68]. As of the latest data update, 2022, our study does not include real-time data from 2023 onwards. Thus, our findings might not fully capture the ongoing impact of the COVID-19 pandemic on DTP vaccination rates in the Americas. Future research, with access to more current data, would be essential in providing a more comprehensive understanding of these trends.
4.1.2. Discrepancies in Vaccine Coverage Data and Trend Analysis.
There may be inconsistencies between the number of American countries that experienced a significant decline in vaccination coverage between 2019 and 2022, 22 countries, and those in which a decreasing change in trend was detected that is smaller, only sixteen of those twenty-two countries. This discrepancy is explained because although there has been a decrease in vaccination coverage rates in some countries in the number of years of follow-up, it is not yet of the magnitude to detect a trend change in some countries.
4.2. Analysis of DTP3 Vaccination Trends
The data analysis shows a declining trend in vaccination coverage throughout the Americas, possibly due to socioeconomic and cultural factors and vaccine hesitancy, which COVID-19 exacerbated[69,70]
In the context of DTP3 vaccine coverage between 2019 and 2022, several American countries exhibited an increase in vaccine coverage. Brazil led this trend with a notable 7% increase in coverage. Following Brazil, Antigua and Barbuda saw a 4% rise, while Jamaica experienced a 2% increase. Canada and Mexico also reported modest increases of 1% each. Despite the challenging times of the COVID-19 pandemic, these enhancements in vaccine coverage highlight the effectiveness of public health interventions and the resilience of healthcare systems in these countries.
Conversely, several countries demonstrated stability in their DTP3 vaccine coverage during the same period. Countries such as Chile, Costa Rica, Cuba, Haiti, and Suriname maintained their coverage levels, with no percentage change observed. Amidst the global health crisis, this stability underscores the strength and consistency of vaccination programs in these nations. It suggests that these countries successfully navigated the complexities introduced by the pandemic, ensuring uninterrupted vaccine delivery to their populations.
However, the study also identified countries with declining DTP3 vaccine coverage. The Dominican Republic, Guyana, Panama, Saint Kitts, and Nevis experienced a 1% decrease, while Argentina faced a 2% decline. These reductions highlight the challenges and disruptions caused by the COVID-19 pandemic, potentially reflecting resource reallocation, access issues, or public hesitancy toward vaccination. It underscores the need for focused efforts to strengthen and adapt vaccination programs in the face of such unprecedented global health challenges.
We found that DTP3 coverage remained stable during the whole pandemic period 2019-2022 across most North American countries, as depicted in Table 4. This observation warrants further exploration, as it contrasts with the 4% absolute decrease in vaccine coverage reported across America during the same period. Canada and Mexico slightly increased the coverage of DTP3 in the period between 2019 and 2022, while the United States remained with the same coverage[4]. The countries that did not have their coverage affected at the end of the pandemic period were Haiti, Chile, Costa Rica, Cuba, Suriname, Trinidad and Tobago, Uruguay, United States. These findings may reflect the effectiveness of their national immunization programs and robust healthcare systems, which allowed these countries to maintain their vaccination rates despite the various obstacles posed by the ongoing global COVID-19 pandemic. Nevertheless, there are differences in subnational units. For example, in Haiti, 80% of the subnational units experienced a 5% or higher reduction in DPT3 service volume in the third quarter of 2022[71].
Conversely, during this period, Grenada, Paraguay, Ecuador, El Salvador, Belize, Saint Lucia, Honduras, Venezuela, Colombia, Dominica, Bolivia, Guatemala, Nicaragua, Peru, Saint Vincent and the Grenadines, Barbados, Argentina, Bahamas, Dominican Republic, Guyana, Panama, Saint Kitts and Nevis experienced decreases in DTP3 vaccine coverage. Many countries had a slight decline in coverage of -1%, like the Dominican Republic, Guyana, Panama, Saint Kitts and Nevis, with no statistically significant decrease. Furthermore, other countries like Grenada and Saint Lucia had massive reductions -17% and 11%- but they were not statistically significant.
In contrast, in countries like Paraguay, Ecuador, El Salvador, Belize, and Honduras, absolute coverage decreased from -17% to -10%. This decrease may be attributed to the country's ongoing health system challenges, including vaccine supply chain inefficiencies, which could have been exacerbated by the additional strain of the COVID-19 pandemic (3).
We have demonstrated significant decreases in vaccine coverage in many American countries. We also show a change in the coverage trend in Latin America and the Caribbean. The change in the trend, accelerating the decrease in coverage, was found in all the subregions. It was statistically significant in the Caribbean (P=0.031) and South America (p=0.001). There was also an acceleration in coverage decrease in Central America, which was not yet statistically significant due to the reduced follow-up period. Our data agrees with the bibliography that shows that in Latin America and the Caribbean, the coverage of DTP3 experienced a decrease of -5,06% between 2019 and 2021. The coverage rate decreased from 79% in 2019 to 75% in 2020 [35].
A significant observation in our comprehensive study examining DTP vaccination trends in America was the reduction in DTP3 vaccine coverage from 2019-2022 in Central America. This period, coinciding with the COVID-19 pandemic, marked an acceleration in the decrease in coverage that was a notable deviation from the previous downward trend, with an APC of -2.6%, indicating a substantial decrease in vaccination rates.
4.3. Comparative Global and Regional Perspectives
The global decline in vaccine coverage, spurred by the COVID-19 pandemic, extends beyond DTP vaccines. From January to December 2020, approximately 30 million children missed DTP3 vaccinations, and 27.2 million missed MCV1 vaccinations [32]. It has been reported that there was also a reduction in HPV in some parts of the United States[69]. The worldwide coverage of DTP3 experienced a decline of 5.81% from 2019 to 2021, decreasing from 86% to 81% [48].In considering the broader implications of our findings, it is crucial to assess the impact of the digital divide on data reporting. In regions of the Americas with limited access to technological resources, the accuracy and timeliness of data reporting may be compromised. This factor is crucial in understanding the regional disparities in vaccine coverage and the challenges in data collection.
The decrease in DTP coverage is a global problem. The Global coverage of the DTP3 decreased from 86% in 2019 to 83% in 2020 [72,48]. Similar declines had been found in Africa and Asia. [41,73]. In contrast to other regions, Europe experienced a minor reduction in vaccination coverage. Specifically, the coverage for the third dose of the Diphtheria-Tetanus-Pertussis (DTP3) vaccine saw a marginal decline of 1.05% from 2019 to 2021. This resulted in a slight dip in coverage rates, from 95% in 2019 to 94% in 2020. Furthermore, a comparative analysis with other regions, such as Africa or Europe, could offer valuable insights into global patterns and region-specific challenges in maintaining vaccination during the pandemic. Such a comparative perspective could help identify unique challenges and successful strategies in different regions, offering lessons for future healthcare planning and policy formulation.
4.4. Influential Factors and Challenges
Socioeconomic factors have been pivotal in influencing vaccine accessibility during the pandemic. Economic challenges exacerbated by the pandemic have widened existing disparities in healthcare access, further impacting vaccination rates. A detailed examination of these socioeconomic variables provides a more nuanced understanding of the vaccination landscape across different socio-demographic groups.
Several factors may explain the change in vaccine coverage. Country-level factors, such as high fertility rates, and community-level factors, such as high illiteracy rates, contribute to the prevalence of unvaccinated children[33]. Research conducted in the U.S. revealed that for all types of hepatitis vaccines, both adherence and completion rates are notably low, exhibiting considerable differences across various socio-demographic and clinical profiles. The likelihood of poor adherence and incomplete vaccination was typically linked to factors such as being male, belonging to a younger age group, identifying as Black or Hispanic, and having lower levels of education and household income[74].
In Africa, the primary factors contributing to incomplete vaccination were time limitations faced by caregivers, insufficient understanding about immunization, the absence of vaccines or personnel at healthcare facilities, missed opportunities for vaccination, concerns regarding minor side effects, limited access to vaccination services, and the vaccination beliefs held by caregivers[75]. Multiple missed vaccination opportunities exist among different populations and geographical regions. A recent meta-analysis has found that the prevalence of incomplete immunization (failing to receive any vaccination doses) in Africa was 35.5%. The main risk factors were home birth, rural residence, lack of antenatal care visits, knowledge of immunizations), and maternal illiteracy[76].
Additionally, American countries varied public health policies and COVID-19 response strategies have potentially influenced DTP vaccination rates[50]. Redirecting healthcare resources from routine vaccinations to COVID-19 response efforts in some regions may have contributed to the observed decline in vaccine coverage.
These declines underscore the profound impact of the COVID-19 pandemic on routine vaccination programs in the continent, signaling a need for focused efforts to recover and enhance vaccine coverage. Covid-19 had an impact on children's vaccination. The decrease in vaccination rates can be attributed to several factors related to the COVID-19 pandemic, such as the redirection of healthcare resources towards managing the outbreak, lockdowns, and restrictions on movement that impeded access to vaccination services. In a survey conducted to parents of children 0-4 years from Europe, America, and Australia, 83% of the parents believed it essential for their child to continue receiving recommended vaccines during the COVID-19 pandemic. Half of routine vaccine appointments were delayed or canceled due to the pandemic. Nevertheless, 61% of the parents said they would like to catch up once COVID-19 restrictions were lifted[77].
4.5 Strategies and Interventions for Enhancing Vaccine Coverage
Interestingly, despite the pandemic's difficulties, some nations, including Canada, Mexico, Jamaica, Antigua and Barbuda, and Brazil, were able to increase their vaccination coverage. It is worth noting the case of Brazil, which increased its vaccination coverage by 7% at the end of the Covid 19 pandemic. This increase may be attributed to effective immunization strategies, targeted interventions, or increased government support for vaccination programs during the crisis. It is crucial to examine and learn from the experiences of these countries to improve immunization services in the face of future crises.
As there are many incomplete vaccinations and the parents are willing to catch up, healthcare services should try to reach the parents[4]. Strategies need to be developed to increase DTP3 vaccination coverage. One strategy that has been suggested is co-administration with other vaccines[78].
The differences among countries highlight the need for tailored strategies to improve vaccine coverage, particularly in countries with decreasing trends. Continuous monitoring of immunization programs, addressing health system barriers, and community engagement are vital for maintaining and enhancing vaccine coverage in these settings.
Our study's findings align with other research suggesting that the COVID-19 pandemic has disrupted essential health services, including vaccination programs, worldwide. Additionally, fear of contracting the virus may have led to a reluctance among parents to bring their children to healthcare facilities for vaccination. Healthcare workers, especially community nurses, have an essential role[20].
4.6. The Role of Healthcare Systems and Planning
The COVID-19 pandemic's disruption has brought attention to the need for resilient health systems that can continue providing essential medical services in times of need. [80]. The significant differences in vaccination trends across regions highlight the need for tailored public health strategies. Policies must be region-specific, considering each area's unique challenges and resources.
Efforts should be made to strengthen vaccination programs and improve coverage across the continent, particularly in the regions most affected by the decrease in vaccination rates[81]. The decline in vaccination rates, especially in areas with weaker healthcare infrastructures, underscores the need to strengthen health systems, ensure adequate funding, train healthcare workers, and improve vaccine supply chains.
4.7. Looking to the Future
The implications of reduced vaccination coverage are significant, as it may lead to outbreaks of vaccine-preventable diseases, such as diphtheria, tetanus, and pertussis. These outbreaks can strain already overwhelmed healthcare systems and further exacerbate the impact of the COVID-19 pandemic on public health in America. It is essential to address the decline in vaccination rates and implement strategies to ensure the continuity of immunization services. The risks associated with suspension or vaccination have been demonstrated to outweigh the risk of contracting COVID-19 while receiving routine immunizations [82].
Addressing these factors through targeted interventions and policies is essential to improve immunization rates and ensure the health of these children. Geographical and economic factors, access to healthcare services, the grade of development of healthcare infrastructure, vaccine supply chain issues, sociocultural factors, political stability, and the Government's commitment to vaccination may modulate the impact of the COVID-19 pandemic on DTP vaccination coverage [83,84]. We can observe that the countries that dropped out of the list in 2021 of those achieving WHO's DPT objectives are spread across Latin American and Caribbean regions. The decline in the number of countries reaching the target of 90% coverage for the third dose of DTP is observed across various Latin American regions. It is essential to accurately assess the regional impact by comparing the countries that achieved the WHO target in 2019 and 2022. Another issue is that, even if vaccination programs improve and return to pre-pandemic levels, they might not do so to the extent required for catch-up immunizations, which may take a long time[85]. Because of this delay, there may be an increased chance of outbreaks of diseases that can be prevented by vaccination[86].
Efficient planning, organization, and swift implementation are crucial for expediting the vaccine distribution process and ensuring a speedy recovery of vaccine coverage[87]. Collaboration between governments, healthcare providers, and international organizations is vital to ensure that progress in achieving vaccination targets is not lost [88] and to protect the health of American populations from vaccine-preventable diseases. We should plan for the next pandemic, analyzing and replicating the strategies of countries that have successfully increased or maintained high vaccination rates post-pandemic, which could be beneficial. It is also essential to strengthen epidemiology services related to preventing vaccine-preventable diseases. Continuous monitoring and evaluation of vaccination programs are crucial. Identifying and addressing issues promptly can avoid further declines in vaccination rates.
Despite initial fears and logistical challenges like transportation restrictions, community commitment to vaccination during the pandemic remained strong in many countries. Systemic changes within healthcare, such as staff reallocations, caused temporary delays but were efficiently addressed. Notably, some community misconceptions about the pandemic existed but did not significantly deter vaccination efforts, reflecting a deep-rooted trust in the importance of vaccines[89]. It is crucial to monitor subnational units to avoid inequities.[71]
5. Conclusions
This study comprehensively assessed the impact of the COVID-19 pandemic on DTP3 vaccination coverage in the Americas from 2012 to 2022. The findings indicate a significant and concerning decline in vaccination rates, particularly after 2019. The overall annual percentage change (APC) for the entire period was -1.4%, with an absolute decrease in vaccine coverage of -4% from 2019 to 2022. Notably, the most substantial relative decrease occurred in Central America, with a 7.87% reduction in coverage. The JoinPoint analysis highlighted distinct temporal shifts in vaccination trends across various regions. In North America, the change was minimal and not statistically significant, with an APC of -0.1%.
In contrast, Latin America and the Caribbean experienced a more pronounced decline, with an APC of -2.1%. The situation in Central America and the Caribbean was similar, with APCs of -1.3% and -0.7%, respectively, indicating a downward trend in vaccination rates. South America faced the steepest decline, with an APC of -2.5%, intensifying to -3.1% in the latter part of the study period. Interestingly, while the pandemic adversely affected vaccination coverage in most countries, some nations like Brazil, Antigua and Barbuda, and Jamaica showed increased DTP3 vaccine coverage post-pandemic. Several countries, including Chile, Costa Rica, Cuba, Haiti, Suriname, Trinidad and Tobago, the United States, and Uruguay, maintained stable vaccination rates. The study's results are alarming, considering the importance of maintaining high DTP vaccination coverage to prevent outbreaks of vaccine-preventable diseases. The pandemic's disruptive impact on public health initiatives is underscored by the decline in coverage rates, particularly in countries that had previously met the WHO target of 90% coverage. This decline in vaccination rates highlights the need for renewed efforts in vaccination campaigns and public health strategies to reverse the negative trends and ensure the well-being of populations across the Americas.
Author Contributions
Conceptualization, FGG, EAO, ERV and IAO; methodology, SGA, LGA, EAO ERV; software, SGA, LGA; investigation, RAB, EAO, ERV.; writing—original draft preparation, FGG, SGA, LGA, EAO, IAO, RAB ERV; writing—review and editing, FGG, SGA, LGA, IAO, EAO, RAB ERV; visualization, SGA, LGA; supervision, FGG, IAO. All authors have read and agreed to the published version of the manuscript.
Funding
This research received no external funding.
Institutional Review Board Statement
This is not applicable because the study was done with publicly available databases.
Informed Consent Statement
Not applicable because the study was done with public available database.
Data Availability Statement:
Data are available from UNICEF database.
Conflicts of Interest
The authors declare no conflict of interest.
References
- Ota, M. O. C.; de Moraes, J. C.; Vojtek, I.; Constenla, D.; Doherty, T. M.; Cintra, O.; Kirigia, J. M. Unveiling the Contributions of Immunization for Progressing towards Universal Health Coverage. Hum Vaccin Immunother 2022, 18. [Google Scholar] [CrossRef]
- Suffel, A. M.; Ojo-Aromokudu, O.; Carreira, H.; Mounier-Jack, S.; Osborn, D.; Warren-Gash, C.; McDonald, H. I. Exploring the Impact of Mental Health Conditions on Vaccine Uptake in High-Income Countries: A Systematic Review. BMC Psychiatry 2023, 23, 15. [Google Scholar] [CrossRef] [PubMed]
- Hassan, M. N. A Survey on Hygienic Practices and Immunization Coverage among 12-59 Months Old Children in Urban Slum, Barishal, Bangladesh. Asian Journal of Medical and Biological Research 2022, 8, 277–285. [Google Scholar] [CrossRef]
- Evans, A.; Mahar, A. L.; Deb, B.; Boblitz, A.; Brownell, M.; Guttmann, A.; Stukel, T. A.; Cohen, E.; Sarkar, J.; Eze, N.; Katz, A.; Raveendran, T.; Saunders, N. Gaps in Childhood Immunizations and Preventive Care Visits during the COVID-19 Pandemic: A Population-Based Cohort Study of Children in Ontario and Manitoba, Canada, 2016–2021. Canadian Journal of Public Health 2023, 114, 774–786. [Google Scholar] [CrossRef] [PubMed]
- Stein, R. A. Vaccination: A Public Health Intervention That Changed History & Is Changing with History. Am Biol Teach 2011, 73, 513–519. [Google Scholar] [CrossRef]
- Pan, J.; Wang, Y.; Cao, L.; Wang, Y.; Zhao, Q.; Tang, S.; Gong, W.; Guo, L.; Liu, Z.; Wen, Z.; Zheng, B.; Wang, W. Impact of Immunization Programs on 11 Childhood Vaccine-Preventable Diseases in China: 1950–2018. The Innovation 2021, 2, 100113. [Google Scholar] [CrossRef]
- Espinal, M. A. The Pan American Health Organization: 120 Years in the Americas Hemisphere. The Lancet Regional Health - Americas 2023, 21, 100488. [Google Scholar] [CrossRef] [PubMed]
- Zulfan, G. P.; Sihombing, J. A.; Amin, D. M.; Widiantari, A. D.; Berti, M. P. E.; Murtiani, F. Clinical Manifestation of Childhood Diphtheria. Jurnal Ilmiah Kedokteran Wijaya Kusuma 2023, 12, 1. [Google Scholar] [CrossRef]
- WHO. Global Vaccine Action Plan 2011-2020.; WHO Press: Geneva, 2013. [Google Scholar]
- Shahid, A. S. M. S. Bin; Rahman, A. E.; Shahunja, K. M.; Afroze, F.; Sarmin, M.; Nuzhat, S.; Alam, T.; Chowdhury, F.; Sultana, M. S.; Ackhter, M. M.; Parvin, I.; Saha, H.; Islam, S. Bin; Shahrin, L.; Ahmed, T.; Chisti, M. J. Vaccination Following the Expanded Programme on Immunization Schedule Could Help to Reduce Deaths in Children under Five Hospitalized for Pneumonia and Severe Pneumonia in a Developing Country. Front Pediatr 2023, 11. [Google Scholar] [CrossRef]
- Atteraya, M. S.; Song, I. H.; Ebrahim, N. B.; Gnawali, S.; Kim, E.; Dhakal, T. Inequalities in Childhood Immunisation in South Asia. Int J Environ Res Public Health 2023, 20, 1755. [Google Scholar] [CrossRef]
- Basu, S.; Ashok, G.; Debroy, R.; Ramaiah, S.; Livingstone, P.; Anbarasu, A. Impact of the COVID-19 Pandemic on Routine Vaccine Landscape: A Global Perspective. Hum Vaccin Immunother 2023, 19. [Google Scholar] [CrossRef] [PubMed]
- Budu, E.; Ahinkorah, B. O.; Guets, W.; Ameyaw, E. K.; Essuman, M. A.; Yaya, S. Socioeconomic and Residence-based Related Inequality in Childhood Vaccination in Sub-Saharan Africa: Evidence from Benin. Health Sci Rep 2023, 6. [Google Scholar] [CrossRef]
- Albers, A. N.; Wright, E.; Thaker, J.; Conway, K.; Daley, M. F.; Newcomer, S. R. Childhood Vaccination Practices and Parental Hesitancy Barriers in Rural and Urban Primary Care Settings. J Community Health 2023, 48, 798–809. [Google Scholar] [CrossRef]
- Santoli, J. M.; Lindley, M. C.; DeSilva, M. B.; Kharbanda, E. O.; Daley, M. F.; Galloway, L.; Gee, J.; Glover, M.; Herring, B.; Kang, Y.; Lucas, P.; Noblit, C.; Tropper, J.; Vogt, T.; Weintraub, E. Effects of the COVID-19 Pandemic on Routine Pediatric Vaccine Ordering and Administration — United States, 2020. MMWR Morb Mortal Wkly Rep 2020, 69, 591–593. [Google Scholar] [CrossRef]
- Zhong, Y.; Clapham, H. E.; Aishworiya, R.; Chua, Y. X.; Mathews, J.; Ong, M.; Wang, J.; Murugasu, B.; Chiang, W. C.; Lee, B. W.; Chin, H.-L. Childhood Vaccinations: Hidden Impact of COVID-19 on Children in Singapore. Vaccine 2021, 39, 780–785. [Google Scholar] [CrossRef] [PubMed]
- Tolera, S. T. , Kaweti, G., & Aboma, L. M. Article Review on Potential Impact of COVID-19 Pandemic on Socioeconomic of Ethiopia, Africa. Health Sciences 2022, 11, 19–30. [Google Scholar]
- Yang, J.; Vaghela, S.; Yarnoff, B.; De Boisvilliers, S.; Di Fusco, M.; Wiemken, T. L.; Kyaw, M. H.; McLaughlin, J. M.; Nguyen, J. L. Estimated Global Public Health and Economic Impact of COVID-19 Vaccines in the Pre-Omicron Era Using Real-World Empirical Data. Expert Rev Vaccines 2023, 22, 54–65. [Google Scholar] [CrossRef]
- Chen, X.; Huang, H.; Ju, J.; Sun, R.; Zhang, J. Impact of Vaccination on the COVID-19 Pandemic in U.S. States. Sci Rep 2022, 12, 1554. [Google Scholar] [CrossRef]
- Heffernan, C. The 'New Normal': Delivering Childhood Immunisations during the COVID-19 Pandemic. Practice Nursing 2020, 31. [Google Scholar] [CrossRef]
- Athiyaman, A.; Ajayi, T.; Mutuku, F.; Luwaga, F.; Bryer, S.; Giwa, O.; Mngemane, S.; Edwige, N. N.; Berman, L. Recovering from the Unprecedented Backsliding in Immunization Coverage: Learnings from Country Programming in Five Countries through the Past Two Years of COVID-19 Pandemic Disruptions. Vaccines (Basel) 2023, 11, 375. [Google Scholar] [CrossRef]
- Naor, M.; Pinto, G. D.; Davidov, P.; Abdrbo, L. Rapidly Establishing an Ultra-Cold Supply Chain of Vaccines in Israel: Evidence for the Efficacy of Inoculation to Mitigate the COVID-19 Pandemic. Vaccines (Basel) 2023, 11, 349. [Google Scholar] [CrossRef]
- He, K.; Mack, W. J.; Neely, M.; Lewis, L.; Anand, V. Parental Perspectives on Immunizations: Impact of the COVID-19 Pandemic on Childhood Vaccine Hesitancy. J Community Health 2022, 47, 39–52. [Google Scholar] [CrossRef]
- McDonald, H. I.; Tessier, E.; White, J. M.; Woodruff, M.; Knowles, C.; Bates, C.; Parry, J.; Walker, J. L.; Scott, J. A.; Smeeth, L.; Yarwood, J.; Ramsay, M.; Edelstein, M. Early Impact of the Coronavirus Disease (COVID-19) Pandemic and Physical Distancing Measures on Routine Childhood Vaccinations in England, January to April 2020. Euro Surveill 2020, 25. [Google Scholar] [CrossRef] [PubMed]
- Lassi, Z. S.; Naseem, R.; Salam, R. A.; Siddiqui, F.; Das, J. K. The Impact of the COVID-19 Pandemic on Immunization Campaigns and Programs: A Systematic Review. Int J Environ Res Public Health 2021, 18, 988. [Google Scholar] [CrossRef] [PubMed]
- Alsuhaibani, M.; Alaqeel, A. Impact of the COVID-19 Pandemic on Routine Childhood Immunization in Saudi Arabia. Vaccines (Basel) 2020, 8, 581. [Google Scholar] [CrossRef] [PubMed]
- Palo, S. K.; Dubey, S.; Negi, S.; Sahay, M. R.; Patel, K.; Swain, S.; Mishra, B. K.; Bhuyan, D.; Kanungo, S.; Som, M.; Merta, B. R.; Bhattacharya, D.; Kshatri, J. S.; Pati, S. Effective Interventions to Ensure MCH (Maternal and Child Health) Services during Pandemic Related Health Emergencies (Zika, Ebola, and COVID-19): A Systematic Review. PLoS One 2022, 17, e0268106. [Google Scholar] [CrossRef] [PubMed]
- Kiely, M.; Mansour, T.; Brousseau, N.; Rafferty, E.; Paudel, Y. R.; Sadarangani, M.; Svenson, L. W.; Robinson, J. L.; Gagneur, A.; Driedger, S. M.; MacDonald, S. E. COVID-19 Pandemic Impact on Childhood Vaccination Coverage in Quebec, Canada. Hum Vaccin Immunother 2022, 18. [Google Scholar] [CrossRef] [PubMed]
- Verrier, F.; de Lauzanne, A.; Diouf, J.-B. N.; Zo, A. Z.; Ramblière, L.; Herindrainy, P.; Sarr, F. D.; Sok, T.; Vray, M.; Collard, J.-M.; Borand, L.; Kermorvant-Duchemin, E.; Delarocque-Astagneau, E.; Guillemot, D.; Huynh, B.-T.; Randriamamonjiarison, A. N.; Volahasina, T. A.; Rasoanaivo, F.; Rakotoarimanana, F. M. J.; Raheliarivao, T. B.; Randrianirina, F.; Chon, T.; Goyet, S.; Kerleguer, A.; Ngo, V.; Lach, S.; Long, P.; Tarantola, A.; Diatta, M.; Faye, J.; Seck, A.; Padget, M.; Abdou, A. Y.; Garin, B. Vaccination Coverage and Risk Factors Associated With Incomplete Vaccination Among Children in Cambodia, Madagascar, and Senegal. Open Forum Infect Dis 2023, 10. [Google Scholar] [CrossRef] [PubMed]
- Hogan, D.; Gupta, A. Why Reaching Zero-Dose Children Holds the Key to Achieving the Sustainable Development Goals. Vaccines (Basel) 2023, 11, 781. [Google Scholar] [CrossRef]
- Alexander, C.; Cabrera, M.; Moore, M.; Lomazzi, M. Driving Paediatric Vaccine Recovery in Europe. Vaccines (Basel) 2023, 11, 184. [Google Scholar] [CrossRef]
- Causey, K.; Fullman, N.; Sorensen, R. J. D.; Galles, N. C.; Zheng, P.; Aravkin, A.; Danovaro-Holliday, M. C.; Martinez-Piedra, R.; Sodha, S. V; Velandia-González, M. P.; Gacic-Dobo, M.; Castro, E.; He, J.; Schipp, M.; Deen, A.; Hay, S. I.; Lim, S. S.; Mosser, J. F. Estimating Global and Regional Disruptions to Routine Childhood Vaccine Coverage during the COVID-19 Pandemic in 2020: A Modelling Study. The Lancet 2021, 398, 522–534. [Google Scholar] [CrossRef] [PubMed]
- Wiysonge, C. S.; Uthman, O. A.; Ndumbe, P. M.; Hussey, G. D. Individual and Contextual Factors Associated with Low Childhood Immunisation Coverage in Sub-Saharan Africa: A Multilevel Analysis. PLoS One 2012, 7, e37905. [Google Scholar] [CrossRef] [PubMed]
- WHO. GLOBAL ROUTINE IMMUNIZATION STRATEGIES AND PRACTICES (GRISP) A Companion Document to the Global Vaccine Action Plan (GVAP); WHO: Geneva, 2016. [Google Scholar]
- WHO. Immunization and vaccine-preventable communicable diseases https://www.who.int/data/gho/data/themes/immunization (accessed 2023 -11 -12).
- Immunization and vaccine-preventable communicable diseases https://data.unicef.org/resources/immunization-coverage-are-we-losing-ground/ (accessed 2023 -04 -29).
- Cutts, F. T.; Izurieta, H. S.; Rhoda, D. A. Measuring Coverage in MNCH: Design, Implementation, and Interpretation Challenges Associated with Tracking Vaccination Coverage Using Household Surveys. PLoS Med 2013, 10, e1001404. [Google Scholar] [CrossRef] [PubMed]
- WHO/UNICEF. Progress and Challenges with Achieving Universal Immunization Coverage. 2022 WHO/UNICEF Estimates of National Immunization Coverage (WUENIC); Geneva, 2023.
- Brown, C. L.; Montez, K.; Amati, J. B.; Simeonsson, K.; Townsend, J. D.; Orr, C. J.; Palakshappa, D. Impact of COVID-19 on Pediatric Primary Care Visits at Four Academic Institutions in the Carolinas. Int J Environ Res Public Health 2021, 18, 5734. [Google Scholar] [CrossRef]
- Shet, A.; Carr, K.; Danovaro-Holliday, M. C.; Sodha, S. V; Prosperi, C.; Wunderlich, J.; Wonodi, C.; Reynolds, H. W.; Mirza, I.; Gacic-Dobo, M.; O'Brien, K. L.; Lindstrand, A. Impact of the SARS-CoV-2 Pandemic on Routine Immunisation Services: Evidence of Disruption and Recovery from 170 Countries and Territories. Lancet Glob Health 2022, 10, e186–e194. [Google Scholar] [CrossRef]
- Aguinaga-Ontoso, I.; Guillen-Aguinaga, S.; Guillen-Aguinaga, L.; Alas-Brun, R.; Onambele, L.; Aguinaga-Ontoso, E.; Guillen-Grima, F. COVID-19 Impact on DTP Vaccination Trends in Africa: A Joinpoint Regression Analysis. Vaccines (Basel) 2023, 11, 1103. [Google Scholar] [CrossRef] [PubMed]
- Castrejon, M. M.; Leal, I.; de Jesus Pereira Pinto, T.; Guzmán-Holst, A. The Impact of COVID-19 and Catch-up Strategies on Routine Childhood Vaccine Coverage Trends in Latin America: A Systematic Literature Review and Database Analysis. Hum Vaccin Immunother 2022, 18. [Google Scholar] [CrossRef]
- Munyangaju, I.; López-Varela, E.; Bassat, Q. Closing the Gap in Childhood Immunisation after the Pandemic. BMJ 2023, p627. [Google Scholar] [CrossRef]
- THE GLOBAL HEALTH OBSERVATORY. Immunization and vaccine-preventable communicable diseases Immunization and vaccine-preventable communicable diseases (accessed 2023 -11 -29).
- Kaur, G.; Danovaro-Holliday, M. C.; Mwinnyaa, G.; Gacic-Dobo, M.; Francis, L.; Grevendonk, J.; Sodha, S. V; Sugerman, C.; Wallace, A. Routine Vaccination Coverage — Worldwide, 2022. MMWR Morb Mortal Wkly Rep 2023, 72, 1155–1161. [Google Scholar] [CrossRef]
- World Health Assembly. Immunization Agenda 2030: A Global Strategy to Leave No One Behind.; WHO: Geneva, 2020. [Google Scholar]
- UNICEF. COVID-19 pandemic fuels largest continued backslide in vaccinations in three decades https://www.unicef.org/press-releases/WUENIC2022release (accessed 2023 -05 -16).
- Data Warehouse - UNICEF DATA https://data.unicef.org/resources/data_explorer/unicef_f/?ag=UNICEF&df=IMMUNISATION&ver=1.0&dq=.IM_DTP3..&startPeriod=2000&endPeriod=2022 (accessed 2023 -04 -18).
- UNICEF. Number of Births. Data Warehouse - UNICEF DATA https://data.unicef.org/resources/data_explorer/unicef_f/?ag=UNICEF&df=GLOBAL_DATAFLOW&ver=1.0&dq=.DM_BRTS..&startPeriod=2019&endPeriod=2021 (accessed 2023 -05 -21).
- World Bank. Population, total | Data https://data.worldbank.org/indicator/SP.POP.TOTL (accessed 2023 -05 -21).
- White, K. J. The Durbin-Watson Test for Autocorrelation in Nonlinear Models. Rev Econ Stat 1992, 74, 370. [Google Scholar] [CrossRef]
- Wagner, A. K.; Soumerai, S. B.; Zhang, F.; Ross-Degnan, D. Segmented Regression Analysis of Interrupted Time Series Studies in Medication Use Research. J Clin Pharm Ther 2002, 27, 299–309. [Google Scholar] [CrossRef] [PubMed]
- Lopez Bernal, J.; Cummins, S.; Gasparrini, A. Interrupted Time Series Regression for the Evaluation of Public Health Interventions: A Tutorial. Int J Epidemiol 2016, dyw098. [Google Scholar] [CrossRef] [PubMed]
- Slavova, S.; Rock, P.; Bush, H. M.; Quesinberry, D.; Walsh, S. L. Signal of Increased Opioid Overdose during COVID-19 from Emergency Medical Services Data. Drug Alcohol Depend 2020, 214, 108176. [Google Scholar] [CrossRef]
- Joinpoint Regression Program. Version 4.3.1.0. April, 2016; Statistical Methodology and Applications Branch, Surveillance Research Program, National Cancer Institute.
- Kim, H. J.; Fay, M. P.; Feuer, E. J.; Midthune, D. N. Permutation Tests for Joinpoint Regression with Applications to Cancer Rates. Stat Med 2000, 19, 335–351. [Google Scholar] [CrossRef]
- Muggeo, V. M.; Atkins, D. C.; Gallop, R. J.; Dimidjian, S. Segmented Mixed Models with Random Changepoints: A Maximum Likelihood Approach with Application to Treatment for Depression Study. Stat Modelling 2014, 14, 293–313. [Google Scholar] [CrossRef]
- Muggeo, V. M. R. Interval Estimation for the Breakpoint in Segmented Regression: A Smoothed Score-based Approach. Aust N Z J Stat 2017, 59, 311–322. [Google Scholar] [CrossRef]
- Muggeo, V. M. R. Testing with a Nuisance Parameter Present Only under the Alternative: A Score-Based Approach with Application to Segmented Modelling. J Stat Comput Simul 2016, 86, 3059–3067. [Google Scholar] [CrossRef]
- Fasola, S.; Muggeo, V. M. R.; Küchenhoff, H. A Heuristic, Iterative Algorithm for Change-Point Detection in Abrupt Change Models. Comput Stat 2018, 33, 997–1015. [Google Scholar] [CrossRef]
- R Core Team. R: A Language and Environment for Statistical Computing. R Foundation for Statistical Computing: Vienna, Austria. 2023.
- RStudio Team. RStudio: Integrated Development for R.. RStudio, PBC,: Boston, MA. 2023.
- Wickham, H. Ggplot2: Elegant Graphics for Data Analysis; Springer-Verlag: New York, 2016. [Google Scholar]
- Wickham, H.; Bryan, J. Readxl: Read Excel Files_. R Package Version 1.4.3. 2023.
- Mapchart Version 4.3.2. Mapchart. 30 November 2023.
- Brewer, C. A.; Hatchard, G. W.; Harrower, M. A. ColorBrewer in Print: A Catalog of Color Schemes for Maps. Cartogr Geogr Inf Sci 2003, 30, 5–32. [Google Scholar] [CrossRef]
- Brewer, C. A.; Hatchard, G. W.; Harrower, M. A. COLORBREWER 2. 0 Color Advice for Cartograph. 2013.
- Rau, C.; Lüdecke, D.; Dumolard, L. B.; Grevendonk, J.; Wiernik, B. M.; Kobbe, R.; Gacic-Dobo, M.; Danovaro-Holliday, M. C. Data Quality of Reported Child Immunization Coverage in 194 Countries between 2000 and 2019. PLOS Global Public Health 2022, 2, e0000140. [Google Scholar] [CrossRef] [PubMed]
- Bower, M.; Kothari, U.; Akerman, M.; Krilov, L. R.; Fiorito, T. M. Impact of COVID-19 on HPV Vaccination Rates in New York City and Long Island. Pediatric Infectious Disease Journal 2023. [Google Scholar] [CrossRef] [PubMed]
- Urueña, A.; Machado, R.; Cunha, J.; López Colmano, C.; Rancaño, C.; Kfouri, R.; Pírez, C.; Bonvehí, P.; Calvo, M.; Cuadros, R.; Muñoz, G.; Rodríguez, M.; Torres, J.; Cahn, F.; Ballalai, I. Opinions, Attitudes and Factors Related to SARS-CoV-2 Vaccine Uptake in Eight South American Countries. Vaccines (Basel) 2023, 11, 1660. [Google Scholar] [CrossRef] [PubMed]
- Mwinnyaa, G.; Peters, M. A.; Shapira, G.; Neill, R.; Sadat, H.; Yuma, S.; Akilimali, P.; Hossain, S.; Wendrad, N.; Atiwoto, W. K.; Ofosu, A. A.; Alfred, J. P.; Kiarie, H.; Wesseh, C. S.; Isokpunwu, C.; Kangbai, D. M.; Mohamed, A. A.; Sidibe, K.; Drouard, S.; Fernandez, P. A.; Azais, V.; Hashemi, T.; Hansen, P. M.; Ahmed, T. Vaccination Utilization and Subnational Inequities during the COVID-19 Pandemic: An Interrupted Time-Series Analysis of Administrative Data across 12 Low- and Middle-Income Countries. Vaccines (Basel) 2023, 11, 1415. [Google Scholar] [CrossRef] [PubMed]
- Muhoza, P.; Danovaro-Holliday, M. C.; Diallo, M. S.; Murphy, P.; Sodha, S. V.; Requejo, J. H.; Wallace, A. S. Routine Vaccination Coverage — Worldwide, 2020. MMWR Morb Mortal Wkly Rep 2021, 70, 1495–1500. [Google Scholar] [CrossRef] [PubMed]
- Evans, B.; Keiser, O.; Kaiser, L.; Jombart, T. Analysis of Global Routine Immunisation Coverage Shows Disruption and Stagnation during the First Two-Years of the COVID-19 Pandemic with Tentative Recovery in 2022. Vaccine X 2023, 15, 100383. [Google Scholar] [CrossRef]
- LaMori, J.; Feng, X.; Pericone, C. D.; Mesa-Frias, M.; Sogbetun, O.; Kulczycki, A. Hepatitis Vaccination Adherence and Completion Rates and Factors Associated with Low Compliance: A Claims-Based Analysis of U.S. Adults. PLoS One 2022, 17, e0264062. [Google Scholar] [CrossRef]
- Périères, L.; Séror, V.; Boyer, S.; Sokhna, C.; Peretti-Watel, P. Reasons given for Non-Vaccination and under-Vaccination of Children and Adolescents in Sub-Saharan Africa: A Systematic Review. Hum Vaccin Immunother 2022, 18. [Google Scholar] [CrossRef]
- Atnafu Gebeyehu, N.; Abebe Gelaw, K.; Asmare Adella, G.; Dagnaw Tegegne, K.; Adie Admass, B.; Mesele Gesese, M. Incomplete Immunization and Its Determinants among Children in Africa: Systematic Review and Meta-Analysis. Hum Vaccin Immunother 2023. [Google Scholar] [CrossRef]
- Tan, L. (L. J.; Safadi, M. A. P.; Horn, M.; Regojo Balboa, C.; Moya, E.; Schanbaum, J.; Pimenta, P.; Lambert, E.; Soumahoro, L.; Sohn, W.-Y.; Bruce, T.; Ruiz García, Y. Pandemic's Influence on Parents' Attitudes and Behaviors toward Meningococcal Vaccination. Hum Vaccin Immunother 2023, 19. [Google Scholar] [CrossRef]
- Bonanni, P.; Steffen, R.; Schelling, J.; Balaisyte-Jazone, L.; Posiuniene, I.; Zatoński, M.; Van Damme, P. Vaccine Co-Administration in Adults: An Effective Way to Improve Vaccination Coverage. Hum Vaccin Immunother 2023, 19. [Google Scholar] [CrossRef] [PubMed]
- Evans, W. D.; Bingenheimer, J. B.; Long, M.; Ndiaye, K.; Donati, D.; Rao, N. M.; Akaba, S.; Nsofor, I.; Agha, S. Outcomes of a Social Media Campaign to Promote COVID-19 Vaccination in Nigeria. PLoS One 2023, 18, e0290757. [Google Scholar] [CrossRef]
- Diedrich, D. , Northcote, N., Röder, T., & Sauer-Sidor, K. Strategic resilience during the COVID-19 crisis | McKinsey https://www.mckinsey.com/capabilities/strategy-and-corporate-finance/our-insights/strategic-resilience-during-the-covid-19-crisis (accessed 2023 -04 -29).
- WHO and UNICEF warn of a decline in vaccinations during COVID-19 https://www.who.int/news/item/15-07-2020-who-and-unicef-warn-of-a-decline-in-vaccinations-during-covid-19 (accessed 2023 -04 -29).
- Watts, E.; Mak, J.; Patenaude, B. Benefit-Cost Ratios of Continuing Routine Immunization During the COVID-19 Pandemic in Africa. J Benefit Cost Anal 2022, 13, 91–106. [Google Scholar] [CrossRef]
- de Oliveira Roque e Lima, J.; Pagotto, V.; Rocha, B. S.; Scalize, P. S.; Guimarães, R. A.; de Lima, M. D.; da Silva, L. N.; da Silva Oliveira, M. D.; Moura, W. É. A.; Teles, S. A.; Rosso, C. F. W.; Caetano, K. A. A. Low Vaccine Coverage and Factors Associated with Incomplete Childhood Immunization in Racial/Ethnic Minorities and Rural Groups, Central Brazil. Vaccines (Basel) 2023, 11, 838. [Google Scholar] [CrossRef] [PubMed]
- Tan, N. C.; Pang, J.; Koh, E. The Impact of a Revised National Childhood Immunization Schedule on Vaccination Defaulters. Vaccines (Basel) 2023, 11, 859. [Google Scholar] [CrossRef]
- Saxena, K.; Marden, J. R.; Carias, C.; Bhatti, A.; Patterson-Lomba, O.; Gomez-Lievano, A.; Yao, L.; Chen, Y.-T. Impact of the COVID-19 Pandemic on Adolescent Vaccinations: Projected Time to Reverse Deficits in Routine Adolescent Vaccination in the United States. Curr Med Res Opin 2021, 37, 2077–2087. [Google Scholar] [CrossRef] [PubMed]
- Patel Murthy, B.; Zell, E.; Kirtland, K.; Jones-Jack, N.; Harris, L.; Sprague, C.; Schultz, J.; Le, Q.; Bramer, C. A.; Kuramoto, S.; Cheng, I.; Woinarowicz, M.; Robison, S.; McHugh, A.; Schauer, S.; Gibbs-Scharf, L. Impact of the COVID-19 Pandemic on Administration of Selected Routine Childhood and Adolescent Vaccinations — 10 U.S. Jurisdictions, March–September 2020. MMWR Morb Mortal Wkly Rep 2021, 70, 840–845. [Google Scholar] [CrossRef]
- Moraga-Llop, F. A.; Fernández-Prada, M.; Grande-Tejada, A. M.; Martínez-Alcorta, L. I.; Moreno-Pérez, D.; Pérez-Martín, J. J. Recovering Vaccine Coverage Lost Due to the COVID-19 Pandemic. Vacunas (English Edition) 2020, 21, 129–135. [Google Scholar] [CrossRef]
- WHO. Scale-up routine immunization along with COVID-19 vaccination: WHO https://www.who.int/southeastasia/news/detail/08-09-2021-scale-up-routine-immunization-along-with-covid-19-vaccination-who (accessed 2023 -04 -29).
- Berhane, H. Y.; Worku, A.; Fawzi, W. Effect of COVID-19 on Routine Childhood Vaccination in Bahir Dar City, Northwestern, Ethiopia. Vaccines (Basel) 2023, 11, 1569. [Google Scholar] [CrossRef]
Figure 1.
Third DTP doses vaccination rate trends in the Americas (2012-2021) indicating joinpoints.
Figure 1.
Third DTP doses vaccination rate trends in the Americas (2012-2021) indicating joinpoints.
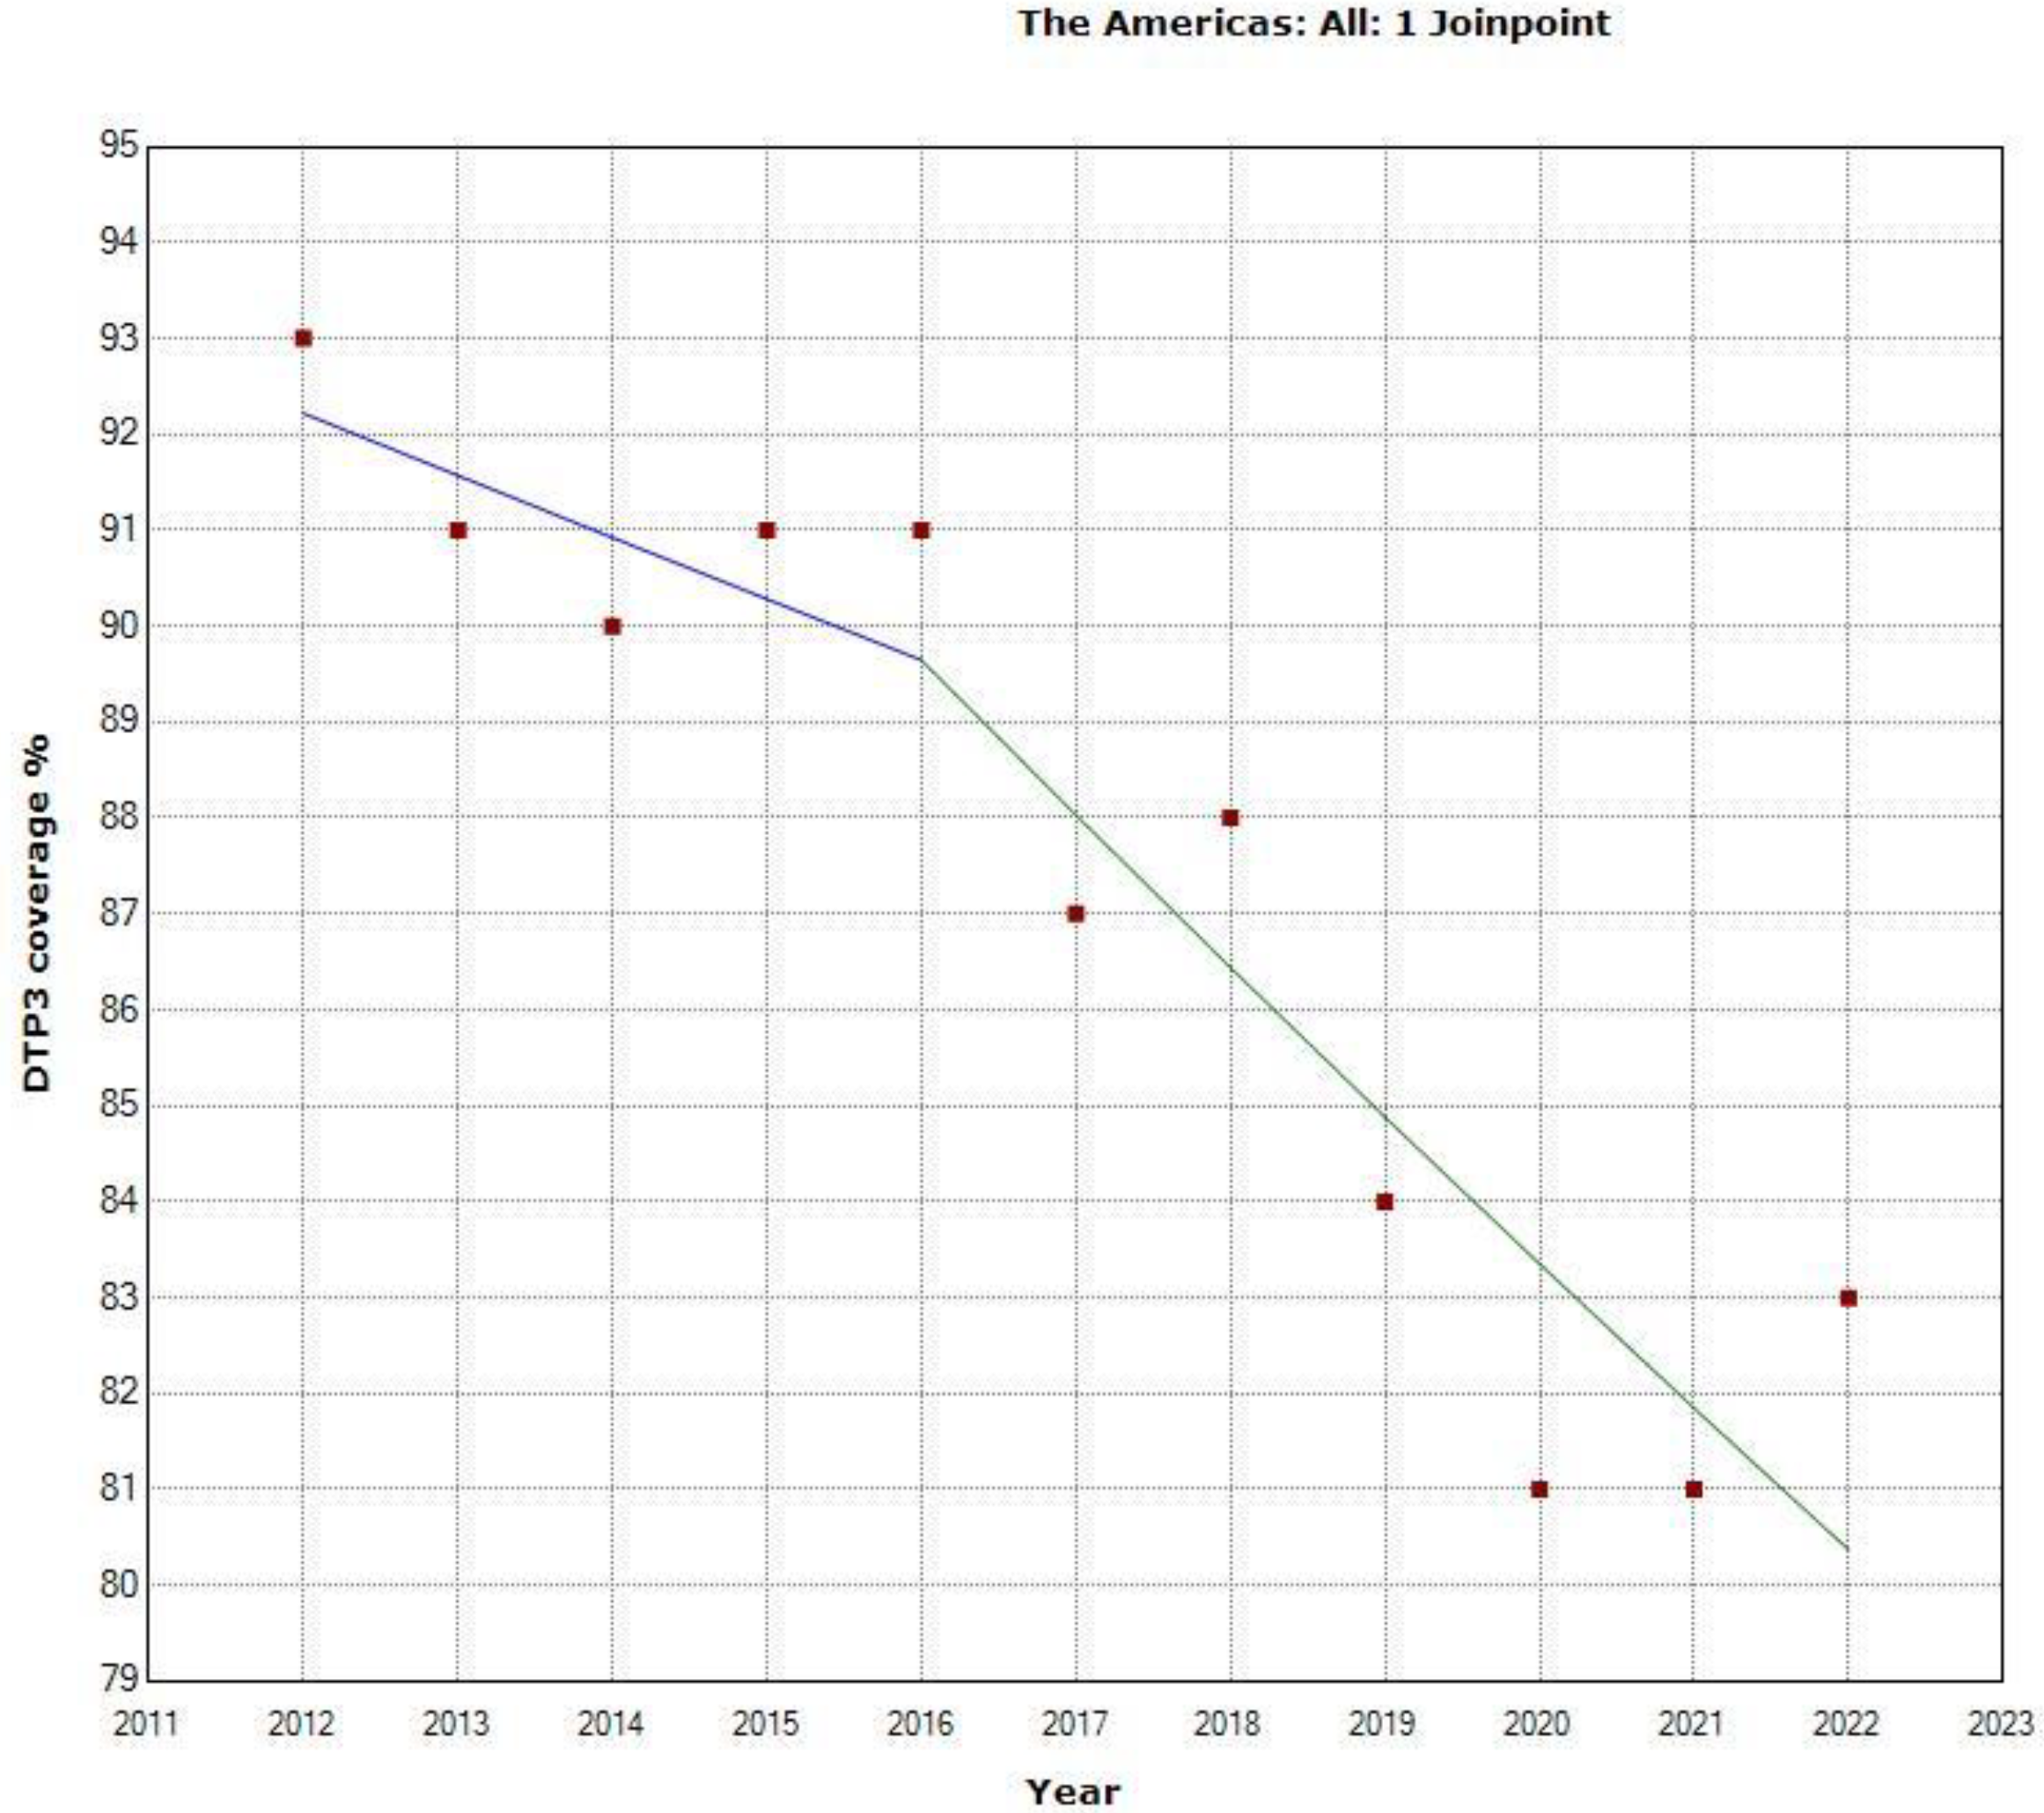
Figure 2.
Third DTP doses vaccination rate trends (2012-2022): North America.
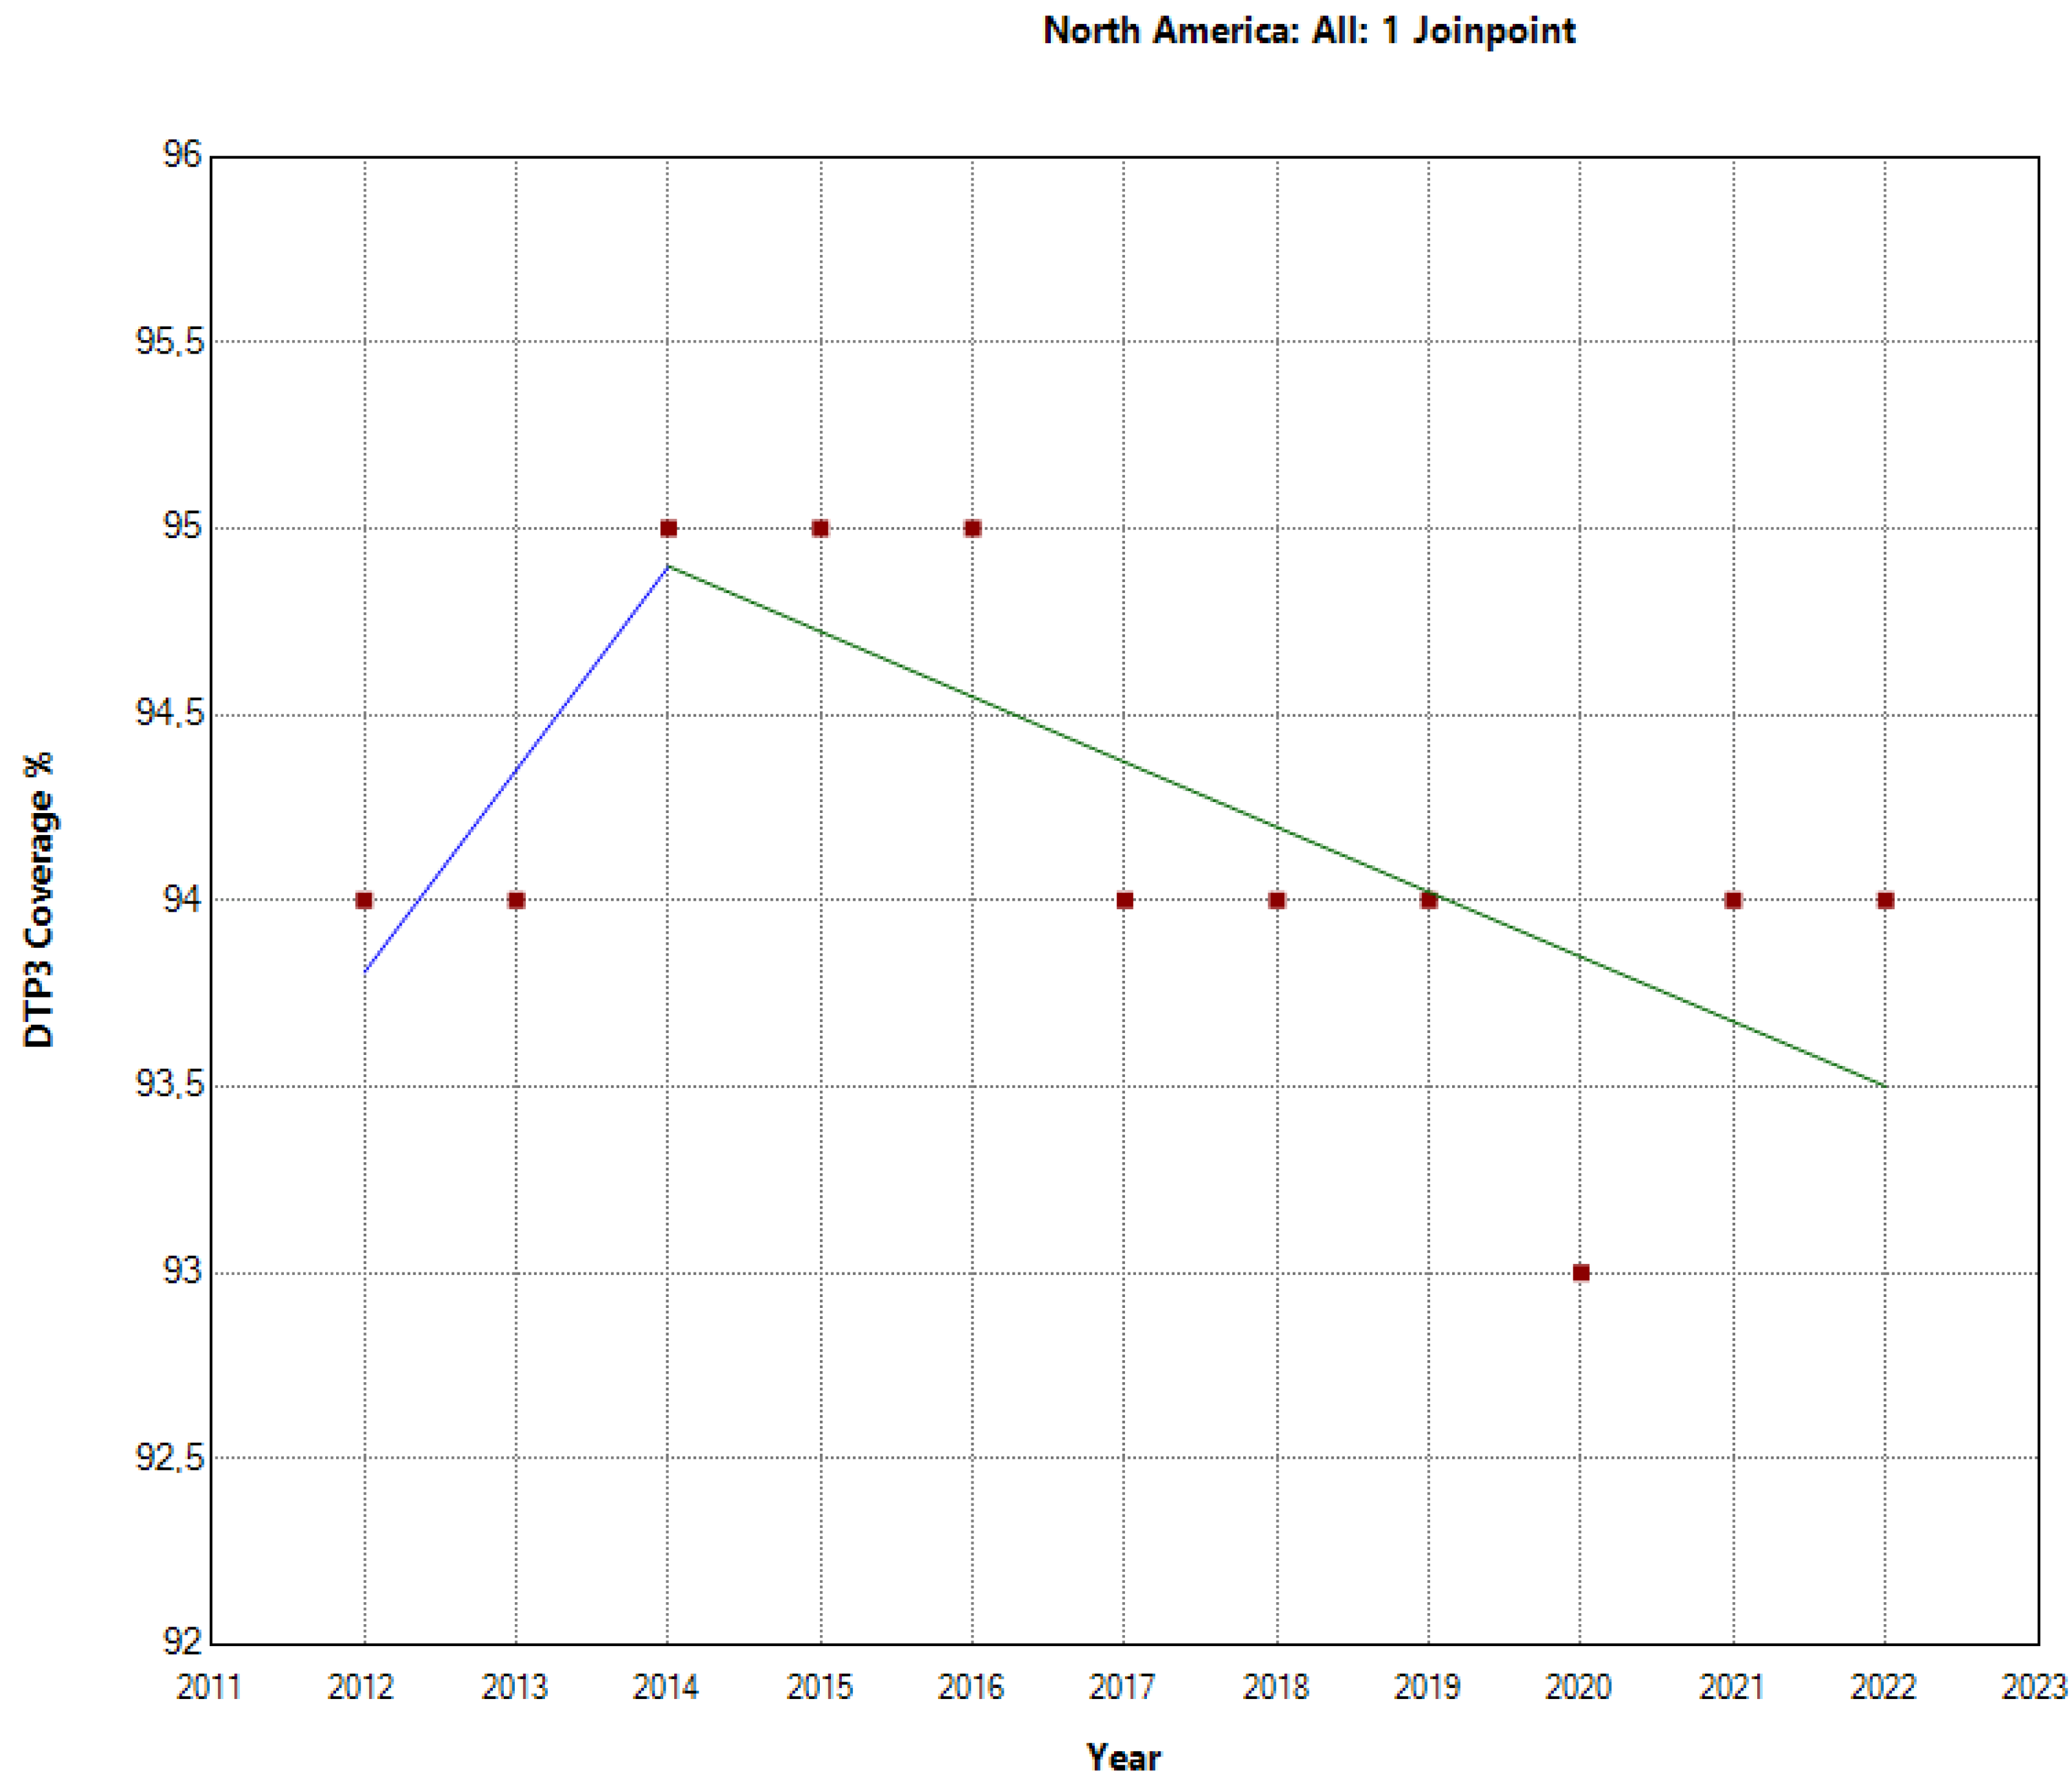
Figure 3.
Third DTP doses vaccination rate trends in Latin America and the Caribbean (2012-2022) indicating joinpoints.
Figure 3.
Third DTP doses vaccination rate trends in Latin America and the Caribbean (2012-2022) indicating joinpoints.
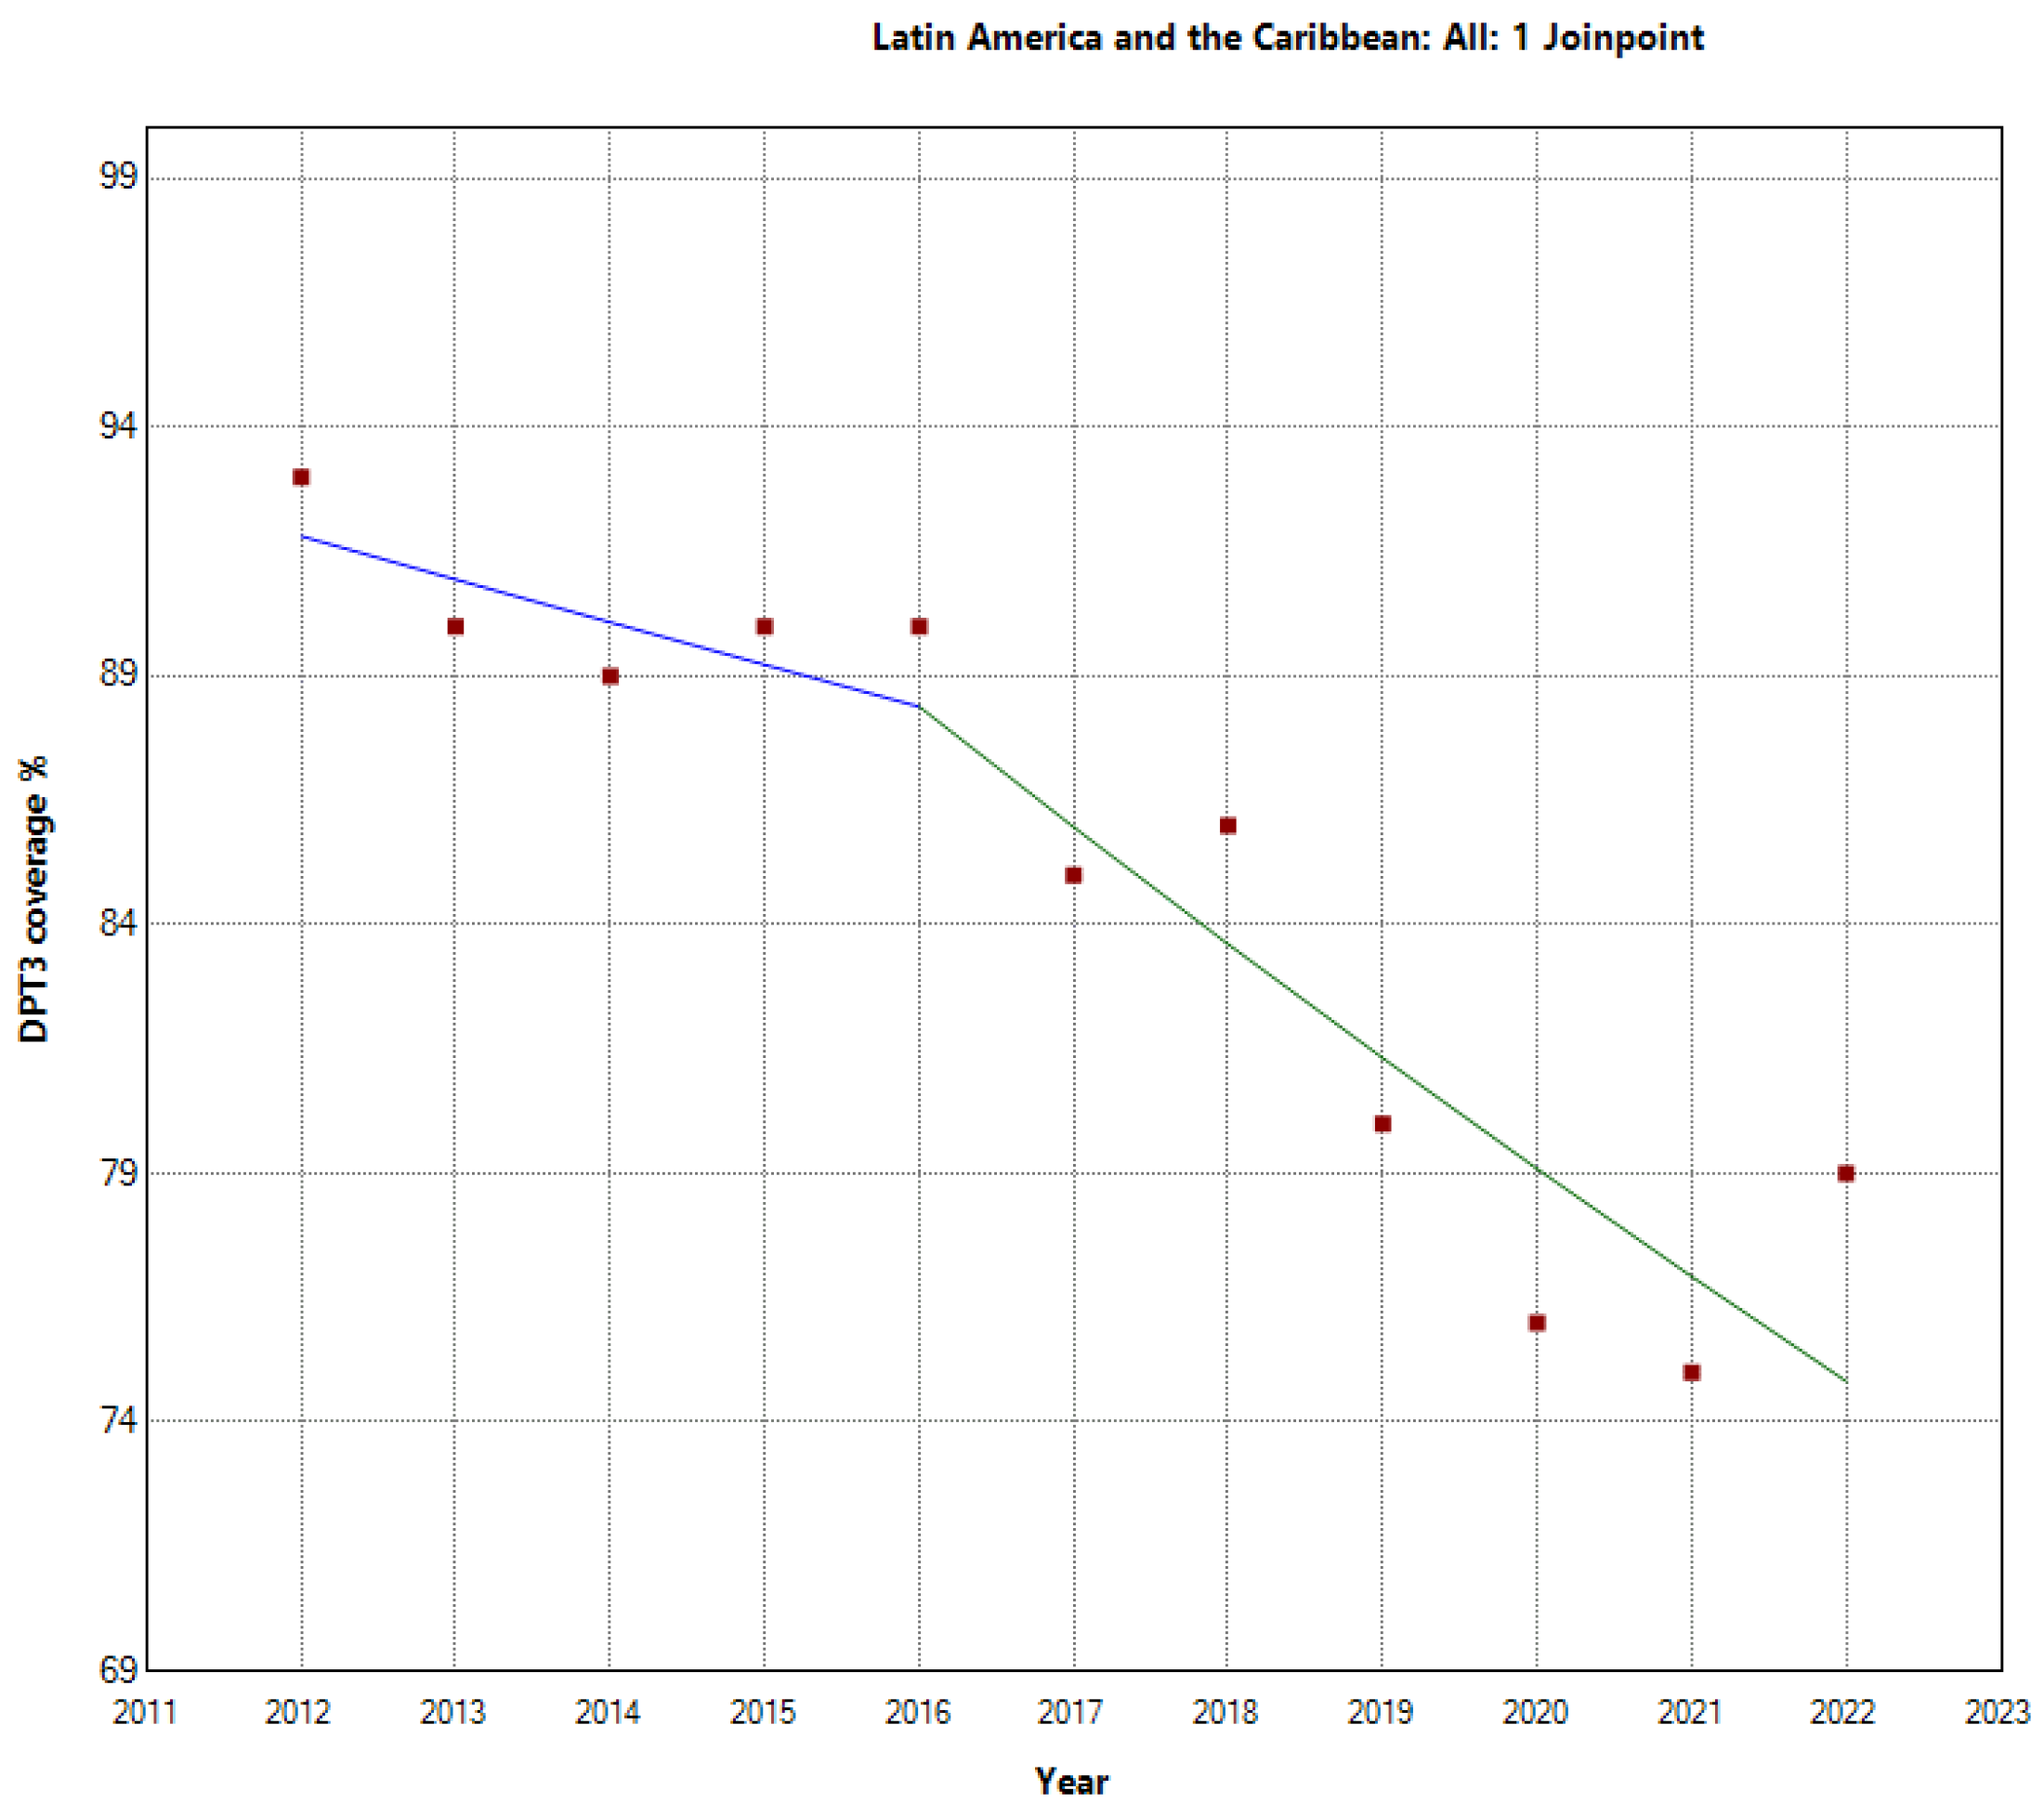
Figure 4.
Third DTP doses vaccination rate trends (2012-2022) in Central America.
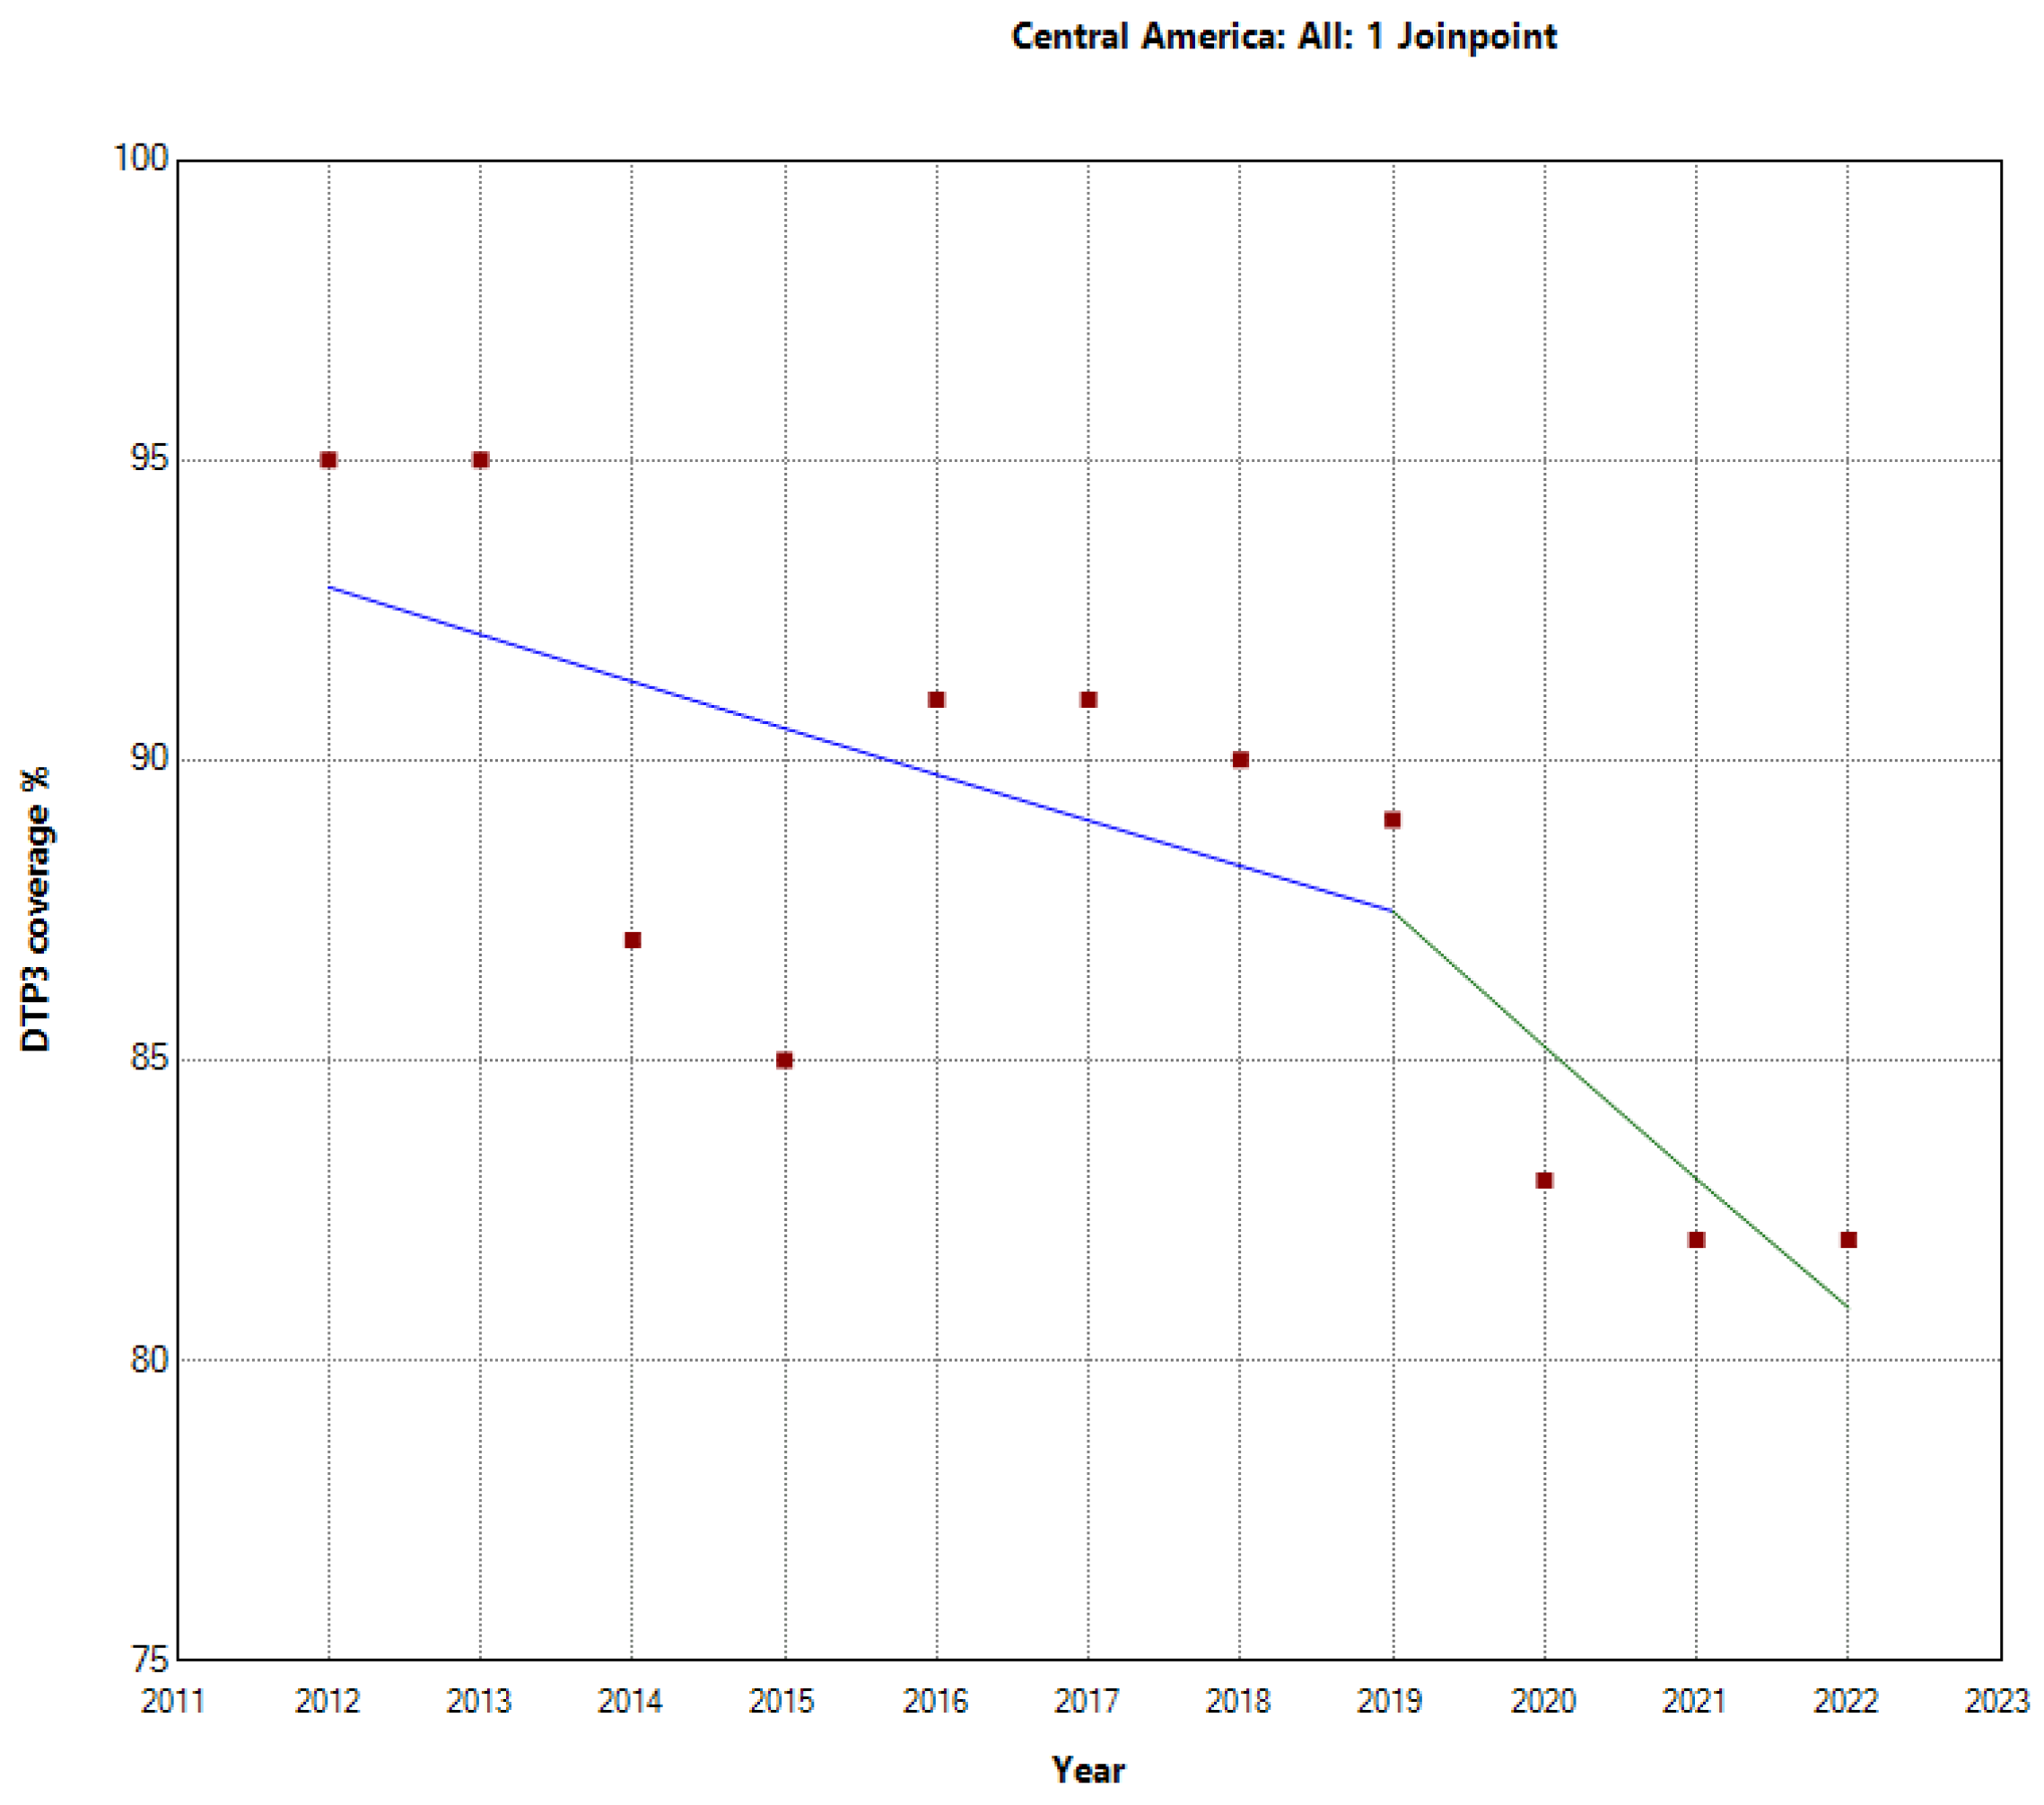
Figure 5.
Third DTP dose coverage (2012-22) in the Caribbean indicating joinpoints.
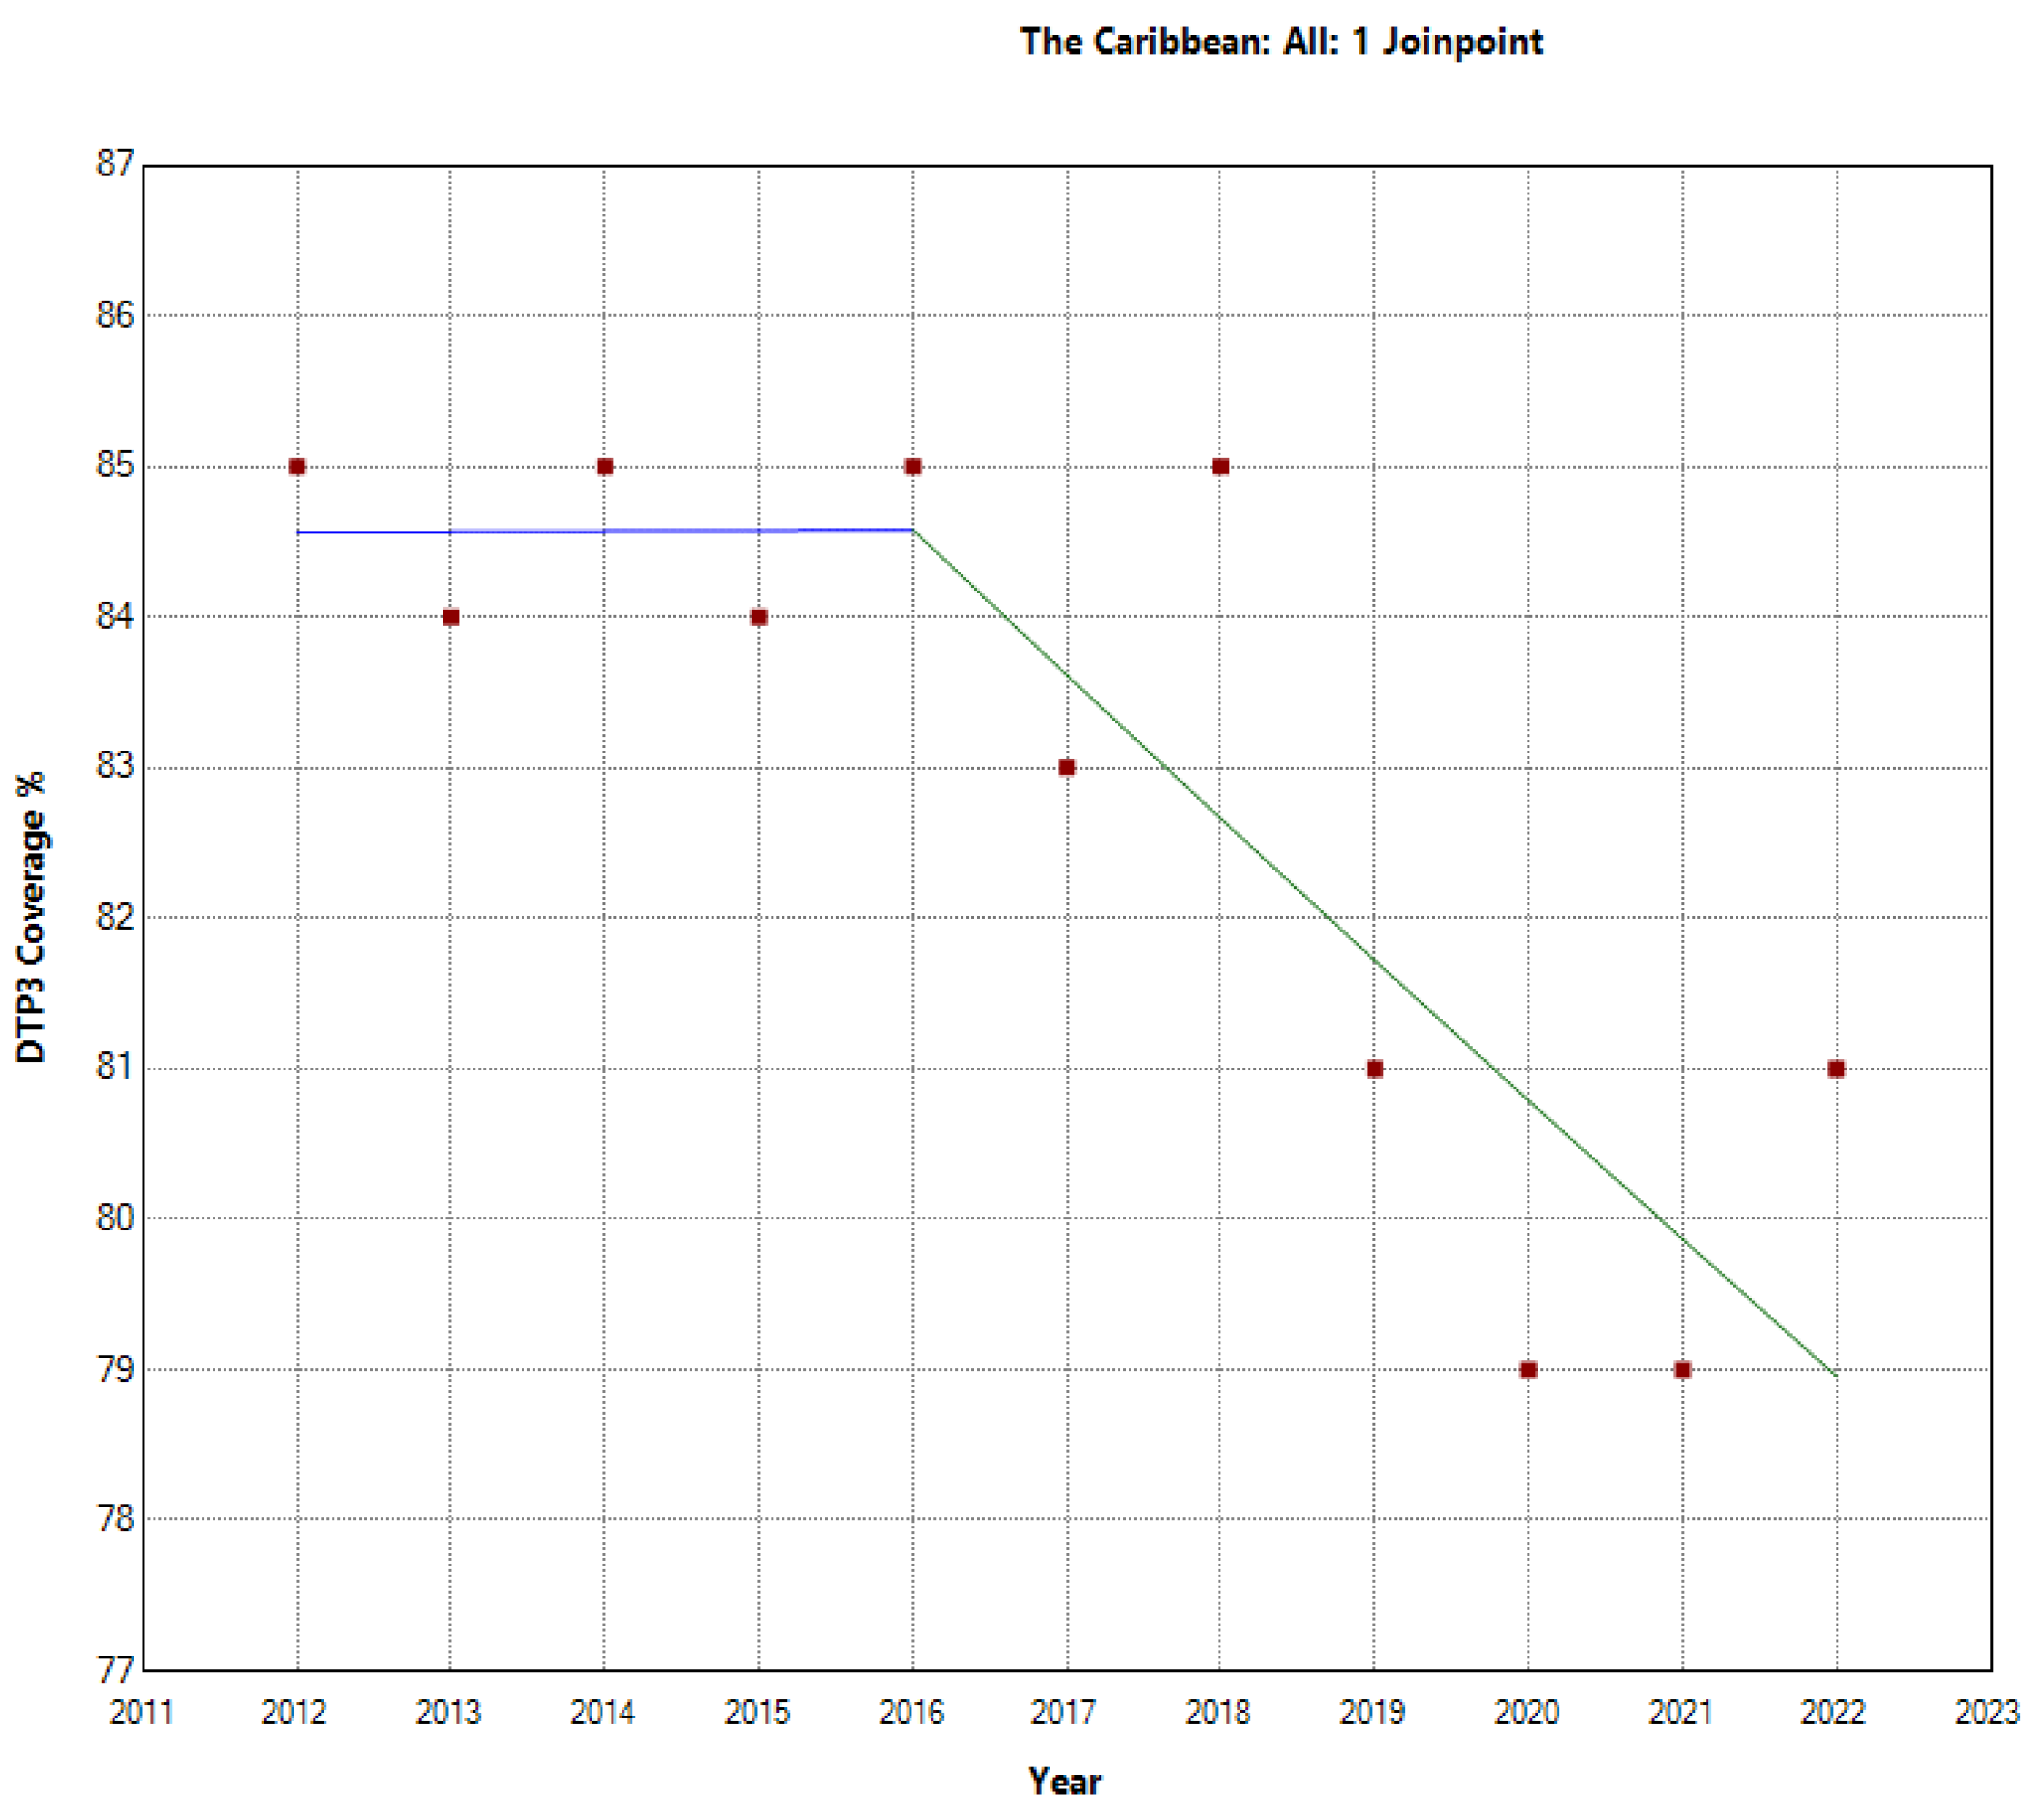
Figure 6.
Third DTP dose coverage (2012-22) in South America indicating joinpoints.
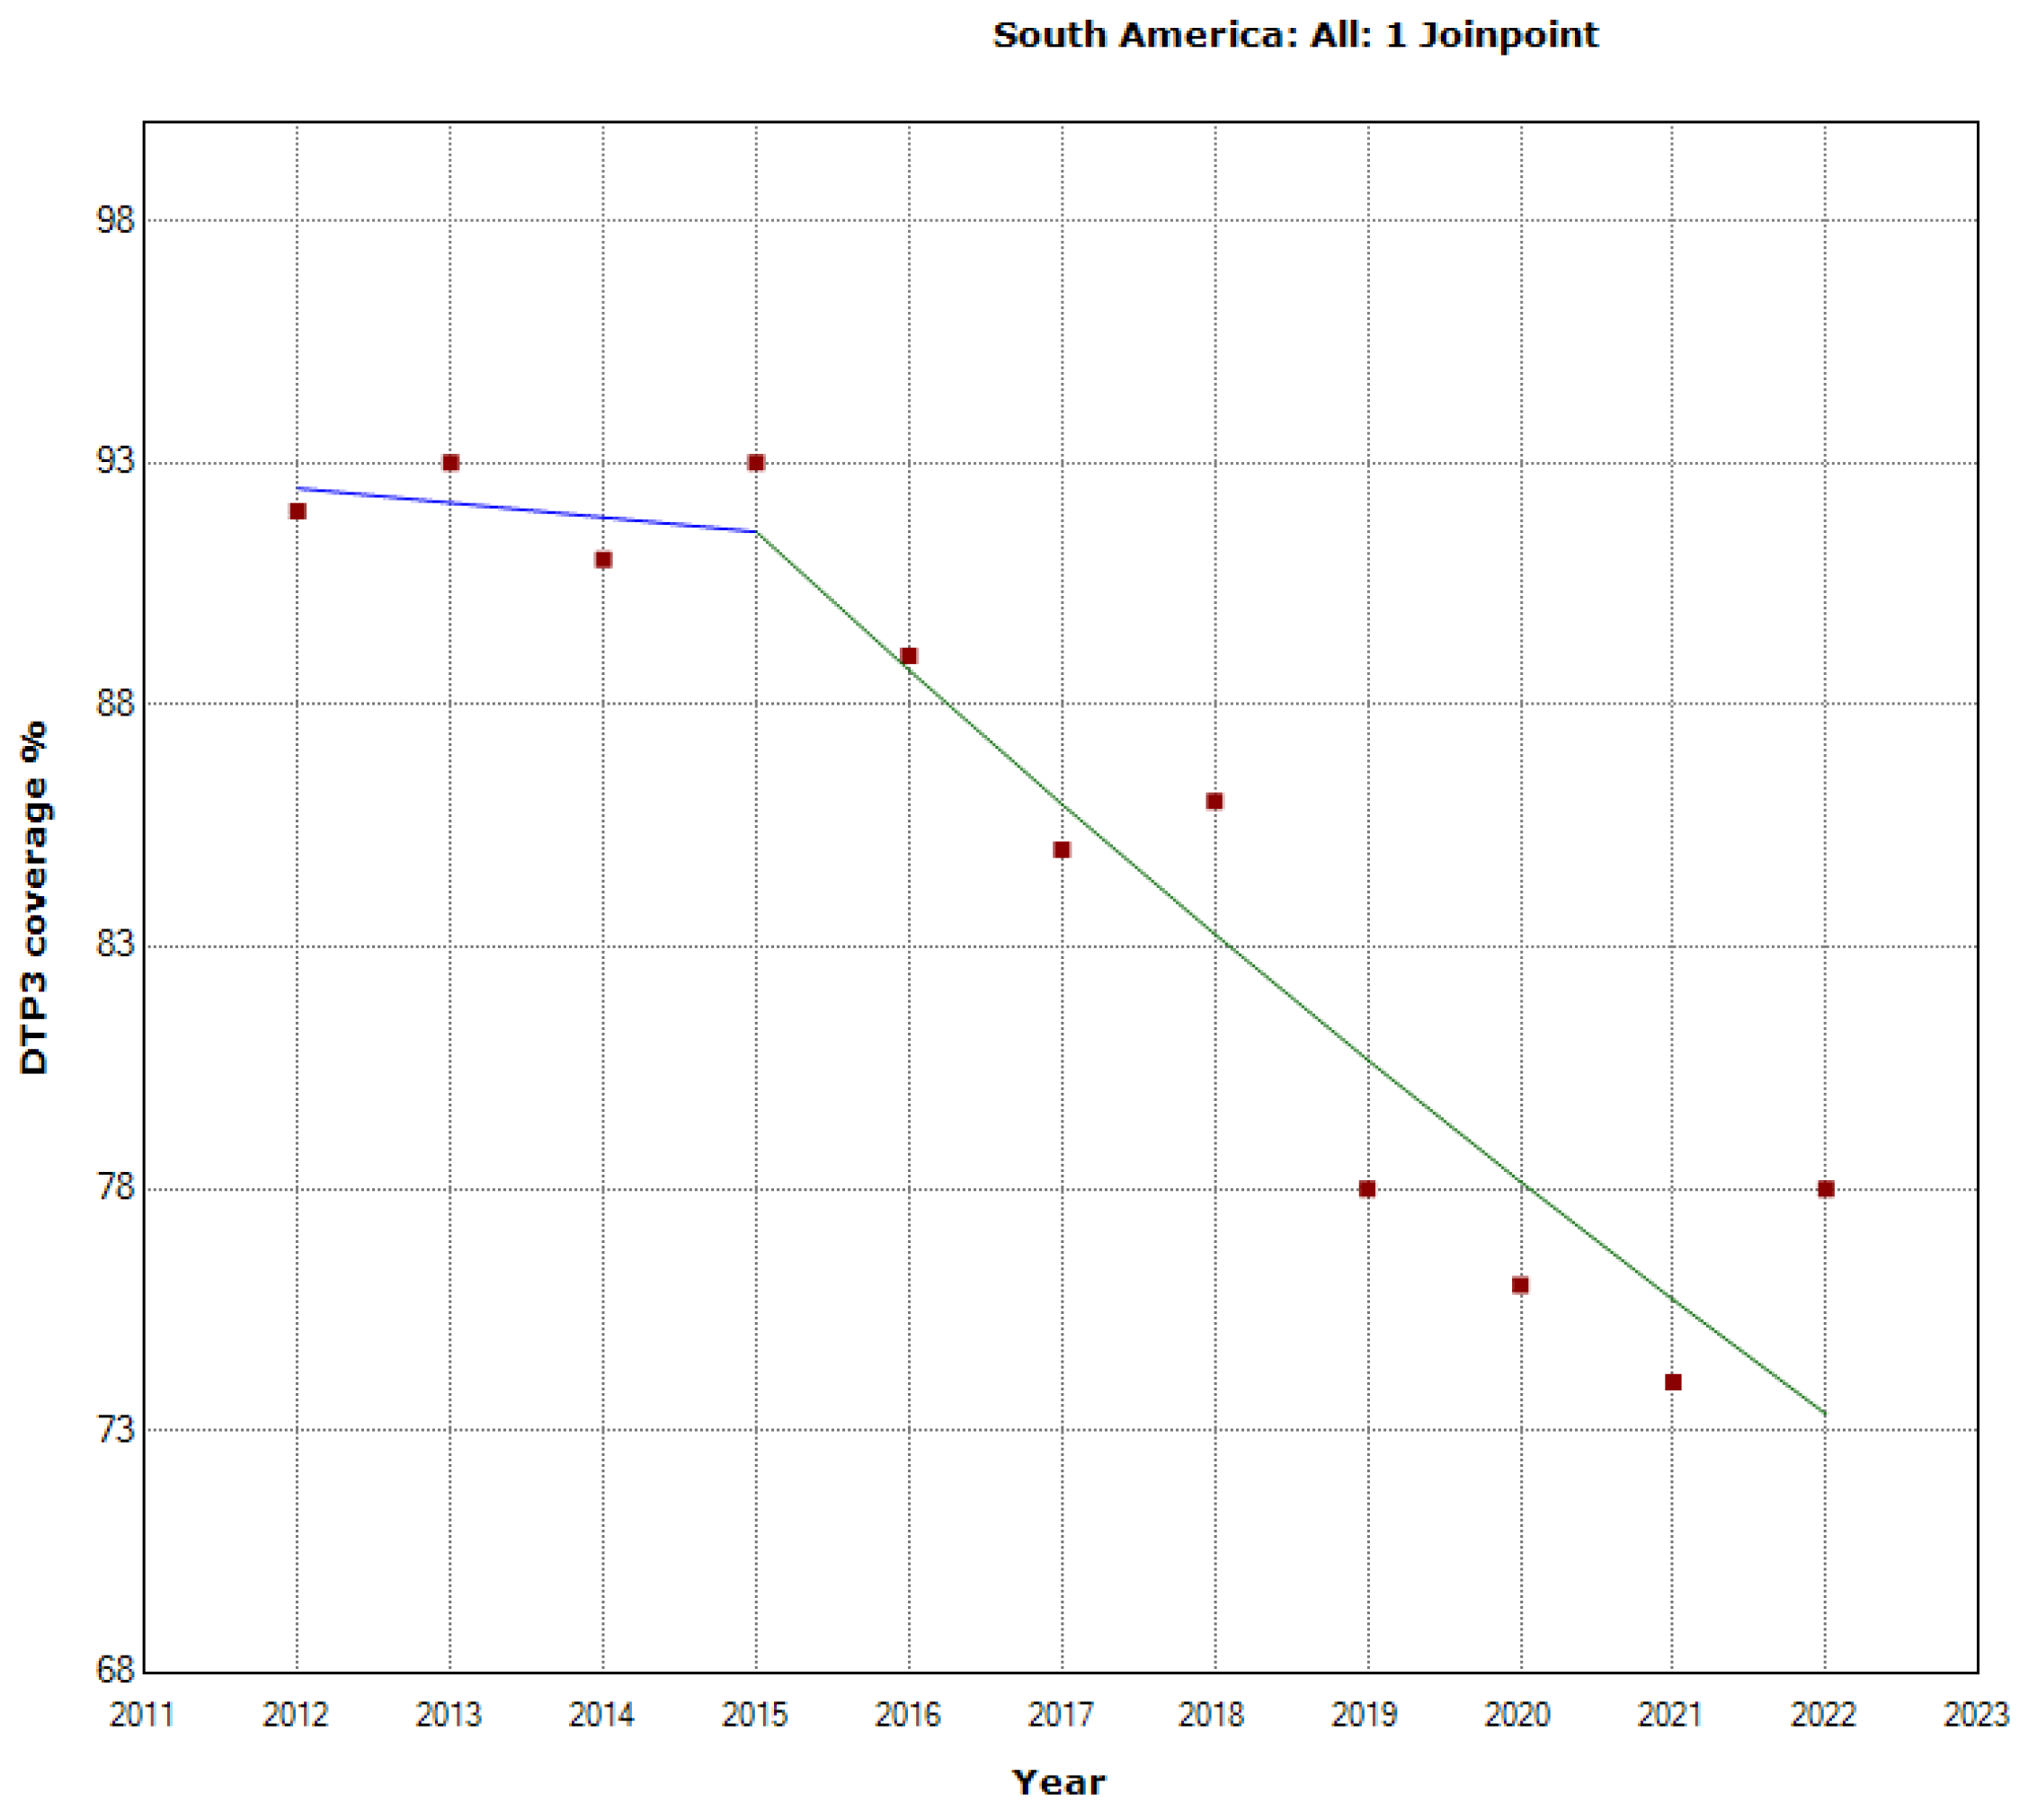
Figure 7.
Evolution of Third DTP dose coverage (2012-22) in South America by Regions.
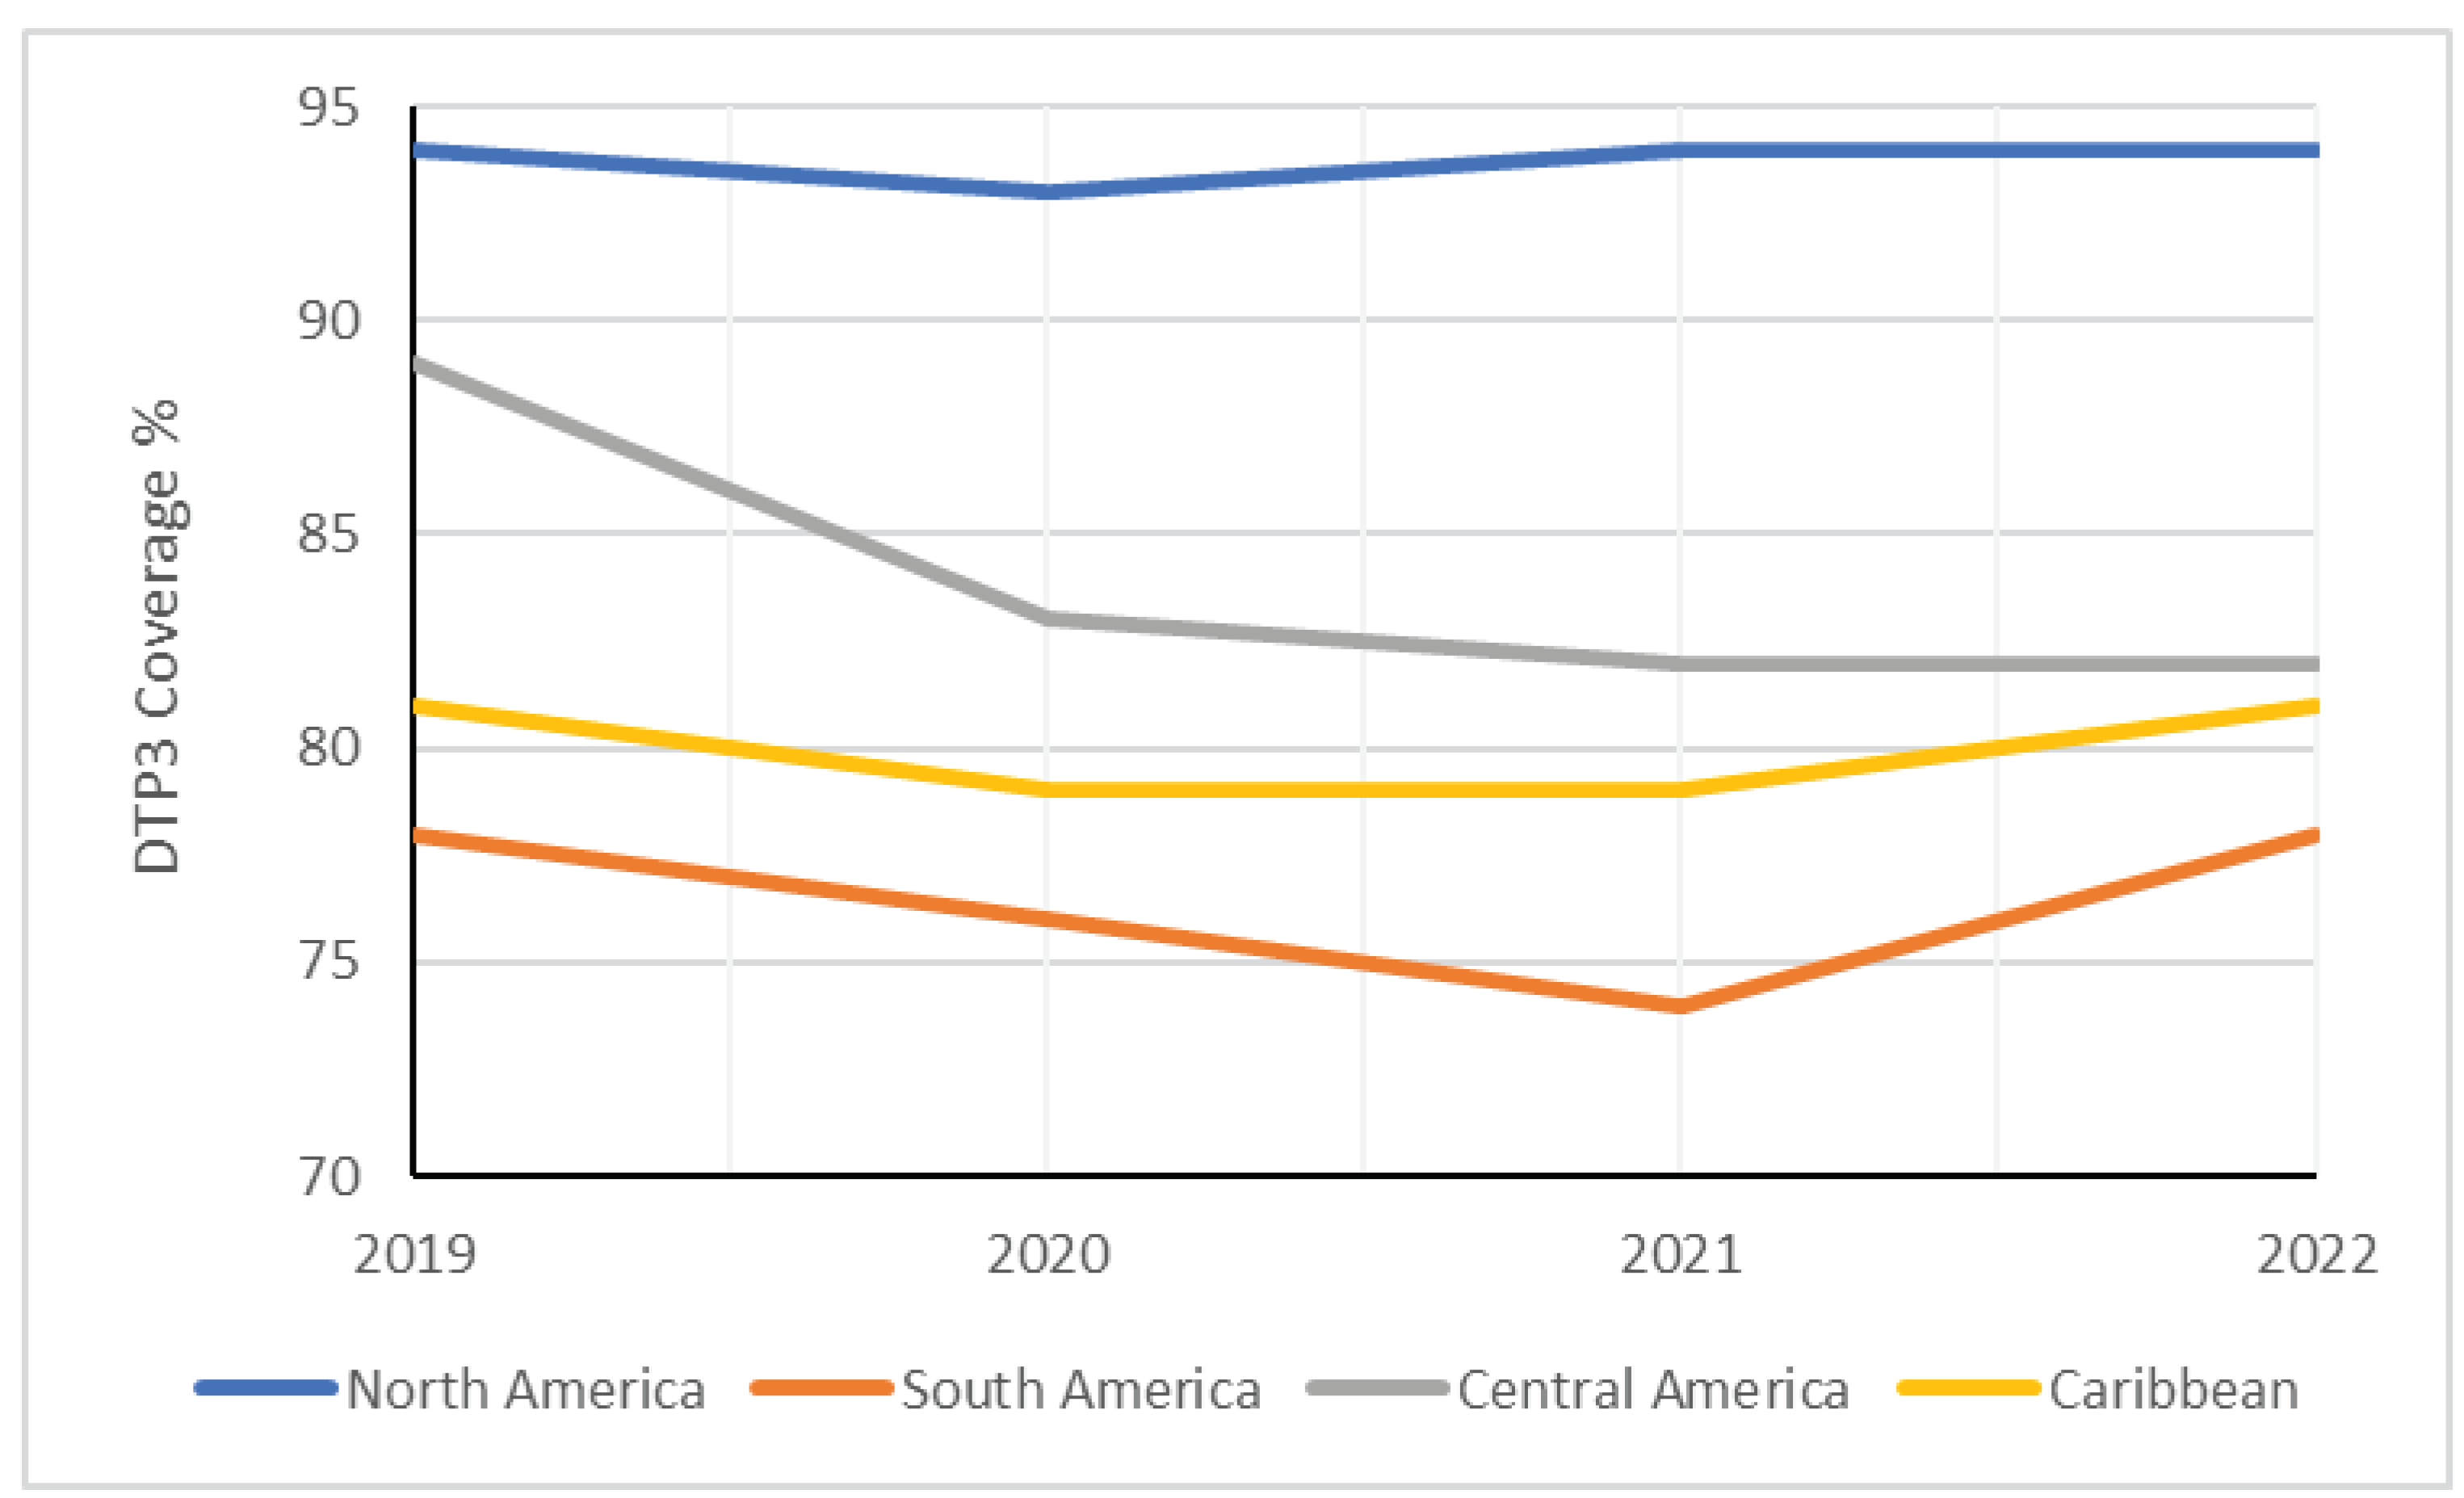
Figure 8.
Absolute Changes in DTP Vaccination Coverage (%) Across American Countries between 2019 and 2020.
Figure 8.
Absolute Changes in DTP Vaccination Coverage (%) Across American Countries between 2019 and 2020.
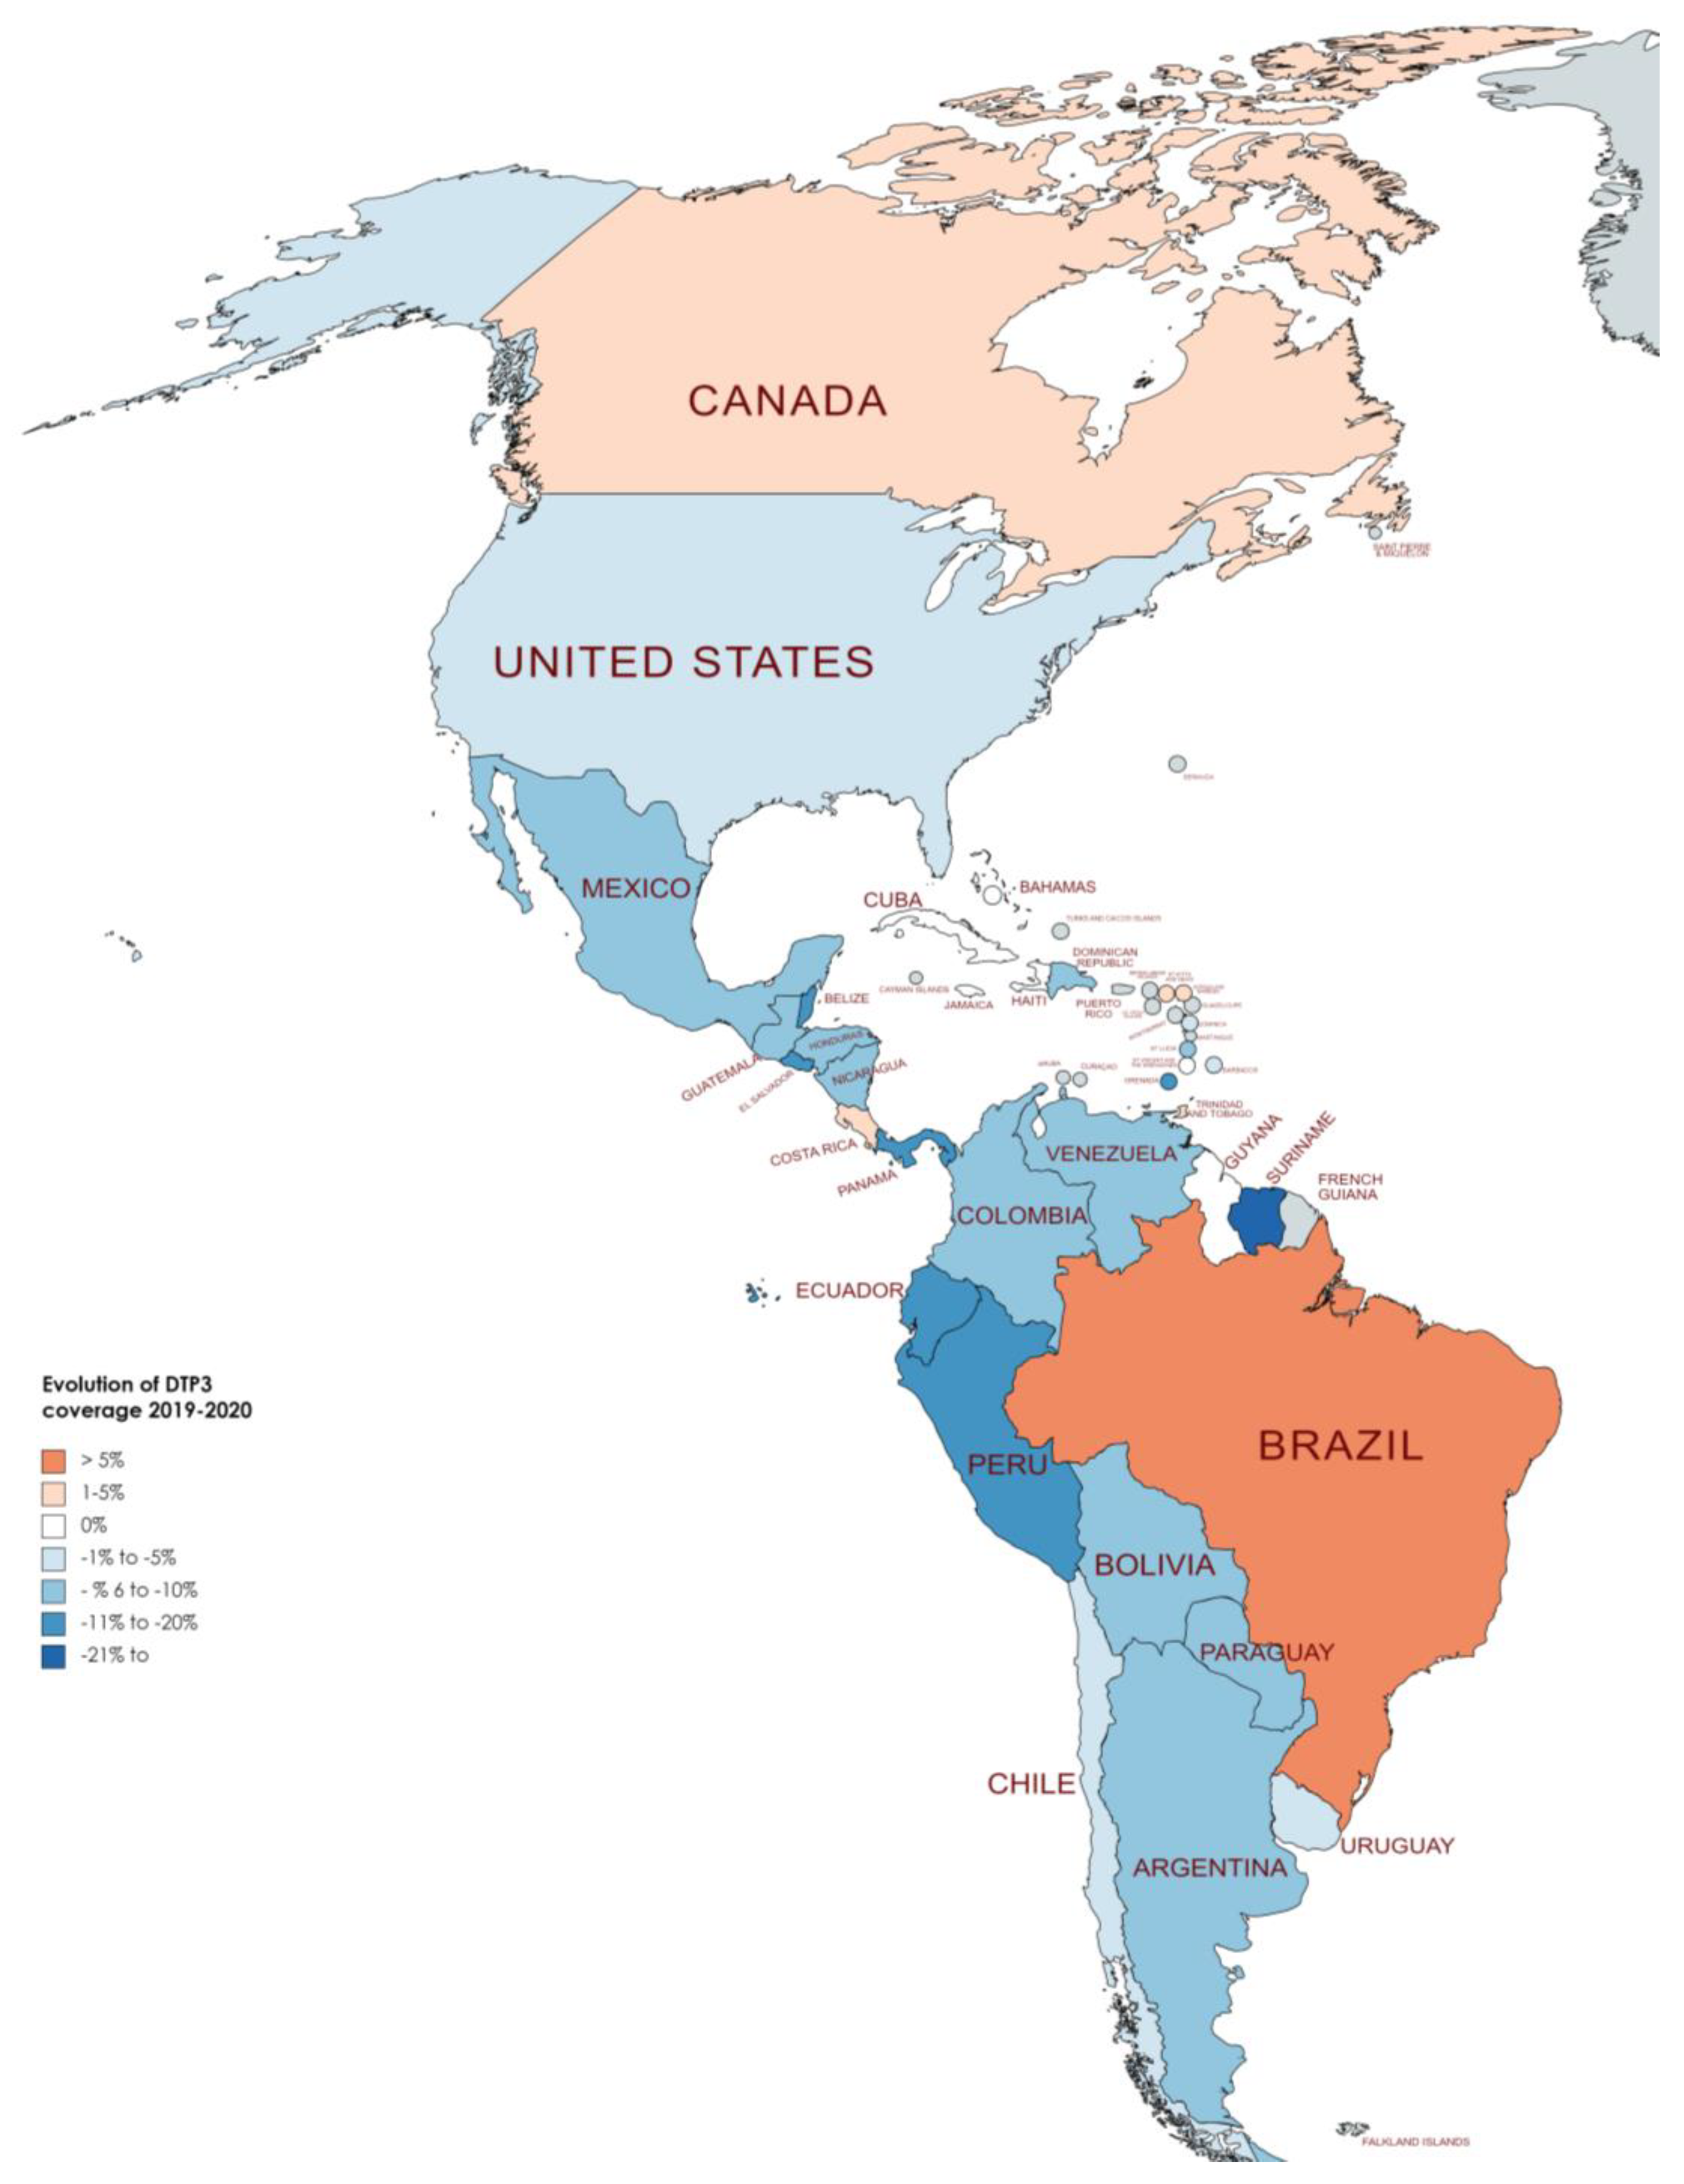
Figure 9.
Absolute Changes in DTP Vaccination Coverage (%) Across American Countries between 2019 and 2021.
Figure 9.
Absolute Changes in DTP Vaccination Coverage (%) Across American Countries between 2019 and 2021.
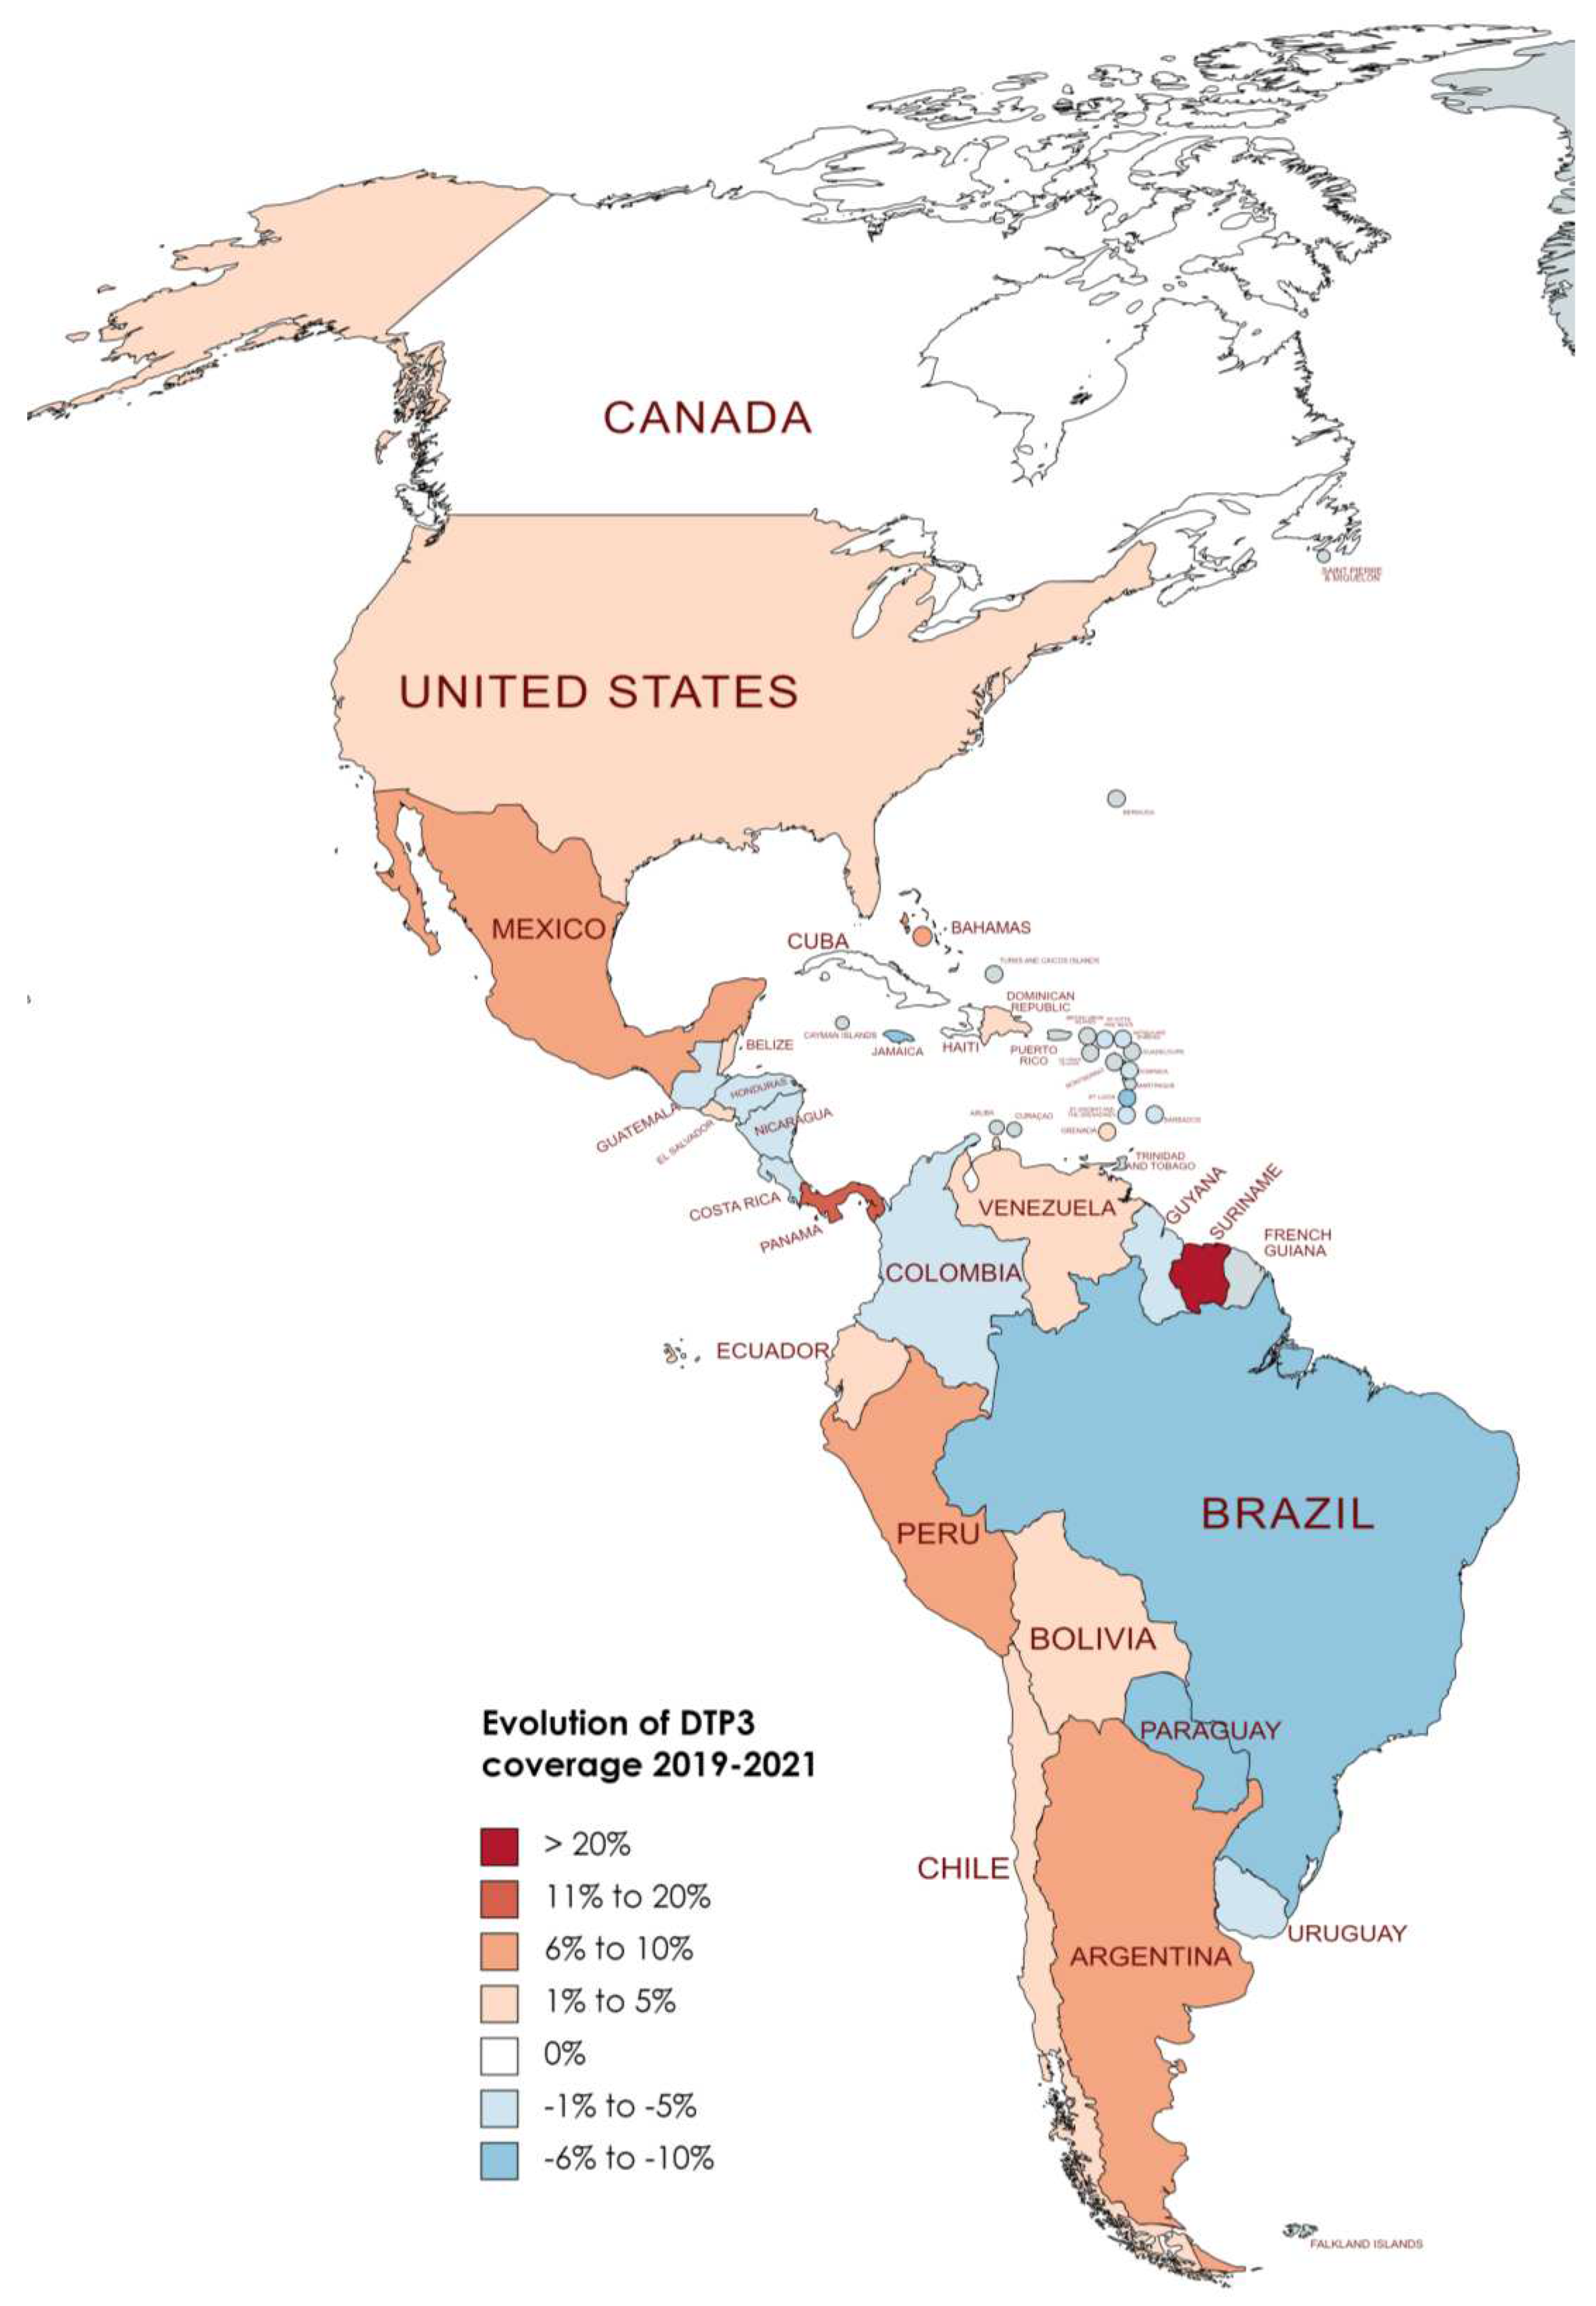
Figure 10.
Absolute Changes in DTP3 Vaccination Coverage (%) Across American Countries between 2019 and 2022.
Figure 10.
Absolute Changes in DTP3 Vaccination Coverage (%) Across American Countries between 2019 and 2022.
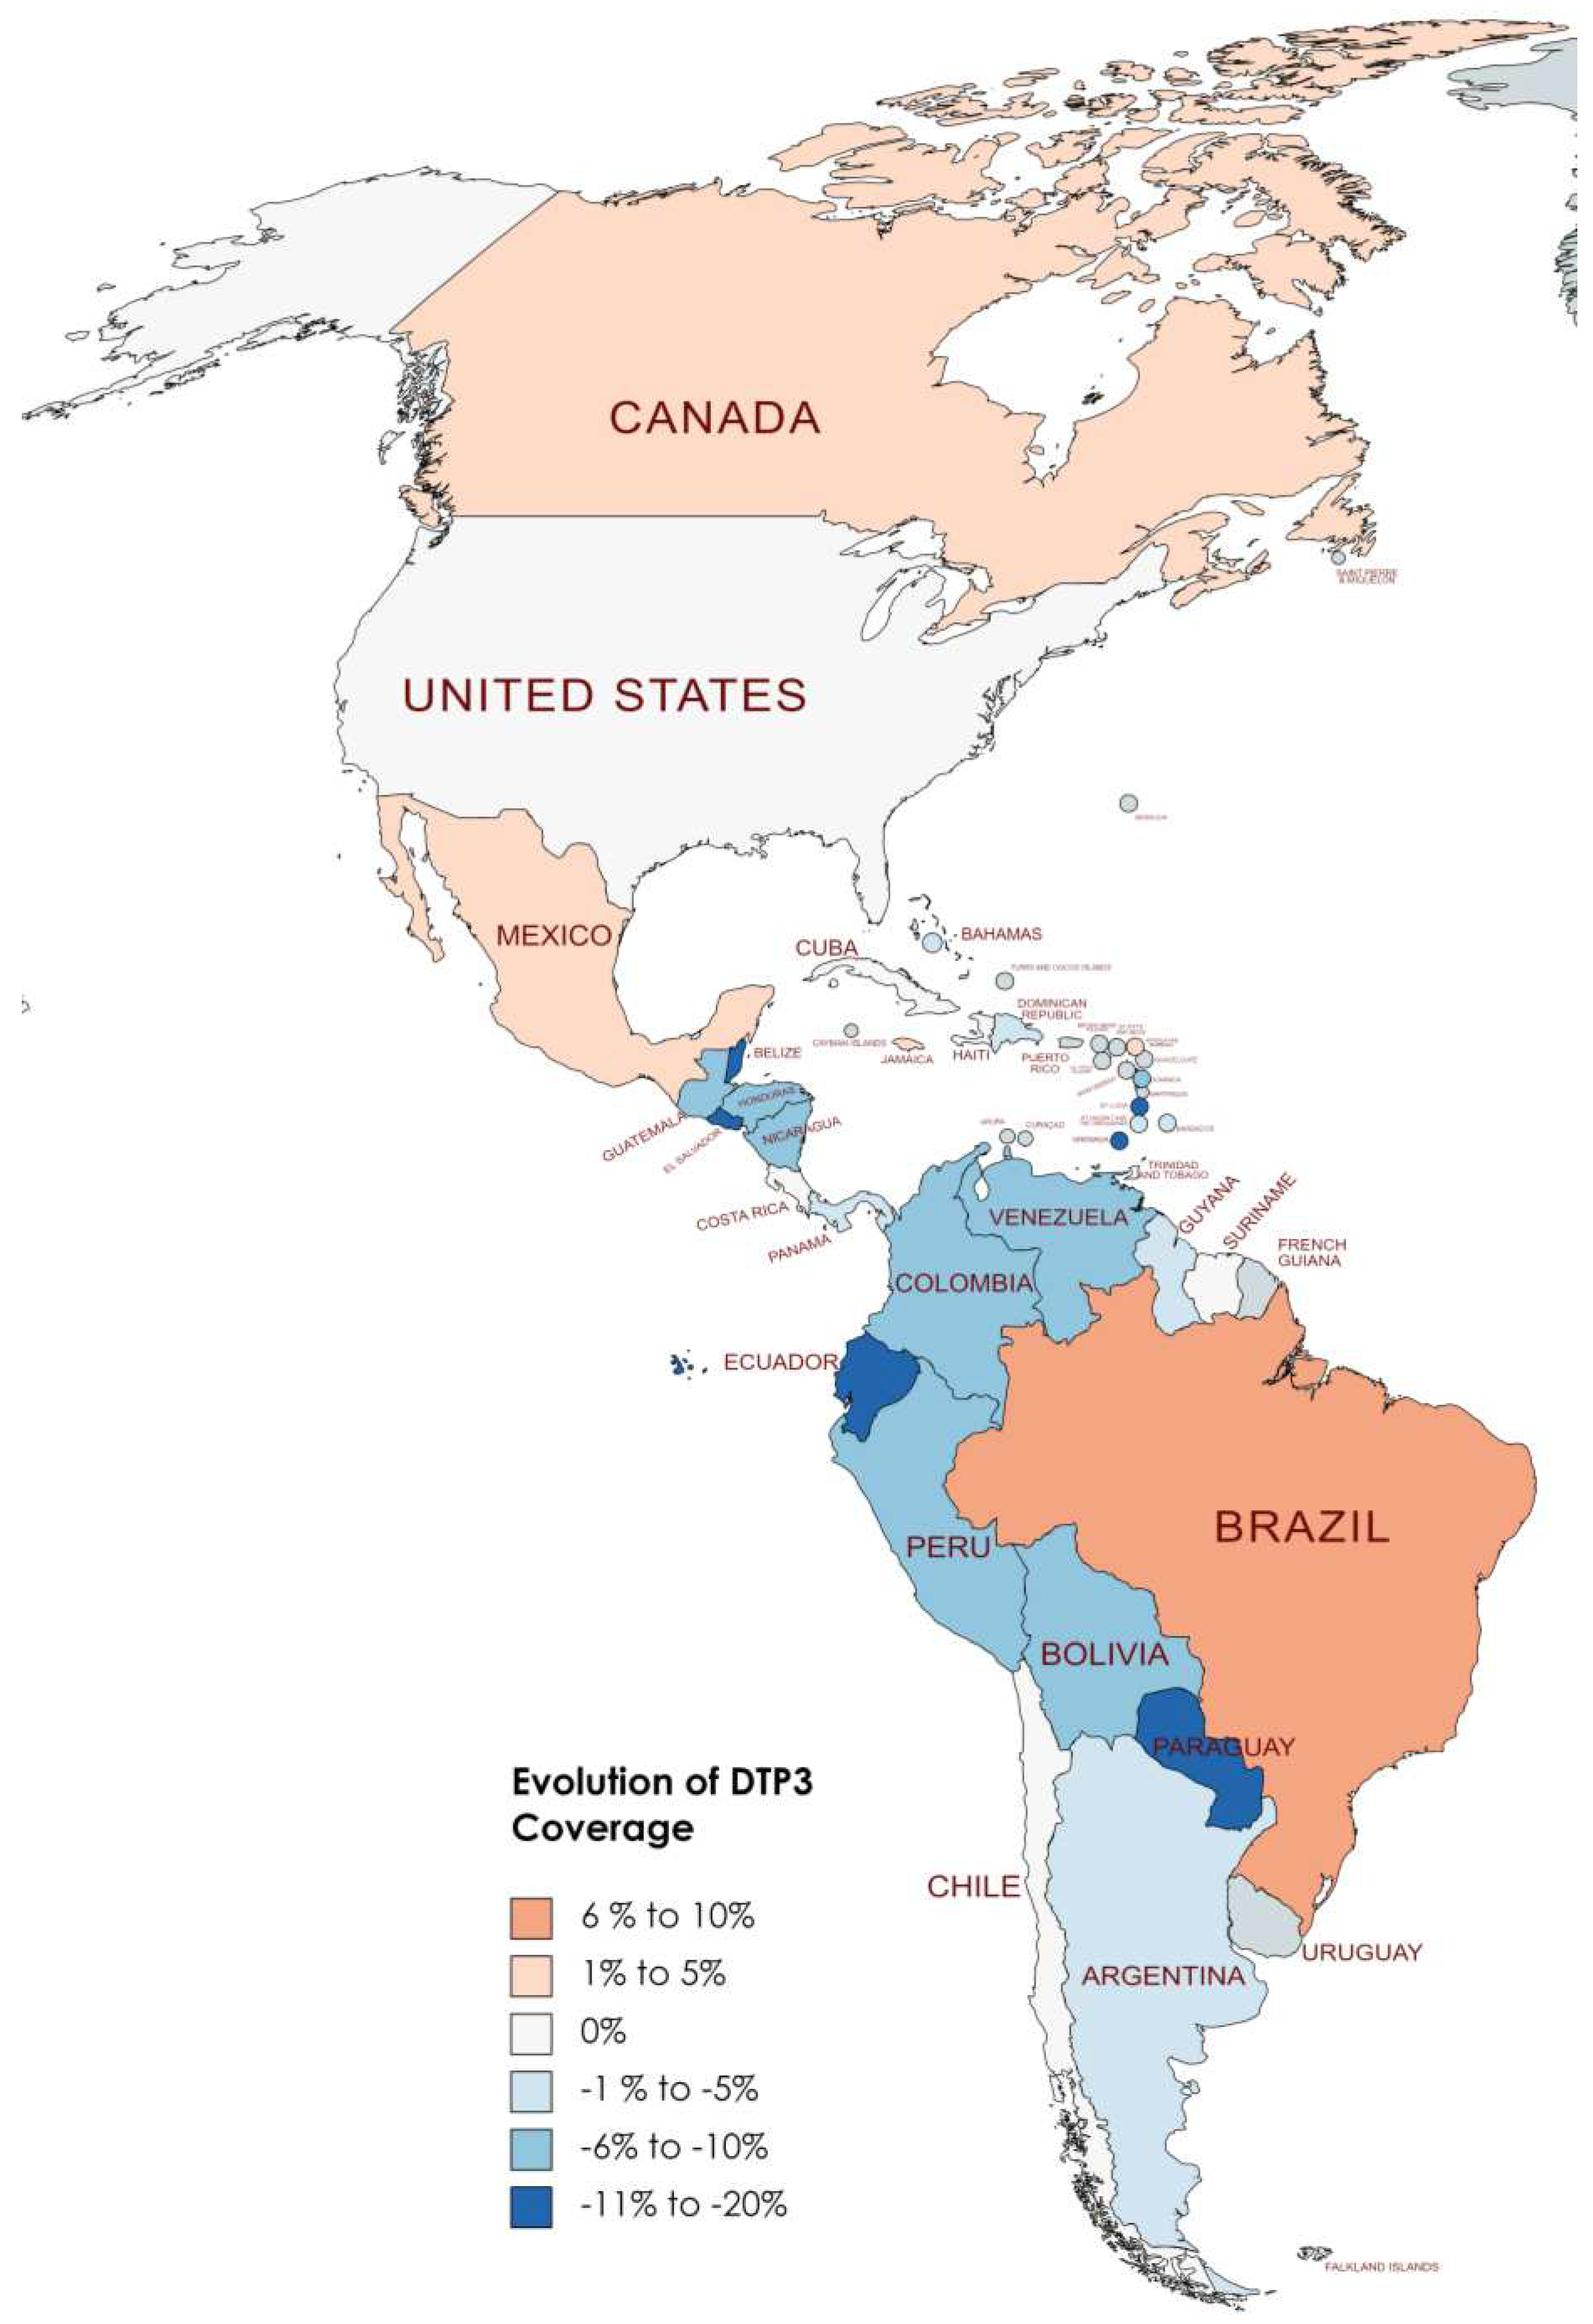
Figure 11.
American Countries Meeting the WHO 90% DTP3 Vaccination Coverage Target in 2019.
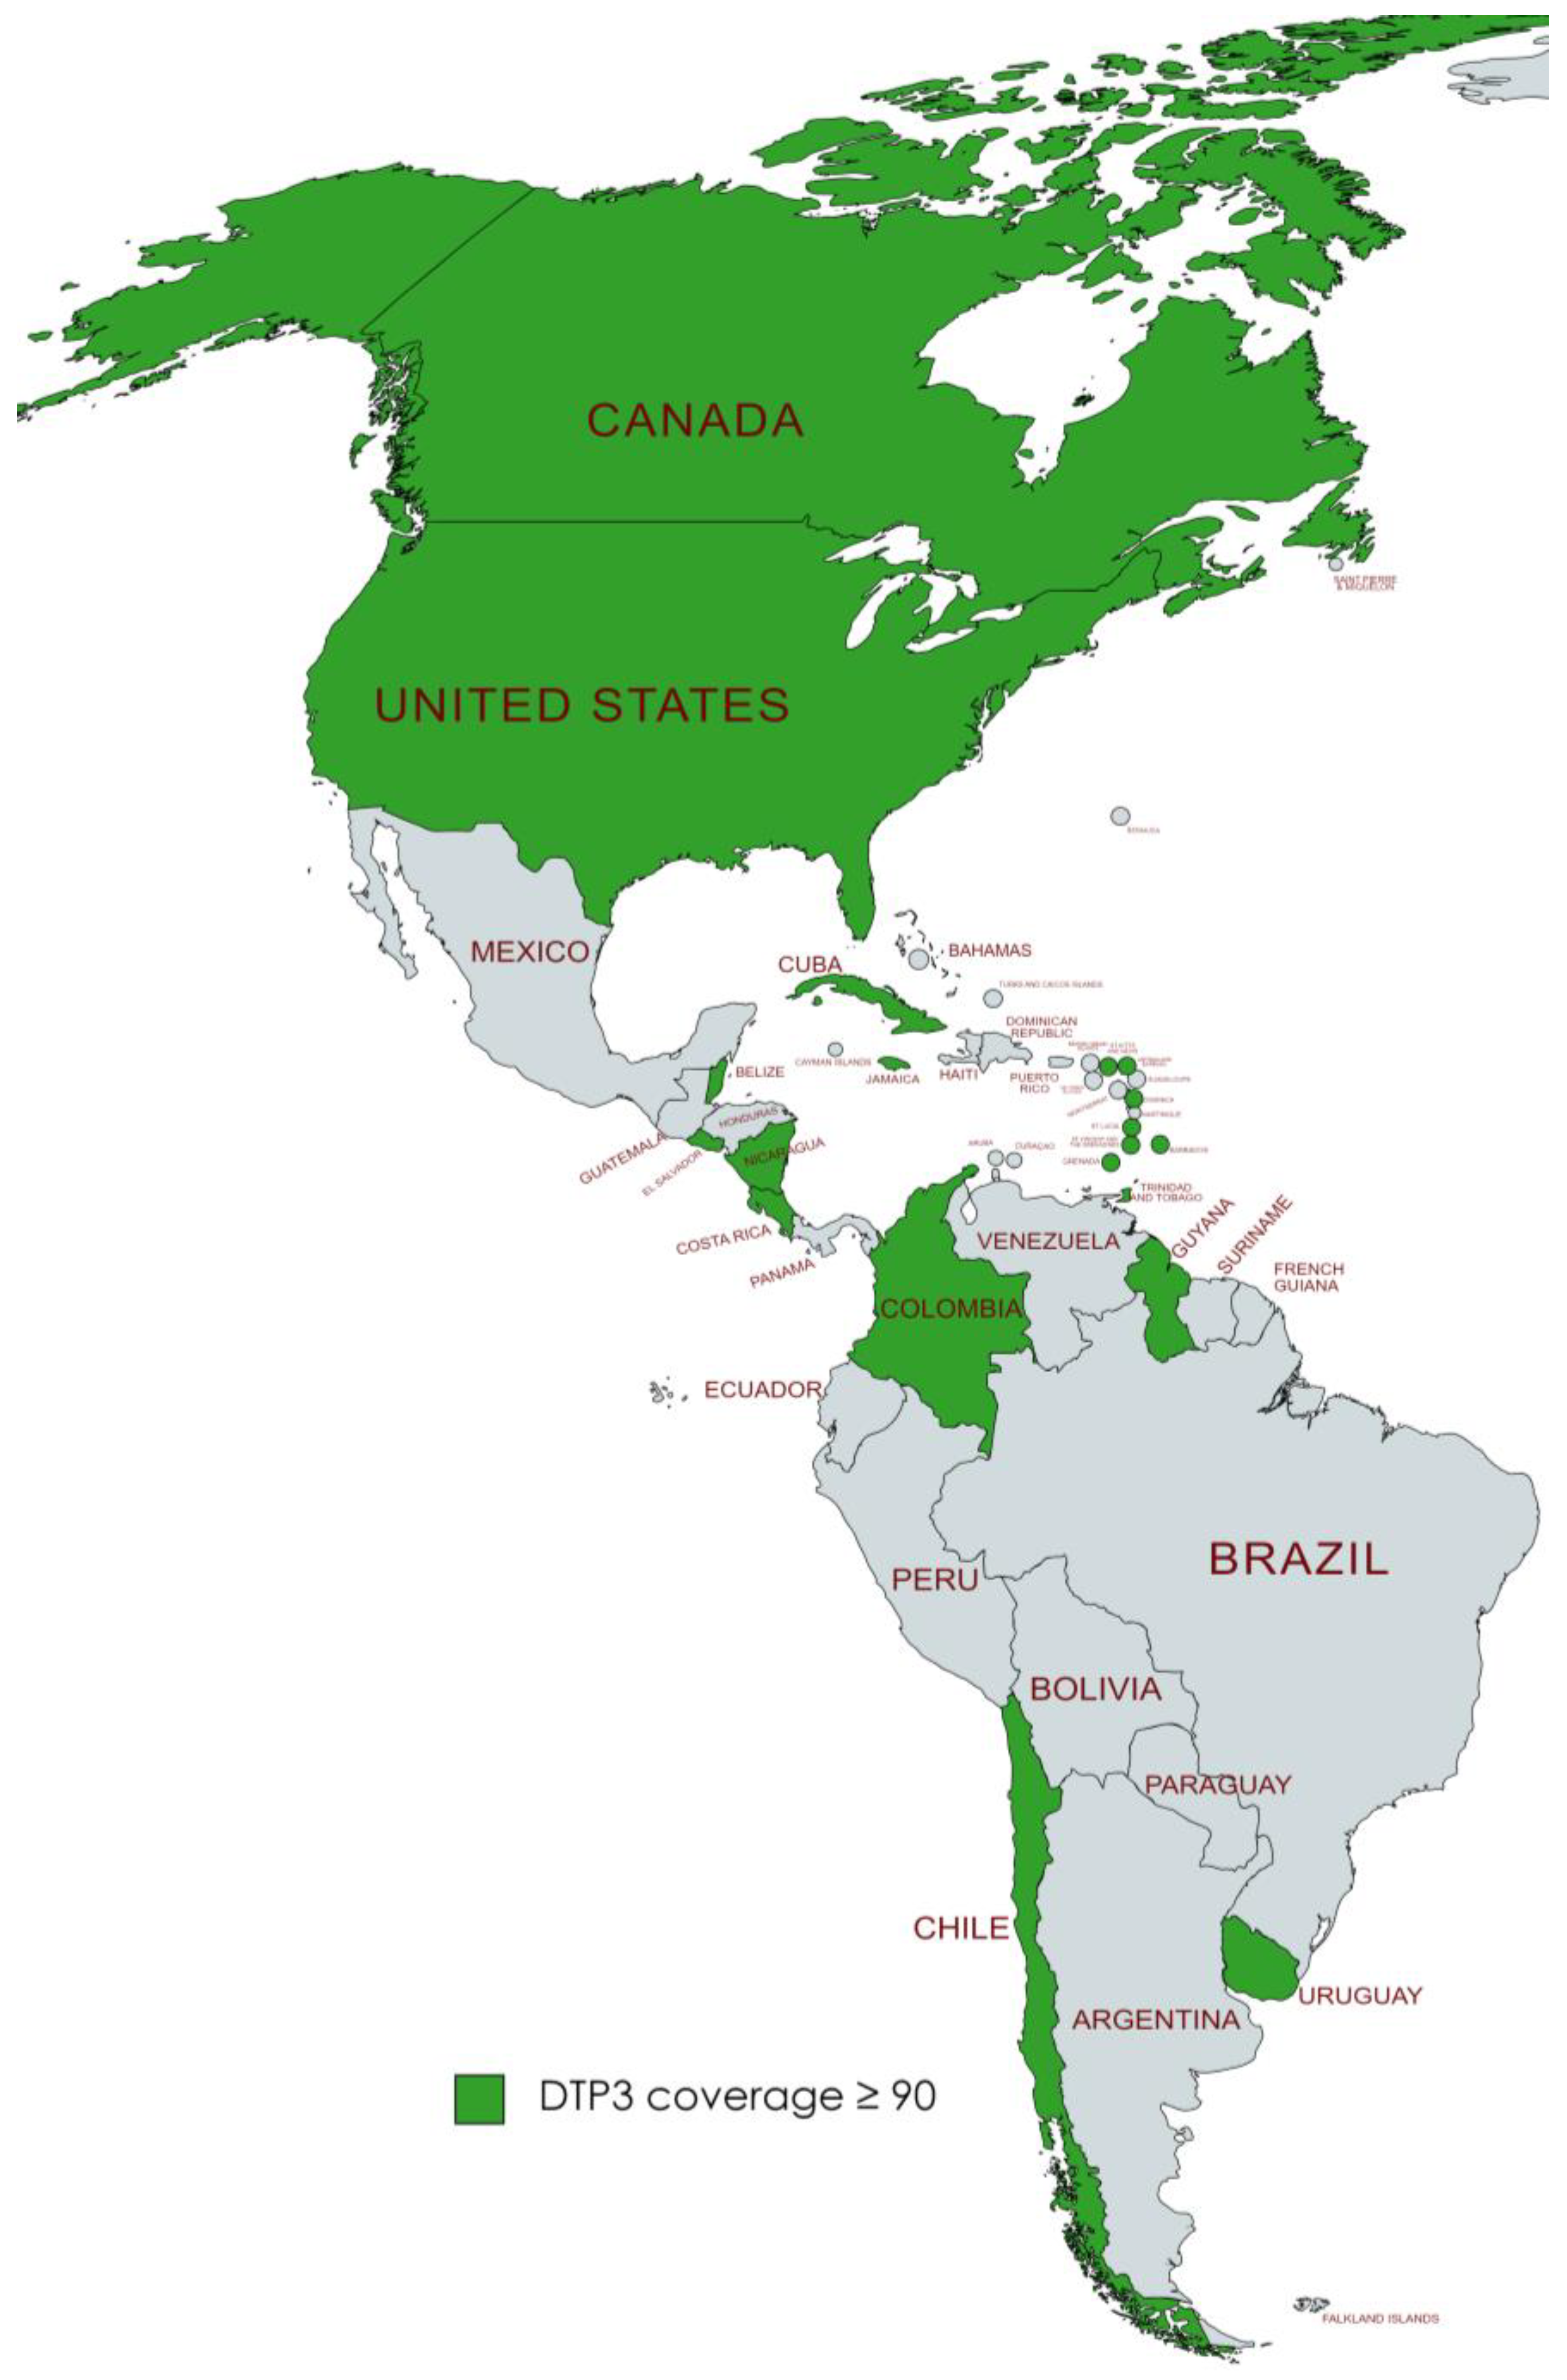
Figure 12.
American Countries Meeting the WHO 90% DTP3 Vaccination Coverage Target in 2022.
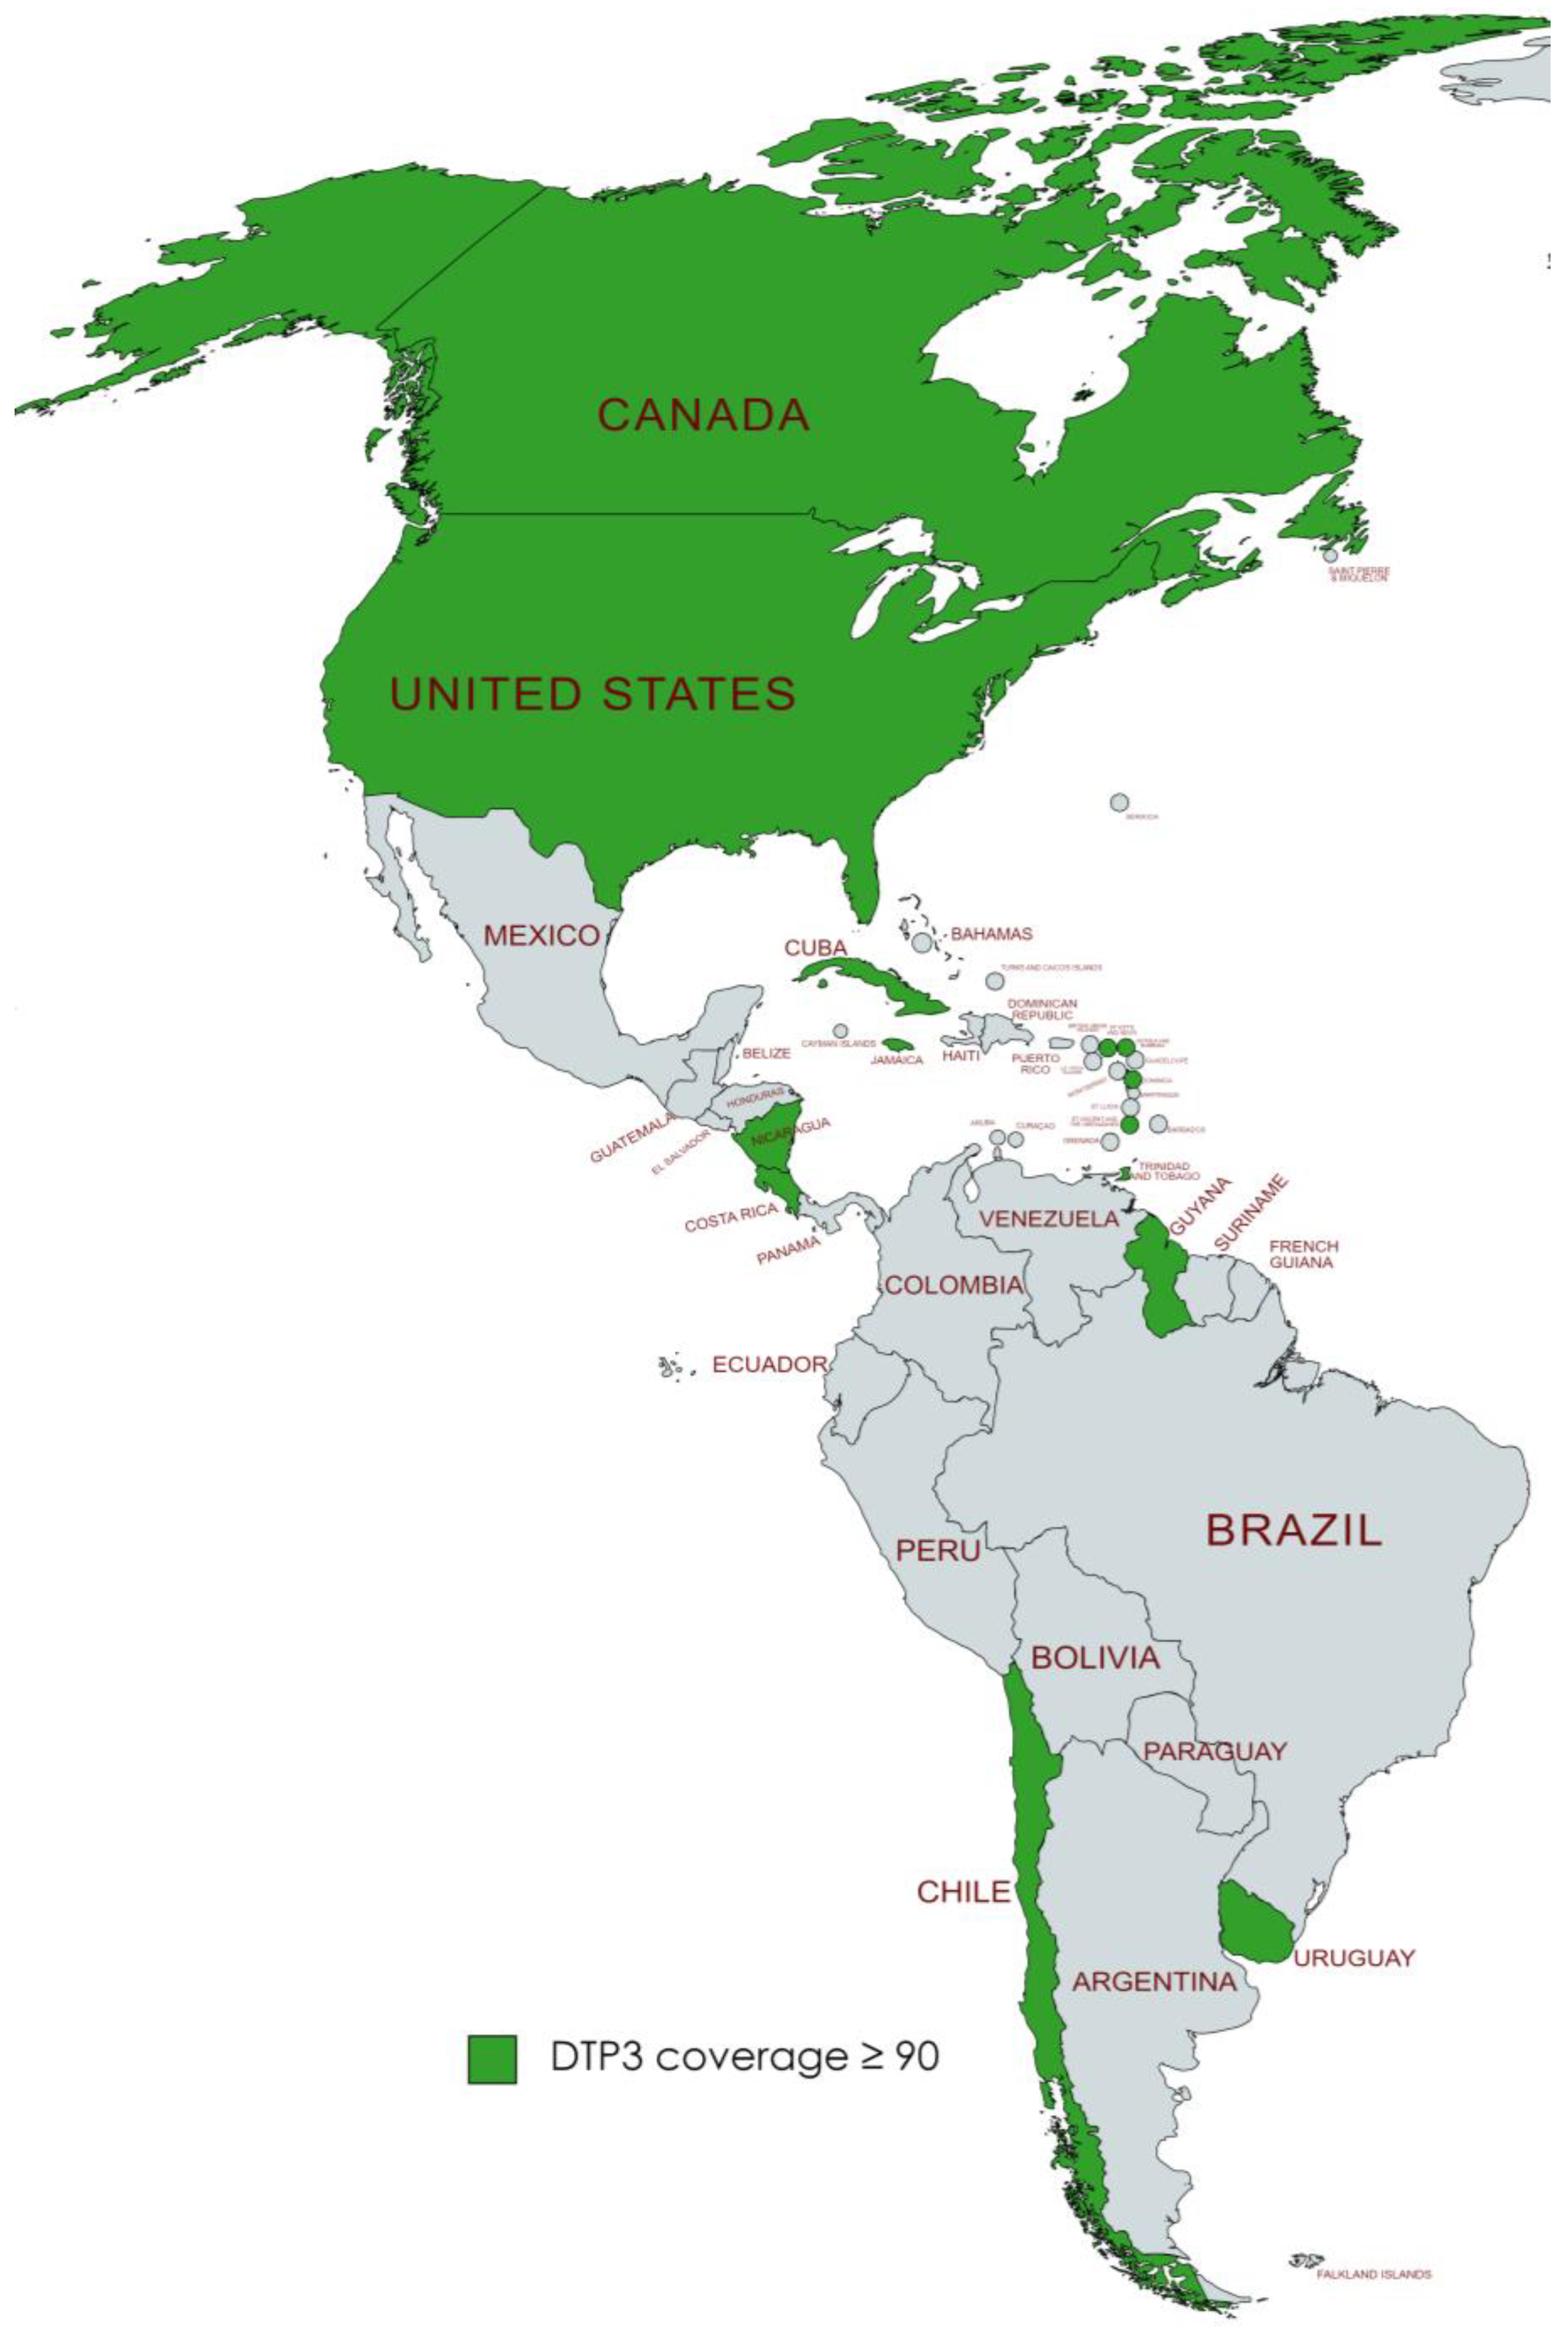
Figure 13.
Third DTP dose coverage (2012-20) indicating joinpoints in Antigua and Barbuda.
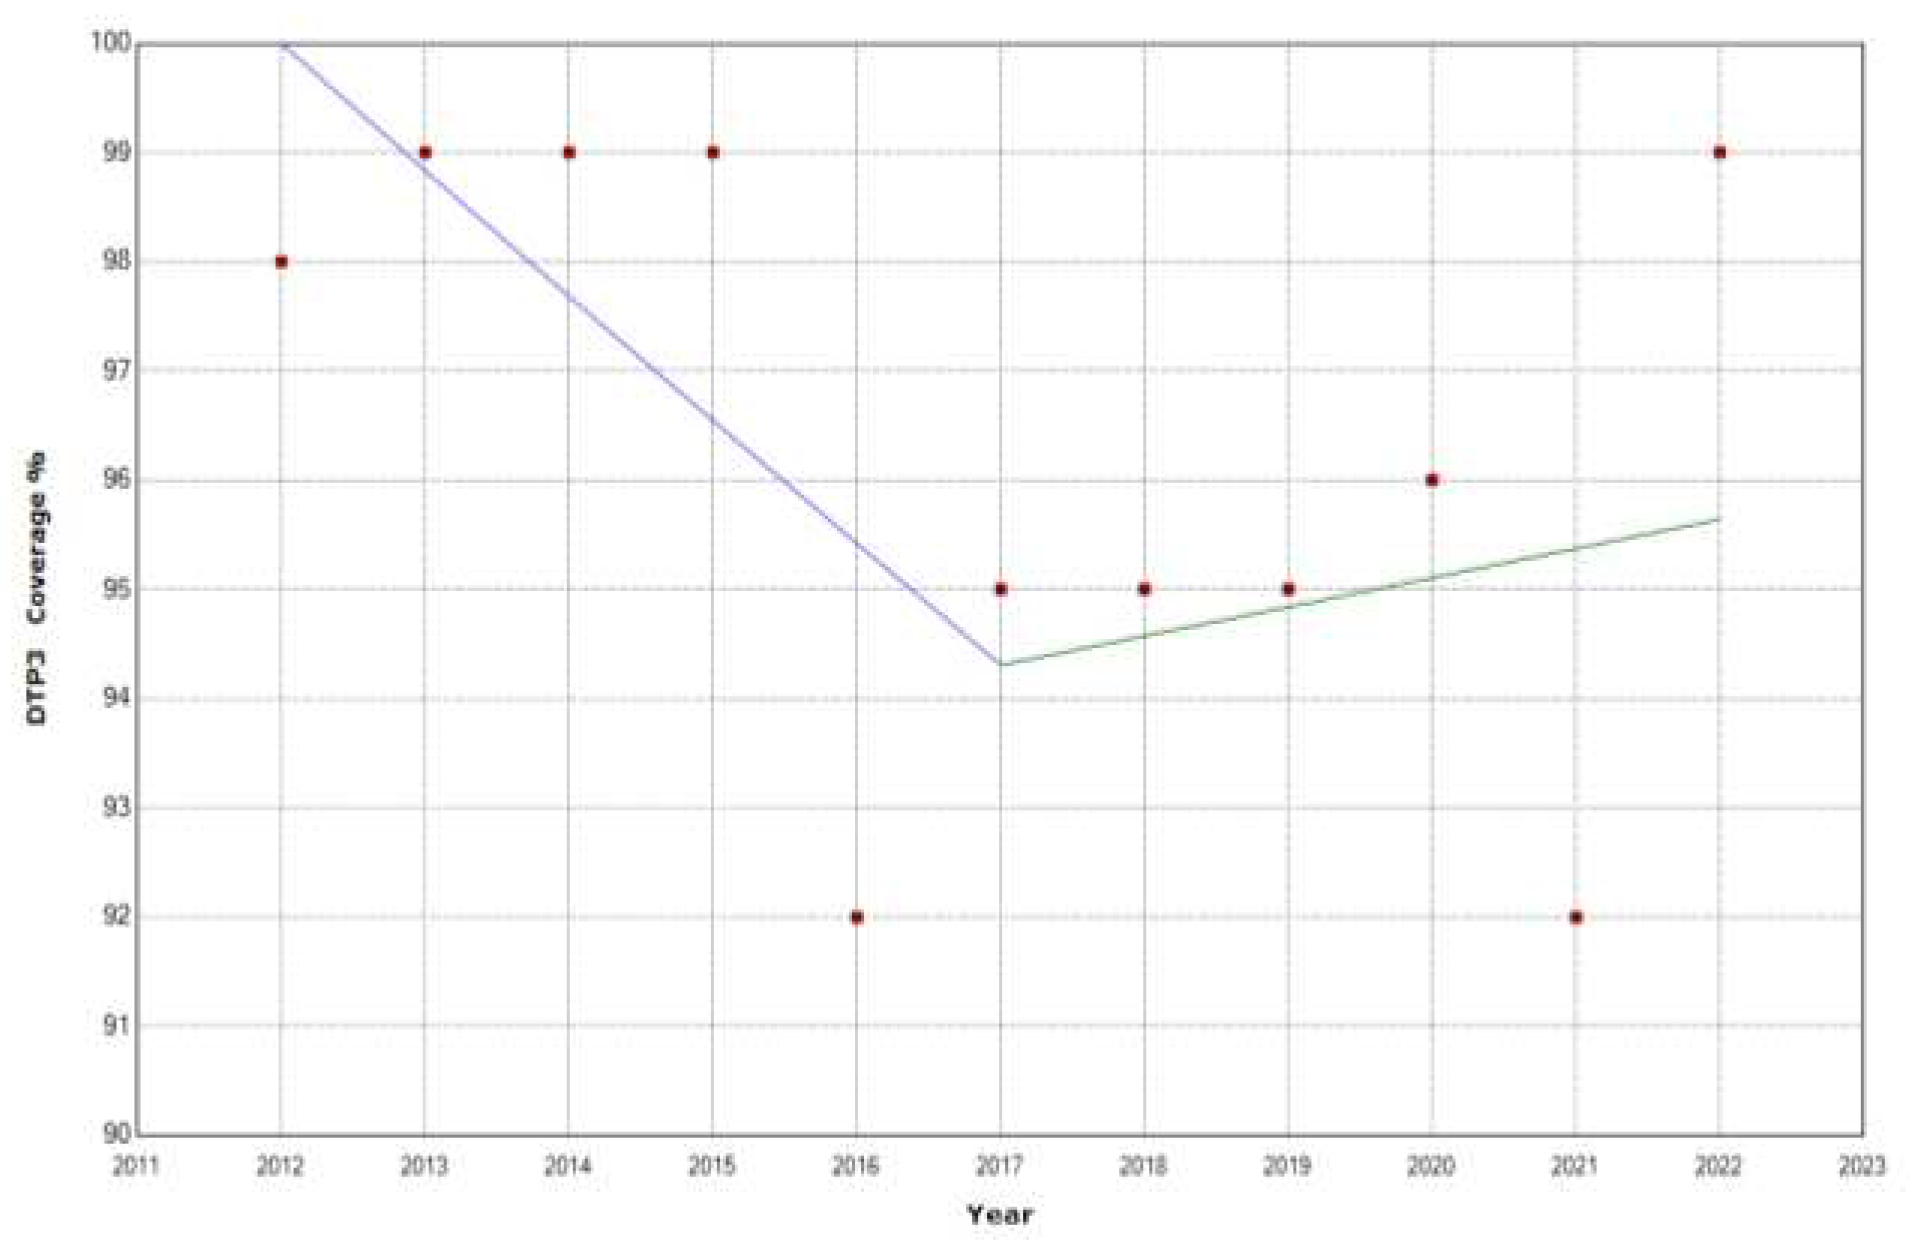
Figure 14.
Third DTP dose coverage (2012-20) indicating joinpoints in the Bahamas.
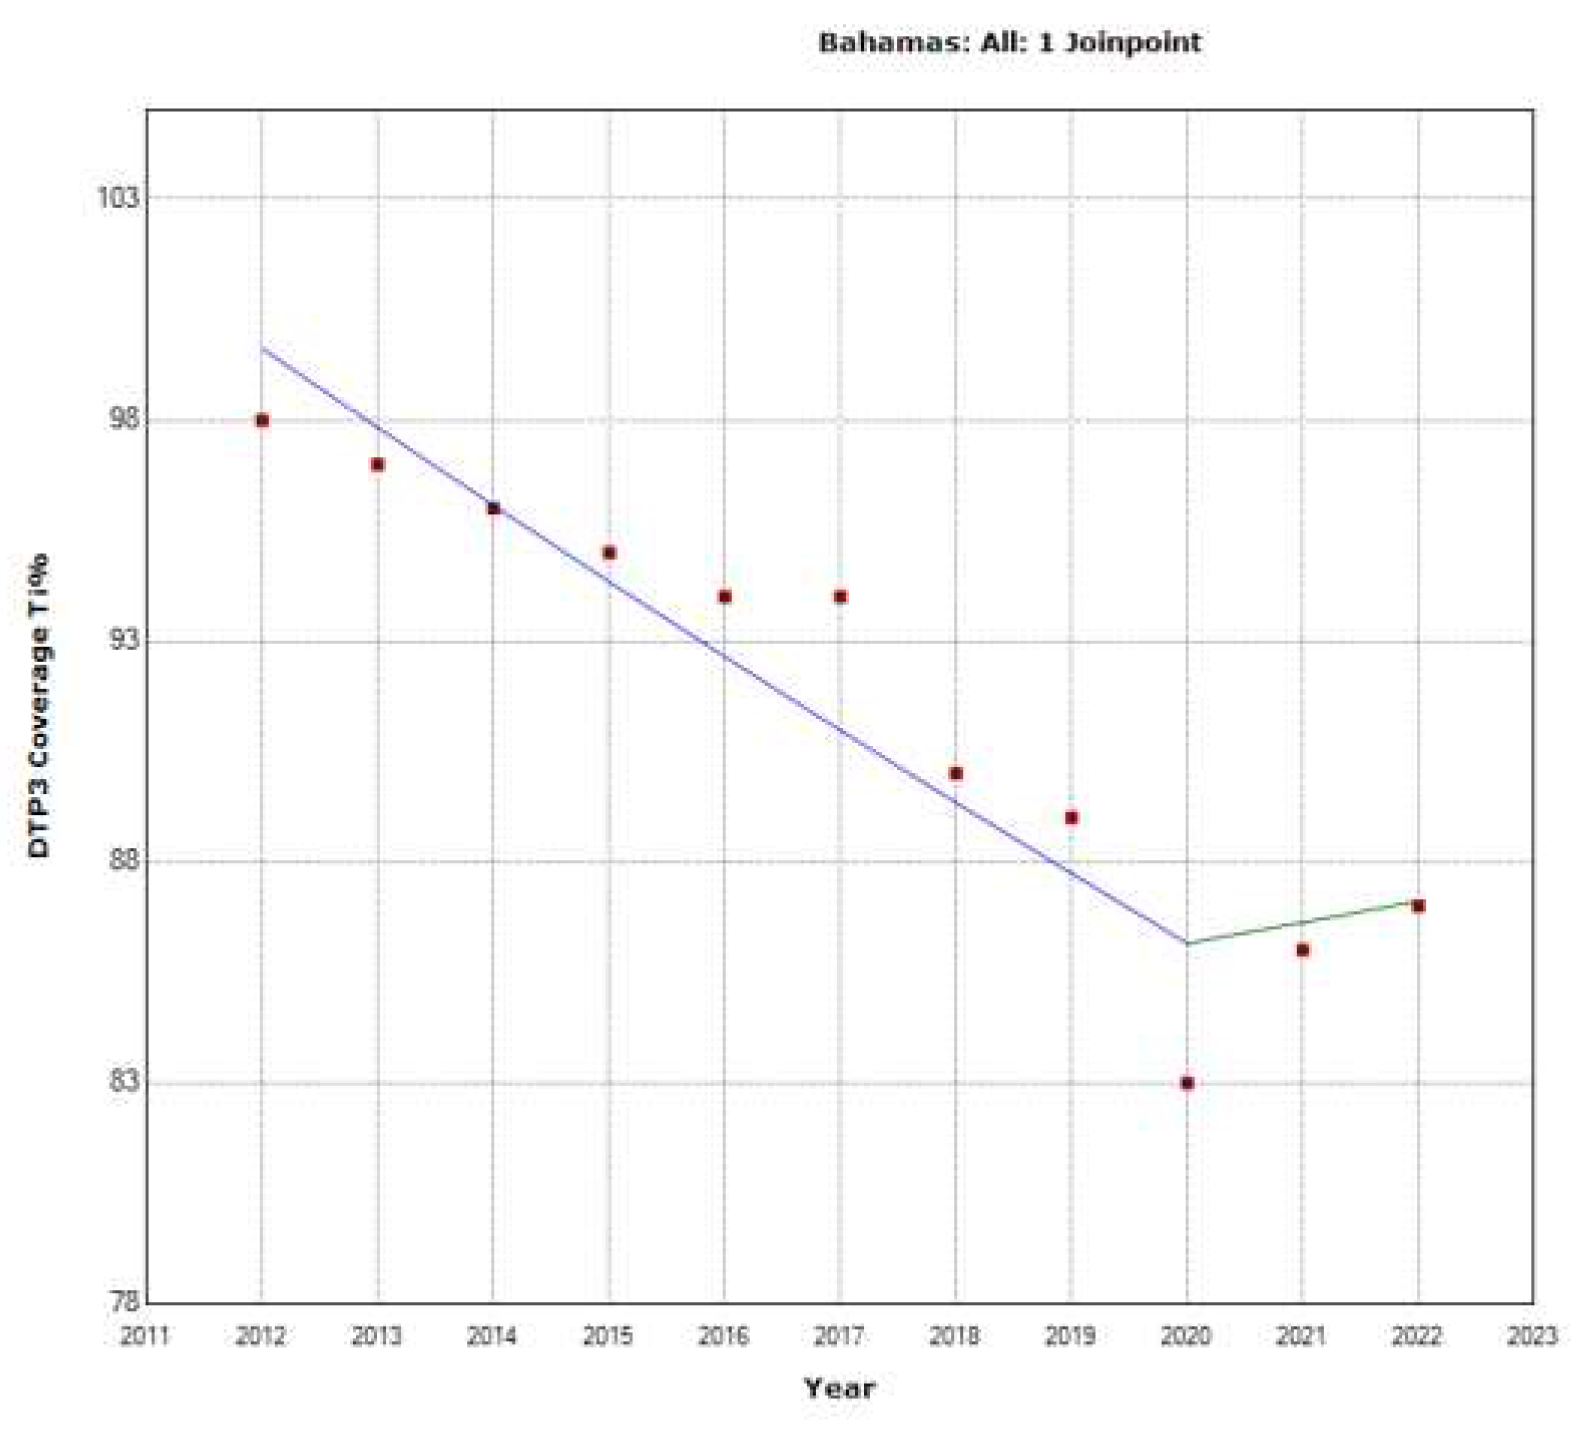
Figure 15.
Third DTP dose coverage (2012-20) indicating joinpoints in Belize.
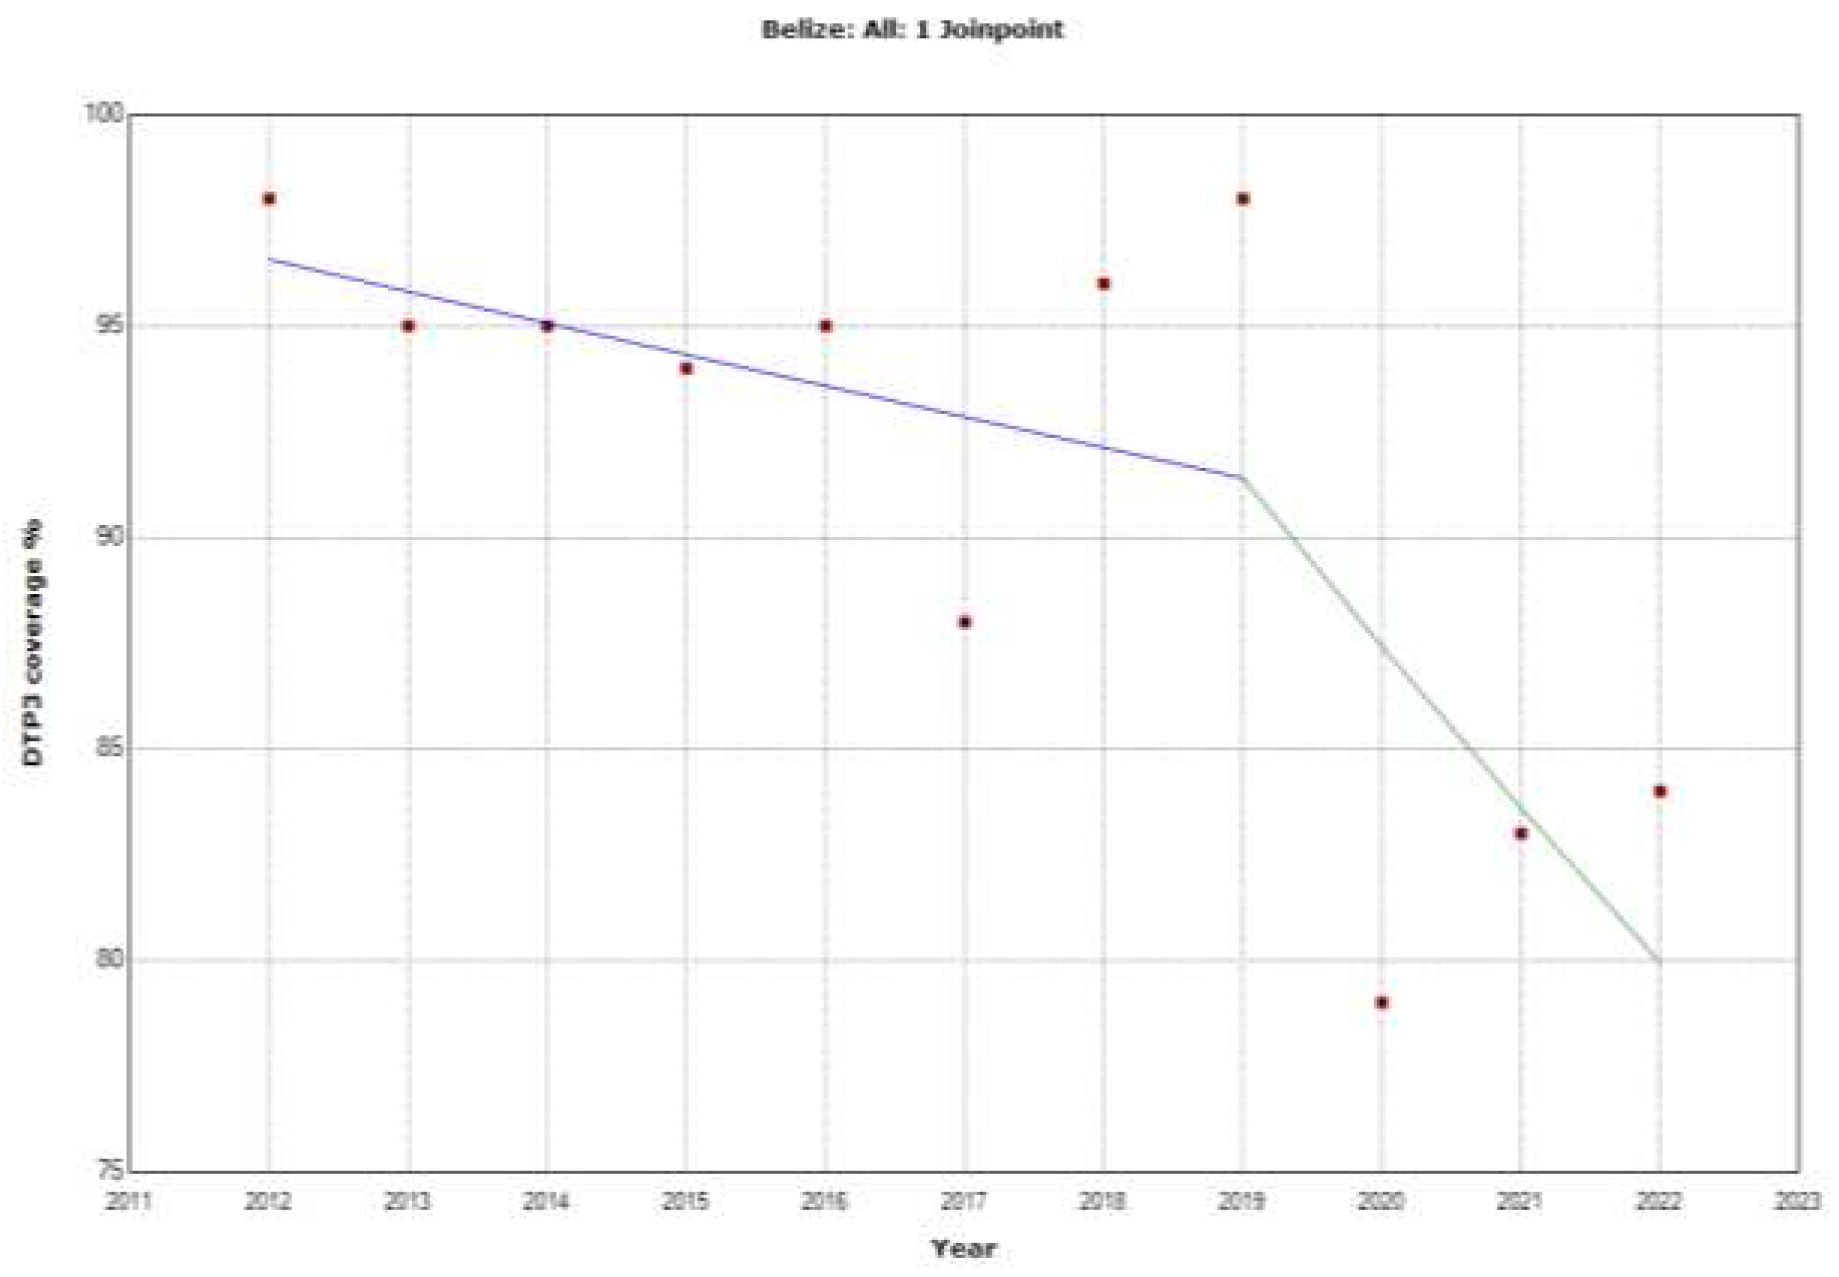
Figure 16.
Third, DTP dose coverage (2012-20) indicates joinpoints in Canada.
Figure 17.
Third DTP dose coverage (2012-20) indicating joinpoints in Colombia.
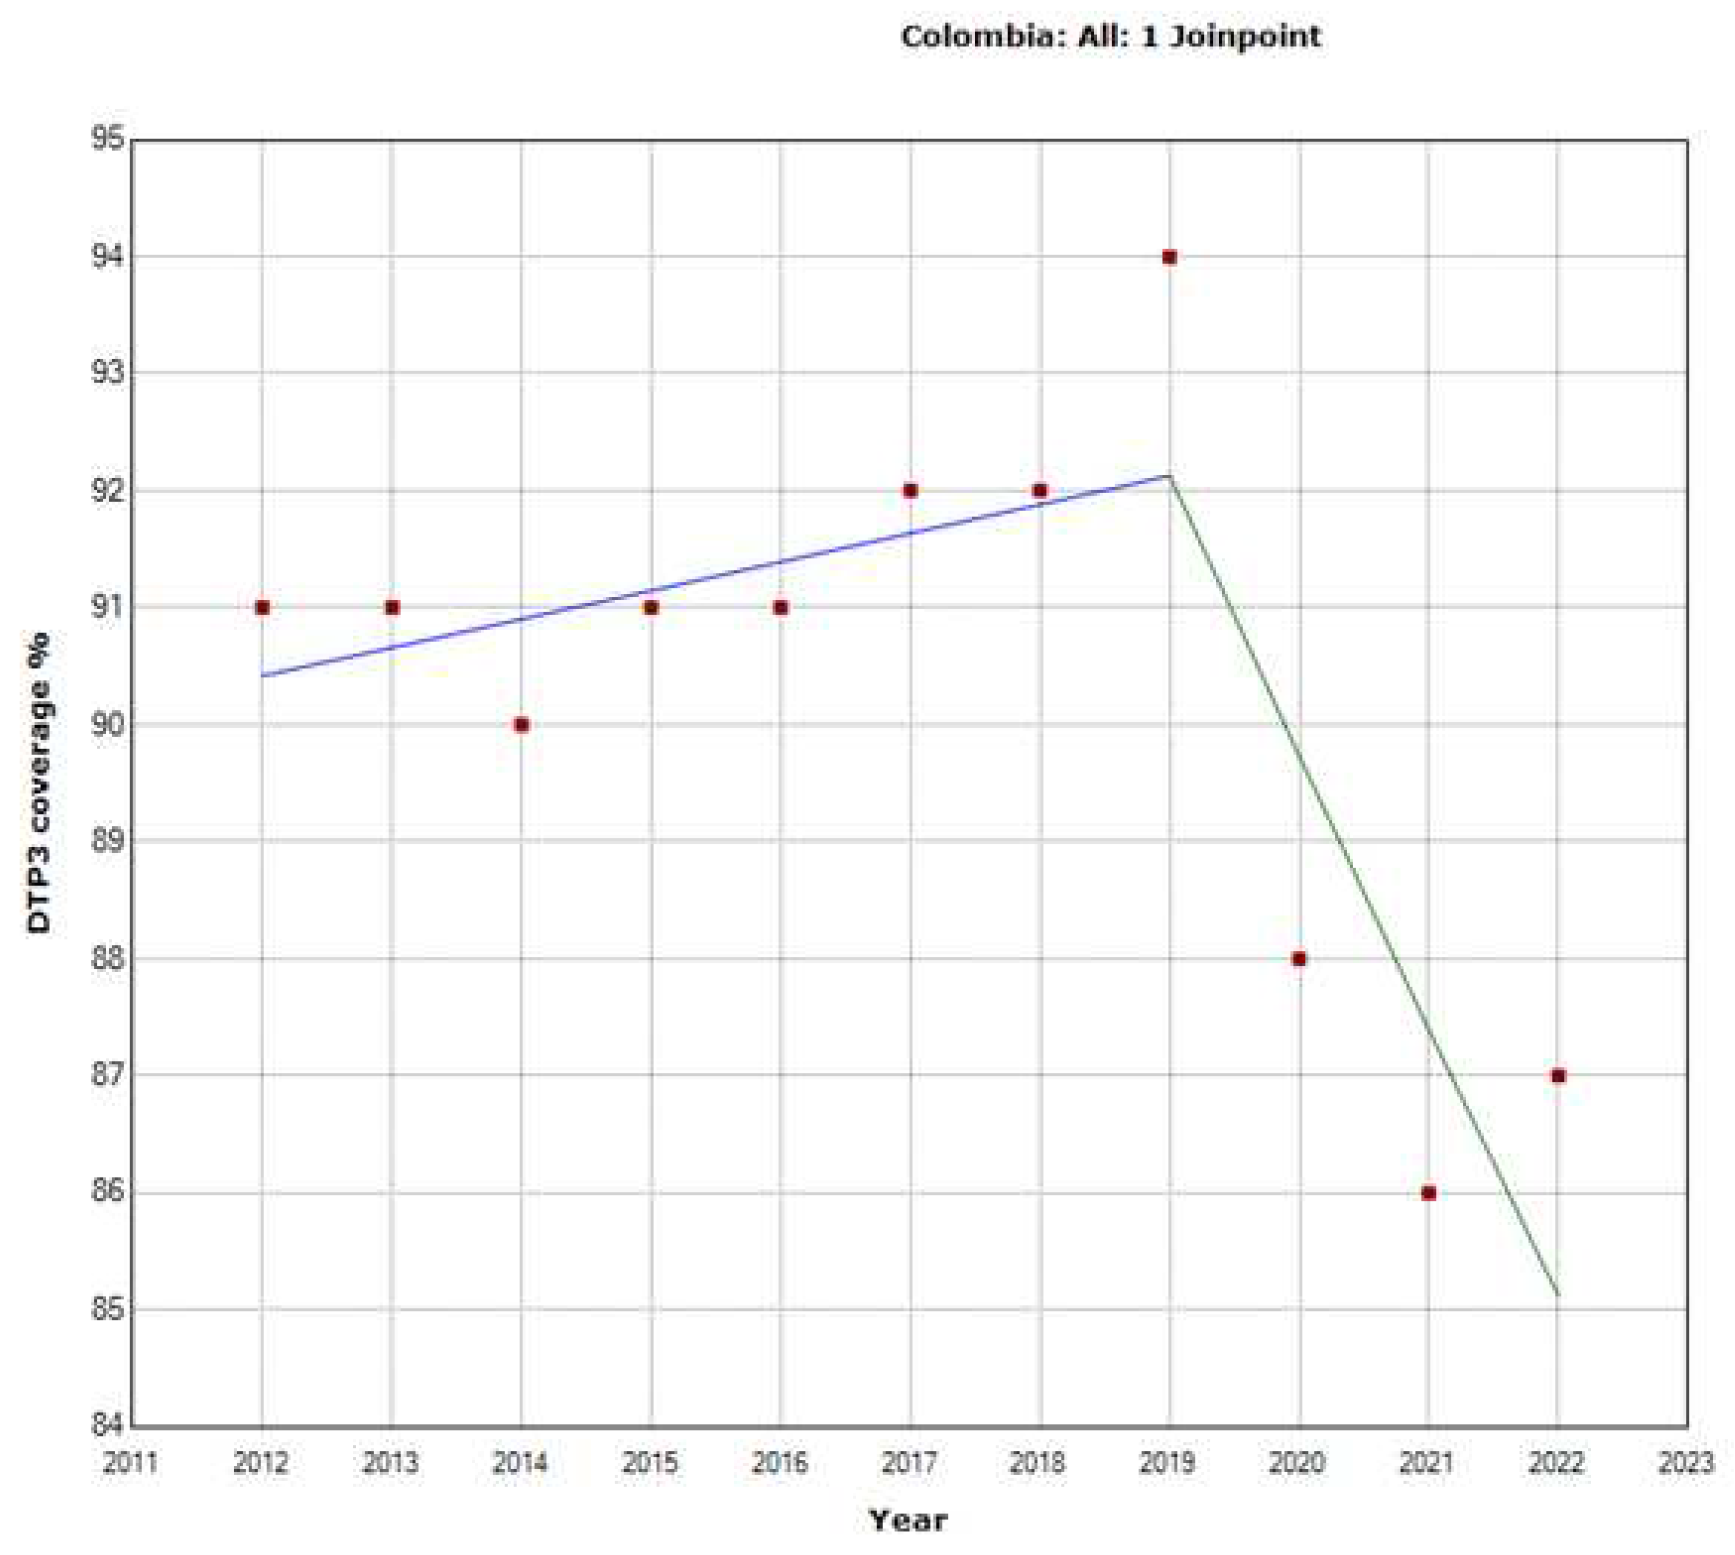
Figure 18.
Third DTP dose coverage (2012-20) indicating joinpoints in Costa Rica.
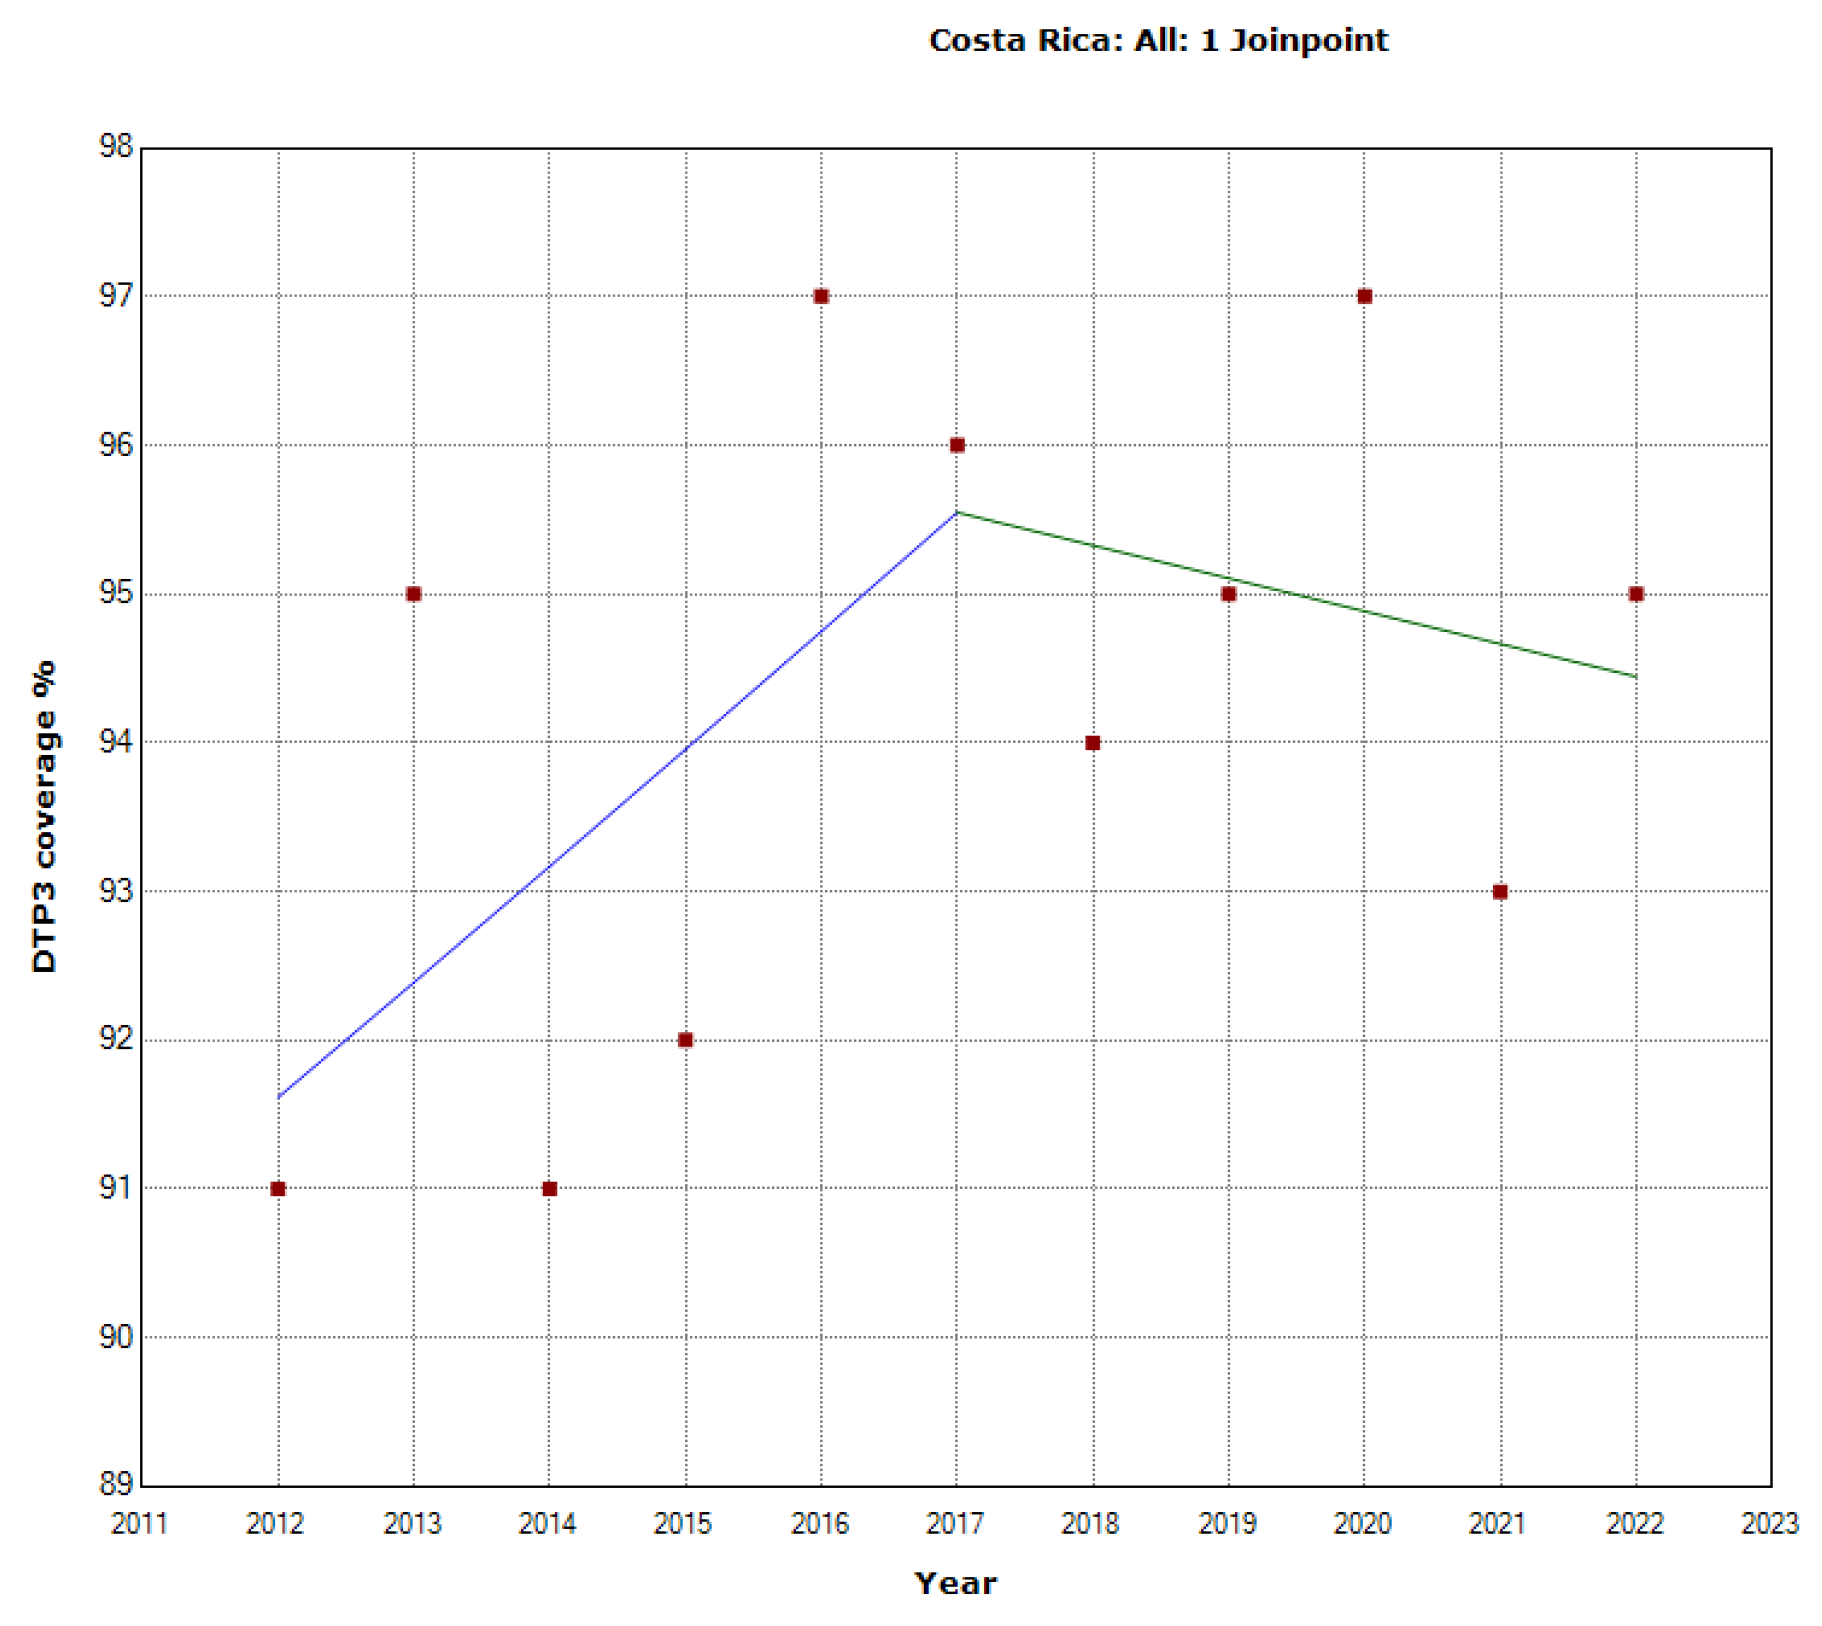
Figure 19.
Third DTP dose coverage (2012-20) indicating joinpoints, Dominica.
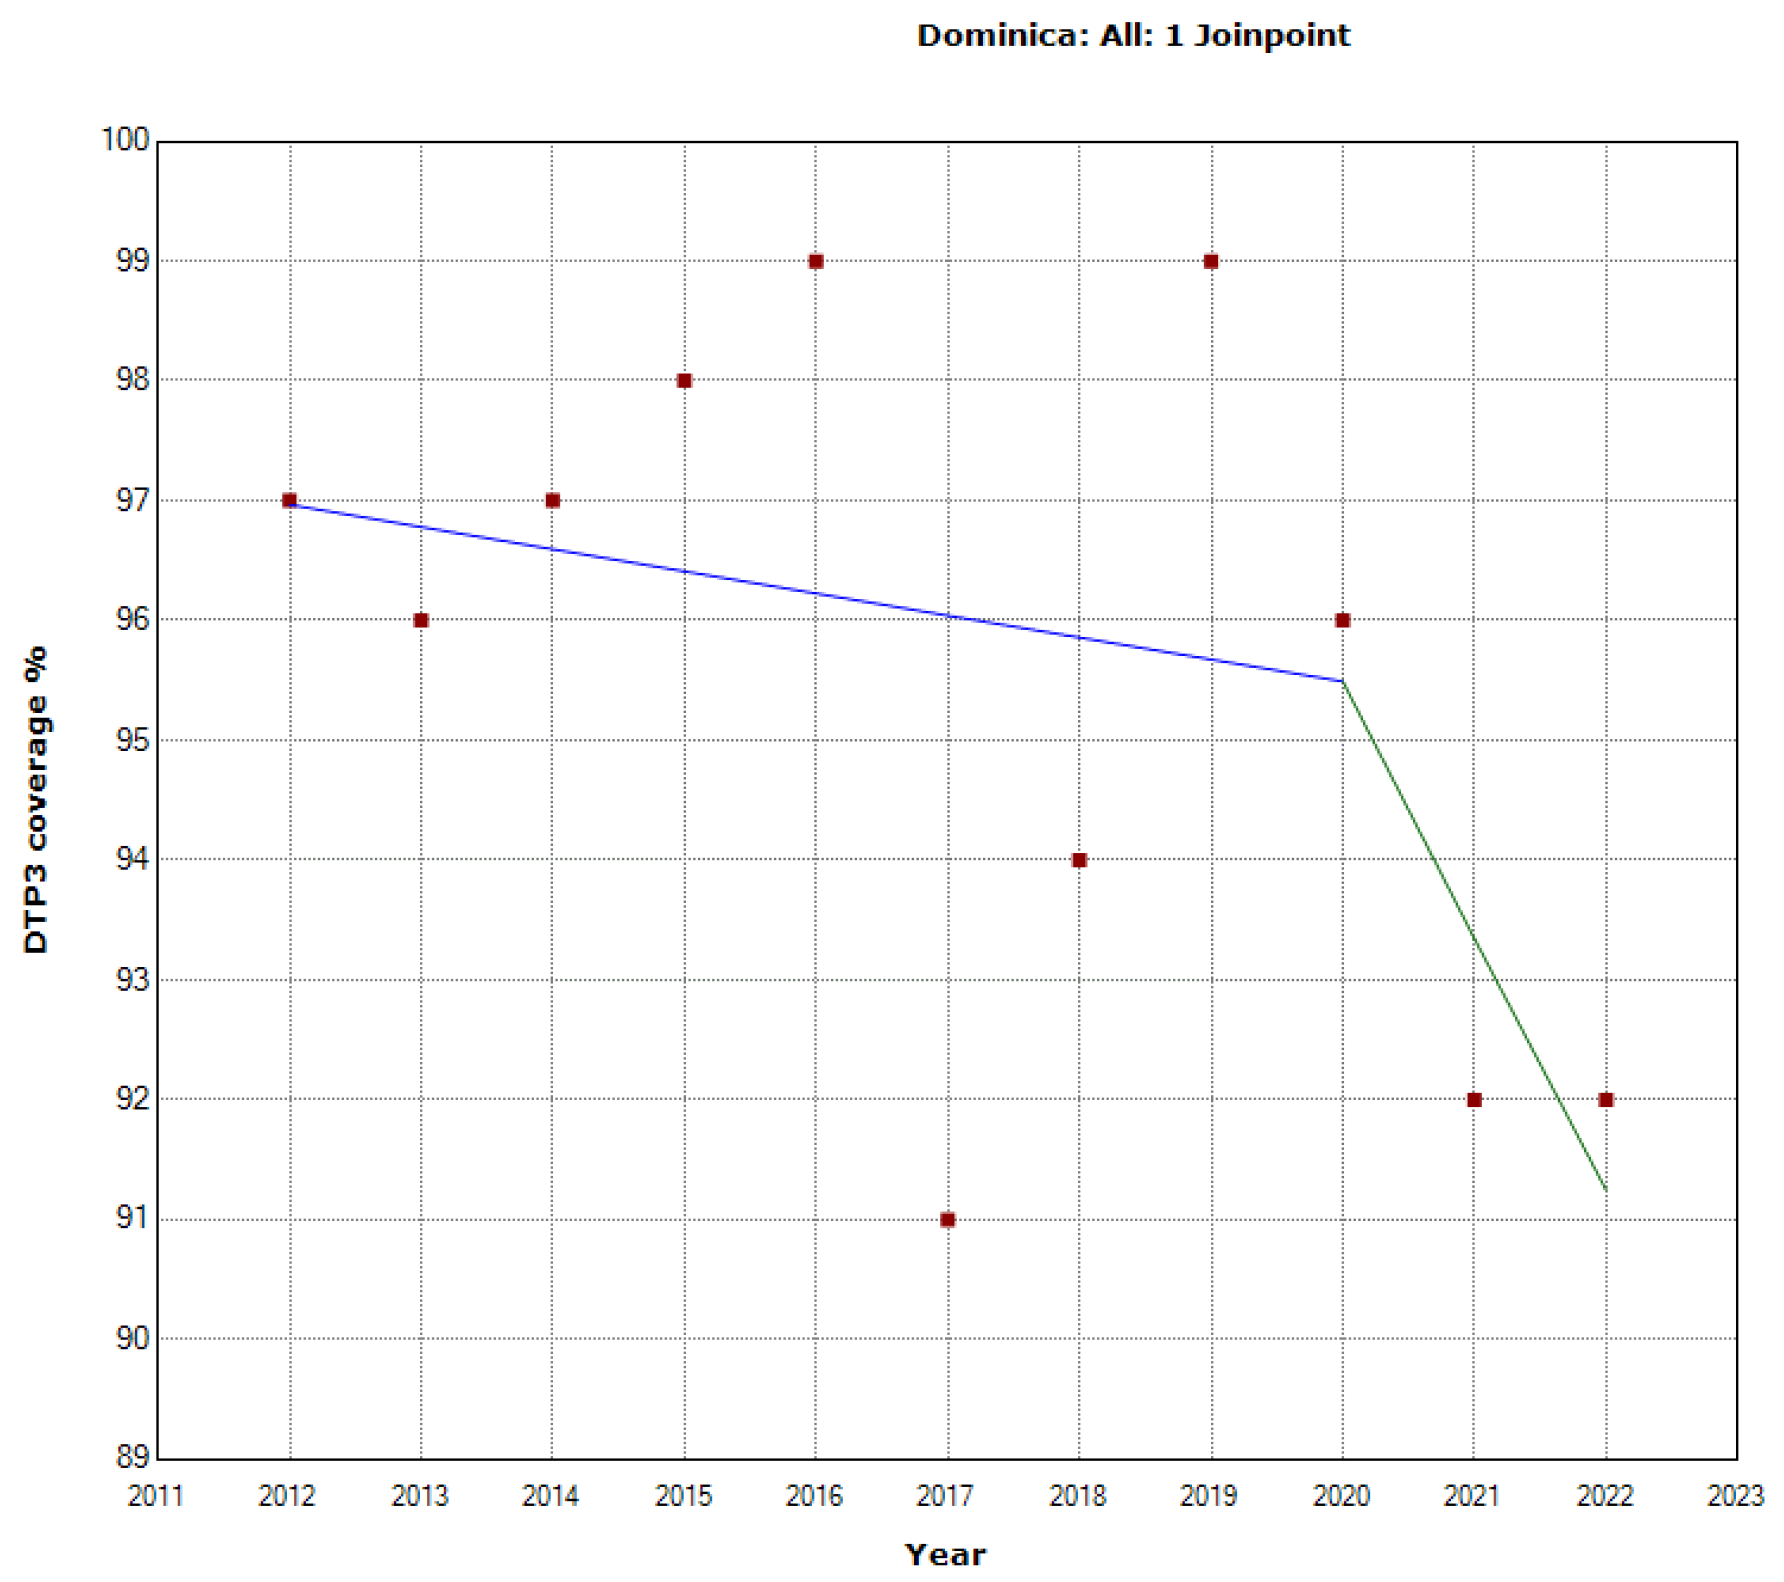
Figure 20.
Third DTP dose coverage (2012-20) indicating joinpoints in Ecuador.
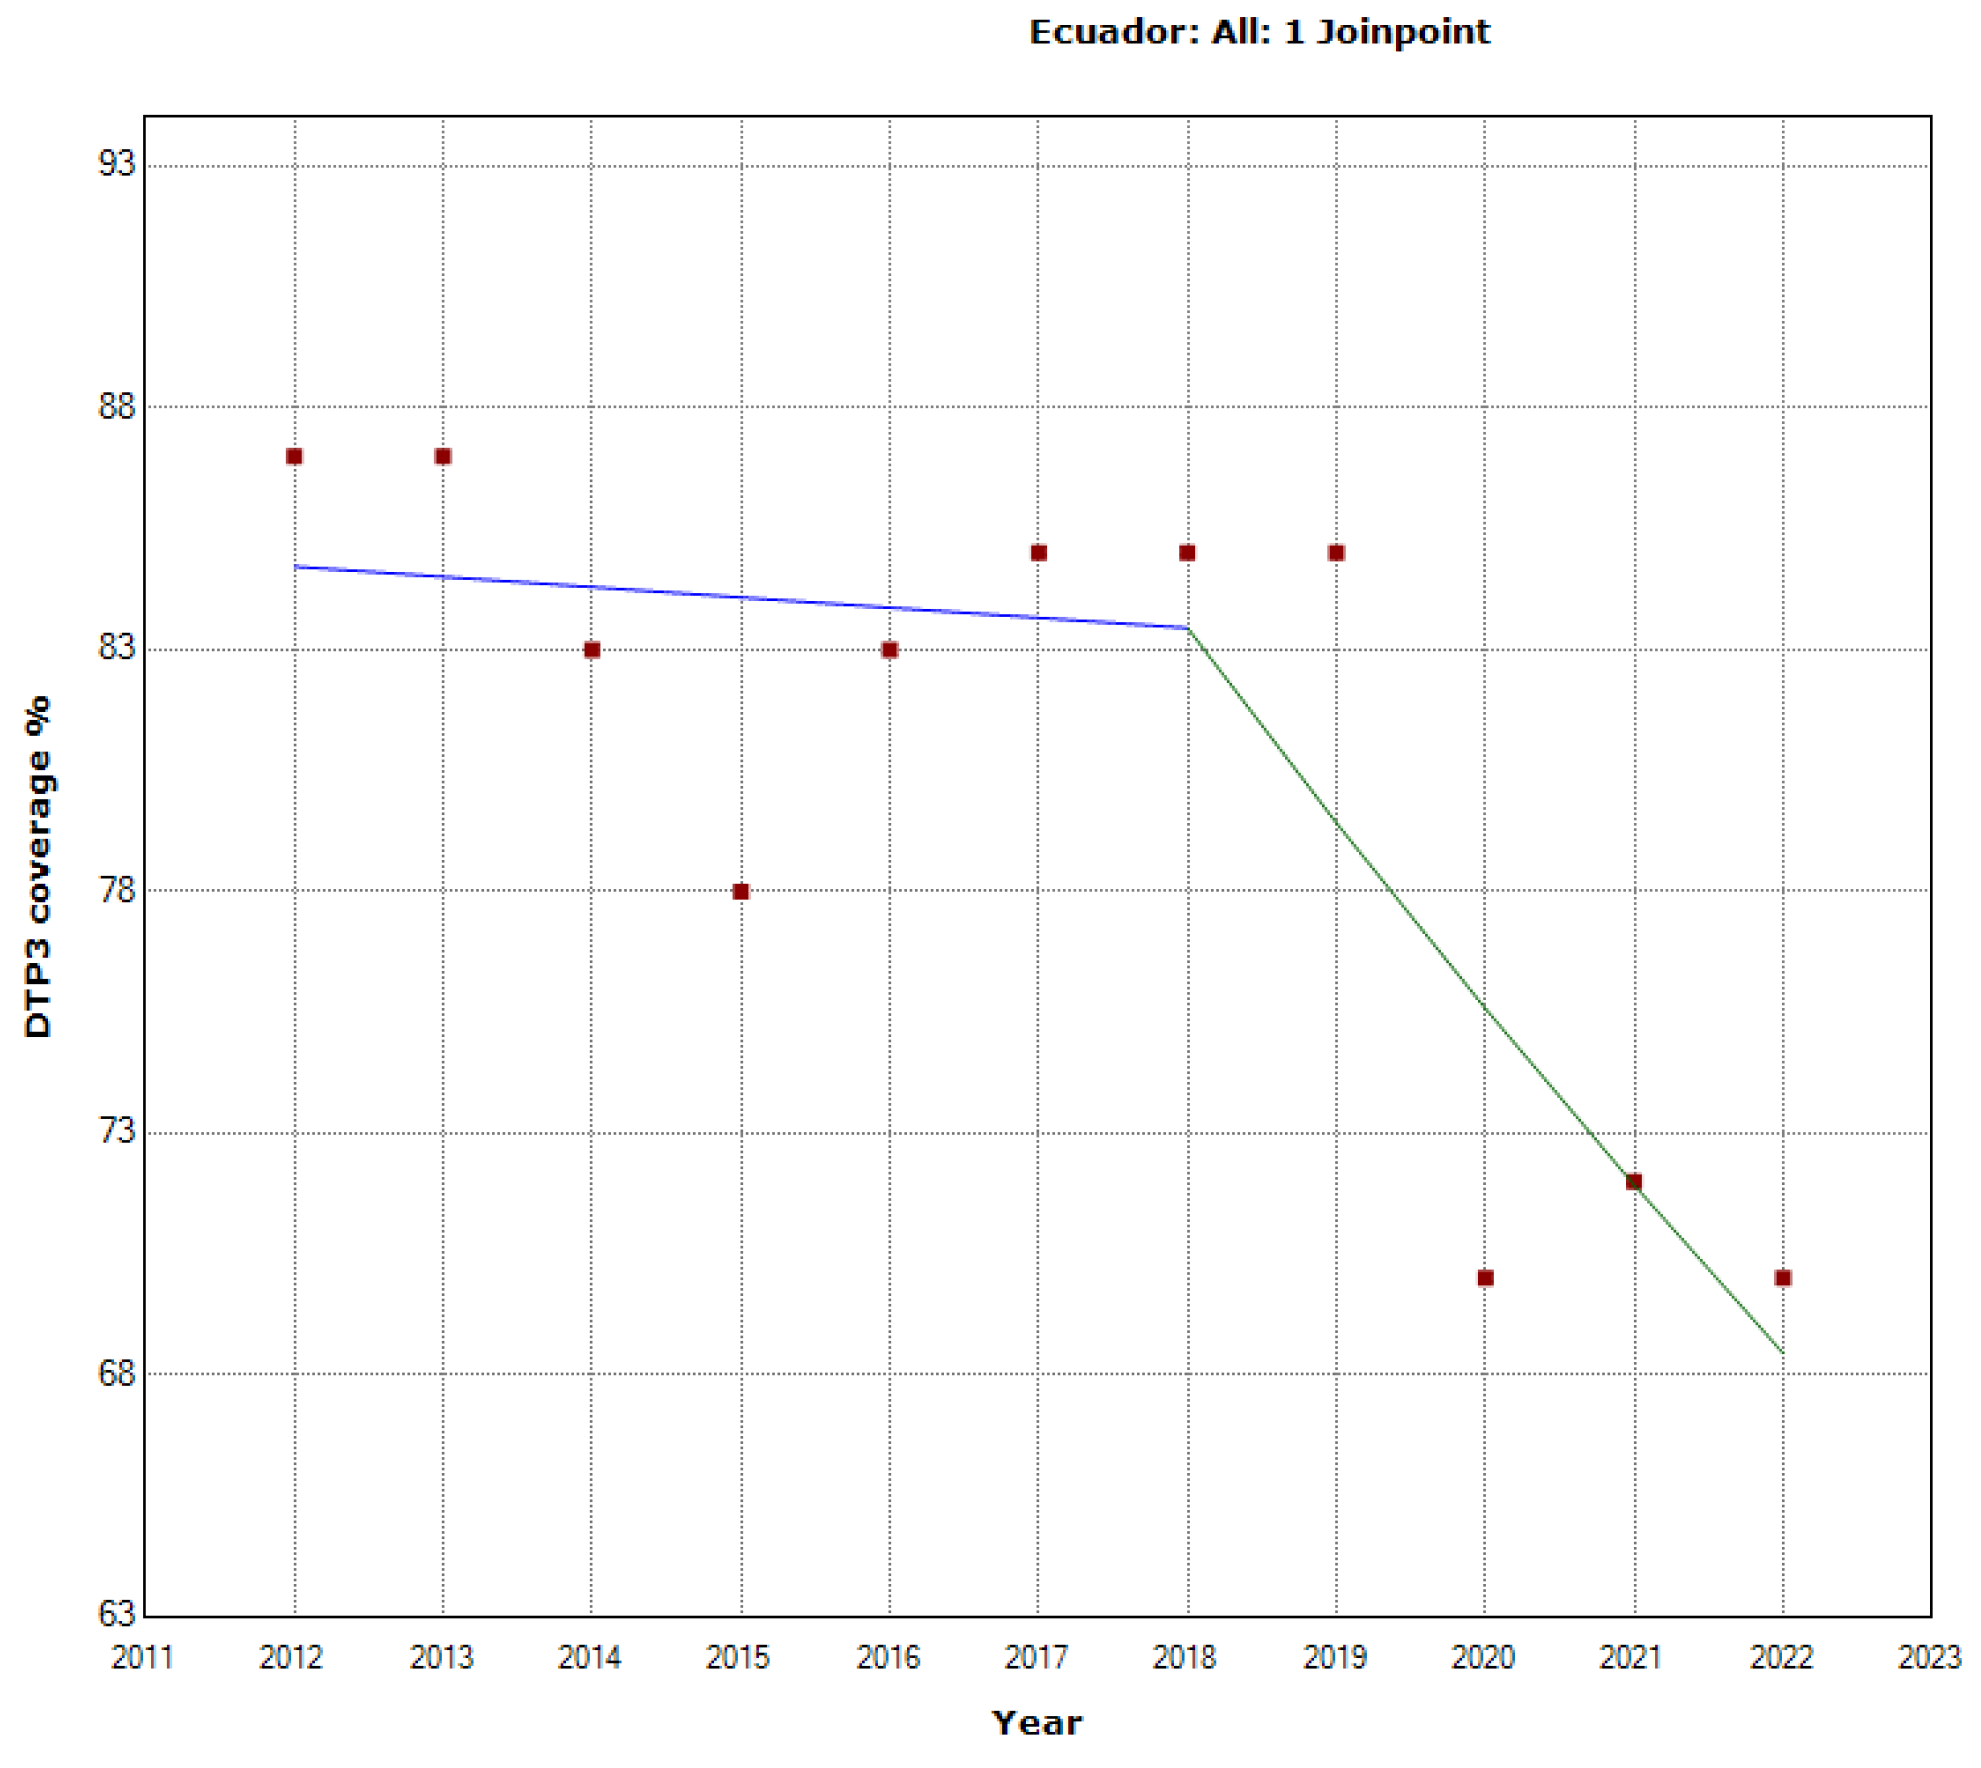
Figure 21.
Third DTP dose coverage (2012-20) indicating joinpoints in Grenada.
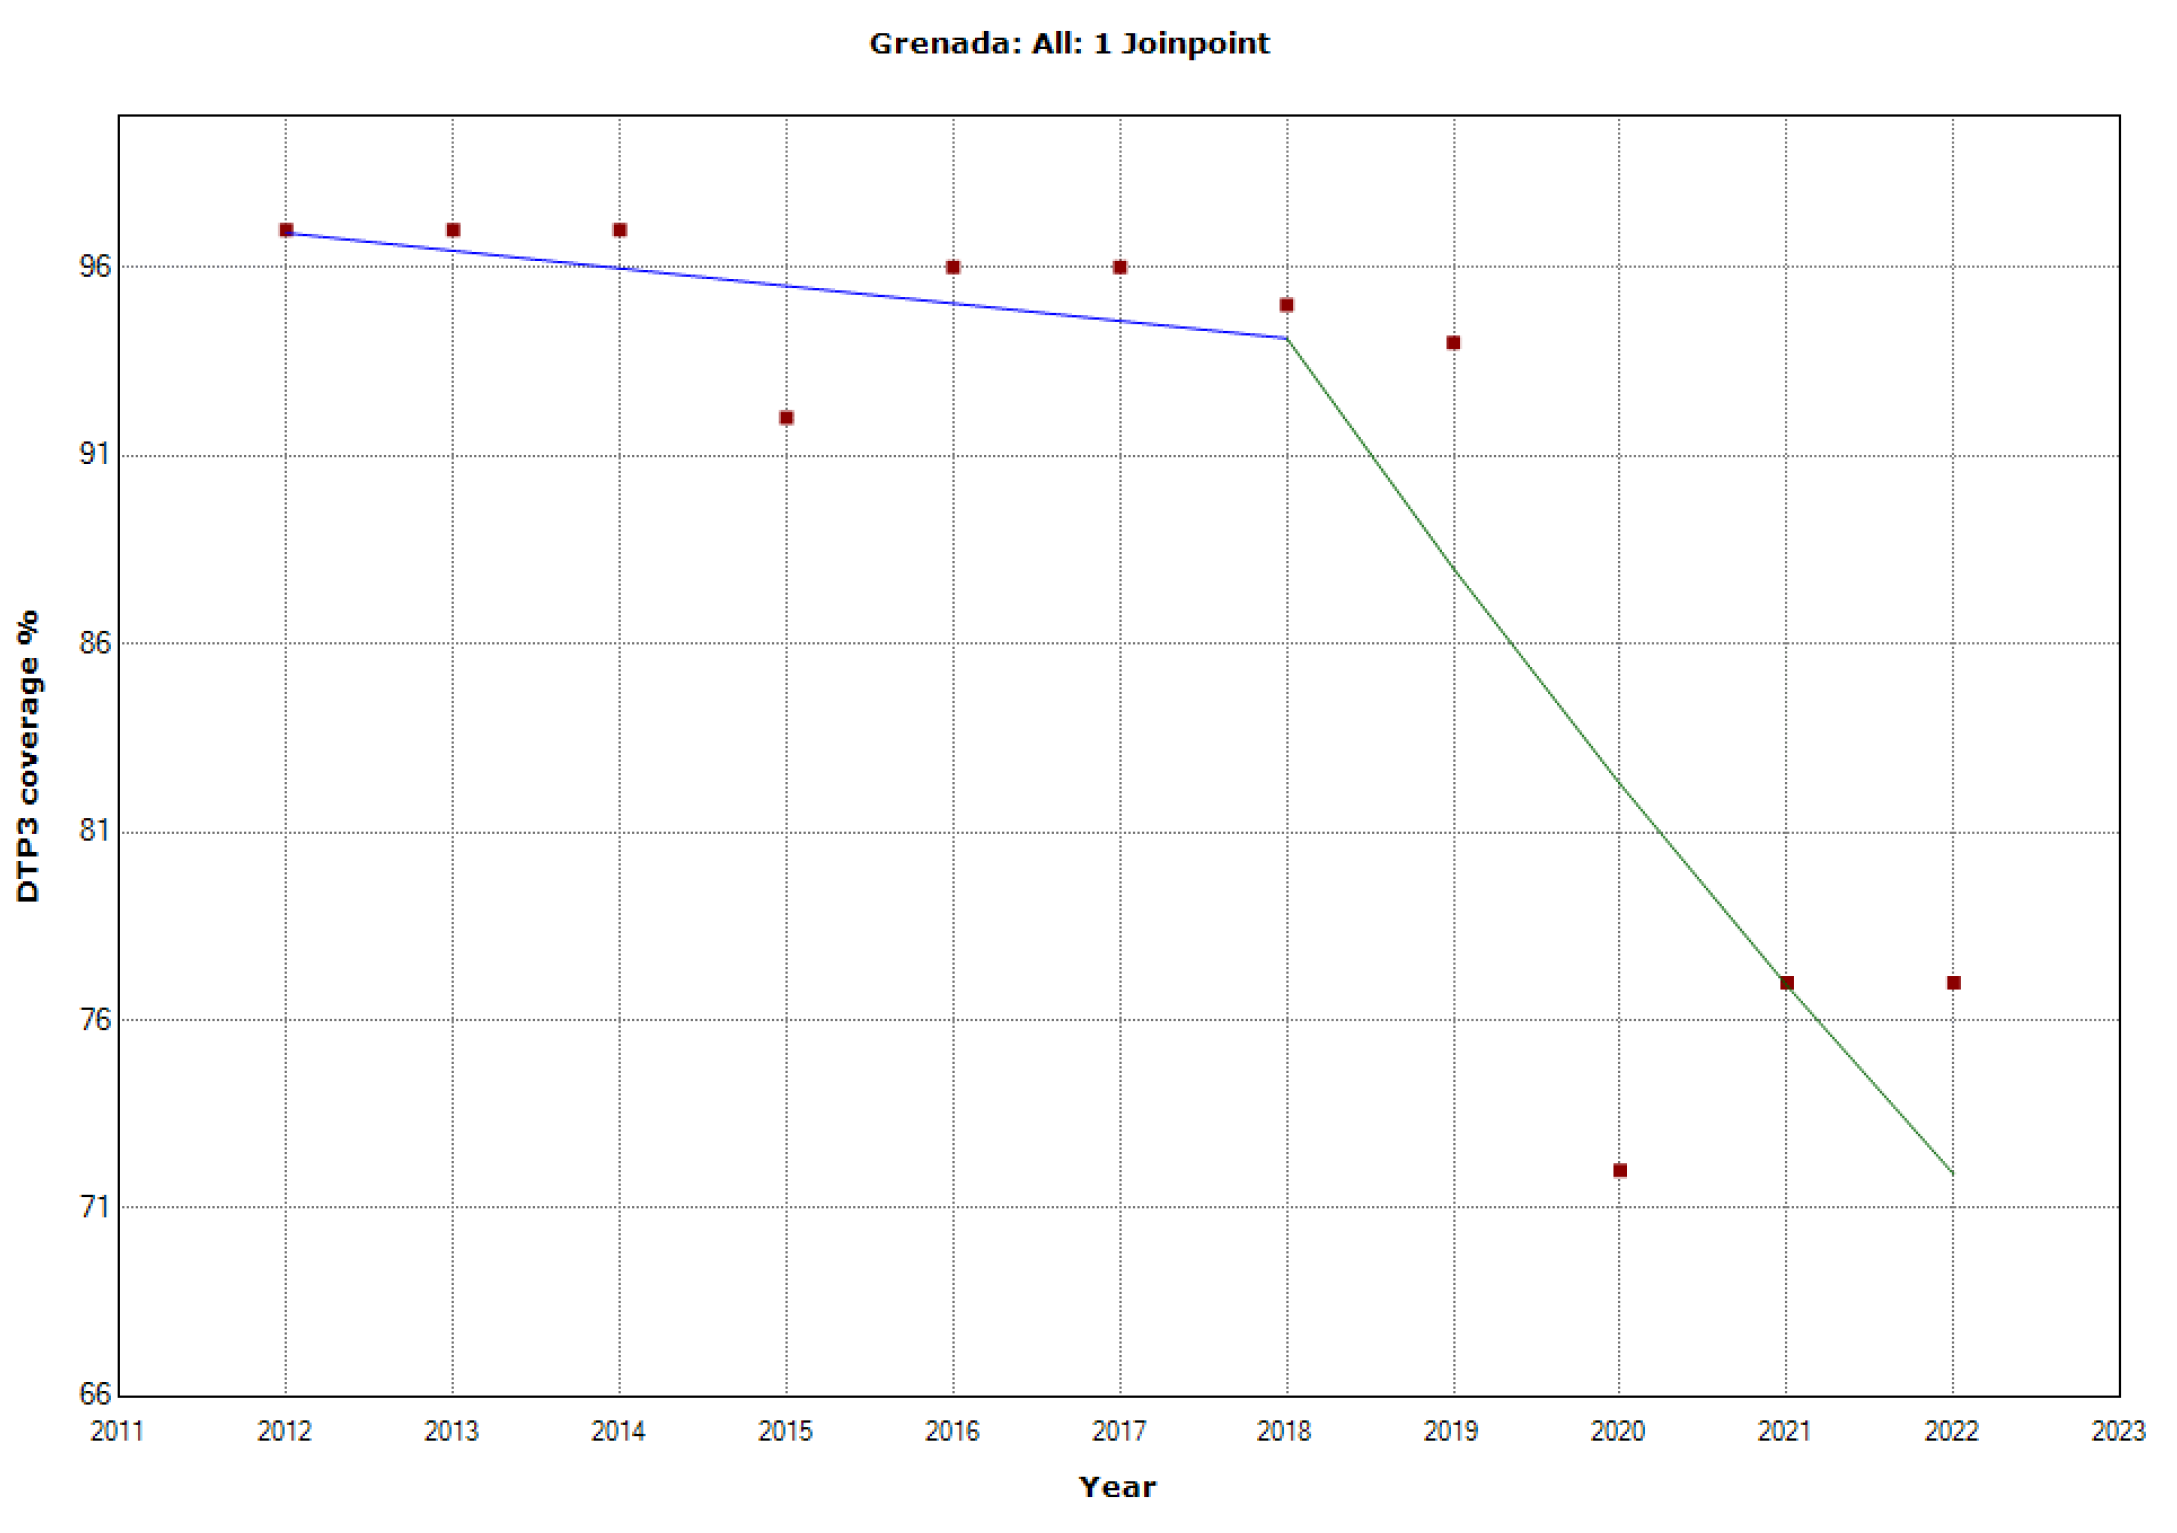
Figure 22.
Third DTP dose coverage (2012-20) indicating joinpoints in Haiti.
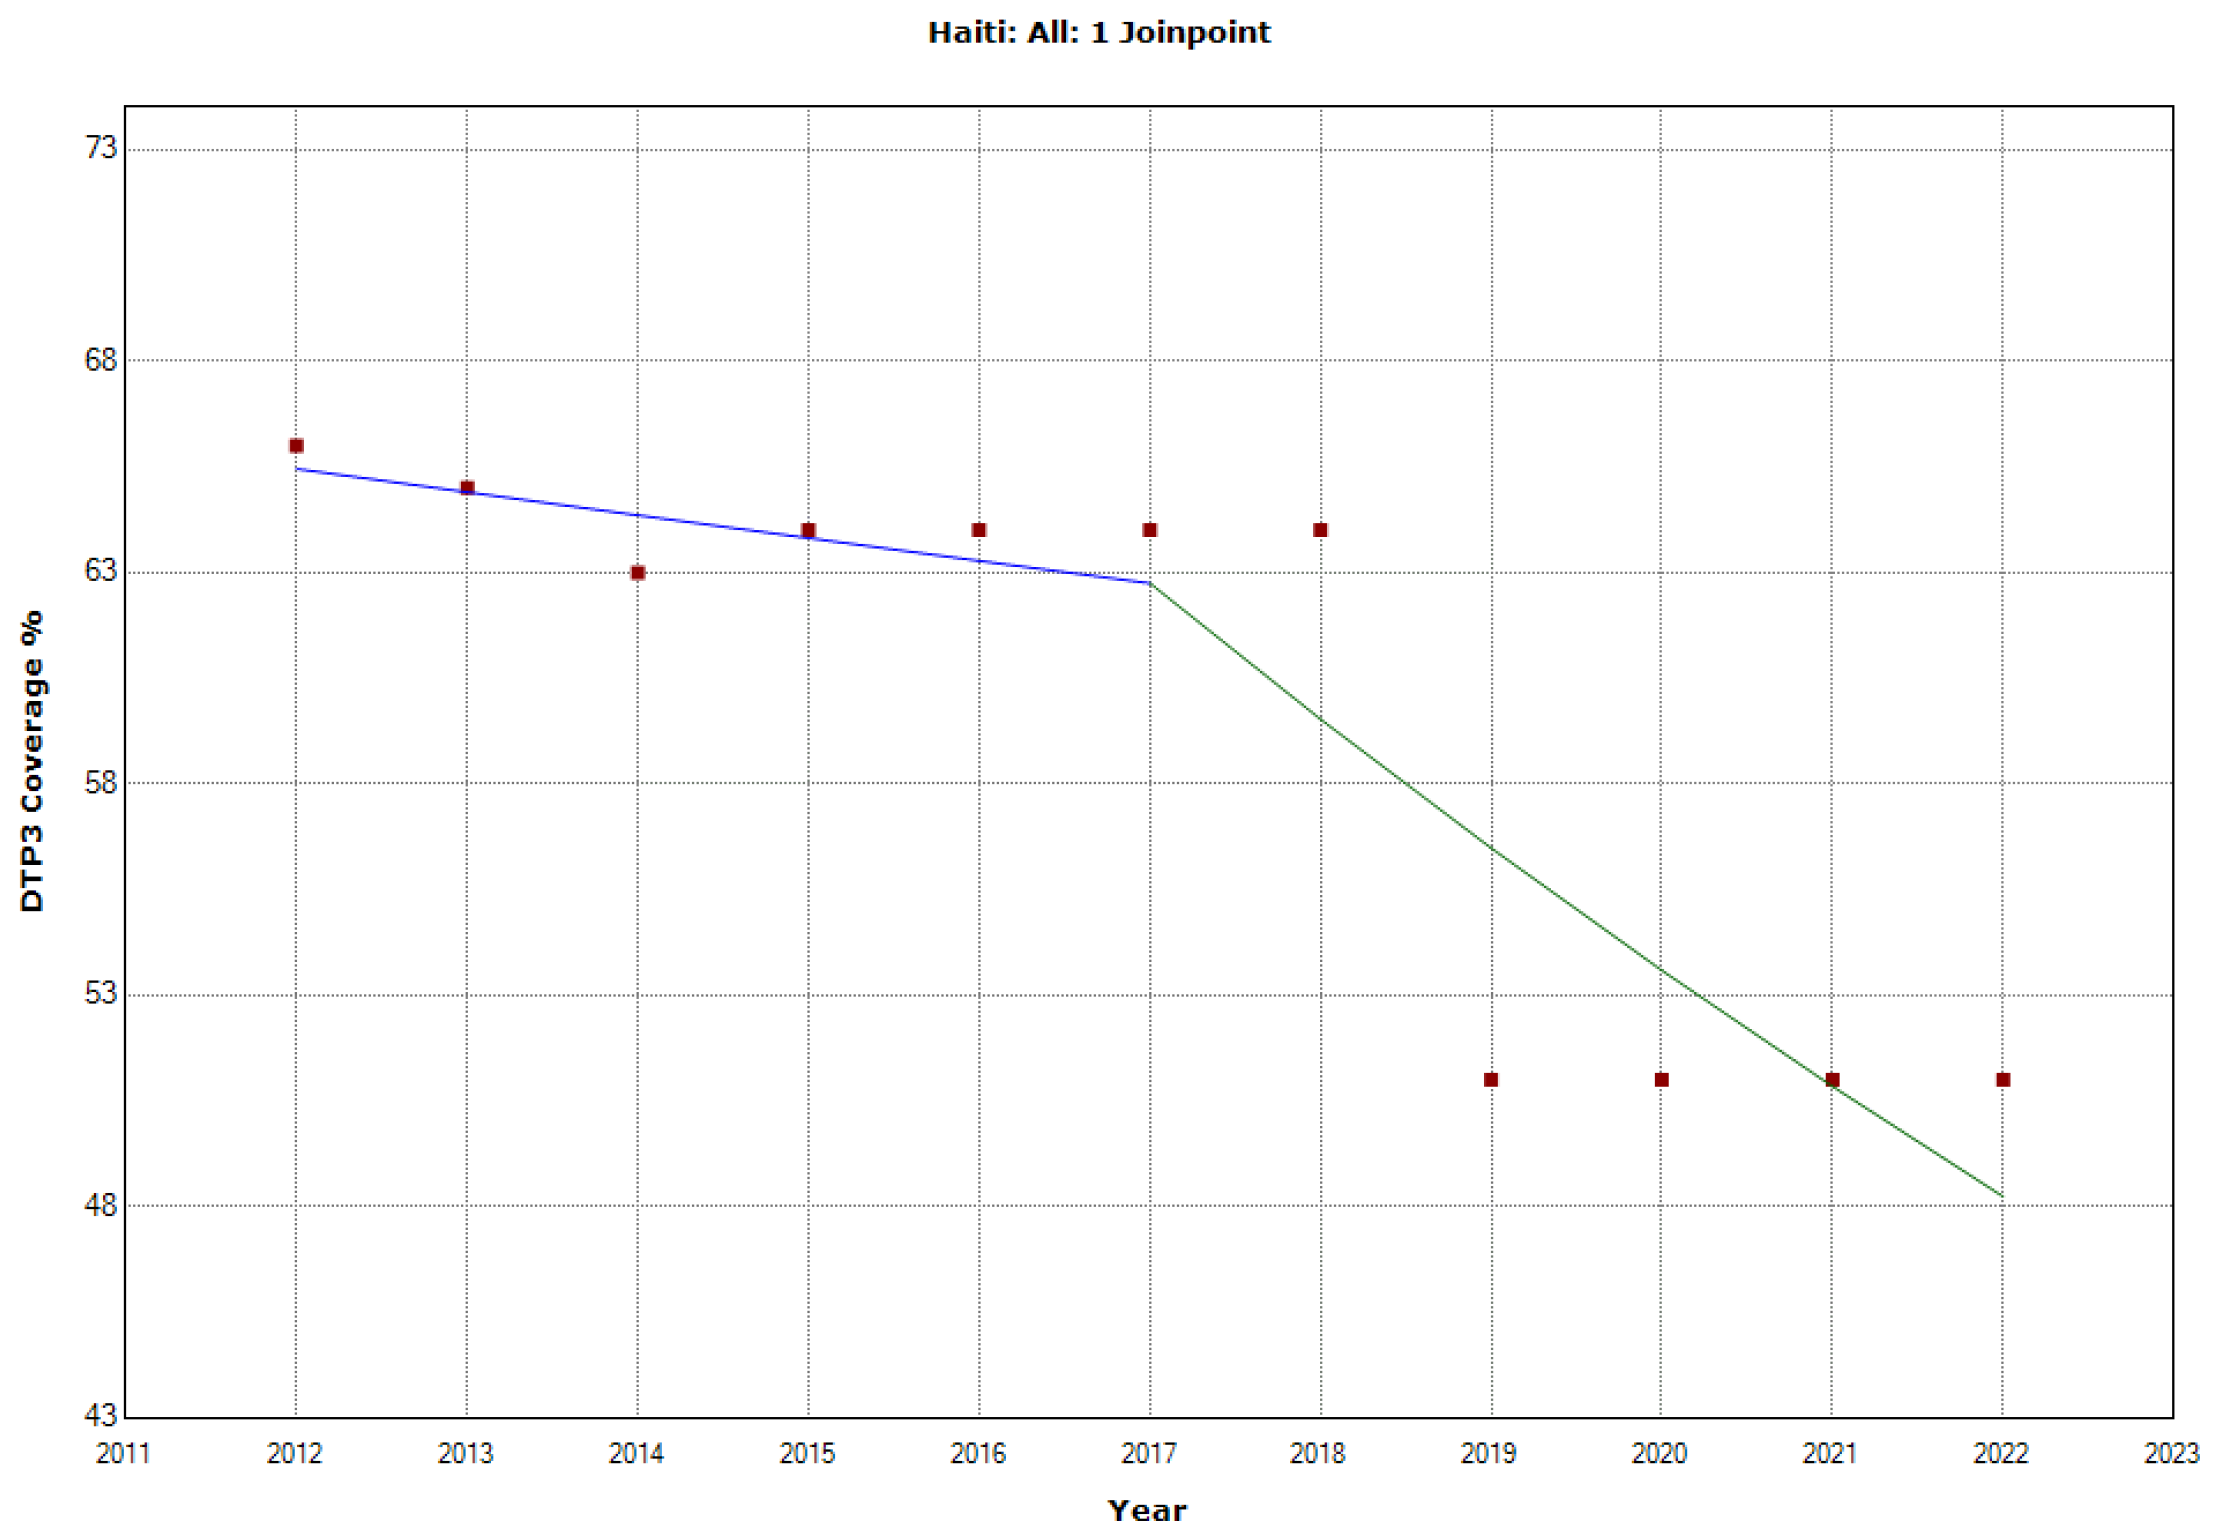
Figure 23.
Third DTP dose coverage (2012-20) indicating joinpoints in Jamaica.
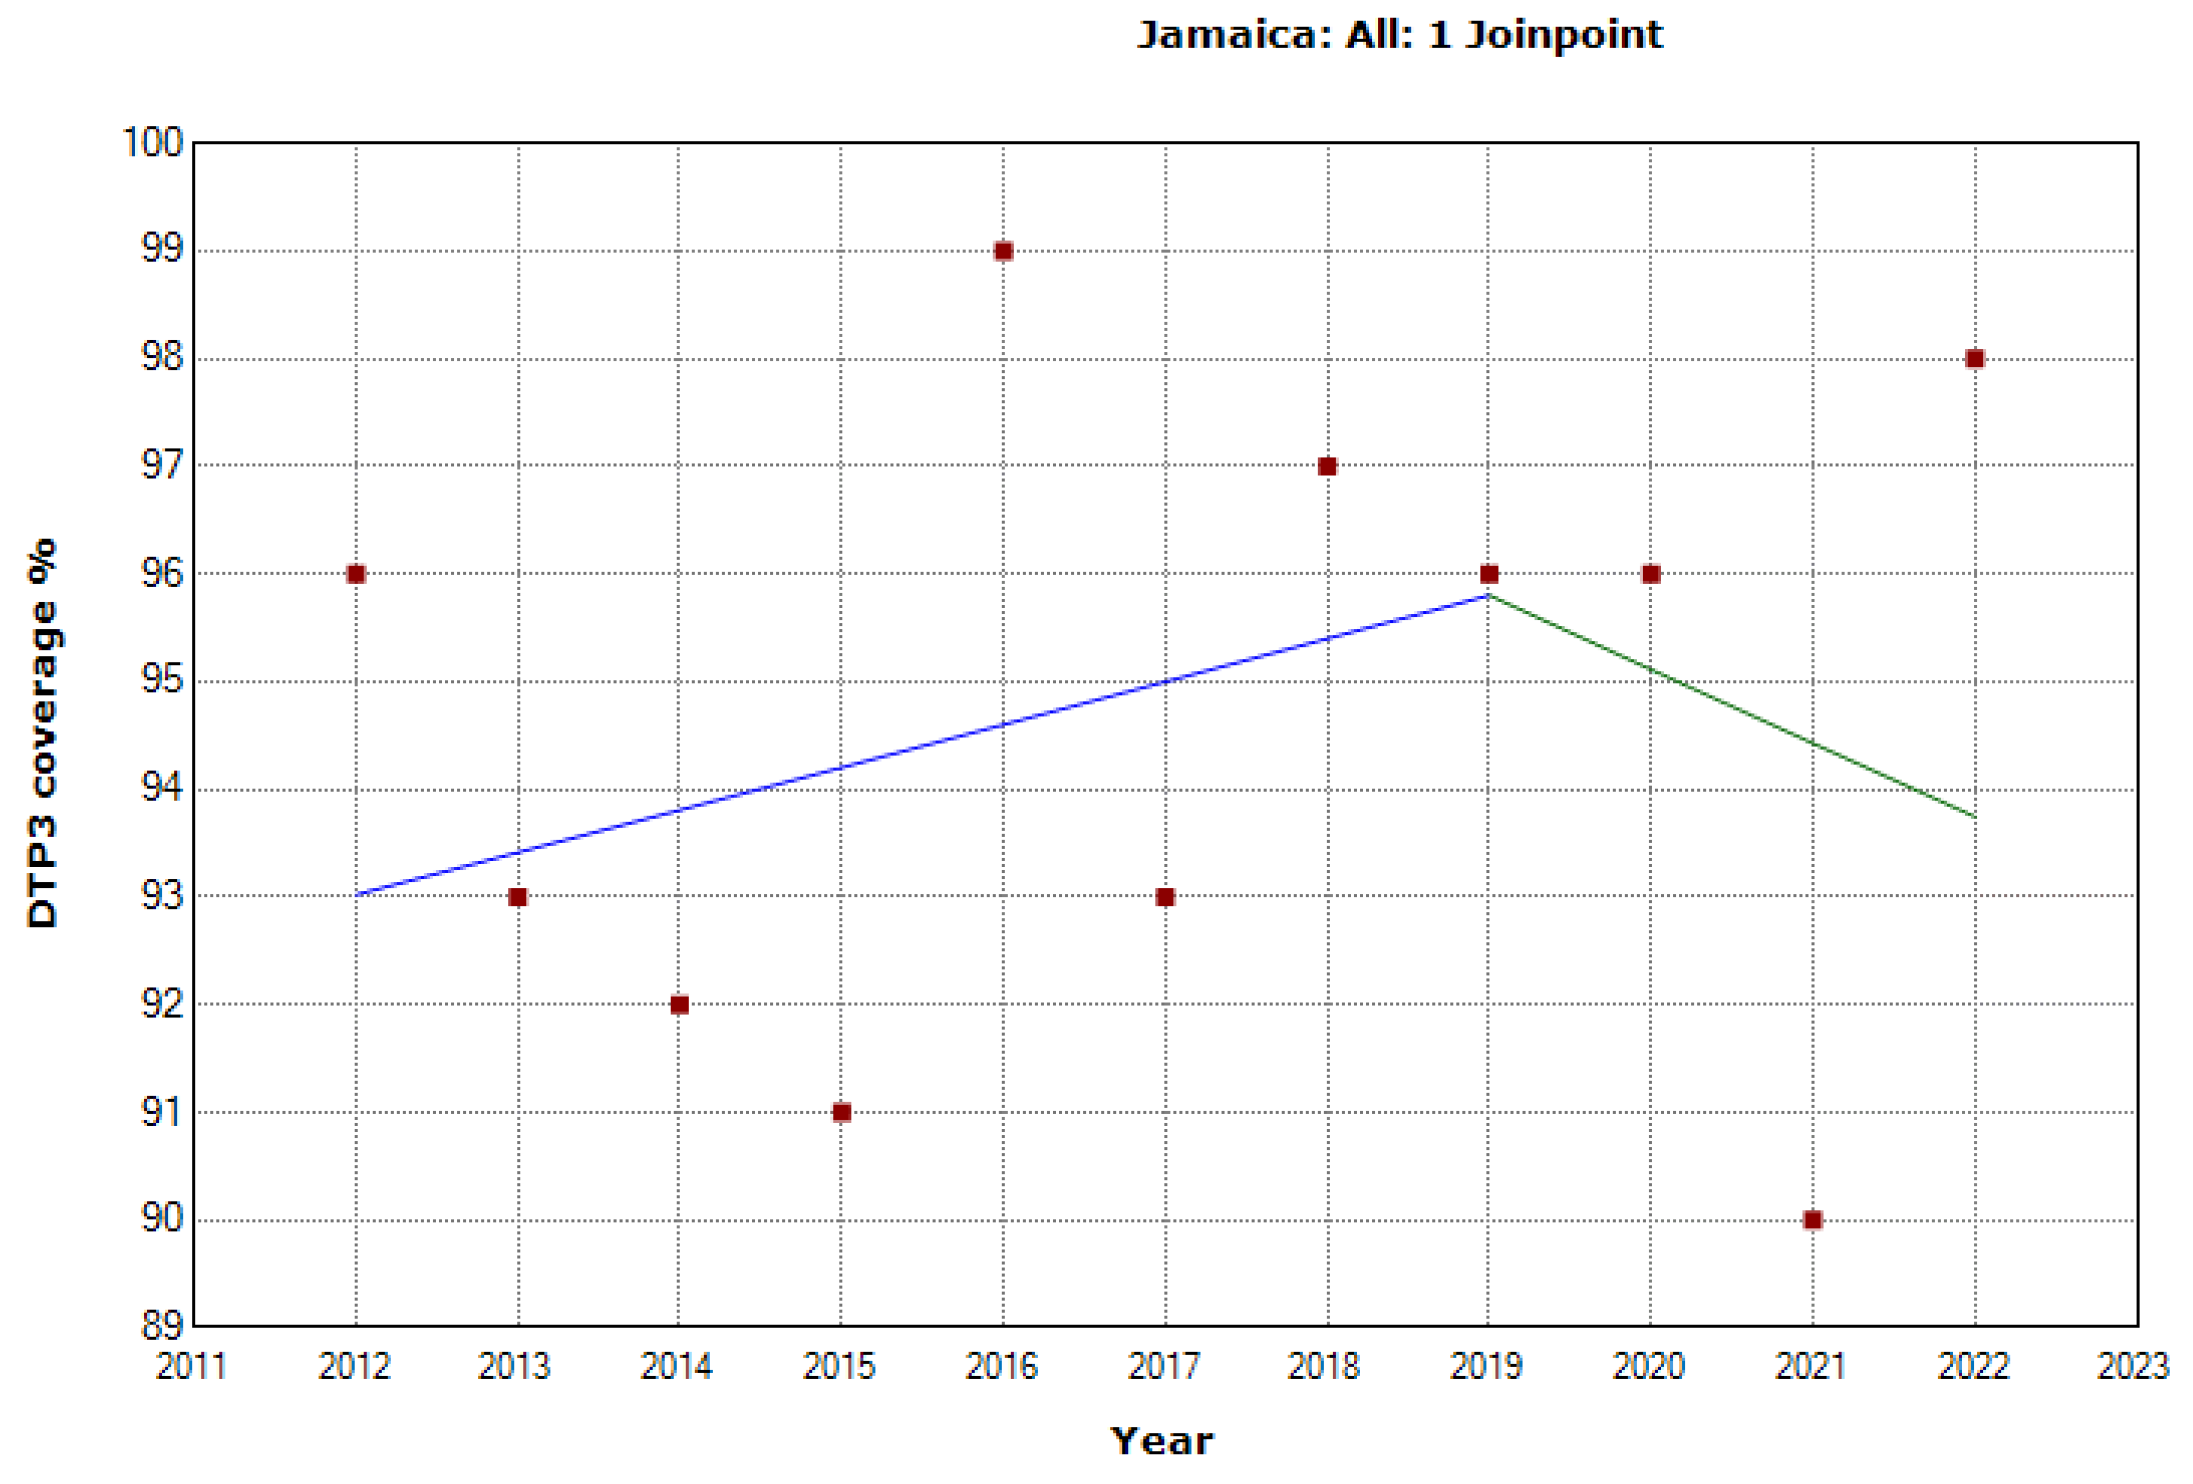
Figure 24.
Third DTP dose coverage (2012-20) indicating joinpoints in Mexico.
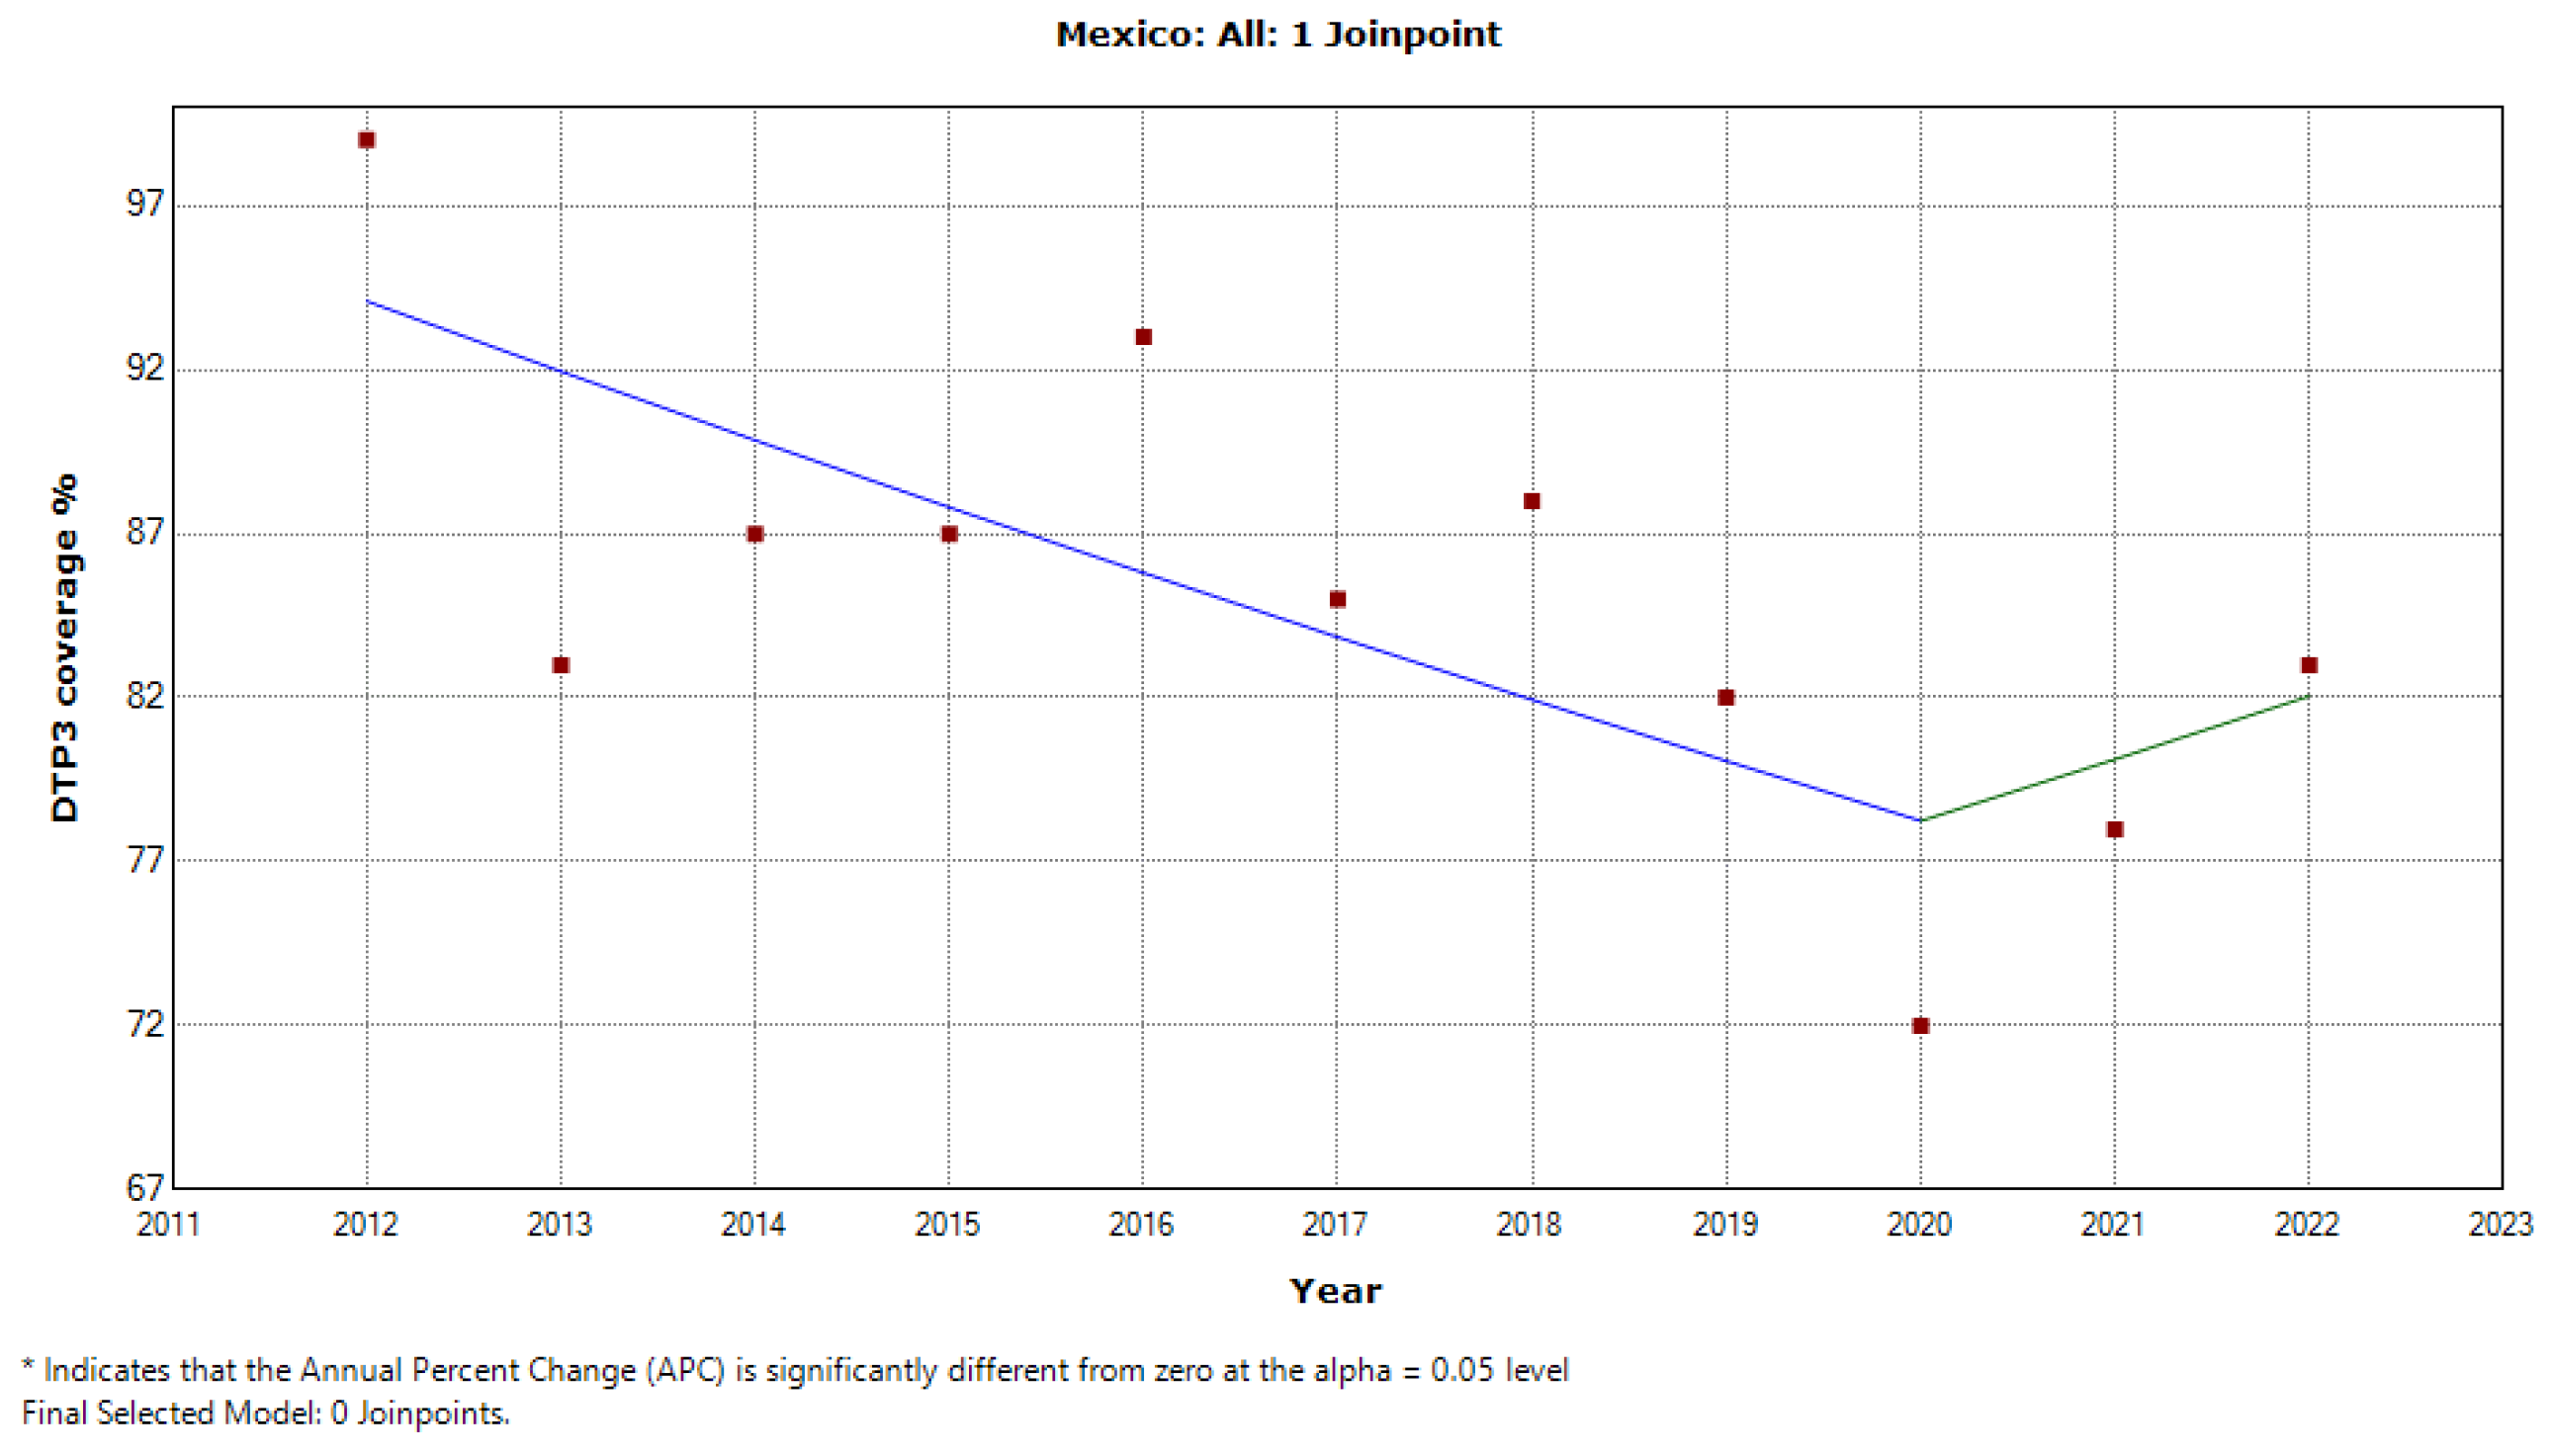
Figure 25.
Third DTP dose coverage (2012-20) indicating joinpoints in Nicaragua.
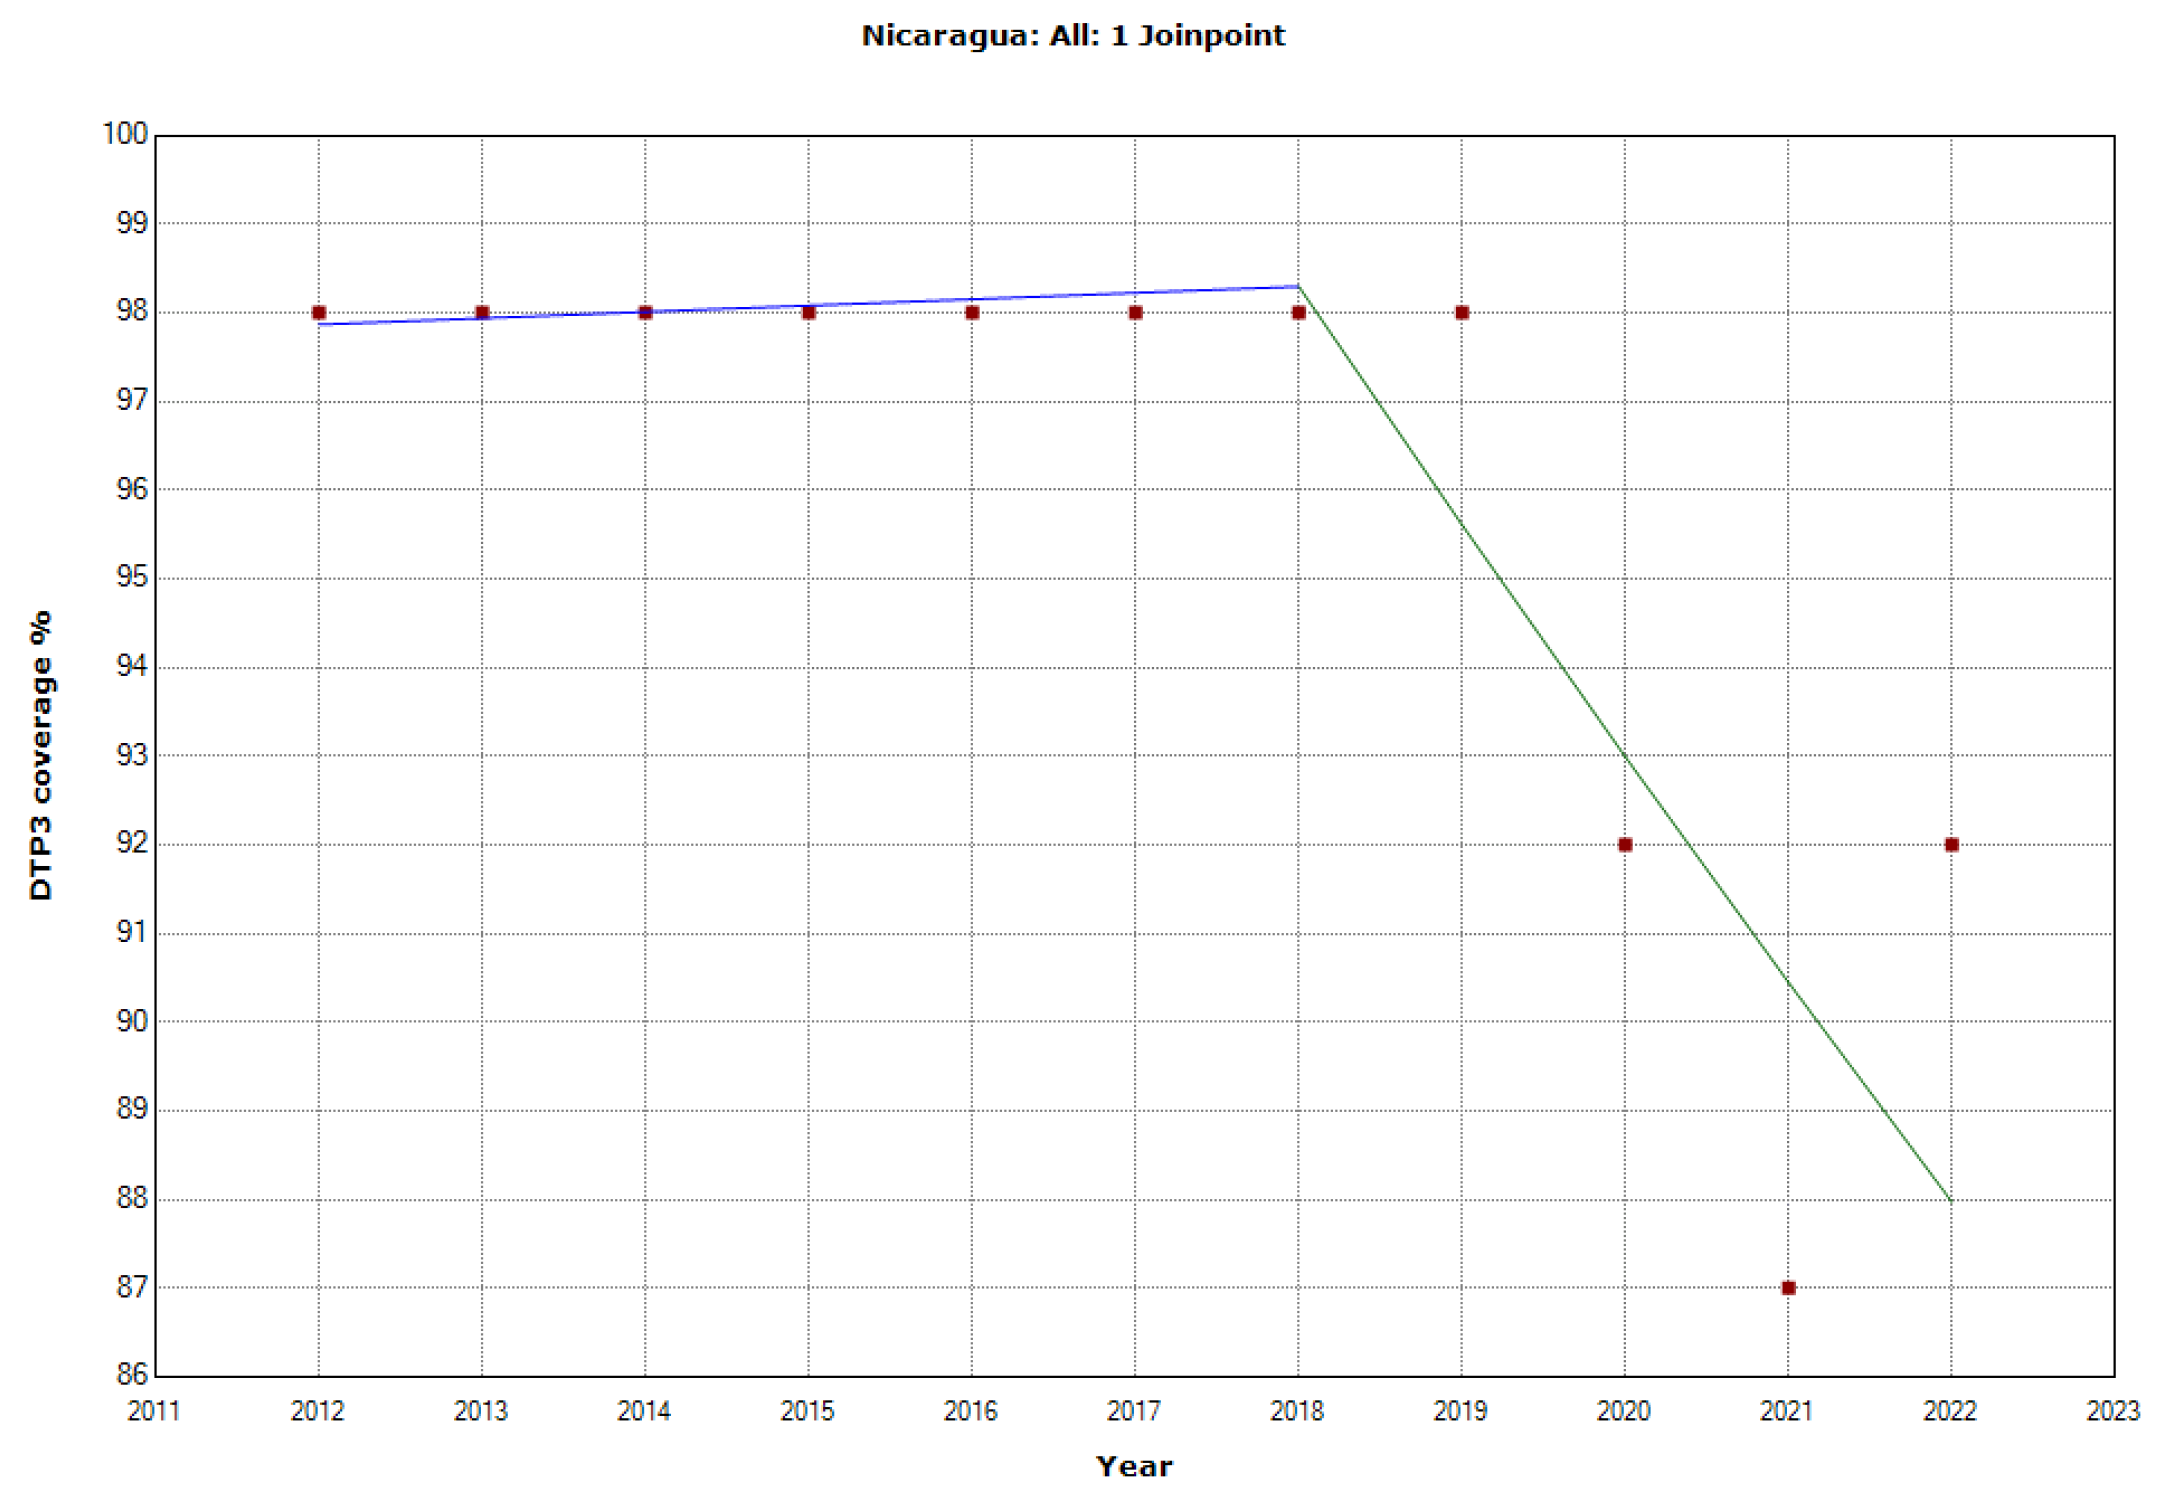
Figure 26.
Third DTP dose coverage (2012-20) indicating joinpoints in Paraguay.
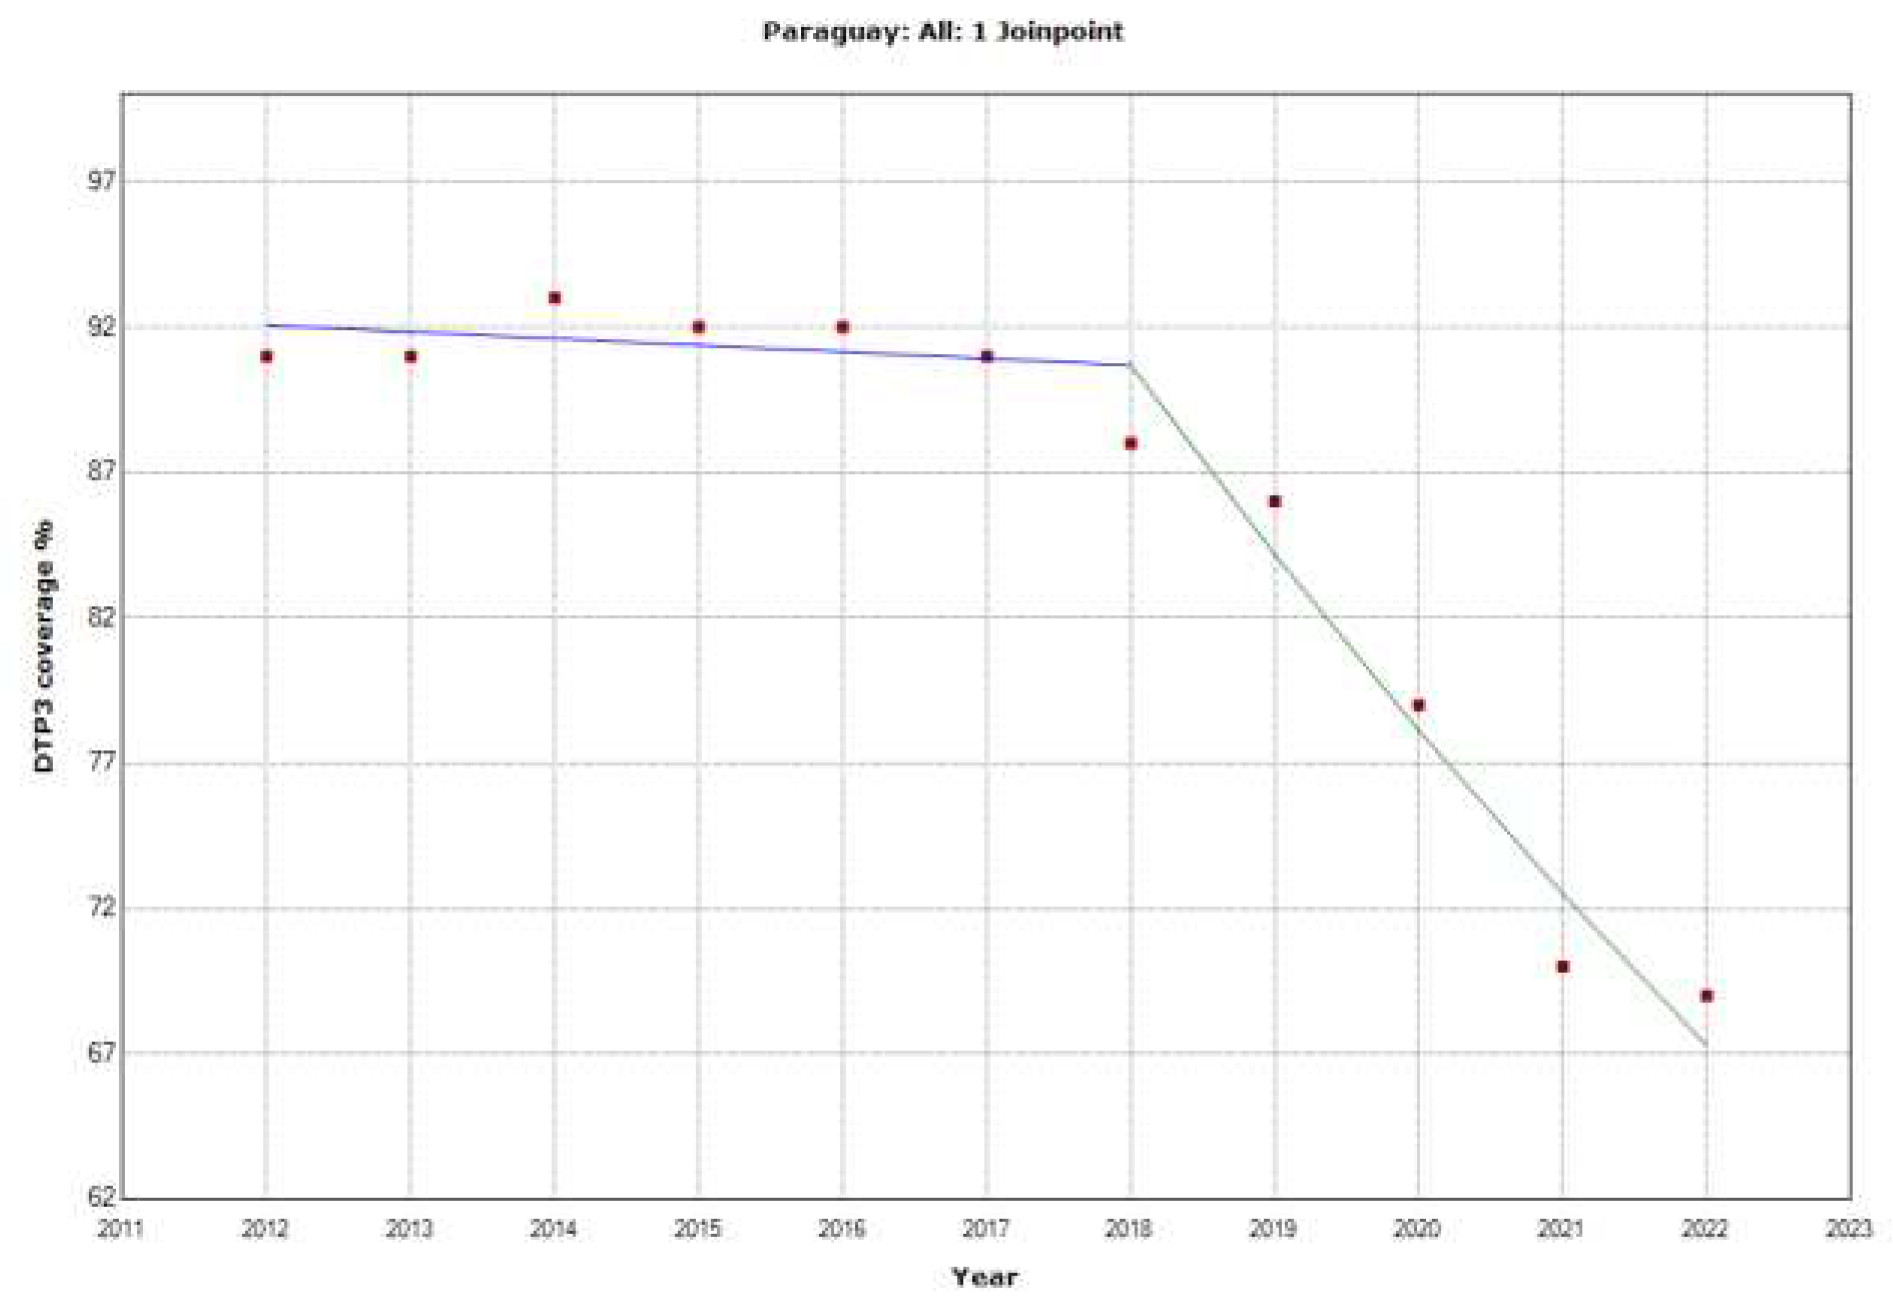
Figure 27.
Third DTP dose coverage (2012-20) indicating joinpoints in Peru.
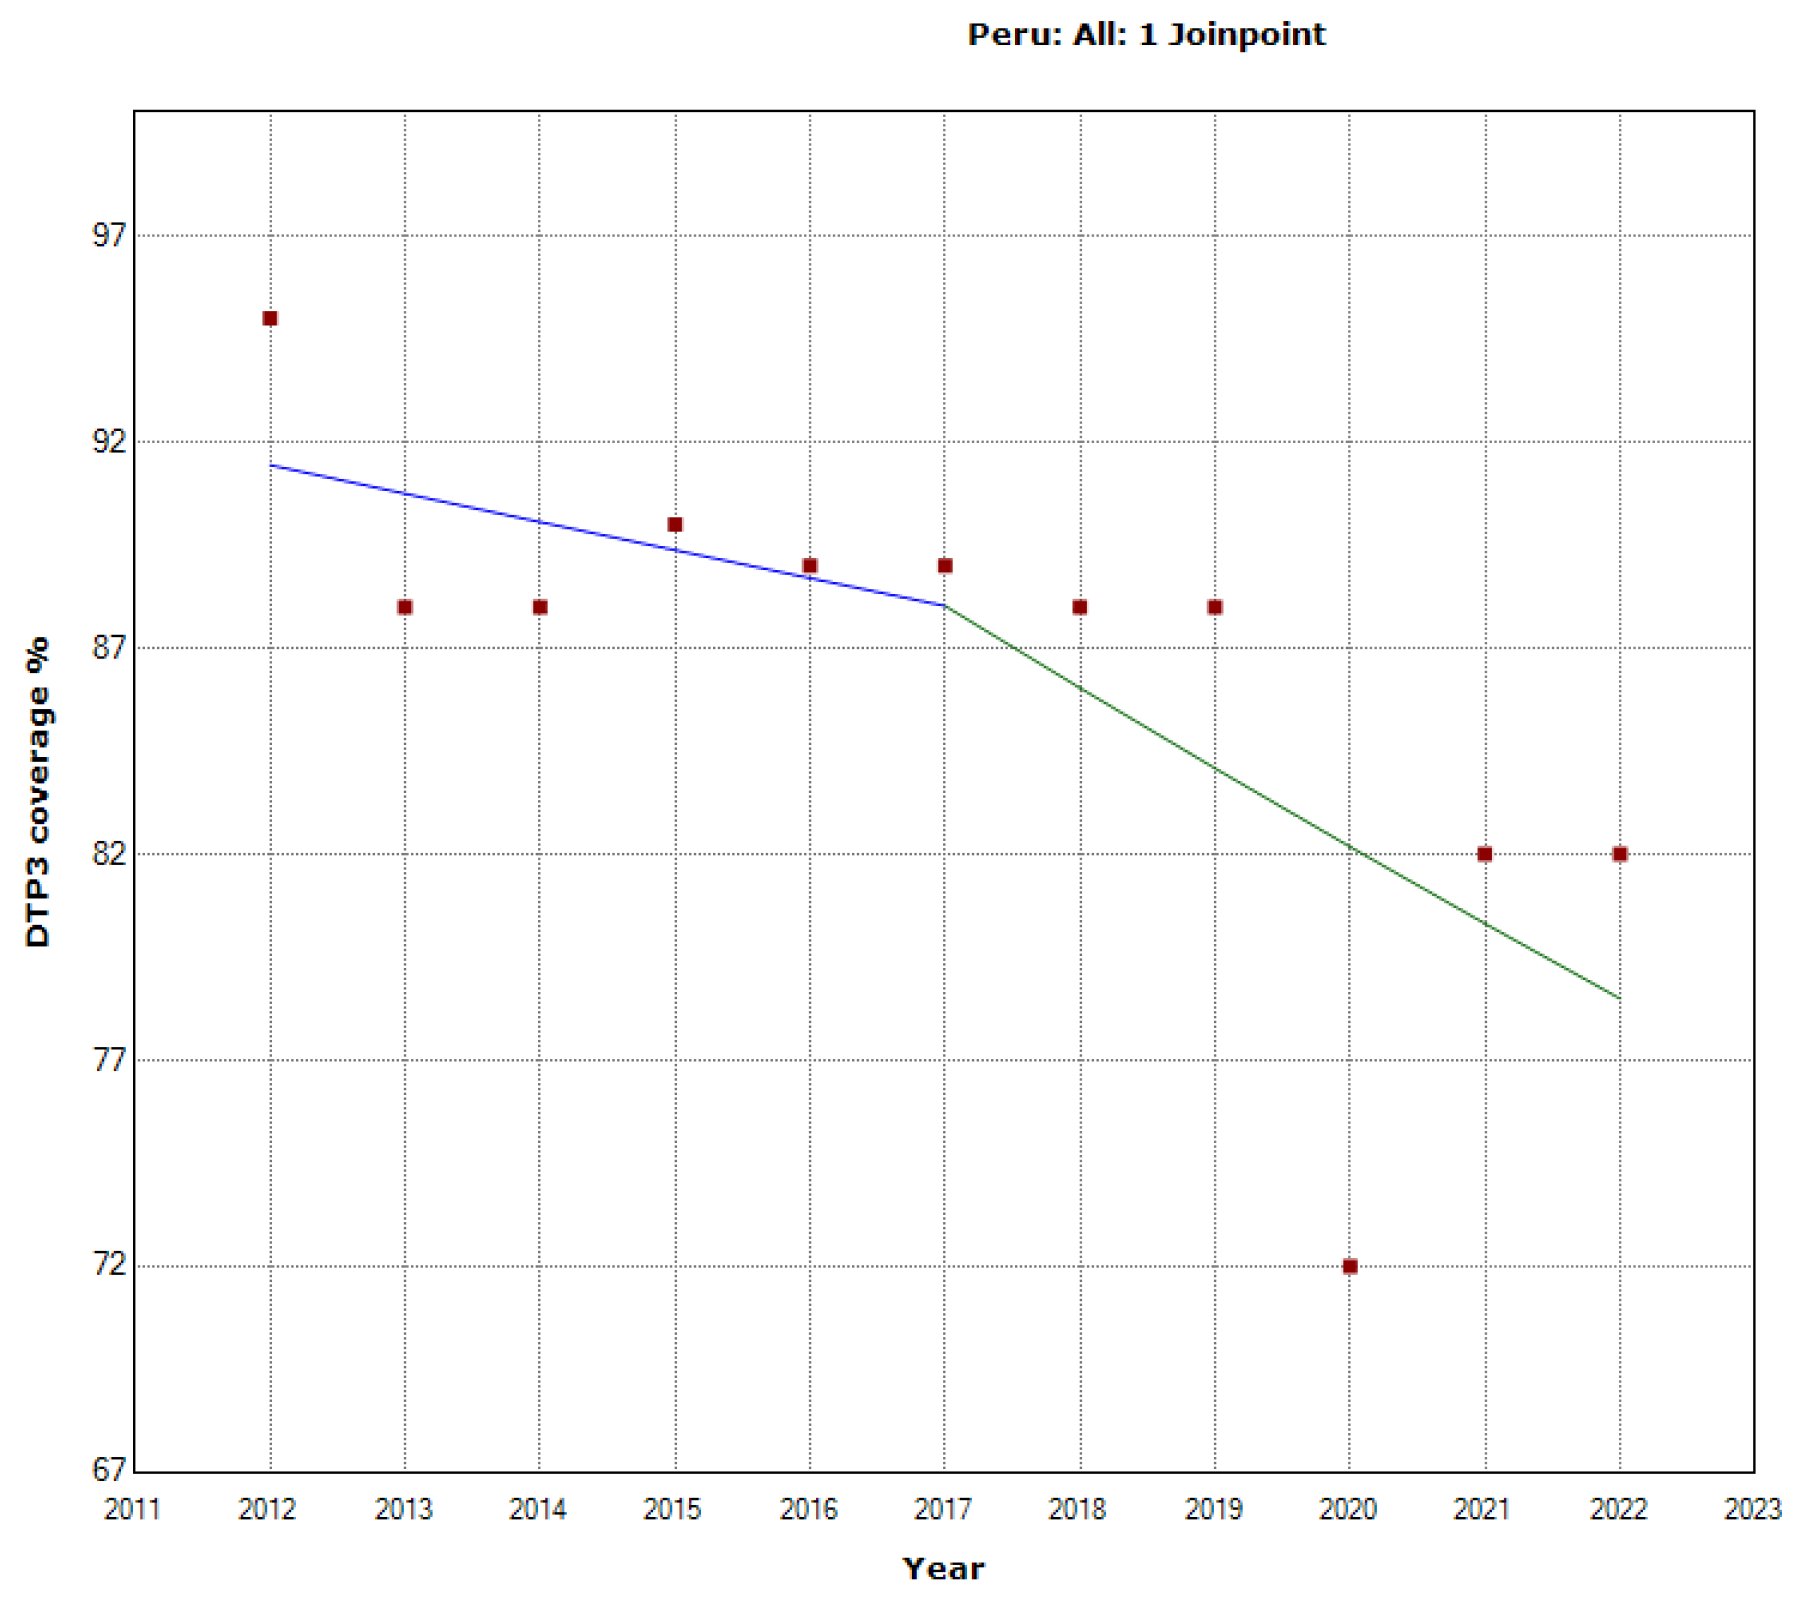
Figure 28.
Third DTP dose coverage (2012-20) indicating joinpoints in Saint Kitts and Nevis.
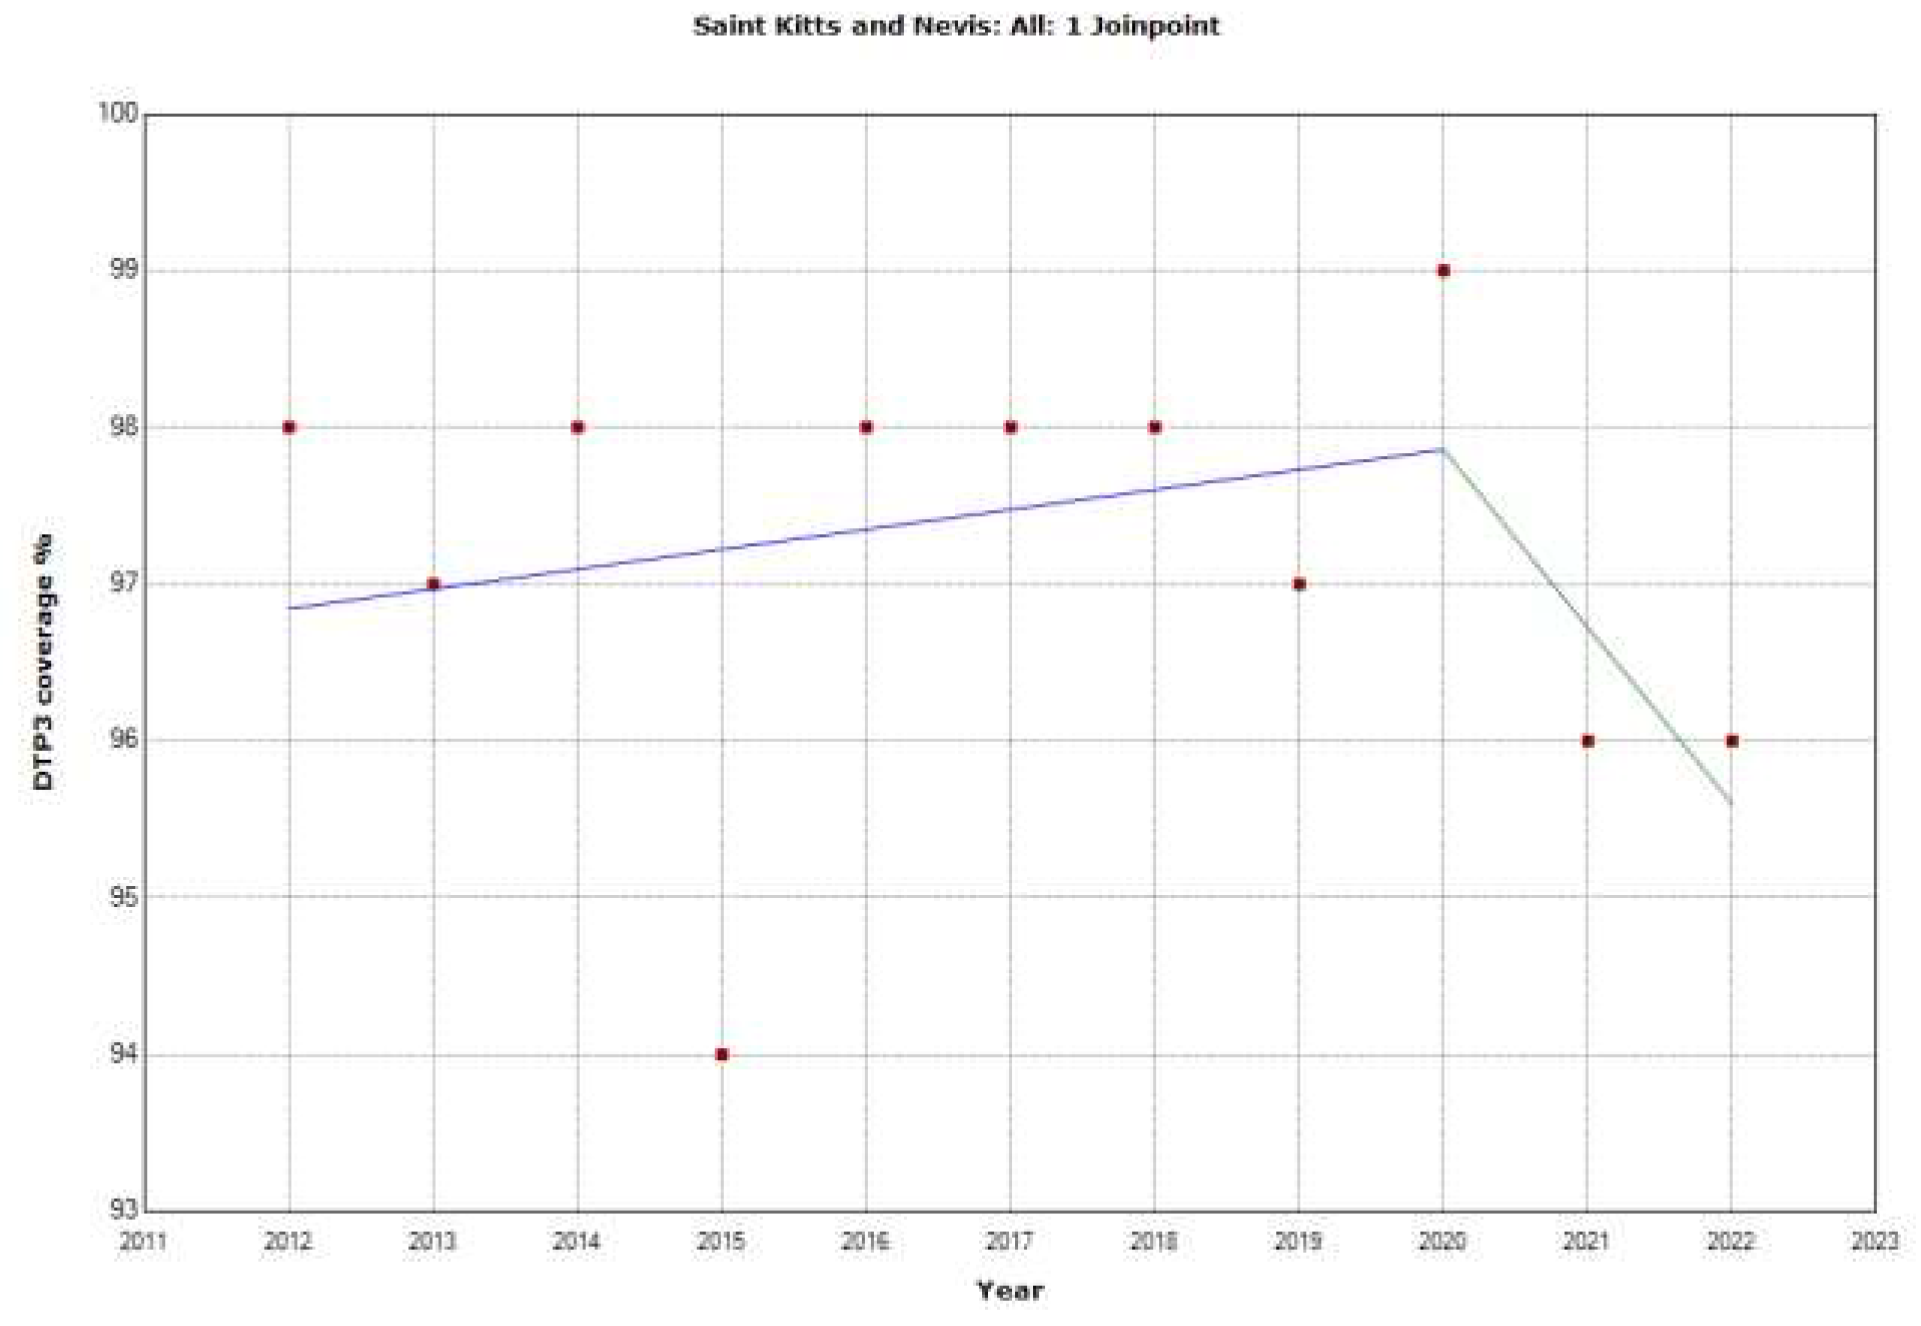
Figure 29.
Third DTP dose coverage (2012-20) indicating joinpoints in Saint Lucia.
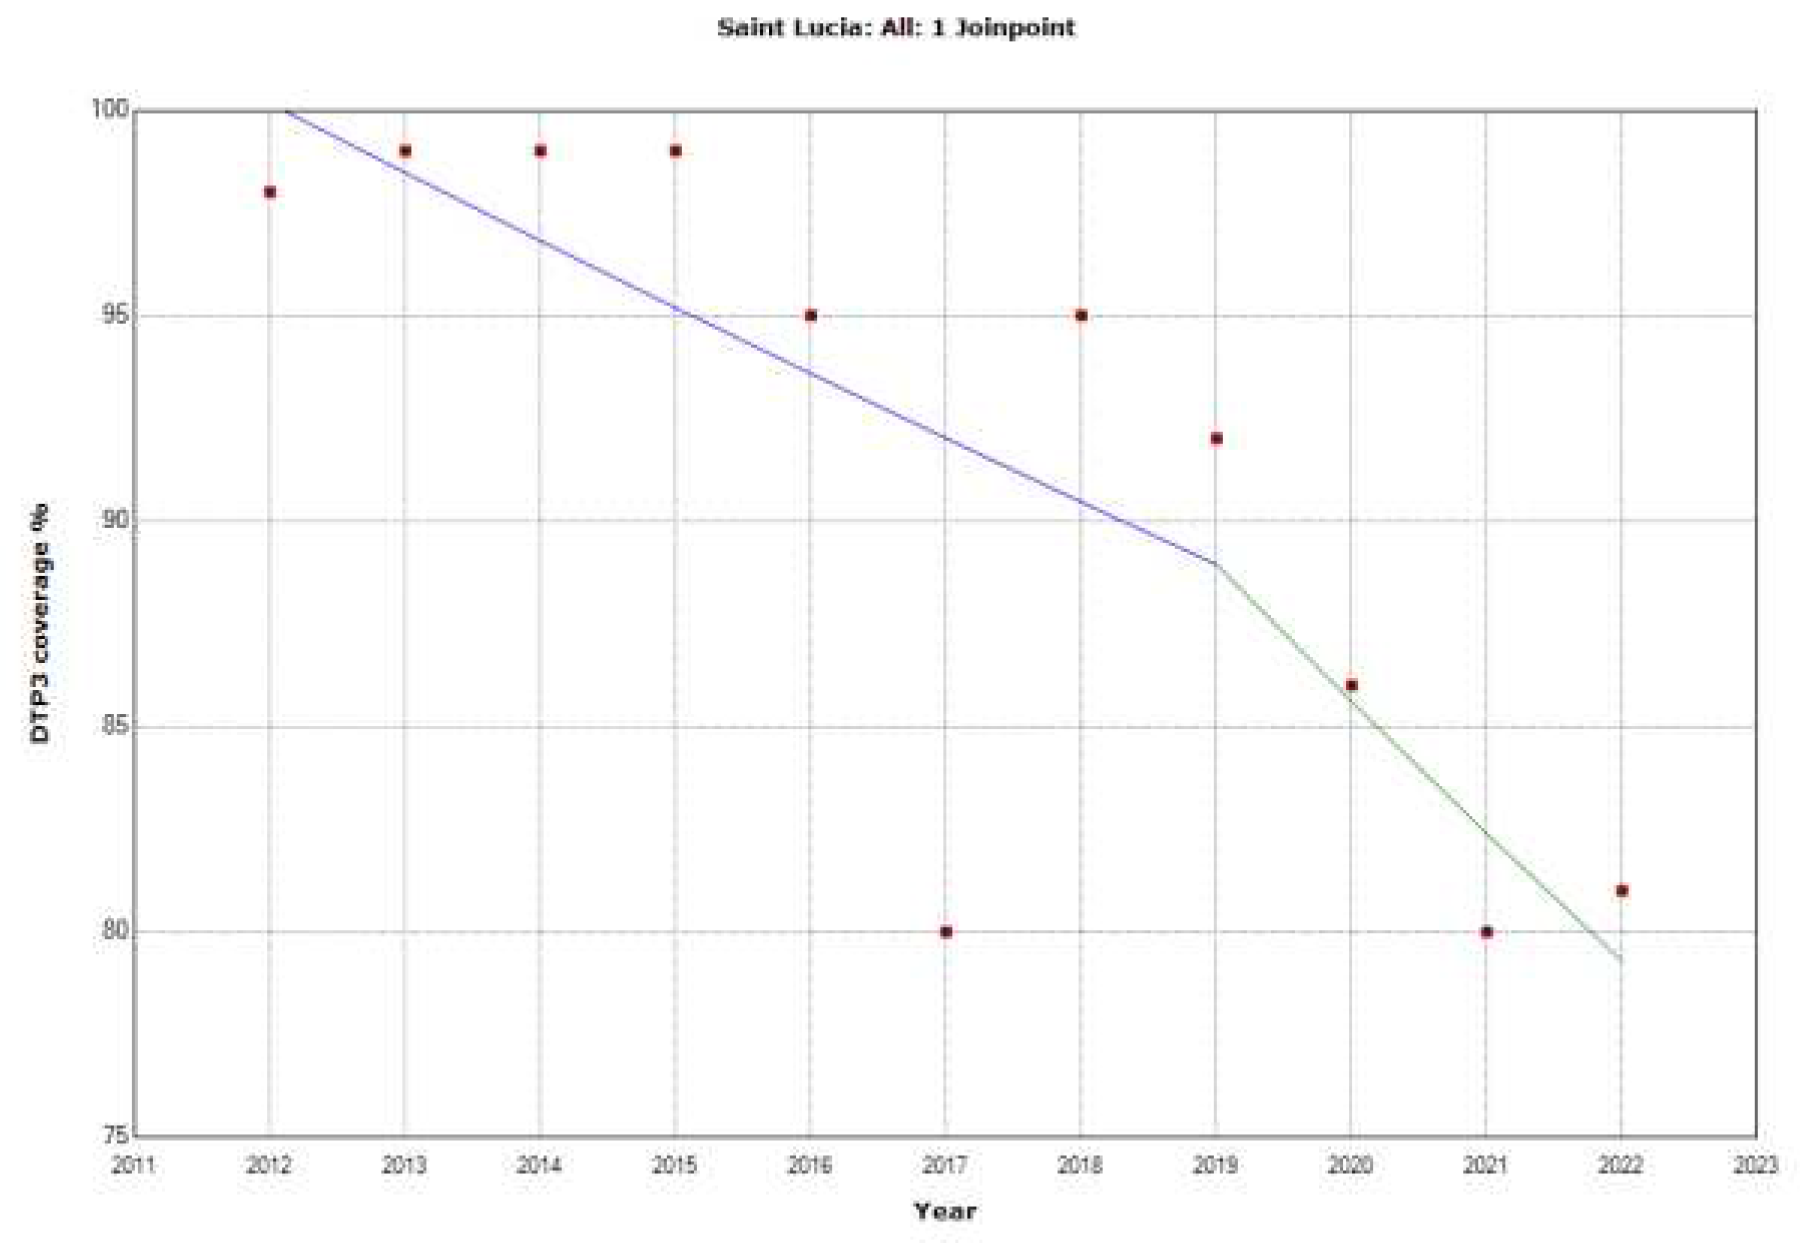
Figure 30.
Third DTP dose coverage (2012-20) indicating joinpoints in Saint Vincent and the Grenadines
Figure 30.
Third DTP dose coverage (2012-20) indicating joinpoints in Saint Vincent and the Grenadines
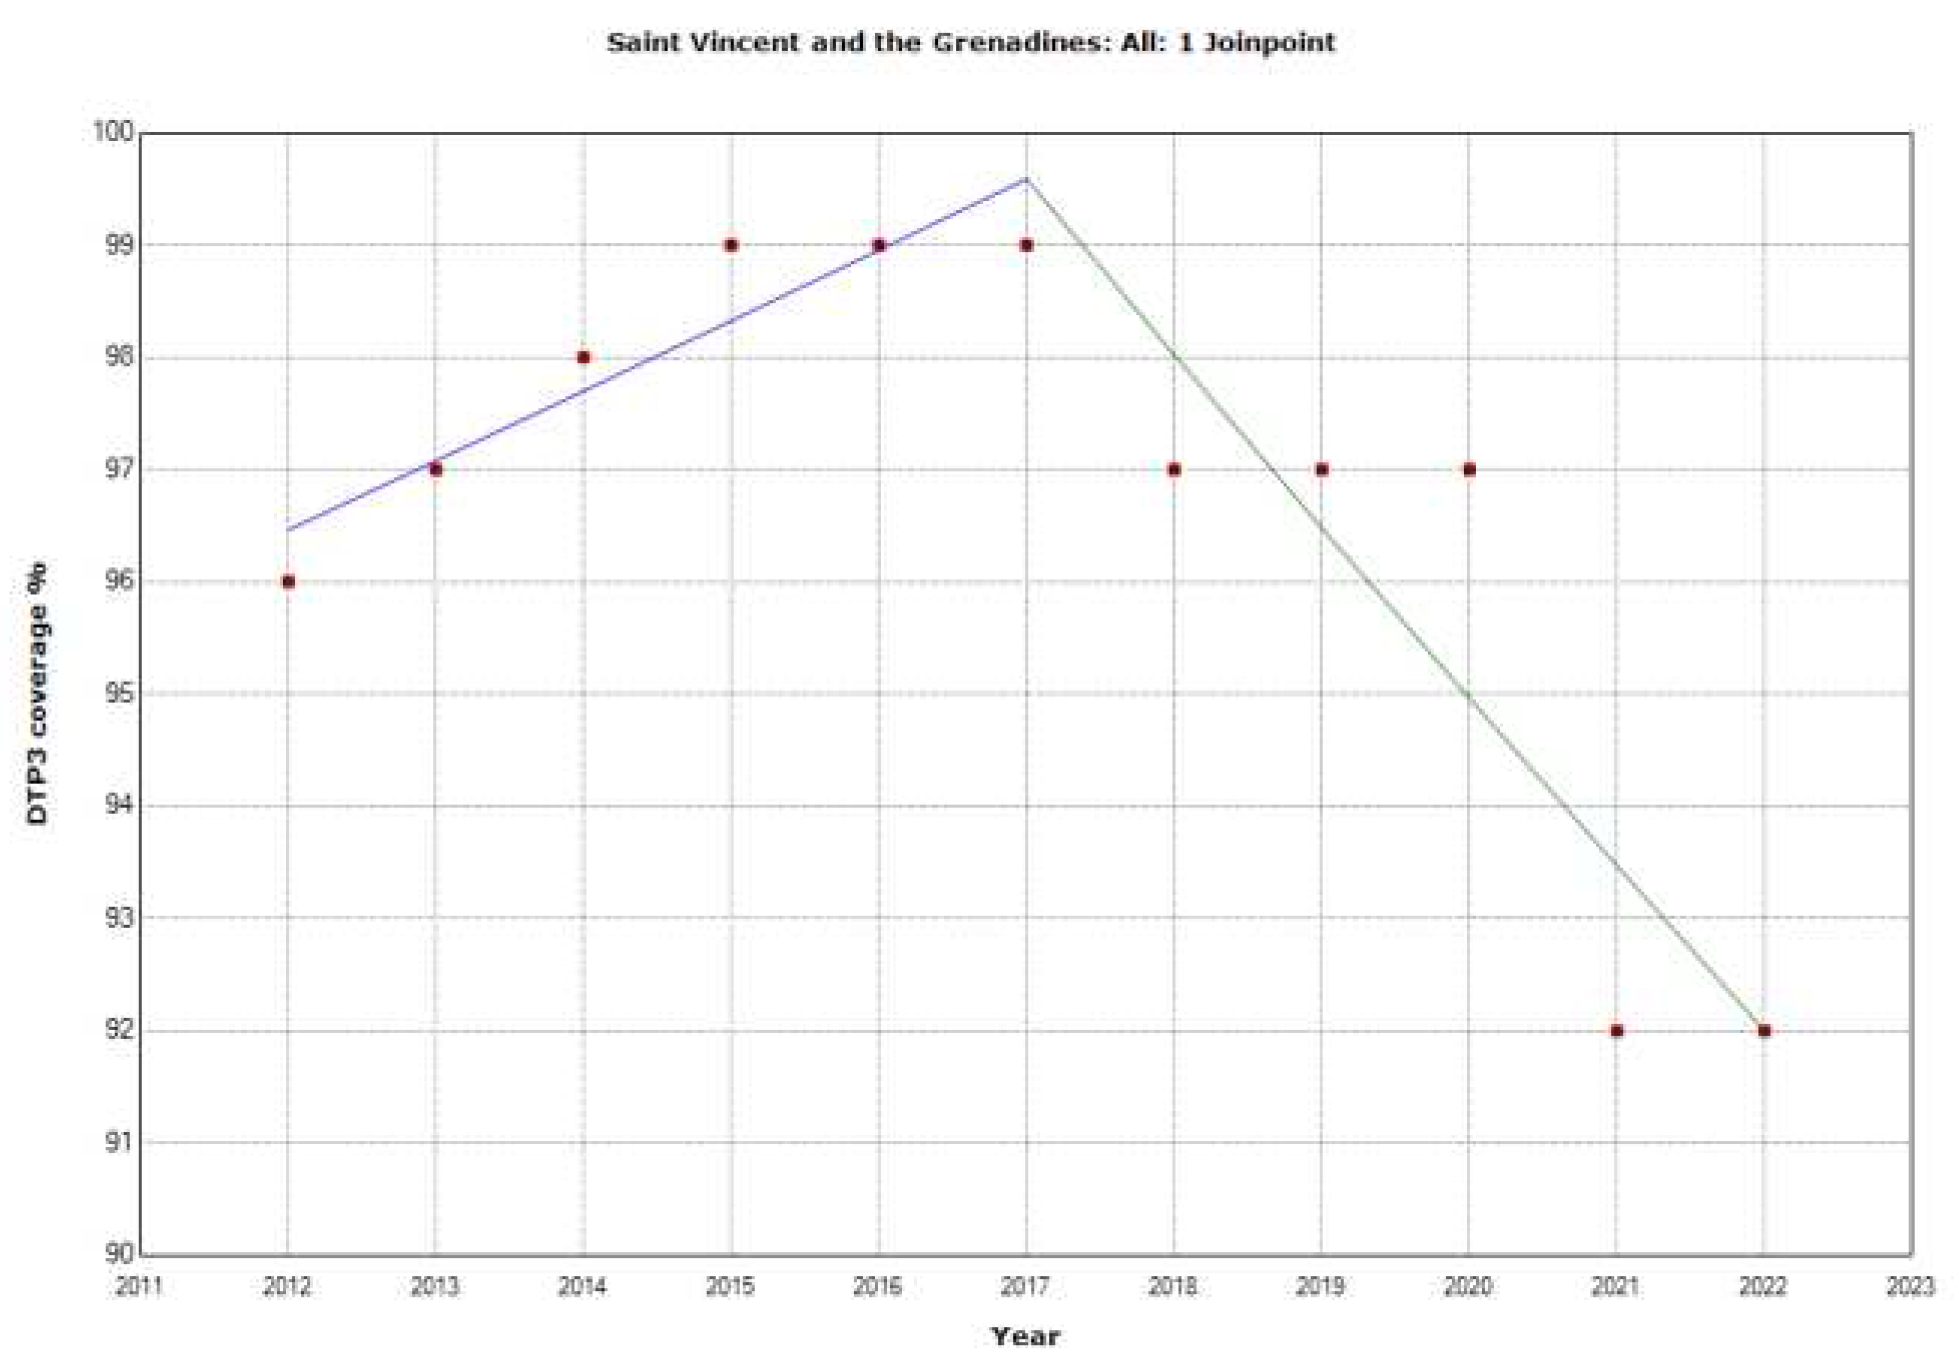
Figure 31.
Third DTP dose coverage (2012-20) indicating joinpoints in Suriname.
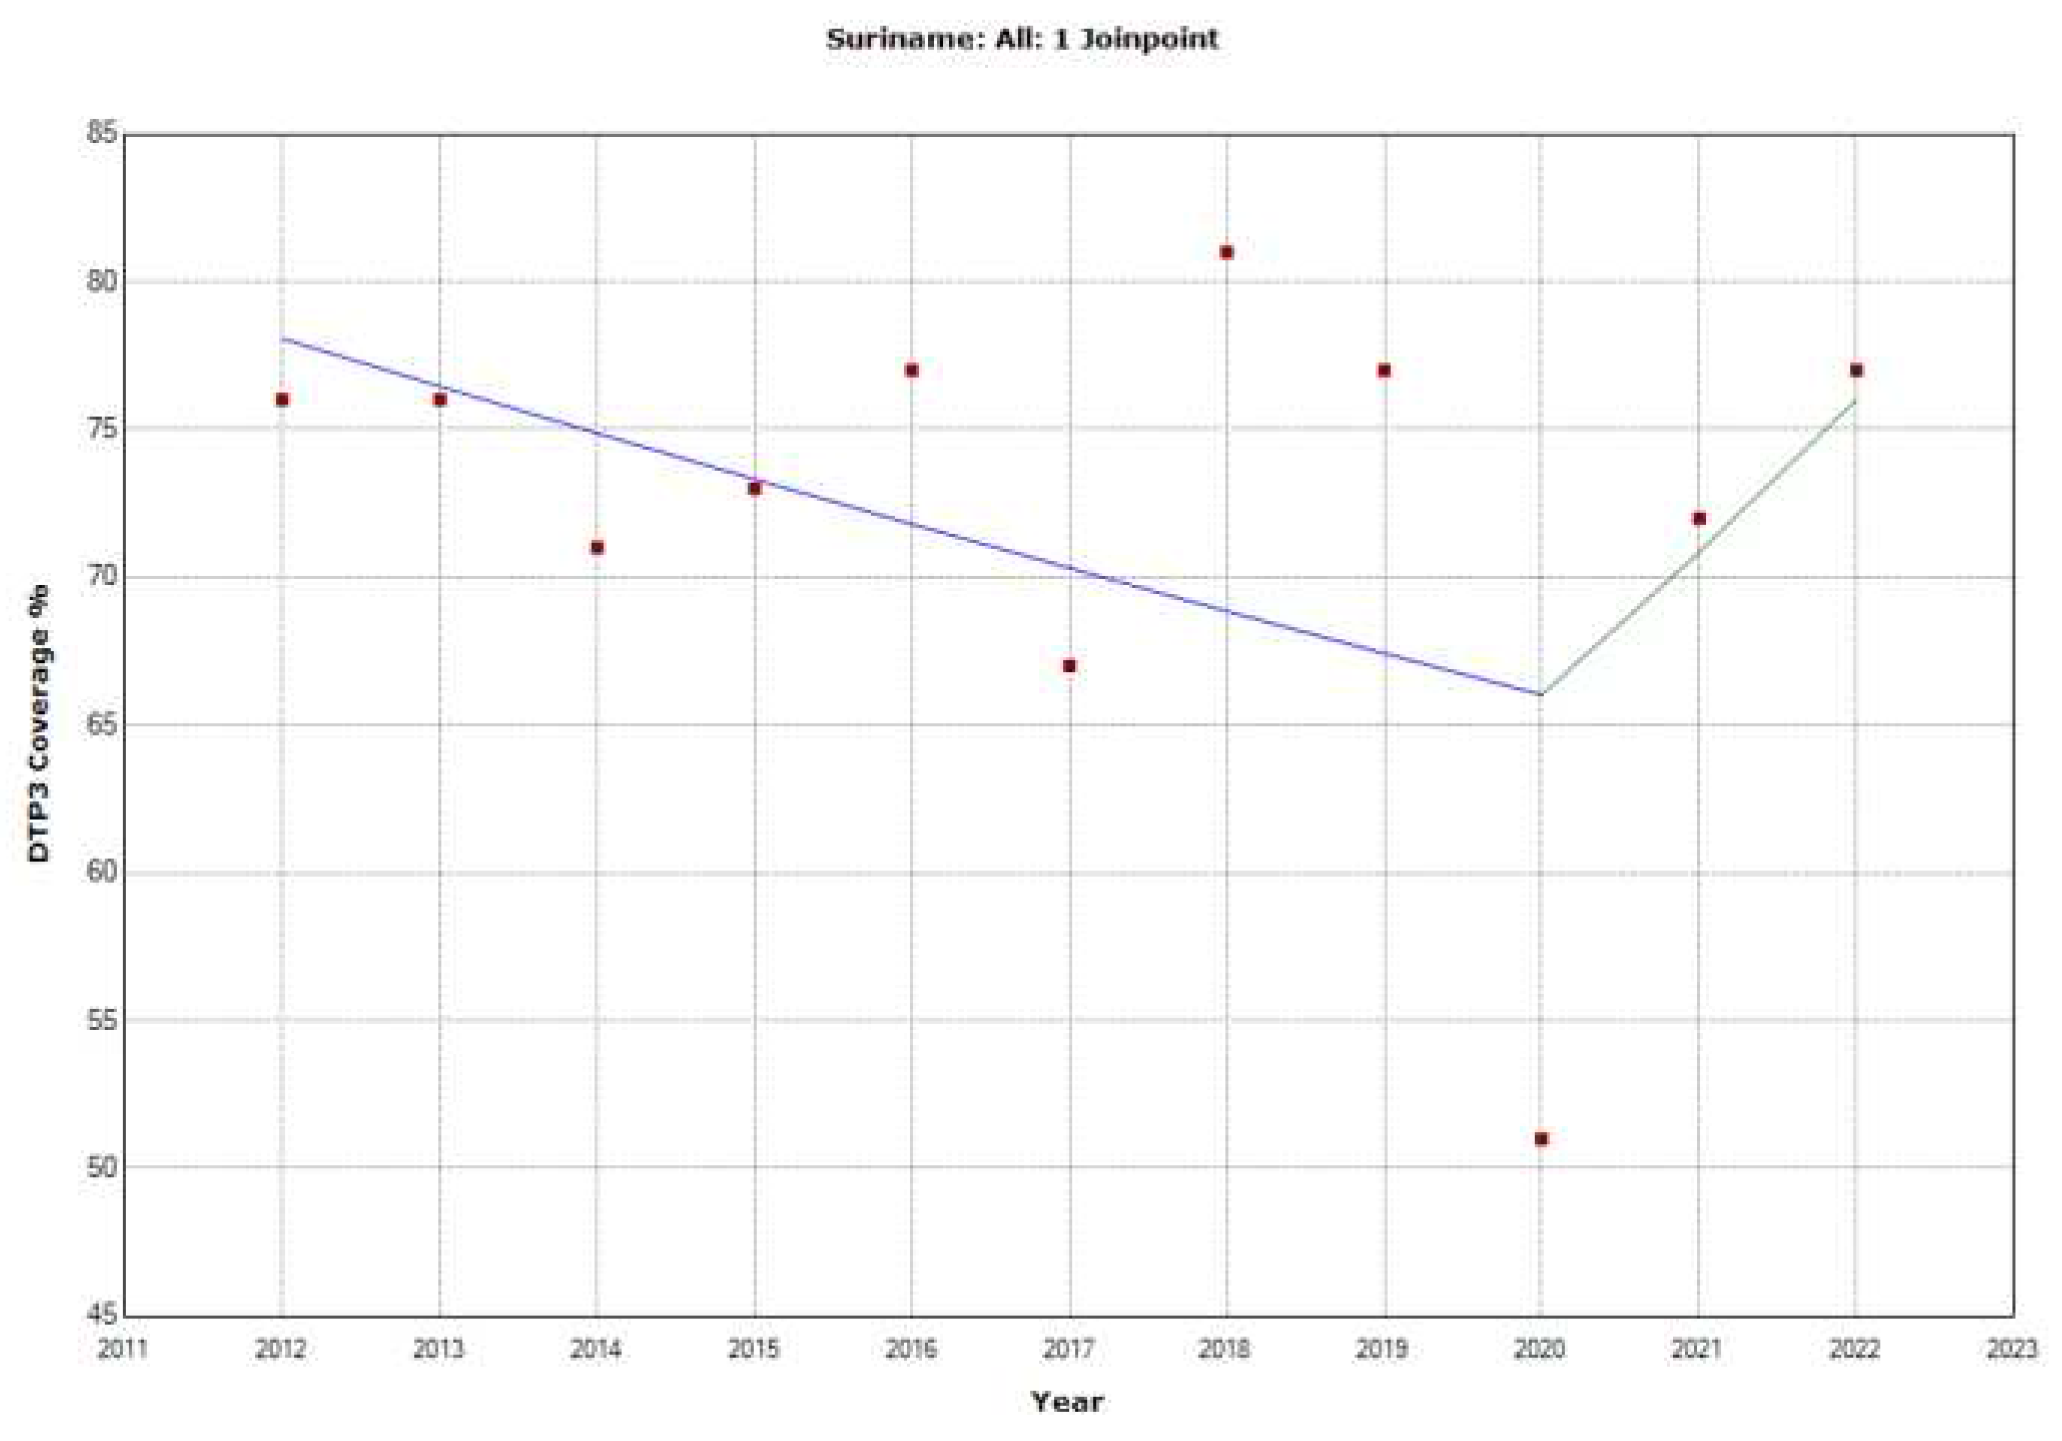
Figure 32.
Third DTP dose coverage (2012-20) indicating joinpoints in Uruguay.
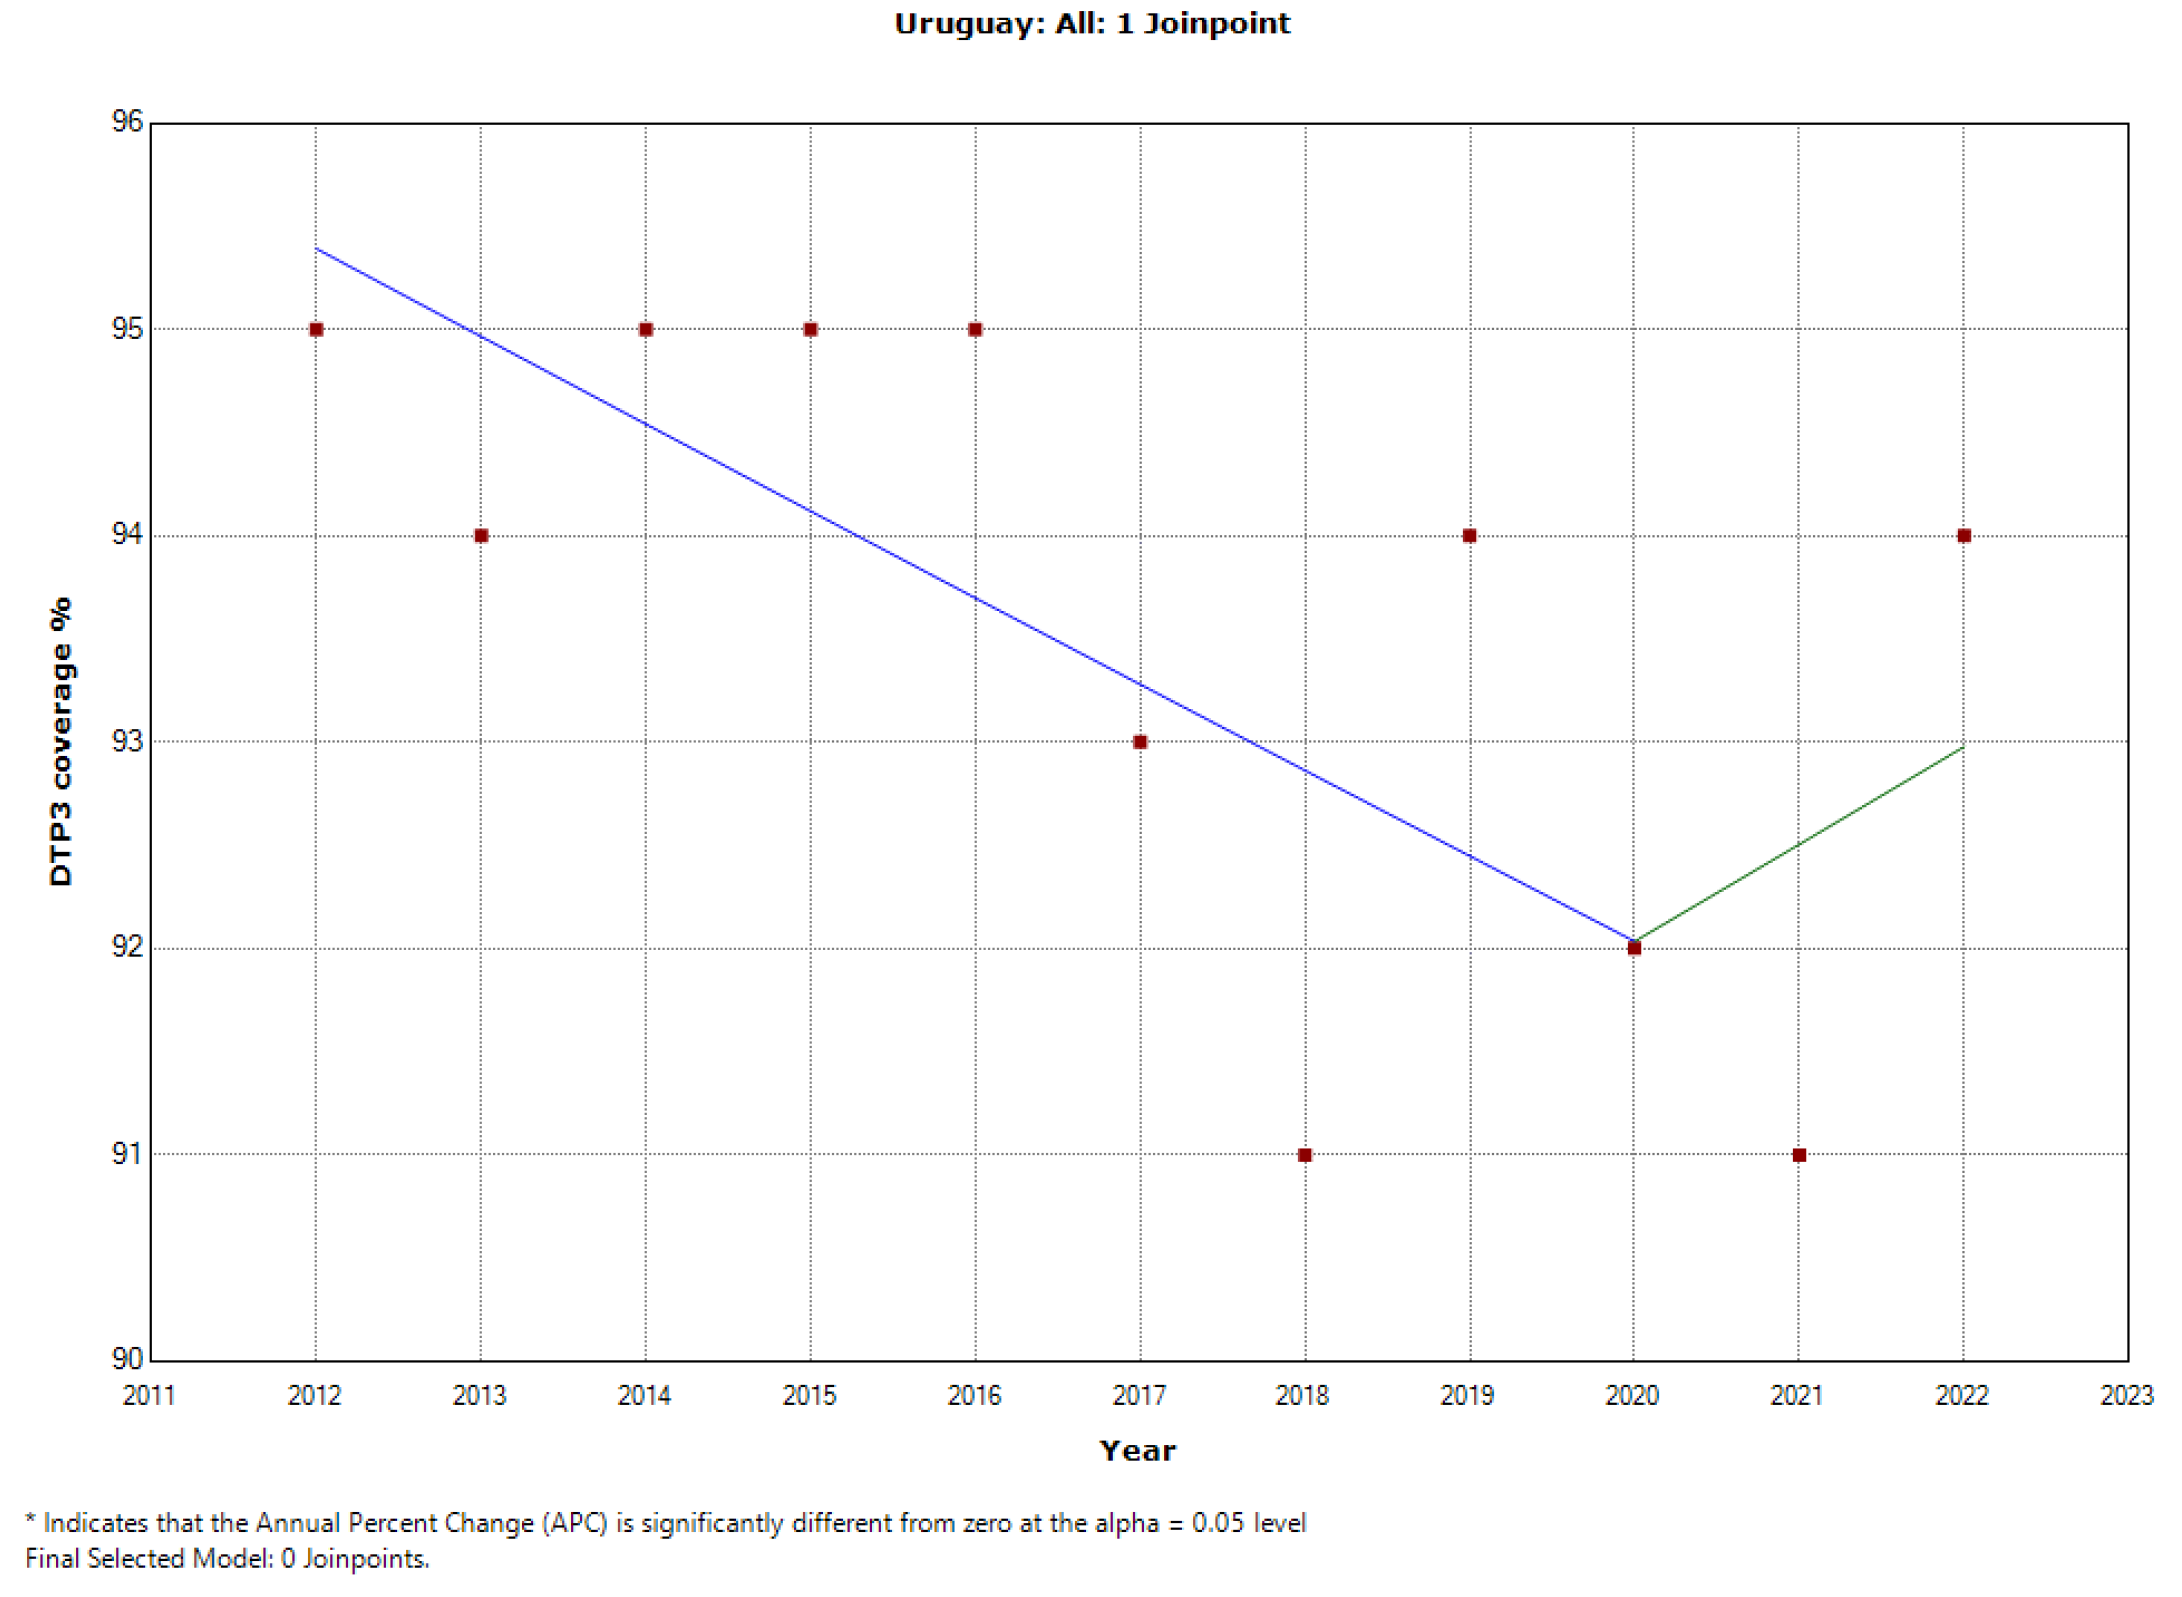
Figure 33.
Segmented Regression Analysis of DTP3 in the Americas, representing the actual DTP3 vaccination numbers (in dark blue) against the predicted values from the segmented regression (in light coral.
Figure 33.
Segmented Regression Analysis of DTP3 in the Americas, representing the actual DTP3 vaccination numbers (in dark blue) against the predicted values from the segmented regression (in light coral.
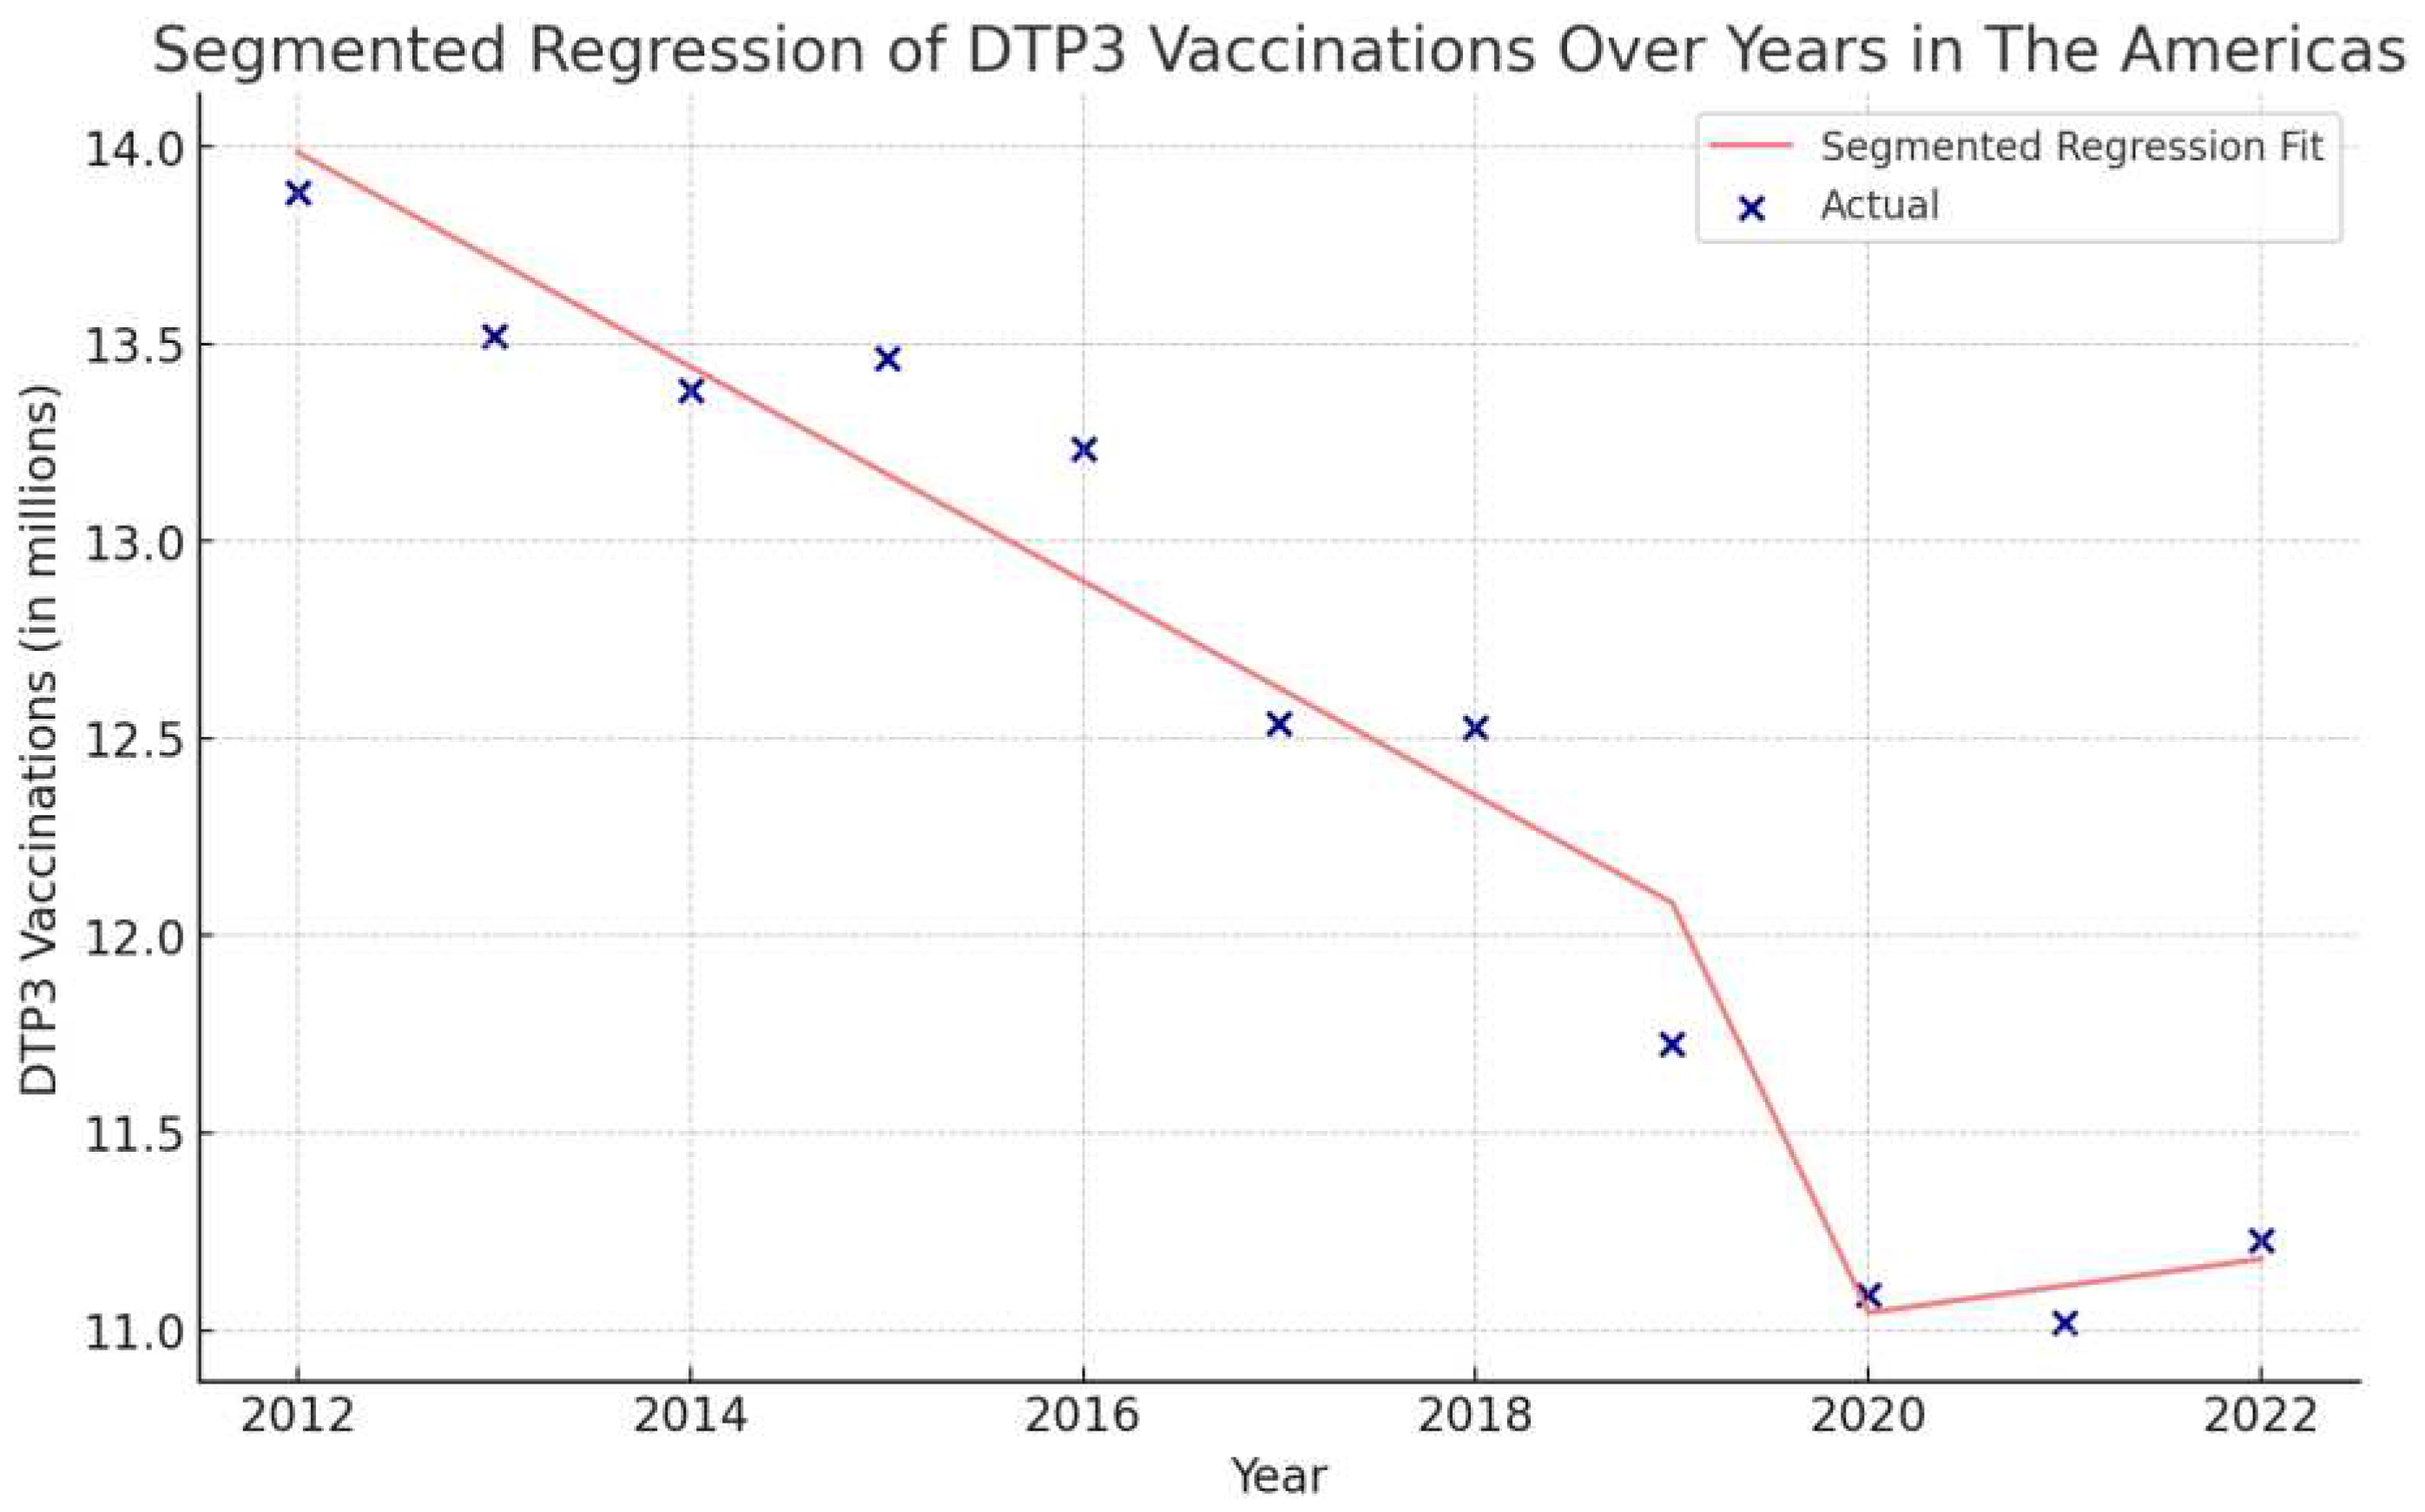
Figure 34.
Segmented Regression Analysis of DTP3 in North America, representing the actual DTP3 vaccination numbers (in dark blue) against the predicted values from the segmented regression (in light coral)
Figure 34.
Segmented Regression Analysis of DTP3 in North America, representing the actual DTP3 vaccination numbers (in dark blue) against the predicted values from the segmented regression (in light coral)
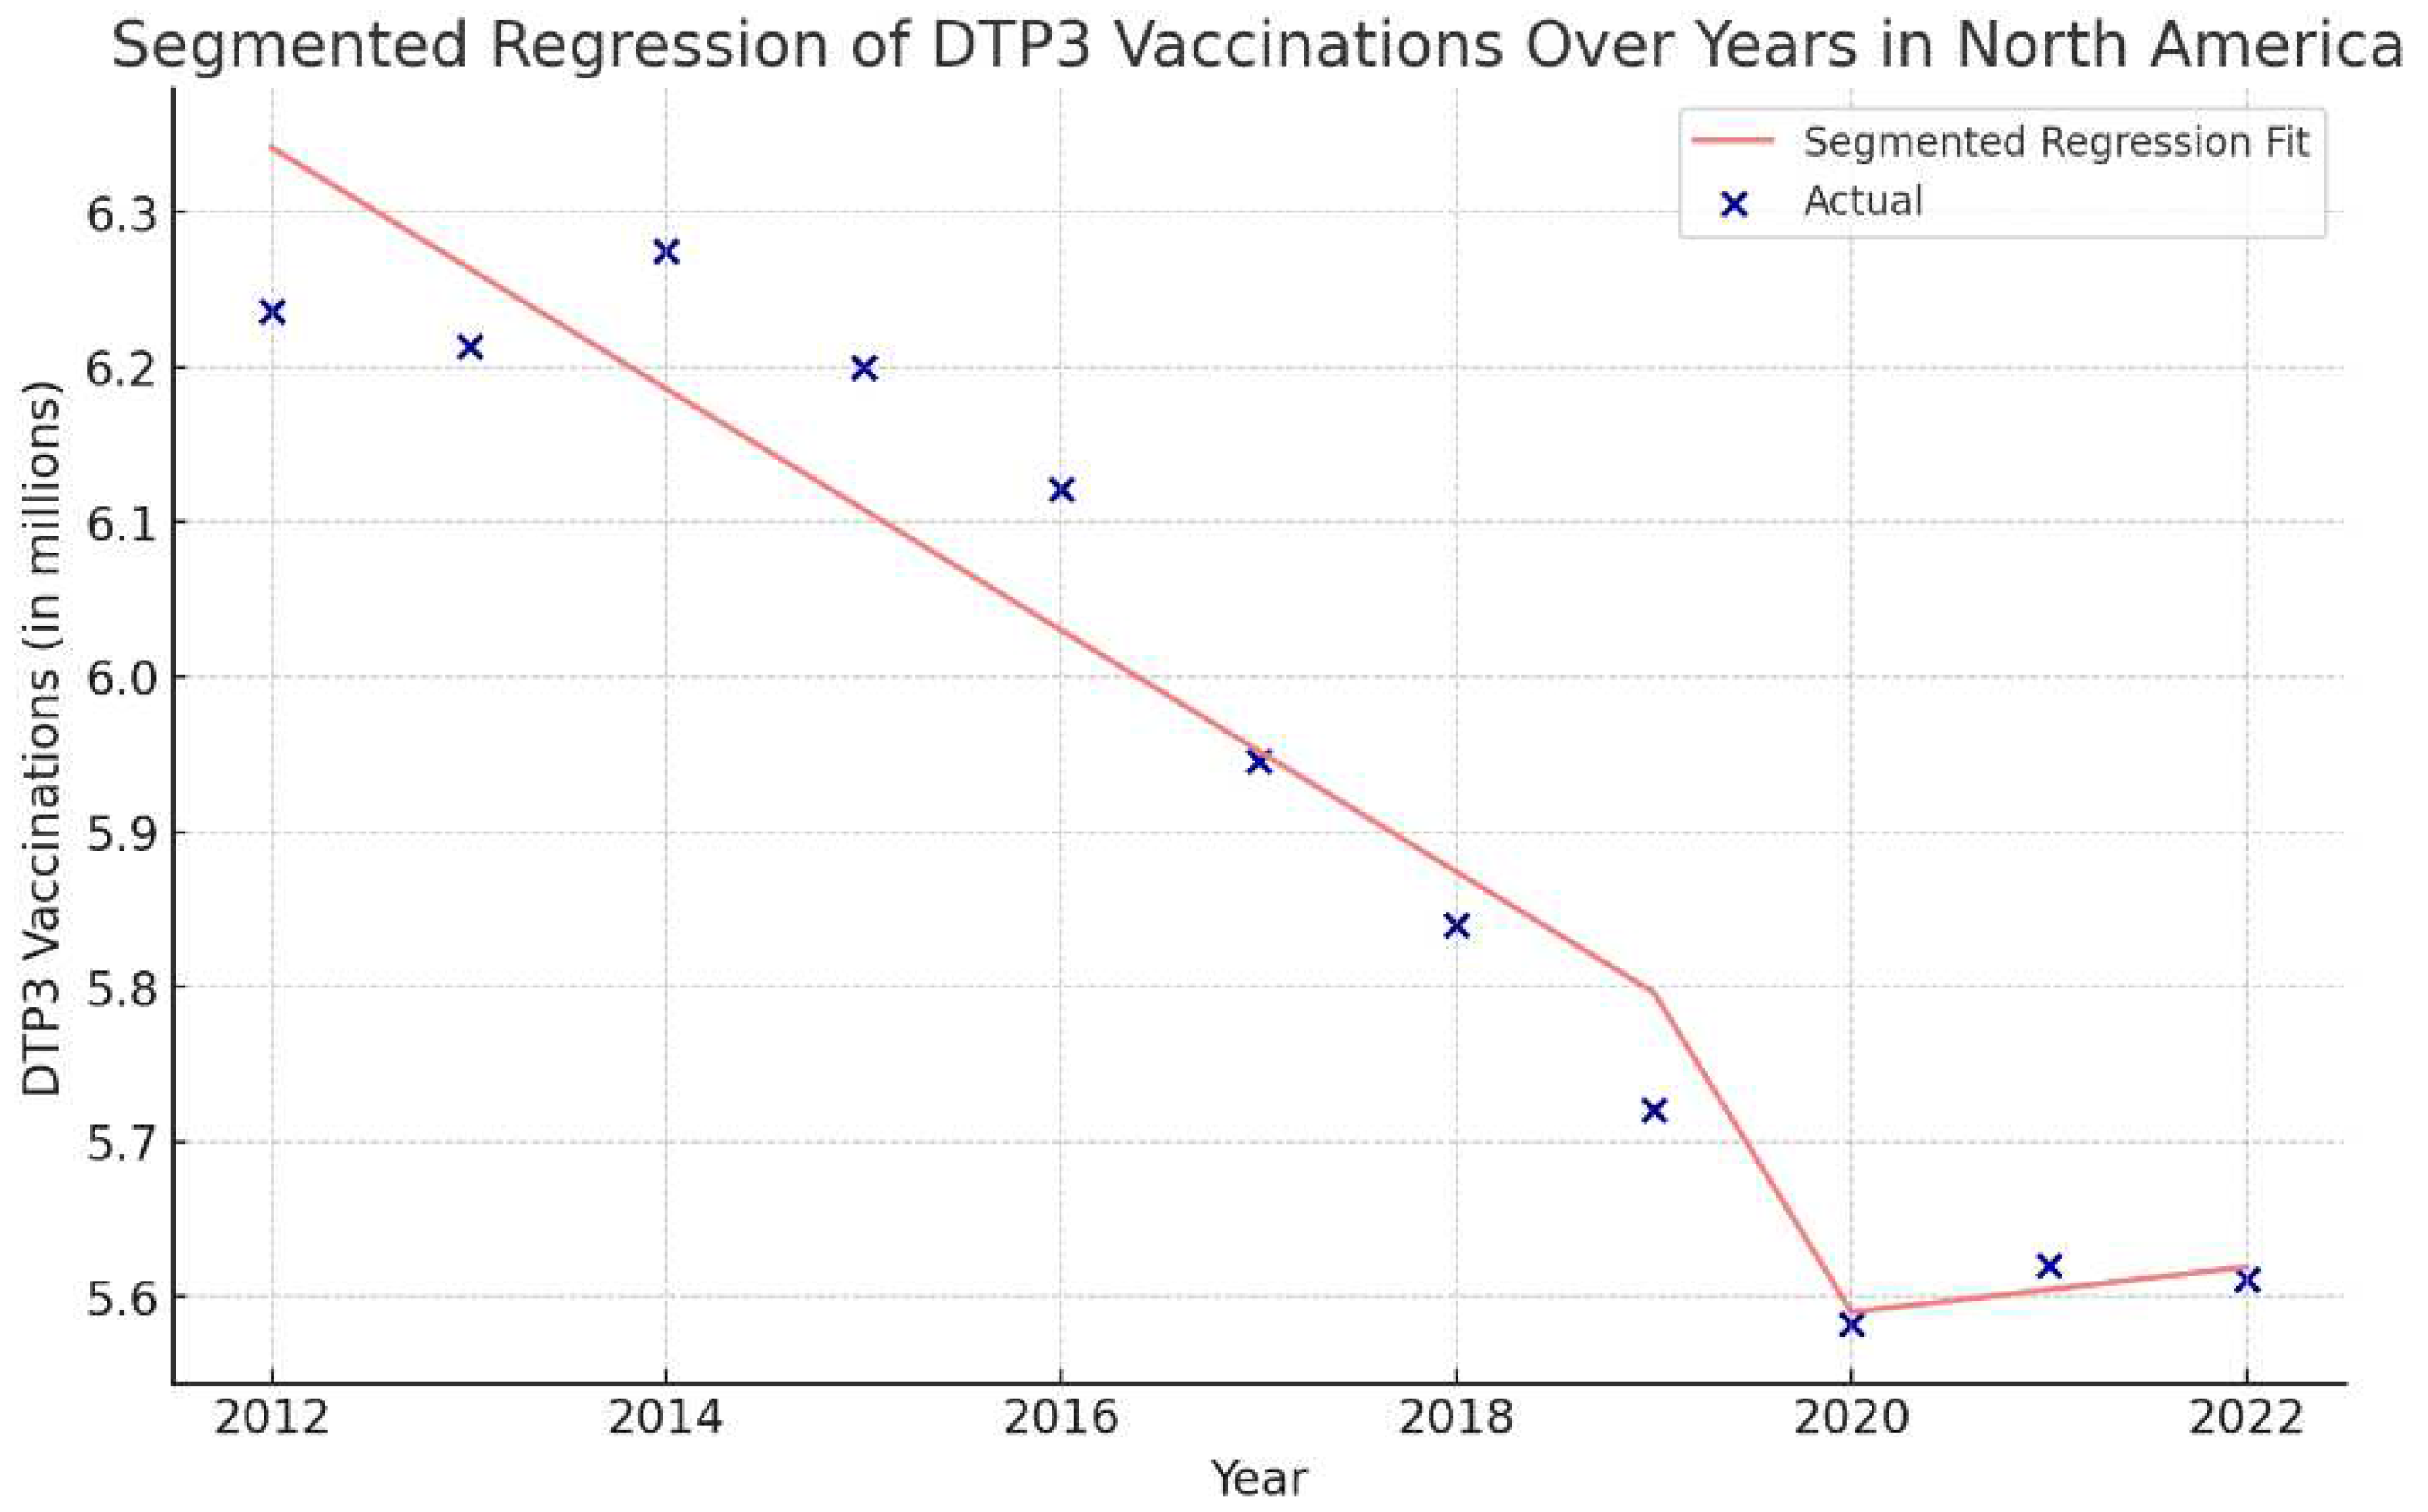
Figure 35.
Segmented Regression Analysis of DTP3 Vaccination in Latin America and the Caribbean. The actual DTP3 vaccination numbers (in dark blue) against the predicted values from the segmented regression (in light coral).
Figure 35.
Segmented Regression Analysis of DTP3 Vaccination in Latin America and the Caribbean. The actual DTP3 vaccination numbers (in dark blue) against the predicted values from the segmented regression (in light coral).
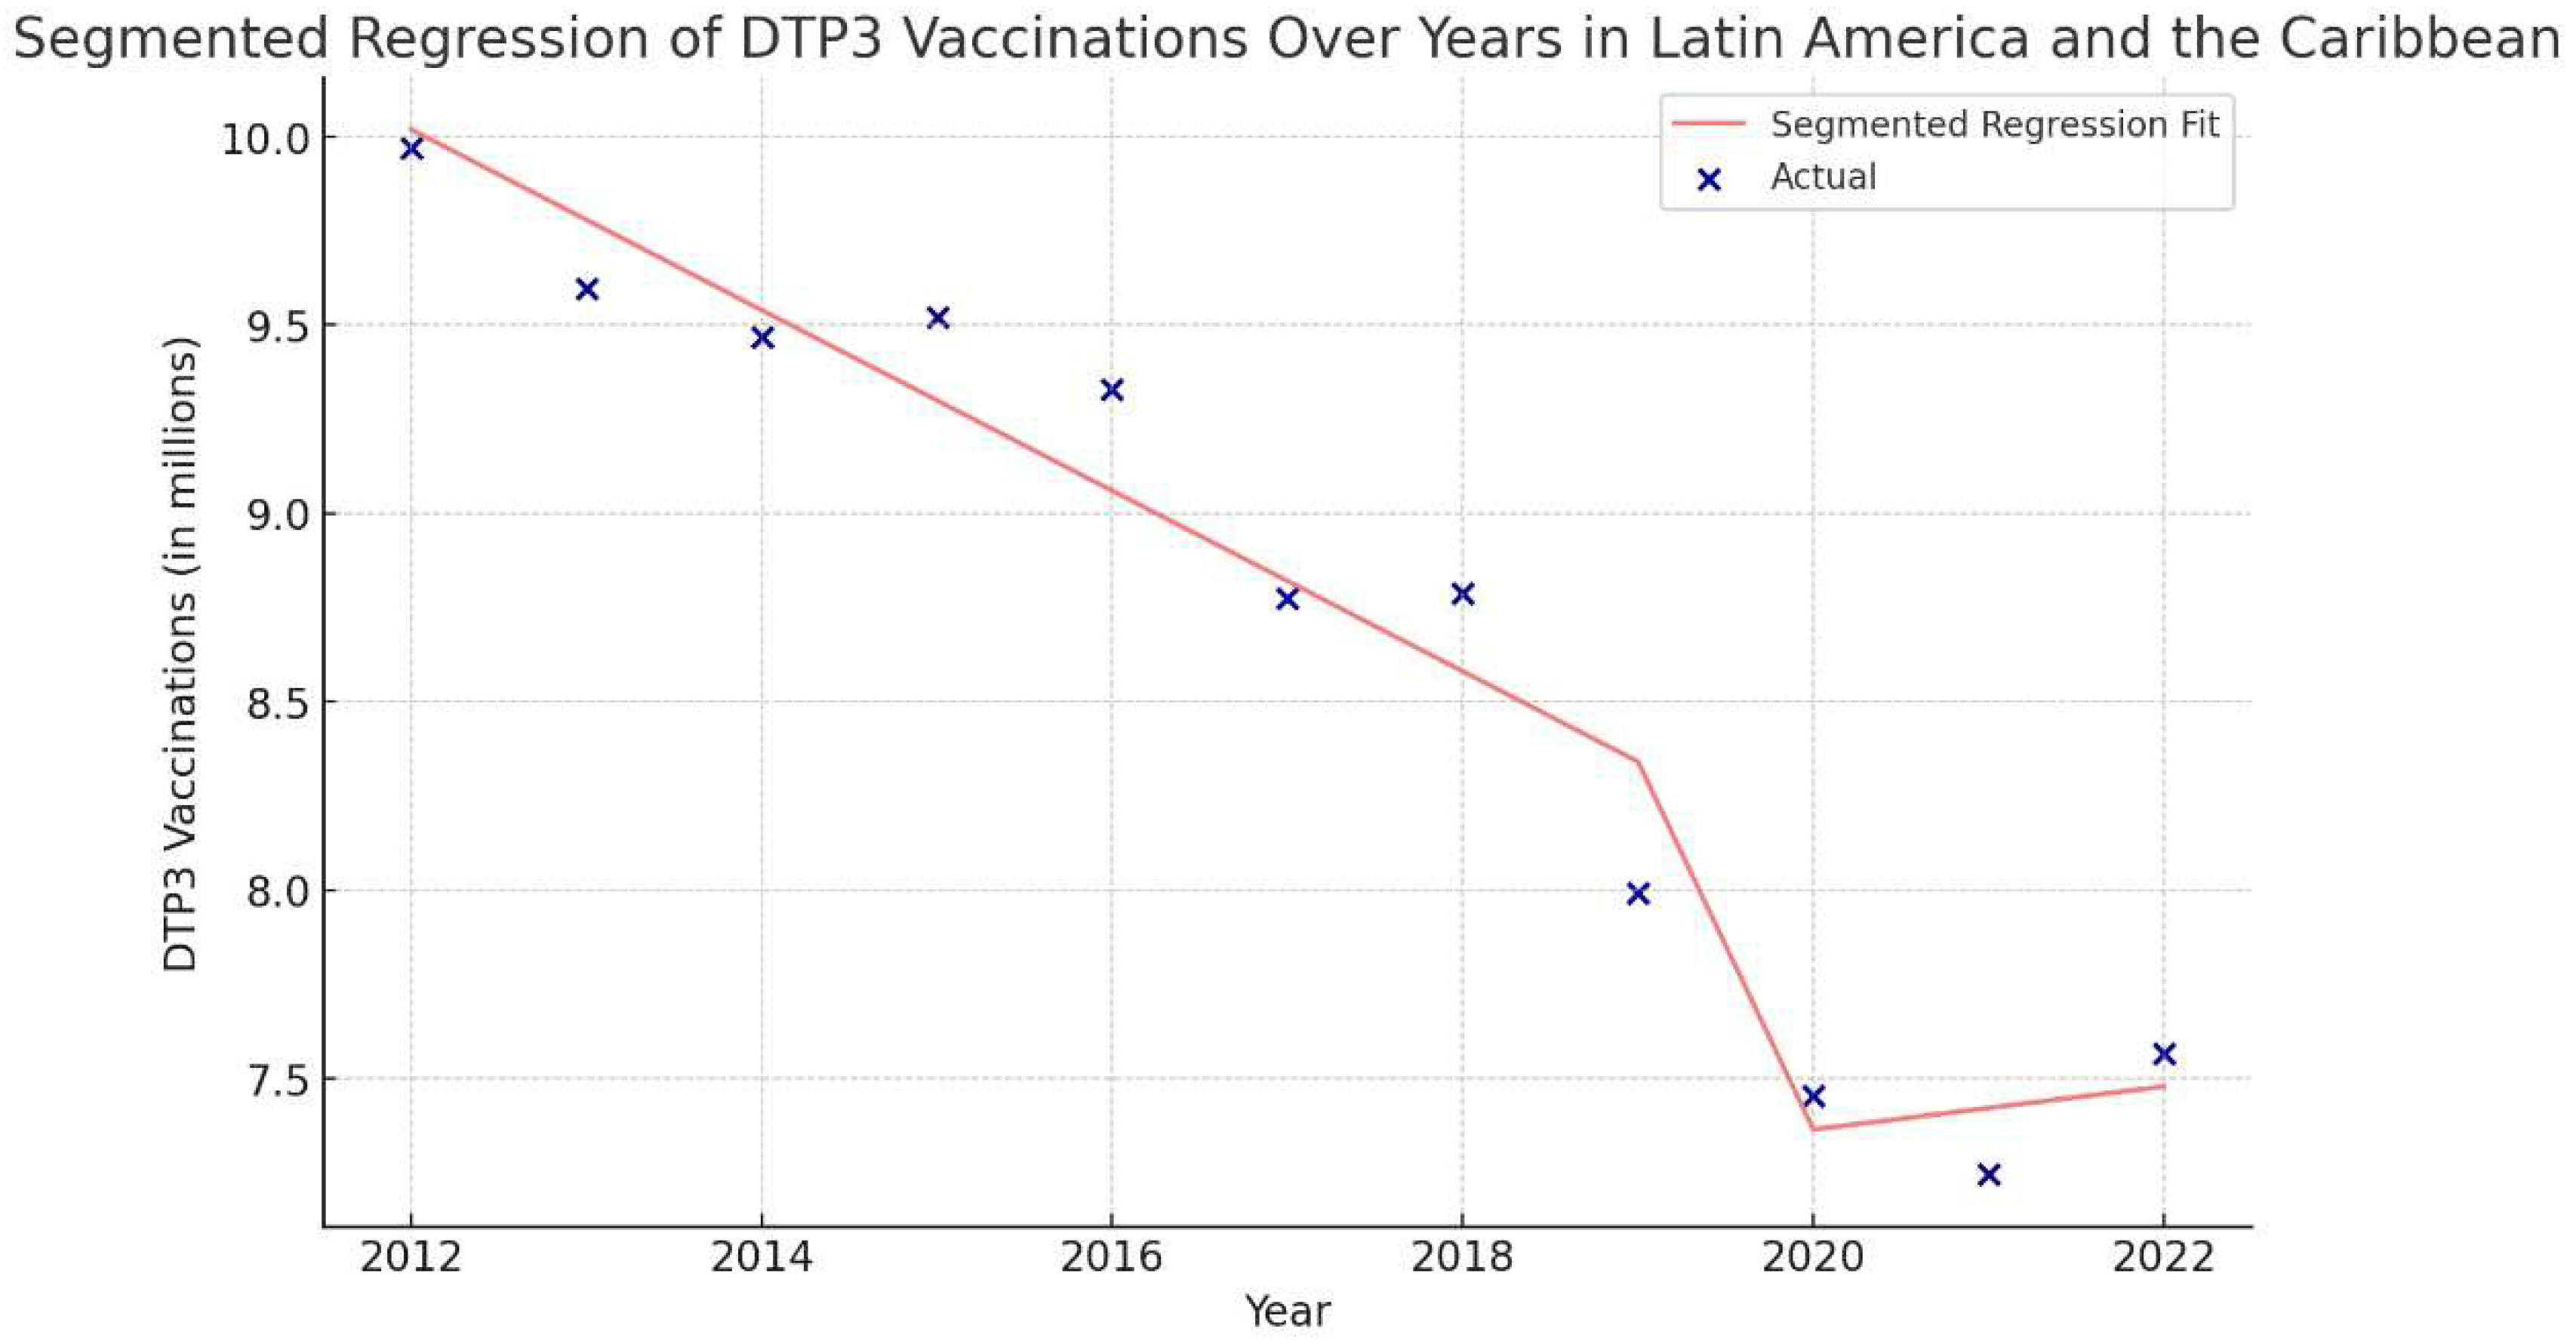
Figure 36.
Segmented Regression Analysis of DTP3 vaccination in Central America. The actual DTP3 (in dark blue) against the predicted values from the segmented regression (in light coral).
Figure 36.
Segmented Regression Analysis of DTP3 vaccination in Central America. The actual DTP3 (in dark blue) against the predicted values from the segmented regression (in light coral).
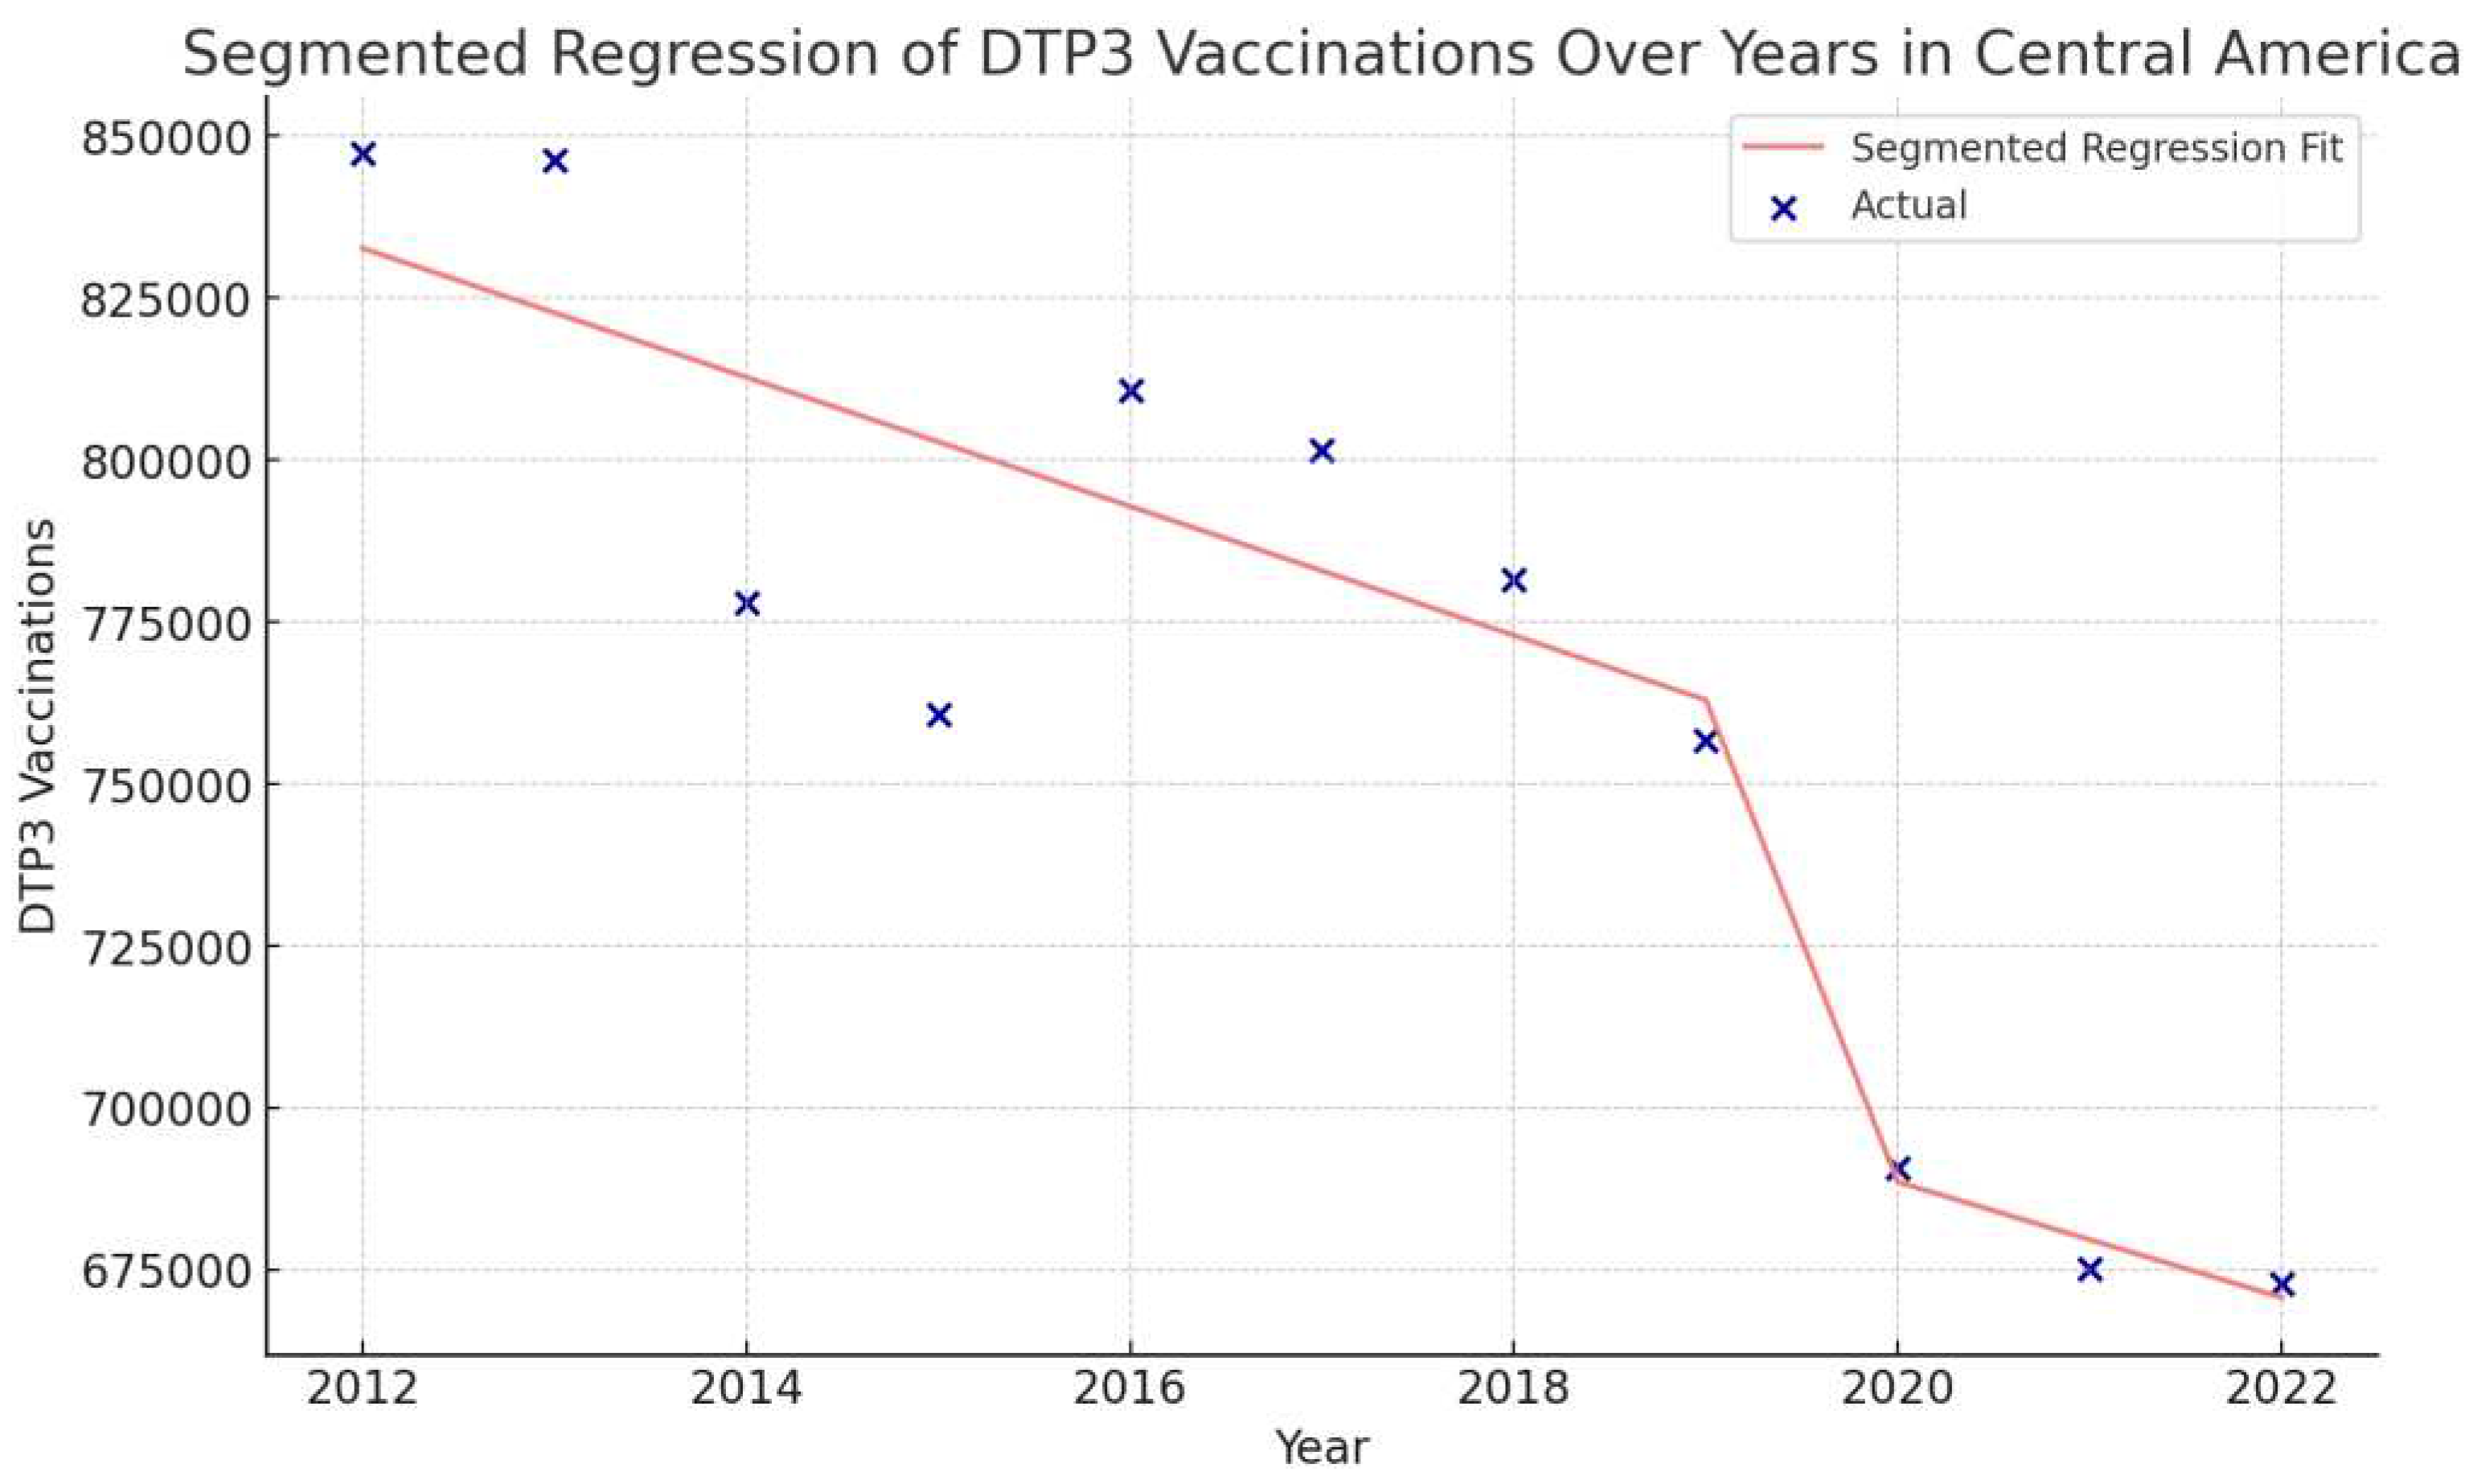
Figure 37.
Segmented Regression Analysis of DTP3 Vaccination in the Caribbean. The actual DTP3 (in dark blue) against the predicted values from the segmented regression (in light coral).
Figure 37.
Segmented Regression Analysis of DTP3 Vaccination in the Caribbean. The actual DTP3 (in dark blue) against the predicted values from the segmented regression (in light coral).
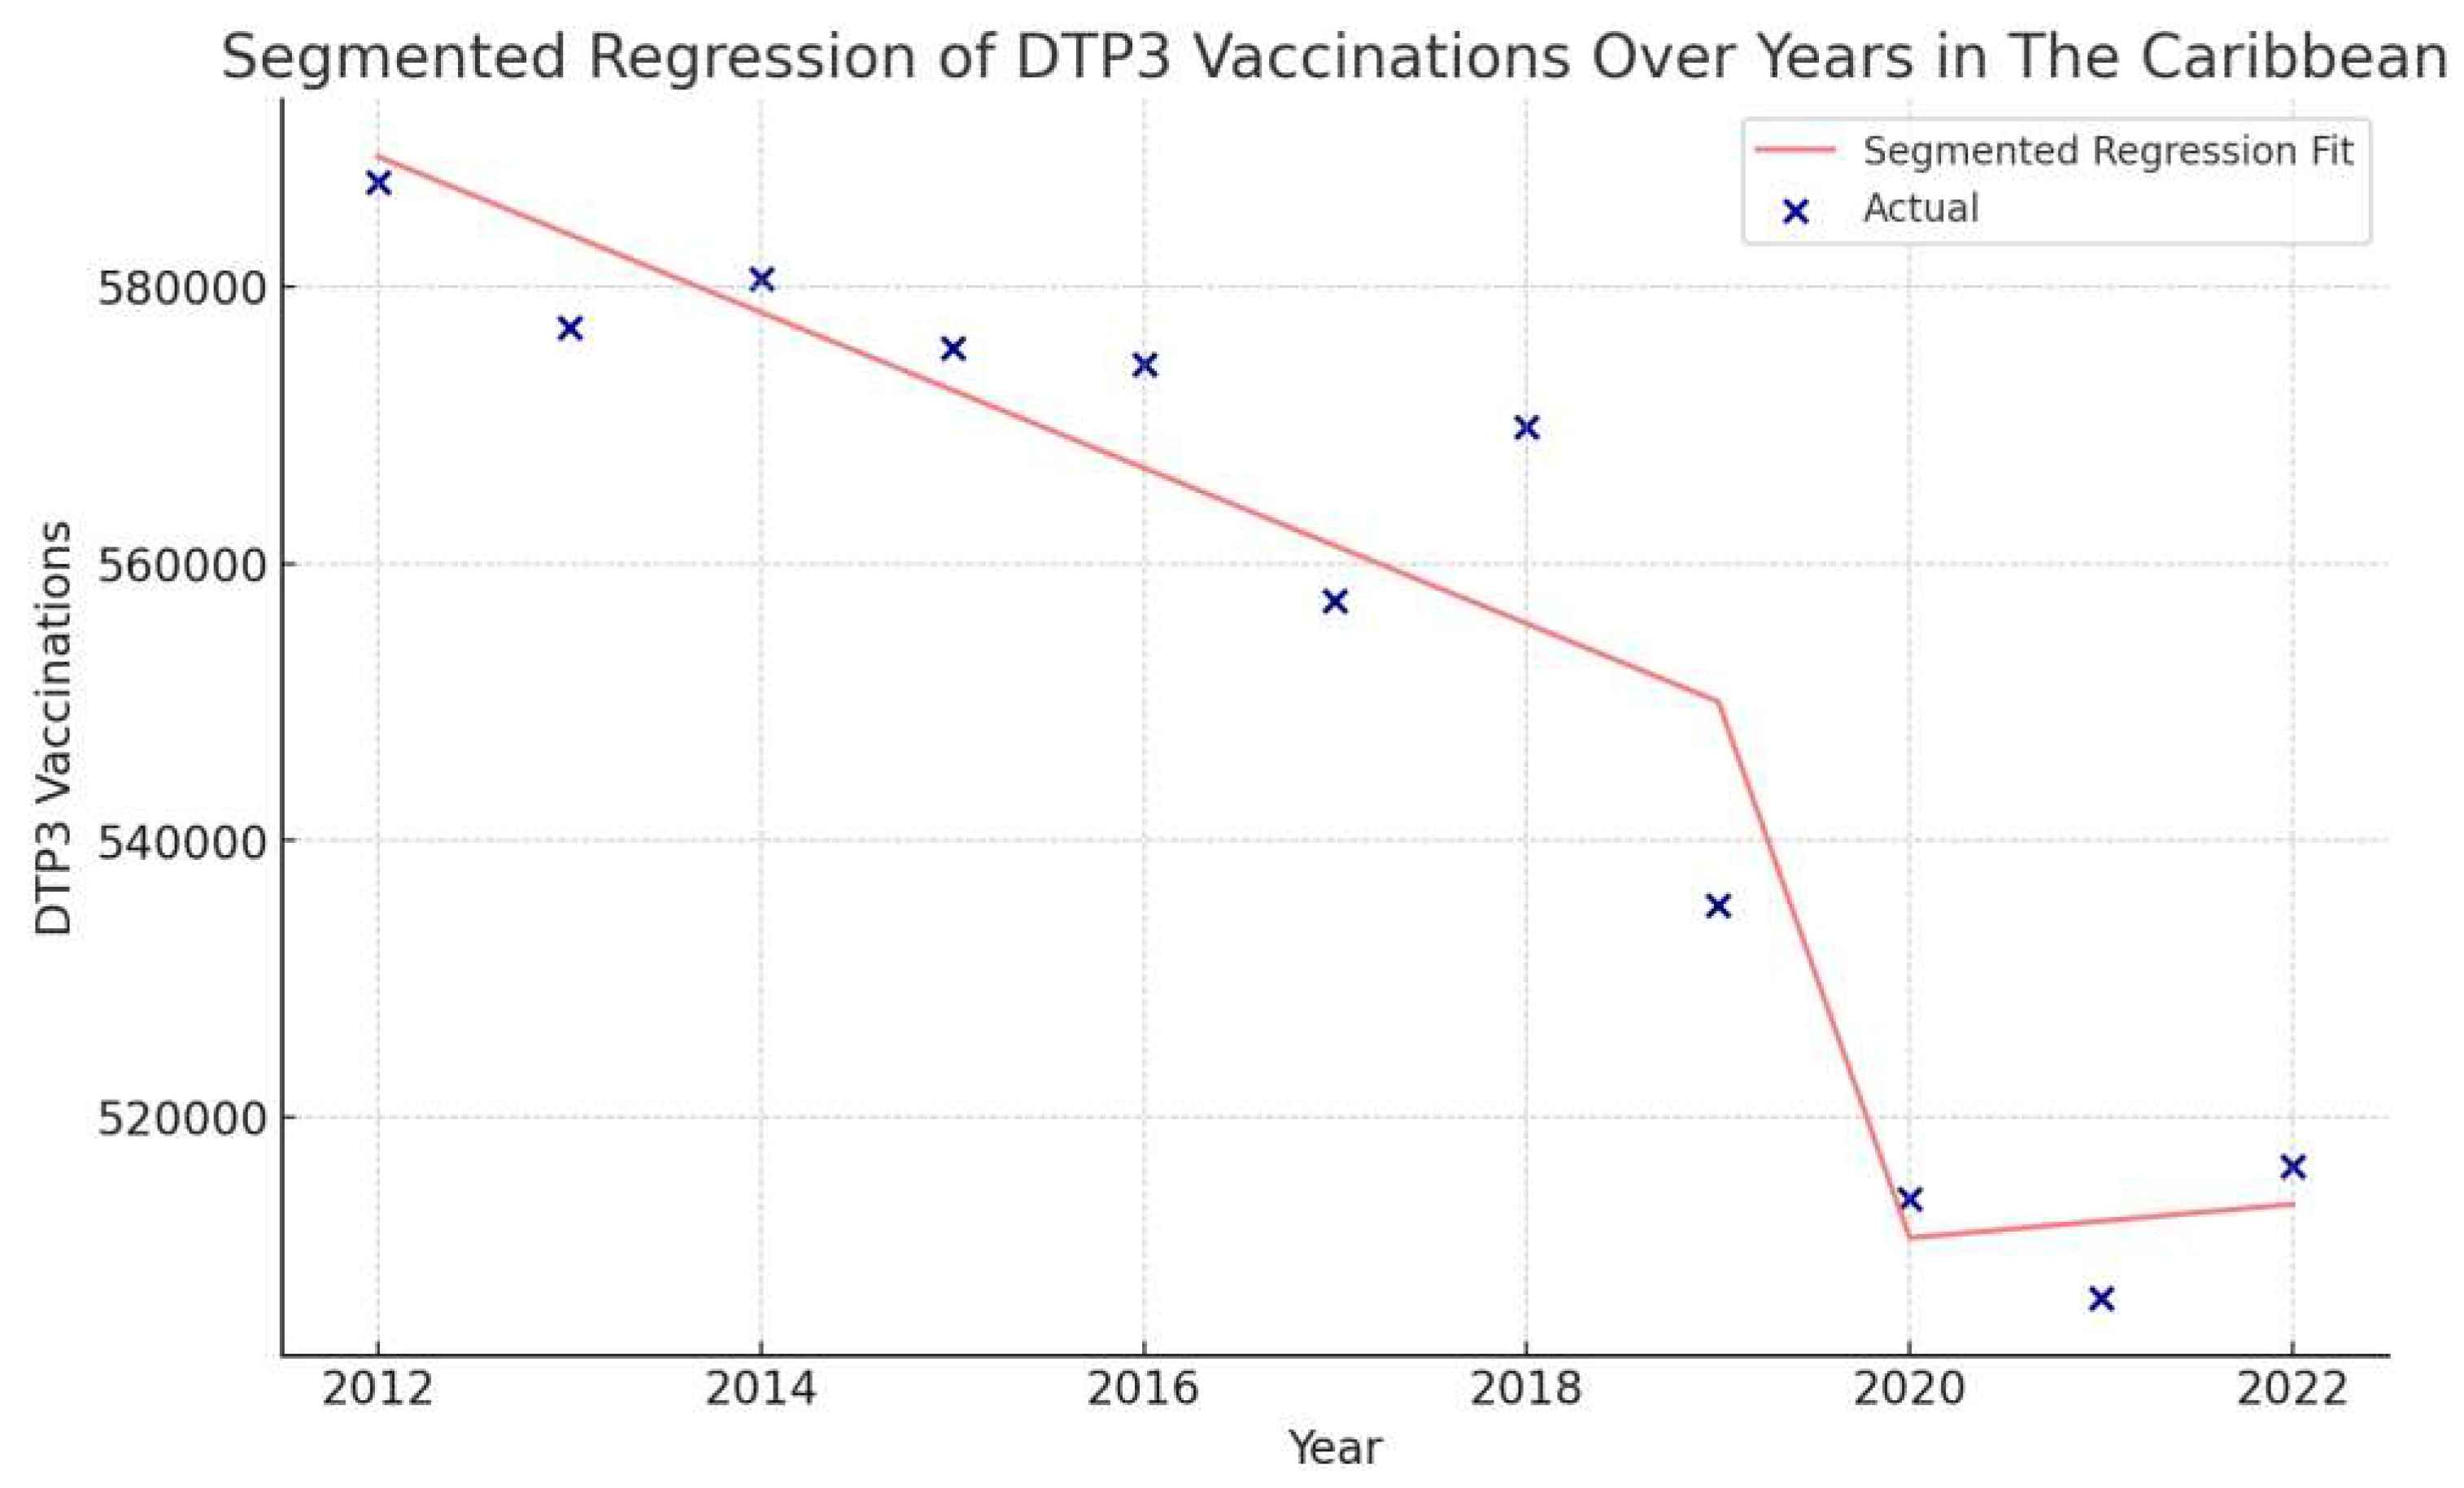
Figure 38.
Segmented Regression Analysis of DTP3 Vaccination in South America. The actual DTP3 numbers (in dark blue) are represented against the predicted values from the segmented regression (in light coral).
Figure 38.
Segmented Regression Analysis of DTP3 Vaccination in South America. The actual DTP3 numbers (in dark blue) are represented against the predicted values from the segmented regression (in light coral).
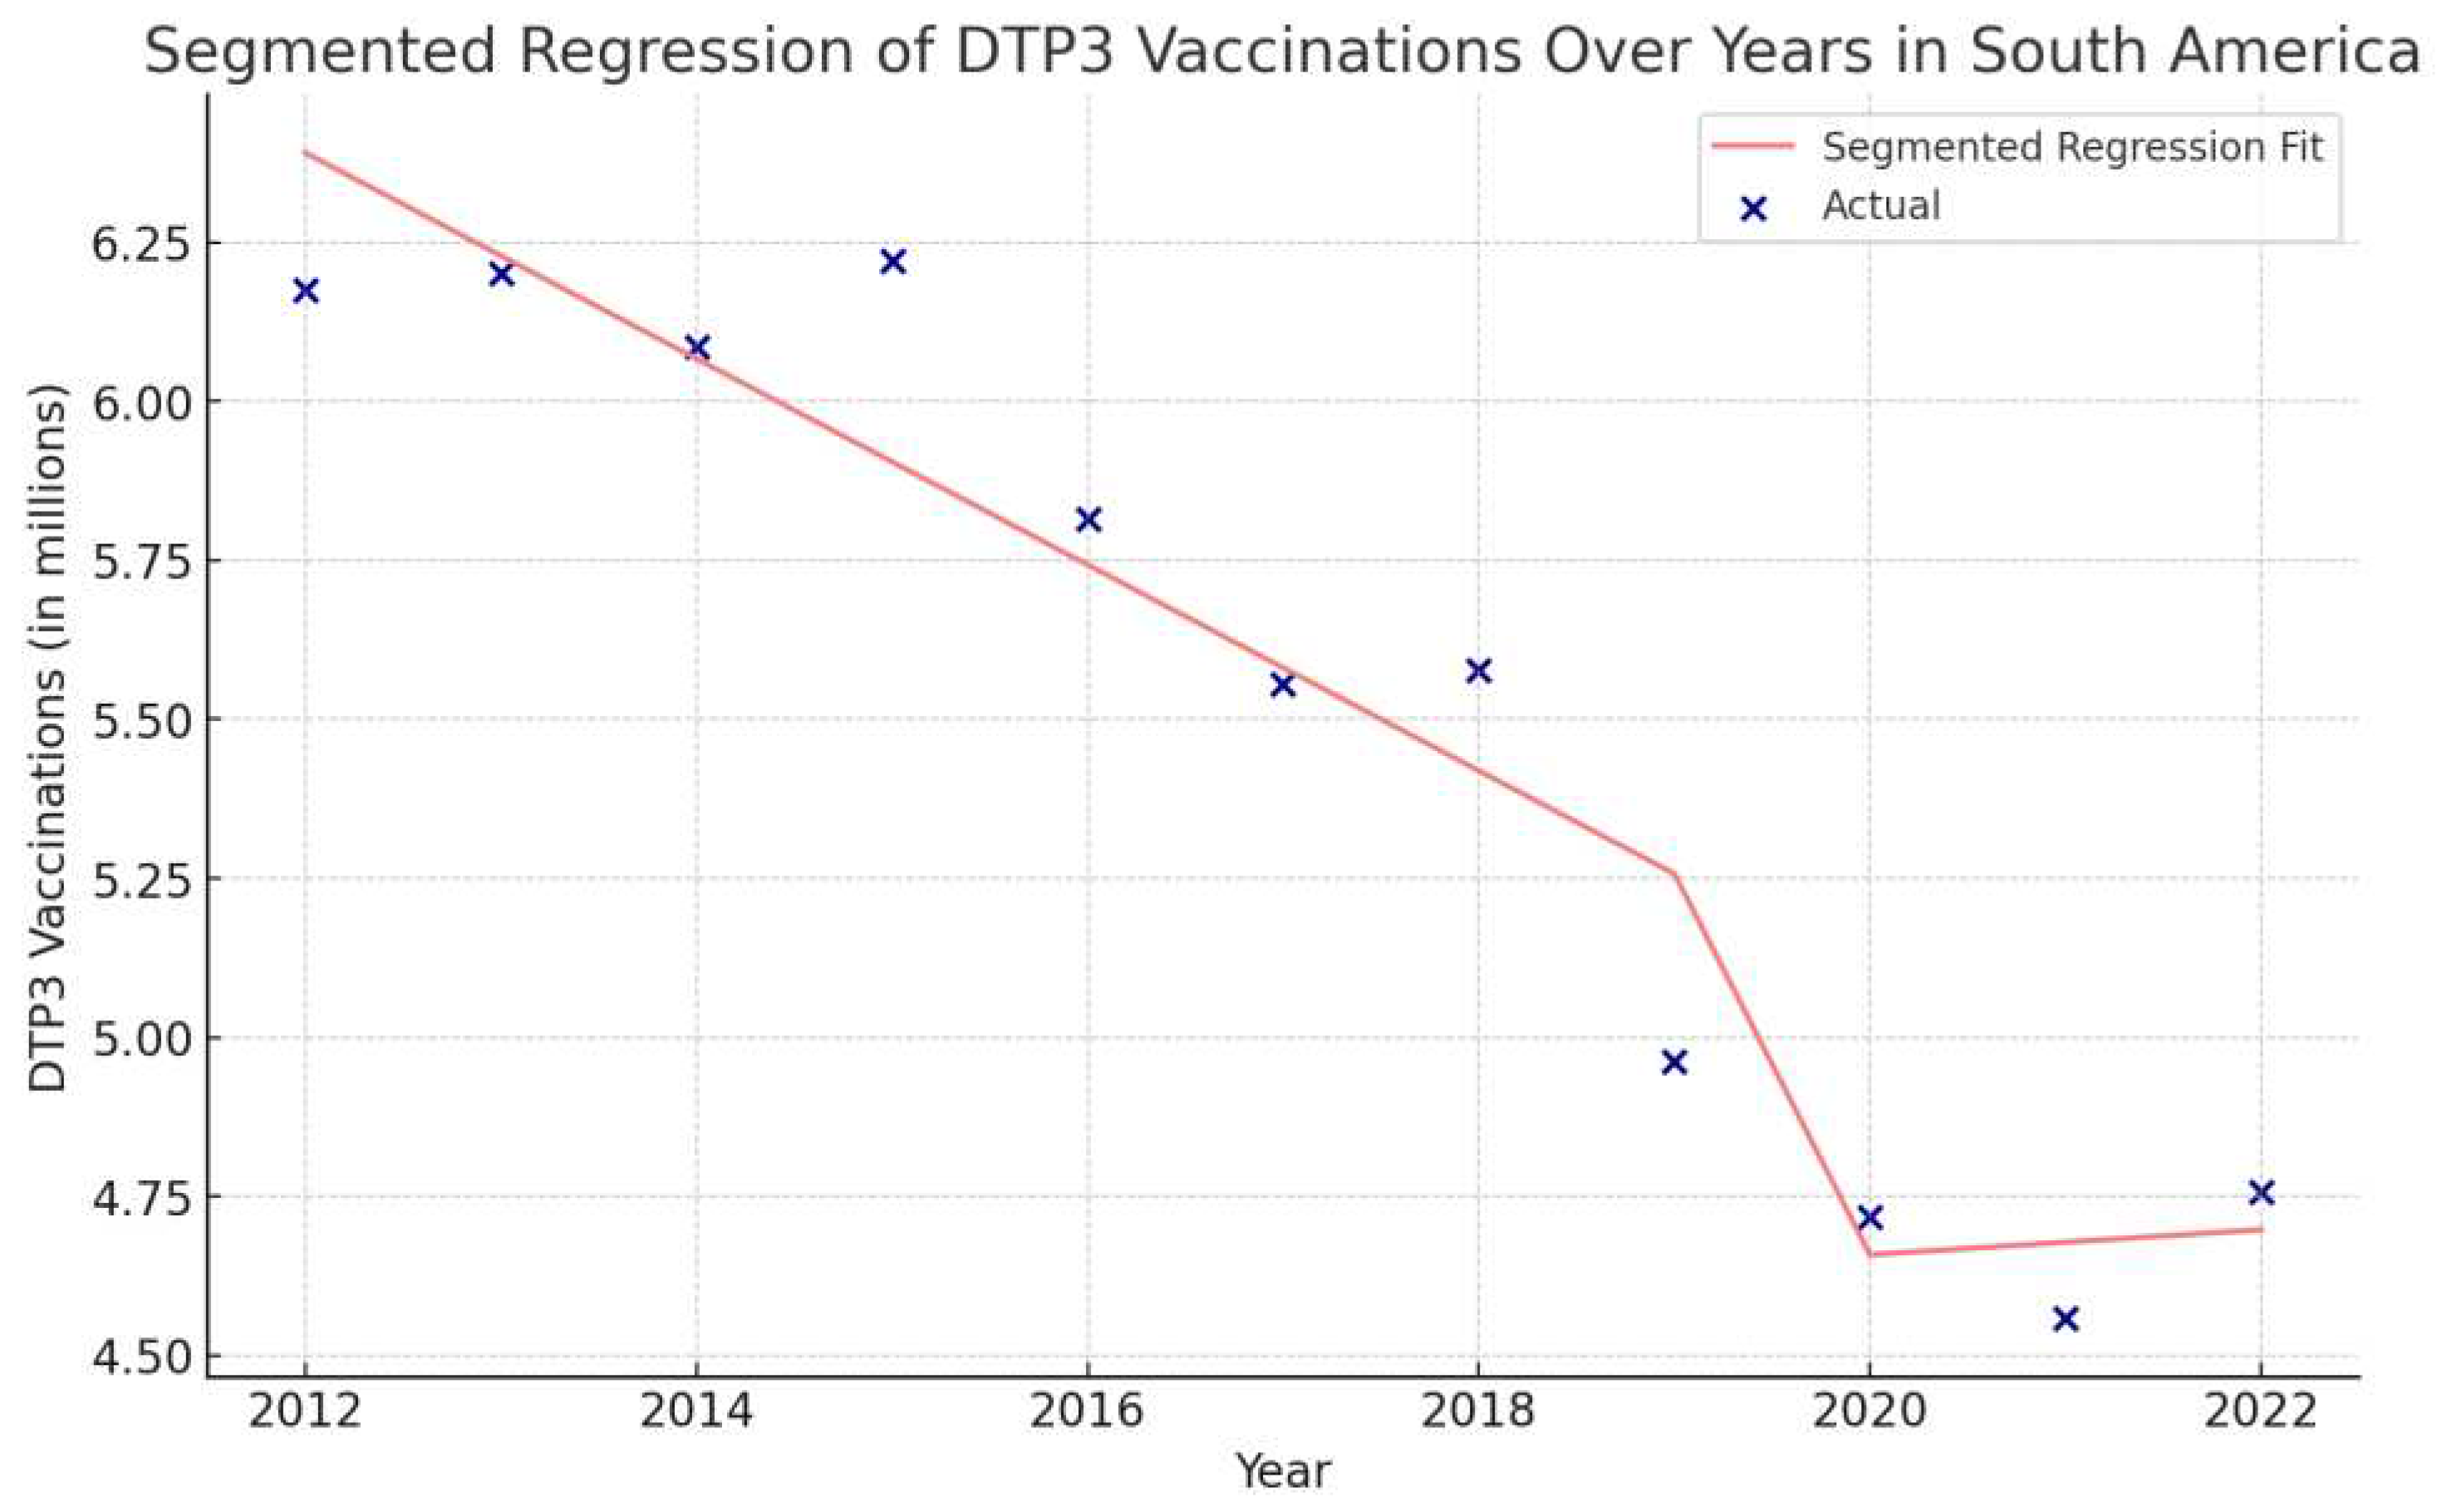
Figure 39.
Segmented Regression Analysis of DTP3 Vaccination in Belize, representing the actual number of DTP3 vaccinations (in blue) and the fitted values from the segmented regression (in red).
Figure 39.
Segmented Regression Analysis of DTP3 Vaccination in Belize, representing the actual number of DTP3 vaccinations (in blue) and the fitted values from the segmented regression (in red).
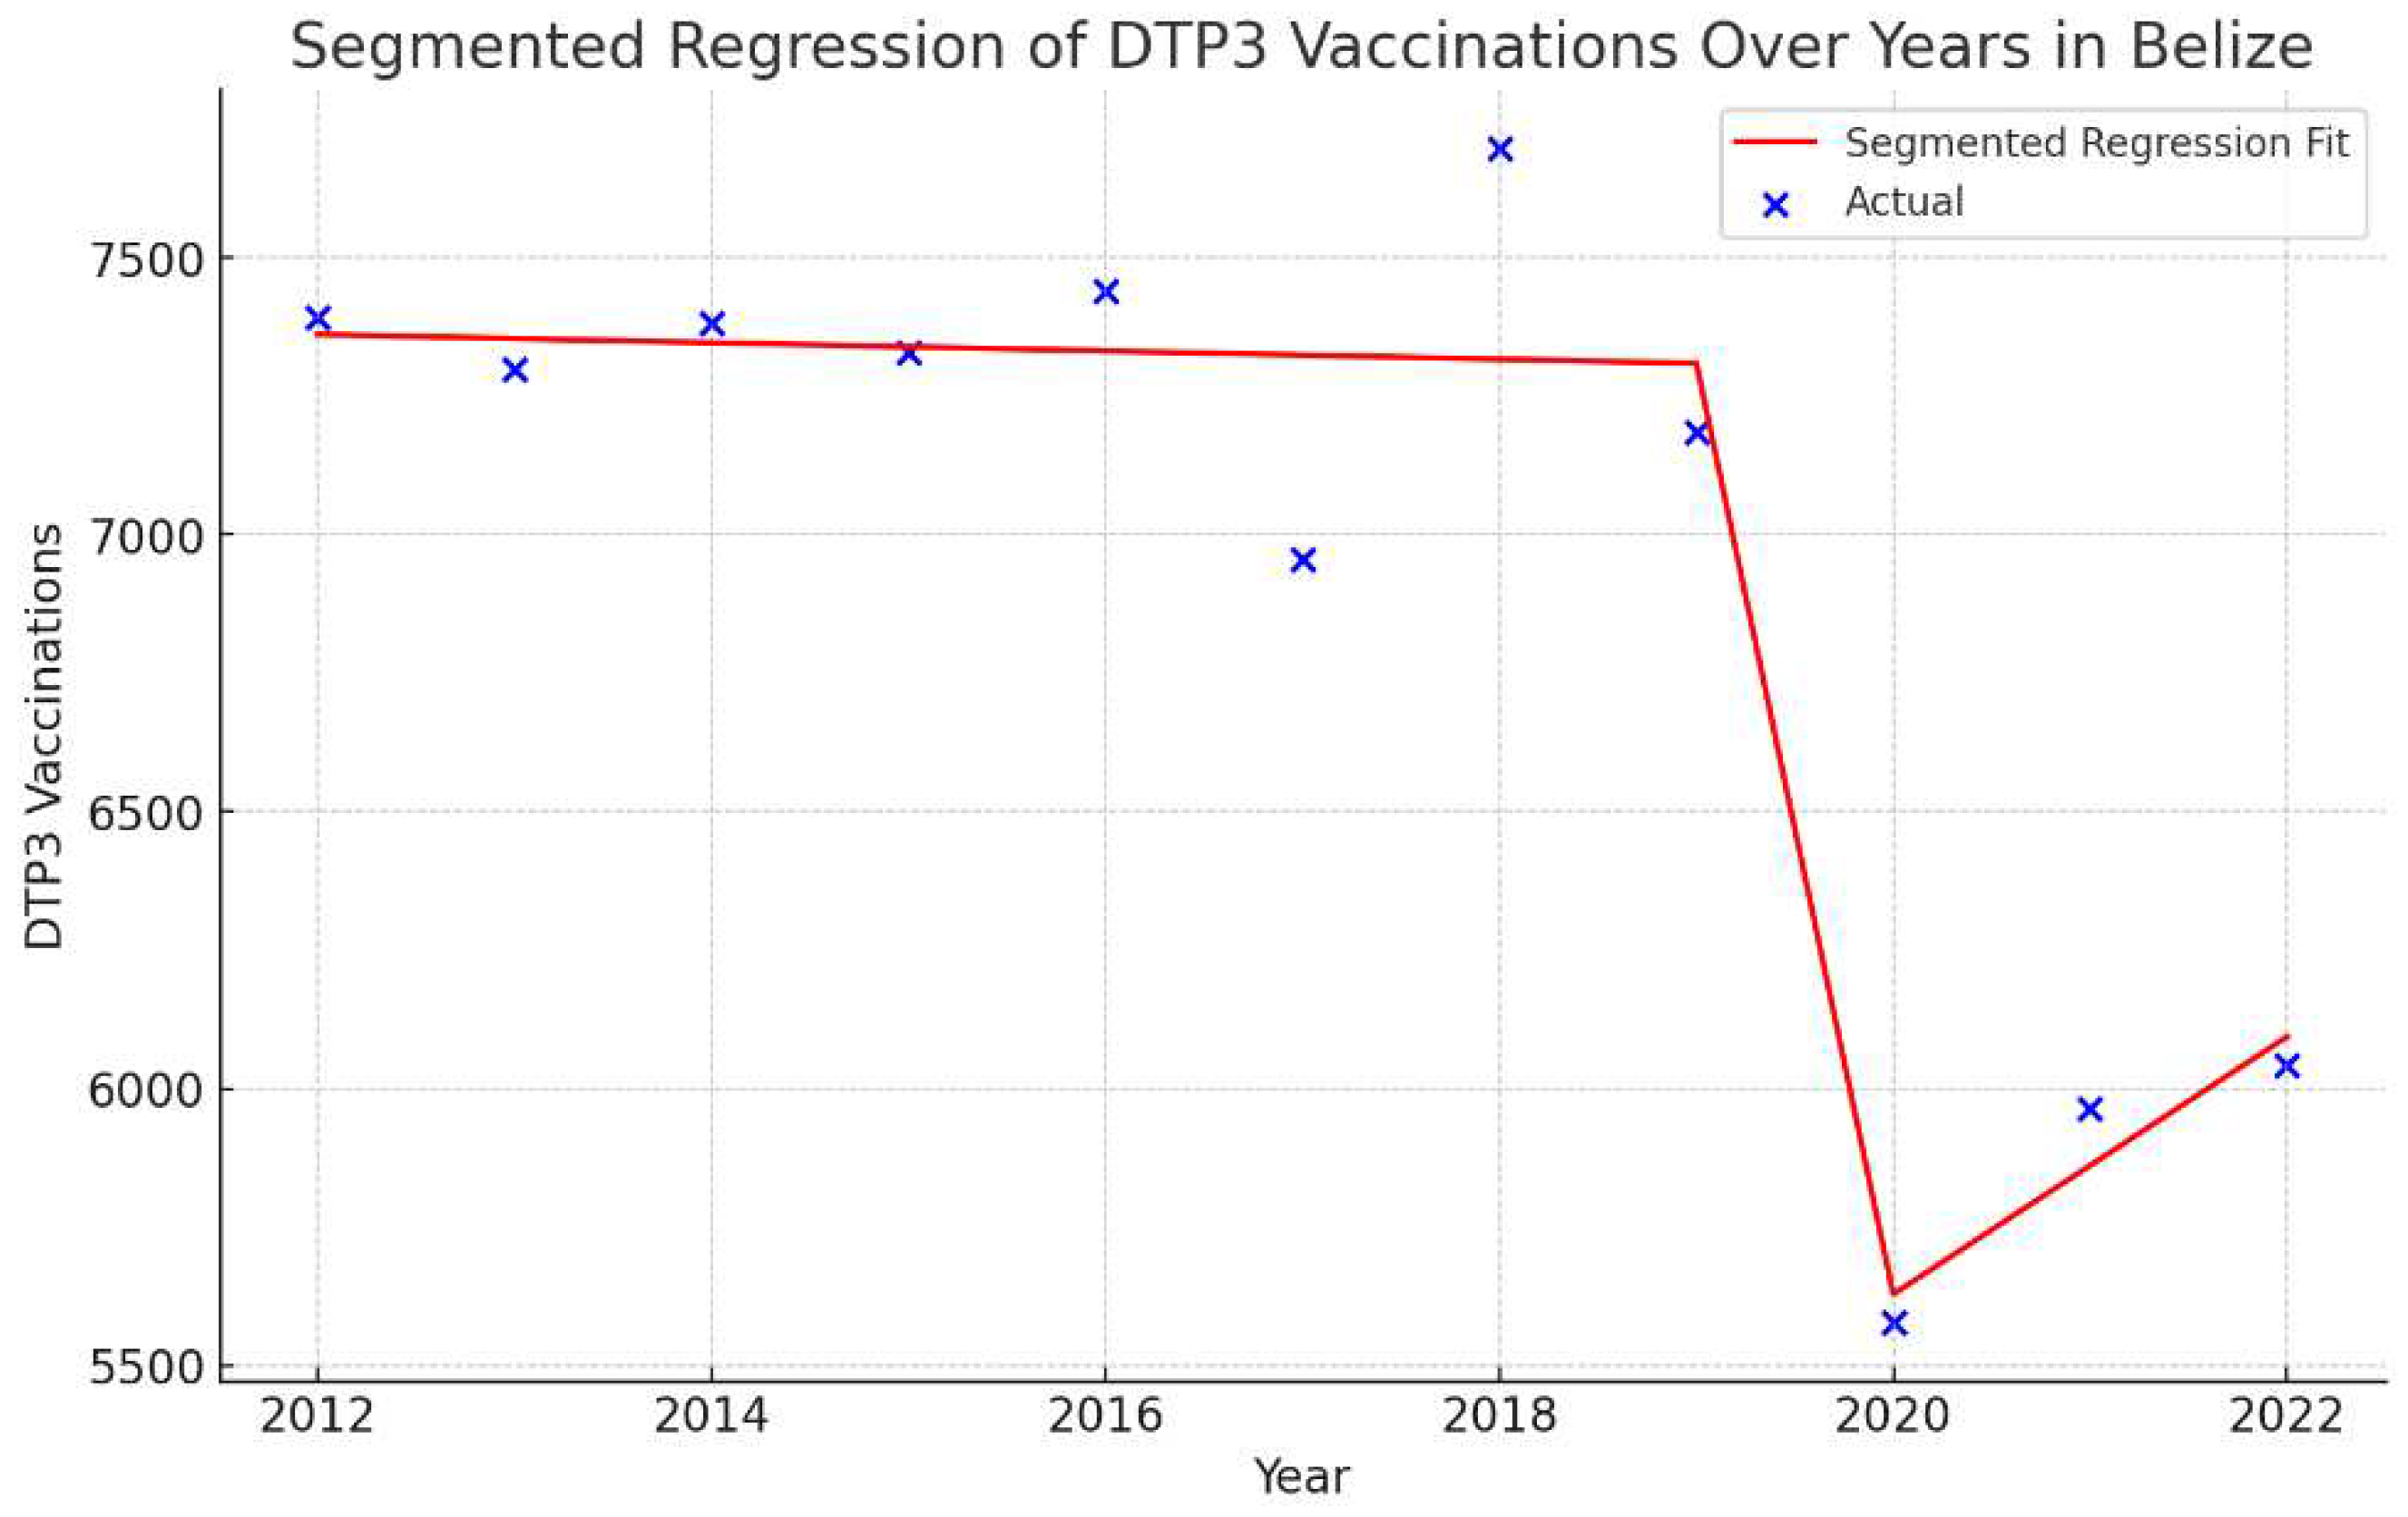
Figure 40.
Segmented Regression Analysis of DTP3 vaccinations in Grenada represents the number of DTP3 vaccinations (in green) and the fitted values from the segmented regression (in orange.
Figure 40.
Segmented Regression Analysis of DTP3 vaccinations in Grenada represents the number of DTP3 vaccinations (in green) and the fitted values from the segmented regression (in orange.
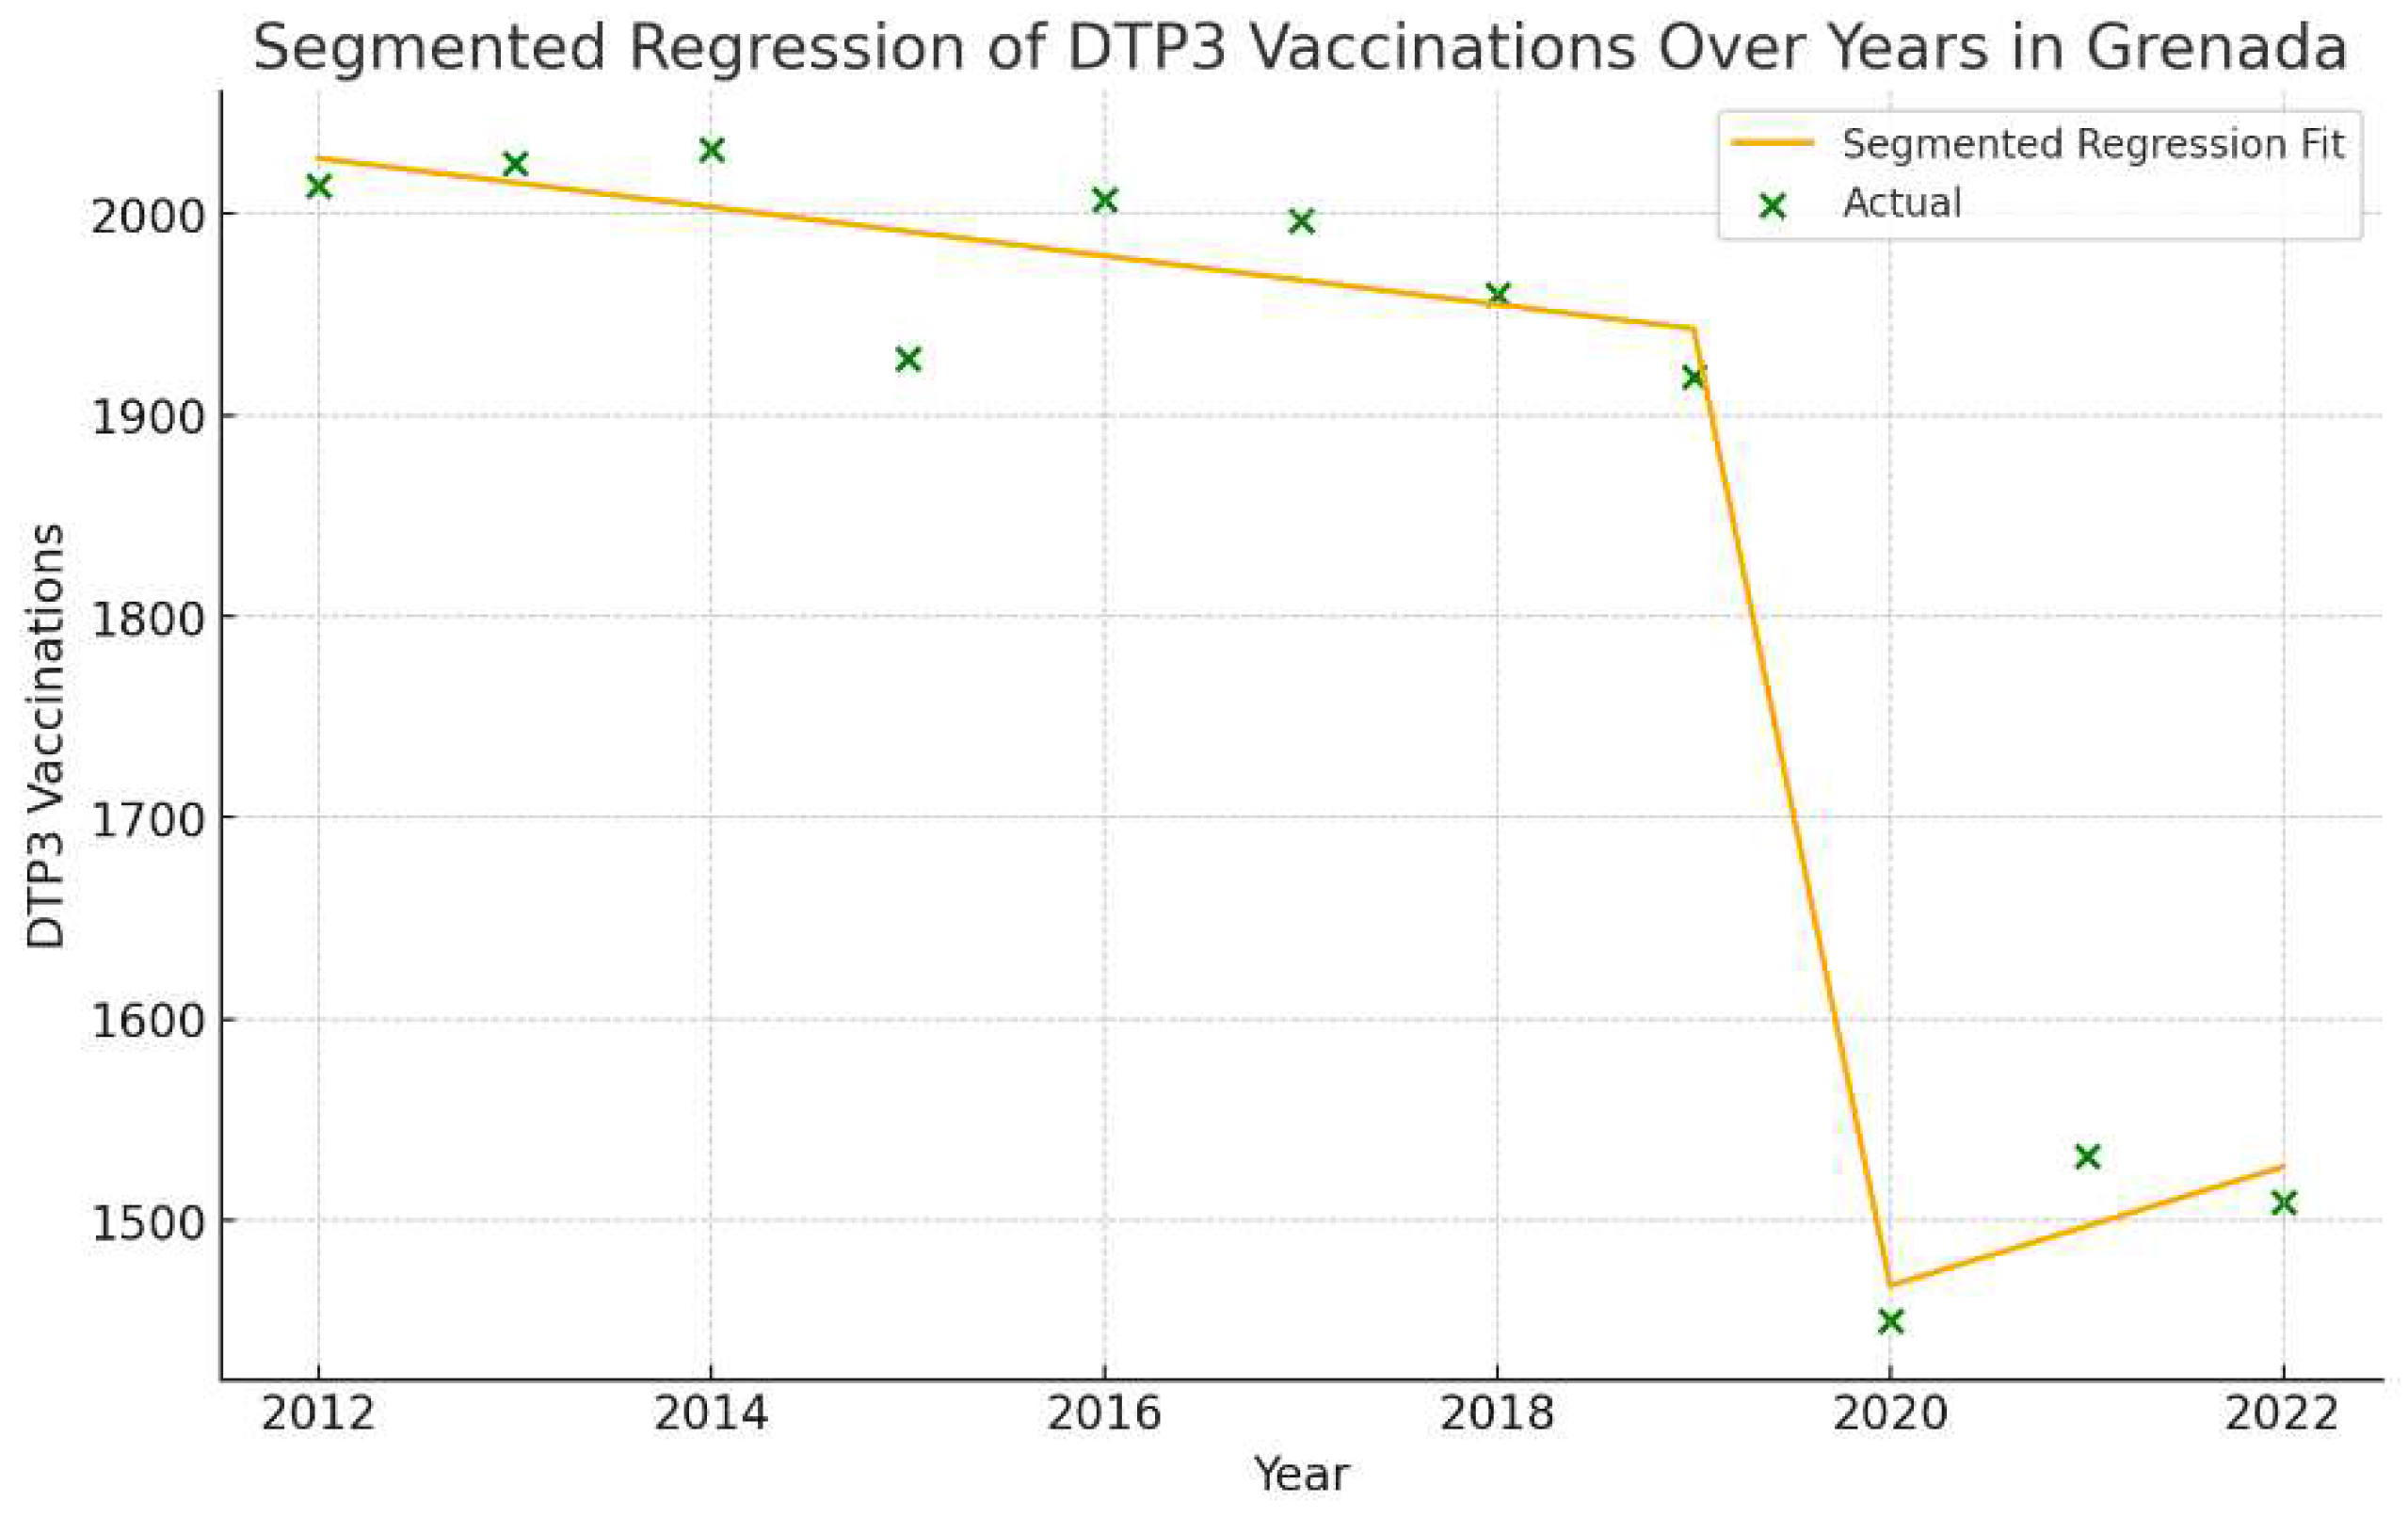
Figure 41.
Segmented Regression Analysis of DTP3 vaccinations in Peru representing the actual DTP3 vaccination numbers (in purple) and the fitted values from the segmented regression (in gold).
Figure 41.
Segmented Regression Analysis of DTP3 vaccinations in Peru representing the actual DTP3 vaccination numbers (in purple) and the fitted values from the segmented regression (in gold).
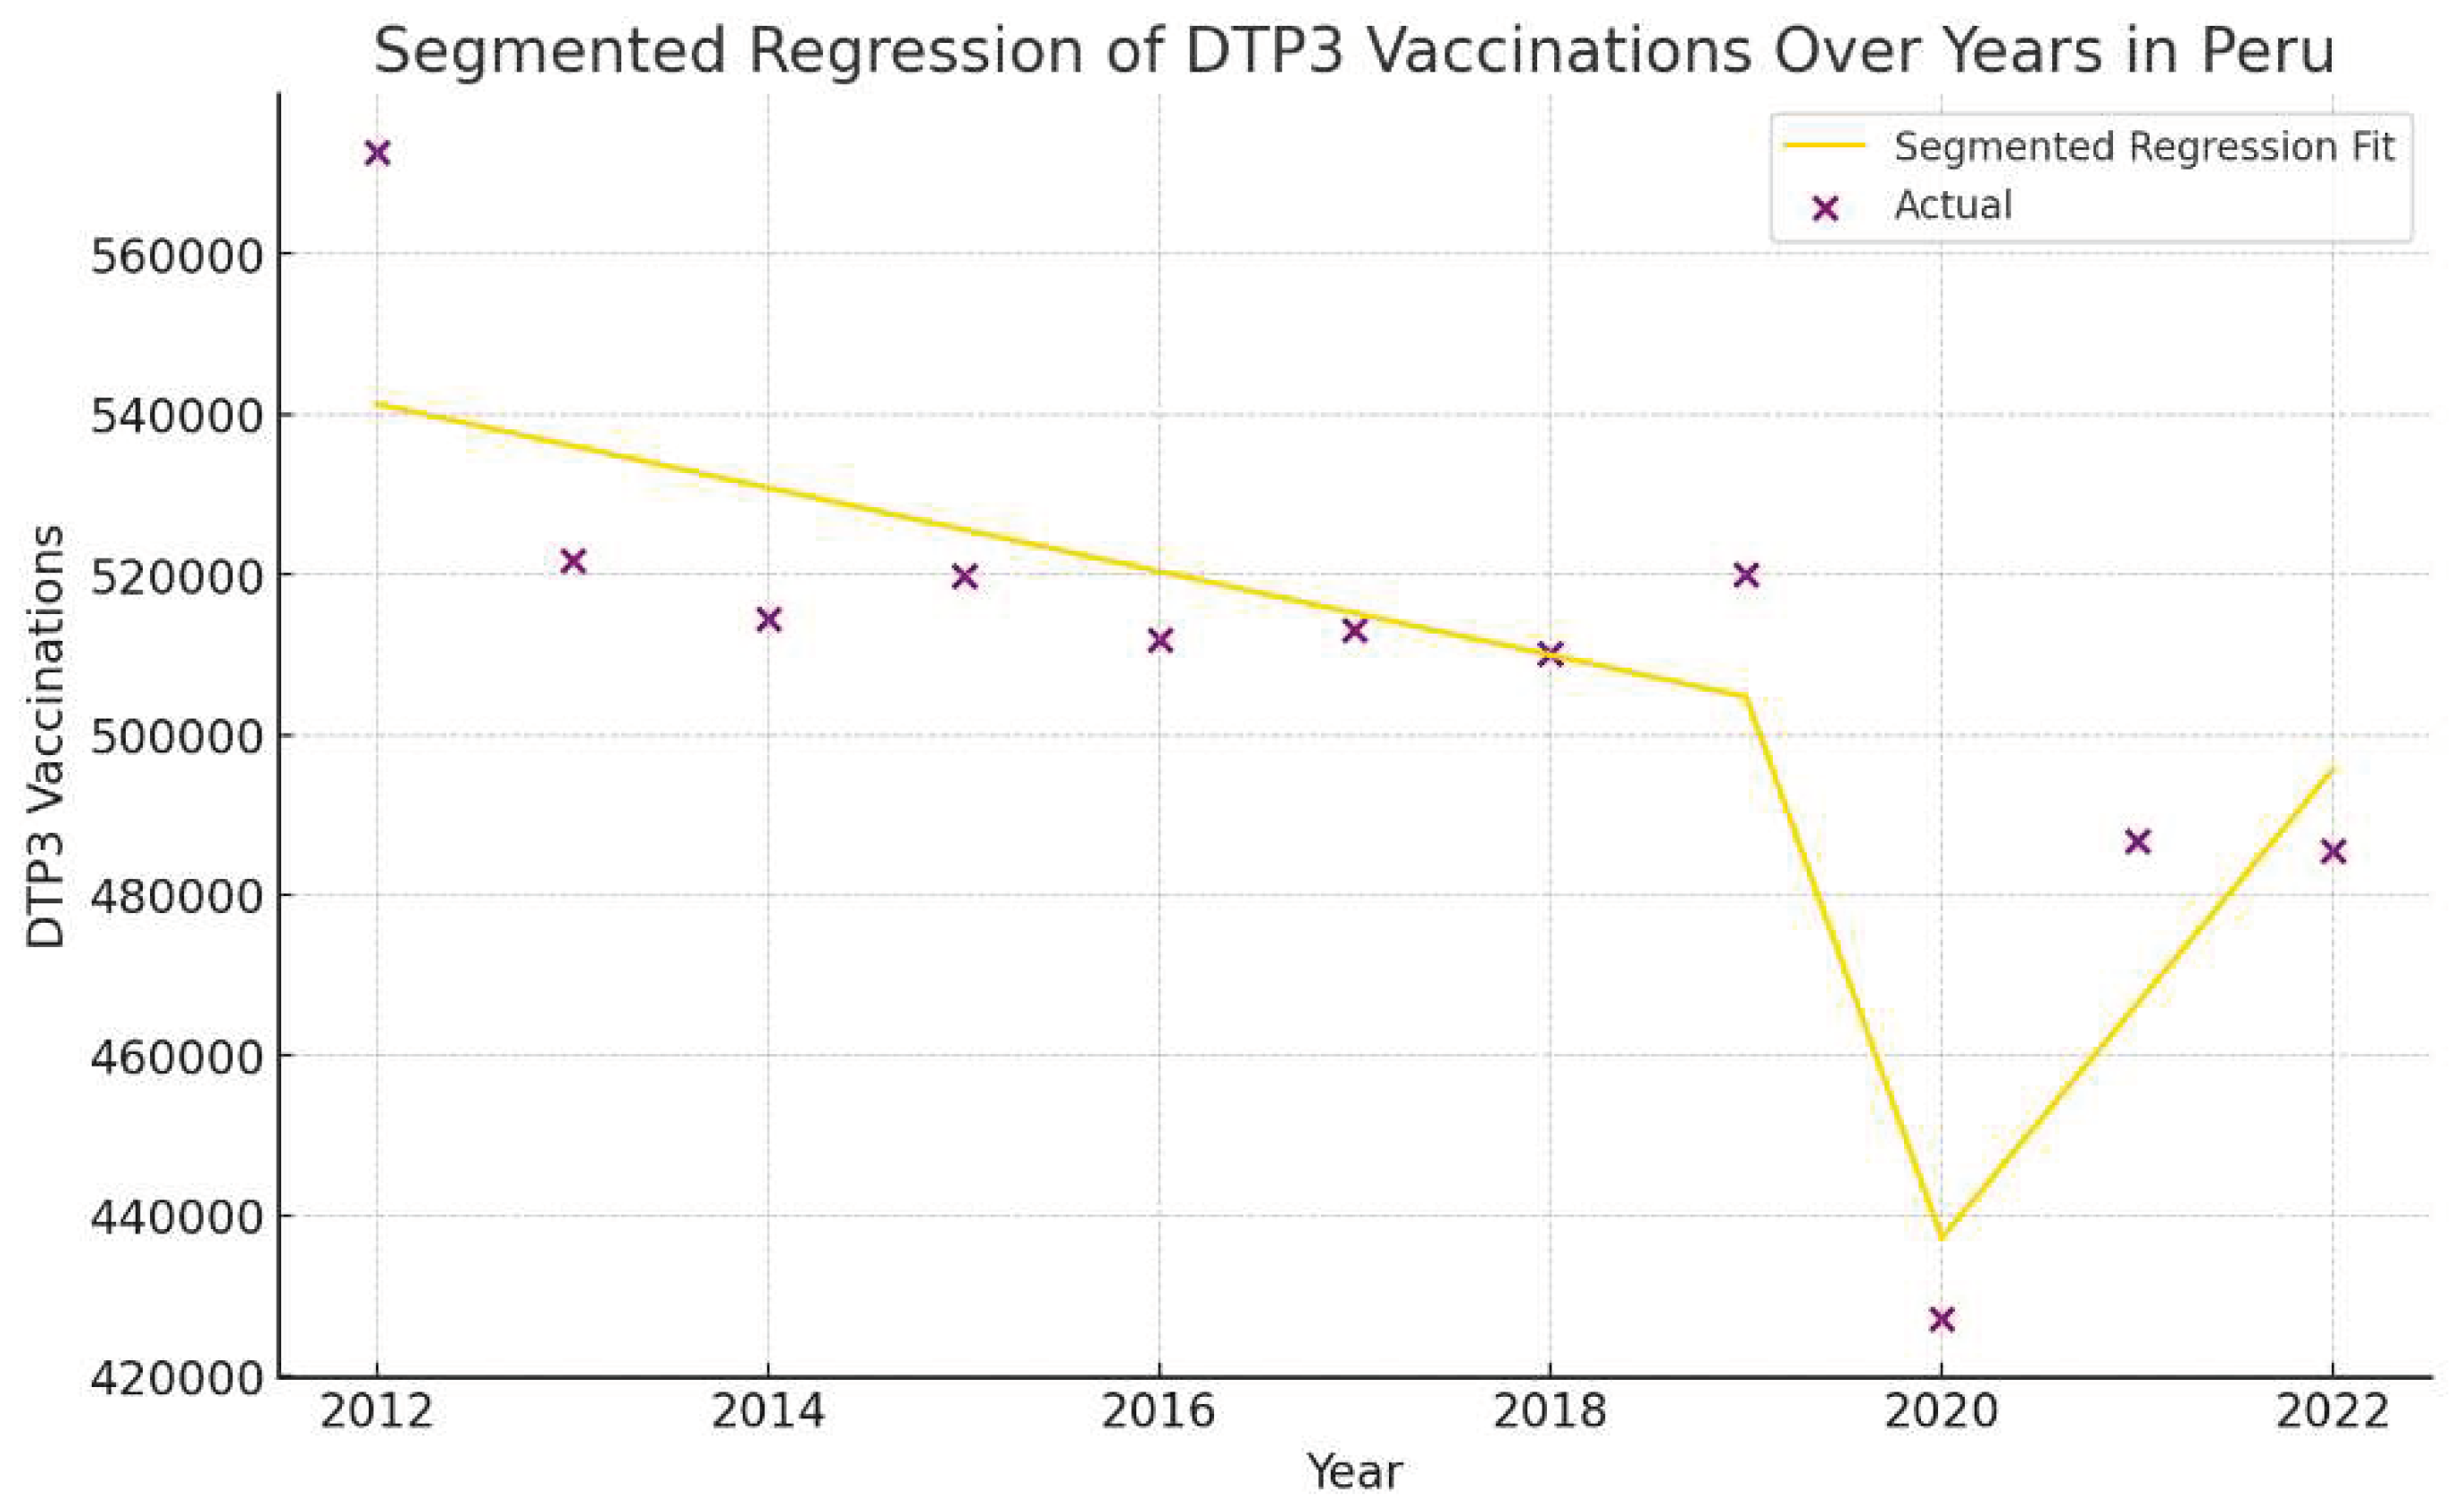
Figure 42.
Segmented Regression Analysis of DTP3 vaccinations in Suriname representing the actual DTP3 vaccination numbers (in dark cyan) and the fitted values from the segmented regression (in magenta).
Figure 42.
Segmented Regression Analysis of DTP3 vaccinations in Suriname representing the actual DTP3 vaccination numbers (in dark cyan) and the fitted values from the segmented regression (in magenta).
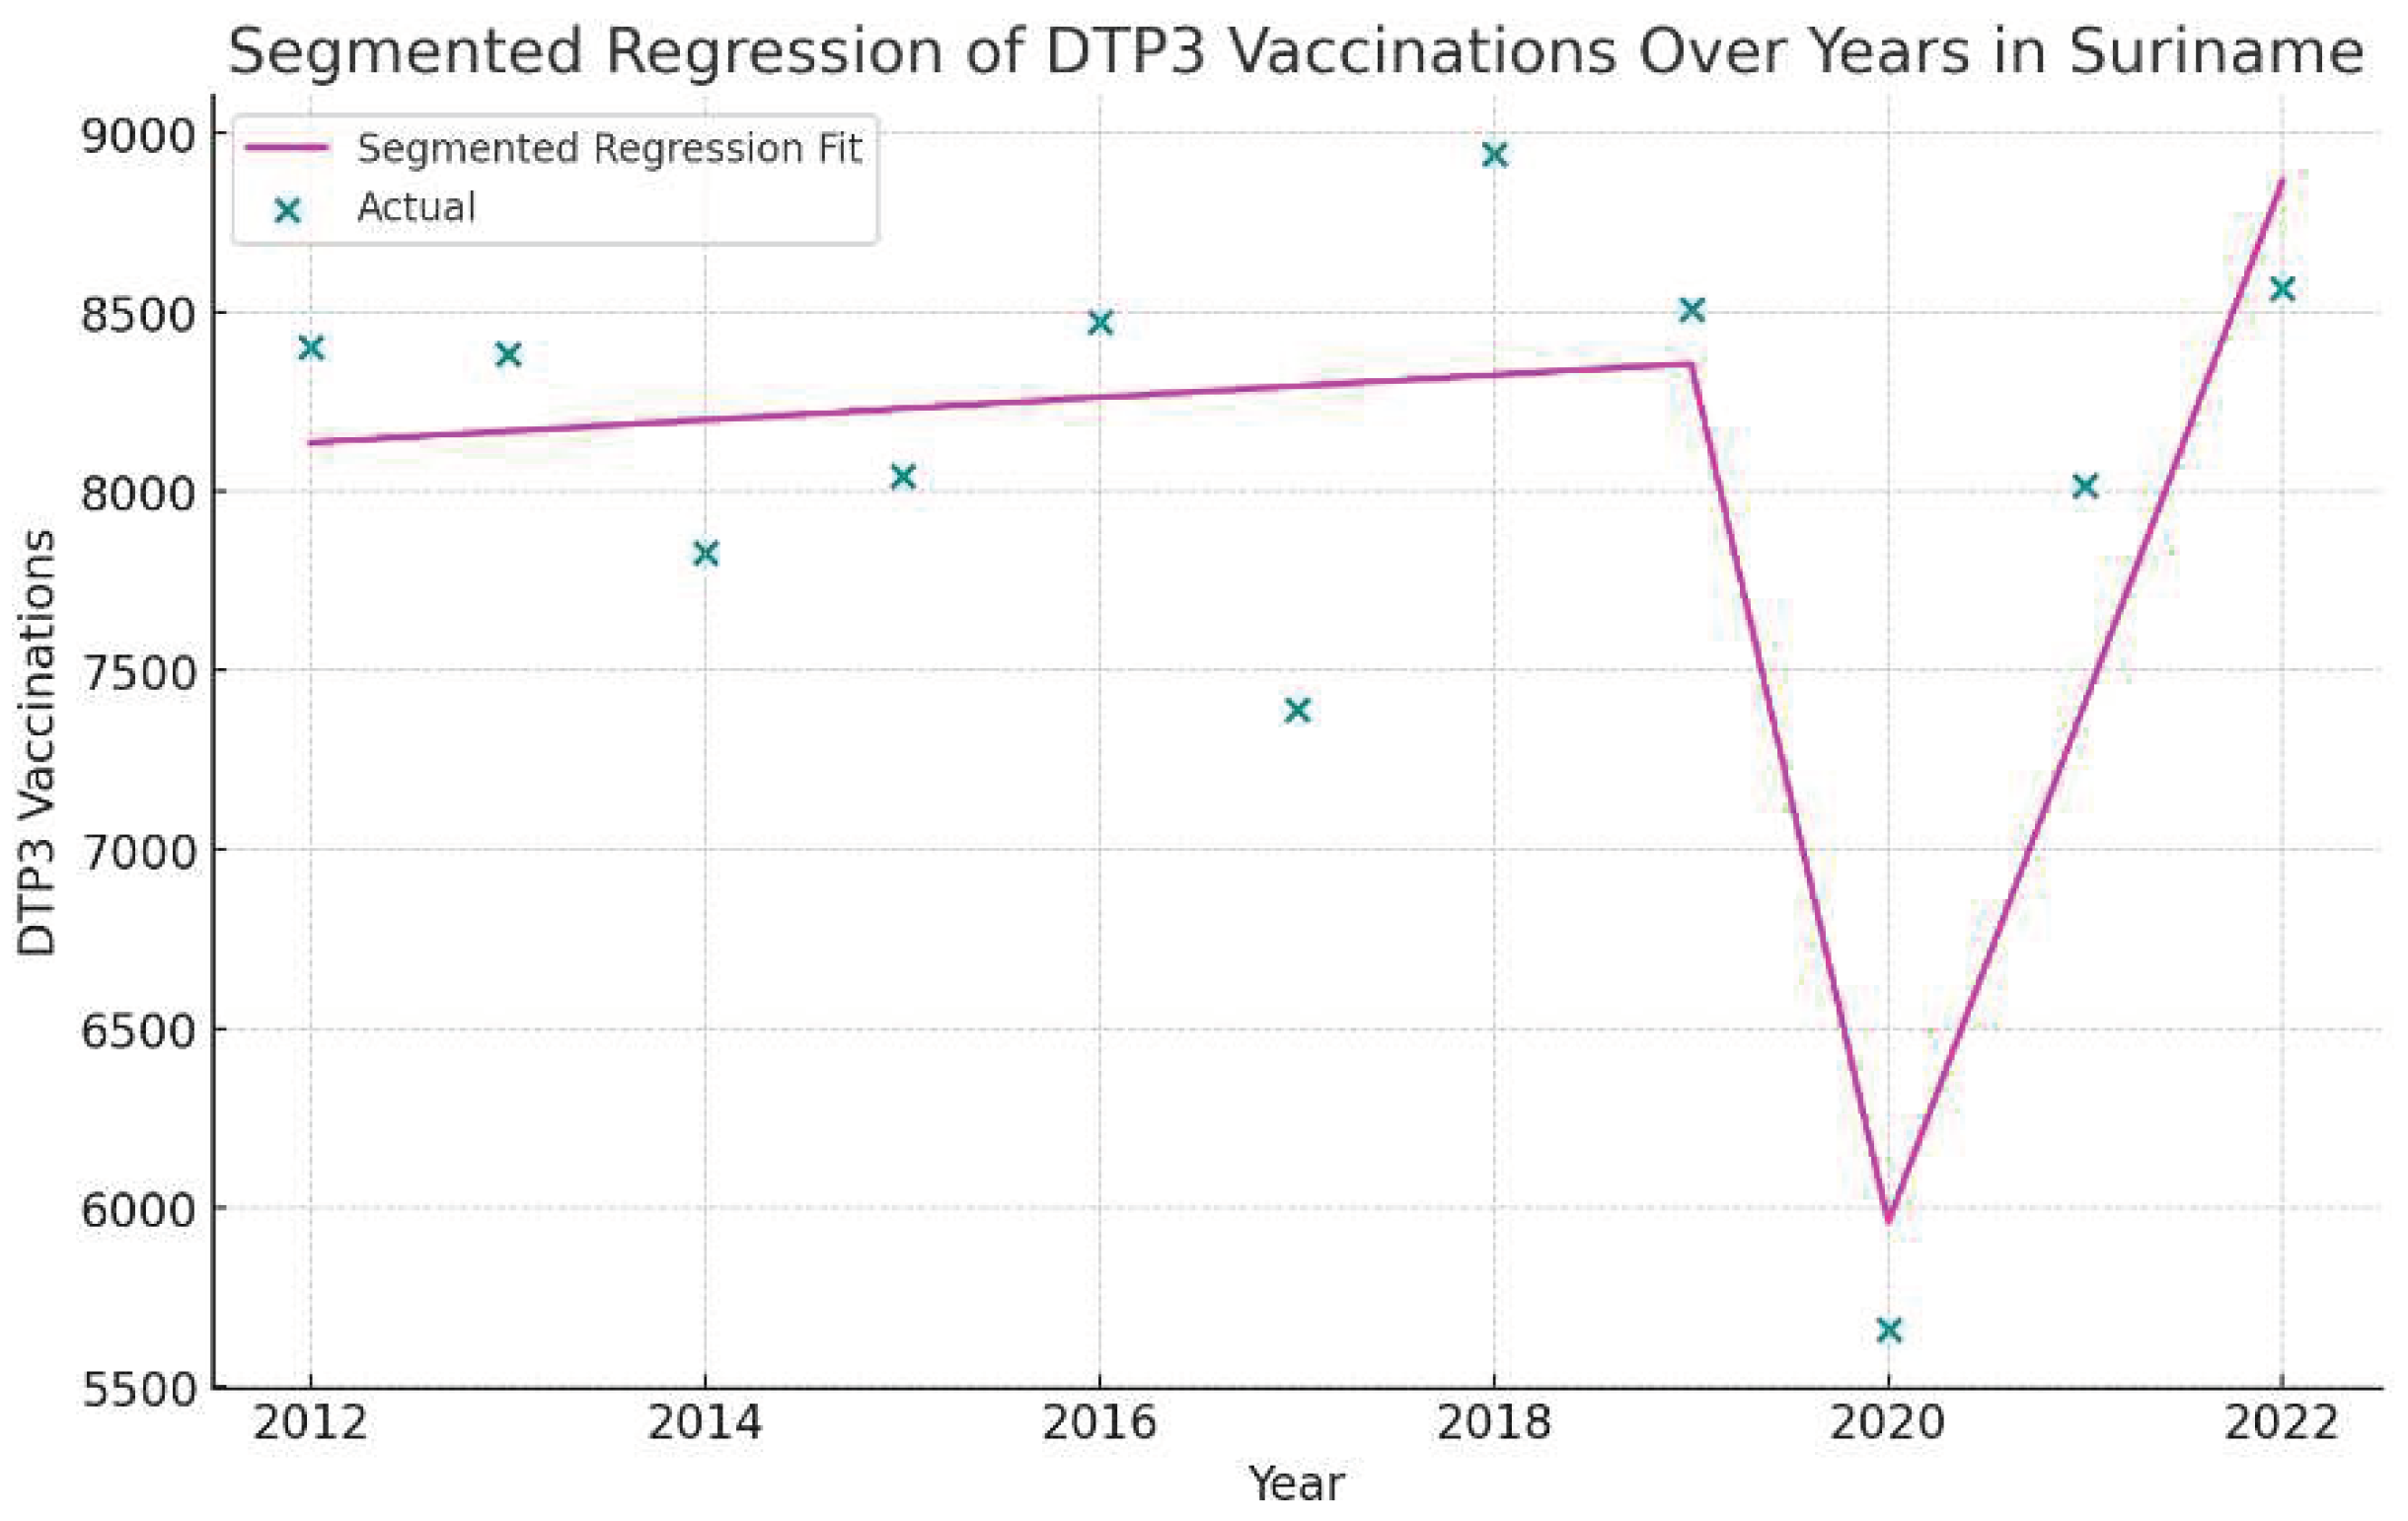
Figure 43.
Segmented Regression Analysis of DTP3 vaccinations in Mexico representing the actual DTP3 vaccination numbers in (in brown) and the predicted values from the segmented regression (in teal)
Figure 43.
Segmented Regression Analysis of DTP3 vaccinations in Mexico representing the actual DTP3 vaccination numbers in (in brown) and the predicted values from the segmented regression (in teal)
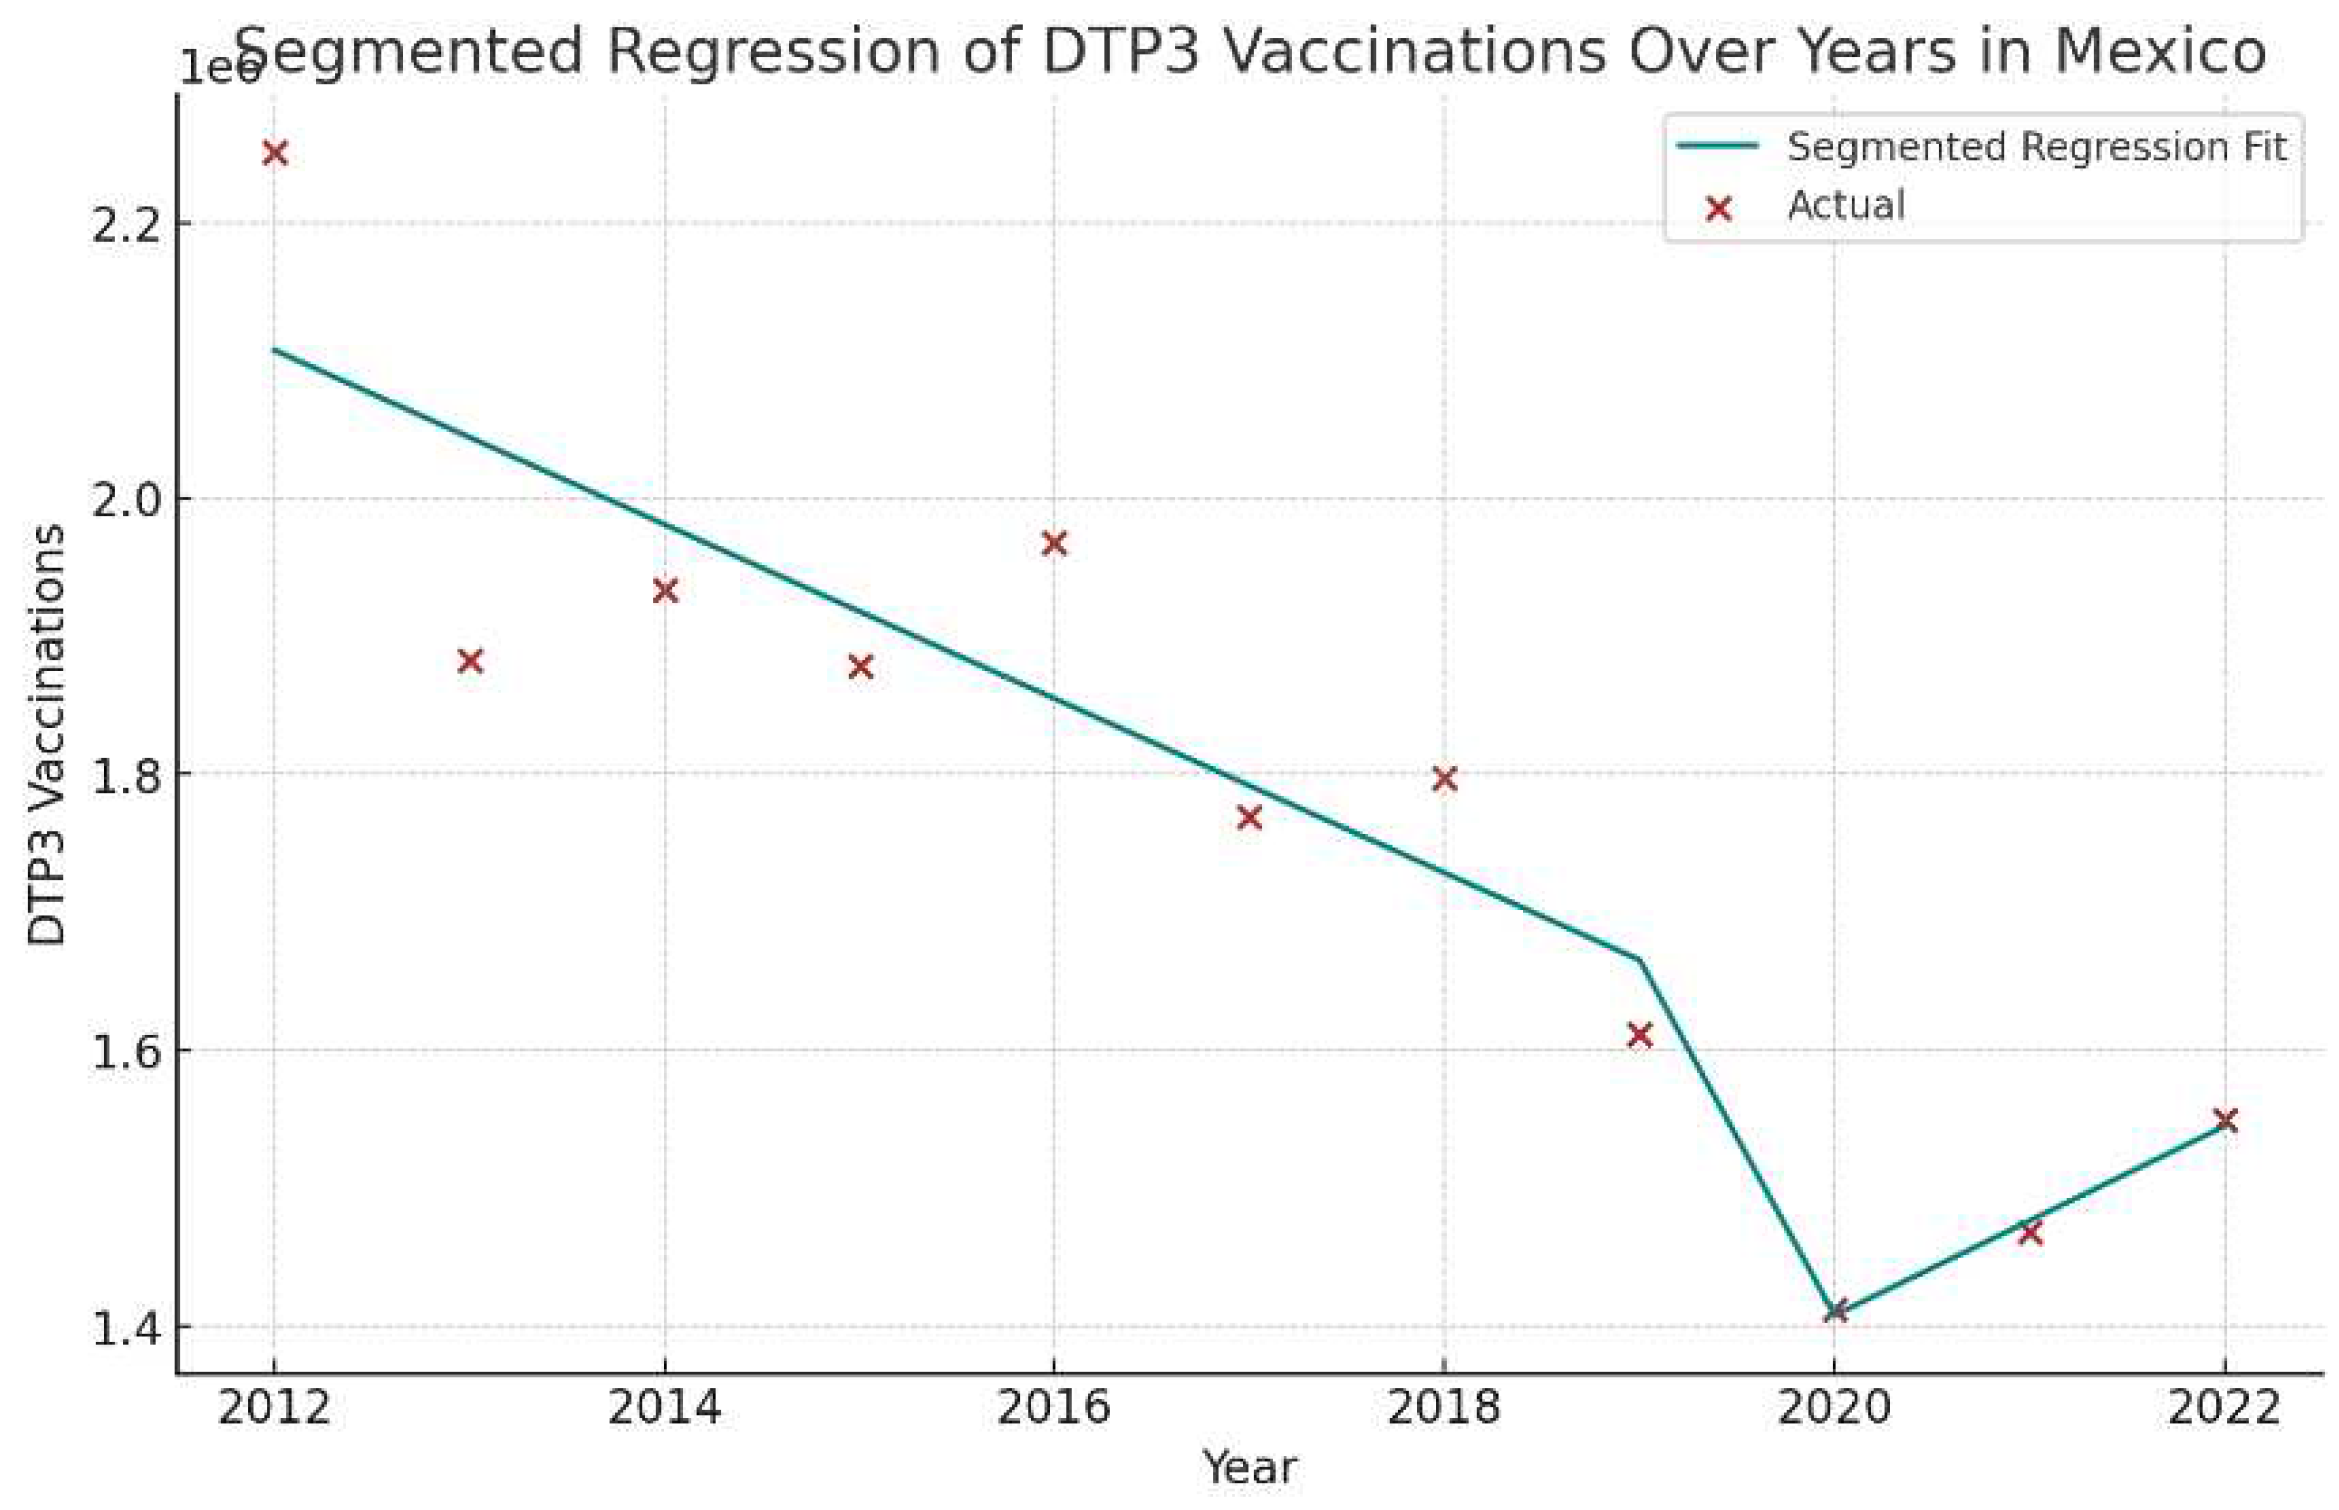
Figure 44.
Segmented Regression Analysis of DTP3 vaccinations in the United States representing the actual DTP3 vaccination numbers in (in dark red) against the predicted values from the segmented regression (in sky blue).
Figure 44.
Segmented Regression Analysis of DTP3 vaccinations in the United States representing the actual DTP3 vaccination numbers in (in dark red) against the predicted values from the segmented regression (in sky blue).
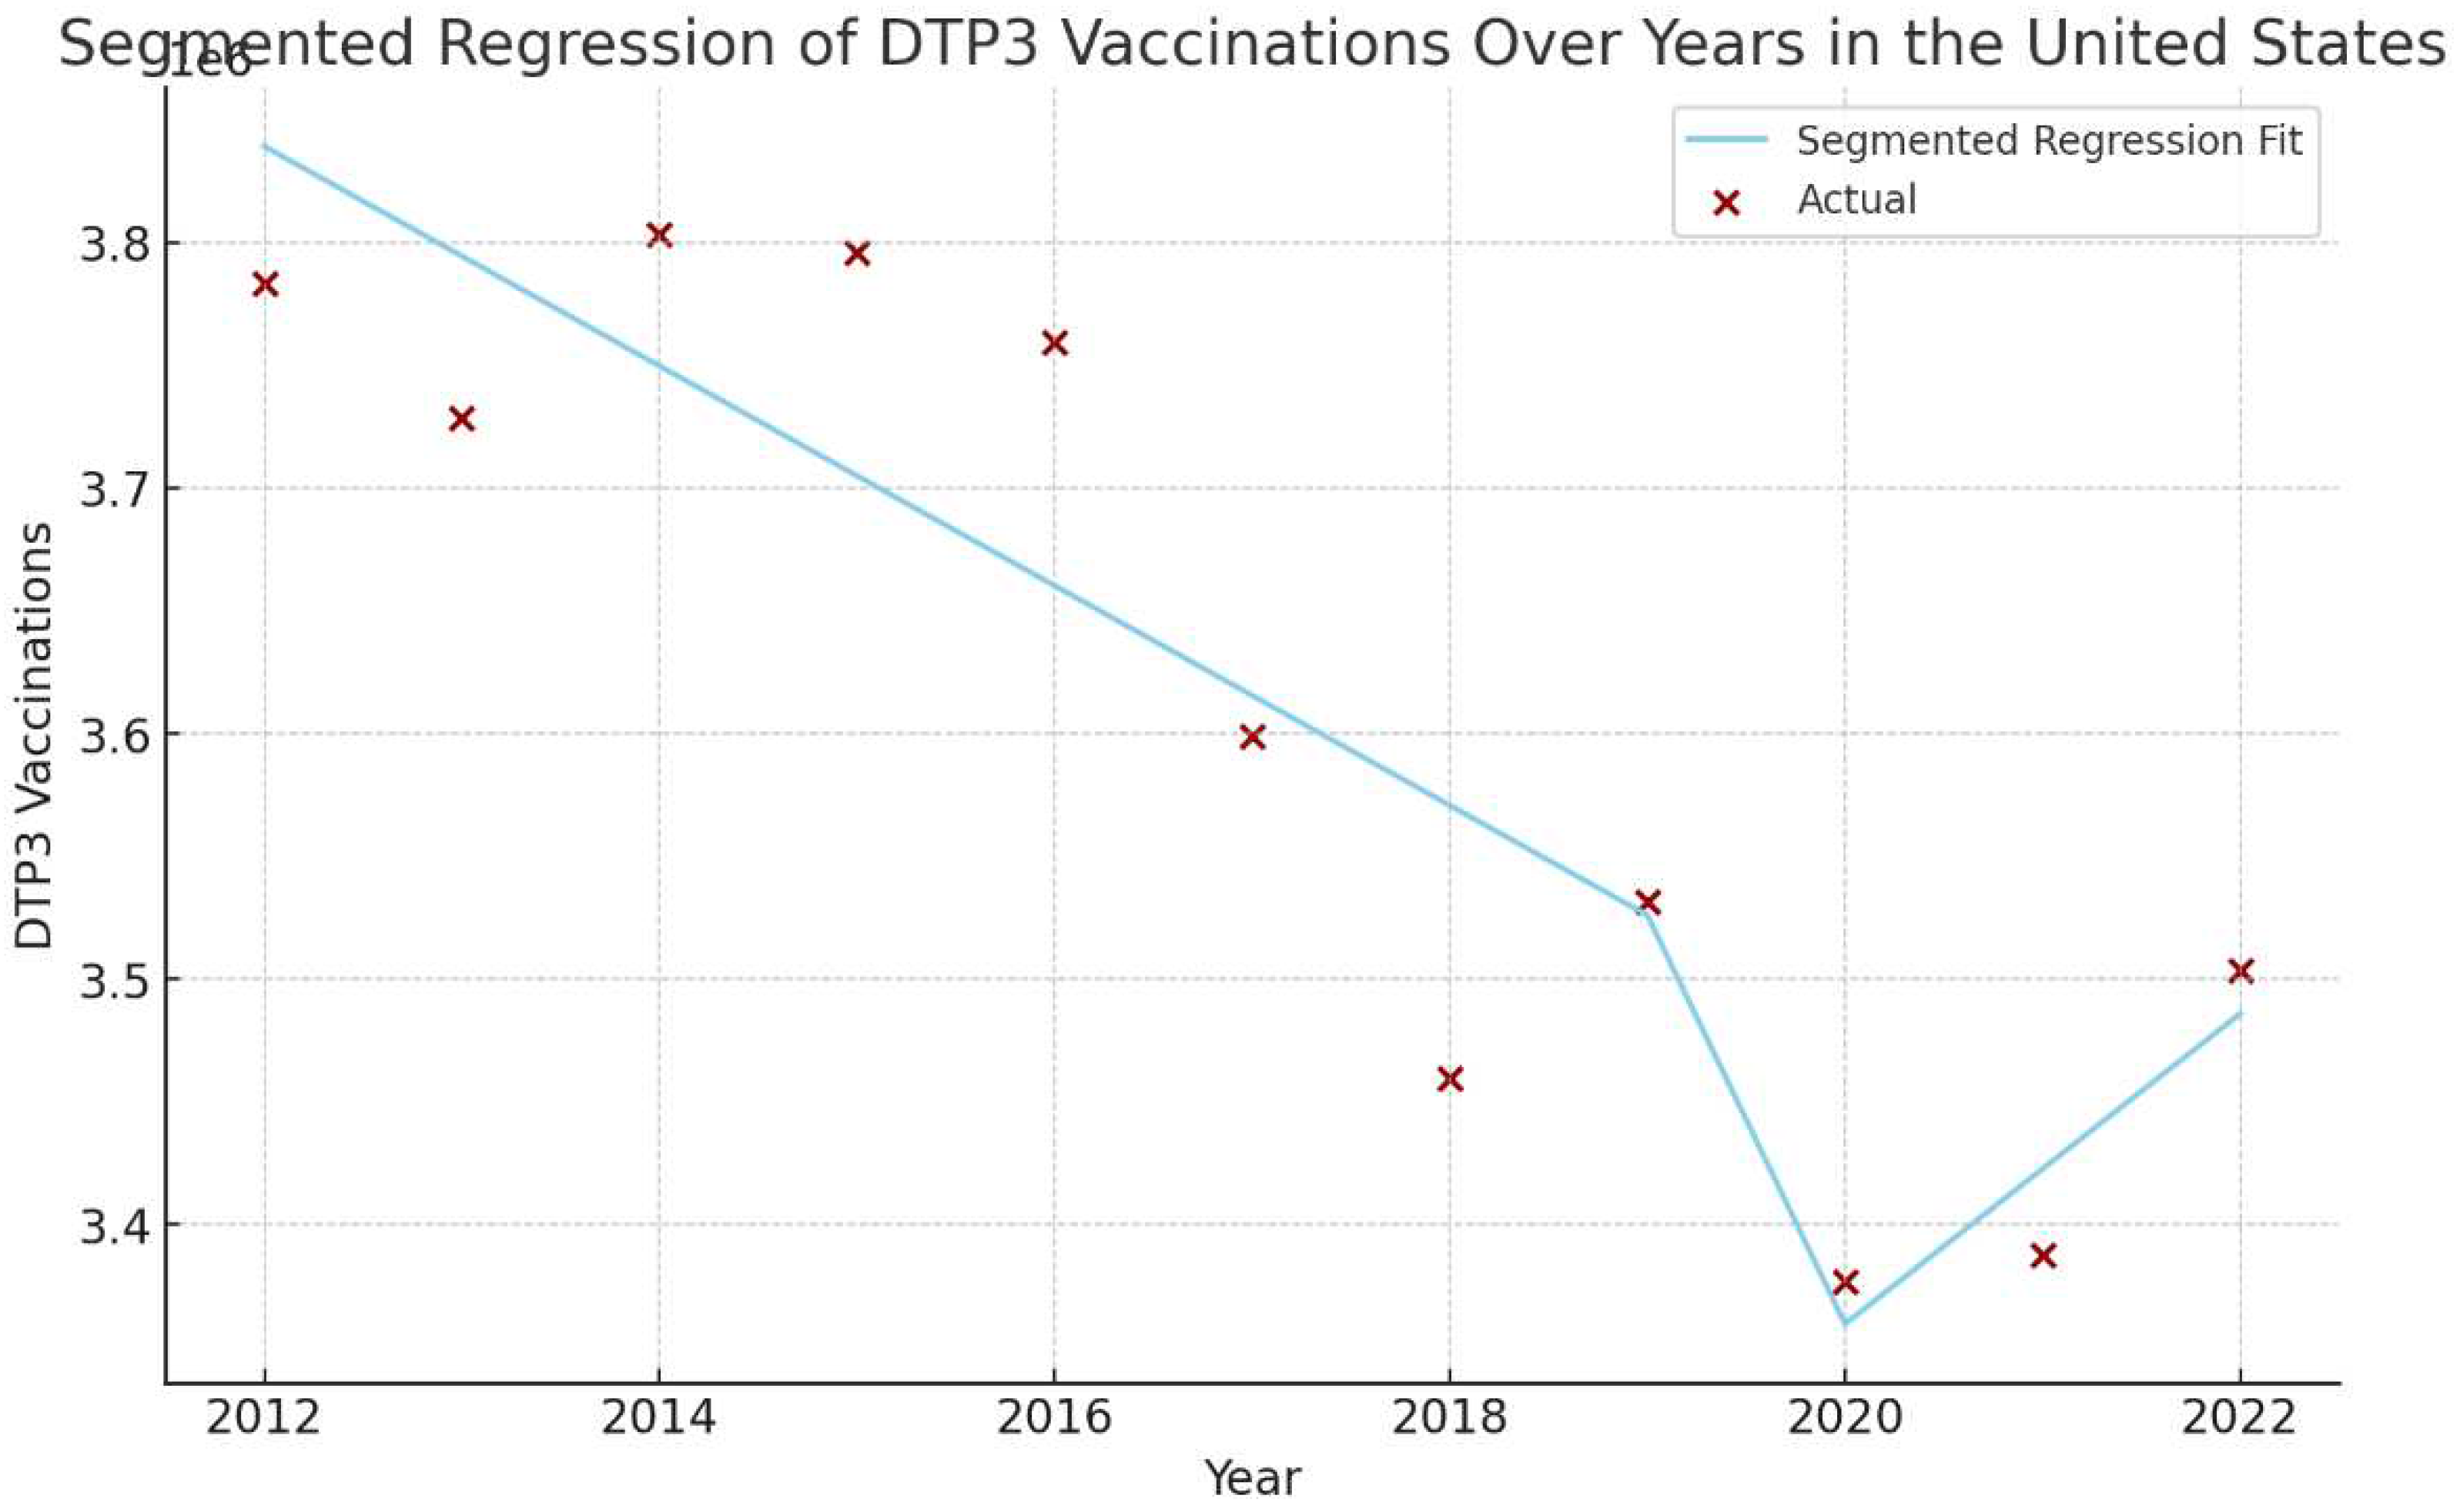

Table 1.
Joinpoint analysis for the third doses DTP vaccination rates in the Americas, 2012–2022.
| Periods | Years | APC (95% CI) | P |
|---|---|---|---|
| Total Period | 2012-2021 | -1.4 (-1.8.; -1.0) | < 0.001 |
| Period 1 | 2012-2016 | -0.7 (-2.9; 1.5) | 0.464 |
| Period 2 | 2016-2022 | -1.8 (-2.9; -0.7) | 0.008 |
Table 2.
Joinpoint analysis for Regional 3rd DTP dose coverage in America, 2012–2022.
| Periods | Years | APC | 95% LCI | 95% UCI | P |
|---|---|---|---|---|---|
| North America | |||||
| Total Period | 2012-2022 | -0.1 | 0.2 | 0 | 0.136 |
| Period 1 | 2012-2014 | 0.6 | -0.2 | 1.4 | 0.494 |
| Period 2 | 2014-2022 | -0.2 | -0.9 | 0.1 | 0.057 |
| Latin America and the Caribbean | |||||
| Total Period | 2012-2022 | -2.1 | -2.7 | -1.5 | < 0.001 |
| Period 1 | 2012-2016 | -0.9 | -4.4 | 2.6 | 0.531 |
| Period 2 | 2016-2022 | -2.7 | -4.5 | -0.9 | 0.010 |
| Central America | |||||
| Total Period | 2012-2022 | -1.3 | -2.1 | -0.4 | 0.009 |
| Period 1 | 2012-2019 | -0.9 | -2.8 | 1.1 | 0.321 |
| Period 2 | 2019-2022 | -2.6 | -8.6 | 3.8 | 0.354 |
| Caribbean | |||||
| Total Period | 2012-2022 | -0.7 | -1.1 | -0.4 | 0.001 |
| Period 1 | 2012-2016 | 0.0 | -1.9 | 2.0 | 0.996 |
| Period 2 | 2016-2022 | -1.1 | -2.1 | -0.1 | 0.031 |
| South America | |||||
| Total Period | 2012-2022 | -2.5 | -3.1 | -1.8 | < 0.001 |
| Period 1 | 2012-2015 | -0.3 | -5.9 | 5.6 | 0.895 |
| Period 2 | 2015-2022 | -3.1 | -4.4 | -1.8 | 0.001 |
Table 3.
Absolute and Relative Changes in DTP Vaccination Coverage (%) Across American Regions between 2019 and 2022.
Table 3.
Absolute and Relative Changes in DTP Vaccination Coverage (%) Across American Regions between 2019 and 2022.
| Region | 2019 | 2020 | 2021 | 2022 | Absolute Changes 2019-2022 |
Relative Changes 2019-2022 |
|---|---|---|---|---|---|---|
| Americas | 84 | 81 | 81 | 83 | -1% | -1,19% |
| North America | 94 | 93 | 94 | 94 | 0% | 0,00% |
| Latin America and the Caribbean | 80 | 76 | 75 | 79 | -1% | -1,25% |
| South America | 78 | 76 | 74 | 78 | 0% | 0,00% |
| Central America | 89 | 83 | 82 | 82 | -7% | -7,87% |
| Caribbean | 81 | 79 | 79 | 81 | 0% | 0,00% |
Table 4.
Absolute and Relative Changes in DTP Vaccination Coverage (%) Across American Countries between 2019 and 2022.
Table 4.
Absolute and Relative Changes in DTP Vaccination Coverage (%) Across American Countries between 2019 and 2022.
| Country | 2019 | 2020 | 2021 | 2022 | Absolute Changes 2019-2022 | p* |
|---|---|---|---|---|---|---|
| Antigua and Barbuda | 95 | 96 | 92 | 99 | 4.00% | <0.001 |
| Argentina | 83 | 74 | 81 | 81 | -2.00% | <0.001 |
| Bahamas | 89 | 83 | 86 | 87 | -2.00% | ns |
| Barbados | 90 | 85 | 82 | 86 | -4.00% | ns |
| Belize | 98 | 79 | 83 | 84 | -14.00% | 0.003 |
| Bolivia | 75 | 68 | 70 | 69 | -6.00% | <0.001 |
| Brazil | 70 | 77 | 68 | 77 | 7.00% | <0.001 |
| Canada | 91 | 92 | 92 | 92 | 1.00% | ns |
| Chile | 96 | 93 | 95 | 96 | 0.00% | ns |
| Colombia | 94 | 88 | 86 | 87 | -7.00% | <0.001 |
| Costa Rica | 95 | 97 | 93 | 95 | 0.00% | ns |
| Cuba | 99 | 99 | 99 | 99 | 0.00% | ns |
| Dominica | 99 | 96 | 92 | 92 | -7.00% | ns |
| Dominican Republic | 89 | 82 | 84 | 88 | -1.00% | ns |
| Ecuador | 85 | 70 | 72 | 70 | -15.00% | <0.001 |
| El Salvador | 90 | 76 | 78 | 75 | -15.00% | <0.001 |
| Grenada | 94 | 72 | 77 | 77 | -17.00% | 0.054 |
| Guatemala | 85 | 83 | 79 | 79 | -6.00% | <0.001 |
| Guyana | 99 | 99 | 98 | 98 | -1.00% | ns |
| Haiti | 51 | 51 | 51 | 51 | 0.00% | ns |
| Honduras | 88 | 80 | 77 | 78 | -10.00% | <0.001 |
| Jamaica | 96 | 96 | 90 | 98 | 2.00% | ns |
| Mexico | 82 | 72 | 78 | 83 | 1.00% | <0.001 |
| Nicaragua | 98 | 92 | 87 | 92 | -6.00% | <0.001 |
| Panama | 88 | 74 | 87 | 87 | -1.00% | ns |
| Paraguay | 86 | 79 | 70 | 69 | -17.00% | <0.001 |
| Peru | 88 | 72 | 82 | 82 | -6.00% | <0.001 |
| Saint Kitts and Nevis | 97 | 99 | 96 | 96 | -1.00% | ns |
| Saint Lucia | 92 | 86 | 80 | 81 | -11.00% | ns |
| Saint Vincent and the Grenadines | 97 | 97 | 92 | 92 | -5.00% | ns |
| Suriname | 77 | 51 | 72 | 77 | 0.00% | ns |
| Trinidad and Tobago | 93 | 96 | 94 | 93 | 0.00% | ns |
| Uruguay | 94 | 92 | 91 | 94 | 0.00% | ns |
| United States | 94 | 93 | 94 | 94 | 0.00% | ns |
| Venezuela | 64 | 54 | 56 | 56 | -8.00% | <0.001 |
ns= no signifcant *Chisquare Test.
Table 5.
Joinpoint analysis DTP3 dose coverage in America, 2012–2022.
| Country | Years | APC | 95% LCI | 95% UCI | P |
|---|---|---|---|---|---|
| Antigua and Barbuda | |||||
| Total Period | 2012-2022 | -0.4 | -0.9 | 0 | 0.04 |
| Period 1 | 2012-2017 | -1.2 | -2.7 | 0.4 | 0.118 |
| Period 2 | 2017-2022 | 0.3 | -1.3 | 1.9 | 0.677 |
| Bahamas | |||||
| Total Period | 2012-2022 | -1.5 | -2 | -0.9 | < 0.001 |
| Period 1 | 2012-2020 | -1.8 | -2.2 | -1.4 | < 0.001 |
| Period 2 | 2020-2022 | 0.6 | -2.7 | 3.9 | 0.697 |
| Belize | |||||
| Total Period | 2012-2022 | -1.6 | -2.6 | -0.6 | 0.005 |
| Period 1 | 2012-2019 | -0.8 | -1.7 | 0.2 | 0.09 |
| Period 2 | 2019-2022 | -4.4 | -8.3 | -0.3 | 0.04 |
| Canada | |||||
| Total Period | 2012-2022 | 0.1 | 0.1 | 0.2 | 0.003 |
| Period 1 | 2012-2018 | 0 | -0.1 | 0.1 | 0.931 |
| Period 2 | 2018-2022 | 0.3 | 0.1 | 0.6 | 0.008 |
| Colombia | |||||
| Total Period | 2012-2022 | -0.4 | -0.9 | 0.1 | 0.102 |
| Period 1 | 2012-2019 | 0.3 | 0 | 0.6 | 0.071 |
| Period 2 | 2019-2022 | -2.6 | -3.8 | -1.4 | 0.002 |
| Costa Rica | |||||
| Total Period | 2012-2022 | -0.4 | -0.9 | 0.1 | 0.102 |
| Period 1 | 2012-2017 | 0.8 | -0.6 | 2.3 | 0.198 |
| Period 2 | 2017-2022 | -0.2 | -1.6 | 1.2 | 0.702 |
| Dominica | |||||
| Total Period | 2012-2022 | -0.4 | -1 | 0.1 | 0.101 |
| Period 1 | 2012-2020 | -0.2 | -1.3 | 0.9 | 0.677 |
| Period 2 | 2020-2022 | -2.2 | -12.5 | 9.3 | 0.635 |
| Ecuador | |||||
| Total Period | 2012-2022 | -1.9 | -3.2 | -0.7 | 0.007 |
| Period 1 | 2012-2018 | -0.3 | -3.2 | 2.8 | 0.843 |
| Period 2 | 2018-2022 | -4.8 | -10.1 | 0.8 | 0.078 |
| Grenada | |||||
| Total Period | 2012-2022 | -2.7 | -4.1 | -1.3 | 0.002 |
| Period 1 | 2012-2018 | -0.5 | -3.5 | 2.6 | 0.71 |
| Period 2 | 2018-2022 | -6.5 | -12.1 | -0.6 | 0.036 |
| Haiti | |||||
| Total Period | 2012-2022 | -3.0 | -4.3 | -1.7 | 0.001 |
| Period 1 | 2012-2017 | -0.8 | -5.2 | 3.7 | 0.663 |
| Period 2 | 2017-2022 | -5.1 | -9.3 | -0.7 | 0.029 |
| Jamaica | |||||
| Total Period | 2012-2022 | 0.2 | -0.3 | 0.7 | 0.476 |
| Period 1 | 2012-2018 | 0.4 | -0.8 | 1.6 | 0.427 |
| Period 2 | 2018-2022 | -0.7 | -6 | 4.8 | 0.756 |
| Mexico | |||||
| Total Period | 2012-2022 | -1.7 | -3.1 | -0.2 | 0.027 |
| Period 1 | 2012-2020 | -2.3 | -4.5 | 0 | 0.048 |
| Period 2 | 2020-2022 | 2.4 | -16.3 | 25.2 | 0.783 |
| Nicaragua | |||||
| Total Period | 2012-2022 | -0.9 | -1.5 | -0.4 | 0.006 |
| Period 1 | 2012-2018 | 0.1 | -1 | 1.2 | 0.875 |
| Period 2 | 2018-2022 | -2.7 | -4.9 | -0.6 | 0.022 |
| Paraguay | |||||
| Total Period | 2012-2022 | -2.8 | -4.1 | -1.5 | 0.001 |
| Period 1 | 2012-2018 | -0.3 | -1.1 | 0.6 | 0.506 |
| Period 2 | 2018-2022 | -7.2 | -8.8 | -5.6 | < 0.001 |
| Peru | |||||
| Total Period | 2012-2022 | -1.5 | -2.6 | -0.4 | 0.012 |
| Period 1 | 2012-2017 | -0.8 | -5.4 | 4.1 | 0.709 |
| Period 2 | 2017-2022 | -2.3 | -6.8 | 2.5 | 0.284 |
| Saint Kitts and Nevis | |||||
| Total Period | 2012-2022 | 0 | -0.3 | 0.2 | 0.87 |
| Period 1 | 2012-2020 | 0.1 | -0.3 | 0.6 | 0.489 |
| Period 2 | 2020-2022 | -1.2 | -7.1 | 5.2 | 0.661 |
| Saint Lucia | |||||
| Total Period | 2012-2022 | -2.2 | -3.2 | -1.1 | 0.001 |
| Period 1 | 2012-2019 | -1.7 | -4.1 | 0.8 | 0.141 |
| Period 2 | 2019-2022 | -3.8 | -13.2 | 6.7 | 0.4 |
| Saint Vincent and the Grenadines | |||||
| Total Period | 2012-2022 | -0.5 | -0.9 | 0 | 0.045 |
| Period 1 | 2012-2017 | 0.6 | -0.2 | 1.5 | 0.105 |
| Period 2 | 2017-2022 | -1.6 | -2.4 | -0.8 | 0.003 |
| Suriname | |||||
| Total Period | 2012-2022 | -1 | -3.3 | 1.4 | 0.361 |
| Period 1 | 2012-2020 | -2.1 | -4 | -0.2 | 0.038 |
| Period 2 | 2020-2022 | 7.3 | -14 | 33.9 | 0.466 |
| Uruguay | 2012-2022 | -0.3 | -0.6 | -0.1 | 0.016 |
| Period 1 | 2012-2020 | -0.4 | -0.9 | 0 | 0.049 |
| Period 2 | 2020-2022 | 0.5 | -4.5 | 5.8 | 0.817 |
Table 6.
Segmented Regression Analysis of Regional DTP3 Vaccine Coverage.
| Region | Intercept | Year | Covid-19 | Interaction |
|---|---|---|---|---|
| The Americas | 14,257,167. | -271,700 *** | -3,824,000 † | 339,600† |
| North America | 6,419,470 | -77,900*** | -960,900 | 92,490, |
| Latin America and the Caribbean | 10,258,998. | -239,700 | -3,408,000† | 296,800 |
| Central America | 842,631 | -9,958* | -73,740 | 1,035 |
| The Caribbean | 595,044 | -5,629* | -94,750 | 6,845 |
| South America | 6,552,726 | -161,900** | -2,071,000, | 181,600, |
† p < 0.10 *p < 0.05 **p < 0.01 *** p < 0.001.
Table 7.
Segmented Regression of the number of DTP3 vaccinations in American nations.
| Nation | Intercept | Year | Covid-19 | Interaction |
| Antigua and Barbuda | 1,166 | -25* | -242 | 41 |
| Argentina | 747,939 | -21,550* | -440,868 | 40,473 |
| Bahamas | 5,272 | -147* | -2,177 | 235 |
| Barbados | 2,906 | -8 | -444 | 19 |
| Belize | 73,689 | -7 | -3,833* | 240 |
| Bolivia | 246,668 | -4,856† | -80,433 | 6,430 |
| Brazil | 3,086,377 | -101,299* | -799,678 | 76,649 |
| Canada | 346,374 | -1,670 | -28,913 | 4,283* |
| Chile | 223,231 | -1,354 | -54,775 | 6,213 |
| Colombia | 671,882 | 277 | 43,507 | -8,393 |
| Costa Rica | 68482 | -580† | 4,127 | -856 |
| Cuba | 128,843 | -2,206* | 1,376 | -726 |
| Dominica | 889 | 1 | 160 | -16 |
| Dominican Republic | 183,881 | 170 | -58,735 | 4,679 |
| Ecuador | 273,474 | -3,456 | -59,827 | 3,220 |
| El Salvador | 116,148 | -2,777* | -27167 | 1,609 |
| Grenada | 2,040 | -12† | -838* | 42 |
| Guatemala | 366,586 | -4,476 | 36,154 | -5,709 |
| Guyana | 15,500 | 49 | 2,205 | -220 |
| Haiti | 183,283 | -3,133 | -39,333 | 2,490 |
| Honduras | 215,078 | -3,019 | -29,014 | 1,396 |
| Jamaica | 39,982 | -942* | -8,835 | 955 |
| Mexico | 2,170,515 | -63,127* | -1,379,021† | 131,627 |
| Nicaragua | 140,894 | -108 | -4,172 | -885 |
| Panama | 62938 | 493 | -48,279 | 4,392 |
| Paraguay | 123,679 | 129 | 48,857 | -7,328 |
| Peru | 546,498 | -5,221 | -372,338* | 34,451* |
| Saint Kitts and Nevis | 672 | -10* | 123 | -14 |
| Saint Lucia | 2,207 | -38† | 242 | -37 |
| Saint Vincent and the Grenadines | 1,843 | -57* | -25 | 1 |
| Suriname | 8105 | 31 | -15,211* | 1,421* |
| Trinidad and Tobago | 19,470 | -221* | 3238 | -372 |
| United States | 3,884,049 | -44,760* | -1,093,444† | 107,962† |
| Uruguay | 49,522 | -1,632* | -21,125 | 2,086 |
| Venezuela | 549,286 | -26,220 | -268,317 | 23,130 |
† p < 0.10 *p < 0.05 **p < 0.01.
Disclaimer/Publisher’s Note: The statements, opinions and data contained in all publications are solely those of the individual author(s) and contributor(s) and not of MDPI and/or the editor(s). MDPI and/or the editor(s) disclaim responsibility for any injury to people or property resulting from any ideas, methods, instructions or products referred to in the content. |
© 2023 by the authors. Licensee MDPI, Basel, Switzerland. This article is an open access article distributed under the terms and conditions of the Creative Commons Attribution (CC BY) license (http://creativecommons.org/licenses/by/4.0/).
Copyright: This open access article is published under a Creative Commons CC BY 4.0 license, which permit the free download, distribution, and reuse, provided that the author and preprint are cited in any reuse.


