
Submitted:
08 December 2023
Posted:
08 December 2023
You are already at the latest version
Abstract
Background. Sarcopenia and spinal cord injury (SCI) often coexist, but little is known about the associations of these two pathologies. This study aimed to assess the impact of SCI on muscle and bone mass and the correlations between clinical characteristics of SCI patients and sarcopenia. Methods: 136 patients diagnosed with SCI admitted to rehabilitation hospital were included in the study. The type and severity of injury (AIS), the level of spasticity (MAS), bone mineral density and Appendicular Lean Muscle Mass (ALM) were assessed. Sarcopenia was diagnosed according to the recommended EWGSOP2 cut-off points for ALM. Results: There was a statistically significant association between the ALM value and the gender, 75% of women developing sarcopenia. Among men, 42.9% had sarcopenia. Over 55% of AIS Grades A and B cases had sarcopenia. Mean age of sarcopenic patients was 35.8 years and they had multiple comorbidities. 51.6% of the patients with osteoporosis had sarcopenia. 69.7% of MAS level 0 cases had sarcopenia, while this was diagnosed in about 40% of patients with MAS levels 1-4. Conclusions: Gender, type of injury, presence of multiple comorbidities and age were directly associated with sarcopenia, while surprisingly, spasticity level and the presence of immobilization osteoporosis were not.
Keywords:
spinal cord injury
; sarcopenia
; immobilization osteoporosis
; spasticity
1. Introduction
The progressive loss of muscle mass and strength, with impaired physical performance of individuals, associated with advancing age, has been defined as sarcopenia [1,2]. The term was first introduced by Rosenberg (1989) [3].
The etiology is multifactorial. Age-related decline, chronic diseases, presbyphagia, qualitative and quantitative muscle tissue impairment, hormonal changes, cellular metabolism (the im-balance between protein synthesis and degradation) are some of the factors involved in the occurrence of sarcopenia [4,5]. The loss of muscle mass and strength associated with the ageing process defines primary sarcopenia, which may contribute to a decrease in mobility, balance, coordination and ability [6]. Secondary sarcopenia is defined by the association of ageing with other evident factors or comorbidities [7].
In 2010, the European Working Group on Sarcopenia in Older People (EWGSOP) met to develop diagnostic criteria. They developed a clear diagnostic criterion and a globally accepted definition for age-related sarcopenia. The working definition until 2018 was that sarcopenia is a syndrome characterized by the concurrent presence of both low muscle mass and low muscle function or low physical performance [6], but in early 2018, the Working Group (EWGSOP2) re-convened to update the original definition and establish new cut-off points for sarcopenia, with the aim of highlighting the latest emerging scientific and clinical evidence that has accumulated over the past decade [8]. The conclusion Cruz-Jentoft et al. reached in 2019 was that it is common among older adults, but can also occur earlier in life [8].
Osteosarcopenia is defined by the concomitant presence of osteopenia/osteoporosis and sarcopenia. The etiology of osteosarcopenia is multifactorial, involving several factors, both genetic and environmental. In addition, a poor nutritional status and lack of physical activity, such as prolonged immobilization, are key risk factors for osteosarcopenia [9].
Spinal cord injuries (SCI) are typically characterized by a loss of function (motor and/or sensory) distal to the lesion and include multiple impairments: paralysis of voluntary muscles, altered sensory function, mobility disorders and joint contractures, abnormal muscle tone, pain, and cardio-pulmonary deconditioning [10]. Road accidents are the most frequent causes of SCI, followed by falls resulting in bone fractures, gunshot wounds and sports. Several secondary long-term complications can occur after SCI, such as: respiratory and cardiovascular complications, urinary and bowel complications, spasticity, bone disease, and last but not least loss of the skeletal muscles [11,12,13].
The loss of motor and/or sensory function leads to a reduction in physical activity favoring deconditioning [7]. Muscle unloading, lack of voluntary contraction, spasticity, injuries to small vessels cause changes in muscle fibers and histochemical changes in the muscle cells.
Patients with complete SCI can lose 20-55% of their muscle mass, while those with in-complete damage lose between 20 and 30% of their muscle mass [14].
Working definition of sarcopenia in patients with SCI is to our knowledge still not clear, and current application of the definitions of sarcopenia in subjects with spinal cord injury requires further research [7].
The aim of the study was to evaluate the impact of SCI on muscle and bone mass, depend-ing on a series of clinical characteristics of SCI patients.
2. Materials and Methods
2.1. Study Design
A cohort study was conducted from 2019 to 2022. Patients from the “Băile Felix Me-dical Rehabilitation Clinical Hospital” diagnosed with SCI were enrolled in the study. The study was approved by the local Ethics Committee (4016/30.04.2018), and was conducted in accordance with the principles of the Declaration of Helsinki. All participants provided their written consent before participating in the study.
2.2. Inclusion/exclusion criteria
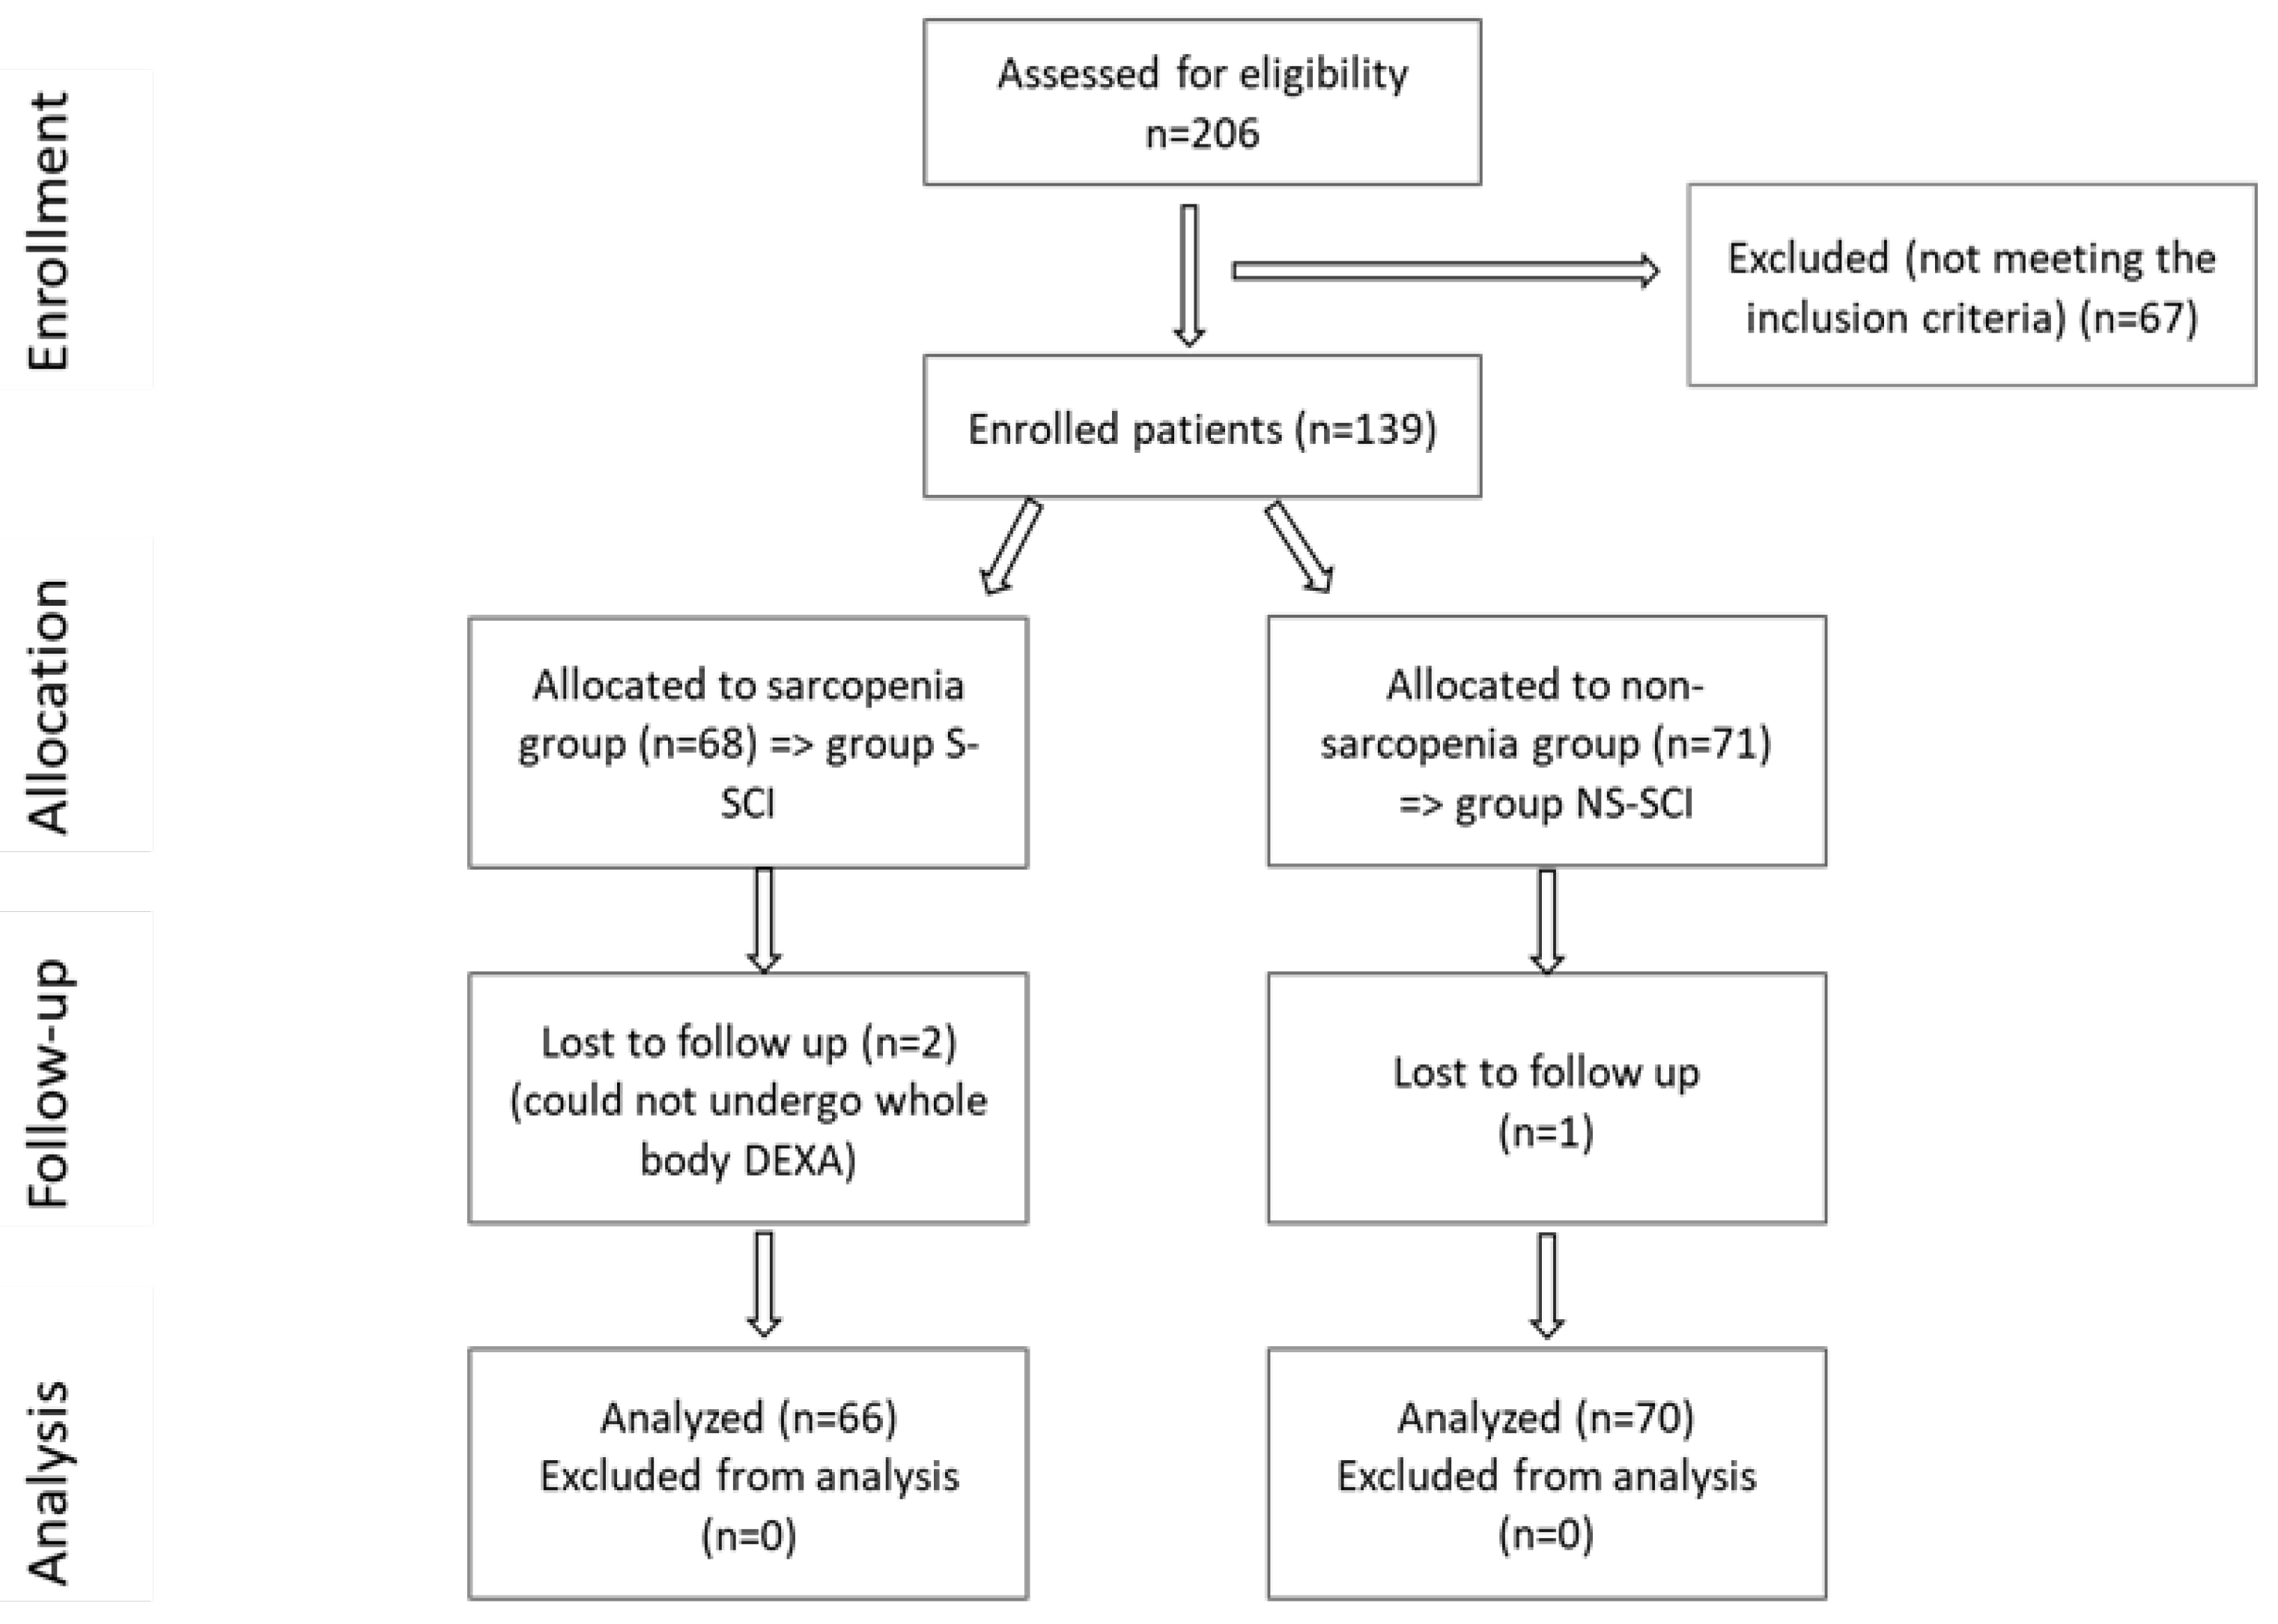
Inclusion criteria were: patients with an established diagnosis of SCI from traumatic caus-es, aged 18 to 75 years, and at least 6 months since the traumatic event. Exclusion criteria for the study were: age under 18 years, SCI due to non-traumatic causes such as: degenerative cervical myelopathy, tumors, birth defects, disruption of the blood supply to the spinal cord, multiple sclerosis, amyotrophic lateral sclerosis, infections and patients who could not undergo whole body DXA.
A total of 206 SCI patients were recruited, as can be seen in the CONSORT flow chart shown in figure 1, but only 136 met the inclusion criteria. Subjects were divided into two groups, according to the presence or absence of sarcopenia:
- Group S-SCI, included 66 patients with SCI and sarcopenia, and
2.3. Study Tools
This study used the revised ASIA scale (proposed by the American Spinal Injury Association) to assess the severity of spinal cord injury. This scale evaluates the motor score (by assessing key muscles) and the sensory score, by testing tactile and pain sensitivity such as a light touch and a pin prick (on dermatomes) [15] (Figure 2).
The level of spasticity was assessed using the Modified Ashworth scale (MAS) [16]. The original Ashworth Scale is a numerical scale from 0 to 4. Lower scores indicate normal muscle tone and higher scores represent spasticity [17]. The MAS adds 1+ to the scale to increase sensitivity (figure 3) [18].
Bone mineral density was determined using Dual X-ray Absorptiometry (DXA) for all patients (Medix 90, Medilink Sarl, France). Skeletal Muscle Mass Index (SMI) (appendicular skeletal muscle (ASM) to height2: SMI = ASM/h2; kg/m2) [19] or ALM (Apendicular Lean Muscle Mass) was determined via full-body dual-energy X-ray absorptiometry (DXA) using Whole Body Assessment. We established the diagnosis of sarcopenia according to the cut-off value recommended by EWGSOP2 for ALM. This cut-off value was 0.54. DXA indicates the total amount of lean tis-sue, but does not measure muscle mass. Appendicular lean mass (ALM), derived from DXA scans, is the sum of lean tissue in the arms and legs. ALM alone, or scaled to squared height (ALM/height2) or body mass index (ALM/body mass index), is the most common measure used as a proxy for muscle mass in our sarcopenia study [19]. Immobilization osteoporosis diagnosis was established using the Z-score for the lumbar spine and right and left hip via DXA, and according to the EWGSOP the Z-score cut-off value is -1.5 [20].
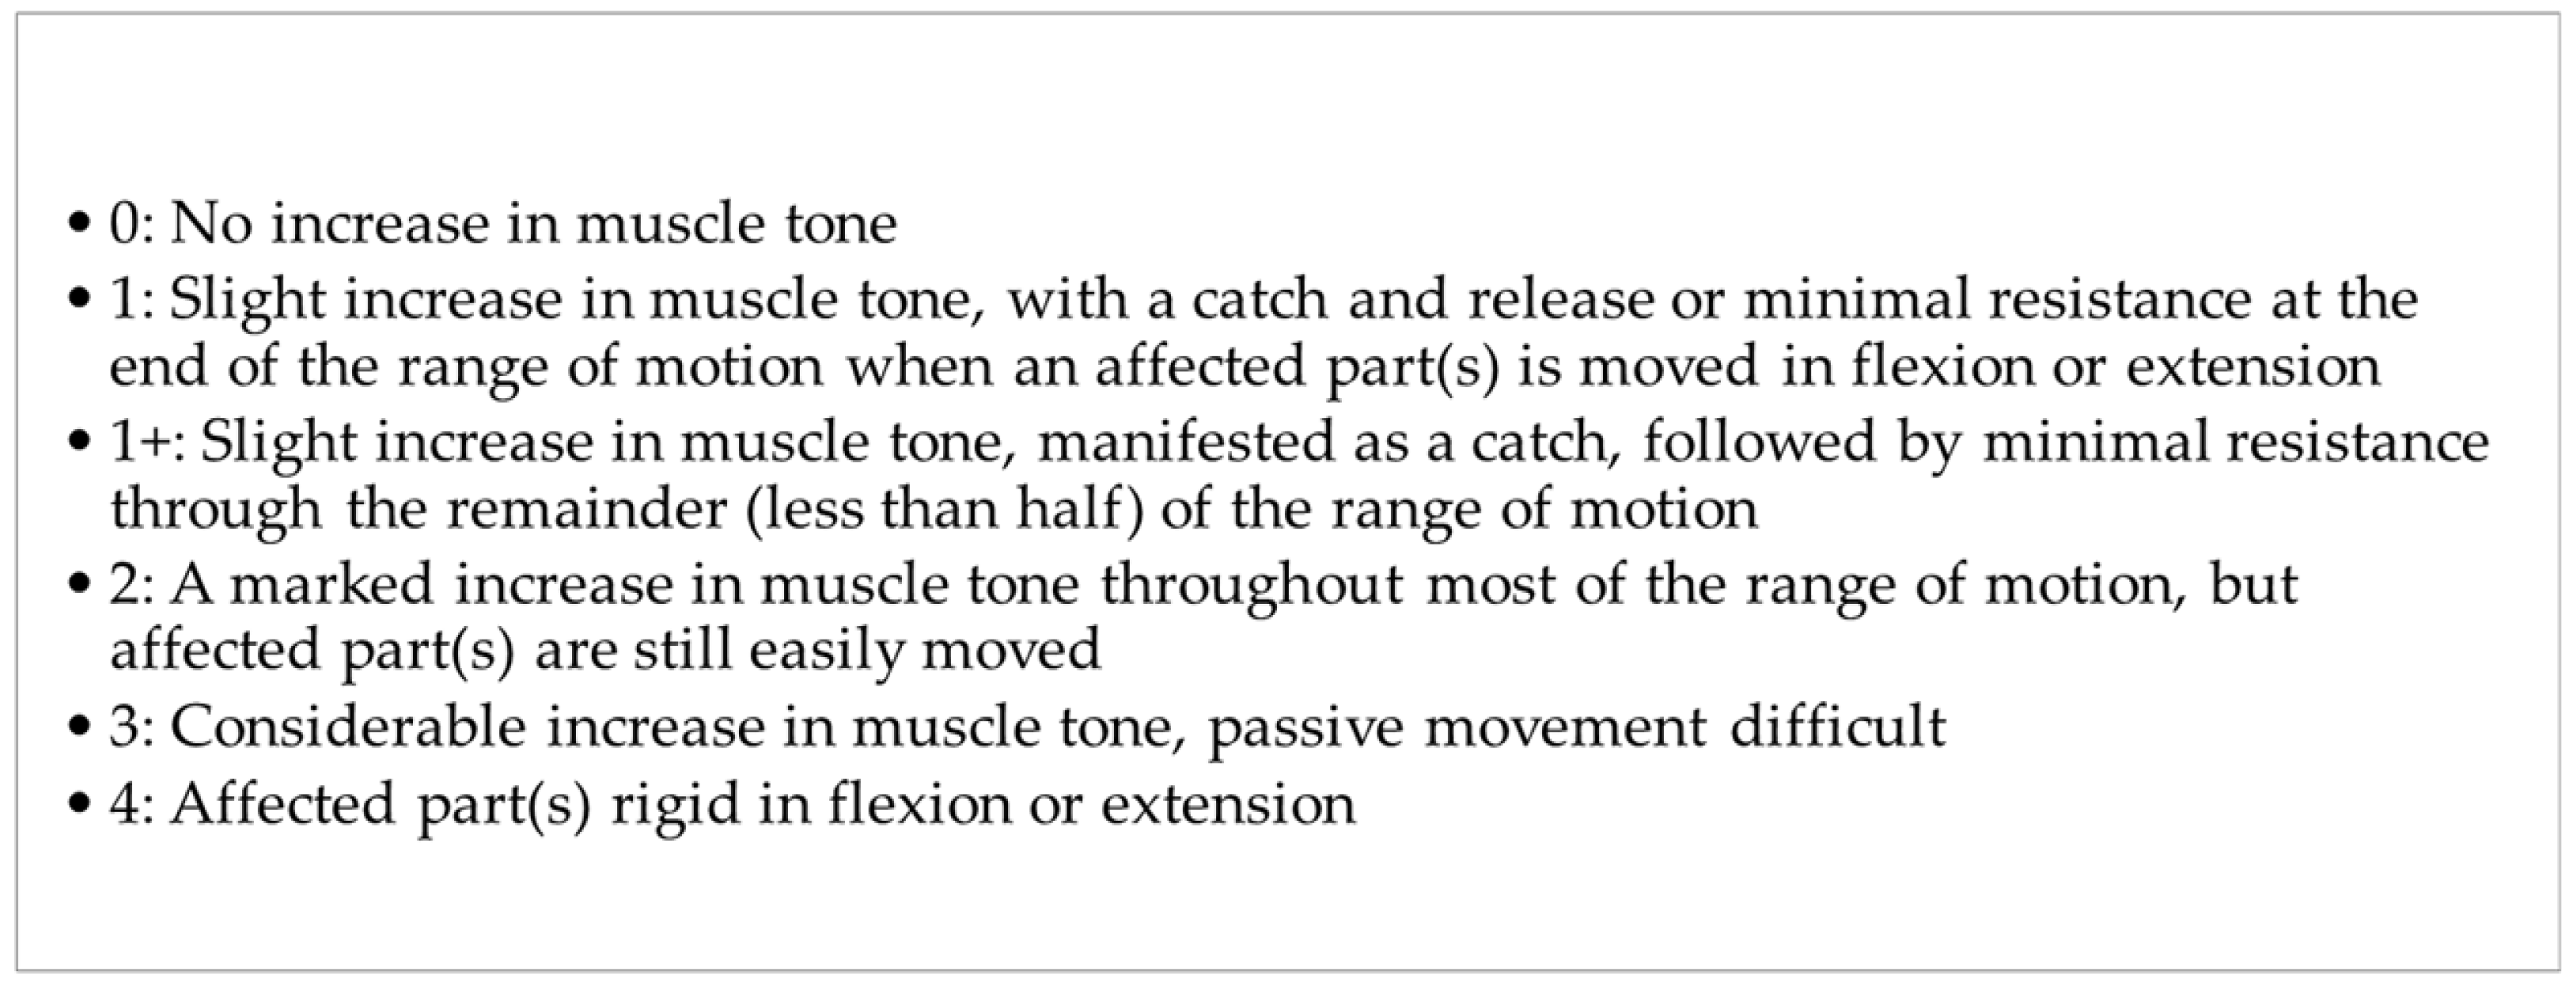
Figure 3.
The Modified Ashworth Scale (MAS).
The period of time since the spinal cord injury and the evaluation moment was calculated in months.
2.4. Study hypotheses
Given the latest research on sarcopenia and the fact that sarcopenia and SCI often coexist, but little is known about the associations between these two pathologies, our study aimed to assess the impact of SCI on muscle and bone mass and the correlations between a series of clinical characteristics of SCI patients, such as: the neurological level of injury, the type of lesion (complete versus incomplete), AIS grade, level of spasticity measured with the modified Ashworth Scale (MAS), period of time since the traumatic event and presence of complications and the prevalence of sarcopenia in these patients.
We hypothesized that more men than women would have SCI, according to the epidemiological studies in literature [10] and that more women would be susceptible to having sarcopenia [21]. We also presumed that patients with a complete lesion would be more susceptible of developing sarcopenia, versus patients with an incomplete lesion. We assumed that the presence of immobilization osteoporosis is directly related to the risk of developing secondary sarcopenia in patients with SCI, based on our clinical observations and experience, but also based on literature review [20,22]. Regarding the period of time elapsed since SCI, we hypothesized that the mean time since injury was longer for the sarcopenia patients compared to those without sarcopenia [23].
2.5. Statistical Analysis
All statistical analysis was generated using the JASP software, version 0.18.0. The calculation of the p-values was performed using Student t-test and the Mann-Whitney U test for numerical variables. The Poisson regression was used for count data and the chi-square test for nominal and ordinal variables. For accurate results we conducted multiple comparisons; to control the false-positive rate, we conducted the Bonferroni correction when assessing the statistical significance of the results: we compared the obtained p-values with α* = 0.05/k, where k is the number of tests conducted.
3. Results
The demographic data, number of months since SCI, neurological level of injury (NLI), AIS grade, MAS score, comorbidities, Z-score for immobilization osteoporosis cases, for both study groups (Group S—SCI, Group NS—SCI) are presented in Table 1.
75% of women were diagnosed with sarcopenia (table 1). On the other hand, 42.9% of men were diagnosed with sarcopenia. A chi-square test in each gender group was performed to test these differences. Multiple comparisons were performed; therefore, Bonferroni correction was used to control the false-positive rates: we compared the obtained p-values with α^*=0.05⁄k, where k is the number of tests conducted (k=2 in this case). As the Chi-square tests show, women are more likely to be diagnosed with sarcopenia (p < 0.025), whereas among men, these proportions do not seem to differ significantly. The computed log odds ratio showed that women were approximately 1.4 times (40%) more likely to be diagnosed with sarcopenia than men.
The mean age of the sarcopenic patients was lower than the mean age of the patients without sarcopenia (35.8 years and 41.5 years respectively). The minimum age in the NS-SCI group was 20 years, while in the S-SCI group was 18 years; the maximum age in the NS-SCI group was 73 years, while in the S-SCI group it was 67 years. Statistical significance of these differences was tested conducting the t-test for independent samples. The results showed that patients with sarcopenia were significantly younger than those without sarcopenia p<0.05, and the effect size is medium (d=0.431) (figure 4a).
The mean time since the SCI was 55 months (ranging from 2 months to 312 months) in the sarcopenia group and about 47 months (ranging from 12 months to 132 months) in non-sarcopenia group. The statistical significance of this difference was tested using the non-parametric Mann-Whitney U test, because the normality and equality of variances assumptions were not met by our data. According to the Mann-Whitney U test, our data do not support the hypothesis that the mean time since the SCI is longer for the sarcopenia patients compared to those without sarcopenia (W=2379,p>0.05, figure 4b).
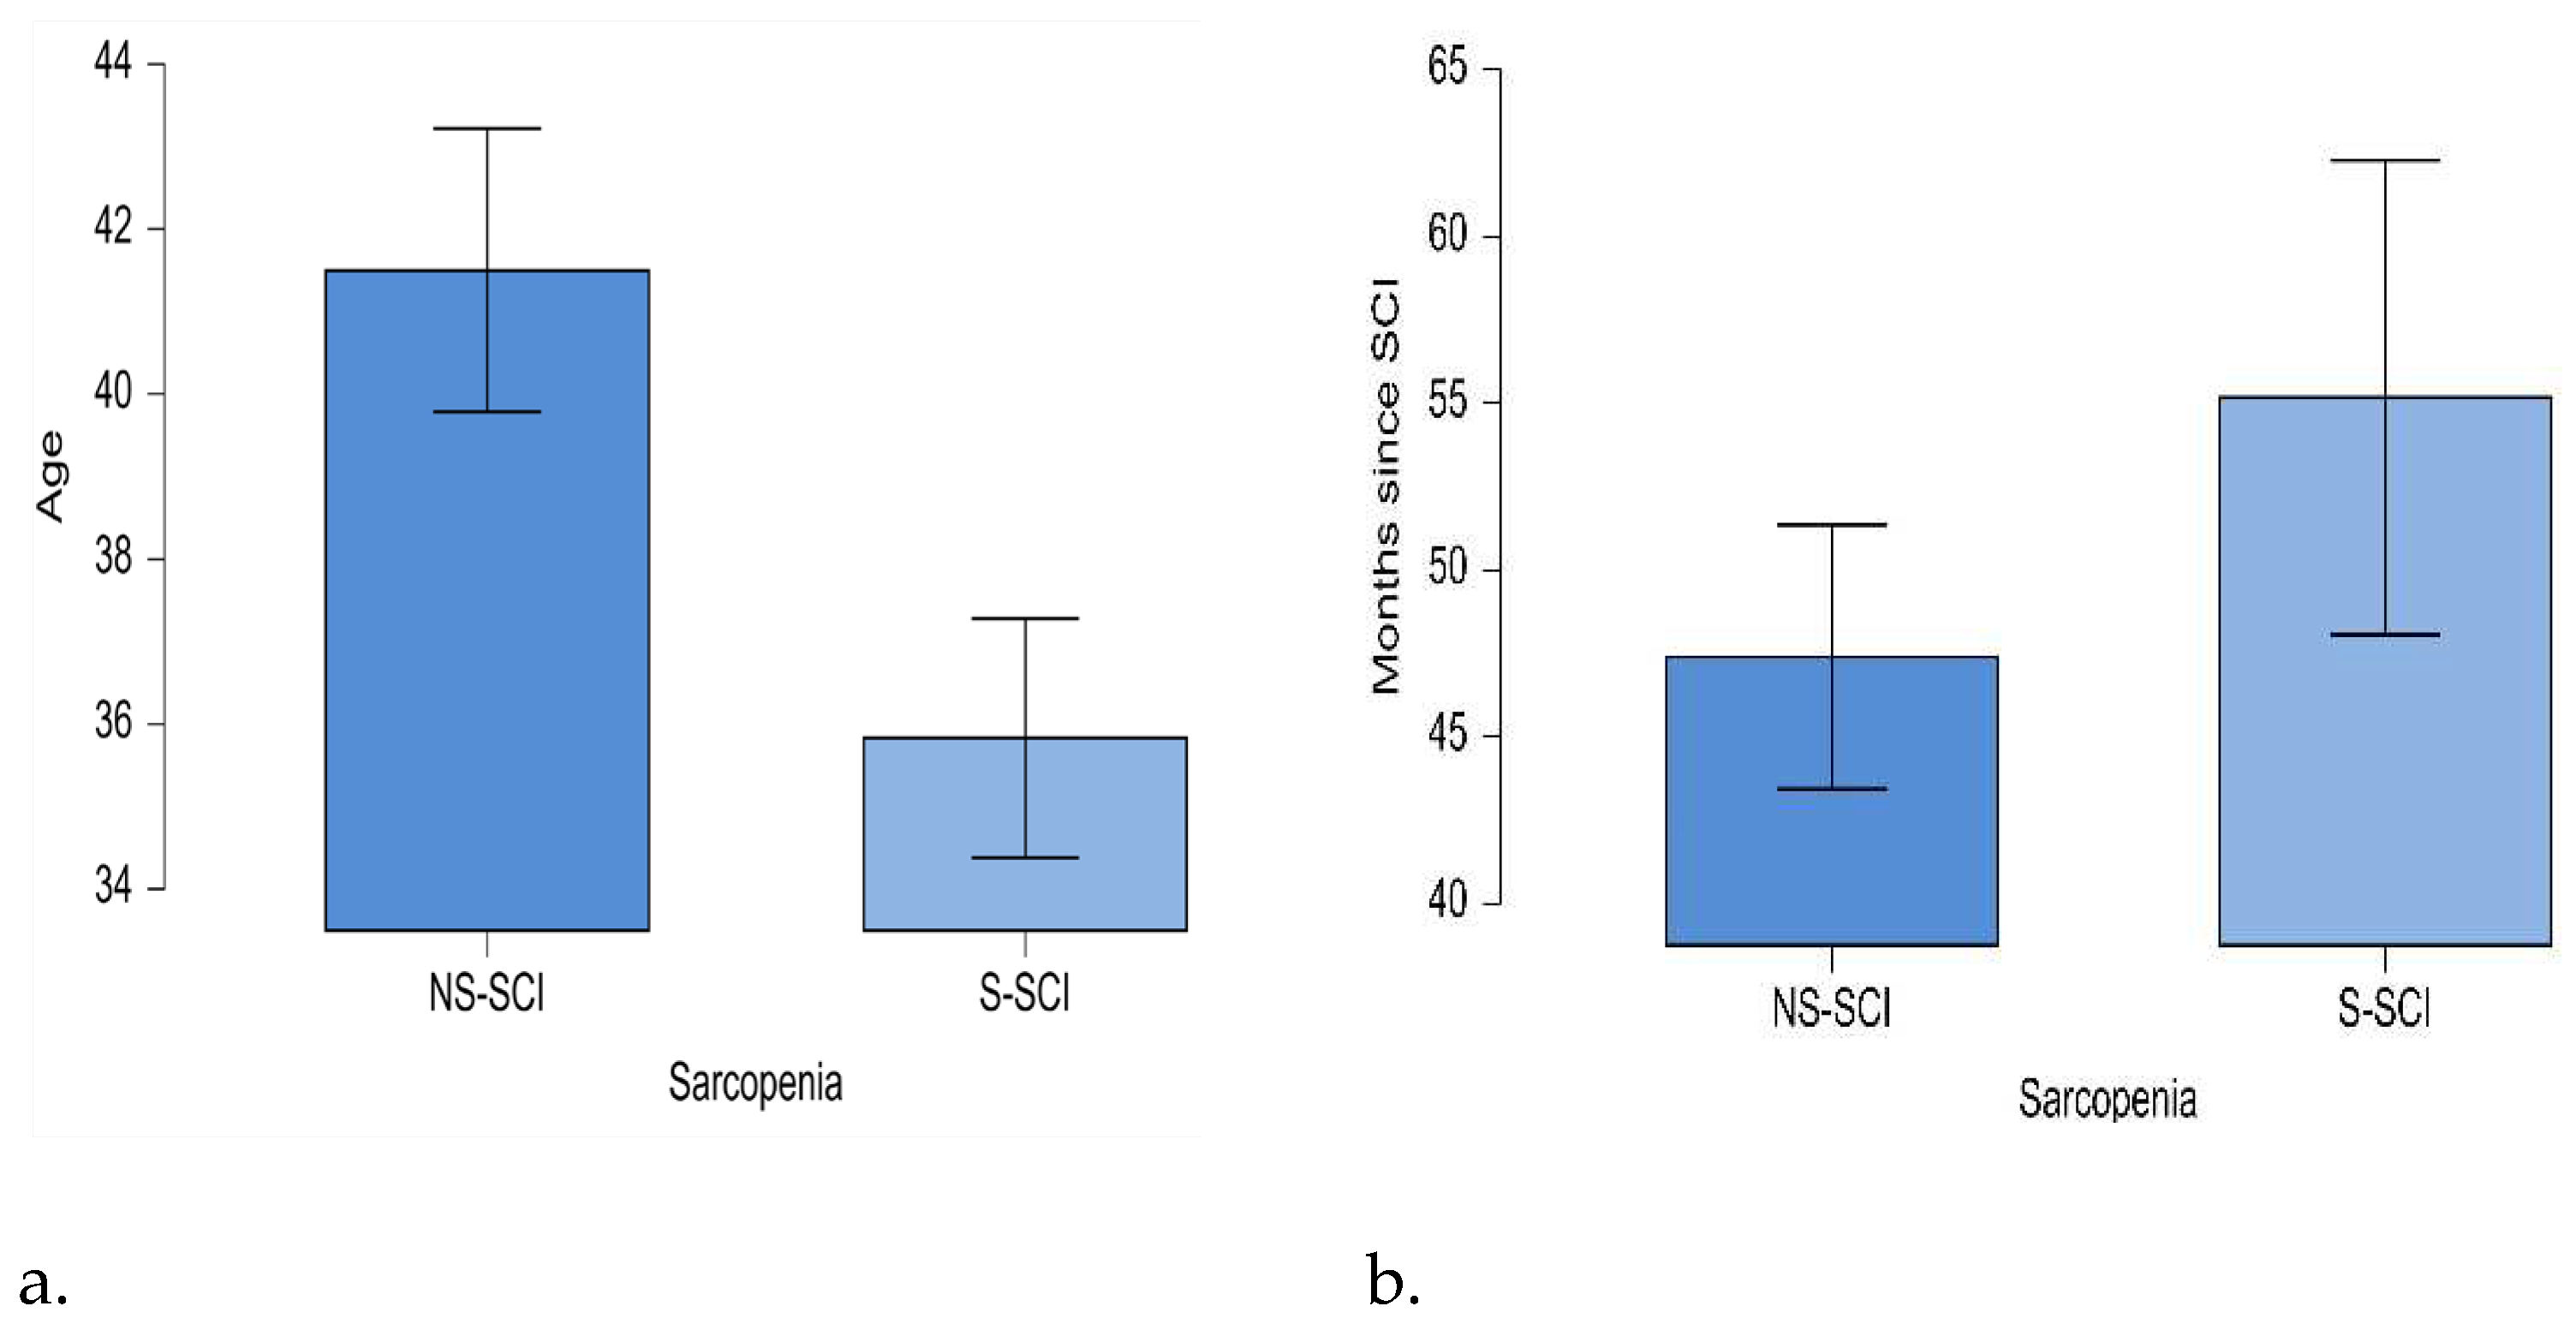
Figure 4.
a. Mean age (years) of patients in the two groups: NS-SCI and S-SCI. b. Mean time (months) since SCI in the two groups: NS-SCI and S-SCI.
Figure 4.
a. Mean age (years) of patients in the two groups: NS-SCI and S-SCI. b. Mean time (months) since SCI in the two groups: NS-SCI and S-SCI.
Descriptive statistics in table 1 revealed that among the patients with a cervical (C)-level injury slightly more were diagnosed with sarcopenia (52.9%). Among the patients with a lumbar (L)-level injury, 40% of the patients were diagnosed with sarcopenia. Finally, among the patients with a thoracic (T)-level injury, slightly fewer were diagnosed with sarcopenia (47.1%). To test whether the frequency distributions of the SCI groups were similar across the lesion levels groups, we conducted a Chi-square test within each lesion level group. Bonferroni correction was also used as we conducted multiple comparisons, to control the false-positive rate: we compared the obtained p-values with α^*=0.05⁄k, where k is the number of tests conducted (k=3 in this case). The results are presented in table 1. The data showed that the prevalence of sarcopenia did not vary across the three lesion level groups, as p>0.017.
Descriptive statistics in table 1 also showed that among the patients with AIS Grade A slightly more were diagnosed with sarcopenia (55.8%). 59% of the patients with AIS Grade B were diagnosed with sarcopenia. Among the patients with AIS Grade C 28.6% were diagnosed with sarcopenia, while 35.3% of the patients with AIS Grade D were diagnosed with sarcopenia. We conducted a Chi-square test within each AIS grade group to test whether the frequency distributions of the SCI groups are similar across the AIS grade groups. As we conducted multiple comparisons, and to control the false-positive rate, we conducted the Bonferroni correction: we compared the obtained p-values withα^*=0.05⁄k, where k is the number of tests conducted (k=4 in this case). The results are presented in table 1. We did not find any statistically significant differences in the proportions of S-SCI and NS-SCI patients across the AIS grade groups (p > 0.0125).
Regarding the level of spasticity, our data showed that 69.7% of the patients with MAS level 0 were diagnosed with sarcopenia. Among patients with MAS level 1, 42.9% were diagnosed with sarcopenia, while 57.1% were not. Among patients with MAS level 2, 41.5% were diagnosed with sarcopenia and among those with a MAS level 3, 40.7% had sarcopenia. Finally, among the patients with a level 4 on the Modified Ashworth scale, 42.9% were diagnosed with sarcopenia. To test whether the frequency distributions of the SCI groups were similar across the Ashworth level groups, we conducted a Chi-square test within each Ashworth level group. We conducted the Bonferroni correction: we compared the obtained p-values with α^*=0.05⁄k, where k is the number of tests conducted ( k=5 in this case), as we conducted multiple comparisons and also to control the false-positive rate. We did not find any statistically significant differences in the proportions of S-SCI and NS-SCI patients across the Ashworth level groups (p > 0.01).
Data presented in table 2 revealed that the mean Z-scores for the lumbar area (lumbar Z-score), the right hip (right hip Z-score) and the left hip (left hip Z-score) tend to be lower in the S-SCI group compared to the NS-SCI group.

Table 2.
Descriptive statistics for Z-scores across the S-SCI and NS-SCI groups.
| Region scor Z | Group | M± SD | MIN | MAX |
|---|---|---|---|---|
| Lumbar Z-score | Group NS-SCI | -1.280±0,976 | -3.500 | 1.400 |
| Group S-SCI | -1.318±1.182 | -4.600 | 1.900 | |
| Right hip Z-score | Group NS-SCI | -1.444±1.454 | -3.700 | 4.400 |
| Group S-SCI | -1.948±0,945 | -3,900 | -0,100 | |
| Left hip Z-score | Group NS-SCI | -1.467±1,233 | -3.700 | 2.800 |
| Group S-SCI | -1.802±1.330 | -3.900 | 5.200 |
M: mean value; SD: standard deviation value; N: number of the patients; Group NS—SCI: patients with SCI, without sarcopenia; Group S—SCI: patients with SCI, and sarcopenia; MIN: Minimum value of Z-score; MAX: Maximum value of Z-score.
Moreover, 41% of the patients without osteoporosis were diagnosed with sarcopenia. Among the patients with osteoporosis 51.6% were diagnosed with sarcopenia. We conducted a Chi-square test within each group to test whether the frequency distributions of the SCI groups were similar across patients with or without osteoporosis. The Bonferroni correction was used as we performed multiple comparisons, and also to control the false-positive rate: we compared the obtained p-values with α^*=0.05⁄k, where k is the number of tests conducted (k=2 in this case). The results are presented in table 3.
Table 3.
Frequency of immobilization osteoporosis in the S-SCI and NS-SCI groups.
| Immobilization Osteoporosis | Group NS—SCI | Group S—SCI | p-value** |
|---|---|---|---|
| Yes, N (%) | 47 (48.45) | 50 (51.55) | 0.761** NS |
| No, N (%) | 23 (58.97) | 16(41.03) | 0.262** NS |
N: number of the patients; Group NS—SCI: patients with SCI, without sarcopenia; Group S—SCI: patients with SCI, and sarcopenia ; p-value statistical significance (**, Chi-Squared); NS-without statistical significance.
We did not find significant differences in the frequency distributions of immobilization osteoporosis across the groups of patients with and without sarcopenia (p > 0.025).
The mean number of comorbidities was 2 in non-sarcopenia group (ranging between 0 and 6) and 2.7 in sarcopenia group (ranging between 0 and 8) (figure 5). The most common comorbidity in each group was hypertension. Among the patients without hypertension, the number of sarcopenic and non-sarcopenic patients was almost the same (50.4% versus 49.6%). 30.8% of the patients with hypertension were diagnosed with sarcopenia. To test whether the frequency distributions of the SCI groups were similar across patients with or without hypertension, we conducted a Chi-square test within each group. We conducted the Bonferroni correction: we compared the obtained p-values with α^*=0.05⁄k, (k=number of conducted tests, 2 in this case). We did not find a statistically significant association between sarcopenia and the presence of hypertension (p > 0.025).
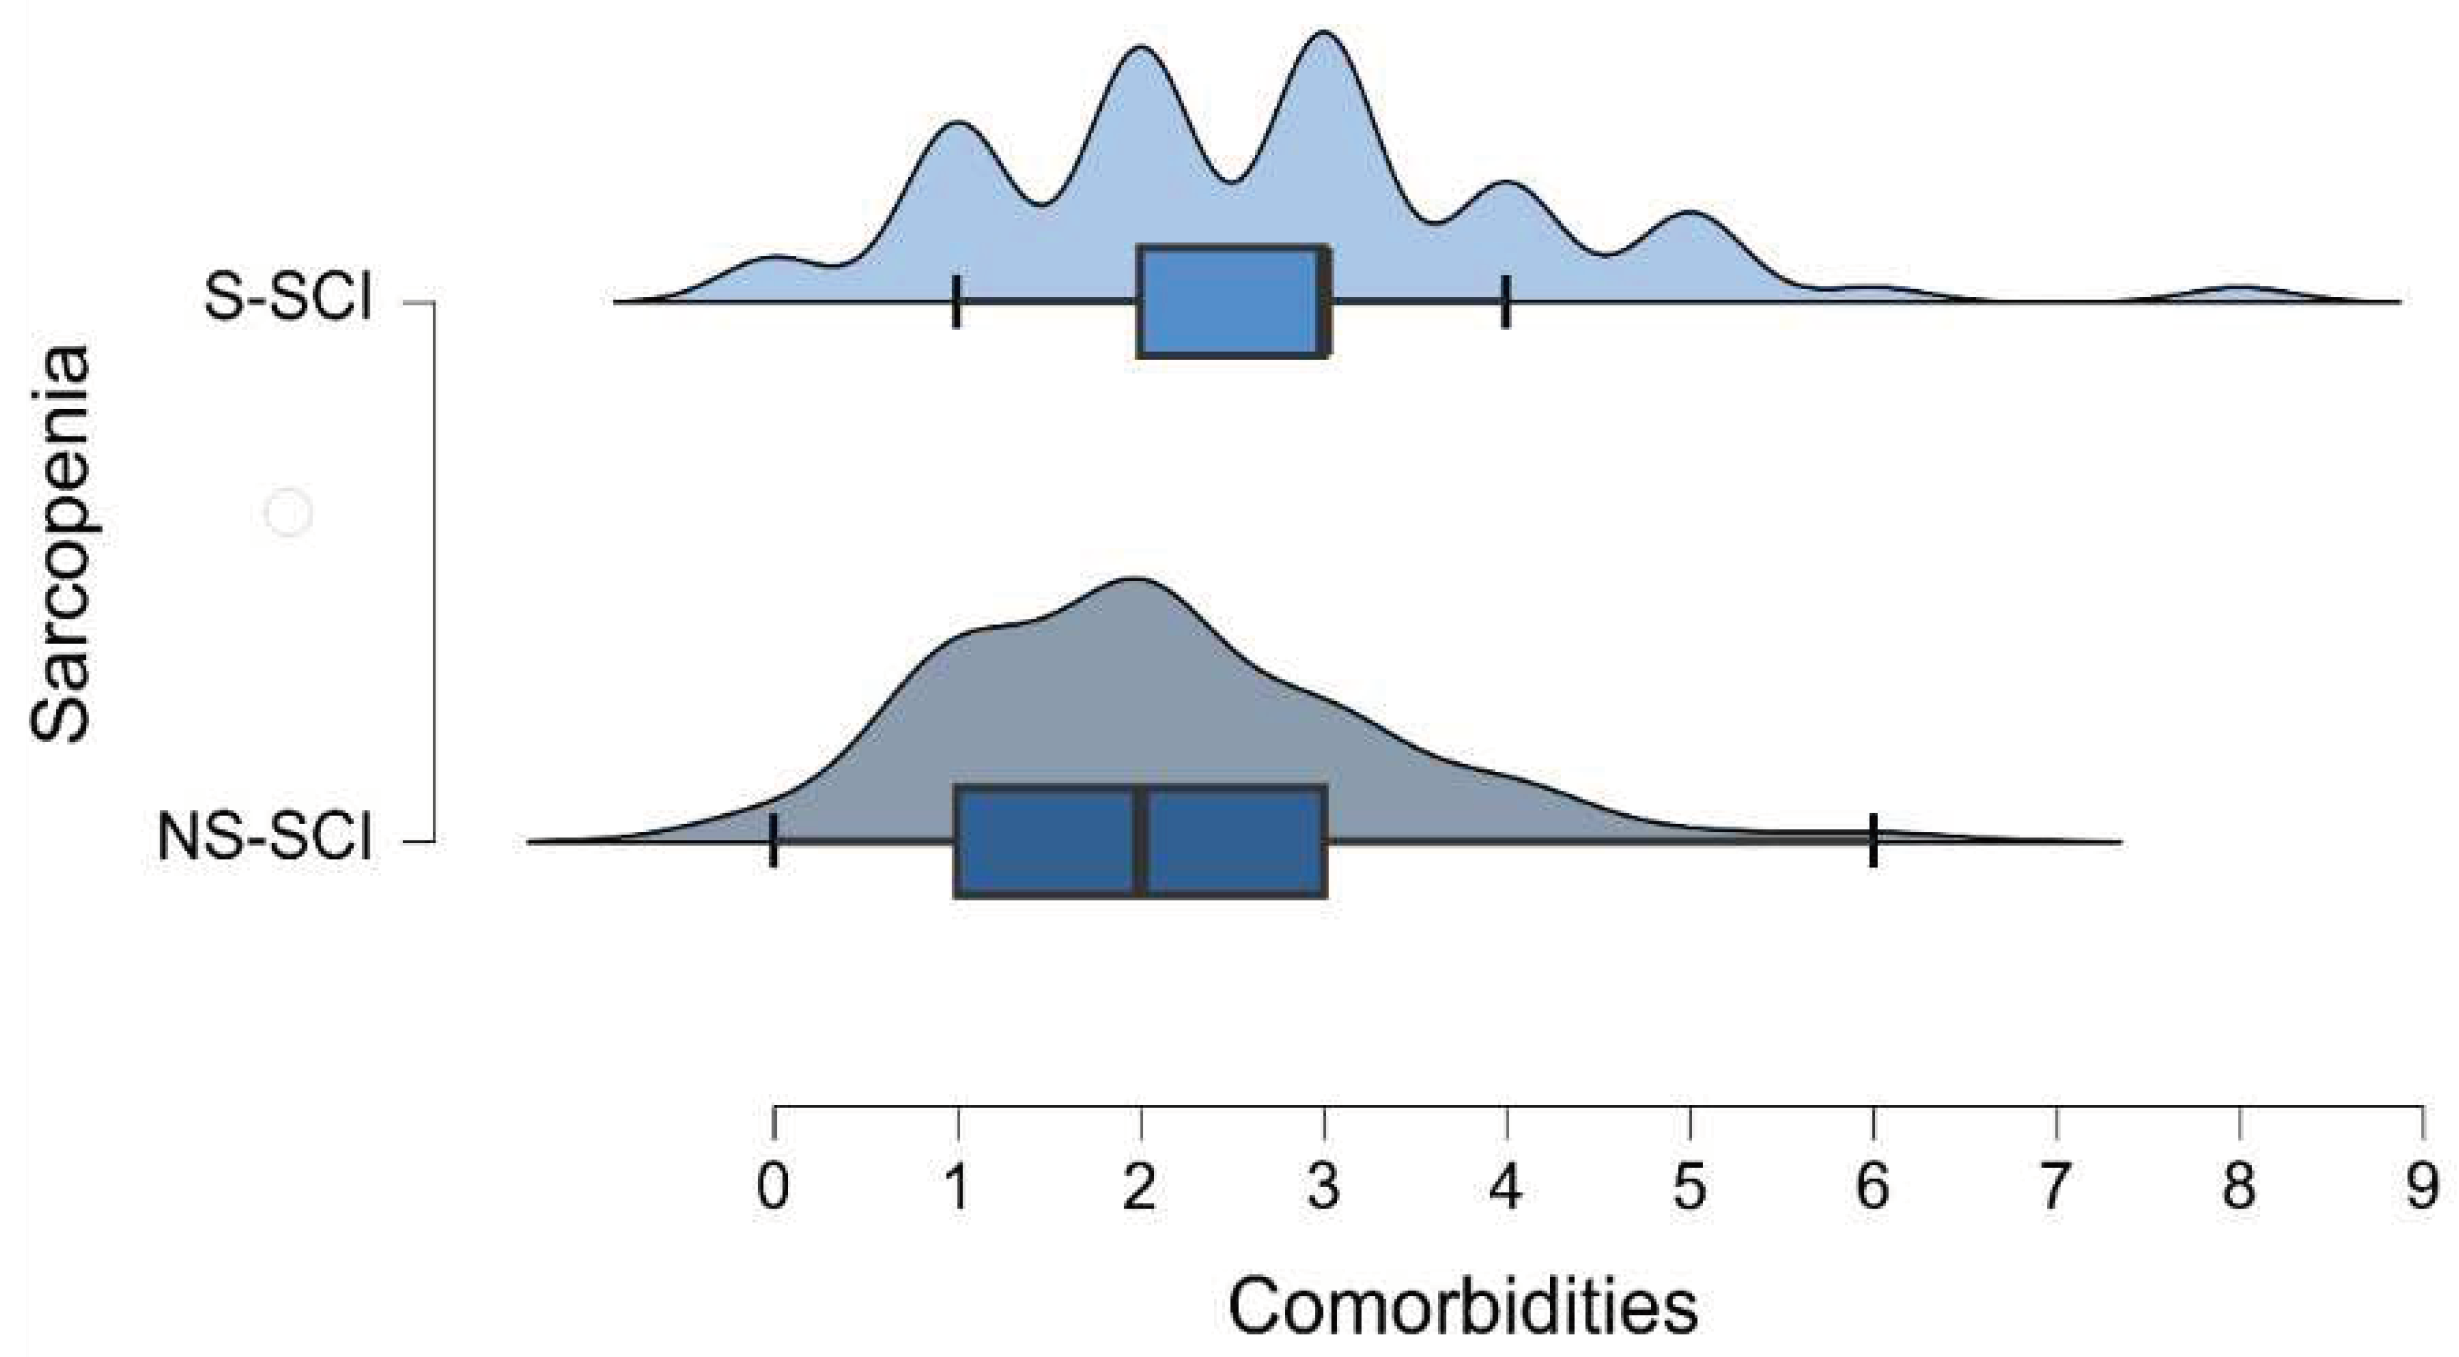
Figure 5.
Density plot of the number of comorbidities across the groups of patients with and without sarcopenia.
Figure 5.
Density plot of the number of comorbidities across the groups of patients with and without sarcopenia.
Poisson regression (a.k.a. log-linear model) was used to test the association between sarcopenia and the number of comorbidities. The Deviance goodness-of-fit test indicates that the model fits the data [D (134) = 107.858, p=0.953]. The tables below (table 4 and table 5) show the model summary and the model coefficients.
Table 4.
Model summary for the number of comorbidities.
| Model | Deviance | AIC | BIC | df | Χ² | p-value** |
|---|---|---|---|---|---|---|
| H₀ | 112.701 | 465.175 | 468.088 | 135 | ||
| H₁ | 107.858 | 462.332 | 468.157 | 134 | 4.843 | 0.028 |
H₀: The Null Hypothesis; H₁: The Alternative Hypothesis; Χ²: Chi-Squared test; p-values statistical significance (**, Chi-Squared); AIC: Akaike Information Criterion (AIC), BIC (Bayesian Information Criterion) (53, 54).
H₀: The Null Hypothesis; H₁: The Alternative Hypothesis; Χ²: Chi-Squared test; p-values statistical significance (**, Chi-Squared); AIC: Akaike Information Criterion (AIC), BIC (Bayesian Information Criterion) (53, 54).
The Model Summary table shows that there was a significant effect of sarcopenia on the number of comorbidities that patients were diagnosed with [χ^2 (1)=4.843,p<0.05]. Thus, the Coefficients table reveals that the number of comorbidities is 1.279 times higher in patients with sarcopenia than in those without the disease. In other words, there is a 27.9% increase in the number of comorbidities among patients with sarcopenia compared to those without the condition.
Table 5.
Model coefficient for the number of comorbidities.
| Coefficients | 95 % Confidence Interval for B | ||||||
|---|---|---|---|---|---|---|---|
| B | Std. Error | Exp(B) | Z-score | p-value ** | Lower Bound | Upper Bound | |
| Intercept | 0.735 | 0.083 | 2.086 | 8.882 | < 0,001 | 0.568 | 0.893 |
| Sarcopenia (Yes) | 0.246 | 0.112 | 1.279 | 2.195 | 0.028 | 0.027 | 0.466 |
p-values statistical significance (**, Chi-Squared); Std. Error: standard error; B: regression coefficient.
4. Discussion
The goal of this study was to assess the impact of SCI on muscle and bone mass, and the correlations between different clinical characteristics of SCI patients and the presence of sarcopenia in these cases.
SCI, inability or decreased ability to perform physical exercise are often associated with sarcopenia [24,25,26]. The cross-sectional area of the skeletal muscle (which represents approximately 40% of the body weight) decreases fast in the following 1-17 months after a trauma. Muscular atrophy in patients with SCI is partially explained by the rapid changes in the quality of muscle proteins, activating proteolytic enzymes and proteases from mitochondria, the increase in the production of reactive oxygen species and decrease in oxidative capacity [27,28]. According to these data, we expected to diagnose a high percentage of patients with sarcopenia, but, to our surprise, of all SCI cases, over 51% did not have sarcopenia.
Comparing the 2 groups of patients with SCI (group S—SCI and group NS—SCI), there were statistically significant differences between the two study groups regarding gender, age and presence of comorbidities. Our results revealed that 75% of women suffering from SCI were diagnosed with sarcopenia. This finding was in line with the results of a study published by Hwang and Park (2022, N=2697) that examined the prevalence of sarcopenia according to gender in young-old adults, reporting a higher prevalence of sarcopenia in females [29]. Ishimoto et al. [30], in a retrospective analysis (2023, N= 97), reported that female sex was a risk factor for sarcopenia. Contrarily, Zhang et al. in the published meta-analysis (2021) revealed no statistically significant difference in the pooled prevalence of sarcopenia in patients with heart failure between men and women [31]. Analyzing the effect of postoperative muscle loss and surgery-induced sarcopenia on the long-term outcomes of patients with gastric cancer other authors found significant differences be-tween genders, more men having a rapid decrease in muscle mass, which impacted the overall survival [32].
However, our study revealed that women with SCI are more susceptible to develop sarcopenia. This could be due to the considerable sex-based differences in human skeletal muscle gene expression that regulates muscle mass, fiber composition and contractile function [33]. Considering the mentioned genetic traits, is more likely that women would develop sarcopenia than men, androgens having a powerful anabolic effect that promotes muscle regeneration, while estrogen has muscle-protective effect through anti-inflammatory pathway that inhibits proteolysis [34]. On the other hand, the number of male patients was significantly higher compared to the number of female patients participating in the study, in agreement with previous studies [30]. Our results showed a significant association between gender and the likelihood of having sarcopenia. Despite the small sample size of female patients with SCI, they are more likely to develop sarcopenia. The computed log odds ratio showed that women with SCI are approximately 1.4 times (40%) more likely to be diagnosed with sarcopenia, which reinforces and which strengthens the hypothesis issued at the beginning, and also accords with earlier observations [18]. 42.9% of men were diagnosed with sarcopenia. Studies investigating muscle mass or sarcopenia and its correlation with the functional status of patients with SCI are few and far between. Previous rather few studies have shown that sarcopenia, obesity, and sarcopenic obesity were prevalent among individuals with SCI; female sex, level of injury (tetraplegia), and a complete injury leading to inability to walk (AIS A, B) were identified as risk factors for sarcopenia in individuals with SCI [19,30].
The prevalence of sarcopenia may vary depending on the diagnostic criteria, definitions, study group, anthropometric values and measured parameters [8]. We need to be aware that we cannot perform a walking test to disabled, tetraplegic, or paraplegic patients. We also lack the proper measurement of strength, measured with hand dynamometers, because patients with tetraplegia cannot perform the handgrip test and for those with paraplegia it would be rather difficult or even impossible, depending on the neurological level of injury. Therefore, it would be biased, not to mention the fact that paraplegic wheelchair users develop stronger upper limbs through the training effect of their daily wheelchair activities.
Our results also revealed that patients with sarcopenia were significantly younger than those without sarcopenia. Primary sarcopenia is an age-related process associated with loss of muscle mass [35,36]. This doesn’t fit into the general frame of our study design, because patients suffering from SCI participating in the study were, in general, young adults, with a mean age of 41 years in the NS-SCI group and 35 years in the S-SCI group; this reinforces the above mentioned hypothesis, and aligns with epidemiological studies regarding the average age at which SCIs occur, which was 37.6 years in a study from 2000 [37]. Another study published in 2023 by Tanaka et al. (N= 1039) found a statistically significantly higher mean age in the sarcopenic group compared with non-sarcopenic [38]. However, secondary sarcopenia occurs if other factors besides aging are evident in the study sample, as per our research [39].
Paradoxical, we did not find any significant correlations between the presence of immobilization osteoporosis and sarcopenia, which we would have expected, as the prevalence of secondary osteoporosis in SCI is high [40]. The presence of sarcopenia was found to be associated with reduced bone mineral density and osteoporosis [41]. Yoshimura et al. in a study published in 2017 examined the relationship between osteoporosis and sarcopenia (diagnosed according to AWGS criteria) based on the results of a survey of bone mineral density in 1099 participants, and determined the osteoporosis prevalence of 24.9%. In addition, although 18.9% of these patients had sarcopenia, the prevalence of sarcopenia in the study group was 8.2% [42]. The prevalence of secondary conditions among patients with SCI depends on a variety of aspects; the severity and completeness of the injury are some of the most important ones. Gianna Rodriguez et all, in a study published in 2021(N=9081) investigated the risk of developing musculoskeletal comorbidities by comparing 9081 privately-insured patients with 1,474,232 adults without SCI, and the results showed that adults with SCIs have a significantly higher incidence and risk for musculoskeletal morbidities, as compared to adults without SCIs (43). However, in our study, despite the lack of statistical significance, an important percentage of patients (46.84%) from the S-SCI group were diagnosed with secondary osteoporosis.
Considering the Modified Ashworth scores, we expected that patients with a high degree of spasticity (who scored 3 or 4) would be less susceptible of developing sarcopenia. According to a study published in 2022 by Li et al. (N= 28) about sarcopenia following stroke, the authors demonstrated that spasticity in stroke survivors actually had a protective role against muscle loss in the lower limbs [43,44].
Many of the long-term outcomes of SCI are related to muscle and bone loss due to immobilization. The impact of SCI can vary depending on the neurological level of injury, but also on the type of lesion (complete/incomplete). There are short-term impacts and long-term impacts, as Leone et al. highlighted in a review article published in September 2023. Long-term impacts include sarcopenia and osteoporosis [45].
The last statistically significant difference between our study groups was the presence of comorbidities. On average, patients without sarcopenia had approximately 2 comorbidities associated with SCI, while patients with sarcopenia had approximately 2.7 comorbidities associated with SCI. Sarcopenia can be considered itself a comorbidity and often is studied in numerous clinical trials, and its seems that presence of sarcopenia is associated with other secondary conditions such as: respiratory disease, diabetes, dementia, and cardiovascular disease [46].
Secondary health conditions affecting the sensory, respiratory, cardio-vascular, genitourinary and tegumentary system impacts a SCI patient life being debilitating and potentially life-threatening [47]. Tallqvist et al. assessed the comorbidities and secondary health conditions (SHCs) among the Finnish population with SCI (2022, N=884) and found that the prevalence of comorbidities and SHCs was common among elderly persons with SCI, the age being the strongest predictor for multimorbidity [48].
In our research the most common comorbidity in both groups was hypertension; however, we did not find a statistically significant association between sarcopenia and presence of hypertension. Spinal cord injury instead can cause a variety of physiological changes. The sudden reduction of physical activity in individuals with SCI is translated into elevated risk of cardiovascular diseases; therefore it is among the leading causes of death in the SCI population [49].
Kepler et al. in a retrospective case–control study published in 2015 (N=92) investigated the effects of preexisting hypertension in a lot of patients with acute SCI and they found that chronic hypertension was an independent risk factor for poor outcomes in patients with acute SCI. This finding was independent of age and other comorbidities [50].
Strengths and limitations of the study
This is the first study in Romania, to our knowledge, that evaluated sarcopenia in SCI patients and its correlation with gender, age, time elapsed since the onset of the disease, injury level and muscle tone.
Our study had certain limitations: [1] Sarcopenia was diagnosed using only the ALM score, because some patients were tetraplegic and we couldn’t use the Jamar dynamometer to determine muscle strength, and we also couldn’t perform a walking test for neither of the patients; sarcopenia questionnaire such as: SARC-F [47] could not be used as well. [2] Moreover, the question remains, whether the cut-off points for normal and able-bodied populations can be applied to SCI patients. [3] Furthermore, SCI with its pathophysiology may influence the validity of the results.
Future directions
Future research is needed to establish clear definitions of sarcopenia in disabled SCI patients.
Following SCI many patients develop motor, but probably most important, functional impairments that can affect their daily living and reduce the quality of life [47]. In addition, in the chronic phase multiple complications can occur. One of them can be secondary sarcopenia; the rehabilitation goals during this phase is to prevent further damage from the injury and to slow down or reverse the process of muscle loss. The general recommendation for the management of sarcopenia is to follow a resistance based exercise program and to follow a high-protein diet [39].
There are several pharmacologic approaches to prevent or reduce muscle atrophy after SCI. Testosterone can increase muscle mass and strength in older individuals and a meta-analysis has con-firmed its safety [48]. Acetoside-treated muscles had a significantly greater mass when compared to vehicle treatment, which suggest that acetoside promotes skeletal muscle recovery and regeneration, potentially independent of exercise-induced myokine secretion [49]. Estrogen can also play a role in remodeling the extracellular matrix and muscle fiber expansion after unloading or not being used [50].
The number of patients suffering from SCI increases year after year, and so do the secondary complications that can occur alongside. The search for therapeutic modalities to improve the quality of their life continues.
5. Conclusions
The study results showed that patients with sarcopenia were significantly younger than those without sarcopenia. The following clinical features of SCI patients: sex, the type of injury, the presence of multiple comorbidities and age were directly associated with sarcopenia, while surprisingly enough, spasticity level and the presence of immobilization osteoporosis were not proved to be associated with sarcopenia. There was a statistically significant association between the ALM value and the gender, significantly more women with SCI developing sarcopenia. The number of male patients was significantly higher compared to the number of female cases participating in the study, but fewer men with SCI had sarcopenia.
Author Contributions
Conceptualization, A.G. and M.L.C..; methodology, C.D.N.C.; D.C.I. and D.S.; software, A.G. and D.C.I..; validation, M.L.C.; I.R.C. and D.V.; formal analysis, A.G.; investigation, S.D.; resources, M.L.C.; I.R.C.; data curation, S.D. and I.R.C.; writing—original draft preparation, A.G.; C.D.N.C.; writing—review and editing, C.D.N.C.; visualization, M.L.C. and D.V.; supervision, D.S.; project administration, A.G.; funding acquisition, M.L.C. All authors have read and agreed to the published version of the manuscript.”
Funding
This research received no external funding
Institutional Review Board Statement
Not applicable.
Informed Consent Statement
Informed consent was obtained from all subjects involved in the study.
Data Availability Statement
Data of the patients are available in the medical archive of the hospital.
Acknowledgments
The authors would like to thank to the University of Oradea, Oradea, Romania, for supporting the APC.
Conflicts of Interest
The authors declare no conflict of interest.
References
- Moga, T.D.; Nistor-Cseppento, C.D.; Bungau, S.G.; Tit, D.M.; Sabau, A.M.; Behl, T.; Nechifor, A.C.; Bungau, A.F.; Negrut, N. The Effects of the 'Catabolic Crisis' on Patients' Prolonged Immobility after COVID-19 Infection. Medicina (Kaunas) 2022, 58. [Google Scholar] [CrossRef] [PubMed]
- Coletta, G.; Phillips, S.M. An elusive consensus definition of sarcopenia impedes research and clinical treatment: A narrative review. Ageing Res Rev 2023, 86, 101883. [Google Scholar] [CrossRef] [PubMed]
- Rosenberg, I.H. Sarcopenia: origins and clinical relevance. Clin Geriatr Med 2011, 27, 337–339. [Google Scholar] [CrossRef] [PubMed]
- Yuan, S.; Larsson, S.C. Epidemiology of sarcopenia: Prevalence, risk factors, and consequences. Metabolism 2023, 144, 155533. [Google Scholar] [CrossRef]
- Cevei, M.; Onofrei, R.R.; Gherle, A.; Gug, C.; Stoicanescu, D. Rehabilitation of Post-COVID-19 Musculoskeletal Sequelae in Geriatric Patients: A Case Series Study. Int J Environ Res Public Health 2022, 19. [Google Scholar] [CrossRef] [PubMed]
- Cruz-Jentoft, A.J.; Baeyens, J.P.; Bauer, J.M.; Boirie, Y.; Cederholm, T.; Landi, F.; Martin, F.C.; Michel, J.P.; Rolland, Y.; Schneider, S.M.; et al. Sarcopenia: European consensus on definition and diagnosis: Report of the European Working Group on Sarcopenia in Older People. Age Ageing 2010, 39, 412–423. [Google Scholar] [CrossRef] [PubMed]
- Dionyssiotis, Y.; Skarantavos, G.; Petropoulou, K.; Galanos, A.; Rapidi, C.A.; Lyritis, G.P. Application of current sarcopenia definitions in spinal cord injury. J Musculoskelet Neuronal Interact 2019, 19, 21–29. [Google Scholar] [PubMed]
- Cruz-Jentoft, A.J.; Bahat, G.; Bauer, J.; Boirie, Y.; Bruyère, O.; Cederholm, T.; Cooper, C.; Landi, F.; Rolland, Y.; Sayer, A.A.; et al. Sarcopenia: revised European consensus on definition and diagnosis. Age Ageing 2019, 48, 16–31. [Google Scholar] [CrossRef] [PubMed]
- Polito, A.; Barnaba, L.; Ciarapica, D.; Azzini, E. Osteosarcopenia: A Narrative Review on Clinical Studies. Int J Mol Sci 2022, 23. [Google Scholar] [CrossRef]
- Barbiellini Amidei, C.; Salmaso, L.; Bellio, S.; Saia, M. Epidemiology of traumatic spinal cord injury: a large population-based study. Spinal Cord 2022, 60, 812–819. [Google Scholar] [CrossRef]
- Shackleton, C.; Evans, R.; Shamley, D.; West, S.; Albertus, Y. Effectiveness of over-ground robotic locomotor training in improving walking performance, cardiovascular demands, secondary complications and user-satisfaction in individuals with spinal cord injuries: A systematic review. J Rehabil Med 2019, 51, 723–733. [Google Scholar] [CrossRef] [PubMed]
- Gorgey, A.S.; Dudley, G.A. Skeletal muscle atrophy and increased intramuscular fat after incomplete spinal cord injury. Spinal Cord 2007, 45, 304–309. [Google Scholar] [CrossRef] [PubMed]
- Nistor-Cseppento, C.D.; Gherle, A.; Negrut, N.; Bungau, S.G.; Sabau, A.M.; Radu, A.F.; Bungau, A.F.; Tit, D.M.; Uivaraseanu, B.; Ghitea, T.C.; et al. The Outcomes of Robotic Rehabilitation Assisted Devices Following Spinal Cord Injury and the Prevention of Secondary Associated Complications. Medicina (Kaunas) 2022, 58. [Google Scholar] [CrossRef]
- Kim, T.N.; Choi, K.M. Sarcopenia: definition, epidemiology, and pathophysiology. J Bone Metab 2013, 20, 1–10. [Google Scholar] [CrossRef] [PubMed]
- Roberts, T.T.; Leonard, G.R.; Cepela, D.J. Classifications In Brief: American Spinal Injury Association (ASIA) Impairment Scale. Clin Orthop Relat Res 2017, 475, 1499–1504. [Google Scholar] [CrossRef] [PubMed]
- Meseguer-Henarejos, A.B.; Sánchez-Meca, J.; López-Pina, J.A.; Carles-Hernández, R. Inter- and intra-rater reliability of the Modified Ashworth Scale: a systematic review and meta-analysis. Eur J Phys Rehabil Med 2018, 54, 576–590. [Google Scholar] [CrossRef] [PubMed]
- ASHWORTH, B. PRELIMINARY TRIAL OF CARISOPRODOL IN MULTIPLE SCLEROSIS. Practitioner 1964, 192, 540–542. [Google Scholar] [PubMed]
- Ansari, N.N.; Naghdi, S.; Arab, T.K.; Jalaie, S. The interrater and intrarater reliability of the Modified Ashworth Scale in the assessment of muscle spasticity: limb and muscle group effect. NeuroRehabilitation 2008, 23, 231–237. [Google Scholar] [CrossRef]
- Harvey, N.C.; Orwoll, E.; Kwok, T.; Karlsson, M.K.; Rosengren, B.E.; Ribom, E.; Cauley, J.A.; Cawthon, P.M.; Ensrud, K.; Liu, E.; et al. Sarcopenia Definitions as Predictors of Fracture Risk Independent of FRAX. J Bone Miner Res 2021, 36, 1235–1244. [Google Scholar] [CrossRef]
- Bagur, A.; Vega, E.; Mautalen, C. Discrimination of total body bone mineral density measured by dexa in vertebral osteoporosis. Calcif Tissue Int 1995, 56, 263–267. [Google Scholar] [CrossRef]
- Melton, L.J.; Khosla, S.; Crowson, C.S.; O'Connor, M.K.; O'Fallon, W.M.; Riggs, B.L. Epidemiology of sarcopenia. J Am Geriatr Soc 2000, 48, 625–630. [Google Scholar] [CrossRef] [PubMed]
- Clynes, M.A.; Gregson, C.L.; Bruyère, O.; Cooper, C.; Dennison, E.M. Osteosarcopenia: where osteoporosis and sarcopenia collide. Rheumatology (Oxford) 2021, 60, 529–537. [Google Scholar] [CrossRef] [PubMed]
- Moore, C.D.; Craven, B.C.; Thabane, L.; Laing, A.C.; Frank-Wilson, A.W.; Kontulainen, S.A.; Papaioannou, A.; Adachi, J.D.; Giangregorio, L.M. Lower-extremity muscle atrophy and fat infiltration after chronic spinal cord injury. J Musculoskelet Neuronal Interact 2015, 15, 32–41. [Google Scholar] [PubMed]
- Carda, S.; Cisari, C.; Invernizzi, M. Sarcopenia or muscle modifications in neurologic diseases: a lexical or patophysiological difference? Eur J Phys Rehabil Med 2013, 49, 119–130. [Google Scholar] [PubMed]
- TD, M.; I, M.; CD, N.-C.; DC, I.; S, C.; GB, D. Sarcopenia, a major clinical problem in old age, potential causes, clinical consequences and therapeutic possibilities. Balneo and PRM Research Journal 2022, 13. [Google Scholar] [CrossRef]
- Sirbu, E.; Onofrei, R.R.; Szasz, S.; Susan, M. Predictors of disability in patients with chronic low back pain. Arch Med Sci 2023, 19, 94–100. [Google Scholar] [CrossRef] [PubMed]
- Alizadeh, A.; Dyck, S.M.; Karimi-Abdolrezaee, S. Traumatic Spinal Cord Injury: An Overview of Pathophysiology, Models and Acute Injury Mechanisms. Front Neurol 2019, 10, 282. [Google Scholar] [CrossRef] [PubMed]
- P Drasites, K.; Shams, R.; Zaman, V.; Matzelle, D.; C Shields, D.; P Garner, D.; J Sole, C.; Haque, A.; Banik, N.L. Pathophysiology, Biomarkers, and Therapeutic Modalities Associated with Skeletal Muscle Loss Following Spinal Cord Injury. Brain Sci 2020, 10. [Google Scholar] [CrossRef]
- Hwang, J.; Park, S. Gender-Specific Risk Factors and Prevalence for Sarcopenia among Community-Dwelling Young-Old Adults. Int J Environ Res Public Health 2022, 19. [Google Scholar] [CrossRef]
- Ishimoto, R.; Mutsuzaki, H.; Shimizu, Y.; Kishimoto, H.; Takeuchi, R.; Hada, Y. Prevalence of Sarcopenic Obesity and Factors Influencing Body Composition in Persons with Spinal Cord Injury in Japan. Nutrients 2023, 15. [Google Scholar] [CrossRef]
- Zhang, Y.; Zhang, J.; Ni, W.; Yuan, X.; Zhang, H.; Li, P.; Xu, J.; Zhao, Z. Sarcopenia in heart failure: a systematic review and meta-analysis. ESC Heart Fail 2021, 8, 1007–1017. [Google Scholar] [CrossRef] [PubMed]
- Lee, J.K.; Park, Y.S.; Lee, K.; Youn, S.I.; Won, Y.; Min, S.H.; Ahn, S.H.; Park, D.J.; Kim, H.H. Prognostic significance of surgery-induced sarcopenia in the survival of gastric cancer patients: a sex-specific analysis. J Cachexia Sarcopenia Muscle 2021, 12, 1897–1907. [Google Scholar] [CrossRef] [PubMed]
- Haizlip, K.M.; Harrison, B.C.; Leinwand, L.A. Sex-based differences in skeletal muscle kinetics and fiber-type composition. Physiology (Bethesda) 2015, 30, 30–39. [Google Scholar] [CrossRef]
- Anderson, L.J.; Liu, H.; Garcia, J.M. Sex Differences in Muscle Wasting. Adv Exp Med Biol 2017, 1043, 153–197. [Google Scholar] [CrossRef] [PubMed]
- Marzetti, E.; Calvani, R.; Tosato, M.; Cesari, M.; Di Bari, M.; Cherubini, A.; Collamati, A.; D'Angelo, E.; Pahor, M.; Bernabei, R.; et al. Sarcopenia: an overview. Aging Clin Exp Res 2017, 29, 11–17. [Google Scholar] [CrossRef] [PubMed]
- Nishikawa, H.; Fukunishi, S.; Asai, A.; Yokohama, K.; Nishiguchi, S.; Higuchi, K. Pathophysiology and mechanisms of primary sarcopenia (Review). Int J Mol Med 2021, 48. [Google Scholar] [CrossRef]
- Wyndaele, M.; Wyndaele, J.J. Incidence, prevalence and epidemiology of spinal cord injury: what learns a worldwide literature survey? Spinal Cord 2006, 44, 523–529. [Google Scholar] [CrossRef] [PubMed]
- Tanaka, Y.; Miyagi, M.; Inoue, G.; Hori, Y.; Inage, K.; Murata, K.; Fujimaki, H.; Kuroda, A.; Yokozeki, Y.; Inoue, S.; et al. Muscle strength rather than appendicular skeletal muscle mass might affect spinal sagittal alignment, low back pain, and health-related quality of life. Sci Rep 2023, 13, 9894. [Google Scholar] [CrossRef]
- Supriya, R.; Singh, K.P.; Gao, Y.; Gu, Y.; Baker, J.S. Effect of Exercise on Secondary Sarcopenia: A Comprehensive Literature Review. Biology (Basel) 2021, 11. [Google Scholar] [CrossRef]
- Varacallo M, Davis DD, Pizzutillo P. Osteoporosis in Spinal Cord Injuries. 2023 Aug 28. In: StatPearls [Internet]. Treasure Island (FL): StatPearls Publishing; 2023.; 2023.
- Verschueren, S.; Gielen, E.; O'Neill, T.W.; Pye, S.R.; Adams, J.E.; Ward, K.A.; Wu, F.C.; Szulc, P.; Laurent, M.; Claessens, F.; et al. Sarcopenia and its relationship with bone mineral density in middle-aged and elderly European men. Osteoporos Int 2013, 24, 87–98. [Google Scholar] [CrossRef]
- Yoshimura, N.; Muraki, S.; Oka, H.; Iidaka, T.; Kodama, R.; Kawaguchi, H.; Nakamura, K.; Tanaka, S.; Akune, T. Is osteoporosis a predictor for future sarcopenia or vice versa? Four-year observations between the second and third ROAD study surveys. Osteoporos Int 2017, 28, 189–199. [Google Scholar] [CrossRef]
- Mahitthiharn, K.; Kovindha, A.; Kaewchur, T.; Morse, L.R.; Pattanakuhar, S. Prevalence and influencing factors of spinal cord injury-related osteoporosis and fragility fractures in Thai people with chronic spinal cord injury: A cross-sectional, observational study. J Spinal Cord Med 2023, 46, 458–465. [Google Scholar] [CrossRef] [PubMed]
- Li, S.; Gonzalez-Buonomo, J.; Ghuman, J.; Huang, X.; Malik, A.; Yozbatiran, N.; Magat, E.; Francisco, G.E.; Wu, H.; Frontera, W.R. Aging after stroke: how to define post-stroke sarcopenia and what are its risk factors? Eur J Phys Rehabil Med 2022, 58, 683–692. [Google Scholar] [CrossRef] [PubMed]
- Leone, G.E.; Shields, D.C.; Haque, A.; Banik, N.L. Rehabilitation: Neurogenic Bone Loss after Spinal Cord Injury. Biomedicines 2023, 11. [Google Scholar] [CrossRef]
- Pacifico, J.; Geerlings, M.A.J.; Reijnierse, E.M.; Phassouliotis, C.; Lim, W.K.; Maier, A.B. Prevalence of sarcopenia as a comorbid disease: A systematic review and meta-analysis. Exp Gerontol 2020, 131, 110801. [Google Scholar] [CrossRef]
- Burns, A.S.; Marino, R.J.; Kalsi-Ryan, S.; Middleton, J.W.; Tetreault, L.A.; Dettori, J.R.; Mihalovich, K.E.; Fehlings, M.G. Type and Timing of Rehabilitation Following Acute and Subacute Spinal Cord Injury: A Systematic Review. Global Spine J 2017, 7, 175S–194S. [Google Scholar] [CrossRef]
- De Spiegeleer, A.; Beckwée, D.; Bautmans, I.; Petrovic, M. Pharmacological Interventions to Improve Muscle Mass, Muscle Strength and Physical Performance in Older People: An Umbrella Review of Systematic Reviews and Meta-analyses. Drugs Aging 2018, 35, 719–734. [Google Scholar] [CrossRef] [PubMed]
- Lee, J.H.; Jun, H.-S. Role of myokines in regulating skeletal muscle mass and function. Frontiers in physiology 2019, 10, 42. [Google Scholar] [CrossRef]
- McClung, J.; Davis, J.; Wilson, M.; Goldsmith, E.; Carson, J. Estrogen status and skeletal muscle recovery from disuse atrophy. Journal of Applied Physiology 2006, 100, 2012–2023. [Google Scholar] [CrossRef]
Figure 2.
American Spinal Injury Association Impairment Scale (AIS).
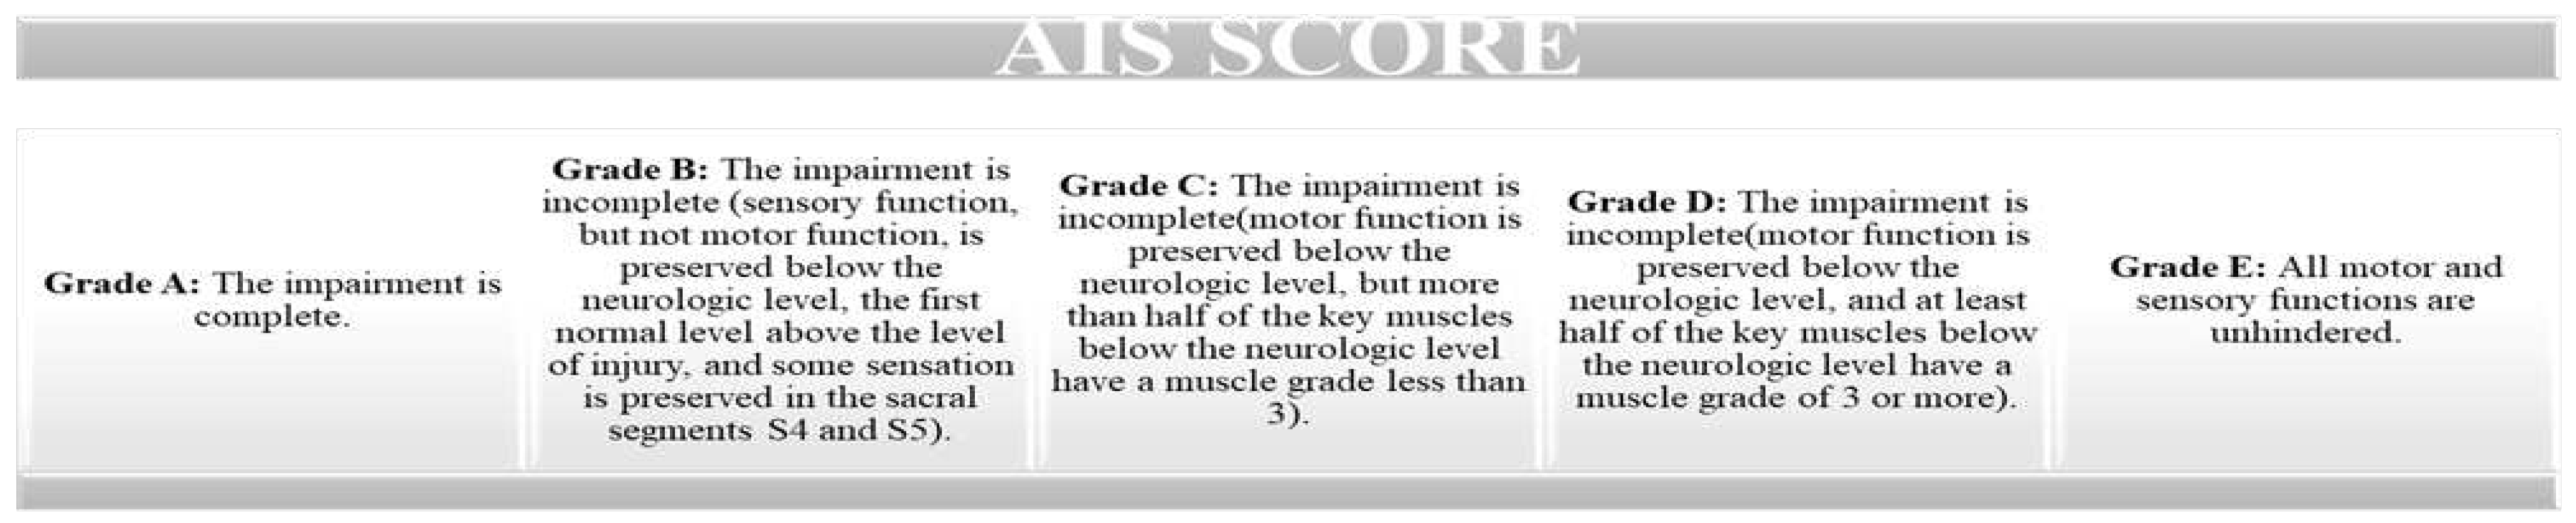
Table 1.
This is a table. Tables should be placed in the main text near to the first time they are cited.
Table 1.
This is a table. Tables should be placed in the main text near to the first time they are cited.
| Parameter | Group S—SCI | Group NS—SCI | p-value | SS/NS |
|---|---|---|---|---|
| Patients N (%) | 66 (48.529) | 70 (51.471) | - | - |
| Age, M, SD (years) | 35.83 ± 11.75 | 41.50 ± 14.36 | 0.013 * | SS |
| Female, N (%) | 18 (75.00) | 6 (25.00) | 0.014 ** | SS |
| Male, N (%) | 48 (42.86) | 64 (57.14) | 0.131** | NS |
| Number of months since SCI ( M, SD) | 55.17 ± 57.77 | 47.40± 33.17 | 0.620*** | NS |
| Neurological level of injury | ||||
| level Cervical, N (%) | 27 (52.94) | 24 (47.06) | 0.674** | NS |
| level Thoracal, N (%) | 33 (47.14) | 37 (52.85) | 0.633** | NS |
| level Lumbar, N (%) | 6 (40) | 9 (60) | 0.439** | NS |
| American Spinal Injury Association Impairment Scale | ||||
| Grade A, N (%) | 29 (55.77) | 23 (44.23) | 0.405** | NS |
| Grade B, N (%) | 23 (58.97) | 16 (41.02) | 0.262** | NS |
| Grade C, N (%) | 8 (28.57) | 20 (71.43) | 0.023** | NS |
| Grade D, N (%) | 6 (35.29) | 11 (64.70) | 0.225** | NS |
| Modified Ashworth Scale | ||||
| Score 0, N (%) | 23 (69.69) | 10 (30.30) | 0.024** | NS |
| Score 1, N (%) | 9 (42.85) | 12 (57.14) | 0.513** | NS |
| Score 2, N (%) | 17 (41.46) | 24 (58.53) | 0.274** | NS |
| Score 3, N (%) | 11 (40.74) | 16 (59.25) | 0.336** | NS |
| Score 4, N (%) | 6 (42.85) | 8(57.14) | 0.583** | NS |
| Comorbidities( M, SD) | 2.667 ± 1.522 | 2.086 ± 1.164 | 0.028** | SS |
| Immobilization Osteoporosis, Z-score | ||||
| Lumbar M, SD | -1.318 ± 1.182 | -1.280 ± 0.976 | - | |
| Right hip M, SD | -1.948 ± 0.945 | -1.444 ± 1.454 | - | |
| Left hip M, SD | -1.802 ± 1.330 | -1.467 ± 1,233 | - |
M: mean value; SD: standard deviation value; N: number of the patients; Group NS—SCI: patients with SCI, without sarcopenia; Group S—SCI: patients with SCI, and sarcopenia; p values statistical significance (*, student t-test; **, chi-square test; *** Mann-Whitney U test); NS-without statistical significance; SS-statistically significant.
Disclaimer/Publisher’s Note: The statements, opinions and data contained in all publications are solely those of the individual author(s) and contributor(s) and not of MDPI and/or the editor(s). MDPI and/or the editor(s) disclaim responsibility for any injury to people or property resulting from any ideas, methods, instructions or products referred to in the content. |
© 2023 by the authors. Licensee MDPI, Basel, Switzerland. This article is an open access article distributed under the terms and conditions of the Creative Commons Attribution (CC BY) license (http://creativecommons.org/licenses/by/4.0/).
Copyright: This open access article is published under a Creative Commons CC BY 4.0 license, which permit the free download, distribution, and reuse, provided that the author and preprint are cited in any reuse.


