
Submitted:
06 December 2023
Posted:
07 December 2023
You are already at the latest version
Abstract
(1) Background: The chemotherapeutic drug cisplatin exerts toxic side effects causing acute kidney injury. Mesenchymal stromal cells can ameliorate cisplatin-induced kidney injury. We hypothe-size that the MSC secretome orchestrates the vicious cycle of injury and inflammation by acting on proximal tubule epithelial cells (PTECs) and macrophages individually, but further by coun-teracting their cellular crosstalk. (2) Methods: Conditioned medium (CM) from adipose stromal cells was used, first assessing its effect on cisplatin injury in PTECs. Second, effects of cisplatin and CM on macrophages were measured. Lastly, in an indirect co-culture system the interplay between the two cell types was assessed. (3) Results: First, CM rescued PTECs from cisplatin-induced apoptosis by reducing oxidative stress and expression of nephrotoxicity genes. Second, while cisplatin exerted only minor effects on macrophages, CM skewed macrophage phenotypes to the anti-inflammatory M2-like phenotype and increased phagocytosis. Finally, in the co-culture system, CM suppressed PTEC death by inhibiting apoptosis and nuclei fragmentation. CM lowered TNF-α release. While cisplatin inhibited macrophage phagocytosis, PTECs, and CM to a greater extent, enhanced it. CM strongly dampened the inflammatory macrophage cytokine secretion triggered by PTECs. (4) Conclusion: ASC-CM surpasses the PTEC-macrophage cross-talk in cisplatin injury. The positive effects on reducing cisplatin cytotoxicity, on polarizing mac-rophages and on fine-tuning cytokine secretion underscores MSCs CM benefit to prevent kidney injury progression.
Keywords:
MSC secretome
; proximal tubular epithelial cells
; cisplatin
; macrophages
; acute kidney injury
; oxidative stress
; crosstalk
; phagocytosis
1. Introduction
Mesenchymal stromal cells (MSCs) are considered as promising candidates for the development of cell-based therapies for a variety of diseases [1]. The high interest in exploiting MSCs clinical potential stems from their pro-angiogenic, anti-apoptotic, anti-oxidative, and immunomodulatory properties [2,3]. The underlying mechanism of action by which MSCs deliver those therapeutic benefits includes the release of bioactive paracrine factors, collectively regarded as secretome [4]. In general, the MSC secretome consists of soluble factors, which include various growth factors, cytokines, hormones, chemokines, anti-oxidants, extracellular matrix proteins, and other serum proteins, and extracellular vesicles (EVs). These EVs deliver proteins, lipids, and genetic materials (DNA, mRNA, miRNA) to exert their effect on target cells. Given its diverse contents, MSC secretome presents an option for multimodal treatment for debilitating diseases, such as kidney injury [1].
Cis-diamminedichloroplatinum II (cisplatin) is an anti-cancer drug with a wide range of side effects, including gastrotoxicity, neurotoxicity, allergic reactions, and, most prevalent of all, nephrotoxicity [5]. Acute kidney injury (AKI) happens to 20-30 % of cancer patients receiving cisplatin and it accounts for up to 60 % of hospital-acquired kidney injuries with high mortality and morbidity [6]. Because of this, cisplatin-induced AKI has been the dose-limiting factor of cisplatin treatment, significantly compromising its efficacy in treating cancer [6,7,8].
Proximal tubular epithelial cells (PTECs) are the key player in cisplatin-induced AKI. Being responsible for reabsorption, PTECs express organic cation transporter 2 (OCT2), multidrug and toxin extrusion (MATE), and human copper transporter 1 (Ctr1), enabling cisplatin uptake [8,9,10]. Once internalized, cisplatin damages mitochondria by targeting mitochondrial DNA and the electron transport chain, resulting in increased reactive oxygen species (ROS) levels, release of cytochrome C, and subsequent activation of the intrinsic apoptosis pathway [6,7]. Furthermore, cisplatin-induced ROS drive inflammation by the stimulation of p38-MAPK pathway and the release of death receptor ligands, including tumor necrosis factor-α (TNF-α). The secretion of TNF-α further promotes PTEC apoptosis through the extrinsic pathway, which consecutively exacerbates intracellular ROS production [6,11].
Previous studies have demonstrated that the interplay between renal cells and macrophages is essential for determining the fate of AKI progression and recovery [12]. Soon after the insult, tubular cells, in particular PTECs, release chemotactic factors comprising pro-inflammatory cytokines and danger-associated molecular patterns (DAMPs) that promote macrophage infiltration and induce polarization into the pro-inflammatory phenotype, M1 [13]. Upon healing, M1 macrophages become gradually replaced by M2 macrophages contributing to inflammation resolution and tubule regeneration [12,13,14]. However, when the injury is sustained, PTECs maintain the molecular pathways, which favor M1 polarization, resulting in prolonged inflammation and further renal deterioration [14,15]. Kidney regeneration has been shown to require active resolution of renal inflammation by M2-like macrophages highlighting their importance [16].
The role of macrophages in AKI has been largely studied in ischemia-reperfusion-injury (IRI) models [17]. Yet the involvement of macrophages on cisplatin-induced AKI is not as extensively described [6,18,19,20]. Nakagawa et al. performed a phenotypical characterization of M1/M2 macrophages in cisplatin-induced renal fibrosis [21]. They showed that both CD68+ M1 and CD163+ M2 macrophages started infiltrating the kidney on day 5 post cisplatin treatment. While the M1 macrophage population peaked on day 9, the M2 population peaked later on day 12. Interestingly, on day 9, 60-80 % of macrophages co-expressed M1 and M2 surface markers, eventually documenting the transition from M1 towards M2 macrophages. The authors concluded that a complicated interplay of inflammatory M1 and anti-inflammatory M2 macrophages was pivotal for cisplatin-induced renal fibrosis and its resolution.
Given the importance of PTECs’ role in macrophage polarization and vice versa [14,15], targeting the PTEC and macrophage crosstalk might pose a further additive effect in treating cisplatin-induced AKI. Indeed, given their anti-apoptotic and immunomodulatory capacity, MSCs have been shown to modulate both cell types individually [1,4]. We hypothesize that the MSCs can ameliorate cisplatin injury not only by directly rescuing PTECs and macrophages, but also by having additive effects counteracting the vicious cycle of injury and inflammation. To address this, the direct effect of MSC secretome on conditionally immortalized PTECs (ciPTECs) and macrophages upon cisplatin injury was evaluated first separately, investigating potential mediators. Lastly, the MSC influence on PTECs and macrophages interaction was interrogated in a co-culture system, mainly by assessing the cytokine crosstalk.
2. Materials and Methods
MSC Culture and Production of Conditioned Medium (CM)
Adipose-derived mesenchymal stromal cells (ASCs) were isolated from the lipoaspirate of healthy donors upon obtaining informed consent in concordance to Mannheim Ethic Committee approval (ethical votes 2011-215N-MA, 2009-210N-MA) as previously described [22]. ASCs were cultivated in Dulbecco’s Modified Eagle Medium (DMEM; Lonza, #12-918F), supplemented with 10 % (v/v) of pooled human AB serum from healthy donors (German Red Cross Blood Donor Service Mannheim), 1 % Penicillin/Streptomycin (PAN Biotech, # P06-07100) and 4 mM L-glutamine (PAN Biotech, # P04-80100). ASCs were expanded seeding 300 cells/cm2 and maintained in cell culture incubator (37 °C, 5 % CO2). ASCs were characterized with respect to their surface markers and osteogenic and adipogenic differentiation ability (Supplementary Figure S1). Different ASC batches were used to account for their biological heterogeneity.
To produce ASC-derived conditioned medium (CM), passage 3-6 ASCs were cultured in a T-175 flask until 80-90% confluence was reached. The cells were washed twice with PBS and 15 mL of either ciPTEC serum-free medium (SFM) or X-Vivo medium for macrophages was added respectively. The CM was harvested after 24 hours, centrifuged at 2000 x g 10 min 4 o C and filtered through a 0.22 µm filter to remove any cell debris. Representative images of ASCs after CM production are shown in Supplementary Figure S1. The processed CM were then stored in -80o C for later use. As control medium, ciPTEC SFM and X-Vivo were also incubated cell-free in empty culture flasks at 37 °C, 5 % CO2 for 24 h and subjected to the same harvesting process described above.
Ultra-Filtration of CM to Deplete Extracellular Vesicles
To investigate whether soluble factors or rather EVs mediate the secretome effect, we decided to first deplete EVs. To deplete EVs, CM were filtered through 100 kDa Amicon Ultra-15 centrifugal filter devices (Merck Milipore, #UFC810024) that were pre-treated with bovine serum albumin (BSA) to reduce the loss of CM soluble factors in the membrane as described previously [23]. First, the 100 kDA centrifugal filter devices were washed with EV-grade water as per the manufacturer’s manual. 12 mL of 1 % (w/v) BSA in PBS was then added into the upper compartment of the device and incubated for 2.5 h at room temperature. Subsequently, the upper compartment was washed 4x with 15 mL PBS without centrifugation and 1x with centrifugation in swing rotor at 4000 x g, 10 min, 4 o C. After the washing step, 15 mL of CM was added into the upper compartment of the device and centrifuged until all the CM was filtered (dead stop). The CM flow-through (CM-FT) in the lower compartment was then collected and subjected to nanoparticle tracking analysis (NTA) to confirm EV depletion. 1 μL of concentrated CM-FT was diluted in sterile-filtered PBS in a dilution 1:1000 and analyzed using NTA (ZetaView, Particle Metrix GmbH; sensitivity 80%, shutter 100, 11 positions, 2 cycles; in collaboration with the Urology department, University Medical Centre Mannheim).
Thiol Measurement of CM
Free thiols are sulfhydryl groups (R-SH) that can be found in peptides and proteins and are very sensitive to ROS. Therefore, free thiols not only serve as redox switch in the cells but also act as a ROS scavenger [24]. Given their roles in cellular redox state, we measured the concentration of free thiols in CM to predict its anti-oxidative capacity (Thiol Quantification Assay kit, Abcam, # ab112158). The standard and the thiol green indicator solution were prepared according to the manufacturer’s manual. 50 µL of standard solution or CM were incubated with 50 µL of thiol green indicator solution for 10 min in the dark. The fluorescence was read using a microplate reader (TECAN, M200) at ex/em: 490/520 nm.
ciPTEC Culture and Cisplatin Treatment
Conditionally immortalized PTECs (ciPTECs 14.4, stably transfected by SV40T and hTERT, Cell4Pharma) were cultured as previously described [25]. ciPTECs were expanded in DMEM HAM’s F12 (ThermoFisher, #11039047), supplemented with 5 μg/ml insulin, 5 μg/ml transferrin, 5 μg/ml selenium (Sigma Aldrich, #11074547001 50MG), 35 ng/ml hydrocortisone (Sigma Aldrich, #H0135-1MG), 10 ng/ml epidermal growth factor (Sigma Aldrich, #E9644-5MG), 40 pg/ml tri-iodothyronine (Sigma Aldrich, #T5516-1MG) and 10 % (v/v) fetal bovine serum (FBS, ThermoFisher, #10270106) in 33 °C, 5 % CO2 incubator. For experiments, ciPTECs were seeded at 48400 cells/cm2 (unless indicated otherwise) and kept at 33 °C, 5 % CO2 incubator for 1 day. The next day, ciPTECs were cultured at 37 °C, 5 % CO2 for 7 more days to allow cell maturation.
Once matured, ciPTECs were treated with 15 µM cisplatin (Cis, Cisplatin Teva®) in ciPTEC SFM for 1 h. After 1 h, the medium was replaced with CM containing 15 µM cisplatin and the cells were incubated for another 23 h. ciPTECs treated with control medium (ciPTEC SFM) served as untreated (UT) and cisplatin-treated control (CTRL), respectively.
ciPTEC Viability
After a total of 24 h treatment with cisplatin, ciPTEC viability was measured using PrestoBlue™ HS (Invitrogen, #P50200) as per the manufacturer’s instruction. ciPTECs were washed once and HBSS containing 10 % (v/v) of PrestoBlue was added. ciPTECs were then incubated for 30 min at 37 °C, before being measured using a microplate reader (TECAN, M200) with ex/em: 560/590 nm. The results are presented as relative value of the untreated healthy ciPTECs.
ciPTEC Metabolic Activity
To assess metabolic activity of ciPTECs, the intracellular ATP concentration was measured (CellTiter-Glo® Luminiscent Cell Viability Assay, Promega, #G7571) as per the manufacturer’s instruction. After 24 h of cisplatin treatment, the reagent was added with the same volume as the media in each well. To induce cell lysis, the cell culture plate was placed on an orbital shaker for 2 minutes and subsequently incubated at room temperature to stabilize the luminescent signal. The signal was then read using a microplate reader (TECAN, M200). The results are presented as the fold-change to the healthy untreated ciPTECs.
ciPTEC Migratory Capacity
To assess ciPTEC migratory capacity, ciPTECs were seeded in ImageLock 96 well plates (Essen BioScience, Sartorius, #4379) and were matured and treated with cisplatin and CM for 24 h as explained above. Then, media were discarded and replaced with HBSS. Scratch wounds were created using a wound maker tool (Essen BioScience, Sartorius, #4563) as per the manufacturer’s instruction, before immediate media change to CM or ciPTEC SFM, both without cisplatin. The closing of the scratch wounds was then recorded for the next 3 days with 3 h intervals using live-cell imaging (Incucyte Zoom, Essen BioScience, Sartorius). The relative wound density (%) was calculated using the respective Incucyte algorithm.
ciPTEC Apoptosis
Previous studies indicated that cisplatin induces either apoptosis or necrosis/necroptosis of cultured PTECs, depending on the dose: continuous low-dose cisplatin exposure (3 – 50 µM) induces apoptosis, whereas transient high-dose exposure causes necrosis/necroptosis (300 – 1000 µM) [26]. We could reproduce these findings: under the chosen experimental setup, apoptosis rather than necrosis/necroptosis occurred in cisplatin-treated ciPTECs (Rendra et al. revised manuscript submitted). To assess cisplatin-induced apoptosis, we used live-cell imaging. CiPTECs were seeded at 5000 cell/cm2 8 days prior to the experiment and underwent subsequent maturation as well as cisplatin and CM treatment as described previously. After a total of 24 h of treatment with or without CM and Cis, the medium was discarded and cells were washed once with HBSS. Fresh CM (without cisplatin) containing 50 nM Apotracker (Biolegend, #427401) was added and ciPTEC apoptosis was monitored using live-cell imaging (Incucyte SX5, Sartorius) for 3 days with 3h intervals. Apoptosis was assessed by quantifying total integrated intensity of green fluorescence (GCU x µm2/image) indicating apoptotic cells, normalized by cell confluence (%, percentage of total phase object area) and presented as relative value to UT-CTRL.
Nephrotoxicity PCR Array
To assess nephrotoxicity, ciPTEC mRNA was harvested 24 h after cisplatin treatment with or without CM, and isolated using miRNeasy Kit (Qiagen, #217084) according to manufacturer’s instruction. The concentration and quality of isolated mRNA were assessed using Tecan InfiniteR 200. mRNA was subjected to cDNA synthesis using RT2 First Strand Kit (Qiagen, #330401). The cDNA was then analysed using RT2 Profiler PCR Array for Nephrotoxicity (Qiagen, #330231) and RT2 SYBR Green Mastermix (Qiagen, #330502) according to the manufacturer’s instruction.
Confirmatory RT-qPCR
Validation of PCR array data was performed on independent samples using quantitative reverse transcription polymerase chain reaction (RT-qPCR). 24h after treatment, ciPTEC mRNA was isolated using RNeasy Micro Kit (Qiagen, #74004) and the cDNA was generated using SensiFAST™ cDNA Synthesis Kit (Bioline, #BIO-65054). Gene expressions of growth arrest and DNA damage inducible alpha (GADD45a), cyclin dependent kinase inhibitor 1A (CDKN1a), activating transcription factor-3 (ATF-3), heme-oxygenase-1 (HMOX-1) were assessed using SensiFAST™ SYBR® No-ROX Kit (Bioline, #BIO-98005). The primers used in this study were obtained from Eurofins (Germany) and the sequences can be found in Supplementary Table S1. Glyceraldehyde 3-phosphate dehydrogenase (GAPDH) served as reference gene. Relative value of the target genes was analyzed using 2-ddCt method and normalized against the reference gene. The results are presented as relative value to the UT-CTRL.
Intracellular Reactive Oxygen Species Levels
Intracellular reactive oxygen species (ROS) of ciPTECs were measured using 2’,7’-dichlorodihydrofluorescein diacetate (H2DCFDA, Invitrogen, #D399). ciPTECs were first loaded with 10 µM H2DCFDA in HBSS for 10 min, washed 2x with HBSS and incubated with their normal growth media for 30 min at 37 o C, 5 % CO2 for recovery. Once the cells recovered, they were treated with cisplatin and CM (1 h Cis alone followed by 4 h of Cis + CM treatment). ciPTECs treated with 1 µM H2O2 in ciPTEC SFM served as positive control. 5 h after the treatment, H2DCFDA fluorescence representing intracellular ROS level was measured using a microplate reader (TECAN, M200; ex/em: 495/520 nm). The ROS level is presented as relative value to UT-CTRL.
Monocyte Isolation and Macrophage Culture
Primary human monocytes were isolated from buffy coats provided by the German Red Cross Blood Donor Service Mannheim from healthy blood donors. The Mannheim Ethics Committee II, Medical Faculty Mannheim, Heidelberg University waived the need for ethical approval; all donors signed informed consent that blood can be used for research and development purposes. Buffy coats were first diluted 3x in PBS 2 mM EDTA, then overlaid gently onto a ficoll gradient (Sigma Aldrich, #GE17-1440-02), and centrifuged at 420 x g for 30 min without break. Peripheral blood mononuclear cells (PBMCs) were collected from the interphase. Monocytes were then isolated using magnetic activated cell sorting with anti-CD14 microbeads (Miltenyi Biotech, #130-050-201) as per manufacturer’s instruction. Isolated monocytes were then cultured at a seeding density of 106 cells/mL in serum-free X-Vivo 10 (Lonza, #BE04-380Q) supplemented with 10 ng/mL recombinant human macrophage colony-stimulating factor (M-CSF, Peprotech, #300-25) for 6 days without media change.
After 6 days, macrophages were treated with 15 µM cisplatin in X-Vivo 10 and CM as described for ciPTECs. Macrophages cultured with X-Vivo 10 in the absence and presence of cisplatin served as untreated (UT-CTRL) and cisplatin control (Cis-CTRL). Of note, both adherent and non-adherent macrophages were included in the experiment.
Macrophage Surface Marker Expression
Upon cisplatin and CM treatment, macrophages were harvested using accutase (Sigma Aldrich, #A6964) and subsequent gentle scrapping of the culture wells. The harvested macrophages were washed once with PBS 2 mM EDTA and stained for 20 min with the following human antibodies: anti-HLA-DR-PE-Cy7 (Clone: L243, BioLegend, #307616), anti-CD86-BV421 (Clone: IT2.2, BioLegend, #305426), anti-CD206-PE (Clone:19.2, BD Biosciences, #555954) and anti-CD163-BV510 (Clone: GHI/61, BioLegend, #333628). All antibodies were properly titrated before. Consecutively, the cells were also stained with the viability dye Sytox Bue (Invitrogen, #S34857). The cells were then acquired using flow cytometry (FACS Canto II, BD Biosciences) and the obtained .fcs data were analyzed with FlowJo 10 software (purity check Supplementary Figure S2; changes of macrophage marker expression Supplementary Figure S3).
Macrophage Phagocytosis
The phagocytosis capacity of macrophages was measured by adding 5 µg pHrodo® green E. coli Bioparticles® (Essen BioScience, #4616) per 105 macrophages. Subsequently, phagocytosis was measured by live-cell imaging for 6 h with 15 min intervals. Phagocytosis was determined by calculating the total integrated intensity of green fluorescence (GCU x µm2/image and normalized by cell confluence (%)). The data are shown as a relative value to UT-CTRL.
Indirect Co-Cultures of ciPTEC and Macrophages
Before seeding ciPTECs on transwell membranes, transwell inserts (0.4 µm transparent PET Membrane (Falcon, #353095) were coated with 2 mg/mL L-DOPA (Sigma Aldrich, #D9628-5G) for 4 h in 37 °C and subsequently with 25 µg/mL of human collagen IV (Sigma Aldrich, #C6745-1ML) for 1 h in 37 °C [25]. After coating, the membranes were washed 3x with HBSS. 4 x 10⁴ ciPTECs /transwell were then seeded onto the apical side of the membrane. 300 µL and 700 µL of ciPTEC growth medium were added to the apical and basolateral side, respectively. The seeded ciPTECs were left in the transwell membrane for 3 days at 33 °C, before being moved to 37 °C for maturation for additional 7 days. The ciPTEC medium was refreshed periodically.
During the maturation of ciPTECs, monocytes were isolated and seeded in a 24-well plate (Falcon, #353504) at a density of 2 x 10⁵ cells/well and matured in X-Vivo-10 supplemented with 10 ng/mL M-CSF at 37 0C for 6 days without media change.
After the maturation, ciPTECs and macrophages were treated separately with 30 µM cisplatin in ciPTEC SFM and X-Vivo-10 + M-CSF, respectively, for 1 h. The cisplatin concentration had to be doubled in the transwell system to achieve a similar level of apoptosis, as apparently the differing cell culture/insert plastic led to a lower cisplatin toxicity. After 1 h initial treatment with cisplatin, ciPTECs transwells were transferred to the well plates containing the macrophages (cell ratio 1:5). The co-cultures were then treated with either CM (pooled from 3 different ASC batches/donors, produced in ciPTEC SFM and X-Vivo-10 + M-CSF, for apical and basolateral side, respectively) or the respective control medium with or without 30 µM cisplatin for another 23 h. As a control, ciPTECs and macrophages were cultured alone and treated in the same manner as the co-culture.
After a total of 24 h of cisplatin treatment, the supernatant (SN) from the apical and basolateral side was collected, spun down to remove cell debris, and cryopreserved at -80 °C. The ciPTECs on the transwell membrane were subjected to staining (see below), while the macrophages were subjected to phagocytosis assay (see above).
Staining of ciPTECs on Transwell Membrane
Because culture of the transwell did not allow for apoptosis measurement using live-cell imaging, immunofluorescence was used. After ciPTECs inserts were removed from the co-culture and washed 1x with HBSS, the cells were incubated with 150 nM Apotracker in HBBS at 37 0C for 20 min. Then excess Apotracker was washed off 2x with HBSS, and the cells were fixed with 4 % paraformaldehyde (PFA) for 10 min. Once fixed, the cells were washed once with PBS and the membrane was carefully cut from the insert using a 24 G needle. The membrane was then washed again with 2x PBS, and blocked with blocking solution (10 % FBS + 0.15 % Triton-X in PBS) for 1 h. The membrane was stained with rabbit anti-human connexin-43 (CX43; Sigma, #C6219, 1:1000) in blocking solution overnight. The next day, the membrane was washed 3x with PBS with 5 min incubation per wash, before incubating with the goat anti-rabbit secondary Ab AF568 (Life Technologies, #A-11011) for 30 min in the dark. After washing 3x with PBS, the membrane was stained with 300 nM DAPI (SantaCruz, #SC-300415) in PBS for 5 min and washed again 3x, before being mounted on a microscope slide.
The image of the ciPTECs was acquired using Zeiss LSM 800. ImageJ Fiji was used to quantify the fluorescence intensity of CX-43, the number of Apotracker spots (using Plugin TrackMate7 [27]), and the number of nuclei fragments, fragmented and intact nuclei. Resulting data were normalized against the number of intact nuclei and presented as the relative value of the untreated ciPTEC cultured alone.
Multiplex Assay to Quantify Secreted Factors in the Co-Culture System (Basolateral Side)
To assess the secreted factors derived from the macrophages within co-cultures harvested from the basolateral (macrophage) side of the co-culture, a 22-plex panel assay (ProcartaPlex Thermo Fisher Scientific, #PPX-22) was used assessing: Arginase-1, Fractalkine (CX3CL1), Granulocyte-macrophage colony-stimulating factor (GM-CSF), Hepatocyte growth factor (HGF), Heat shock protein 60 (HSP60), Interferon-β (IFN-β), Interleukin-1β (IL-1β), IL-1RA, IL-8 (CXCL8), IL-10, IL-13, IL-33, IFN-γ inducible protein-10 (IP-10), M-CSF, Matrix metallopeptidase 9 (MMP-9), Platelet-derived growth factor-BB (PDGF-BB), Chemokine (C-C motif) ligand 5 (CCL5), S100A8/A9, Survivin (BIRC5), Tissue inhibitor of metalloproteinase-1 (TIMP-1), TNF-α, and Vascular cell adhesion molecule 1 (VCAM-1). The kit was first equilibrated to room temperature. The dilution of the standard solution and the loading of the beads and supernatant were done as per the manufacturer’s manual. The intensity of each marker in the samples was then acquired using Luminex 200 Multiplex Bead Array (Merck-Millipore) and Luminex xPonent Version 3.1 software. The standards calibration was done with the Logistics 5P Weighted method.
TNF-α Measurement in the Co-Culture System (Apical Side)
The concentration of TNF-α of co-culture supernatant on the apical (ciPTEC) side was measured using human TNF-α DuoSet ELISA (R&D Systems, #DY210) as per the manufacturer’s instruction.
Statistical Analysis
The statistical analysis was done using GraphPad Prism 9.2.0 software (GraphPad Software). Data are presented as mean ± standard deviation. N refers to the biological replicates for each donor per cell type and n indicates the independent technical replicates. The statistical analyses run for each data set and the number of replicates are indicated in the figure legends. Statistical significance is indicated as the following: * p<0.5, **p<0.01, ***p<0.001, ****p<0.0001.
3. Results
In this study, we aimed to investigate the reno-protective capacity of ASC secretome in the context of renal cells and macrophages interaction (Figure 1A). First, we investigated the effect of ASC secretome on ciPTECs and macrophages separately, to establish the ASC therapeutic effect on each cell directly and to gain insights into mechanisms of action. Then, we studied the ASC secretome capacity in modulating the interplay between ciPTECs and macrophages in transwell co-cultures of both cell types.
3.1. Cisplatin Decreases ciPTEC Viability, Metabolic Activity and Migratory Capacity
Hypothesizing that the ASC secretome will protect rather than cure from cisplatin toxicity, we chose a setting where ciPTECs were treated with cisplatin for 1 h before adding ASC-CM (Figure 1B). To calculate a concentration of cisplatin with only moderate cytotoxic but high functional impact that can be rescued by CM, we performed a titration of cisplatin and assessed viability, metabolic activity and migratory capacity in a wound scratch assay. After 24 h of treatment, all features were dose-dependently reduced (Figure 1C–E). We choose a concentration of 15 µM cisplatin because it impaired viability and metabolic activity only by 20-25%, while exerting a highly pronounced effect on migratory capacity (76 ± 14 % viability, 80 ± 19 % metabolic activity, and 36 ± 20 % migratory capacity compared to the untreated control).
3.1.1. ASC Secretome Attenuated Cisplatin-Induced Cell Toxicity and Promoted Migration of ciPTECs by Ameliorating Apoptosis, DNA Damage, and Oxidative Stress
We first sought to investigate the effect of ASC secretome on cisplatin treated ciPTECs (Figure 2A). 24 h after treatment, cisplatin decreased ciPTEC viability by 13 %, meanwhile, CM significantly increased ciPTEC viability in cisplatin-untreated (UT-CM) and treated (Cis-CM) groups (Figure 2B). Even clearer became the protective effect of the ASC secretome when assessing apoptosis of cPTECs, challenged with cisplatin for 24 h and cultured for further 3 days in CM in CTRL medium. While cisplatin induced significant apoptosis, ASC CM reduced this significantly by 55.68 % (Cis-CM, Figure 2C,D, Supplementary Figure S4A). Not only rescuing from cell death, CM also promoted ciPTEC migratory capacity (Figure 2E,F, Supplementary Figure S4B). This effect was prominent in both the untreated and treated CM condition, while cisplatin per se affected wound closure only slightly.
To understand better the molecular pathways by which cisplatin and CM exert their effects, we performed a nephrotoxicity PCR array. Cisplatin affected ciPTECs’ gene expression profile indicating nephrotoxicity (Figure 3A). Meanwhile, CM ameliorated the cisplatin effects largely. Independent PCR validation documented that genes involved in cell cycle control and DNA damage (CDKN1a and GADD45a), oxidative stress (HMOX-1), and cellular stress (ATF-3) were all elevated by cisplatin treatment, but ameliorated upon ASC CM treatment (Figure 3B–E).
3.1.2. Anti-Apoptotic Effect of CM Was Not Affected by EV Depletion but Related to Its Free Thiol Content
As previous reports suggested EVs to mediate the MSC renoprotective effects in an animal model of AKI [28,29], we postulated that EV depletion would neutralize the protective effect of CM on ciPTEC apoptosis. CM from different ASC batches/donors contained a wide variation of particle concentrations, effectively depleted by ultra-filtration as seen in CM-flow through (CM-FT) (Figure 4A). Cell-free CTRL medium before and after ultra-filtration contained no measurable particles. Yet, EV depletion did not affect the protective effect of CM on inhibiting apoptosis (Figure 4B). Of note, to compensate for eventual depletion of soluble factors by ultrafiltration as suggested by Whittaker et al. [23], the apoptotic level of cis-CM and cis-CM-FT were normalized to their respective CTRL.
Having shown that the protective effect of CM was not mediated by EVs, we hypothesized that free thiols acting as ROS scavenger [24,30] may have ameliorated oxidative stress as indicated by the gene expression data (Figure 3B). Indeed, CM had a higher free thiol content as compared to the empty media, yet showing large donor-dependent differences in concentration (Figure 4C). Supporting our hypothesis, CM significantly decreased ROS level in both UT- and Cis-treated ciPTEC by 43 % and 79 % in UT-CM and Cis-CM, compared to UT-CTRL and Cis-CTRL, respectively (Figure 4D). Based on a Spearman analysis, free thiols content in CM inversely correlated with ciPTEC apoptosis (R= -0.8, p= 0.167), although not significant due to the large donor heterogeneity and too low number of biological replicates for this kind of analysis (Supplementary Figure S5).
3.2. MSC-CM Promoted Macrophage Polarization towards the M2-Like Phenotype
Having documented the protective effect of CM on cisplatin injury in ciPTECs, we next aimed to assess its effect on macrophages (Figure 5A). First, we assessed phenotype skewing and phagocytosis. Unlike in ciPTECs, cisplatin per se barely affected macrophages (Figure 5B–G, Supplementary Figure S3). The M1 surface marker expression (HLA-DR, CD38 and CD86) of macrophages remained similar, as did the M2 marker expression (CD206, CD163 and phagocytosis). CM however, exerted significant effects, yet irrespective of cisplatin. CM significantly reduced the expression of the M1 marker HLA-DR and CD86 and increased the M2 marker CD206 and CD163. Only in the presence of CM, cisplatin significantly attenuated the CM induced CD206 expression. CM significantly increased macrophage apoptosis, slightly reduced upon cisplatin treatment.
3.3. Macrophages Did Not Boost the Protective Effect of MSC-CM on ciPTECs
Having shown that cisplatin exerted nephrotoxic effects on ciPTECs, significantly ameliorated by CM, but no apparent effect on macrophage polarization and function, while CM induced a shift to the more anti-inflammatory M2 state, we postulated that CM could modulate the vicious crosstalk of injured ciPTEC acting on macrophages. Accordingly, we established indirect co-cultures of ciPTEC and macrophages (Figure 6A). Of note, in the transwell system the concentration of cisplatin needed to be doubled to 30 µM, as 15 µM of cisplatin did not cause the same level of apoptosis as in ciPTEC monoculture (Supplementary Figure S6). As ciPTECs were now seeded on inserts, live-cell imaging of apoptosis was not possible, thus immunofluorescence was performed. Next to Apotracker staining and nuclear fragmentation indicative for apoptosis, connexin-43 (CX-43) was analyzed, a gap junction protein implicated in various nephropathologies [31]. Cisplatin treatment increased CX-43 expression levels 4 ± 3.46- and 3.2 ± 1.32-fold in ciPTECs monoculture and co-culture with macrophages, respectively (Figure 6B,C, compared to UT-CTRL). Co-cultures showed a small decrease in CX-43 levels, but CM, which reduced CX-43 levels 1.9 ± 0.65- and 1.97 ± 0.83-fold in ciPTEC mono- and co-culture, respectively, overruled this reduction. Despite the use of CM pooled from each three donors in these experiments, large data heterogeneity was observed in the transwell system resulting in non-significant statistical analyses. Variances were apparently lowered upon macrophage co-culture. Possibly, by chance highly potent ASC-CM donors were pooled in one experiment, while in the other donor pooling leveled out potent and less potent donor attributes. Despite the lower variation of data, the co-culture had no apparent effect on CX-43 expression. While the co-culture per se lowered cisplatin-induced apoptosis, the anti-apoptotic properties of CM completely surpassed this co-culture effect (apoptotic levels were 2.42 ± 1.08- and 2.44 ± 1.49-fold for cis-CM in ciPTEC mono- and co-culture, respectively, Figure 6D). When assessing nuclei fragmentation, CM also exerted a greater effect in suppressing the number of fragmented nuclei and nuclei fragments than that of the co-culture (Figure 6E).
Furthermore, given the importance of TNF-α in cisplatin-induced AKI, we measured TNF-α levels in the supernatant from the apical ciPTEC side of co-culture. The increase of TNF-α level caused by cisplatin treatment in the co-culture setting was higher in mono- than co-cultures (12.76 ± 12.34- fold and 10.59 ± 10.59- fold, for Cis-CTRL in ciPTEC mono- vs. co-culture, respectively, Figure 6F), indicating a regulatory crosstalk between ciPTEC and macrophages in indirect co-culture. TNF-α level in both culture settings were further suppressed by CM treatment to 5.99 ± 5.02- and 4.76 ± 4.33- fold in mono- and co-culture, respectively.
3.3.1. Despite Enhancing the Phagocytosis Capacity of Macrophages, CM Attenuated Macrophage Factors Secretion Triggered by ciPTECs
We initially postulated that ASC-CM treatment could prevent the vicious crosstalk of injured ciPTEC recruiting and activating pro-inflammatory macrophages (Figure 7A). Yet, the macrophage presence appeared to mediate only minor effects on cisplatin nephrotoxicity in ciPTEC, highly overruled by CM. Addressing now the macrophages in the co-cultures revealed an increase in the phagocytosis activity by 47 % (UT-CTRL, Figure 7B). However, again the stimulatory effect of CM entirely overruled this (4.37 ± 3.09- and 4.32 ± 2.59-fold for UT-CM of macrophage mono and co-culture, respectively). While 15 µM cisplatin showed no effect on macrophage viability and function (Figure 5G), the increased concentration of 30 µM cisplatin in the co-culture system compromised phagocytosis slightly (0.72 ± 0.24- and 0.9 ± 0.39-fold for Cis-CTRL of macrophage mono- and co-culture, respectively). Interestingly, this cisplatin inhibition on phagocytosis also persisted in presence of CM (2.80 ± 1.13- and 2.62 ± 0.65-fold for Cis-CM of macrophage mono- and co-culture, respectively).
To address the postulated changed cross-talk between ciPTEC and macrophages in more detail, the supernatant from the basolateral side of the co-culture was probed for the analytes listed in Supplementary Table S2. Co-cultured ciPTECs generally increased the secretion of certain macrophage factors, including DAMPs. For instance, a 71 %, 61 %, 44 %, and 30 % increase of IL-8, arginase-1, fractalkine, and IL-1β, respectively was observed upon cellular crosstalk (Figure 7C, data presented as relative value to untreated macrophage monoculture). Some factors remained unchanged including S100A8/9, IP-10, HGF, and HSP60, meanwhile the rest showed between 10-20 % increase stimulated by the co-culture. Cisplatin, on the other hand, decreased the secretion of all those factors, except IL-8 and MMP-9, which were elevated in macrophage monocultures by 74 % and 19 %, respectively. This was not observed in co-cultures. Interestingly, ciPTECs cultured alone were also able to produce IL-8 into the basolateral side, however, in contrast to macrophages, the IL-8 release by ciPTECs was downregulated by cisplatin. Therefore, the lower IL-8 concentration seen in cisplatin-treated co-culture as compared to the untreated counterpart might be caused by the opposing effect of cisplatin in those two cell types. The other factors that were secreted in ciPTECs monoculture and modestly elevated by cisplatin include the DAMPs arginase-1 and fractalkine, and IL-33. Yet, IL-33 was detected in both basal media and remained unchanged upon conditioning. We cannot exclude that this was an artefactual detection.
CM further attenuated factors secreted in co-cultures. In general, CM downregulated secreted factors, except for HGF and PDGF-BB that were contained in the CM itself. Especially CM produced in X-Vivo medium (for macrophages) contained high HGF and PDGF-BB levels (Figure 7C), higher than in CM produced in ciPTEC SFM.
Lastly, long-term cisplatin treatment reduced macrophage viability as shown in Supplementary Figure S7A, where cisplatin-treated macrophages showed more cell debris than their untreated counterparts did. The constant presence of cisplatin in both the Cis-CTRL and Cis-CM groups reduced macrophage confluence, which started even from day 2 (Supplementary Figure S7B,C) indicating that despite the CM effect in enhancing phagocytosis, CM could not attenuate macrophage death induced by cisplatin. Given the strong association of free thiol content in the anti-apoptotic capacity of CM, we then measured the free thiol content in the CM used to treat macrophages (Supplementary Figure S7B). Interestingly, while CM for macrophages contained a higher concentration of cytokines and growth factors than that for ciPTECs (Figure 7C), its free thiol concentration was 4.5x lower than the CM for ciPTECs (1.9 ± 2.12 µM vs 8.59 ± 8.8 µM, for CM intended for macrophages and ciPTECs (Figure 4C), respectively). Free thiols in X-Vivo CM showed no trend to correlate to its phagocytosis-inducing capacity (Supplementary Figure S5B).
4. Discussion
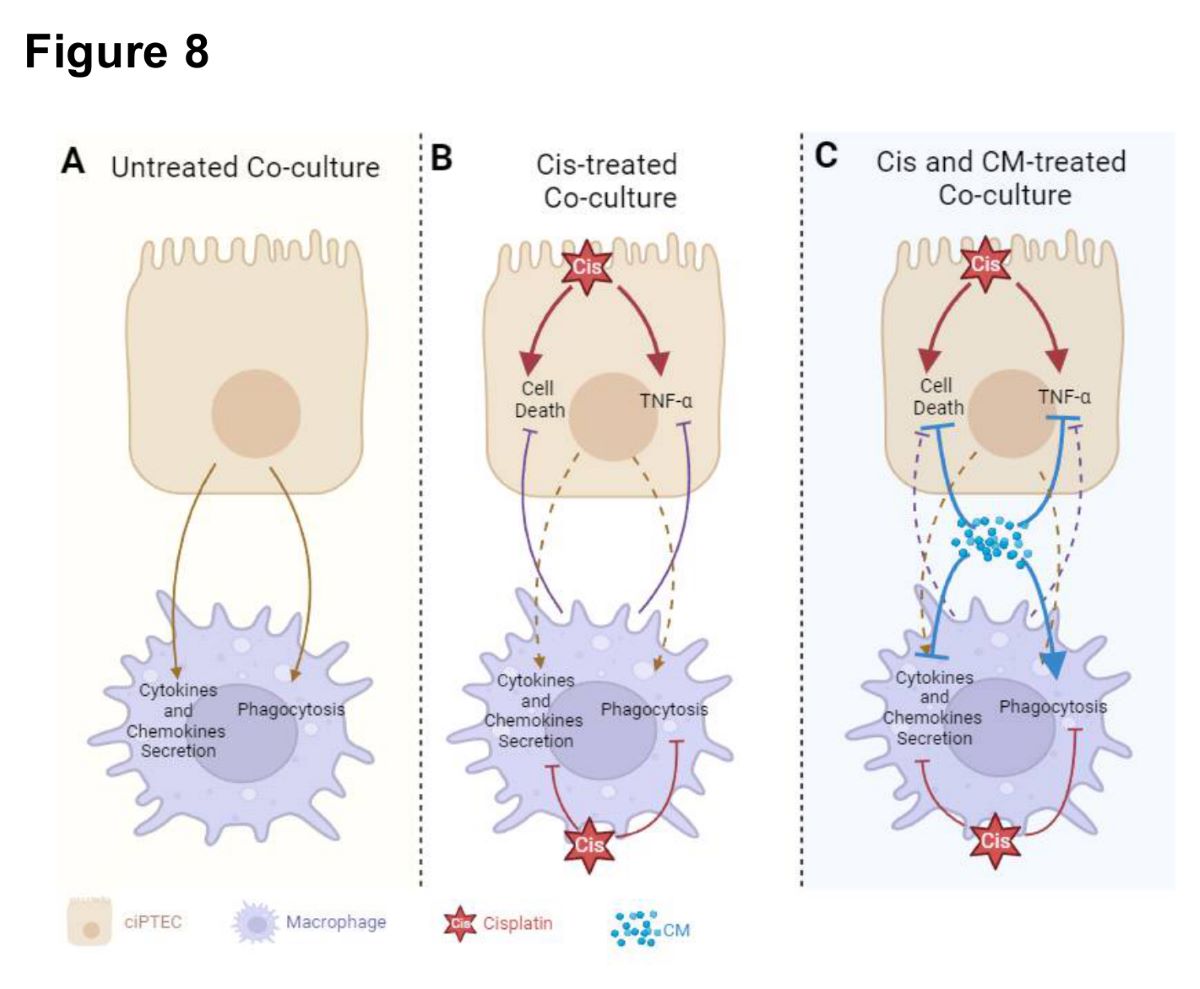
In this study, we have demonstrated the protective effect of MSC secretome (ASC CM) against cisplatin-induced injury in both ciPTECs and macrophages, first individually and second within co-cultures (Figure 8). Yet, contrary to our hypothesis, we did not observe the added benefit of CM in co-cultures, counteracting the vicious cycle of cisplatin-induced nephrotoxicity by modifying the crosstalk of PTECs and macrophages. Yet, this may not rule out the possibility that MSCs and their secretome beneficially influence this complex interplay in vivo.
The protective effect of ASC CM on ciPTECs involved the suppression of apoptosis and enhancement of migratory capacity. CM partially reversed the expression of nephrotoxicity genes induced by cisplatin. Examples are: CDKNA1, GADDH45a, both induced by various cellular stresses, such as DNA damage and oxidative stress, contributing to cell cycle arrest [32,33,34], HMOX1, the gene encoding for heme oxygenase-1, an important anti-oxidative defense mechanism [35], and ATF-3, triggered by ER stress, chemokines, and cytokines regulating apoptosis and necrosis [36]. The attenuation of cisplatin-induced upregulation of these genes documented that CM rescued ciPTECs by alleviating cellular stress, especially oxidative stress.
Given the pivotal role of oxidative stress in ciPTEC apoptosis, we investigated the anti-oxidative capacity of CM. Free thiols or sulfhydryl groups (R-SH) are very easily reduced by ROS and therefore reflect the fluctuation of the redox state of their environment [37]. Due to their sensitivity to ROS, free thiols not only serve as a good indicator of the progression of various degenerative diseases (e.g., digestive, respiratory, cardiovascular, metabolic, and cancer diseases), but also play an important role in dampening oxidative stress by scavenging ROS. The treatment of ciPTECs with CM led to a remarkable decrease in intracellular ROS levels and, subsequently, reduced apoptosis. In fact, our data suggest an inverse relationship between free thiol content and the degree of apoptosis suppressed by CM. It is noteworthy, that a high variance of free thiol content was present across MSC donors. We attribute the ability of MSCs to produce a high level of free thiols to the cell fitness, their vitality, their doubling time, cell size, and morphology (data not shown), however this hypothesis should be tested in a larger study with a higher number of MSC donors. Given the importance of free thiols in cellular redox homeostasis, measuring free thiols presents an easy, robust, and reliable option of a potency assay to select or predict the anti-oxidative properties of MSCs.
Within an accompanying study, we investigated in more detail the underlying mechanisms (Rendra et al. revised manuscript submitted). Various pathways have been described by which either cisplatin causes renal injury or by which MSC/MSC secretome can rescue from nephrotoxic injury. We tested various inhibitors for pathways that have been shown to be involved in cisplatin-induced apoptosis, necrosis or necroptosis [38,39]. N-acetylcysteine (NAC), as expected from the data presented herein, reduced the number of apoptotic cells in both controls, but significantly more in cisplatin-injured ciPTECs. Yet there was no apparent inhibition of ASC CM effects, suggesting that its anti-oxidative properties exceeded NACs inhibitory action. Necrostatin (NEC), an inhibitor targeting receptor-interacting serine/threonine-protein kinase 1 (RIPK1, aka RIP1) and by this the necroptotic pathway, attenuated cisplatin-induced apoptosis, yet again not lowering ASC CM’s anti-apoptotic effects. Likewise, the sphingosine kinase inhibitor (SKI-II) protected against cisplatin-induced apoptosis, while interestingly Mithramyin A, an inhibitor of Specificity Protein 1 (Sp1) and main regulator of sphingosine kinase 1, had no effect at all. Inhibition of stanniocalcin by a blocking antibody, as suggested by the group of Prockop et al. [39], had no significant effect at all, supporting their notion that this pathway becomes activated merely upon priming of MSCs. Yet, we observed that downregulation of miR-181-5p expression appeared involved in the anti-apoptotic activity of ASC-CM (Scaccia et al., manuscript in preparation).
Within the composition of CM, EVs have been reported as the mediator by which MSCs exert their therapeutic effect [40]. However, we showed that EVs were not the key mediator for the anti-apoptotic property of CM, suggesting that soluble factors or smaller EVs (< 100 kDa) are responsible for this effect. Our finding is in agreement with a recent study by our group showing that EVs are dispensable e.g. for angiogenesis of endothelial cells [41] and that bioactivity of EVs is often a result of EV impurity [23,42].
When assessing macrophages alone, we reproduced previous findings of MSC CM promoting M2 polarization of macrophages as seen by decreased expression of M1 surface marker such as HLA-DR and CD86; increased expression of M2 markers, including CD163 and CD206; and higher phagocytosis capacity (Figure 5). In a previous study, we showed IL-6 [43], prostaglandin-2 (PGE-2) and transforming growth factor beta 1 (TGF-β1) to be partly but not entirely involved (Rendra et al., revised manuscript submitted). On the other hand, cisplatin treatment compromised the M2-promoting effect of CM, suggesting cisplatin uptake by macrophages. Supporting this, alveolar macrophages express the transporters capable of uptaking cisplatin, such as MATE, OCTN1, and OCTN2 [44]. Also THP1, a human monocyte cell line, polarized into M2 macrophages showed significantly higher cisplatin uptake, as compared to the M1 and M0 counterparts, and the monocytic cells per se [45]. This might explain why cisplatin partly compromised the effect of CM in skewing macrophage polarization towards M2 macrophages. Considering that M2 macrophages are fueled by oxidative phosphorylation in mitochondria [46,47] and that MSCs promote this metabolic shift [48], cisplatin’s ability to affect mitochondrial function [49] could eventually hinder the M2 polarization promoted by CM.
Beyond the ability in improving the phagocytosis of macrophages, CM could not ameliorate cisplatin-induced macrophage death, at least in the long-term. The measurement of free thiols revealed that CM produced using X-Vivo 10 for macrophage culture contained 4.5x lower free thiols than CM produced in ciPTEC SFM and free thiol levels were not as apparently related to the increased phagocytosis activity as with apoptosis amelioration (Supplementary Figure S5). Whether or not the lower free thiol level of CM in X-Vivo is the reason, why it cannot attenuate macrophage death by cisplatin is beyond the scope of this study.
Contrary to our hypothesis, the coculture system failed to reveal the expected strong additive effect of CM on co-cultures, interrupting the vicious cycle of injured ciPTEC and macrophages (Figure 8). Despite the use of pooled ASC CM to reduce donor heterogeneity, the in vitro data were not as robust in the transwell system as in the standard culture system, yet slightly homogenized in the presence of macrophages. In the absence of CM, ciPTEC and macrophage co-culture showed a slight trend of injury attenuation, which was shown by slightly decreased ciPTEC death markers and TNF-α secretion in the co-culture groups compared to ciPTEC monoculture. However, the protective effect of CM surpassed this co-culture benefit. This might be caused by the fact that CM’s protective effect on ciPTECs was already very strong eventually overruling the macrophages regulatory effect. Not only suppressing ciPTEC apoptosis and nuclei fragmentation, CM also inhibited the expression of CX-43, which has been shown to be an important player of renal fibrosis and CKD progression [50,51]. Furthermore, reduction of TNF-α secretion by ciPTECs was also observed in the co-culture groups and, even more so, in CM-treated groups, suggesting that CM ameliorates also the inflammatory response induced upon cisplatin injury. Of note, the attenuation of TNF- α secretion might in turn contribute to lower cell death as it also plays important role in promoting apoptosis through the activation of the death receptor or extrinsic pathway [52,53,54].
Nonetheless, given the profound increase of phagocytosis elicited by CM, the role of macrophages upon CM treatment might be more significant in an in vivo model, as phagocytosis of dead cells is an important step to prevent prolonged inflammation and stimulate regeneration [55,56]. In fact, in a mouse unilateral ureteral obstruction (UUO) model that develops renal fibrosis, compared to the sham control the population of highly phagocytotic macrophages (M2) decreased, while the ones with low phagocytosis ability increased (M1) [56]. Interestingly, the infusion of highly phagocytic macrophages (M2) attenuated renal fibrosis in this model. It is noteworthy to mention that M1 and M2 is an oversimplification of macrophage polarization showing the extremes, however macrophage polarization during renal injury is more nuanced [57]. For instance, it has been postulated that the M2 macrophages responsible for renal fibrosis express CD206, CD204, and HLA-DRhigh, meanwhile the ones responsible for tissue homeostasis express CD206, CD163, and HLA-DRlow [58]. Given that our CM boosted macrophage phagocytosis and increased the expression of CD206 and CD163, while decreasing the level of HLA-DR and CD86, the CM treatment for cisplatin-induced AKI might be beneficial to prevent the progression of renal fibrosis in vivo. Moreover, the phagocytosis of dead cells can also stimulate macrophages further to promote tubular recovery [56].
Our study demonstrated that in co-cultures, ciPTECs and macrophages could sense and respond to each other’s stimuli. In co-culture, macrophages were activated by ciPTECs as indicated by increased production of various factors comprising cytokines (IL-8), chemokines (Fractalkine), DAMPs (arginase-1), growth factors (HGF), lipoxin (survivin) and matrix metalloproteinases (MMP-9) (Figure 7C). This is in line with a previous study revealing that both direct and indirect co-culture of PTEC and monocytes resulted in the inhibition of monocyte maturation into dendritic cells, marked by lower levels of HLA-DR and CD86, and elevated level of phagocytosis [59]. Interestingly, previous studies reported injured PTECs to drive macrophage polarization into M1 by releasing EVs containing miR-199a-5p, miRNA-23a, and miR-19b-3p, respectively [60,61], and to switch macrophage metabolism towards glycolysis [62]. In our co-culture system, cisplatin induced pro-inflammatory TNF-α secretion of ciPTECs, however slightly decreased within co-cultures (Figure 6F). TNF- α most likely also affected macrophage polarization and, to some degree, contributed to the downregulation of macrophage phagocytosis in co-cultures treated with cisplatin. Co-culture mediated decrease of TNF-α secretion is in contrast to a previous study where macrophages augmented the albumin-induced cytokine release by PTECs [63]. It is also noteworthy that we observed similar patterns regarding the TNF-α secretion and the cisplatin-induced ciPTEC death markers, all slightly reduced in the co-culture setting, compared to monoculture, implying at least some regulatory effect.
Besides dramatically increasing phagocytosis, CM downregulated overall macrophages` factor secretion (Figure 7C). MSC secretome is known to suppress the secretion of pro-inflammatory cytokines on macrophages stimulated by LPS [64], which is in line with our observation that CM decreased macrophage pro-inflammatory cytokine and chemokine level secretion (e.g. IL-1β, IL-13, IL-8, TNF-α, and IP-10). However, not only pro-inflammatory cytokines, our data showed that CM also decreased anti-inflammatory cytokines and enzymes such as IL-10, IL-1RA, and arginase-1. This is in contrast to a previous finding that reported that MSC treatment increases the production of IL-10 and arginase-1 [65]. This discrepancy might be caused by the fact that in most of the previous studies, macrophages were also stimulated with LPS [65,66] or M1 polarizing medium [67], which might be a stronger stimulus than co-culture with ciPTECs alone. The upregulation of those anti-inflammatory and pro-regenerative factors in macrophages was observed mostly in in vivo models with higher cell interaction, thus more macrophage stimulation [67].
The strength of our study is that it provides an overview of the interaction between PTEC and macrophages under cisplatin treatment with and without CM. We also shed light on the importance of free thiols in CM as a metric to assess the anti-oxidative properties of CM, as well as the profound effect of cisplatin on macrophage viability and phagocytosis that is often overlooked in cisplatin-induced AKI. While there are already many reports on how cisplatin influences inflammatory response in PTECs, only a few have focused on macrophages in the context of kidney injury. The limitation of our study is the mere in vitro design, which can only reflect some aspects of the complex interplay and will not allow us to capture the whole PTEC and macrophage crosstalk comprehensively. Further, within this study, we focused on CM derived from non-stimulated ASCs. Priming/licensing by either (pro-) inflammatory molecules, hypoxia or other triggers or cell-cell contacts may further augment therapeutic potency [68].
Our data suggest that MSC CM could ameliorate the cytotoxic effects of cisplatin in AKI, acting predominantly on ciPTEC but also polarizing macrophages to the anti-inflammatory and pro-regenerative M2 phenotype. A therapeutic scenario, thus, could be to administer MSC CM to patients concomitantly with cisplatin. However, implementing this kind of therapy may intervene with the desired anti-cancer benefit of cisplatin. Yet, there are already ideas on how to concentrate the protective MSC effect locally. To achieve tissue specificity, a matrix metalloproteinase-2 (MMP-2) sensitive self-assembling peptide hydrogel containing MSC EVs has been described. Since MMP-2 is normally upregulated upon kidney injury, the injection of MSC-EV in this hydrogel resulted in local retention in the kidney [69]. Of course, the feasibility of this strategy to limit off-target MSC treatment still needs to be further tested, especially if there are other organs undergoing fibrosis with elevated MMP-2 levels. Nevertheless, this presents an option by which MSC therapy might be applied to prevent or treat cisplatin-induced AKI.
5. Conclusions
Our results show that first, ASC CM protected ciPTECs from cisplatin-induced injury, likely associated with its anti-oxidative properties. Second, CM promoted M2 polarization, which was compromised, however, by cisplatin. Third, our co-culture showed that cisplatin only slightly altered the crosstalk between ciPTECs and macrophages. Contrary to our hypothesis, we did not observe the added benefit of CM counteracting the vicious cycle of cisplatin-induced nephrotoxicity, at least not in our in vitro setup. This might be caused by the fact that the CM already exerted very strong protective effect surpassing the macrophage contribution in this system. Given the short-term in vitro nature, our system may not describe the role of CM and its effects on the interplay of PTECs and macrophages in induced proximal tubule recovery in its entire complexity. For clinical implementation of MSC secretome in the future, these aspects should be considered as well.
Supplementary Materials
The following supporting information can be downloaded at the website of this paper posted on Preprints.org, Figure S1: Characterization of Adipose Stromal Cells (ASCs) and conditioned medium (CM) production; Figure S2: Purity check of CD14+ monocytes after MACS using flow cytometry; Figure S3: CM treatment influenced the expression of macrophage surface markers; Figure S4: CM attenuated cisplatin effect on ciPTEC apoptosis and migratory capacity; Figure S5: Correlation of free thiols with apoptosis and phagocytosis; Figure S6: In the transwell system, 15 µM cisplatin induced only CX-43 expression but no apoptosis of ciPTEC; Figure S7: Cisplatin negatively influenced macrophage viability in a long-term treatment; Table S1: Primer sequences used for qPCR; Table S2: The concentrations of analytes in the co-culture supernatant measured using LUMINEX 200.
Author Contributions
Conceptualization, E.R. and K.B.; methodology, E.R., S.U. I.M., C.M.; validation, E.R. and K.B.; formal analysis, E.R.; investigation, E.R., S.U. I.M., C.M.; resources, K.B. and H.K.; data curation, E.R.; writing—original draft preparation, E.R. and K.B.; writing—review and editing, K.B. and H.K.; visualization, E.R.; supervision, K.B.; project administration, K.B and H.K.; funding acquisition, K.B. All authors have read and agreed to the published version of the manuscript.
Funding
This project has received funding from the European Union’s Horizon 2020 research and innovation programme under the Marie Skłodowska-Curie grant agreement No 813839. The funding body played no role in the design of the study and collection, analysis, and interpretation of data and in writing the manuscript.
Institutional Review Board Statement
In this section, you should add the Institutional Review Board Statement and approval num MSCs were isolated from lipoaspirates (healthy donors of both gender in a range of age 47-25 years) after obtaining informed consent (Mannheim Ethics Commission; 2020 Confirmation that procedures are still in accordance with ethical application vote numbers: 2011-215N-M Harvest and preparation of MSCs from human adipose tissue (2011). 2009-210N-MA Harvest and isolation of stromal cells from human adipose tissue to gain a manufacturing license (2009). 2009- Confirmation that procedures are still in accordance with 2006-192NMA (2009). 2006-192N-MA Isolation and characterisation of mesenchymal stem cells from human lipoaspirate (2006). Monocytes were isolated from buffy coats provided by the German Red Cross Blood Donor Service Mannheim (Baden-Württemberg - Hessen, Germany) from healthy donors after obtaining informed consent. No additional ethical vote required here, confirmed by the Mannheim Ethics Commission: donors give informed consent, buffy coats not dedicated for therapeutic use (2020).
Informed Consent Statement
Informed consent was obtained from all subjects involved in the study.
Data Availability Statement
The datasets used and/or analysed during the current study are available from the corresponding author on reasonable request.
Acknowledgments
The authors would like to acknowledge Ina Schäfer and Qi Gao from the Live Cell Imaging Mannheim (LIMa) Core Facility; Silke Vorwald from Neuoroanatomy, and Bhavin Shah from European Center for Angioscience, Medical Faculty Mannheim, University of Heidelberg, for the technical and consultative support on immunofluorescence staining and confocal microscopy. We also would like to thank Victor Costina from Proteomics Core Facility, Medical Faculty Mannheim, for providing us the technical and consultative support on LUMINEX measurement. Lastly, we acknowledge Vladimir Riabov from Hematology und Internal Oncology, Medical Faculty Mannheim, University of Heidelberg, for sharing his expertise on macrophage biology.
Conflicts of Interest
The authors declare no conflict of interest. The funders had no role in the design of the study; in the collection, analyses, or interpretation of data; in the writing of the manuscript; or in the decision to publish the result.
References
- Torres Crigna, A.; Daniele, C.; Gamez, C.; Medina Balbuena, S.; Pastene, D.O.; Nardozi, D.; Brenna, C.; Yard, B.; Gretz, N.; Bieback, K. Stem/Stromal Cells for Treatment of Kidney Injuries With Focus on Preclinical Models. Front Med (Lausanne) 2018, 5, 179. [Google Scholar] [CrossRef] [PubMed]
- Stavely, R.; Nurgali, K. The emerging antioxidant paradigm of mesenchymal stem cell therapy. Stem Cells Transl Med 2020, 9, 985–1006. [Google Scholar] [CrossRef] [PubMed]
- Rendra, E.; Scaccia, E.; Bieback, K. Recent advances in understanding mesenchymal stromal cells. F1000Res 2020, 9. [Google Scholar] [CrossRef] [PubMed]
- Daneshmandi, L.; Shah, S.; Jafari, T.; Bhattacharjee, M.; Momah, D.; Saveh-Shemshaki, N.; Lo, K.W.; Laurencin, C.T. Emergence of the Stem Cell Secretome in Regenerative Engineering. Trends Biotechnol 2020, 38, 1373–1384. [Google Scholar] [CrossRef] [PubMed]
- Nonnekens, J.; Hoeijmakers, J.H. After surviving cancer, what about late life effects of the cure? EMBO Mol Med 2017, 9, 4–6. [Google Scholar] [CrossRef] [PubMed]
- McSweeney, K.R.; Gadanec, L.K.; Qaradakhi, T.; Ali, B.A.; Zulli, A.; Apostolopoulos, V. Mechanisms of Cisplatin-Induced Acute Kidney Injury: Pathological Mechanisms, Pharmacological Interventions, and Genetic Mitigations. Cancers (Basel) 2021, 13, 1572. [Google Scholar] [CrossRef] [PubMed]
- Miller, R.P.; Tadagavadi, R.K.; Ramesh, G.; Reeves, W.B. Mechanisms of Cisplatin nephrotoxicity. Toxins (Basel) 2010, 2, 2490–2518. [Google Scholar] [CrossRef] [PubMed]
- Oh, G.S.; Kim, H.J.; Shen, A.; Lee, S.B.; Khadka, D.; Pandit, A.; So, H.S. Cisplatin-induced Kidney Dysfunction and Perspectives on Improving Treatment Strategies. Electrolyte Blood Press 2014, 12, 55–65. [Google Scholar] [CrossRef] [PubMed]
- Yonezawa, A.; Inui, K. Organic cation transporter OCT/SLC22A and H(+)/organic cation antiporter MATE/SLC47A are key molecules for nephrotoxicity of platinum agents. Biochem Pharmacol 2011, 81, 563–568. [Google Scholar] [CrossRef]
- Motohashi, H.; Nakao Y Fau - Masuda, S.; Masuda S Fau - Katsura, T.; Katsura T Fau - Kamba, T.; Kamba T Fau - Ogawa, O.; Ogawa O Fau - Inui, K.-I.; Inui, K. Precise comparison of protein localization among OCT, OAT, and MATE in human kidney.
- Soni, H.; Kaminski, D.; Gangaraju, R.; Adebiyi, A. Cisplatin-induced oxidative stress stimulates renal Fas ligand shedding. Ren Fail 2018, 40, 314–322. [Google Scholar] [CrossRef]
- Huen, S.C.; Cantley, L.G. Macrophages in Renal Injury and Repair. Annu Rev Physiol 2017, 79, 449–469. [Google Scholar] [CrossRef] [PubMed]
- Baek, J.H. The Impact of Versatile Macrophage Functions on Acute Kidney Injury and Its Outcomes. Front Physiol 2019, 10, 1016. [Google Scholar] [CrossRef] [PubMed]
- Engel, J.E.; Chade, A.R. Macrophage polarization in chronic kidney disease: a balancing act between renal recovery and decline? Am J Physiol Renal Physiol 2019, 317, F1409–F1413. [Google Scholar] [CrossRef] [PubMed]
- Guiteras, R.; Flaquer, M.; Cruzado, J.M. Macrophage in chronic kidney disease. Clin Kidney J 2016, 9, 765–771. [Google Scholar] [CrossRef] [PubMed]
- Lech, M.; Grobmayr, R.; Ryu, M.; Lorenz, G.; Hartter, I.; Mulay, S.R.; Susanti, H.E.; Kobayashi, K.S.; Flavell, R.A.; Anders, H.J. Macrophage phenotype controls long-term AKI outcomes--kidney regeneration versus atrophy. J Am Soc Nephrol 2014, 25, 292–304. [Google Scholar] [CrossRef] [PubMed]
- Nash, W.T.; Yee, M.S.; Okusa, M.D. Myeloid Response to Acute Kidney Injury. Nephron 2023, 147, 39–43. [Google Scholar] [CrossRef] [PubMed]
- Lu, L.H.; Oh, D.J.; Dursun, B.; He, Z.; Hoke, T.S.; Faubel, S.; Edelstein, C.L. Increased macrophage infiltration and fractalkine expression in cisplatin-induced acute renal failure in mice. J Pharmacol Exp Ther 2008, 324, 111–117. [Google Scholar] [CrossRef] [PubMed]
- Rui-Zhi, T.; Ke-Huan, X.; Yuan, L.; Xiao, L.; Bing-Wen, Z.; Tong-Tong, L.; Li, W. Renoprotective effect of isoliquiritigenin on cisplatin-induced acute kidney injury through inhibition of FPR2 in macrophage. J Pharmacol Sci 2022, 148, 56–64. [Google Scholar] [CrossRef]
- Tan, R.-Z.; Wang, C.; Deng, C.; Zhong, X.; Yan, Y.; Luo, Y.; Lan, H.-Y.; He, T.; Wang, L. Quercetin protects against cisplatin-induced acute kidney injury by inhibiting Mincle/Syk/NF-κB signaling maintained macrophage inflammation. Phytotherapy Research 2020, 34, 139–152. [Google Scholar] [CrossRef]
- Nakagawa, M.; Karim, M.R.; Izawa, T.; Kuwamura, M.; Yamate, J. Immunophenotypical Characterization of M1/M2 Macrophages and Lymphocytes in Cisplatin-Induced Rat Progressive Renal Fibrosis. Cells-Basel 2021, 10, 257. [Google Scholar] [CrossRef]
- Netsch, P.; Elvers-Hornung, S.; Uhlig, S.; Klüter, H.; Huck, V.; Kirschhöfer, F.; Brenner-Weiß, G.; Janetzko, K.; Solz, H.; Wuchter, P.; et al. Human mesenchymal stromal cells inhibit platelet activation and aggregation involving CD73-converted adenosine. Stem Cell Research & Therapy 2018, 9, 184. [Google Scholar] [CrossRef]
- Whittaker, T.E.; Nagelkerke, A.; Nele, V.; Kauscher, U.; Stevens, M.M. Experimental artefacts can lead to misattribution of bioactivity from soluble mesenchymal stem cell paracrine factors to extracellular vesicles. J Extracell Vesicles 2020, 9. [Google Scholar] [CrossRef] [PubMed]
- Baba, S.P.; Bhatnagar, A. ROLE OF THIOLS IN OXIDATIVE STRESS. Current opinion in toxicology 2018, 7, 133–139. [Google Scholar] [CrossRef] [PubMed]
- Jansen, J.; Schophuizen, C.M.S.; Wilmer, M.J.; Lahham, S.H.M.; Mutsaers, H.A.M.; Wetzels, J.F.M.; Bank, R.A.; van den Heuvel, L.P.; Hoenderop, J.G.; Masereeuw, R. A morphological and functional comparison of proximal tubule cell lines established from human urine and kidney tissue. Exp Cell Res 2014, 323, 87–99. [Google Scholar] [CrossRef]
- Yano, T.; Itoh, Y.; Matsuo, M.; Kawashiri, T.; Egashira, N.; Oishi, R. Involvement of both tumor necrosis factor-α-induced necrosis and p53-mediated caspase-dependent apoptosis in nephrotoxicity of cisplatin. Apoptosis 2007, 12, 1901–1909. [Google Scholar] [CrossRef] [PubMed]
- Ershov, D.; Phan, M.-S.; Pylvänäinen, J.W.; Rigaud, S.U.; Le Blanc, L.; Charles-Orszag, A.; Conway, J.R.W.; Laine, R.F.; Roy, N.H.; Bonazzi, D.; et al. TrackMate 7: integrating state-of-the-art segmentation algorithms into tracking pipelines. Nature Methods 2022, 19, 829–832. [Google Scholar] [CrossRef] [PubMed]
- Bruno, S.; Grange, C.; Collino, F.; Deregibus, M.C.; Cantaluppi, V.; Biancone, L.; Tetta, C.; Camussi, G. Microvesicles derived from mesenchymal stem cells enhance survival in a lethal model of acute kidney injury. PLoS One 2012, 7, e33115. [Google Scholar] [CrossRef] [PubMed]
- Yuan, X.; Li, D.; Chen, X.; Han, C.; Xu, L.; Huang, T.; Dong, Z.; Zhang, M. Extracellular vesicles from human-induced pluripotent stem cell-derived mesenchymal stromal cells (hiPSC-MSCs) protect against renal ischemia/reperfusion injury via delivering specificity protein (SP1) and transcriptional activating of sphingosine kinase 1 and inhibiting necroptosis. Cell Death & Disease 2017, 8, 3200. [Google Scholar] [CrossRef]
- Abdulle, A.E.; Bourgonje, A.R.; Kieneker, L.M.; Koning, A.M.; la Bastide-van Gemert, S.; Bulthuis, M.L.C.; Dijkstra, G.; Faber, K.N.; Dullaart, R.P.F.; Bakker, S.J.L.; et al. Serum free thiols predict cardiovascular events and all-cause mortality in the general population: a prospective cohort study. BMC Medicine 2020, 18, 130. [Google Scholar] [CrossRef]
- Roger, E.; Boutin, L.; Chadjichristos, C.E. The Role of Connexin 43 in Renal Disease: Insights from In Vivo Models of Experimental Nephropathy. International Journal of Molecular Sciences 2022, 23, 13090. [Google Scholar] [CrossRef]
- Miyaji, T.; Kato, A.; Yasuda, H.; Fujigaki, Y.; Hishida, A. Role of the increase in p21 in cisplatin-induced acute renal failure in rats. J Am Soc Nephrol 2001, 12, 900–908. [Google Scholar] [CrossRef] [PubMed]
- Liebermann, D.A.; Hoffman, B. Gadd45 in stress signaling. J Mol Signal 2008, 3, 15. [Google Scholar] [CrossRef] [PubMed]
- Abbas, T.; Dutta, A. p21 in cancer: intricate networks and multiple activities. Nat Rev Cancer 2009, 9, 400–414. [Google Scholar] [CrossRef] [PubMed]
- Chiang, S.K.; Chen, S.E.; Chang, L.C. The Role of HO-1 and Its Crosstalk with Oxidative Stress in Cancer Cell Survival. Cells-Basel 2021, 10, 2401. [Google Scholar] [CrossRef]
- Ku, H.C.; Cheng, C.F. Master Regulator Activating Transcription Factor 3 (ATF3) in Metabolic Homeostasis and Cancer. Front Endocrinol 2020, 11. [Google Scholar] [CrossRef]
- Baba, S.P.; Bhatnagar, A. Role of Thiols in Oxidative Stress. Curr Opin Toxicol 2018, 7, 133–139. [Google Scholar] [CrossRef] [PubMed]
- Yuan, X.D.; Li, D.W.; Chen, X.S.; Han, C.H.; Xu, L.M.; Huang, T.; Dong, Z.; Zhang, M. Extracellular vesicles from human-induced pluripotent stem cell-derived mesenchymal stromal cells (hiPSC-MSCs) protect against renal ischemia/reperfusion injury via delivering specificity protein (SP1) and transcriptional activating of sphingosine kinase 1 and inhibiting necroptosis. Cell Death Dis 2017, 8. [Google Scholar] [CrossRef]
- Block, G.J.; Ohkouchi, S.; Fung, F.; Frenkel, J.; Gregory, C.; Pochampally, R.; DiMattia, G.; Sullivan, D.E.; Prockop, D.J. Multipotent stromal cells are activated to reduce apoptosis in part by upregulation and secretion of stanniocalcin-1. Stem Cells 2009, 27, 670–681. [Google Scholar] [CrossRef]
- Gowen, A.; Shahjin, F.; Chand, S.; Odegaard, K.E.; Yelamanchili, S.V. Mesenchymal Stem Cell-Derived Extracellular Vesicles: Challenges in Clinical Applications. Front Cell Dev Biol 2020, 8. [Google Scholar] [CrossRef]
- Skovronova, R.; Scaccia, E.; Calcat-i-Cervera, S.; Bussolati, B.; O’Brien, T.; Bieback, K. Adipose stromal cells bioproducts as cell-free therapies: manufacturing and therapeutic dose determine in vitro functionality. J Transl Med 2023, 21. [Google Scholar] [CrossRef]
- Wolf, M.; Poupardin, R.W.; Ebner-Peking, P.; Andrade, A.C.; Blochl, C.; Obermayer, A.; Gomes, F.G.; Vari, B.; Maeding, N.; Eminger, E.; et al. A functional corona around extracellular vesicles enhances angiogenesis, skin regeneration and immunomodulation. J Extracell Vesicles 2022, 11, e12207. [Google Scholar] [CrossRef] [PubMed]
- Liu, C.Y.; Xu, Y.; Lu, Y.C.; Du, P.; Li, X.X.; Wang, C.C.; Guo, P.; Diao, L.; Lu, G.Z. Mesenchymal stromal cells pretreated with proinflammatory cytokines enhance skin wound healing via IL-6-dependent M2 polarization. Stem Cell Res Ther 2022, 13. [Google Scholar] [CrossRef] [PubMed]
- Berg, T.; Hegelund-Myrbäck, T.; Öckinger, J.; Zhou, X.H.; Brännström, M.; Hagemann-Jensen, M.; Werkström, V.; Seidegård, J.; Grunewald, J.; Nord, M.; et al. Expression of MATE1, P-gp, OCTN1 and OCTN2, in epithelial and immune cells in the lung of COPD and healthy individuals. Resp Res 2018, 19. [Google Scholar] [CrossRef] [PubMed]
- Schoeberl, A.; Gutmann, M.; Theiner, S.; Schaier, M.; Schweikert, A.; Berger, W.; Koellensperger, G. Cisplatin Uptake in Macrophage Subtypes at the Single-Cell Level by LA-ICP-TOFMS Imaging. Anal Chem 2021, 93, 16456–16465. [Google Scholar] [CrossRef] [PubMed]
- Kelly, B.; O’Neill, L.A.J. Metabolic reprogramming in macrophages and dendritic cells in innate immunity. Cell Res 2015, 25, 771–784. [Google Scholar] [CrossRef] [PubMed]
- Viola, A.; Munari, F.; Sánchez-Rodríguez, R.; Scolaro, T.; Castegna, A. The Metabolic Signature of Macrophage Responses. Front Immunol 2019, 10. [Google Scholar] [CrossRef] [PubMed]
- Luque-Campos, N.; Bustamante-Barrientos, F.A.; Pradenas, C.; García, C.; Araya, M.J.; Bohaud, C.; Contreras-López, R.; Elizondo-Vega, R.; Djouad, F.; Luz-Crawford, P.; et al. The Macrophage Response Is Driven by Mesenchymal Stem Cell-Mediated Metabolic Reprogramming. Front Immunol 2021, 12. [Google Scholar] [CrossRef] [PubMed]
- Kleih, M.; Böpple, K.; Dong, M.; Gaissler, A.; Heine, S.; Olayioye, M.A.; Aulitzky, W.E.; Essmann, F. Direct impact of cisplatin on mitochondria induces ROS production that dictates cell fate of ovarian cancer cells. Cell Death Dis 2019, 10. [Google Scholar] [CrossRef] [PubMed]
- Prakoura, N.; Kavvadas, P.; Chadjichristos, C.E. Connexin 43: a New Therapeutic Target Against Chronic Kidney Disease? Cell Physiol Biochem 2018, 49, 998–1009. [Google Scholar] [CrossRef]
- Xu, H.Z.; Wang, M.; Li, Y.Z.; Shi, M.X.; Wang, Z.; Cao, C.J.; Hong, Y.; Hu, B.; Zhu, H.; Zhao, Z.; et al. Blocking connexin 43 and its promotion of ATP release from renal tubular epithelial cells ameliorates renal fibrosis. Cell Death Dis 2022, 13. [Google Scholar] [CrossRef]
- Kumar, R.; Herbert, P.E.; Warrens, A.N. An introduction to death receptors in apoptosis. Int J Surg 2005, 3, 268–277. [Google Scholar] [CrossRef] [PubMed]
- Dong, Z.; Atherton, S.S. Tumor necrosis factor-α in cisplatin nephrotoxicity:: A homebred foe? Kidney Int 2007, 72, 5–7. [Google Scholar] [CrossRef] [PubMed]
- Zhang, B.; Ramesh, G.; Norbury, C.C.; Reeves, W.B. Cisplatin-induced nephrotoxicity is mediated by tumor necrosis factor-α produced by renal parenchymal cells. Kidney Int 2007, 72, 37–44. [Google Scholar] [CrossRef]
- Nelson, P.J.; Rees, A.J.; Griffin, M.D.; Hughes, J.; Kurts, C.; Duffield, J. The Renal Mononuclear Phagocytic System. J Am Soc Nephrol 2012, 23, 194–203. [Google Scholar] [CrossRef] [PubMed]
- Calle, P.; Jativa, S.; Torrico, S.; Muñoz, A.; García, M.; Sola, A.; Serra, D.; Mera, P.; Herrero, L.; Hotter, G. Infusion of Phagocytic Macrophages Overexpressing CPT1a Ameliorates Kidney Fibrosis in the UUO Model. Cells-Basel 2021, 10, 1650. [Google Scholar] [CrossRef] [PubMed]
- Baek, J.H. The Impact of Versatile Macrophage Functions on Acute Kidney Injury and Its Outcomes. Front Physiol 2019, 10. [Google Scholar] [CrossRef] [PubMed]
- Anders, H.J.; Ryu, M. Renal microenvironments and macrophage phenotypes determine progression or resolution of renal inflammation and fibrosis. Kidney Int 2011, 80, 915–925. [Google Scholar] [CrossRef]
- Sampangi, S.; Kassianos, A.J.; Wang, X.J.; Beagley, K.W.; Klein, T.; Afrin, S.; Healy, H.; Wilkinson, R. The Mechanisms of Human Renal Epithelial Cell Modulation of Autologous Dendritic Cell Phenotype and Function. Plos One 2015, 10. [Google Scholar] [CrossRef] [PubMed]
- Li, M.; Xie, H.B.; Liu, Y.K.; Xia, C.Y.; Cun, X.L.; Long, Y.; Chen, X.X.; Deng, M.; Guo, R.; Zhang, Z.R.; et al. Knockdown of hypoxia-inducible factor-1 alpha by tumor targeted delivery of CRISPR/Cas9 system suppressed the metastasis of pancreatic cancer. J Control Release 2019, 304, 204–215. [Google Scholar] [CrossRef]
- Lv, L.L.; Feng, Y.; Wu, M.; Wang, B.; Li, Z.L.; Zhong, X.; Wu, W.J.; Chen, J.; Ni, H.F.; Tang, T.T.; et al. Exosomal miRNA-19b-3p of tubular epithelial cells promotes M1 macrophage activation in kidney injury. Cell Death Differ 2020, 27, 210–226. [Google Scholar] [CrossRef]
- Jia, Y.; Chen, J.; Zheng, Z.; Tao, Y.; Zhang, S.; Zou, M.; Yang, Y.; Xue, M.; Hu, F.; Li, Y.; et al. Tubular epithelial cell-derived extracellular vesicles induce macrophage glycolysis by stabilizing HIF-1alpha in diabetic kidney disease. Mol Med 2022, 28, 95. [Google Scholar] [CrossRef] [PubMed]
- Lai, K.N.; Leung, J.C.K.; Chan, L.Y.Y.; Guo, H.; Tang, S.C.W. Interaction between proximal tubular epithelial cells and infiltrating monocytes/T cells in the proteinuric state. Kidney Int 2007, 71, 526–538. [Google Scholar] [CrossRef] [PubMed]
- Jin, Q.H.; Kim, H.K.; Na, J.Y.; Jin, C.; Seon, J.K. Anti-inflammatory effects of mesenchymal stem cell-conditioned media inhibited macrophages activation in vitro. Sci Rep-Uk 2022, 12. [Google Scholar] [CrossRef] [PubMed]
- Liu, F.; Qiu, H.; Xue, M.; Zhang, S.; Zhang, X.; Xu, J.; Chen, J.; Yang, Y.; Xie, J. MSC-secreted TGF-beta regulates lipopolysaccharide-stimulated macrophage M2-like polarization via the Akt/FoxO1 pathway. Stem Cell Res Ther 2019, 10, 345. [Google Scholar] [CrossRef]
- Ko, J.H.; Kim, H.J.; Jeong, H.J.; Lee, H.J.; Oh, J.Y. Mesenchymal Stem and Stromal Cells Harness Macrophage-Derived Amphiregulin to Maintain Tissue Homeostasis. Cell Rep 2020, 30, 3806–3820. [Google Scholar] [CrossRef]
- Stevens, H.Y.; Bowles, A.C.; Yeago, C.; Roy, K. Molecular Crosstalk Between Macrophages and Mesenchymal Stromal Cells. Front Cell Dev Biol 2020, 8. [Google Scholar] [CrossRef] [PubMed]
- Giacomini, C.; Graneli, C.; Hicks, R.; Dazzi, F. The critical role of apoptosis in mesenchymal stromal cell therapeutics and implications in homeostasis and normal tissue repair. Cell Mol Immunol 2023, 20, 570–582. [Google Scholar] [CrossRef]
- Zhou, Y.J.; Liu, S.Y.; Zhao, M.; Wang, C.S.; Li, L.; Yuan, Y.J.; Li, L.; Liao, G.N.; Bresette, W.; Zhang, J.; et al. Injectable extracellular vesicle-released self-assembling peptide nanofiber hydrogel as an enhanced cell-free therapy for tissue regeneration. J Control Release 2019, 316, 93–104. [Google Scholar] [CrossRef]
Figure 1.
Hypothesis and establishment of the cisplatin injury model. We hypothesize that the MSC secretome acts on various levels to ameliorate cisplatin nephrotoxity: 1- prevention of apoptosis of ciPTEC, 2- prevention of cisplatin toxicity in macrophages and polarization towards M2-macrophages, 3- boosted effect by preventing the vicious cycle of crosstalk between injured ciPTEC and recruited M1-polarized macrophages (A) (image created using BioRender). Matured ciPTECs were treated with different concentrations of cisplatin for 24h – for experiments with CM, CM was added after 1 h for a total cisplatin treatment time of 24 h (B). 24 h later their viability (C) and intracellular ATP were measured (D). To assess their migratory capacity, 24h post cisplatin treatment, the ciPTEC monolayer was scratched and cisplatin-containing medium was discarded and replaced with fresh SFM. The closing of the wound was monitored using live-cell imaging and quantified 3 days after the wound was made (E). One-Way ANOVA with Tukey‘s multiple comparisons test, significance values: * p<0.5, **p<0.01, ***p<0.001, ****p<0.0001. All graphs: ciPTEC n=3. PTEC- proximal tubular epithelial cells, ci-PTEC- conditionally immortalized PTEC, Mac – macrophages, CTRL- control, Cis – cisplatin, CM- conditioned medium.
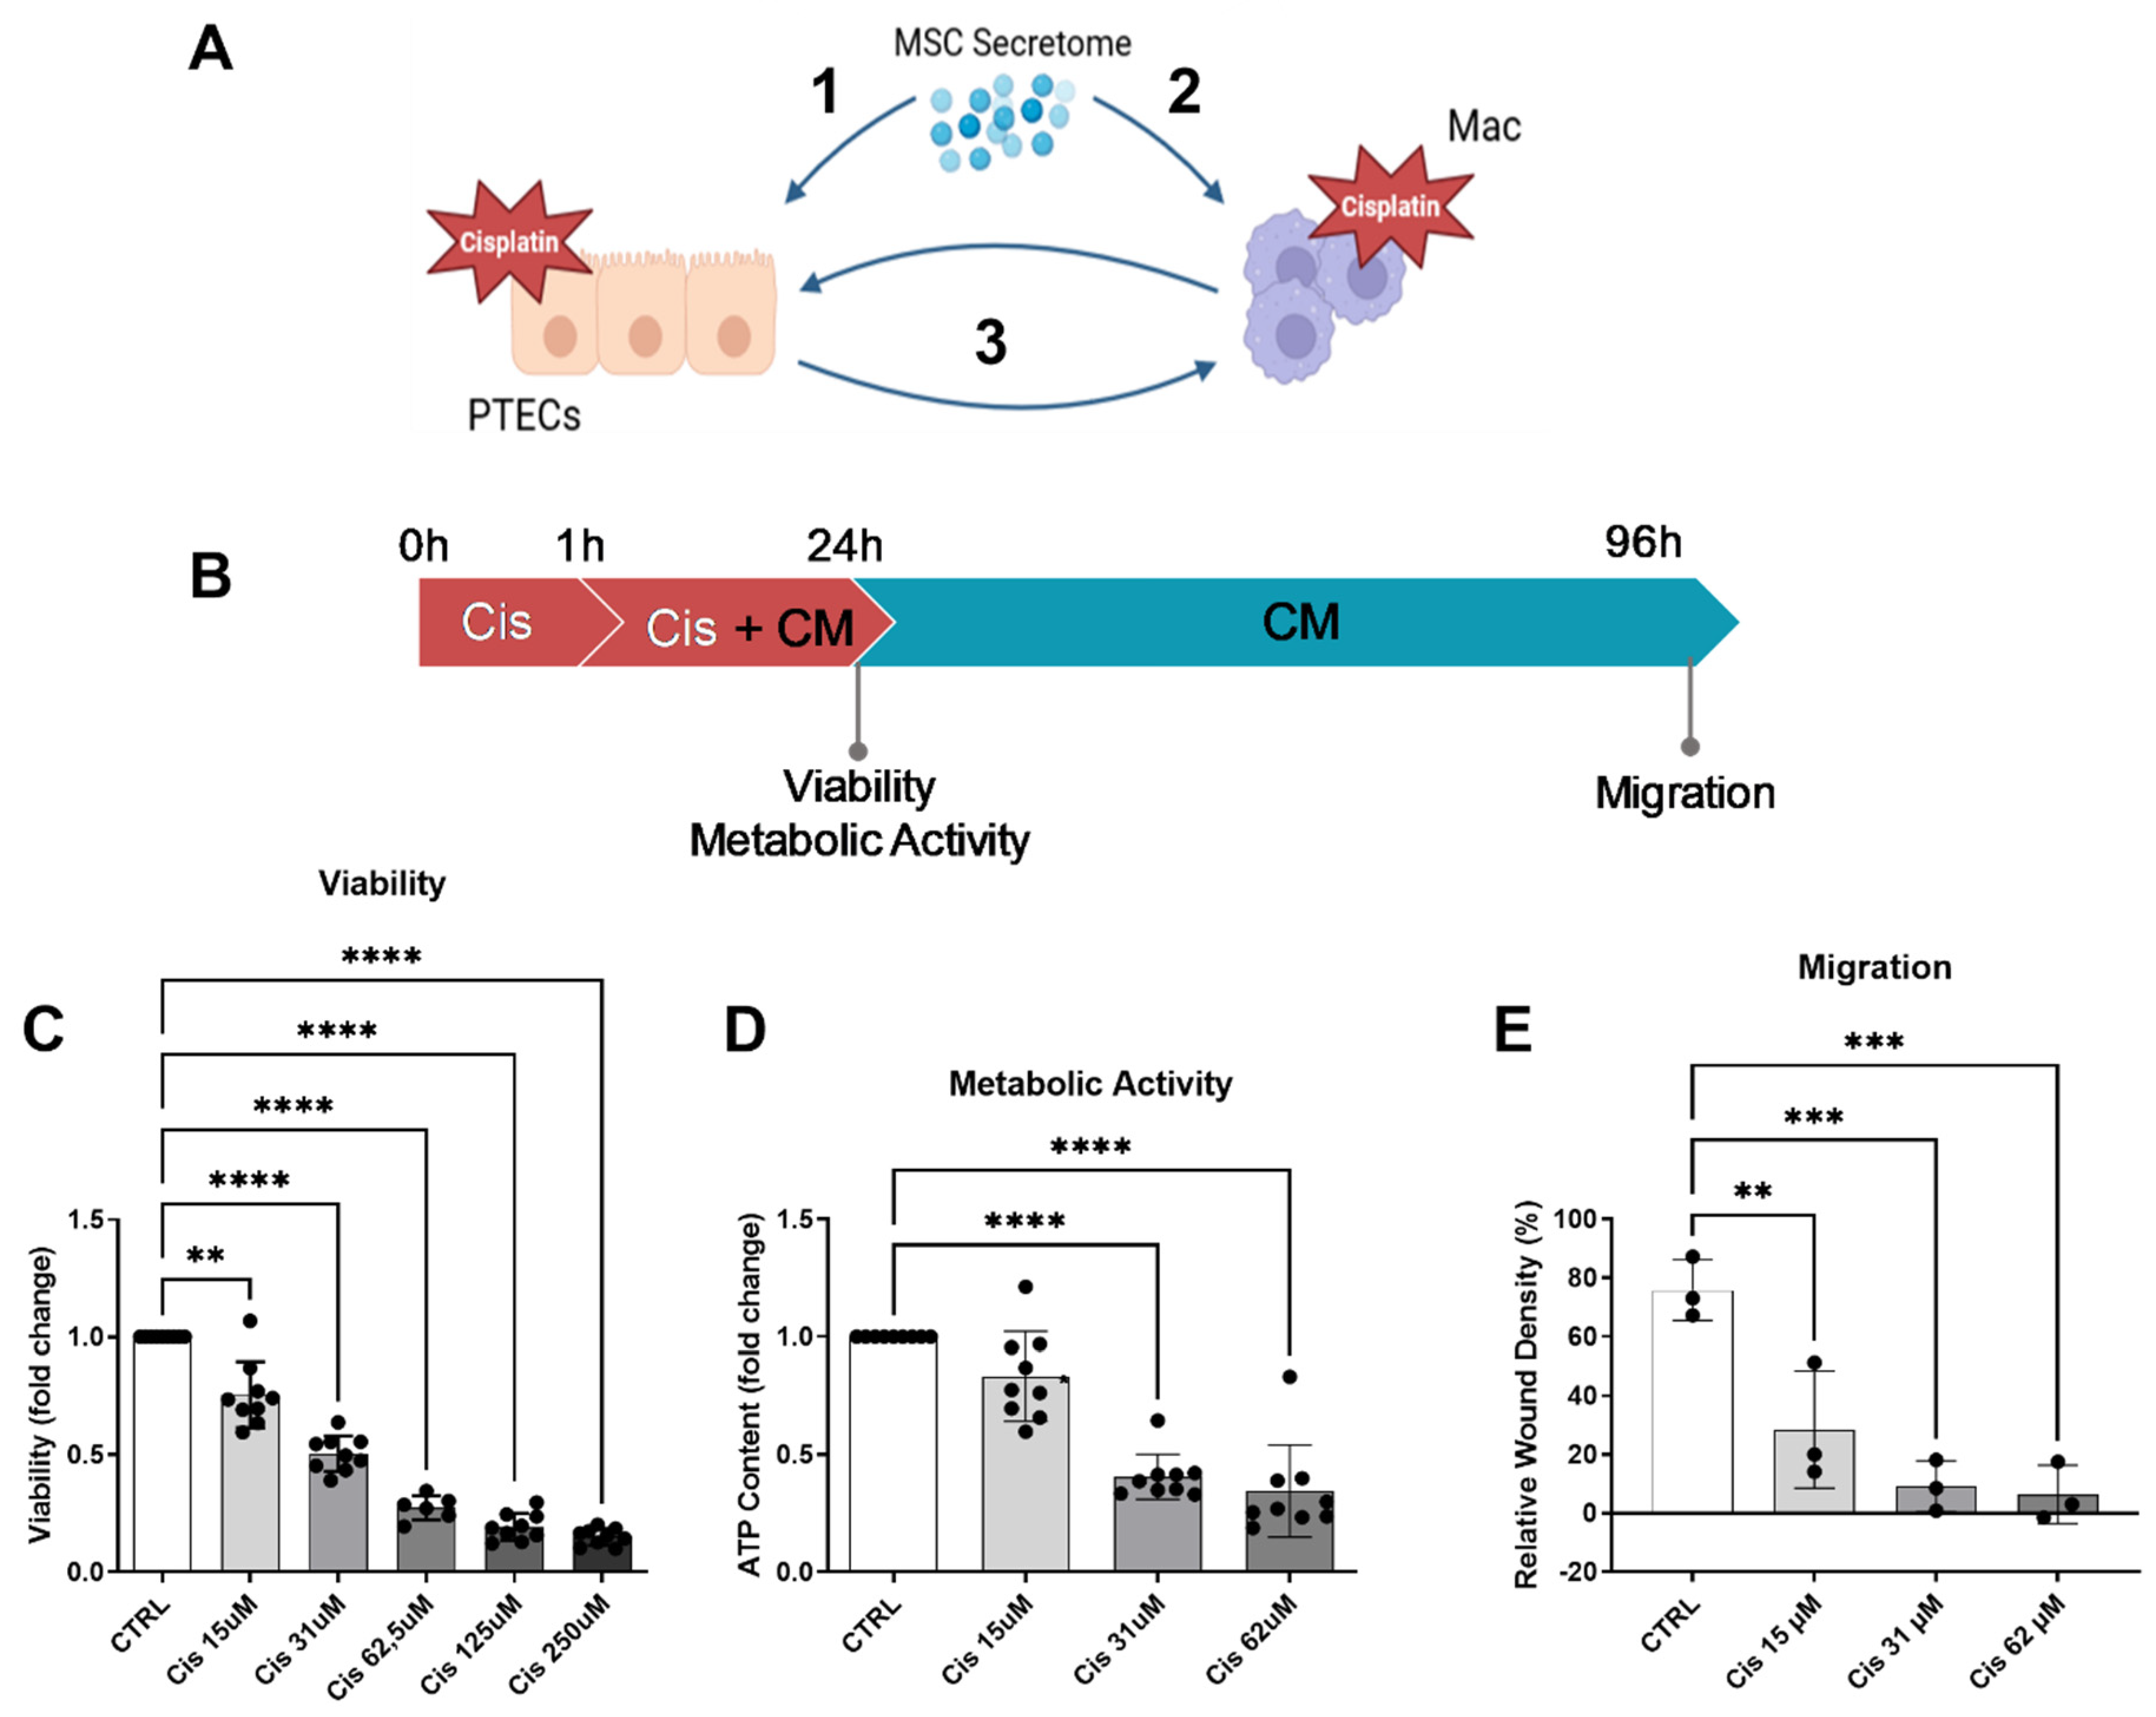
Figure 2.
CM attenuated cisplatin-induced cytotoxicity on ciPTECs. CiPTECs were treated with cisplatin for a total of 24 h in the absence and presence of CM (A) and the viability was measured using PrestoBlue (B). The following day, the cisplatin-containing medium was replaced with either CM or CTRL medium containing Apotracker to monitor the ciPTEC apoptosis for additional 72 h (C). Apoptosis was quantified 96 h post cisplatin treatment and normalized by the cell confluence (D). To measure the migratory capacity, the ciPTEC monolayer was scratched after 24 h of cisplatin treatment, the medium were replaced with fresh CM or CTRL medium, and the wound closing was monitored for 3 days (E) and quantified 96 h post cisplatin treatment (F). One-Way ANOVA with Tukey‘s multiple comparisons test, significance values: * p<0.5, **p<0.01, ***p<0.001, ****p<0.0001. UT-CTRL and Cis-CTRL n (ciPTEC) = 3, UT-CM and Cis-CM N (ASC) = 3 for viability and 4 for apoptosis assay. (Image in (A) created with Biorender). PTECs - proximal epithelial cells, UT-CTRL- untreated control, UT-CM - untreated conditioned medium, Cis-CTRL - Cisplatin-treated, Cis-CM - Cisplatin and conditioned medium-treated, GCU - green calibrated unit.
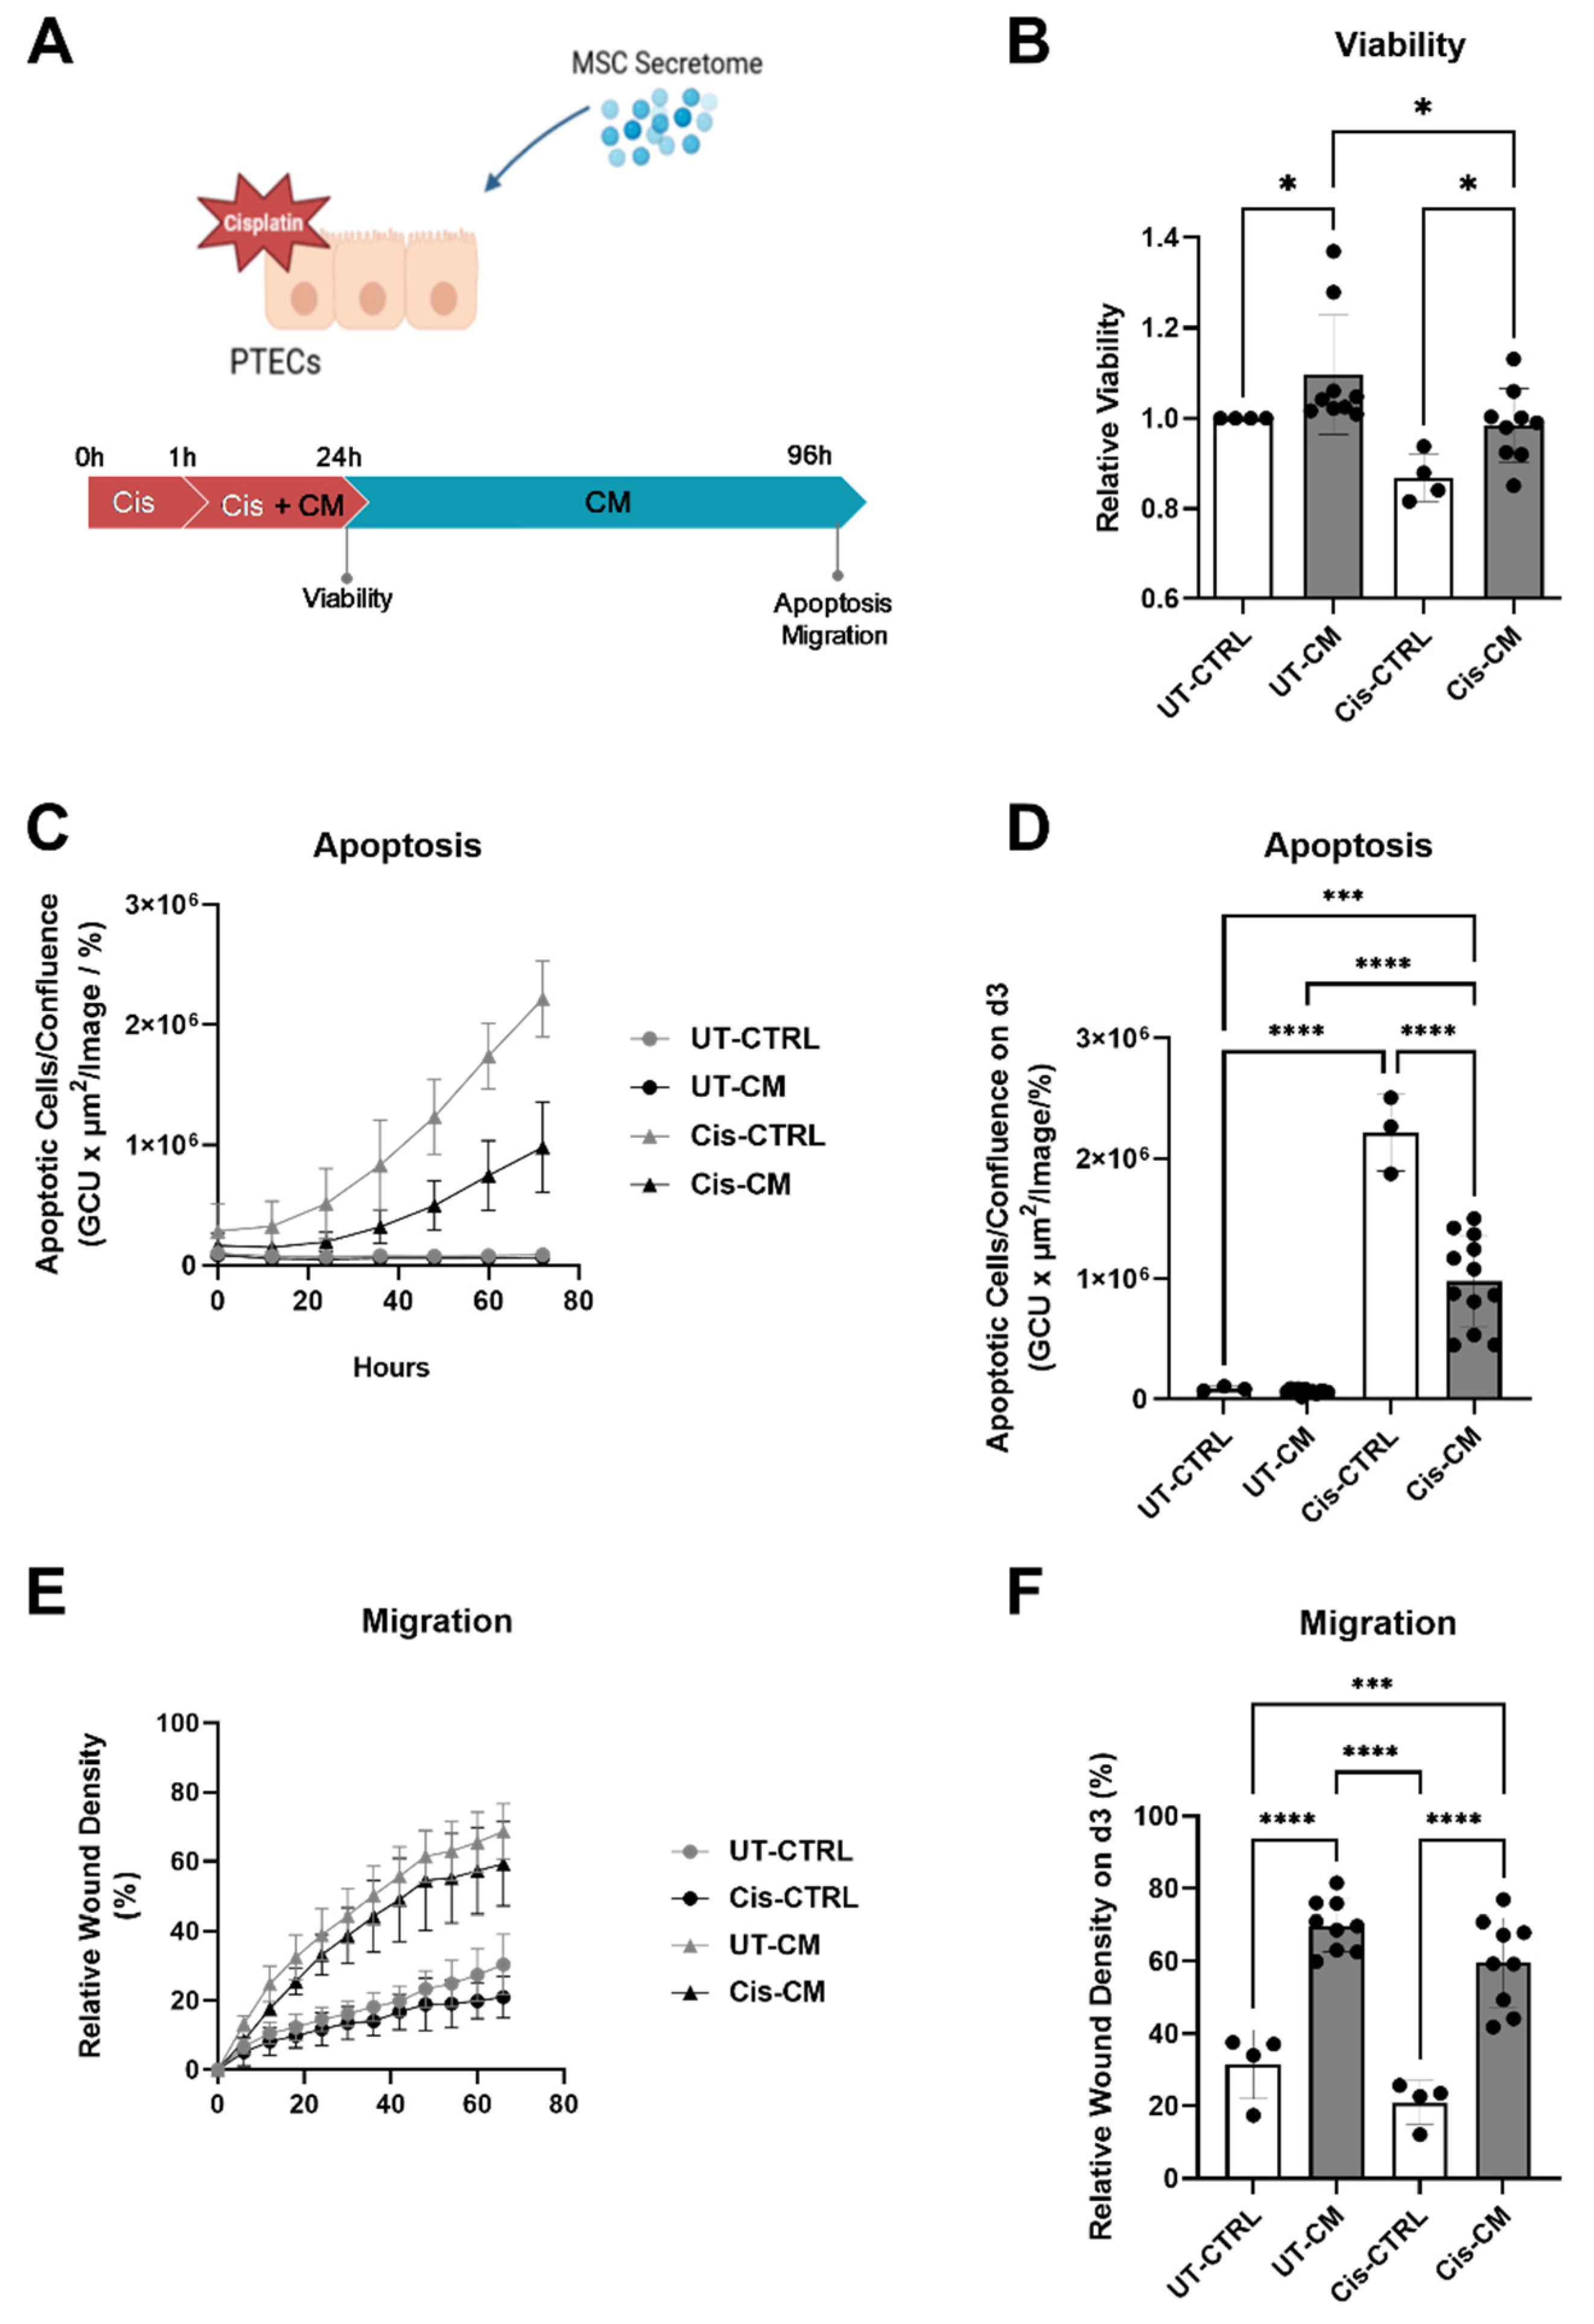
Figure 3.
CM attenuated cisplatin-induced expression of nephrotoxicity genes. CiPTECs were treated with cisplatin for a total of 24 h in the absence and presence of CM, then their mRNA was isolated and subjected to a nephrotoxicity PCR array (A). Independent validation of array results was performed by RT-qPCR for HMOX-1 (B), ATF3 (C), GADD45a (D), and CDKN1a (E). Two-way ANOVA with Tukey‘s multiple comparisons test, significance values: * p<0.5, **p<0.01, ***p<0.001, ****p<0.0001. For PCR array, UT-CTRL and Cis-CTRL n (ciPTEC) = 2, UT-CM and Cis-CM N (ASC) = 4. For RT-qPCR, UT-CTRL and Cis-CTRL n (ciPTEC) = 3, UT-CM and Cis-CM N (ASC) = 4. UT-CTRL - untreated control, UT-CM - untreated conditioned medium, Cis-CTRL - Cisplatin-treated, Cis-CM - Cisplatin and conditioned medium-treated, HMOX1 - heme oxygenase-1, ATF3 - Activating Transcription Factor 3, GADD45a - Growth Arrest and DNA Damage Inducible Alpha, CDKN1a – cyclin dependent kinase inhibitor 1A.
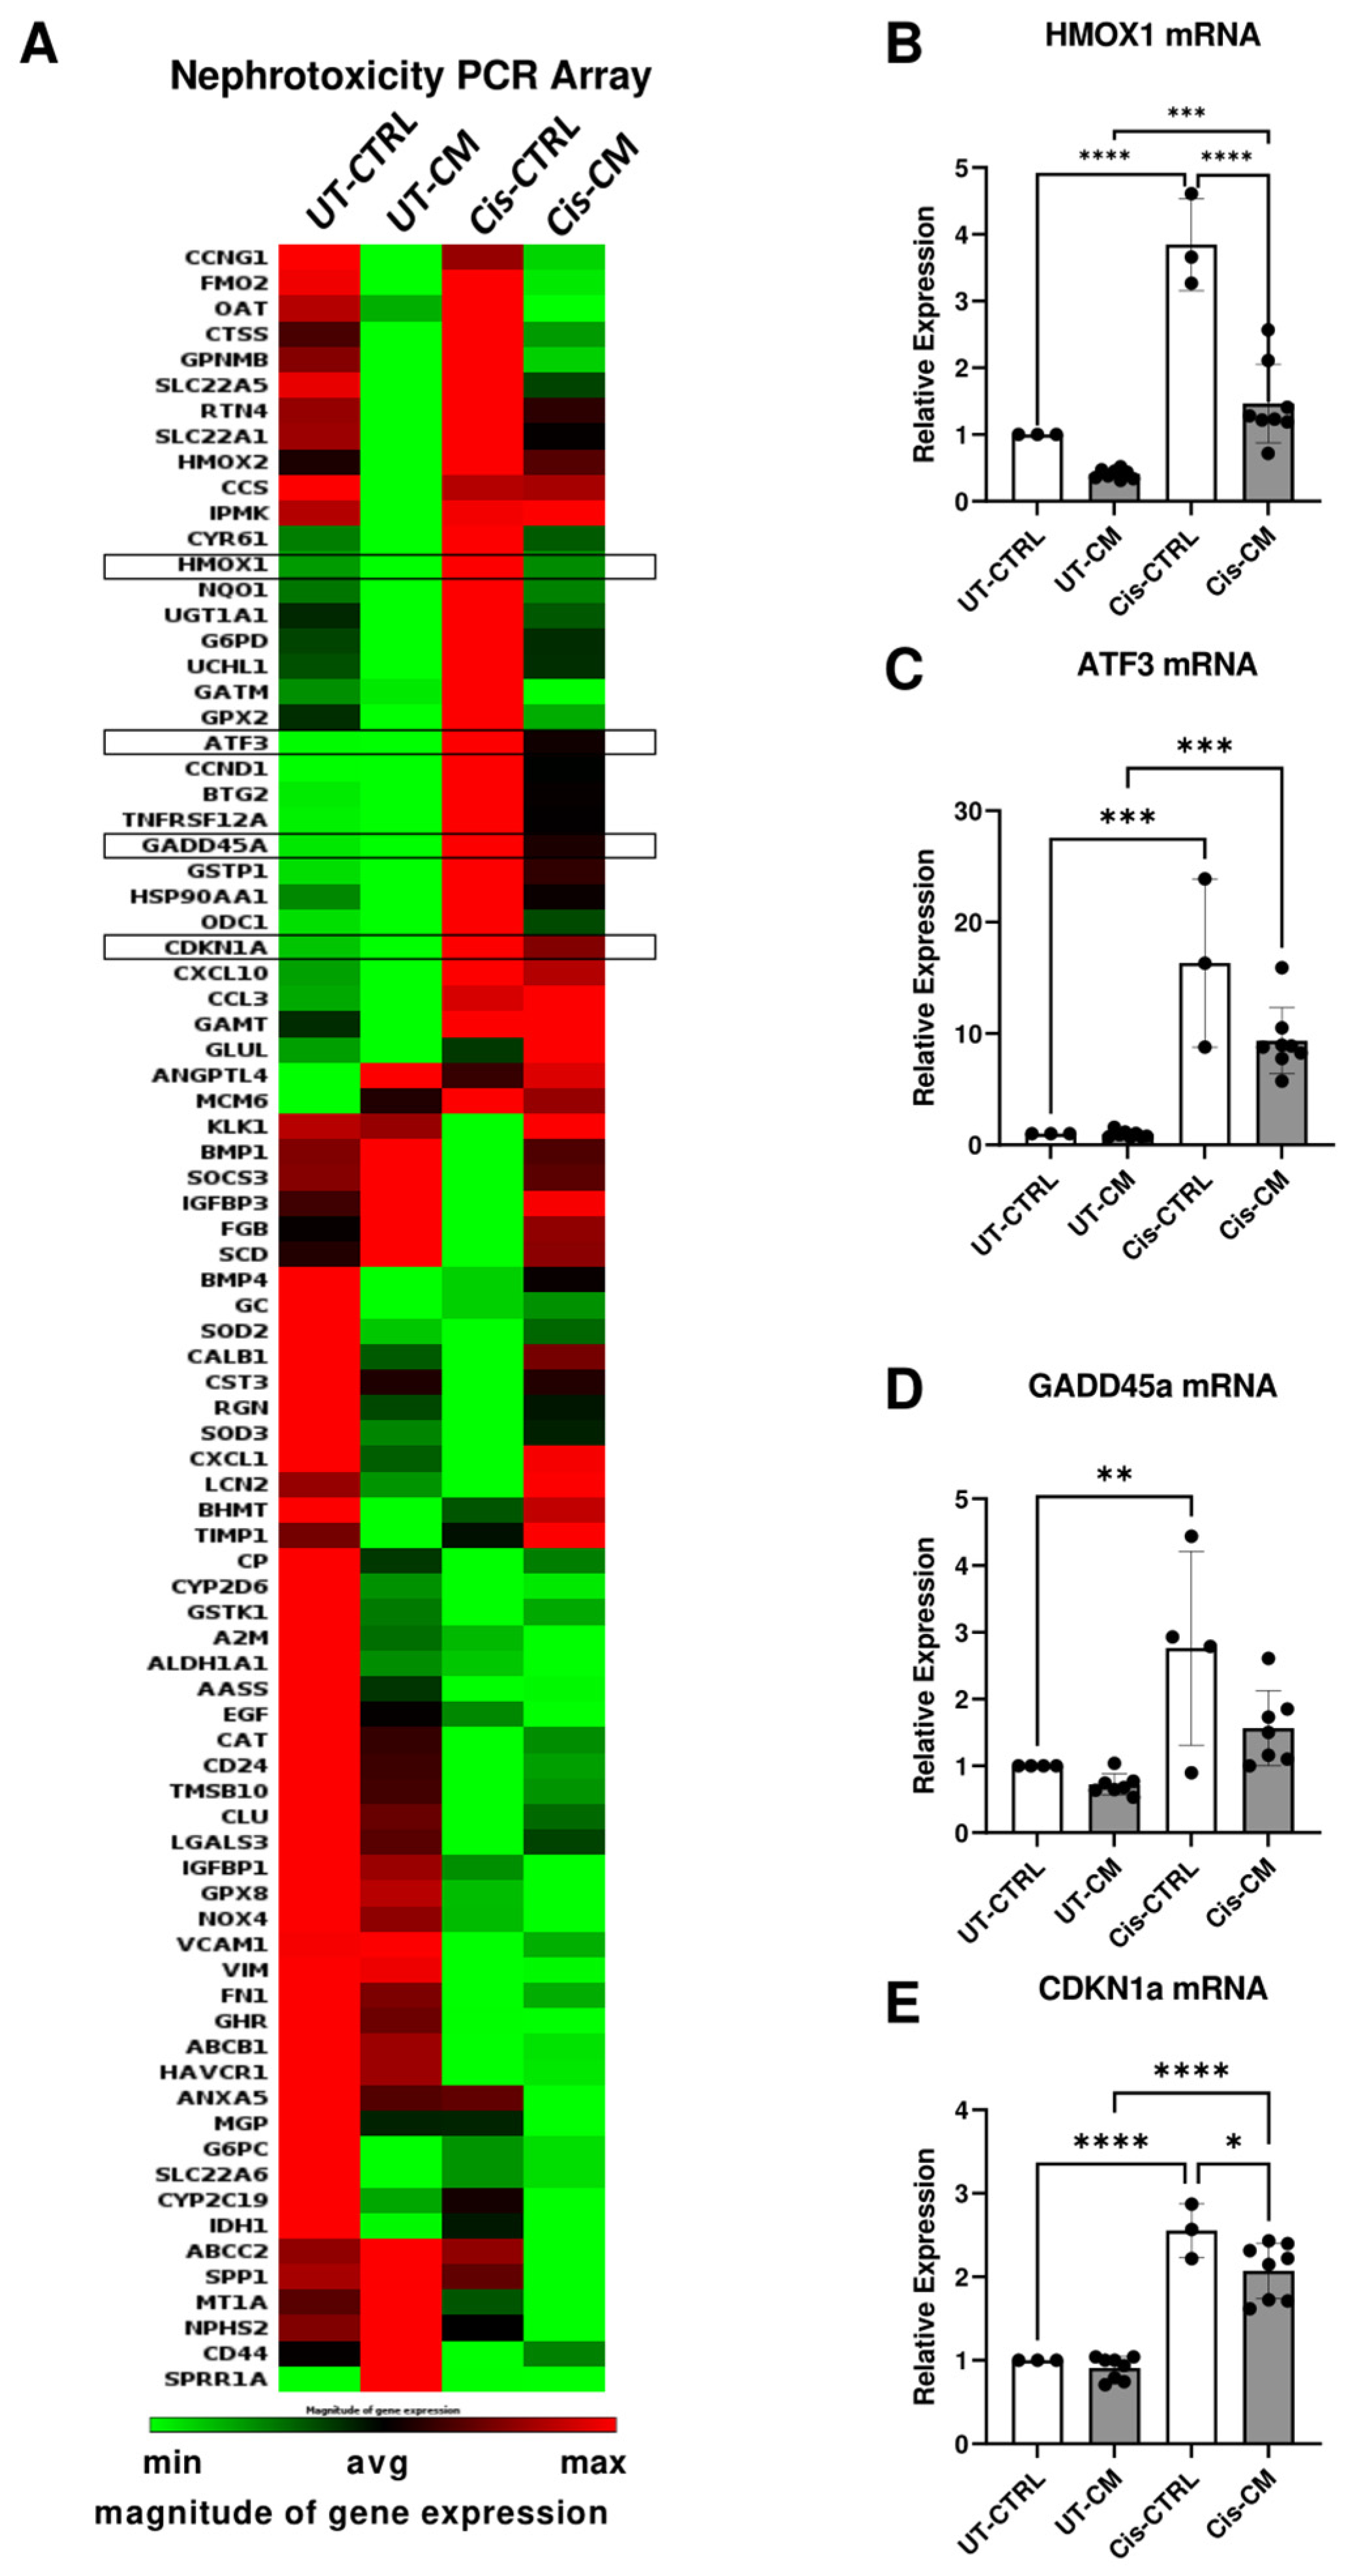
Figure 4.
The anti-apoptotic activity of CM was not affected by EV depletion, but appeared related to its free thiol concentration. The concentration of EVs in CTRL medium and CM with and without EV depletion by 100 kDa ultra-filtration (A). The apoptosis level of ciPTEC 3 d after cisplatin removal as presented as relative value of the corresponding Cis-CTRL. (Of note, to compensate for eventual depletion of soluble factors by ultrafiltration the apoptotic level of Cis-CM and Cis-CM-FT were normalized to their respective CTRL) (B). Concentration of free thiol in the CTRL medium and CM (C). The intracellular ROS level of ciPTECs treated with cisplatin and CM, hydrogen peroxide (H2O2) served as positive control (D). Two-way ANOVA with Tukey‘s multiple comparisons test, significance values: * p<0.5, **p<0.01, ***p<0.001, ****p<0.0001. For NTA and free thiol measurement: CTRL n (ciPTEC) = 3, CM N (ASC) = 4. For Apoptosis Assay: Cis-CTRL and Cis-CTRL-FT n (ciPTEC) = 4; Cis-CM and Cis-CM-FT N (ASC) = 4. For ROS Assay: CT-CTRL, Cis-CTRL, and H2O2 n (ciPTEC) = 3; UT-CM and Cis-CM N (ASC) = 4. CTRL - control, CM - conditioned medium, CTRL-FT – control medium flow-through, CM-FT – conditioned medium flow-through, UT-CTRL - untreated control, UT-CM - untreated conditioned medium, Cis-CTRL - Cisplatin-treated, Cis-CM - Cisplatin and conditioned medium-treated, ROS – reactive oxygen species.
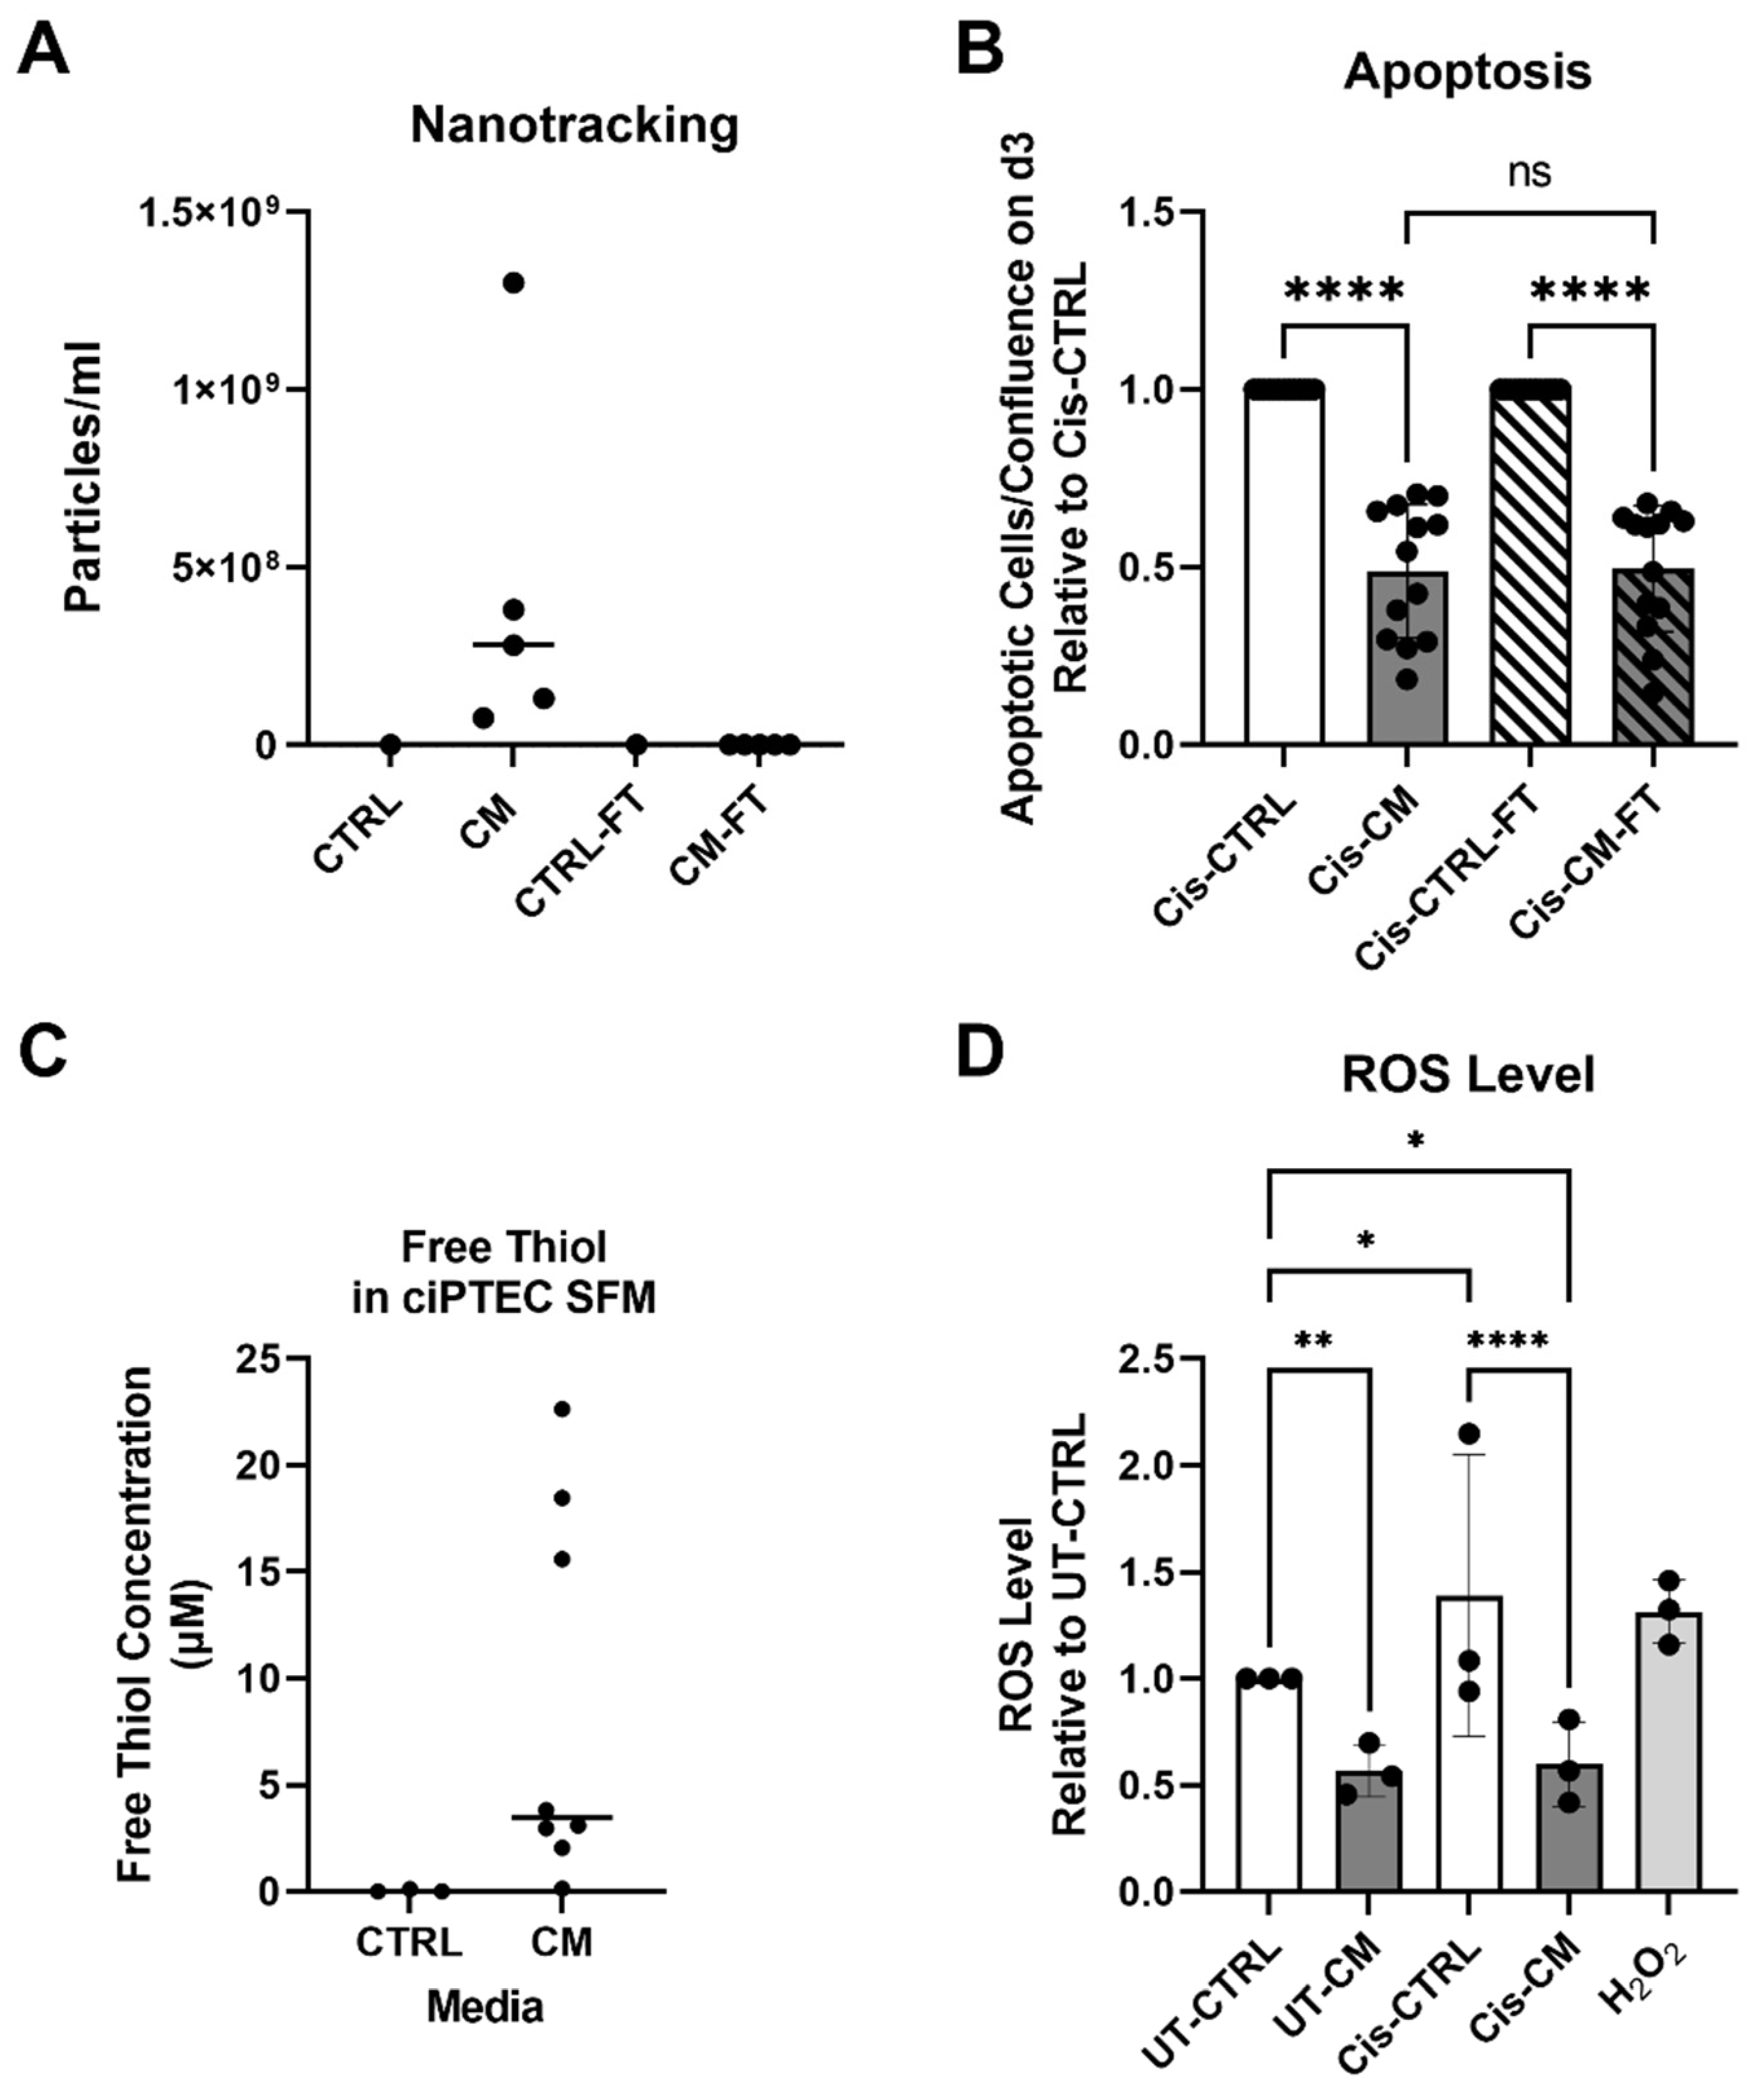
Figure 5.
CM skewed macrophages phenotypes towards M2, while cisplatin per se did not affect macrophage phenotype and function. Characteristics of M1 and M2 macrophages relevant for this study (A) (Image created with BioRender). Macrophages were treated with cisplatin in the presence and absence of CM for a total of 24 h, harvested, and their surface markers were measured using FACS. The mean fluorescence intensity (MFI) for HLA-DR (B), CD38 (C), CD86 (D), CD206 (E), and CD163 (F) is shown. Meanwhile, the phagocytosis capacity of macrophages after the treatment was assessed using E. coli bioparticles and monitored for 6 h by live-cell imaging. The phagocytosis after 6 h is presented as relative value to that of UT-CTRL macrophages (G). Two-way ANOVA with Tukey‘s multiple comparisons test, significance values: * p<0.5, **p<0.01, ***p<0.001, ****p<0.0001. For surface marker measurements: UT-CTRL and Cis-CTRL N (macrophage) = 5; UT-CM and Cis-CM N (ASC) = 4. For Phagocytosis assay: UT-CTRL and Cis-CTRL N (macrophage) = 10; UT-CM and Cis-CM N (ASC) = 4. UT-CTRL - untreated control, UT-CM - untreated conditioned medium, Cis-CTRL - Cisplatin-treated, Cis-CM - Cisplatin and conditioned medium-treated, MFI – mean fluorescence intensity, GCU – green calibrated units.
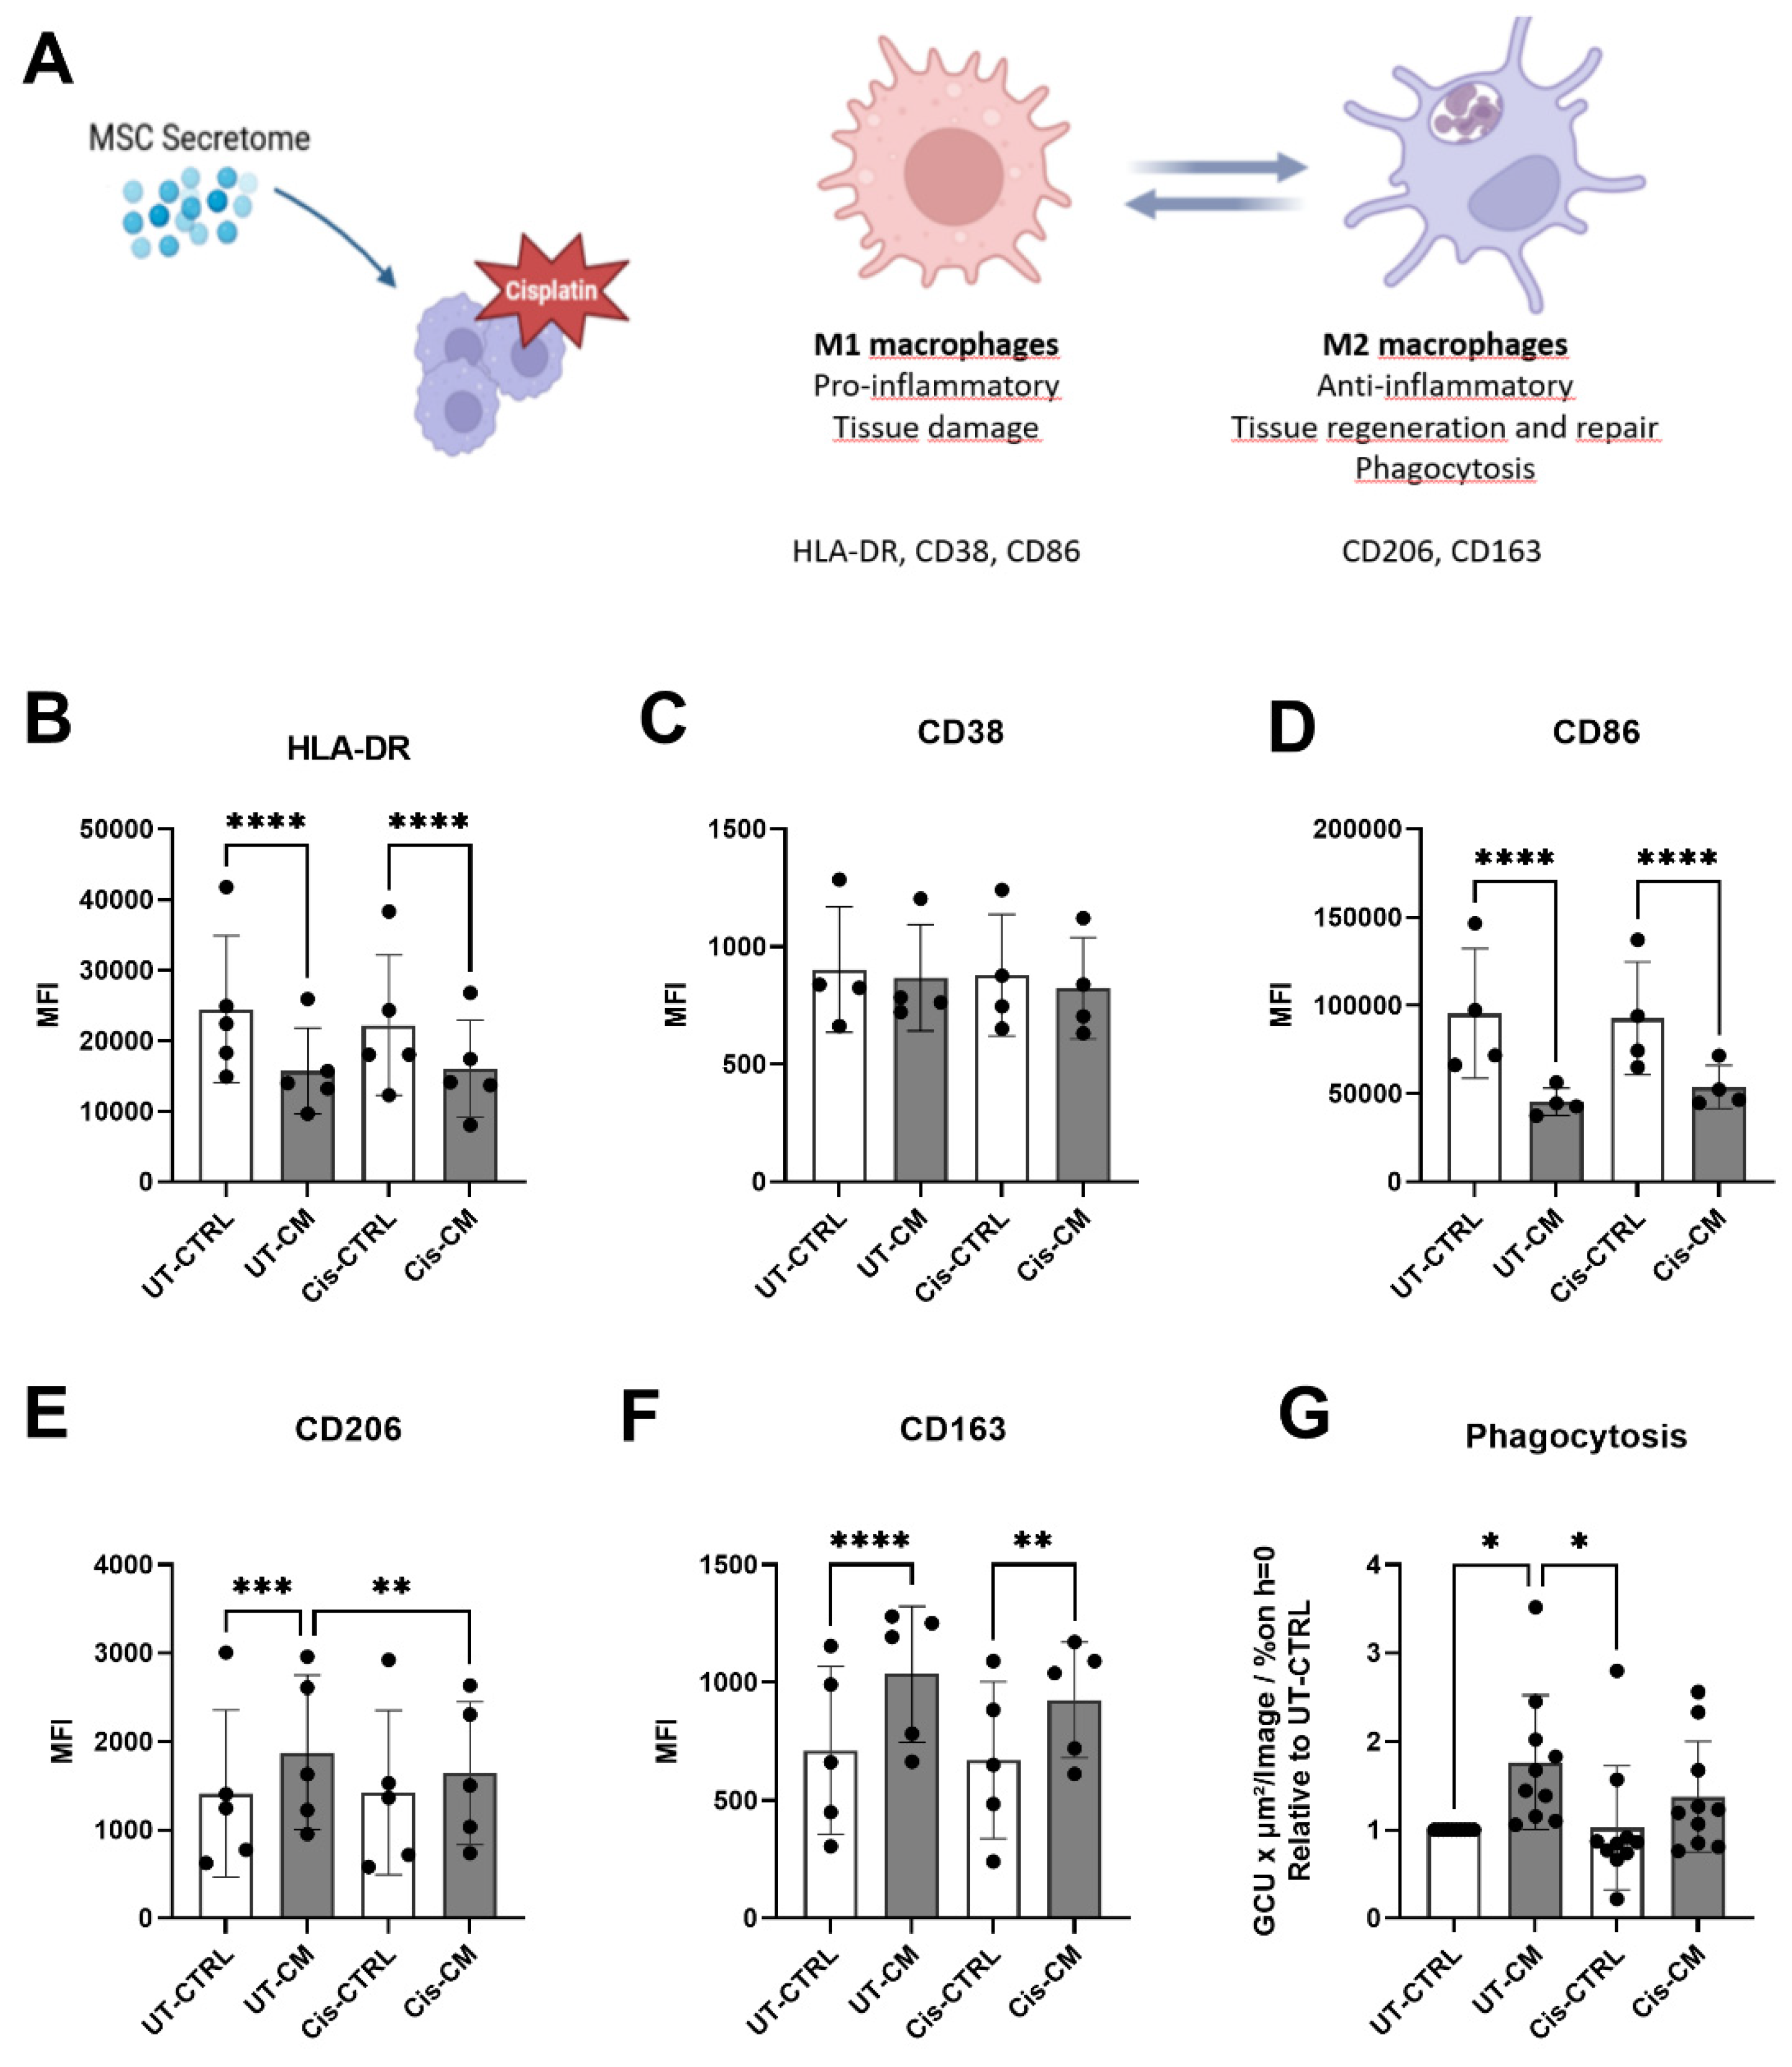
Figure 6.
Co-culture with macrophages did not boost the protective effect of CM on ciPTECs. Experimental setup of co-culture system: ciPTEC were seed on the transwell and macrophages at the basolateral side (A) (image created with BioRender). Representative images of ciPTECs on the transwell membrane after being cultured alone or co-cultured with macrophages in the presence or absence of cisplatin with or without CM. Following cisplatin treatment for 24 h, the cells were stained for CX-43 (purple), Apotracker (green) and DAPI (blue) and imaged using confocal microscopy (B). Scale bars represent 40 µm. The quantification of the fluorescence intensity of CX-43 (C), the number of Apotracker spots (D), and fragmented nuclei (E), normalized by the number of intact nuclei, are presented as relative value to UT-CTRL ciPTEC monoculture. The level of TNF-α on the supernatant of the apical side of the co-culture after 24 h of cisplatin treatment in the presence or absence of CM, measured by ELISA and presented as relative value to the UT-CTRL of ciPTEC monoculture (F). Three-way ANOVA with Tukey‘s multiple comparisons test, no significant differences. For surface CX-43, fragmented nuclei and nuclei fragments staining: all groups N (macrophages) = 4. For apoptosis staining and TNF-α ELISA: all groups N (macrophages) = 3 in 3 independent experiments; pooled CM from N = 3 ASC batches each. UT-CTRL - untreated control, UT-CM - untreated conditioned medium, Cis-CTRL - Cisplatin-treated, Cis-CM - Cisplatin and conditioned medium-treated, TNFα – tumor necrosis factor alpha, MFI – mean fluorescence intensity, ciPTEC, conditionally immortalized proximal tubular epithelial cells, Mac – macrophages, CX-43 – connexin 43.
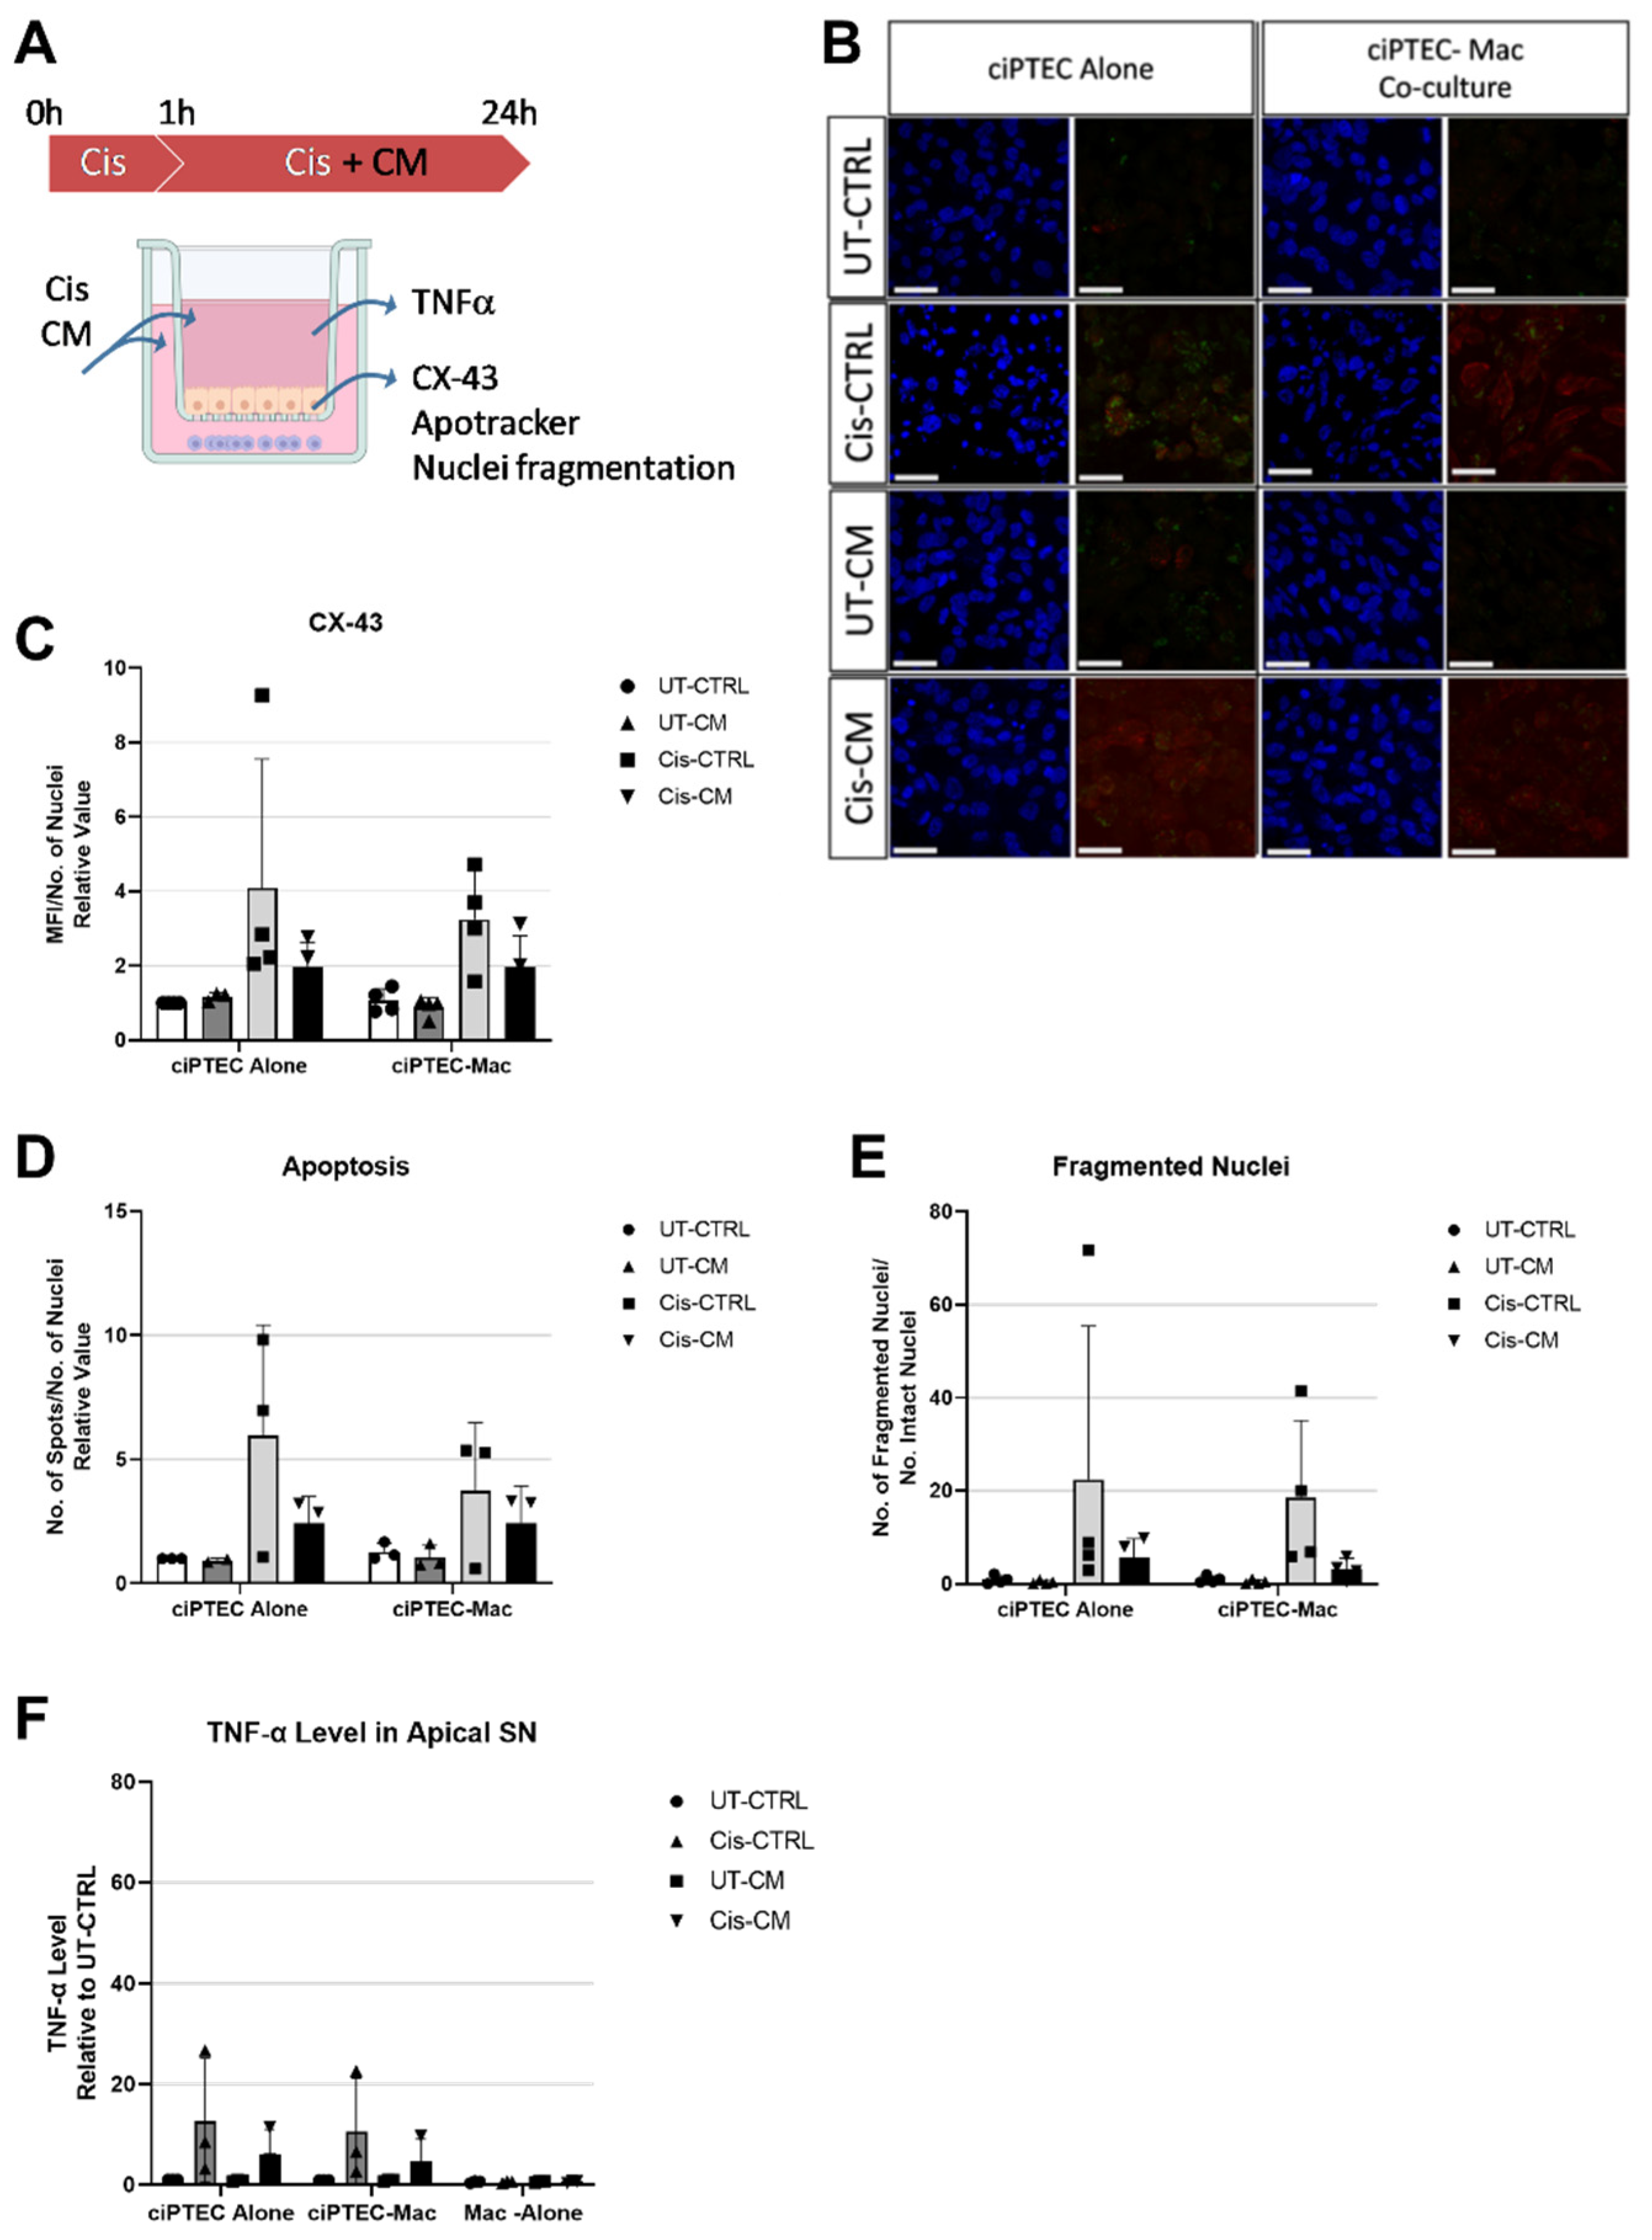
Figure 7.
While the co-culture tended to increase macrophage phagocytosis, CM surpassed these effects. Experimental setup (A) (image created with BioRender). Phagocytosis tested 24 h post cisplatin treatment as presented as relative value to UT-CTRL of macrophage cultured alone (B). Heat map showing the fold change of analytes measured using a 22-plex panel assay assessing cytokines and DAMPs in the supernatant of basolateral side relative to the value of UT-CTRL macrophages cultured alone (C). Three-way ANOVA with Tukey‘s multiple comparisons test, non-significant. For phagocytosis and 22-plex panel assay: all groups N (macrophage) = 3 in two independent experiments; pooled CM from N = 3 ASC. UT-CTRL - untreated control, UT-CM - untreated conditioned medium, Cis-CTRL - Cisplatin-treated, Cis-CM - Cisplatin and conditioned medium-treated, DAMPs – danger associated molecular patterns, GCU – green calibrated units, w/o - without.
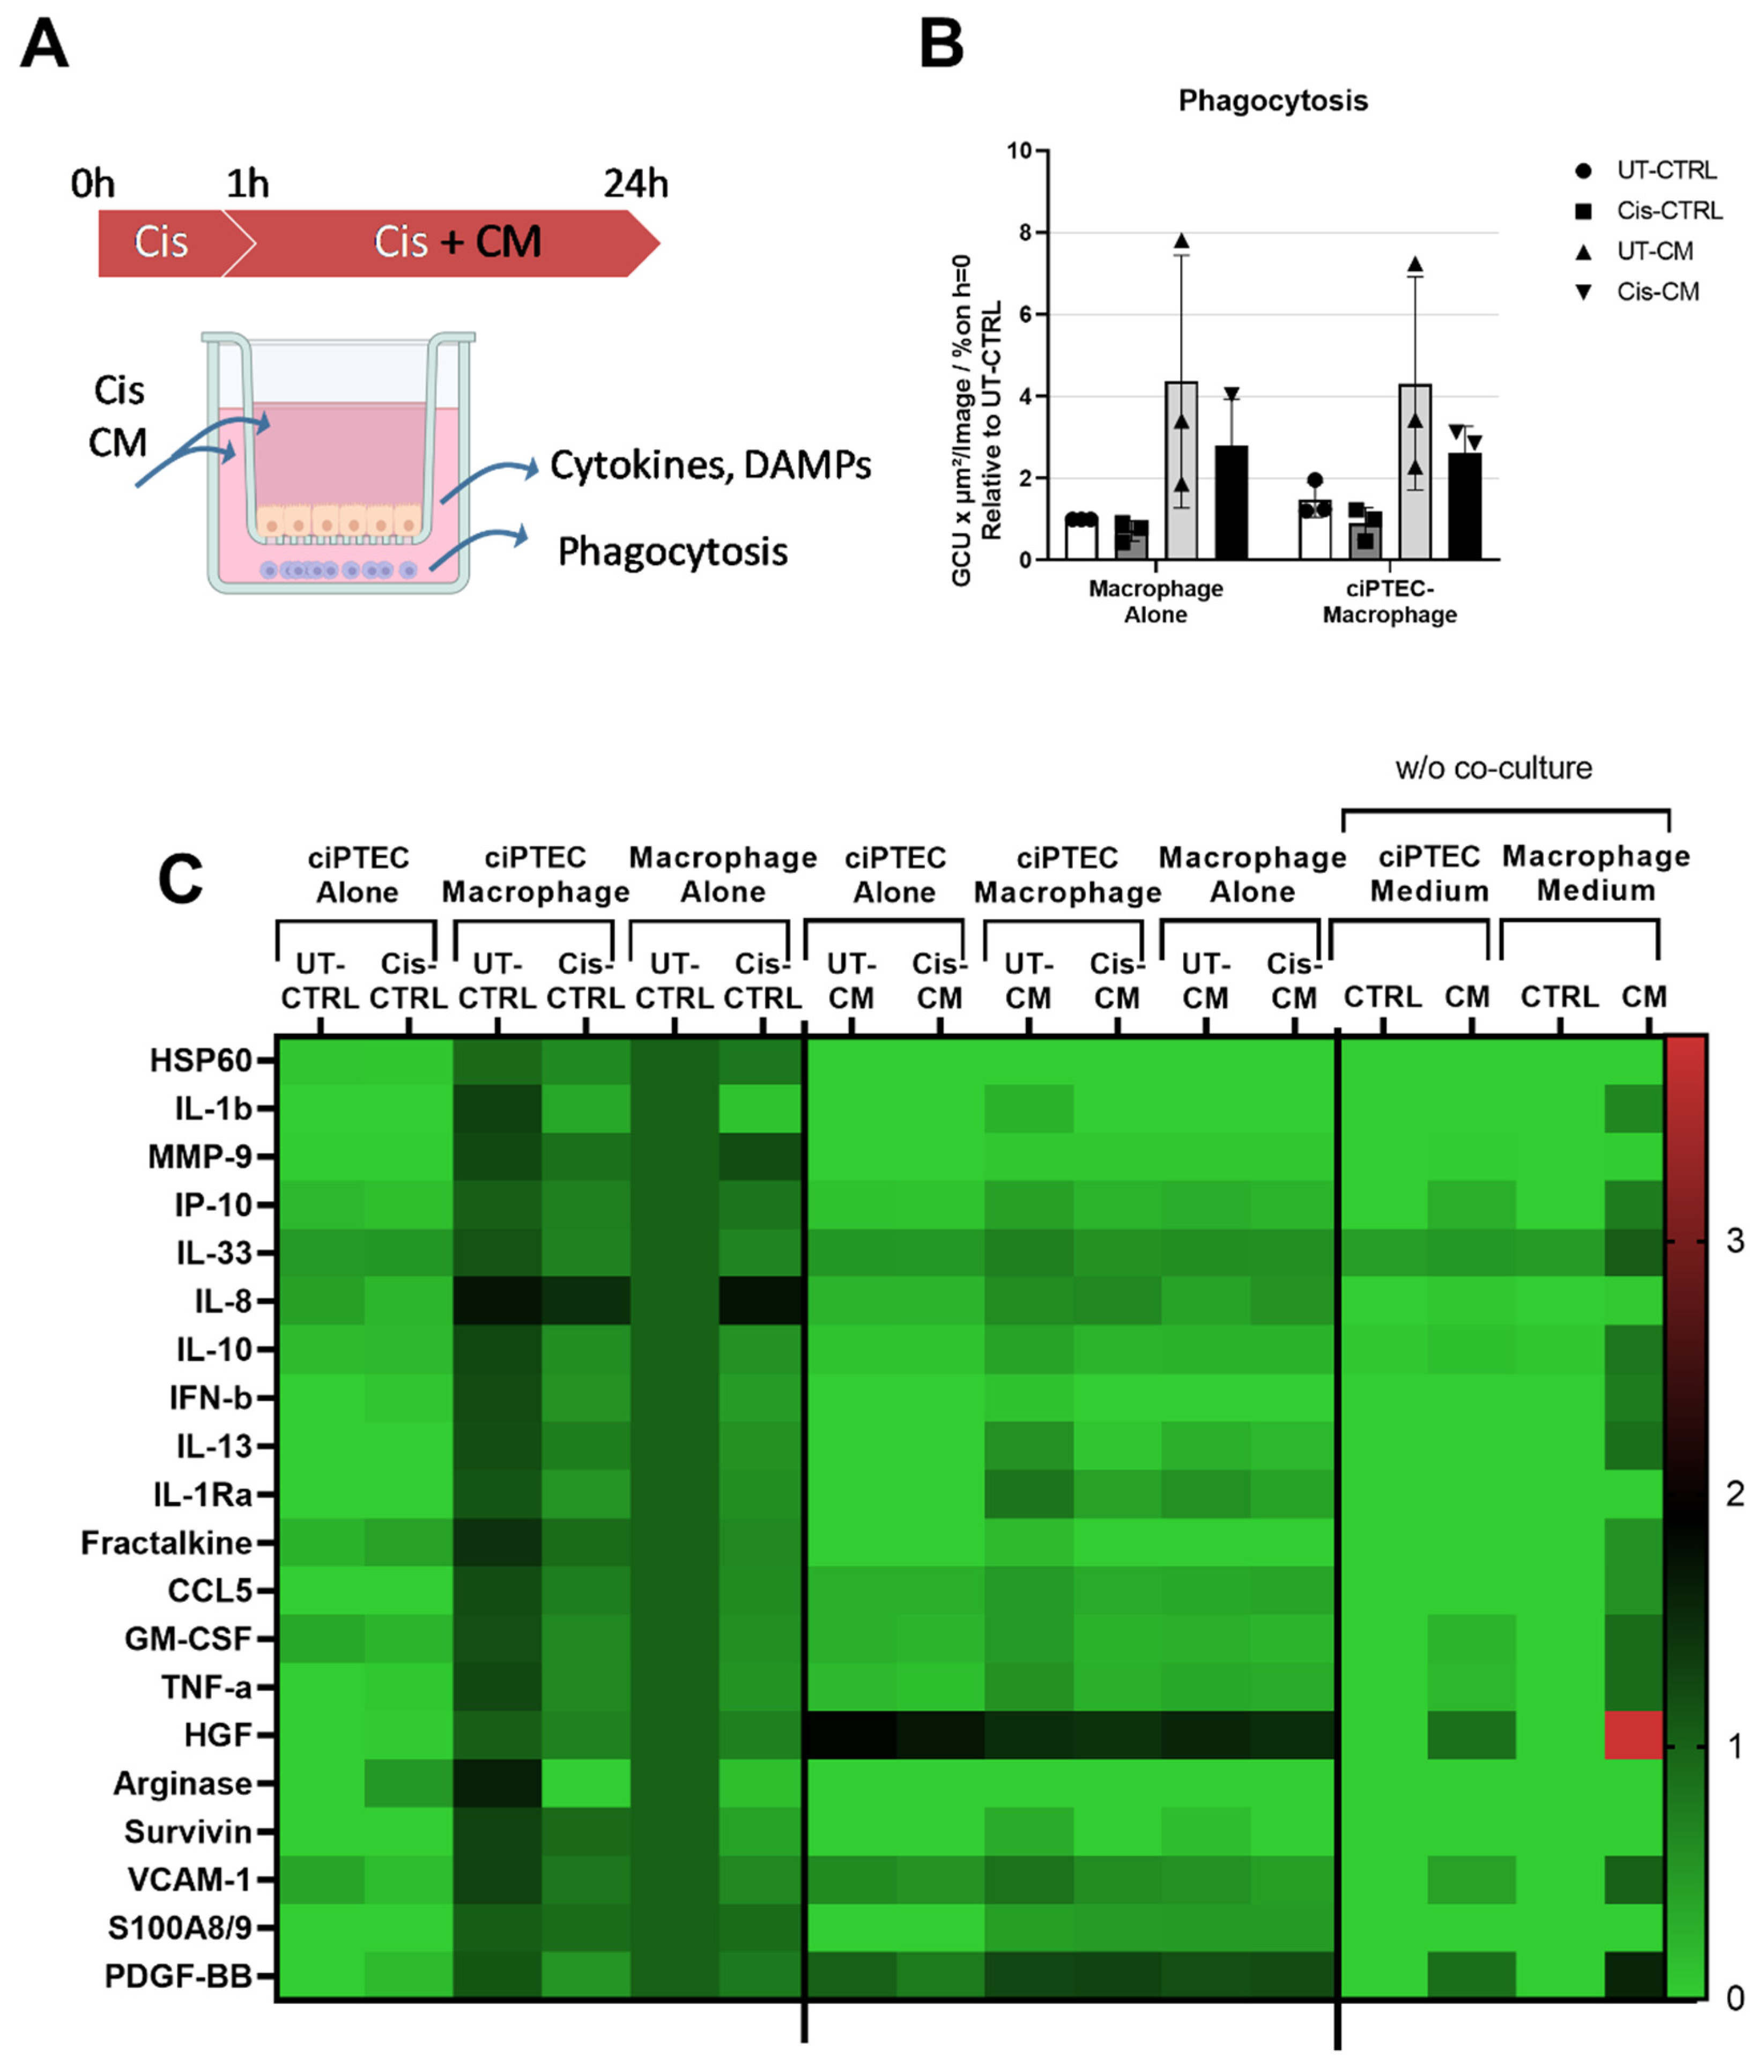
Figure 8.
Cisplatin and CM modified the interaction between ciPTECs and macrophages. In healthy co-culture, ciPTECs stimulated macrophages to secrete various cytokines and chemokines and enhanced their phagocytosis (A). ciPTECs stimulation on macrophages was later attenuated by the addition of cisplatin which suppressed macrophage secretion and phagocytosis, and induced ciPTEC death and TNF-α release. In this setting, macrophages slightly supressed cisplatin-induced ciPTEC death and TNF-α production (B). CM was able to further decrease ciPTEC death and TNF-α release which overruled the regulatory effect of macrophages. In contrast to both cisplatin and ciPTECs, CM augmented macrophage phagocytosis to a greater extent, while also concomitantly tuned down cytokines and chemokines secretion (C). This image was created using BioRender.
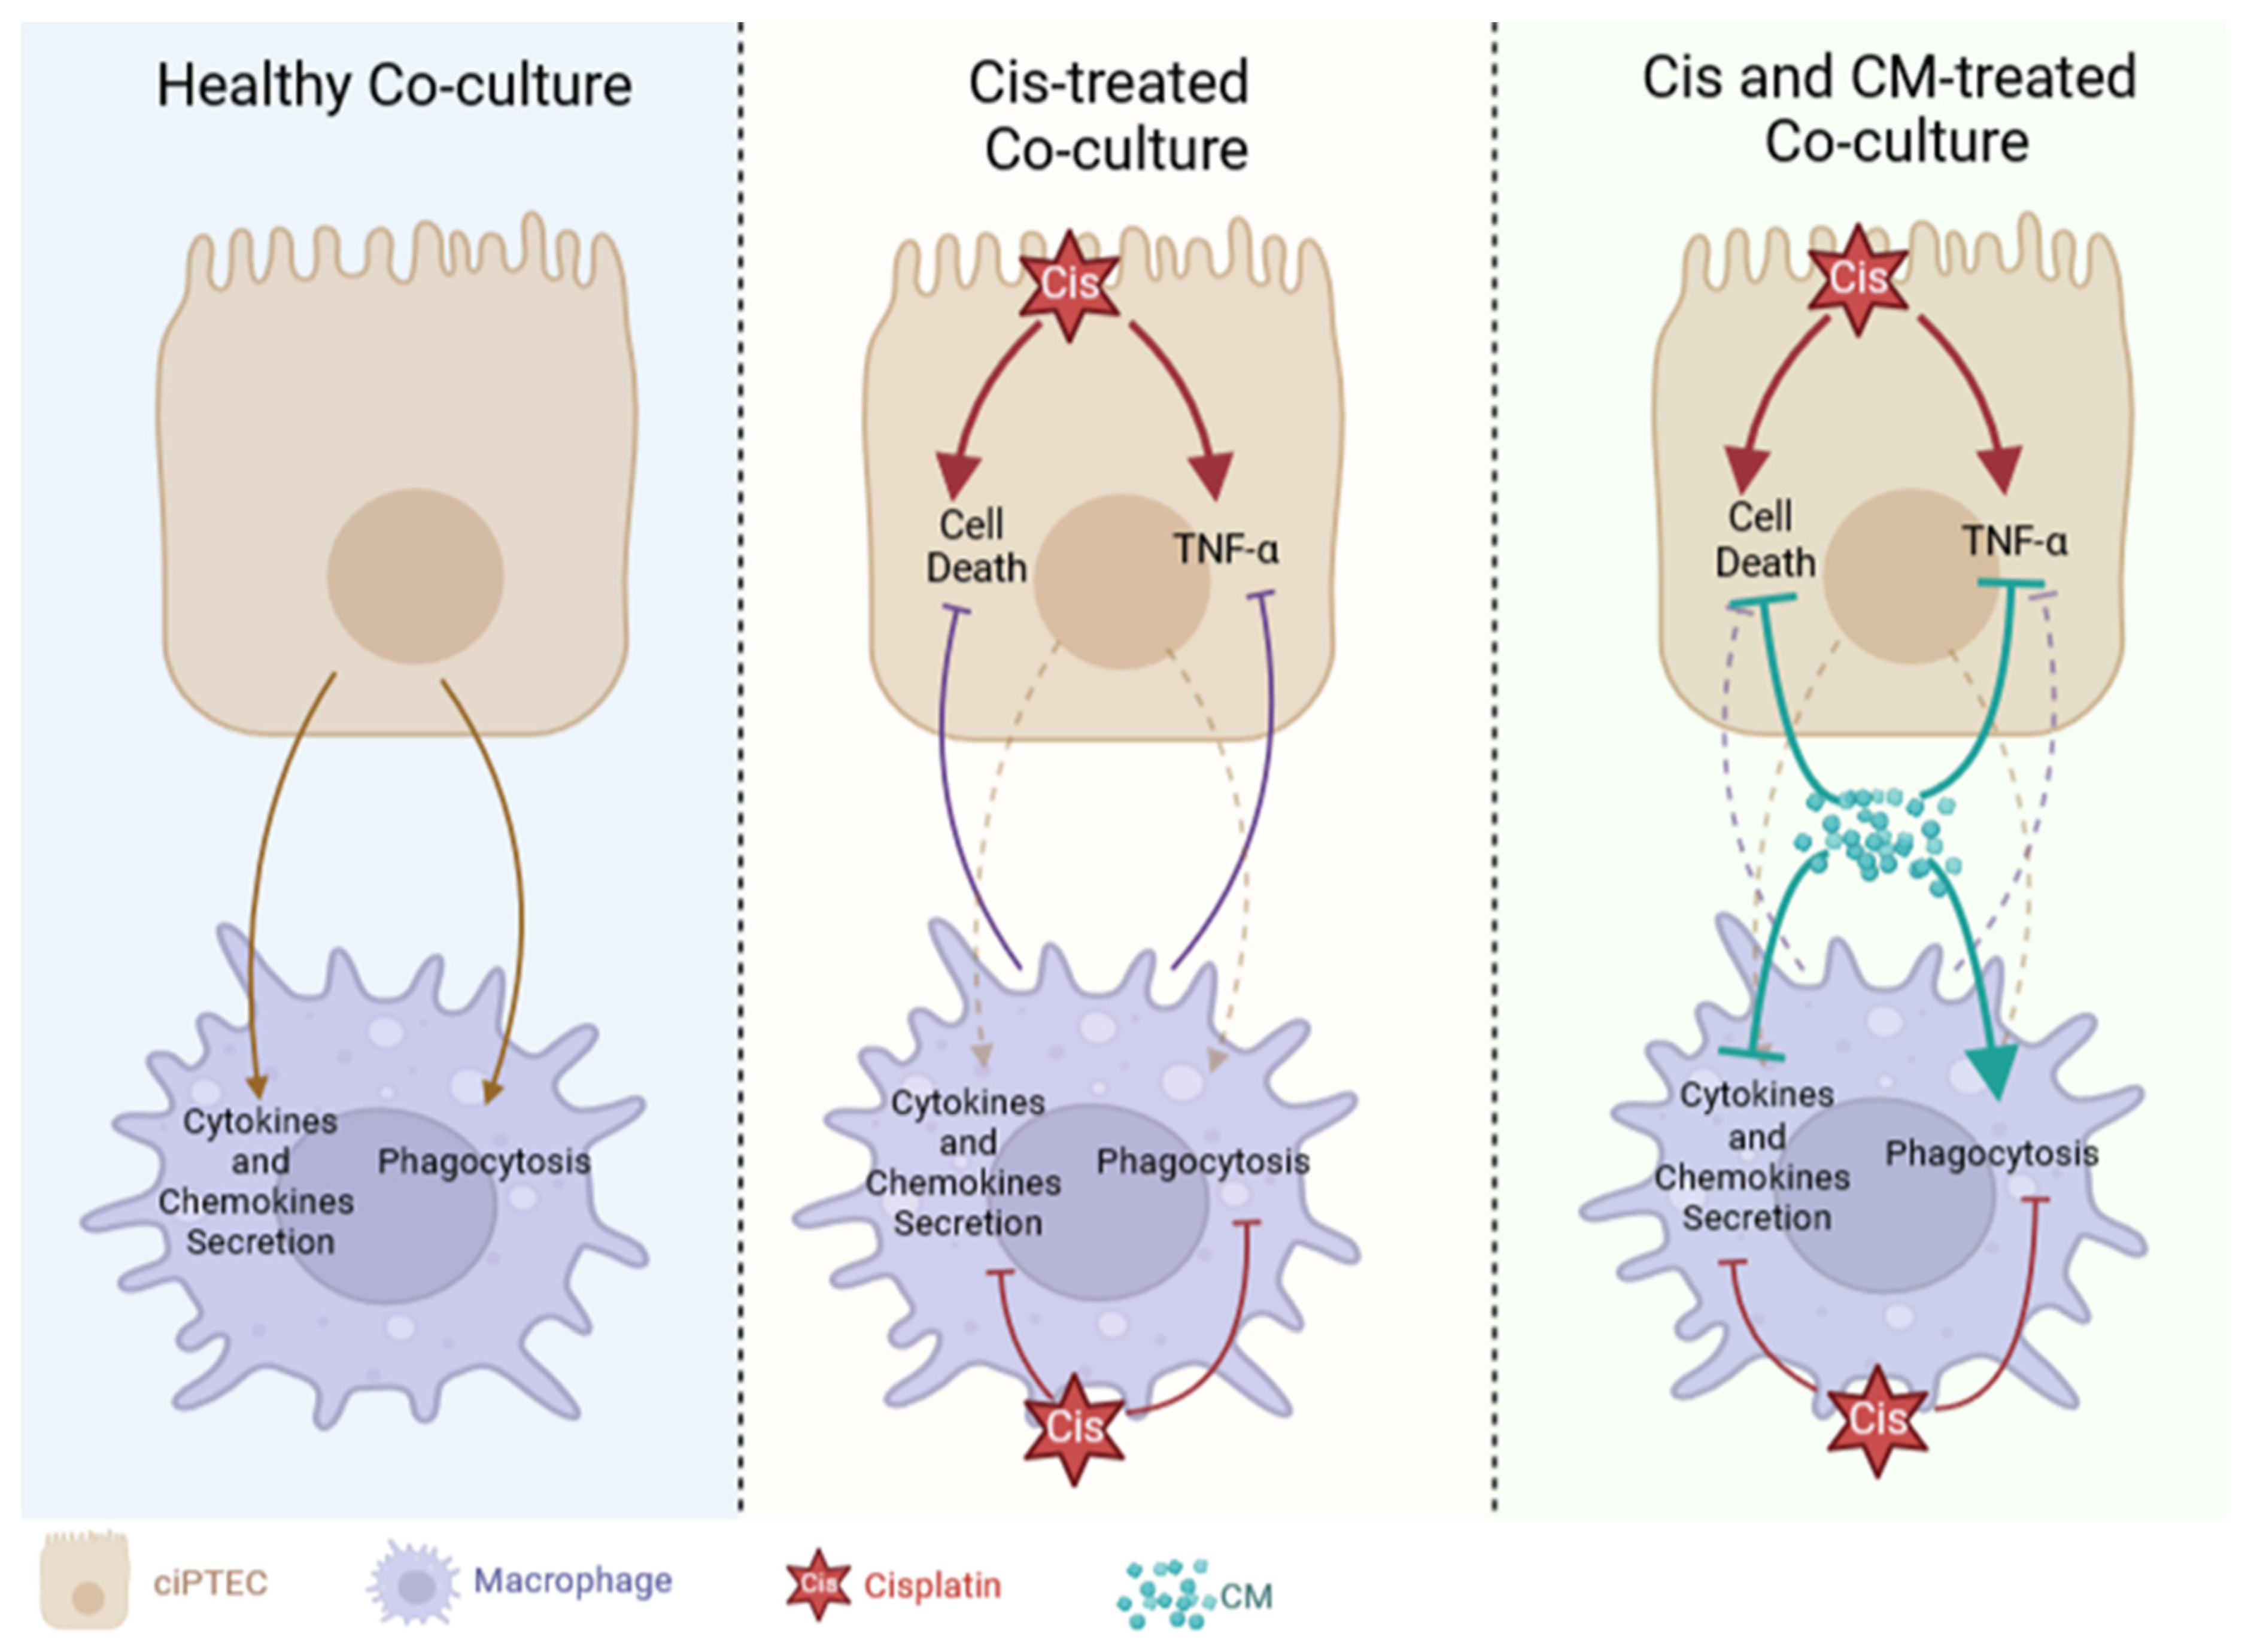
Disclaimer/Publisher’s Note: The statements, opinions and data contained in all publications are solely those of the individual author(s) and contributor(s) and not of MDPI and/or the editor(s). MDPI and/or the editor(s) disclaim responsibility for any injury to people or property resulting from any ideas, methods, instructions or products referred to in the content. |
© 2023 by the authors. Licensee MDPI, Basel, Switzerland. This article is an open access article distributed under the terms and conditions of the Creative Commons Attribution (CC BY) license (http://creativecommons.org/licenses/by/4.0/).
Copyright: This open access article is published under a Creative Commons CC BY 4.0 license, which permit the free download, distribution, and reuse, provided that the author and preprint are cited in any reuse.


