Submitted:
06 December 2023
Posted:
07 December 2023
You are already at the latest version
Abstract
With the development of modern industry, the issue of water pollution has garnered increasing attention. Photocatalysis, as a novel green environmental technology that is resource-efficient, environmentally friendly, and highly promising, has found extensive applications in the field of organic pollutant treatment. However, common semiconductor materials exhibit relatively low photocatalytic efficiency in the visible light range or inefficient separation of photogenerated charges, resulting in their limited ability to harness solar energy effectively. Consequently, the development of new photocatalysts has become a pivotal focus in current photocatalysis research to enhance solar energy utilization. This revision provides a brief explanation of the photocatalytic mechanism of the AgIO3/CTF heterojunction photocatalyst. Due to the Localized surface plasmon resonance (LSPR) effect, Ag nanoparticles demonstrate significant absorption in the visible light region, playing a crucial role in the highly efficient photocatalytic reduction of organic pollutants.
Keywords:
AgIO3/CTF
; heterojunction
; photocatalysis
; degradation
; organic pollutants
1. Introduction
In recent years, the proliferation of organic pollutants in aquatic environments has been on the rise, progressively accumulating along the food chain and culminating in adverse health effects upon ingestion [1]. The imperative challenge lies in the effective removal of these organic pollutants from water bodies. Nevertheless, conventional physical and chemical methodologies prove challenging in comprehensively eliminating or degrading organic pollutants in water. Photocatalysis technology, as an advanced oxidation technique, has evolved into an independent and challenging field through the development of heterogeneous semiconductor photocatalysts capable of degrading organic pollutants under solar irradiation [2]. Semiconductor materials, extensively explored in the realm of photocatalysis, exhibit notable advantages, including efficient photoelectric conversion and commendable stability [3]. Beyond meeting the demands for organic pollutant removal, the quest for efficient and energy-conserving pollution degradation methods, coupled with the construction of adsorption-photocatalysis composite material systems, holds promising applications.
Silver iodate (AgIO3), a recently acclaimed and efficient photocatalytic material, boasts p-type semiconductor characteristics with a relatively narrow bandgap, determining its robust absorption in the visible light spectrum [4]. However, AgIO3 suffers from severe photocorrosion, compromising the catalyst's stability and restraining its widespread adoption in photocatalysis technology. Research reveals that the formation of composite catalysts with other semiconductors effectively suppresses the photocorrosion of AgIO3, elevating the catalyst's stability and catalytic activity [5]. Additionally, surface plasmon resonance, as a promising photocatalytic technique, has garnered increasing attention in recent years. CTF, characterized by typical n-type semiconductor properties, forms a p-n heterojunction composite catalyst when combined with AgIO3, significantly amplifying photocatalytic performance. The p-n heterojunction, endowed with a potent internal electric field, enhances charge separation and transfer capabilities [6]. Materials with varying bandgap widths broaden the photoresponse range, thereby augmenting photocatalytic efficiency. This study endeavors to construct AgIO3/CTF heterojunction catalysts through optimized synthesis methods to realize synergistic adsorption-photocatalytic removal of trace antibiotics from potable water. The research plans to first study the structural characteristics of the composite system based on literature survey and original research basis, and determine the physical and chemical properties of the micro-interface of the material; Select typical antibiotics, study the adsorption-photocatalytic performance and influencing factors of composite materials, and use this feedback to optimize the adsorption-photocatalytic experimental conditions; Study the stability and reusability of composite materials; Finally, experiments were conducted to verify the structure-activity relationship and mechanism of antibiotic removal by the AgIO3/CTF heterojunction adsorption-photocatalytic composite system.
2. Experimental
2.1. Materials
Chemical reagents used in the experiment in this paper: 98% 1,4-dicyanobenzene (DCB) is produced from Beijing bailingwei Technology Co., Ltd, 99.0% bismuth nitrate pentahydrate, 99% carbamazepine is produced from Shanghai McLean Biochemical Technology Co., Ltd., 98% trifluoromethanesulfonic acid (TFMS), 99.5% N, N-dimethylformamide (DMF), ethanol, nitric acid, ≥47% potassium bisulfate (PMS), 99% ammonium metavanadate, 96% sodium hydroxide, 98% norfloxacin, 99.0% acetaminophen, KIO3 and AgNO3 are produced from Shanghai Aladdin Biochemical Technology Co., Ltd. Ultrapure water was obtained from Milli-Q® Ultrapure Water Purification Systems (Milford, MA).
2.2. Preparation of photocatalysts
Preparation of AgIO3: AgIO3 powder is prepared by solid-state ion exchange method. Mix KIO3 (1.51 g) and AgNO3 thoroughly in a mortar until uniform solid particles form. The resulting white precipitate was washed with deionized water to dissolve any unreacted starting material.
Preparation of AgIO3/CTF: Weigh 0.302 g of AgNO3 and 0.24 g of KIO3 respectively, and grind them together with CTF in a mortar. After grinding until completely mixed, transfer the powder in the mortar to a 250 mL beaker, add deionized water and stir for 5 min. Then centrifuge in an ultra-high-speed refrigerated centrifuge, set the rotation speed to 12000 r/min, centrifuge and wash several times, and dry it in a 60oC oven to collect the x-AgIO3/CTF for later use.
This experiment used a xenon lamp as a light source to simulate sunlight. First set the low-temperature thermostatic ring water pump to 25oC, measure the solution (100 mL, 5 mg L-1) and pour it into a quartz glass vessel, add 40 mg of PMS, and stir magnetically for 30 min. Then extract 1 mL of the solution, filter it and inject it into the liquid phase vial.
2.3. Characterization of photocatalysts
X-ray powder diffraction (XRD) analysis of the catalysts was carried out on an X-ray diffractometer (XPert Pro MPD; PANalytical B.V., Netherlands) using Cu-Kα radiation generated at 45 kV and 40 mA. The morphologies of the catalysts were observed using field emission scanning electron microscopy (FESEM, S-4800; Hitachi, Japan) operated at an accelerating voltage of 4 kV. The transmission electron microscopy (TEM) was performed through Tecnai G2F30 S-Twin TEM (FEI, Netherlands). The X-ray photoelectron spectroscopy (XPS) experiments were performed on a Thermo Scientific ESCA-Lab-200i-XL spectrometer (Waltham, MA) with monochromatic Al Alα radiation (1486.6 eV), the C 1s and N 1s peak spectra were analyzed using XPS Peak 4.1 software. The Raman spectra were obtained using a Lab Ram HRUV Raman spectrometer (JDbin-yvon, FR); laser excitation was provided by an Ar+ laser at a wavelength of 532 nm. The fourier transform infrared spectroscopy (FTIR) spectra were recorded in the 4000-400 cm-1 region with a resolution of 4 cm-1 using a Nicolet Thermo NEXUS 670. Steady-state PL spectra were measured using a Hitachi F-4600 fluorescence spectrophotometer (Hitachi, Japan). The data were recorded and analyzed by means of a built-in software supplied by Edinburgh Instruments.
2.4. Adsorption photocatalytic degradation of antibiotics
In this experiment, xenon lamp is used as light source to simulate sunlight. Measure the reaction solution (100 mL, 5 mg L-1) into the reactor, add 40 mg PMS, magnetic stirring and constant temperature 25℃. Weigh 50 mg of photocatalyst, stir in dark state for 30 min, then turn on the xenon lamp, take 1 ml of liquid sample successively under the preset time interval, and inject it into the liquid phase vial after filtration. Four antibiotics were degraded with each photocatalyst (paracetamol solution 100 mL, 5 mg L-1, carbamazepine solution 100 mL, 5 mg L-1, phenol solution 100 ml, 5 mg L-1, p-chlorophenol solution 100 mL, 5 mg L-1).
2.5. Radical quenching experiment
Through the addition of different free radical scavengers disodium EDTA-2Na, methanol (MeOH), p-benzoquinone (PBQ) and histidine (his), combined with electron paramagnetic resonance (ESR) analysis, the main active species and photocatalytic degradation mechanism in the catalytic reaction system were determined. To explore the action mechanism of AgIO3/CTF heterojunction photocatalyst in the system, so as to provide a theoretical basis for the construction of efficient adsorption photocatalysis dual function composite system to remove organic pollutants in water.
3. Results and analysis
Morphology has an important impact on the specific surface area and surface defects of the material, and has an impact on the photocatalytic performance or adsorption performance of the material. Therefore, the photocatalytic performance of the material can be better studied by observing the morphology of the sample. Figure 1(a) and (b) are SEM images of CTF-B and CTF-N. It can be seen from the figure that CTF-B is lumpy and irregular in shape, while CTF-N is an accumulation of particles smaller than CTF-B and has a rough surface. As shown in Figure 1(c) and 1(d), are SEM images of AgIO3 and AgIO3/CTF. Among them, AgIO3 is in the form of flakes with uneven shape, thickness of about 20-60 nm, and maximum lateral width between 200-800 nm. In addition, it can be seen that AgIO3 nanosheets are distributed on the surface of CTF-N.
TEM is a more intuitive way to observe the internal structure and spatial distribution of samples. Figure 2 is the TEM image and elemental scanning results of 0.25AgIO3/CTF. It can be intuitively seen that AgIO3 nanosheets are distributed on the surface of an approximately single-layer and highly dispersed CTF-N, with a maximum lateral width between 200-800 nm, which is consistent with the sample appearance shown in the SEM image. In Figure 2, CTF-N has a translucent structure, indicating that its thickness is very thin; The flaky AgIO3 and the flaky CTF-N were organically combined to successfully construct the AgIO3/CTF composite photocatalyst. It can be clearly seen that the constituent elements Ag, I and O of AgIO3 are evenly distributed on the constituent elements C, O and N of CTF-N. However, because AgIO3 is highly sensitive to damage caused by electron transmission to internal atoms, we cannot further analyze the microstructure of the composite photocatalyst using a polymer transmission electron microscope.
XRD can effectively analyze the phase composition and phase purity of samples. XRD tests were conducted on x-AgIO3/CTF. Figure 3 is the XRD pattern of 0.125AgIO3/CTF, 0.25AgIO3/CTF and 0.5AgIO3/CTF. It is observed from Figure 3 that as the AgIO3 content in the sample increases, the diffraction peak of AgIO3 in the sample gradually becomes apparent. The diffraction peak of AgIO3 in the 0.125AgIO3/CTF sample is the most obvious, and the diffraction peak of AgIO3 in 0.25AgIO3/CTF and 0.5AgIO3/CTF can also be clearly observed. Therefore, it is believed that AgIO3 adheres to CTF to form an AgIO3/CTF composite compound, which further proves the successful synthesis of 0.125AgIO3/CTF, 0.25AgIO3/CTF and 0.5AgIO3/CTF.
In order to analyze the light absorption capacity and optical band gap of x-AgIO3/CTF composites, UV-vis tests were conducted. Figure 4 shows the UV-vis diffuse reflection spectrum of x-AgIO3/CTF composite material in the wavelength range of 230-800 nm. It can be seen from the figure that x-AgIO3/CTF absorbs in the range of 230-430 nm and has an obvious AgIO3 characteristic absorption peak in the 285±5 nm region. The light absorption intensity of this characteristic absorption peak is 1.08. The absorbance of x-AgIO3/CTF in the 230-800 nm range is higher than that of pure AgIO3. This is due to the interaction generated by the formation of a heterostructure between AgIO3 and CTF, which effectively enhances the separation of electron-hole pairs and promotes the band gap transition of photogenerated electrons, thus enhancing the absorption in the visible light region. Theoretically, as the intensity of light absorption by a catalyst increases, the absorbed light energy increases, which increases the rate of generating excited electrons and holes, thereby increasing the photocatalytic efficiencyError! Reference source not found.. The absorption band edge of x-AgIO3/CTF is around 430 nm, which is significantly "red-shifted" compared with sample AgIO3 and shows good optical response capability. This shows that the composite system is conducive to improving the material's utilization of sunlight.
The molecular structure and functional groups of synthetic materials are analyzed by FTIR spectroscopy. Figure 5 is the FTIR of x-AgIO3/CTF. Several absorption peaks can be seen from the figure, among which the peak at 760 cm-1 corresponds to the stretching vibration of the I=O bond. The absorption peak located at 1350-1650 cm-1 corresponds to the characteristic peak caused by the vibrational stretching of the aromatic C=N bond formed by the triazine ring. The peak located near 2864 cm-1 corresponds to the symmetric stretching vibration peak of CH3, and the peaks near 3437 cm-1, 3649 cm-1 and 3743 cm-1 are considered to be the characteristic stretching vibration peaks of hydroxyl groups on the sample surface [9].
Compare the XPS of 0.25AgIO3/CTF (Figure 6a). Obviously, the peaks of C 1s, N 1s, O 1s, I 3d and Ag 3d can be found in their measured spectra. The C element originates from the base of the XPS instrument, and no other peaks are observed, indicating that the prepared sample is of high purity. The peaks at 619.31 eV and 630.79 eV (Figure 6b) can be attributed to the I 3d5/2 orbital and I 3d3/2 orbital, respectively, which are the characteristic peaks of I5+ in AgIO3. The peak at 531.37 eV (Figure 6c) corresponds to the O 1s orbital. The peaks at 368.11 eV and 374.1 eV (Figure 6d) can be assigned to the Ag 3d5/2 orbital and Ag 3d3/2 orbital respectively. These results can further prove that the chemical composition of 0.25AgIO3/CTF remains unchanged after being used for degradation. The 0.25AgIO3/CTF sample contains Ag, I, N, C and O elements, and the valence state of each element is consistent with the valence state of each element in 0.25AgIO3/CTF. This once again proved the successful preparation of the 0.25AgIO3/CTF sample [10].
As shown in Figure 7, the EPR spectra of CTF, AgIO3 and 0.25AgIO3/CTF samples under light conditions and dark conditions. It can be seen that there are four strong symmetry signals, and the existence of g value proves that there are vacancies formed by unpaired electrons on the aromatic ring. Under dark conditions, compared with AgIO3, the EPR curve intensity of 0.25AgIO3/CTF is stronger. This shows that there are more unpaired electrons in the 0.25AgIO3/CTF sample, and it also indicates that the sample has a defect structure, which is conducive to the migration of photogenerated carriers. When CTF, AgIO3 and 0.25AgIO3/CTF were irradiated with visible light, the EPR signal intensity of 0.25AgIO3/CTF was significantly enhanced. This shows that the 0.25AgIO3/CTF photocatalyst will generate more carriers under effective illumination conditions. The entire icon also reflects the characteristic quartet signal of DMPO-OH and the characteristic peak signal of DMPO-SO42- [11]. This indicates that -OH and SO42- are the main reactive oxygen species during the photocatalytic degradation process. In summary, the EPR test results prove that 0.25AgIO3/CTF will produce SO42-, H+ and ·OH active substances during the degradation reaction and are related to the degradation process of pollutants.
In order to further clarify the active substances involved in the photocatalytic process, free radical capture experiments were performed. In this experiment, disodium ethylenediaminetetraacetate (EDTA-2Na), methanol (MeOH), p-benzoquinone (PBQ), and histidine (His) were used as photogenerated holes (h+) and hydroxyl radicals (·OH). And scavengers such as sulfate radicals (·SO42-), superoxide radicals (·O2-) and singlet oxygen (1O2). The experimental results are shown in the Figure 8. During the degradation of carbamazepine by 0.25AgIO3/CTF, the degradation rate did not change significantly after adding PBQ. This indicates that ·O2- is not the main active species in the degradation of carbamazepine by this catalyst. After 180 min of illumination, the degradation rates of carbamazepine were 17.72% (EDTA-2Na), 22.80% (His), and 46.62% (MeOH) respectively. The results show that in the entire carbamazepine photocatalytic degradation system, ·OH and ·SO42- are the main active groups, and 1O2 and H+ play a smaller role.
Under light conditions, the steady-state photoluminescence spectra of 0.25AgIO3/CTF and 0.125AgIO3/CTF, AgIO3, and CTF were further analyzed through fluorescence quenching and fluorescence lifetime experiments, as shown in Figure 9. At 433 nm, when CTF is complexed with AgIO3, AgIO3 has a strong emission peak at 433 nm. When CTF forms a heterojunction with AgIO3, photoinduced charges can be effectively separated. The order of luminescence intensity is AgIO3>0.125AgIO3/CTF>CTF>0.25AgIO3/CTF, which is consistent with the above observed results of photocatalytic activity. The combination of AgIO3 and CTF can reduce the emission peak, but the compound ratio of AgIO3 and CTF still needs to be explored [1,11,12].
Degradation diagram of different composite catalysts for simulated pollutants paracetamol solution, carbamazepine solution, phenol solution, and p-chlorophenol solution (Figure 10). It can be seen from the figure that these Ag element composite catalysts have varying degrees of degradation effects on the simulated polluted solution. As time goes by, the content of contaminants in the solution gradually decreases. Now, by calculating the degradation rates of the two catalysts for the two polluted solutions, the degradation rates of AgIO3 for paracetamol solution, carbamazepine solution, phenol solution, and p-chlorophenol solution are 22.45%, 9.76%, 8.52%, and 3.96% respectively. The degradation rates of pure AgIO3 to phenol solution and p-chlorophenol solution are 2.63% and 2.02% respectively. The degradation rates of 0.25AgIO3/CTF for paracetamol solution, carbamazepine solution, phenol solution, and p-chlorophenol solution are 70.69%, 98.45%, 29.78%, and 61.85% respectively. The degradation rate of carbamazepine solution with 0.5AgIO3/CTF is 95.24%. The photocatalytic degradation performance of the x-AgIO3/CTF composite material on the target contaminated solution is significantly higher than that of pure AgIO3. This shows that the lamellar structure of CTF plays a good dispersion role in nano-spherical AgIO3 and increases the reactive sites. The formation of the heterostructure of the x-AgIO3/CTF composite material reduces the recombination rate of photogenerated electrons and holes and greatly improves the photocatalytic activity. At the same time, according to the pseudo-first-order kinetic equation, the reaction rate constants of the photocatalytic degradation of different pollutants by different samples were calculated. Among them, the reaction rate constants of 0.25AgIO3/CTF for the degradation of phenol, p-chlorophenol, carbamazepine and paracetamol are 0.00163, 0.00381, 0.0146 and 0.00482 respectively. The reaction rate constant of 0.25AgIO3/CTF is 3.41 times, 25.07 times, 30.04 times and 5.18 times that of the single catalyst AgIO3 reaction rate constants of 0.000477, 0.000152, 0.000486 and 0.000931. This shows that the x-AgIO3/CTF composite photocatalyst. It has good degradation effect on most pollutants under visible light irradiation and has a wide range of applications.
In order to evaluate the transmission efficiency of photocarriers (photoexcited electrons and holes) and the generation of photocurrent in the catalyst, photocurrent tests were conducted on CTF, 0.25AgIO3/CTF, and AgIO3. The 0.25AgIO3/CTF is improved compared to the original CTF. Figure 11 shows the photocurrent test results of CTF, 0.25AgIO3/CTF, and AgIO3. The results show that the photocurrent response intensity of CTF monomer and AgIO3 monomer is smaller, which shows that the electron-hole separation efficiency of the two is relatively low. The photocurrent response intensity of the 0.25AgIO3/CTF composite material increased significantly. 0.25AgIO3/CTF achieved transient photocurrent and further enhanced photocurrent. This finding confirms that the combination of CTF and AgIO3 can promote the generation and mobility of photoexcited charges under visible light irradiation. In addition, the arc radius of 0.25AgIO3/CTF in the EIS image is much smaller than that of the CTF catalyst, indicating that the sample has extremely low resistance to charge transfer in the framework, benefiting from the reduction of photoinduced hole separation and photocarrier recombination efficiency [13].
To evaluate the kinetics of charge transfer in this heterostructure composite, EIS tests were performed. The size of the arc radius on the Nynquist curve can reflect the photoreaction rate of the corresponding catalyst on the electrode surface. The smaller the arc diameter, the smaller the hindrance effect [14]. This shows that the smaller the charge transfer resistance Rct, the stronger the conductive performance of the electrode. A smaller arc radius indicates lower interfacial layer resistance at the electrode surface. It can be seen from Figure 12 that the photocurrent of the composite photocatalyst film is significantly higher than that of the single catalyst film. This shows that the combination of x-AgIO3/CTF effectively inhibits the recombination of photogenerated electron and hole pairs of a single catalyst, thereby increasing its photocurrent intensity. This also indicates that its ability to photocatalytically remove pollutants may also be improved. At the same time, 0.25AgIO3/CTF shows the smallest arc radius compared to AgIO3 and CTF, which indicates that the charge transfer resistance on the surface of 0.25AgIO3/CTF is reduced. This therefore results in efficient electron-hole pair separation, which is consistent with the i-t results. The above results confirm that the 0.25AgIO3/CTF photocatalyst has the highest separation efficiency and migration efficiency during the photocatalytic reaction process, thus giving it better photocatalytic performance.
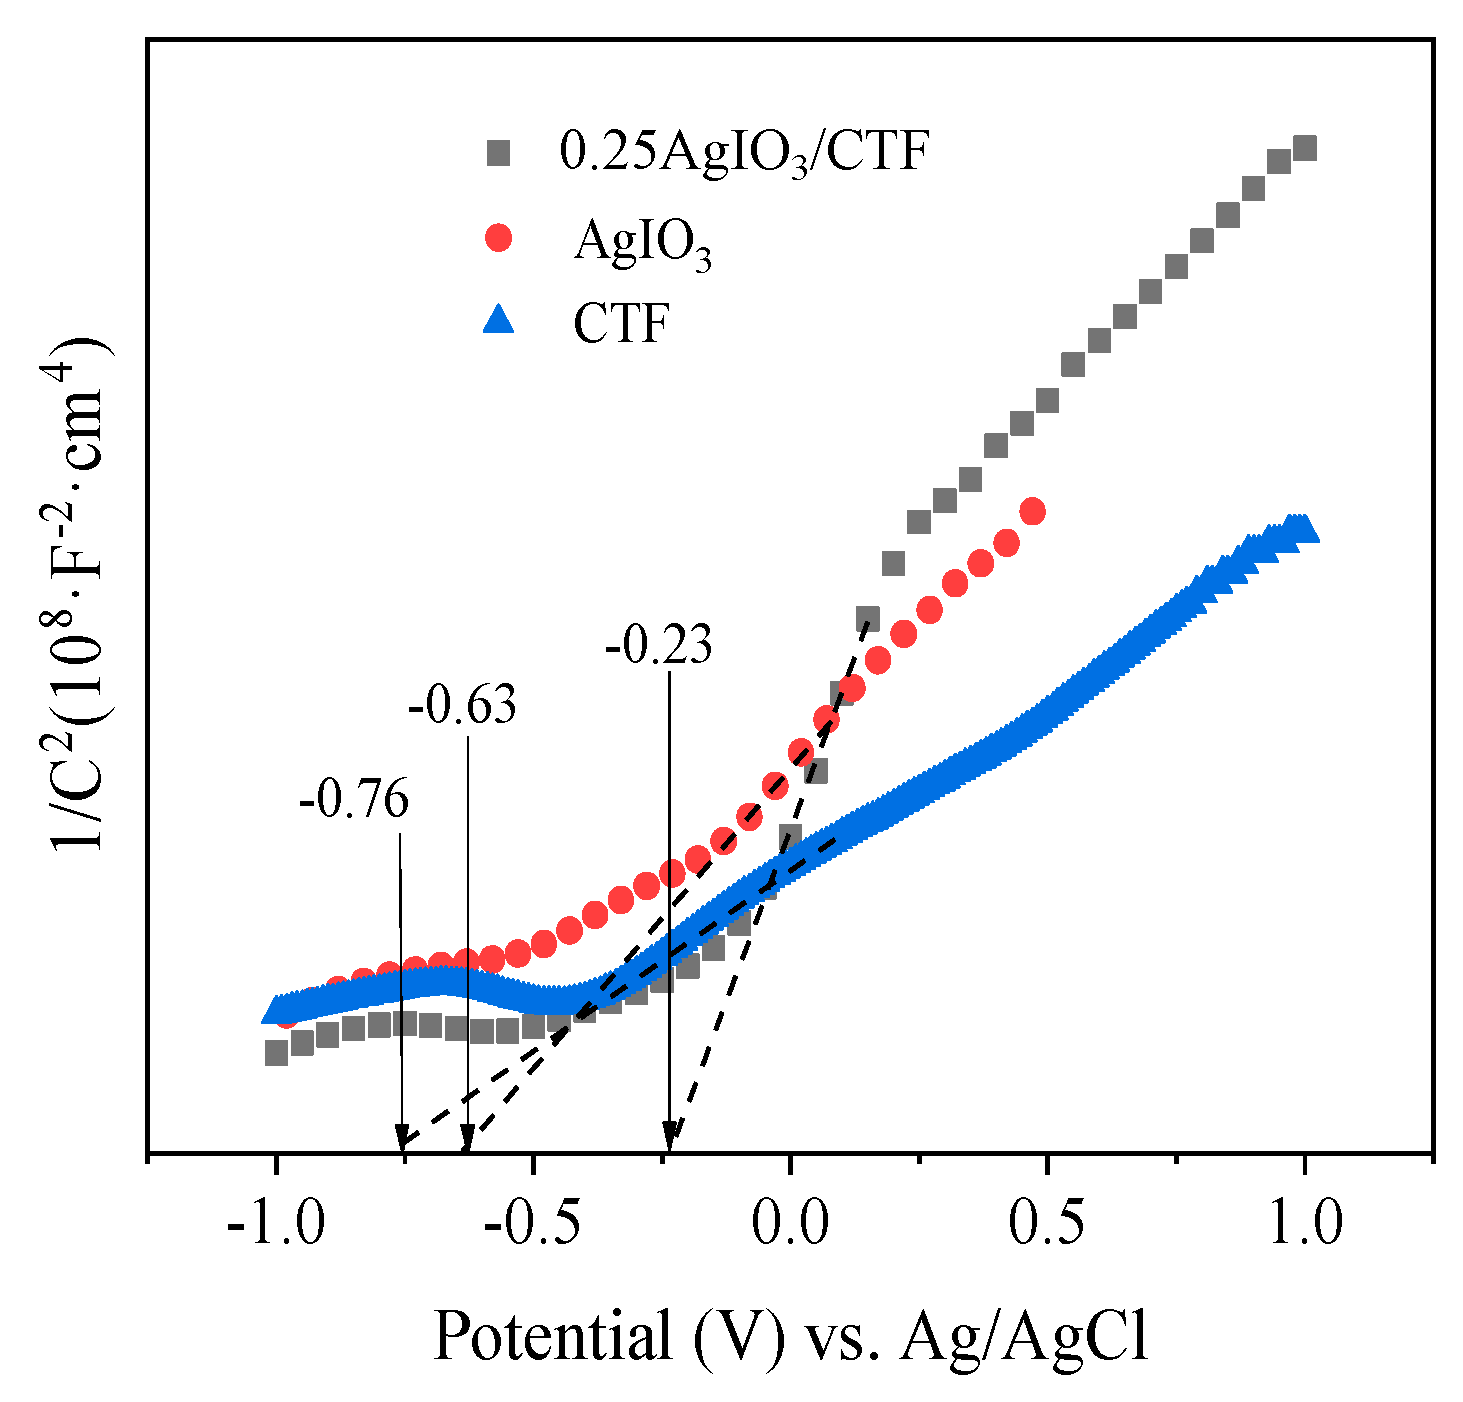
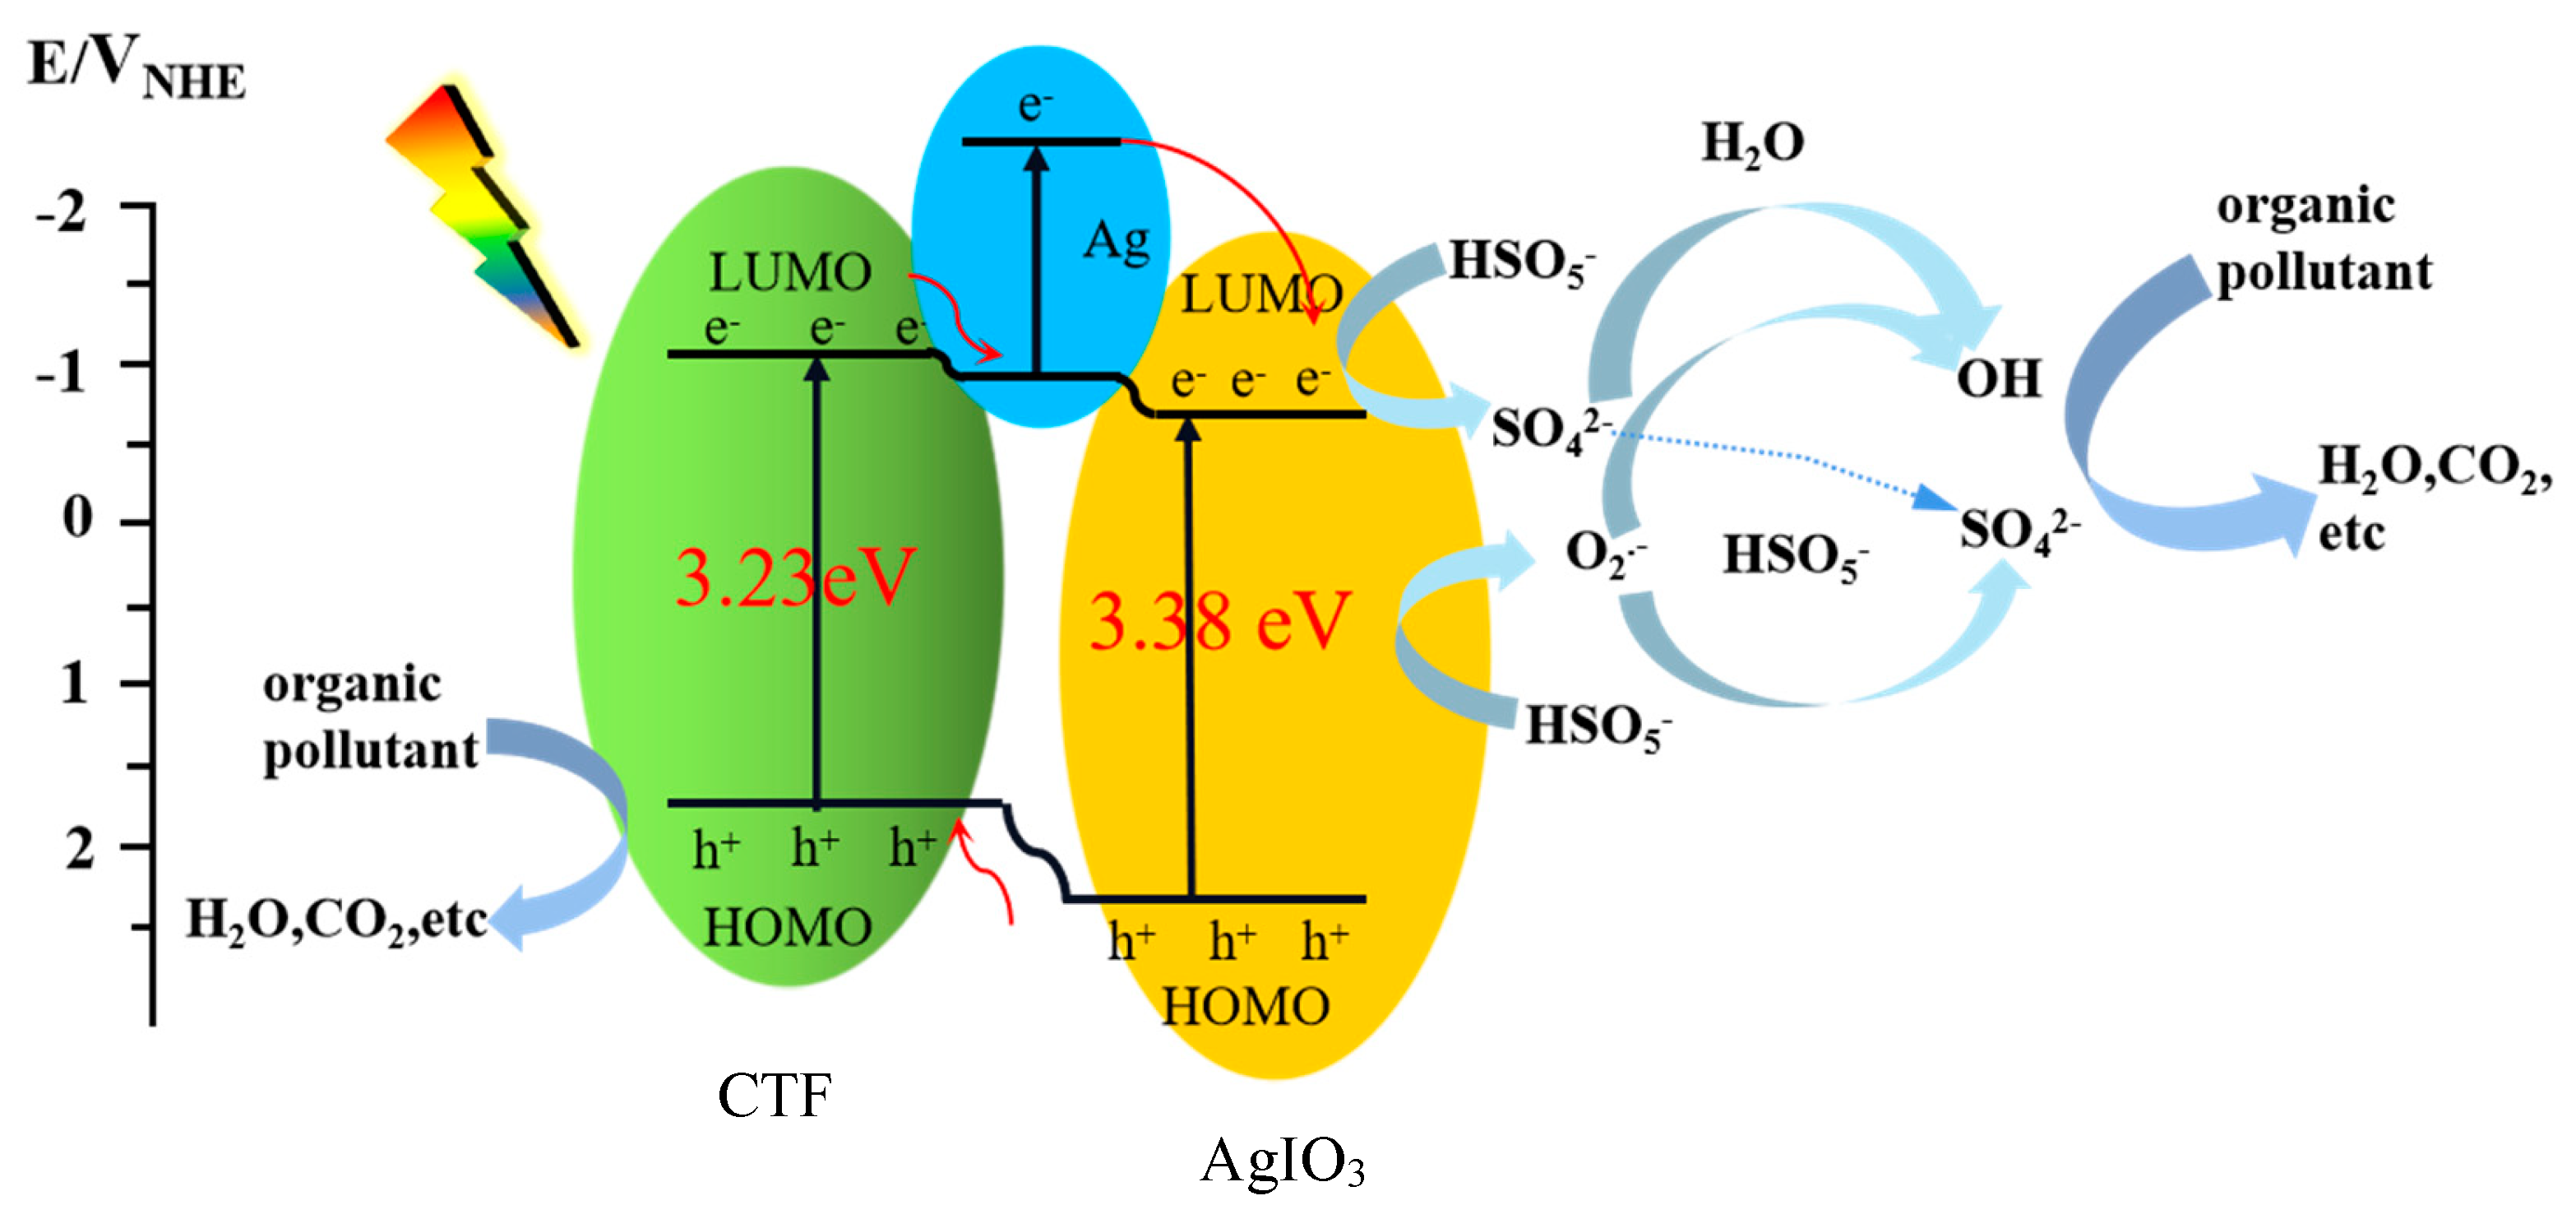
In order to better understand the mechanism of CBZ-accelerated photocatalytic degradation in the 0.25AgIO3/CTF/vis/PMS system, the energy band structure of 0.25AgIO3/CTF with respect to the photoinduced carrier redox ability was evaluated. Typical Mott-Schottky plots for various catalysts measured in the dark at a frequency of 100 Hz are shown in Figure 13. The positive slope of the 1/C2 values obtained indicates that each catalyst has n-type semiconductor properties. The flat band potentials of CTF, AgIO3 and 0.25AgIO3/CTF samples are approximately -0.76, -0.63 and -0.23 V respectively. Based on the relationship between the Ag/AgCl electrode and the normal hydrogen electrode (NHE), it can be calculated that the flat band potentials of each catalyst are -0.56, -0.43 and -0.03 V respectively compared to the normal hydrogen electrode (NHE). It has been reported that the flat band potential of n-type semiconductors is usually 0-0.1 V higher than the conduction band potential [15]. For organic semiconductor materials, the lowest unoccupied molecular orbital (LUMO) and the highest occupied molecular orbital (HOMO) are equivalent to the conduction band (CB) and valence band (VB) of inorganic semiconductor materials, respectively [16]. Therefore, combined with the UV-visible diffuse reflectance spectrum of the sample, the conduction band and valence band potential of each sample relative to the standard hydrogen electrode potential can be obtained. Because the valence band potential energy of the 0.25AgIO3/CTF heterojunction photocatalyst is more negative than the redox potential energy of SO4-/SO42- (2.5-3.1 V vs NHE) [17]. Therefore, the photogenerated electrons can be captured by PMS, thereby producing ·SO4-.
The characteristics of x-AgIO3/CTF meet the requirements for improving photocatalytic performance. More specifically, x-AgIO3/CTF increases the band edge to narrow the band gap and expands the visible light absorption boundary [19]. Due to the existence of elemental Ag, its plasmon resonance effect and good conductivity, it can also generate photogenerated charges and quickly transfer electrons [18]. The existence of the heterojunction shortens the transmission distance of charges to the surface, thereby enhancing light capture and reducing the recombination probability of photoexcited carriers. As shown in Scheme 1, under the irradiation of visible light, after electrons are excited, holes will be left in the valence band, but photogenerated electrons and holes are easy to recombine [19]. Due to the formation of a p-n heterojunction structure between CTF and AgIO3, the valence band energy level of AgIO3 is higher than that of CTF. Holes will easily transfer to the CTF, thus inhibiting the recombination of photogenerated electron-hole pairs inside AgIO3 [20,21,22]. At the same time, due to the existence of elemental Ag, its plasmon resonance effect and good conductivity, it can also generate photogenerated charges and quickly transfer electrons [23]. Taking advantage of the difference in energy level positions between CTF and AgIO3 and the presence of elemental Ag, the recombination of photogenerated electron-hole pairs inside the composite material is ultimately effectively suppressed and the photocatalytic activity of the composite material is improved. Under this condition, holes (h+) react with HO- in water to produce hydroxyl radicals (·OH), and electrons react with dissolved oxygen (O2) in water to produce superoxide radicals (·O2-). After the introduction of PMS, the separation of carriers is further accelerated due to the rapid capture of photogenerated electrons. PMS itself decomposes into various reactive substances through a series of chain reactions, and photooxidation (mainly h+) and PMS chemical activation (mainly ·OH and ·SO4-) are introduced to collaboratively remove organic pollutants. Because PMS (1.82 V vs NHE) is much greater than the oxidizing property of oxygen (1.23 V vs NHE). The e- on the conduction band is thermodynamically more likely to be captured by PMS, and then activated to generate free radicals (HSO5-+e-→·SO4-+OH-;·SO4-+H2O→·OH+SO42-+H+). Since the redox potential of O2− (0.91 V) is much lower than that of ·OH (1.9-2.7 V) and ·SO4- (2.5-3.1 V), it may be less reactive with organic contaminants in aqueous solutions [24,25]. Therefore, using ·O2− as an intermediate, other reaction species ·OH (HSO5-+·O2−→·OH+SO42-+O2), SO4- (HSO5-+·O2-→OH-+SO42-+O2), and 1O2 (2·O2-+2H2O→1O2+ H2O2+2OH-) are formed. These free radicals react with organic pollutants pre-adsorbed on the catalyst surface, causing the organic pollutants to be redox-degraded into inorganic small molecules (H2O, CO2, etc.) [26,27].
Conclusion
In this paper, a series of AgIO3/CTF catalysts with heterojunction structure were successfully synthesized. The analysis of the composite photocatalyst by XRD, FTIR and SEM shows that the reaction between AgIO3 powder and bulk CTF can successfully form AgIO3/CTF composite photocatalyst material system, the crystallinity of the catalyst is good, and a heterojunction structure is formed between AgIO3 and CTF. Compared with single AgIO3, AgIO3/CTF heterojunction photocatalyst has significantly improved the degradation effect of organic pollutants. Among them, the degradation effect of 0.25AgIO3/CTF is the best. The reaction rate constants of phenol, p-chlorophenol, carbamazepine and paracetamol are are 0.00163, 0.00381, 0.0146 and 0.00482 respectively, which are 3.41, 25.07, 30.04 and 5.18 times times that of single catalyst AgIO3. The formation of heterojunction between AgIO3 and CTF, driven by the built-in electric field, leads to the effective separation of photogenerated electron hole pairs and enhances the degradation efficiency of organic pollutants. In addition, due to the LSPR effect, Ag nanoparticles demonstrate significant absorption in the visible light region, playing a crucial role in the highly efficient photocatalytic reduction of antibiotics.
Acknowledgments
This work was supported by the National Natural Science Foundation of China (21876156, 22006078, and 41907100), the Ningbo Yongjiang Innovation Project (No.2021A-098-G), the Ningbo Natural Science Foundation (2021J133) and and K. C. Wong Magna Fund in Ningbo University. The authors would like to thank Shiyanjia Lab (www.shiyanjia.com) for the all characterizations.
References
- Miklos DB, Remy C, Jekel M, Linden KG, Drewes JE, Hubner U. Evaluation of Advanced Oxidation Processes for Water and Wastewater Treatment-A critical Review. Water Research, 2018, 139: 118-131.
- Tian W, Sun H, Duan X, Zhang HY, Ren YX, Wang SB. Biomass-Derived Functional Porous Carbons for Adsorption and Catalytic Degradation of Binary Micropollutants in Water. Journal of Hazardous Materials, 2020, 389: 121881.
- Martins VL, Ogden MD, Jones MR, Trowsdale SA, Hall PJ, Jensen HS. Opportunities for Coupled Electrochemical and Ion-exchange Technologies to Remove Recalcitrant Micropollutants in Water. Separation and Purification Technology, 2020, 239: 116522.
- Bui XT, Vo TP, Ngo HH, Guo WS, Nguyen TT. Multicriteria Assessment of Advanced Treatment Technologies for Micropollutants Removal at Large-Scale Applications. Science of the Total Environment, 2016, 563-564: 1050-1067.
- Eggen RIL, Hollender J, Joss A, Scharer M, Stamm C. Reducing the Discharge of Micropollutants in the Aquatic Environment: The Benefits of Upgrading Wastewater Treatment Plants. Environmental Science & Technology, 2014, 48(14): 7683-7689.
- Lapworth DJ, Baran N, Stuart ME, Ward RS. Emerging Organic Contaminants in Groundwater: A Review of Sources, Fate and Occurrence. Environmental Pollution, 2012, 163: 287-303.
- Zhang D, Tan GQ , Wang M, Li B, Dang MY, Wang Y, Zhang BX, Ren HJ, Xia A. The formation of direct Z-scheme Ag/BiOCl/AgIO3 heterojunction and its degradation stability. Applied Surface Science, 2020, 530, 147228.
- Zhang Y, Cui J, Zhang H, Pei YS. Facile synthesis of a novel AgIO3/BiVO4 photocatalyst with two-step charge separation to enhance visible-light-driven photocatalytic performance for carbamazepine degradation. Separation and Purification Technology, 2021, 276, 119273.
- Carpenter CMG, Helbling DE. Removal of Micropollutants in Biofilters: Hydrodynamic Effects on Biofilm Assembly and Functioning. Water Research, 2017, 120: 211-221.
- Li XF, Chen WY, Ma LM, Huang YX, Wang HW. Characteristics and Mechanisms of Catalytic Ozonation with Fe-shaving-based Catalyst in Industrial Wastewater Advanced Treatment. Journal of Cleaner Production, 2019, 222(10): 174-181.
- Díez-Mato E, Cortezón-Tamarit FC, Bogialli S, Garcia-Fresnadillo D, Marazuela MD. Phototransformation of Model Micropollutants in Water Samples by Photocatalytic Singlet Oxygen Production in Heterogeneous Medium. Applied Catalysis B: Environmental, 2014, 160-161: 445-455.
- Xiao M, Wang ZL, Lyu MQ, Luo B, Wang SC, Liu G, Cheng HM, Wang LZ. Hollow Nanostructures for Photocatalysis: Advantages and Challenges. Advanced Materials, 2019, 31(38): 1801369.
- Zou L, Wang HR, Wang X. High Efficient Photodegradation and Photocatalytic Hydrogen Production of CdS/BiVO4 Heterostructure through Z-Scheme Process. ACS Sustainable Chemistry & Engineering, 2017, 5(1): 303-309.
- Wang L, Jin P, Duan S, Huang JW, She HD, Wang QZ, An TC. Accelerated Fenton-Like Kinetics by Visible-Light-Driven Catalysis over Iron(III) Porphyrin Functionalized Zirconium MOF: Effective Promotion on the Degradation of Organic Contaminants. Environmental Science-Nano, 2019, 6(8): 2652-2661.
- Jansson I, Suárez S, Garcia-Garcia FJ, Sanchez B. Zeolite–TiO2 Hybrid Composites for Pollutant Degradation in Gas Phase. Applied Catalysis B: Environmental, 2015, 178: 100-107.
- Wei PF, Qi MZ, Wang ZP, Ding SY, Yu W, Liu Q, Wang LK, Wang HZ, An WK, Wang W. Benzoxazole-Linked Ultrastable Covalent Organic Frameworks for Photocatalysis. Journal of the American Chemical Society, 2018, 140(13): 4623-4631.
- Chen RF, Shi JL, Ma Y, Lin GQ, Lang XJ, Wang C. Designed Synthesis of a 2D Porphyrin-Based sp2 Carbon-Conjugated Covalent Organic Framework for Heterogeneous Photocatalysis. Angewandte Chemie International Edition, 2019, 58: 6430-6434.
- Wei SC, Zhang F, Zhang WB, Qiang PR, Yu KJ, Fu XB, Wu DQ, Bi S, Zhang F. Semiconducting 2D Triazine-Cored Covalent Organic Frameworks with Unsubstituted Olefin Linkages. Journal of the American Chemical Society, 2019, 141: 14272-14279.
- Liu JL, Zhou DM, Xu ZY, Zheng SR. Adsorptive Removal of Pharmaceutical Antibiotics from Aqueous Solution by Porous Covalent Triazine Frameworks. Environmental Pollution, 2017, 226: 379-384.
- Jin EQ, Geng KY, Fu S, Addicoat MA, Zheng WH, Xie SL, Hu JS, Hou XD, Wu X, Jiang QH, Xu QH, Wang H, Jiang DL. Module-Patterned Polymerization towards Crystalline 2D sp2-Carbon Covalent Organic Framework Semiconductors. Angewandte Chemie International Edition, 2022, 61, e20211502.
- Shao PH, Pei JJ, Tang H, Yu SP, Yang LM, Shi H, Yu K, Zhang K, Luo XB. Defect-Rich Porous Carbon with Anti-Interference Capability for Adsorption of Bisphenol A Via Long-Range Hydrophobic Interaction Synergized with Short-Range Dispersion Force. Journal of Hazardous Materials, 2021, 403: 123705.
- Li XL, Zhang CL, Cai SL, Lei XH, Altoe V, Hong F, Urban JJ, Ciston J, Chan EM, Liu Y. Facile Transformation of Imine Covalent Organic Frameworks into Ultrastable Crystalline Porous Aromatic Frameworks. Nature communications, 2018, 9(1): 1-8.
- Jin EQ, Lan ZA, Jiang QH, Geng KY, Li GS, Wang XC, Jiang DL. 2D sp2 Carbon-Conjugated Covalent Organic Frameworks for Photocatalytic Hydrogen Production from Water. Chem, 2019, 5(6), 1632-1647.
- Chen Q, Zheng JW, Yang Q, Dang Z, Zhang LJ. Effect of Carbon Chain Structure on The Phthalic Acid Esters (Paes) Adsorption Mechanism by Mesoporous Cellulose Biochar. Chemical Engineering Journal, 2019, 362: 383-391.
- Tang Y, Zhang, SH, Su YL, Wu D, Zhao YP, Xie B. Removal of Microplastics from Aqueous Solutions by Magnetic Carbon Nanotubes. Chemical Engineering Journal, 2021, 406: 126804.
- Wang D, Zhao L, Guo LH, Zhang H. Online Detection of Reactive Oxygen Species in Ultraviolet (UV)-Irradiated Nano-TiO2 Suspensions by Continuous Flow Chemiluminescence. Analytical Chemistry, 2014, 86(21): 10535-10539.
- Zhang J, Hu Y, Jiang X, Chen SF, Meng SG, Fu XL. Design of a Direct Z-Scheme Photocatalyst: Preparation and Characterization of Bi2O3/g-C3N4 with High Visible Light Activity. Journal of Hazardous Materials, 2014, 280: 713-722.
Figure 1.
SEM images of (a) AgIO3, (b) CTF-N, (c) and (d) 0.25AgIO3/CTF.
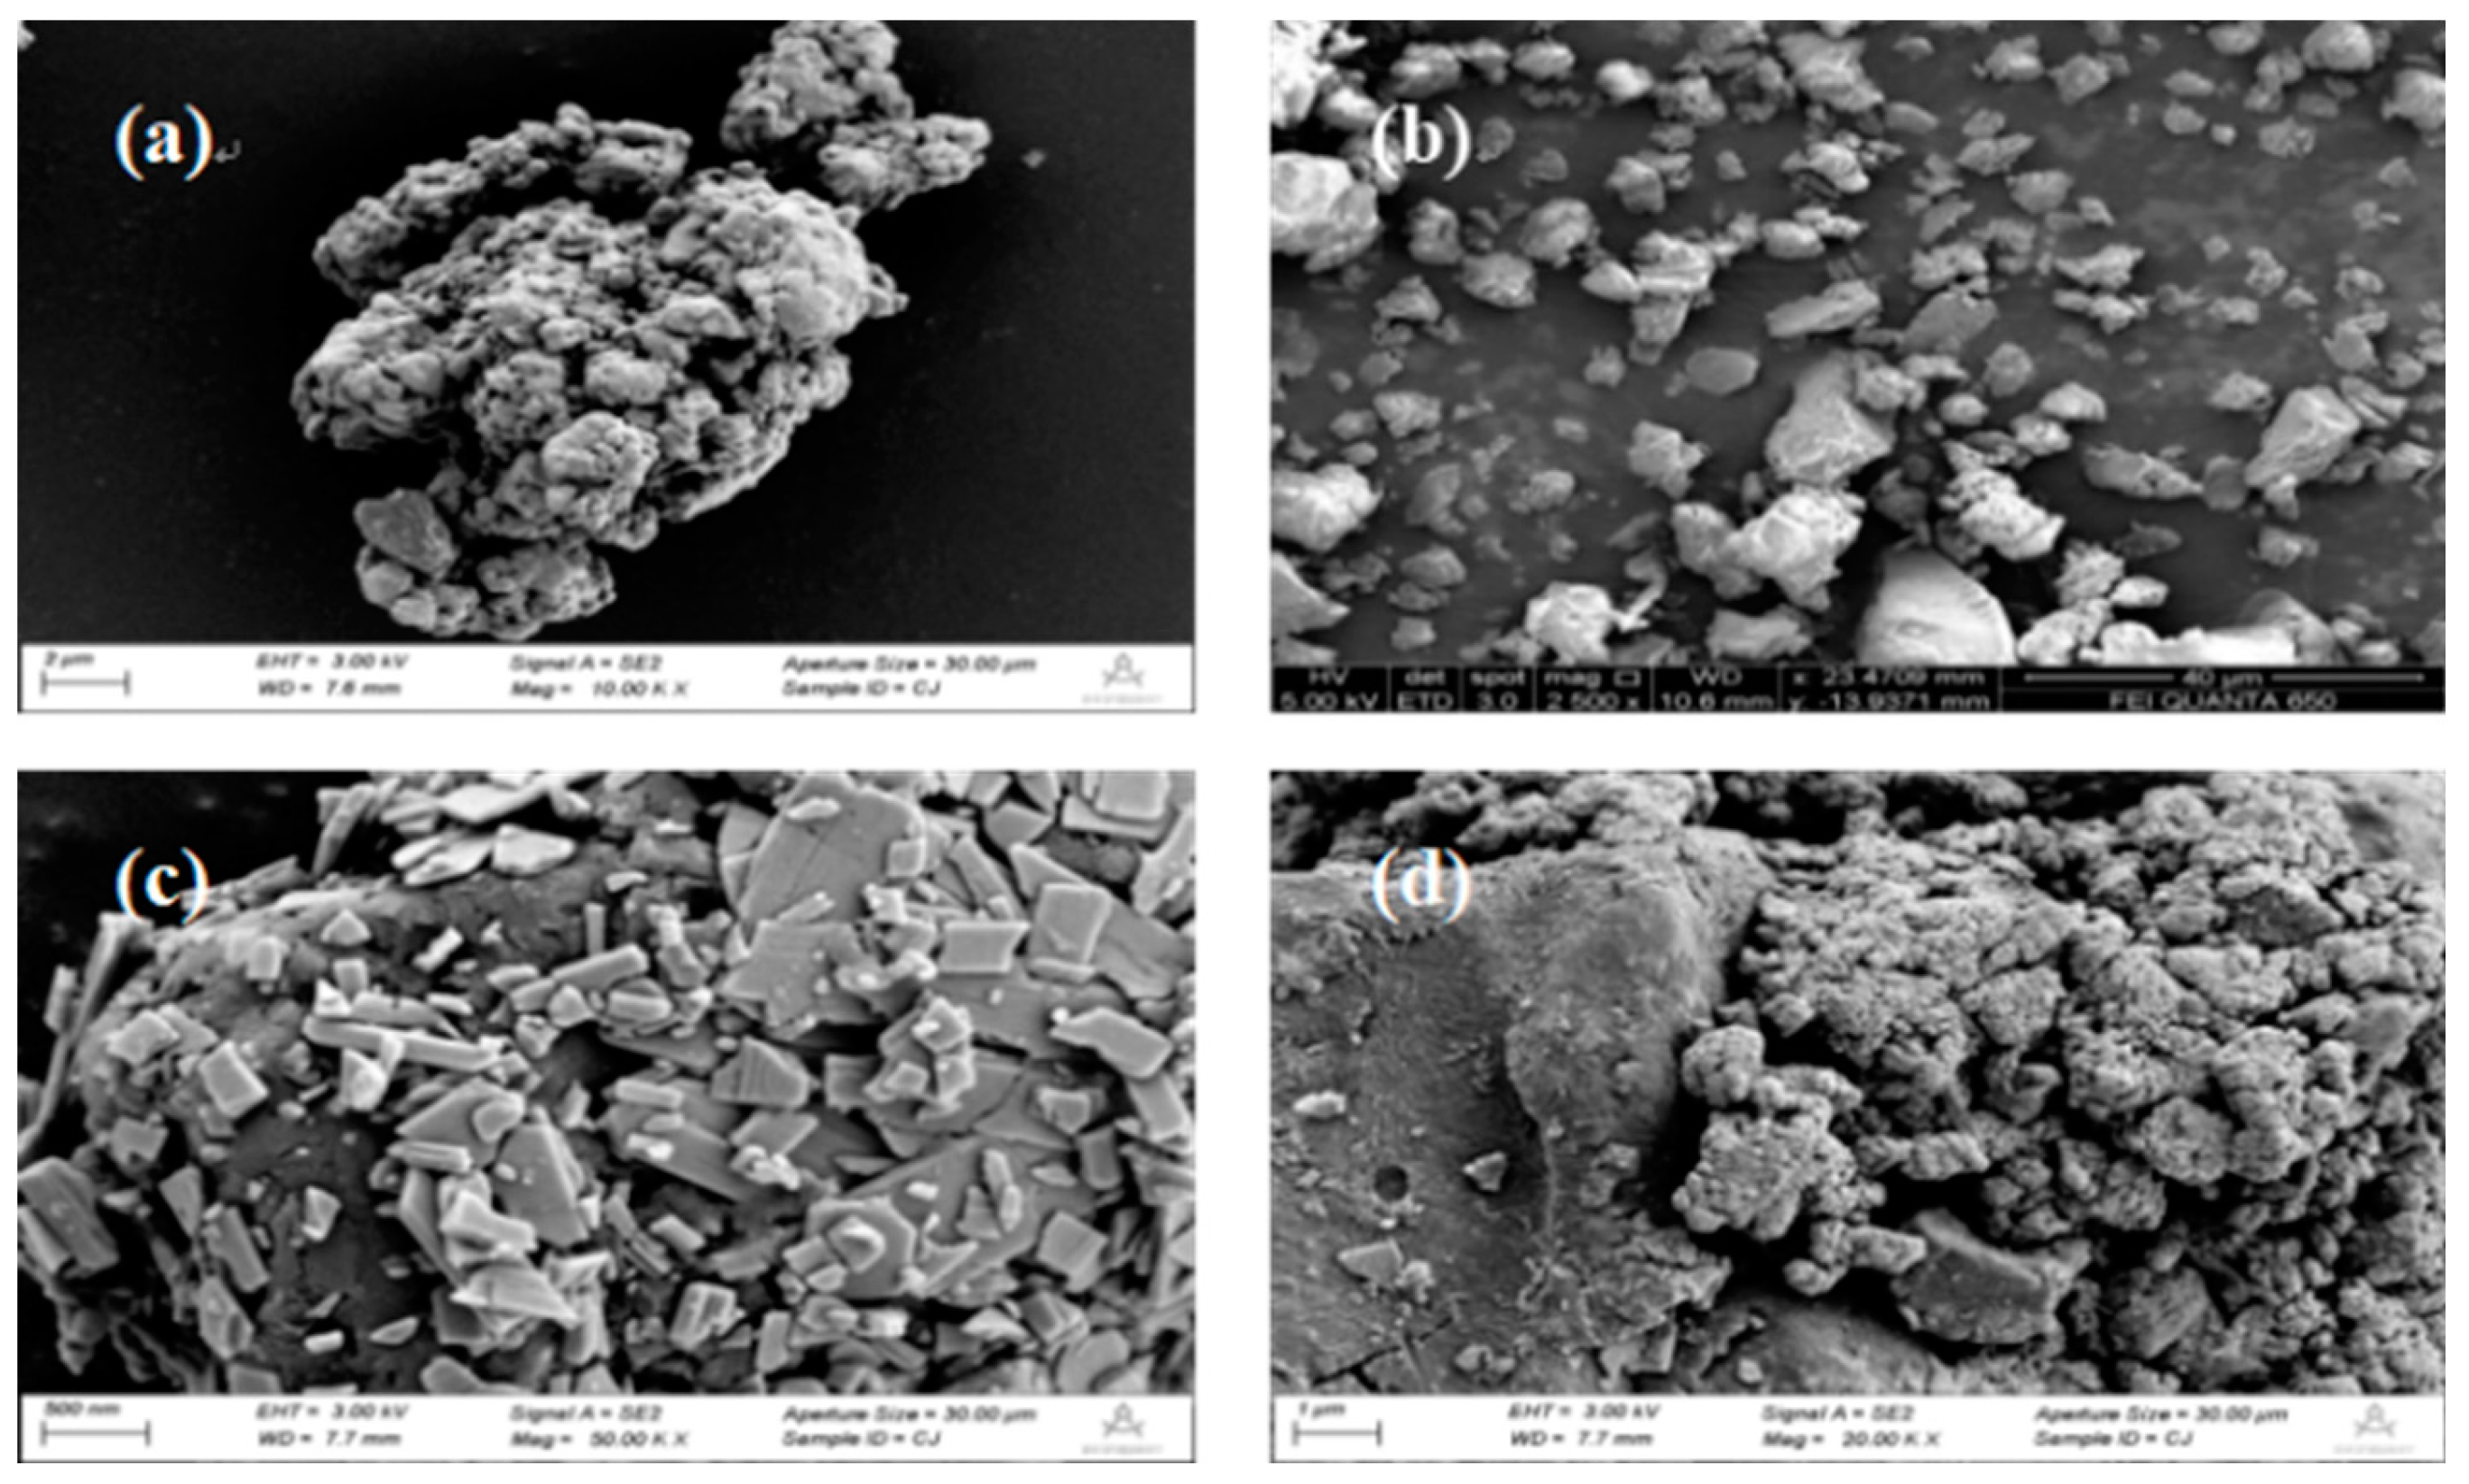
Figure 2.
TEM image of (a) 0.25AgIO3/CTF; (b) A typical high-angle annular dark-field (HAADF) image of 0.25AgIO3/CTF and the corresponding EDS mapping images of C, N, Ag, I and O.
Figure 2.
TEM image of (a) 0.25AgIO3/CTF; (b) A typical high-angle annular dark-field (HAADF) image of 0.25AgIO3/CTF and the corresponding EDS mapping images of C, N, Ag, I and O.
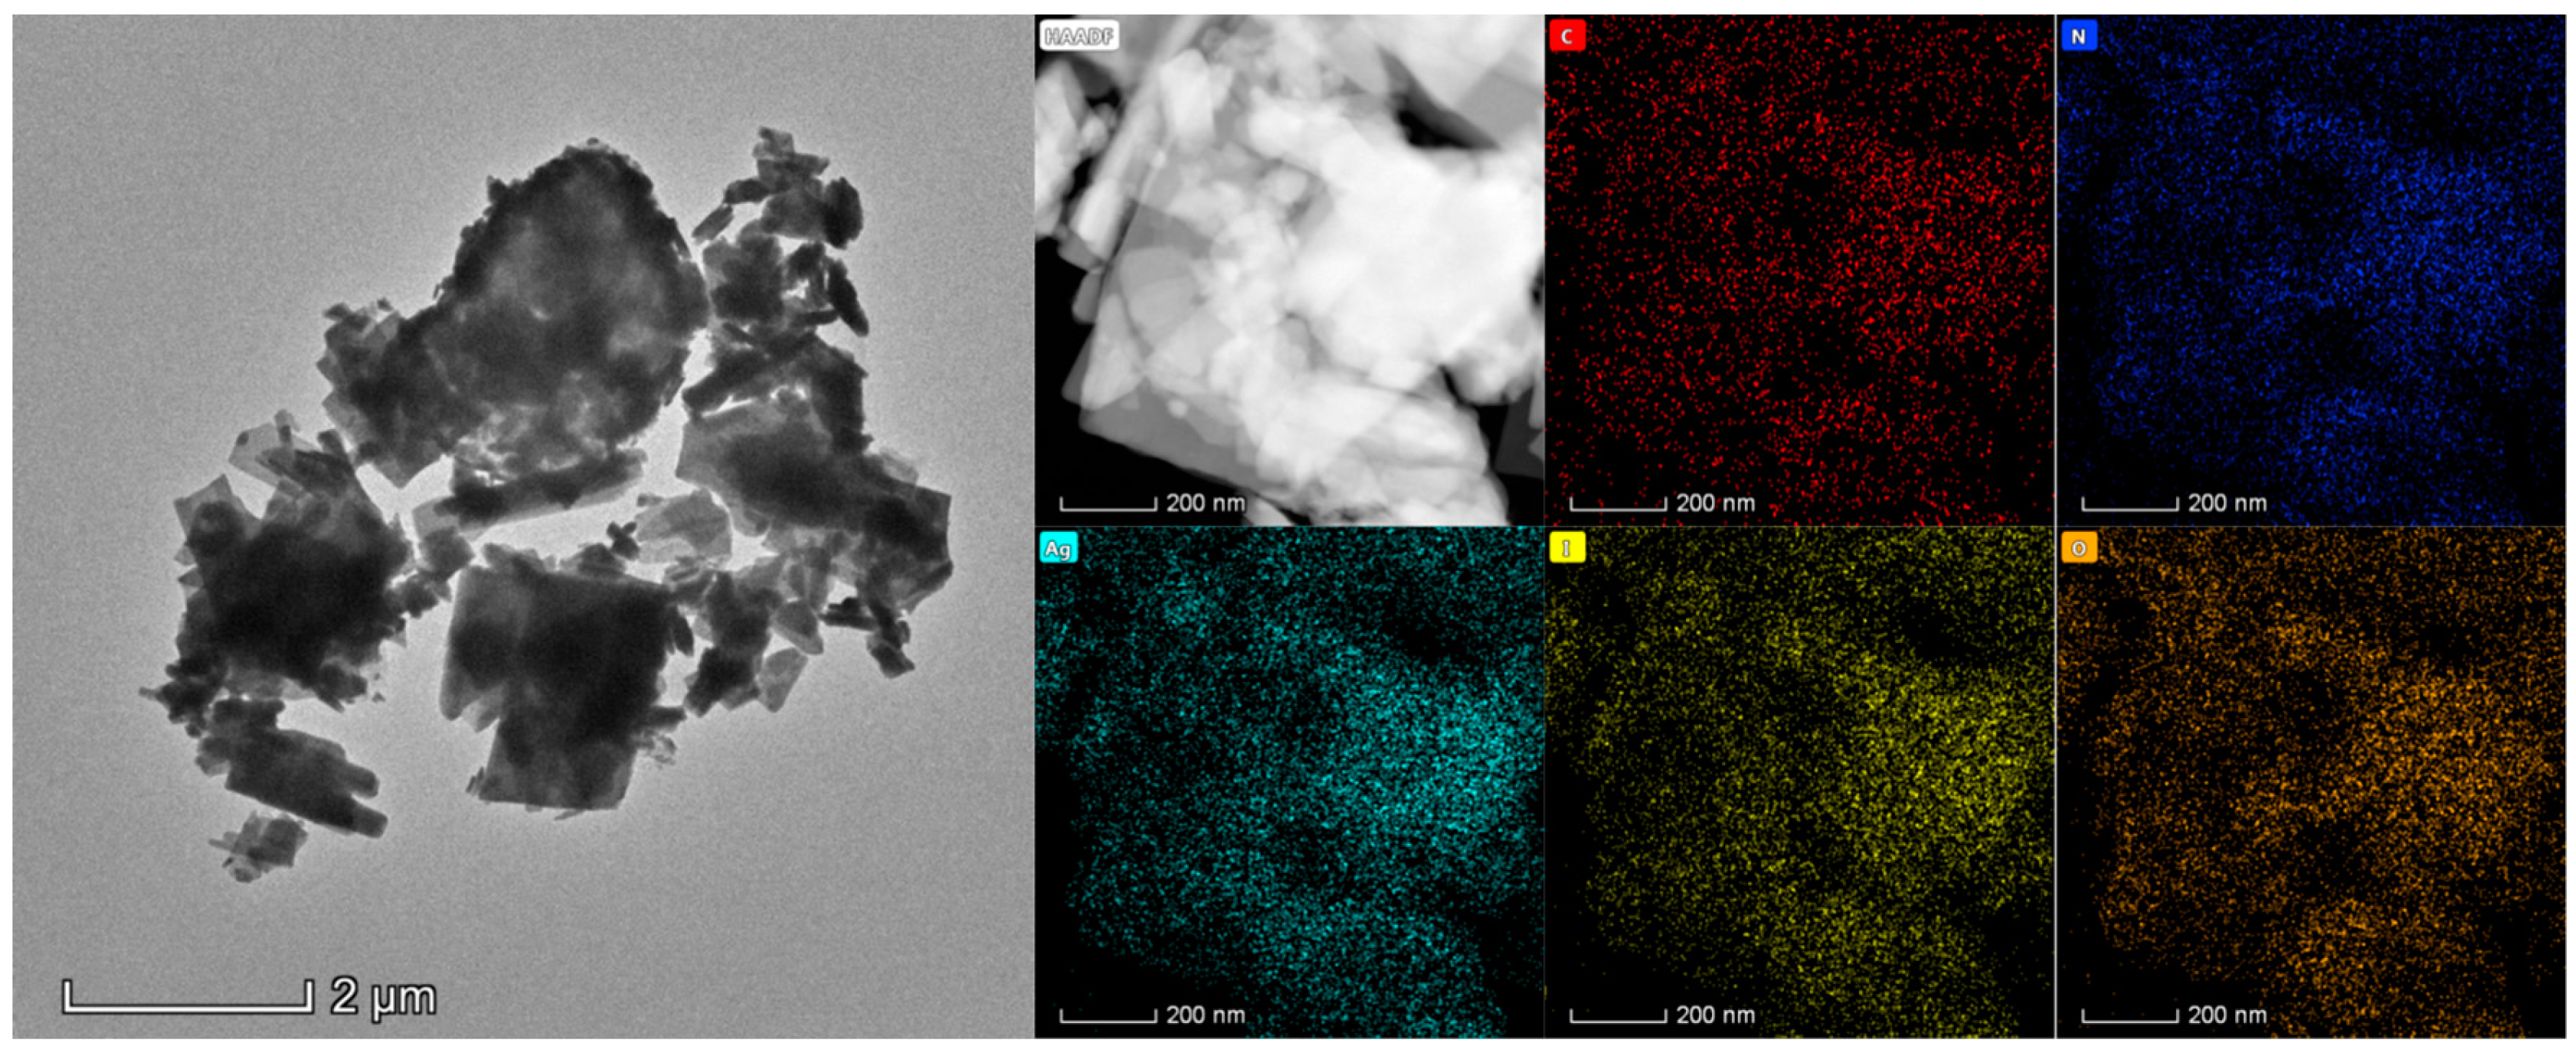
Figure 3.
XRD patterns of x-AgIO3/CTF.
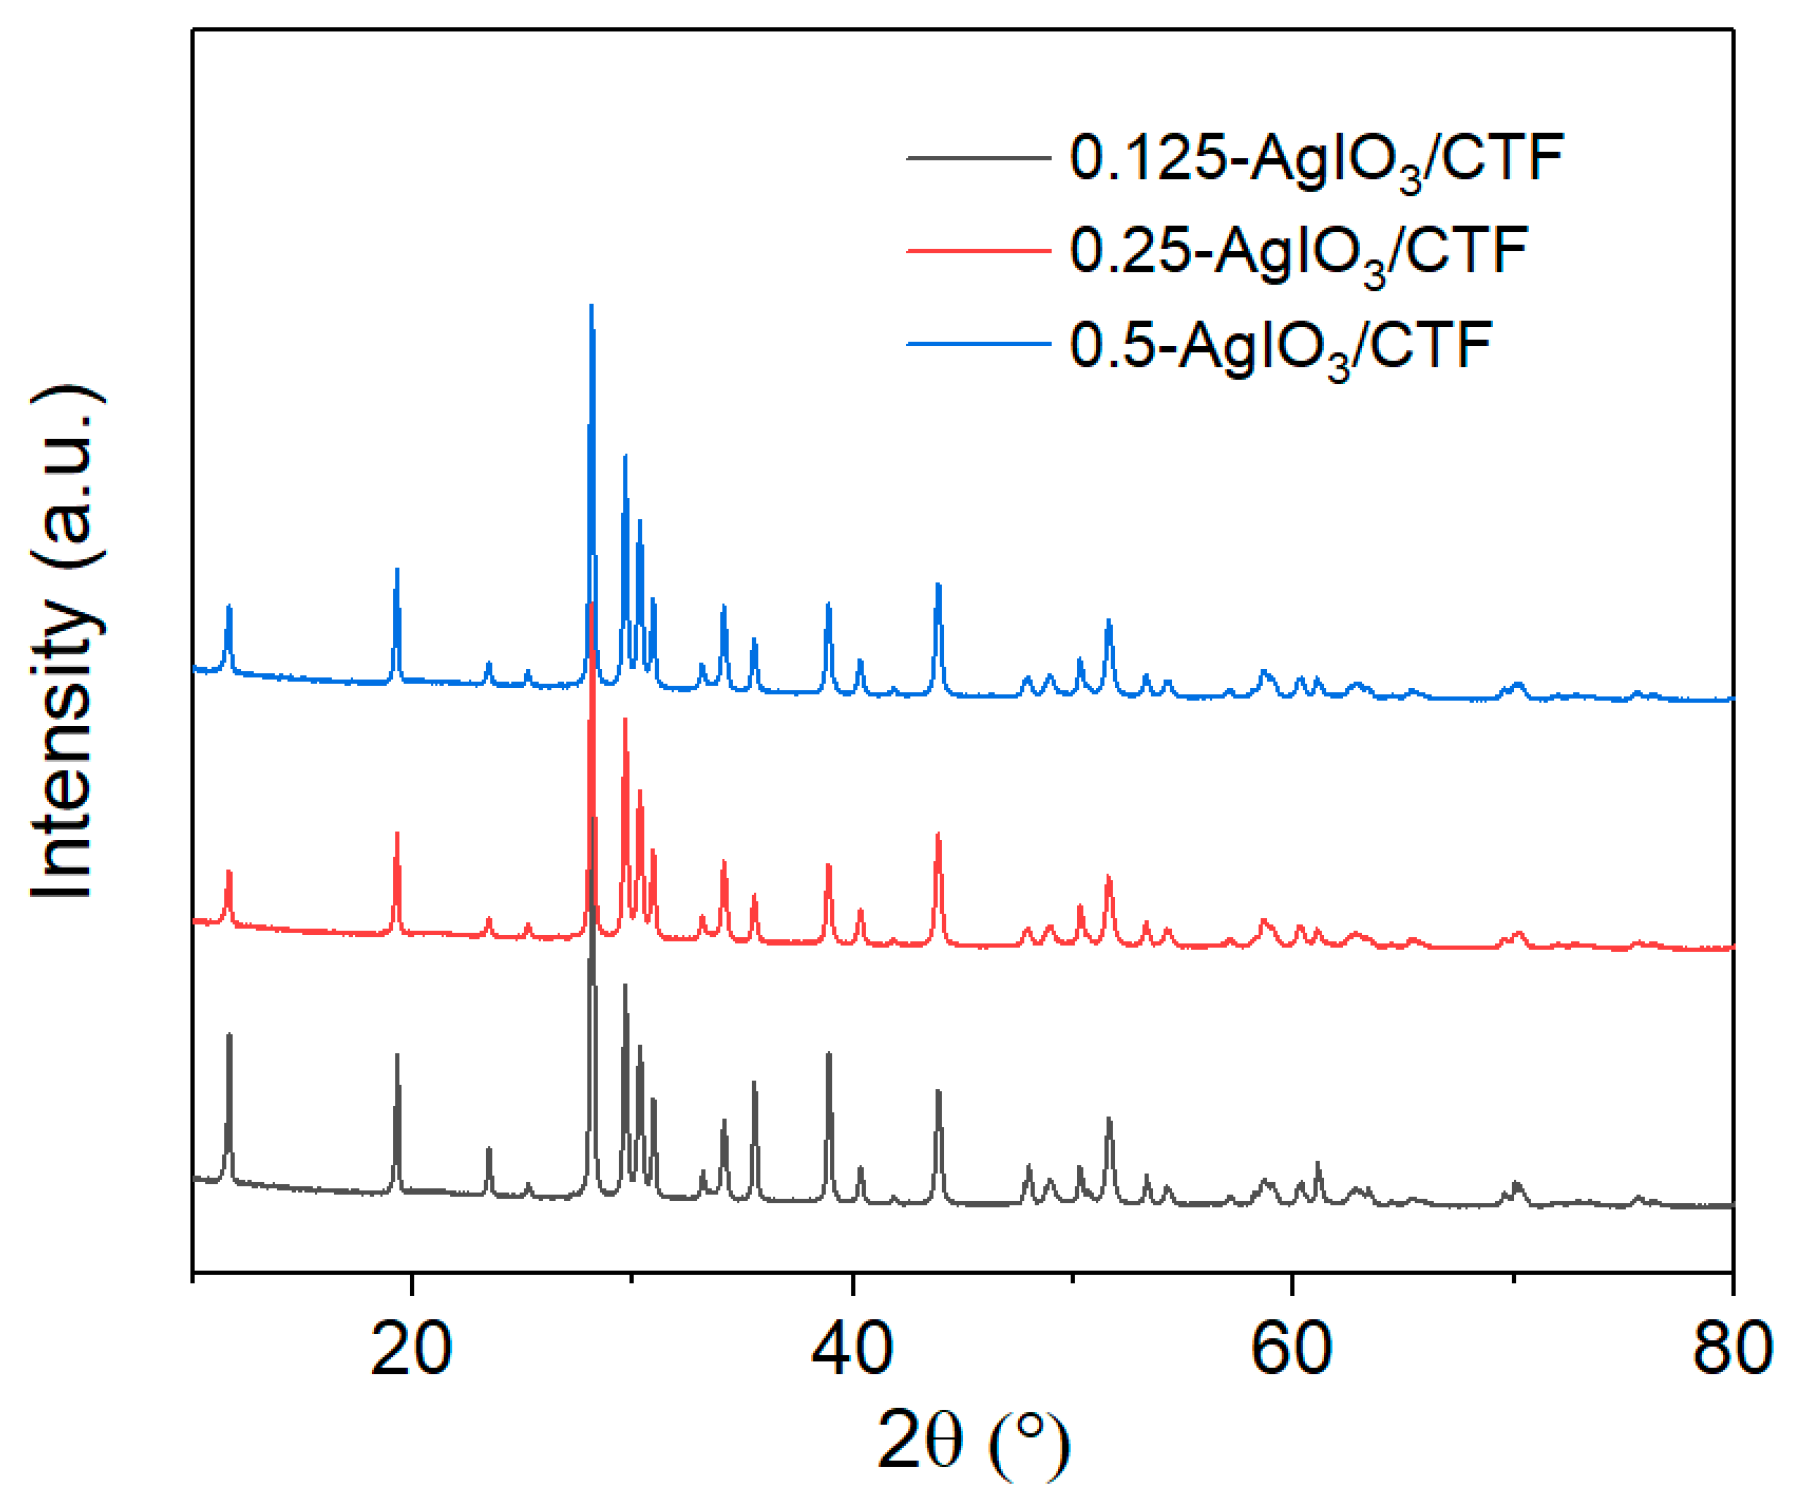
Figure 4.
UV–vis absorption spectra of CTF and x-AgIO3/CTF.
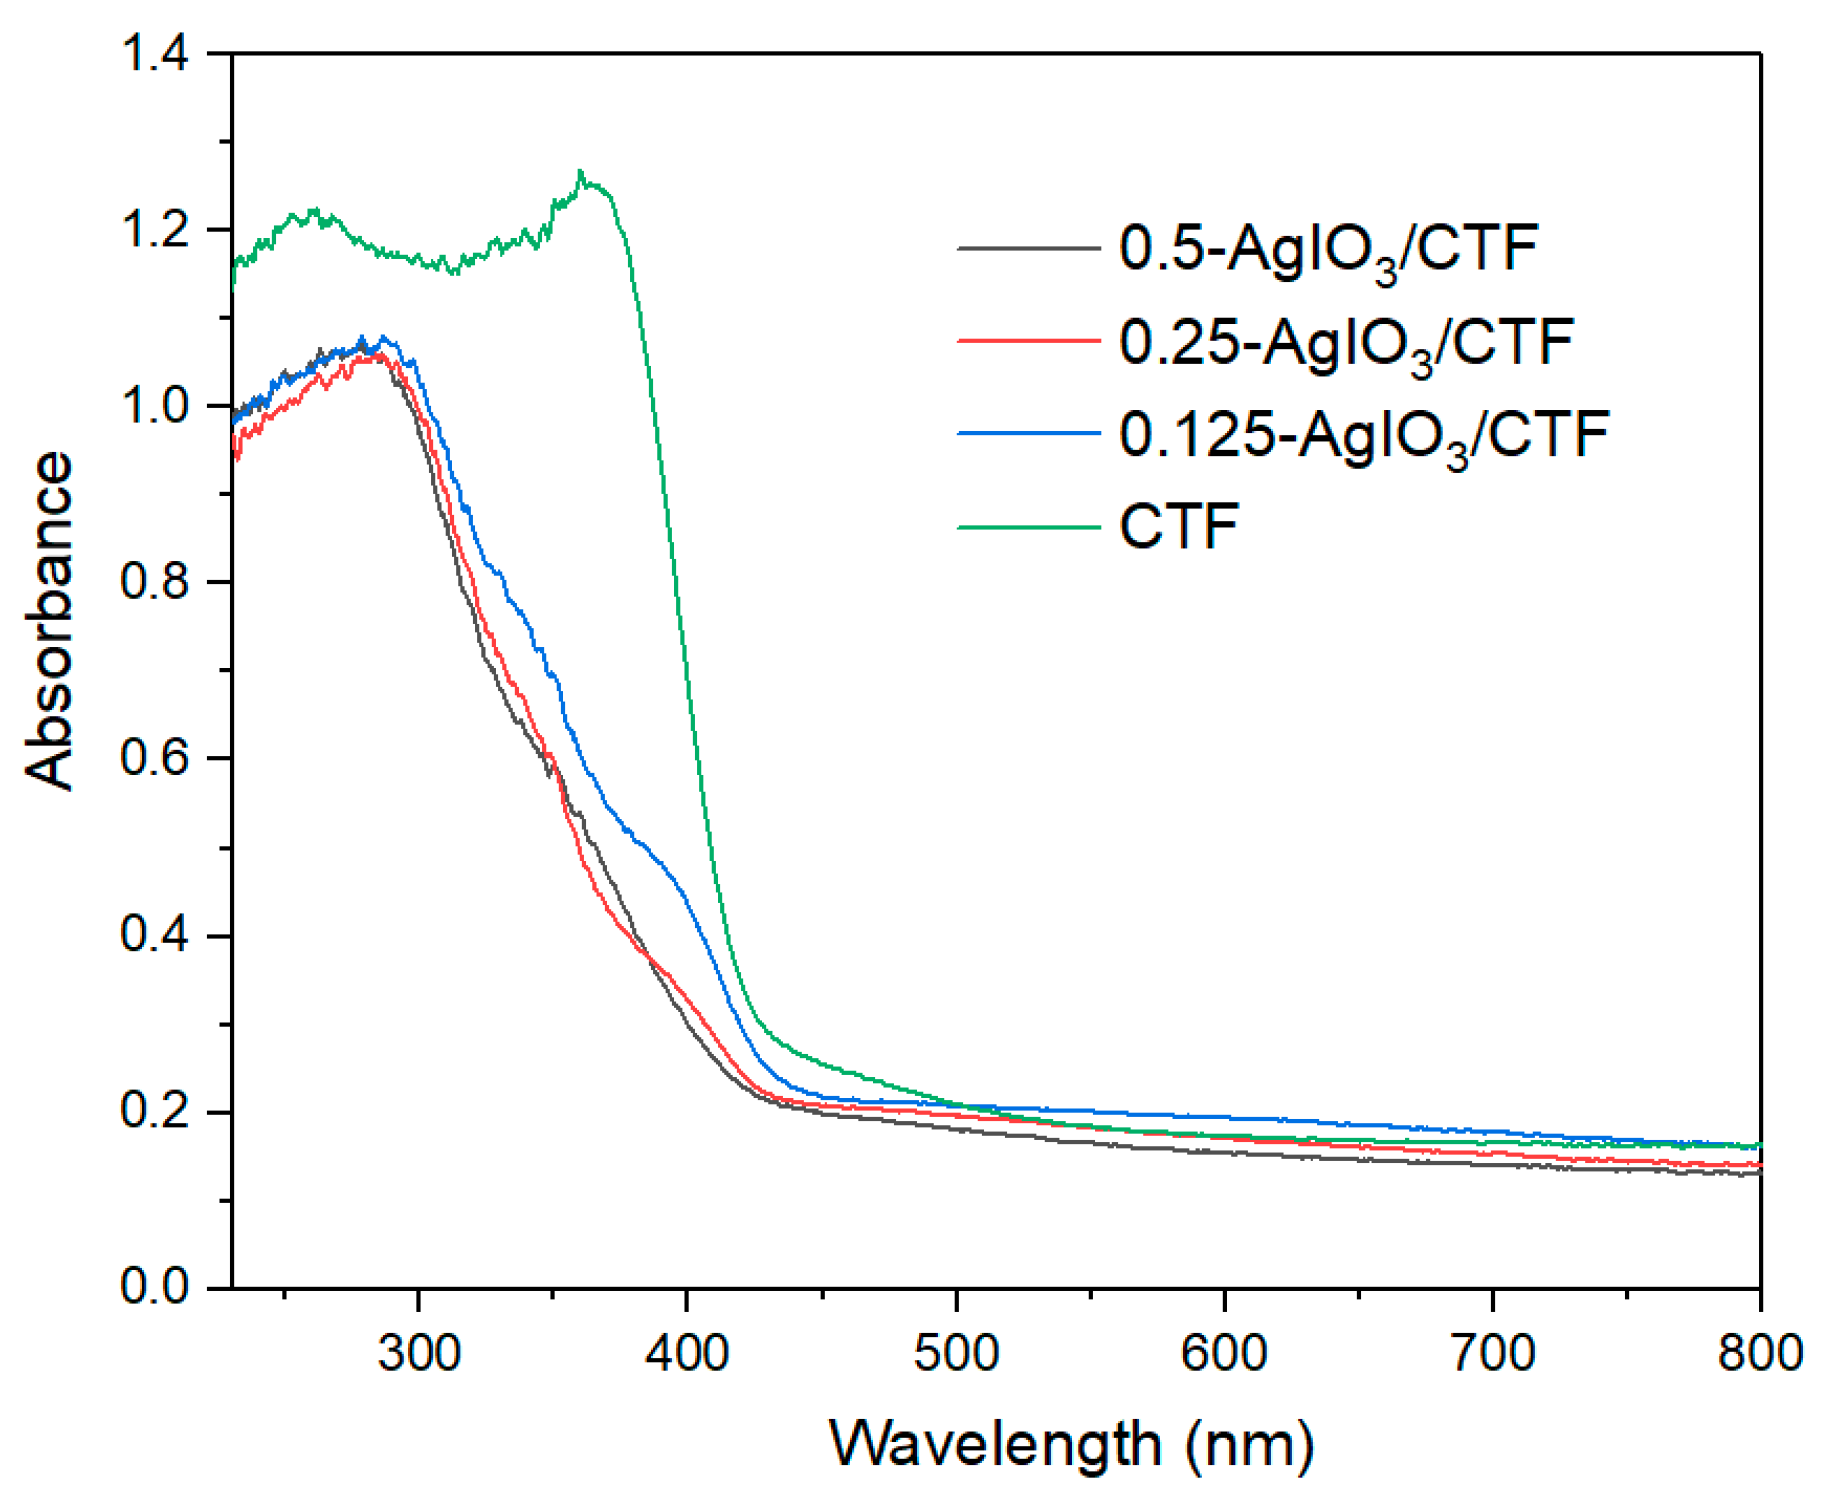
Figure 5.
FTIR spectra of x-AgIO3/CTF.
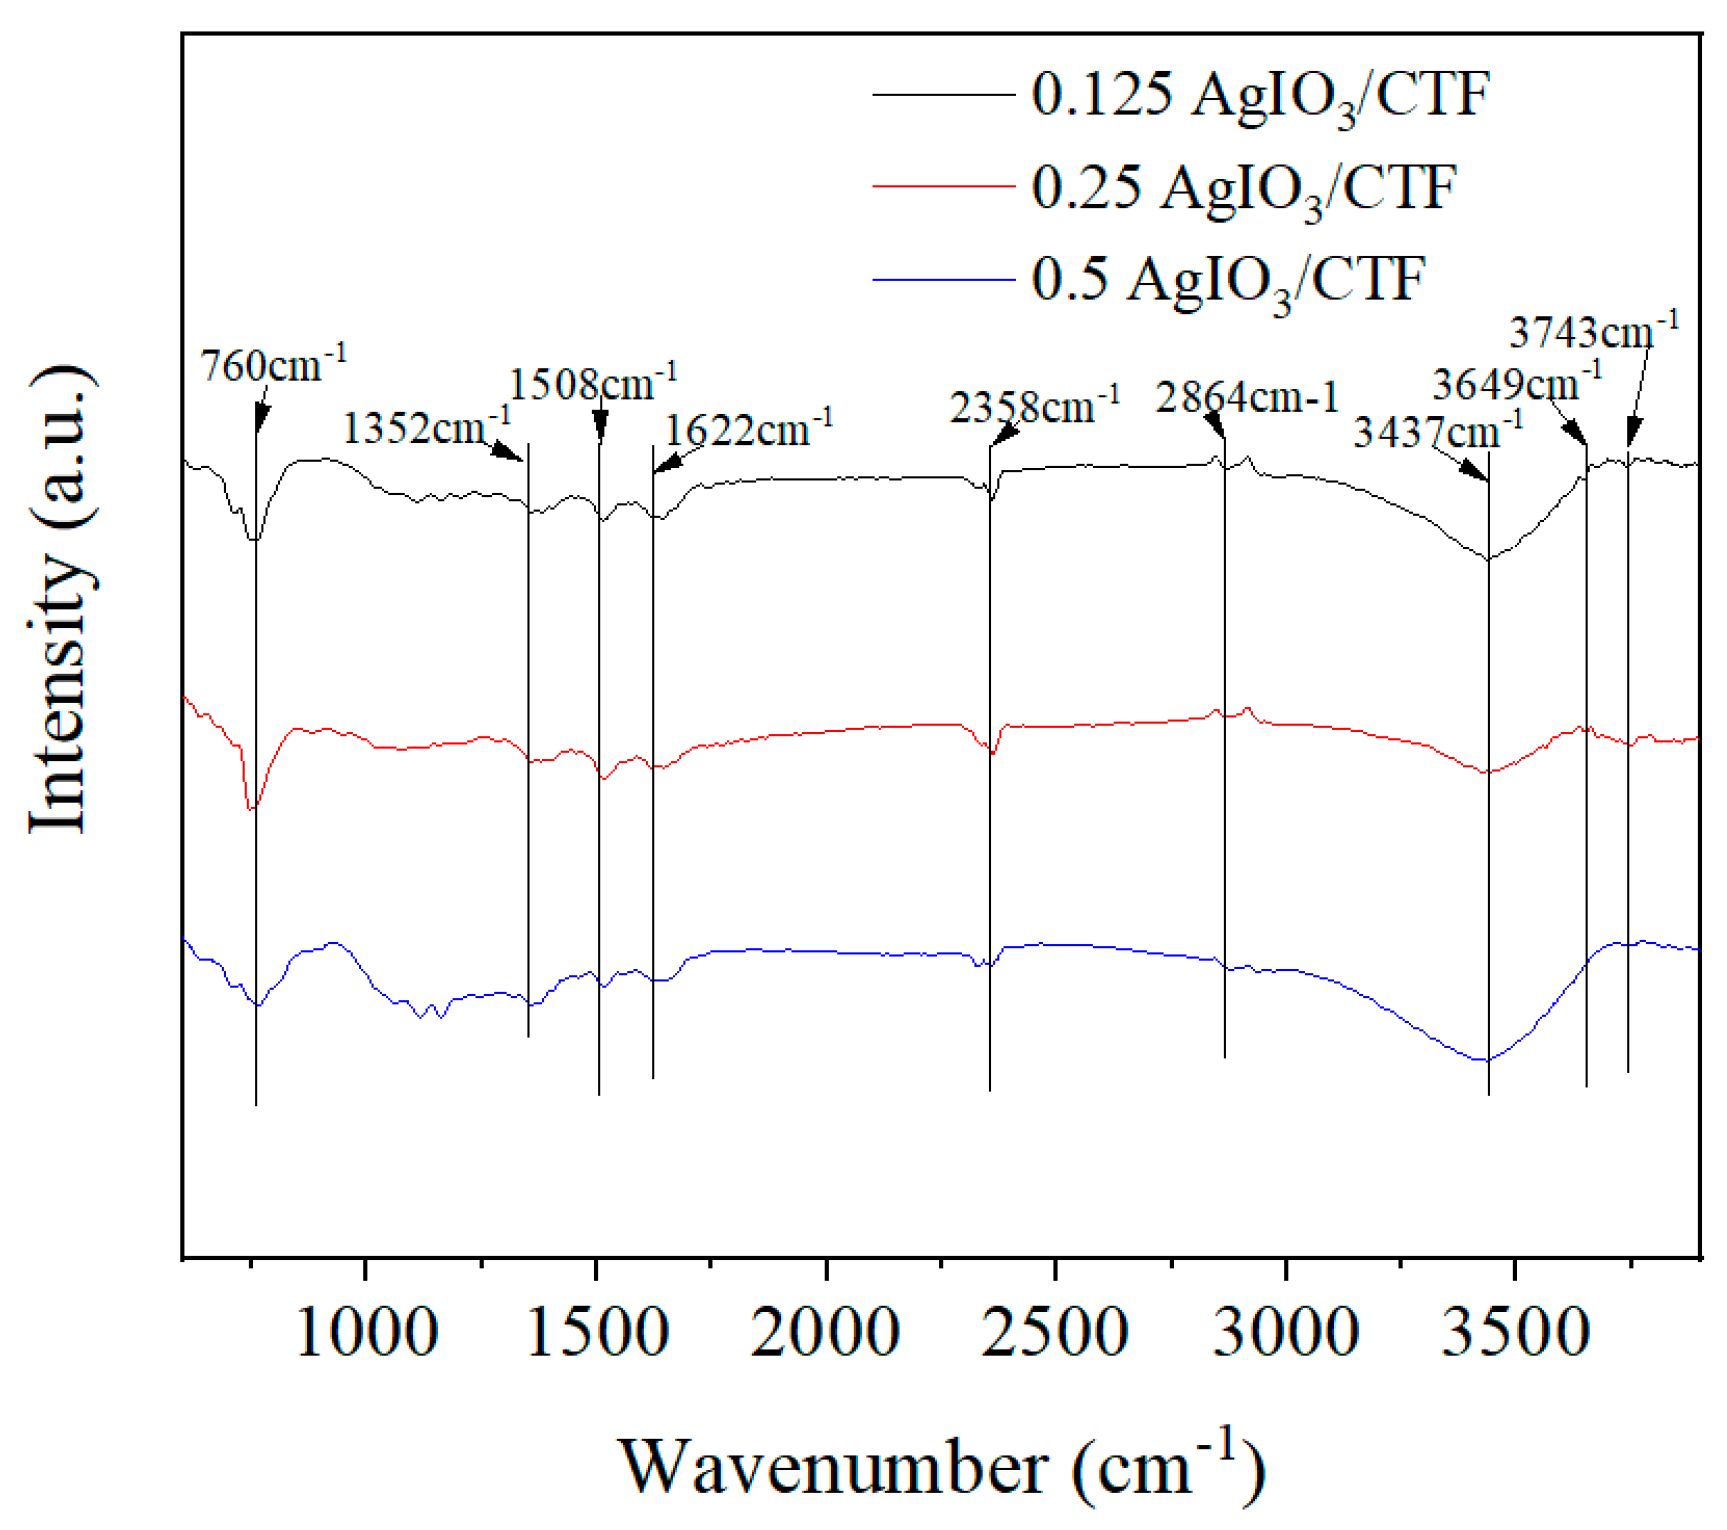
Figure 6.
XPS spectra of (a) 0.25AgIO3/CTF, (b) C 1s, (c) N 1s, (d) O 1s, (e) I 3d, and (f) Ag 3d.
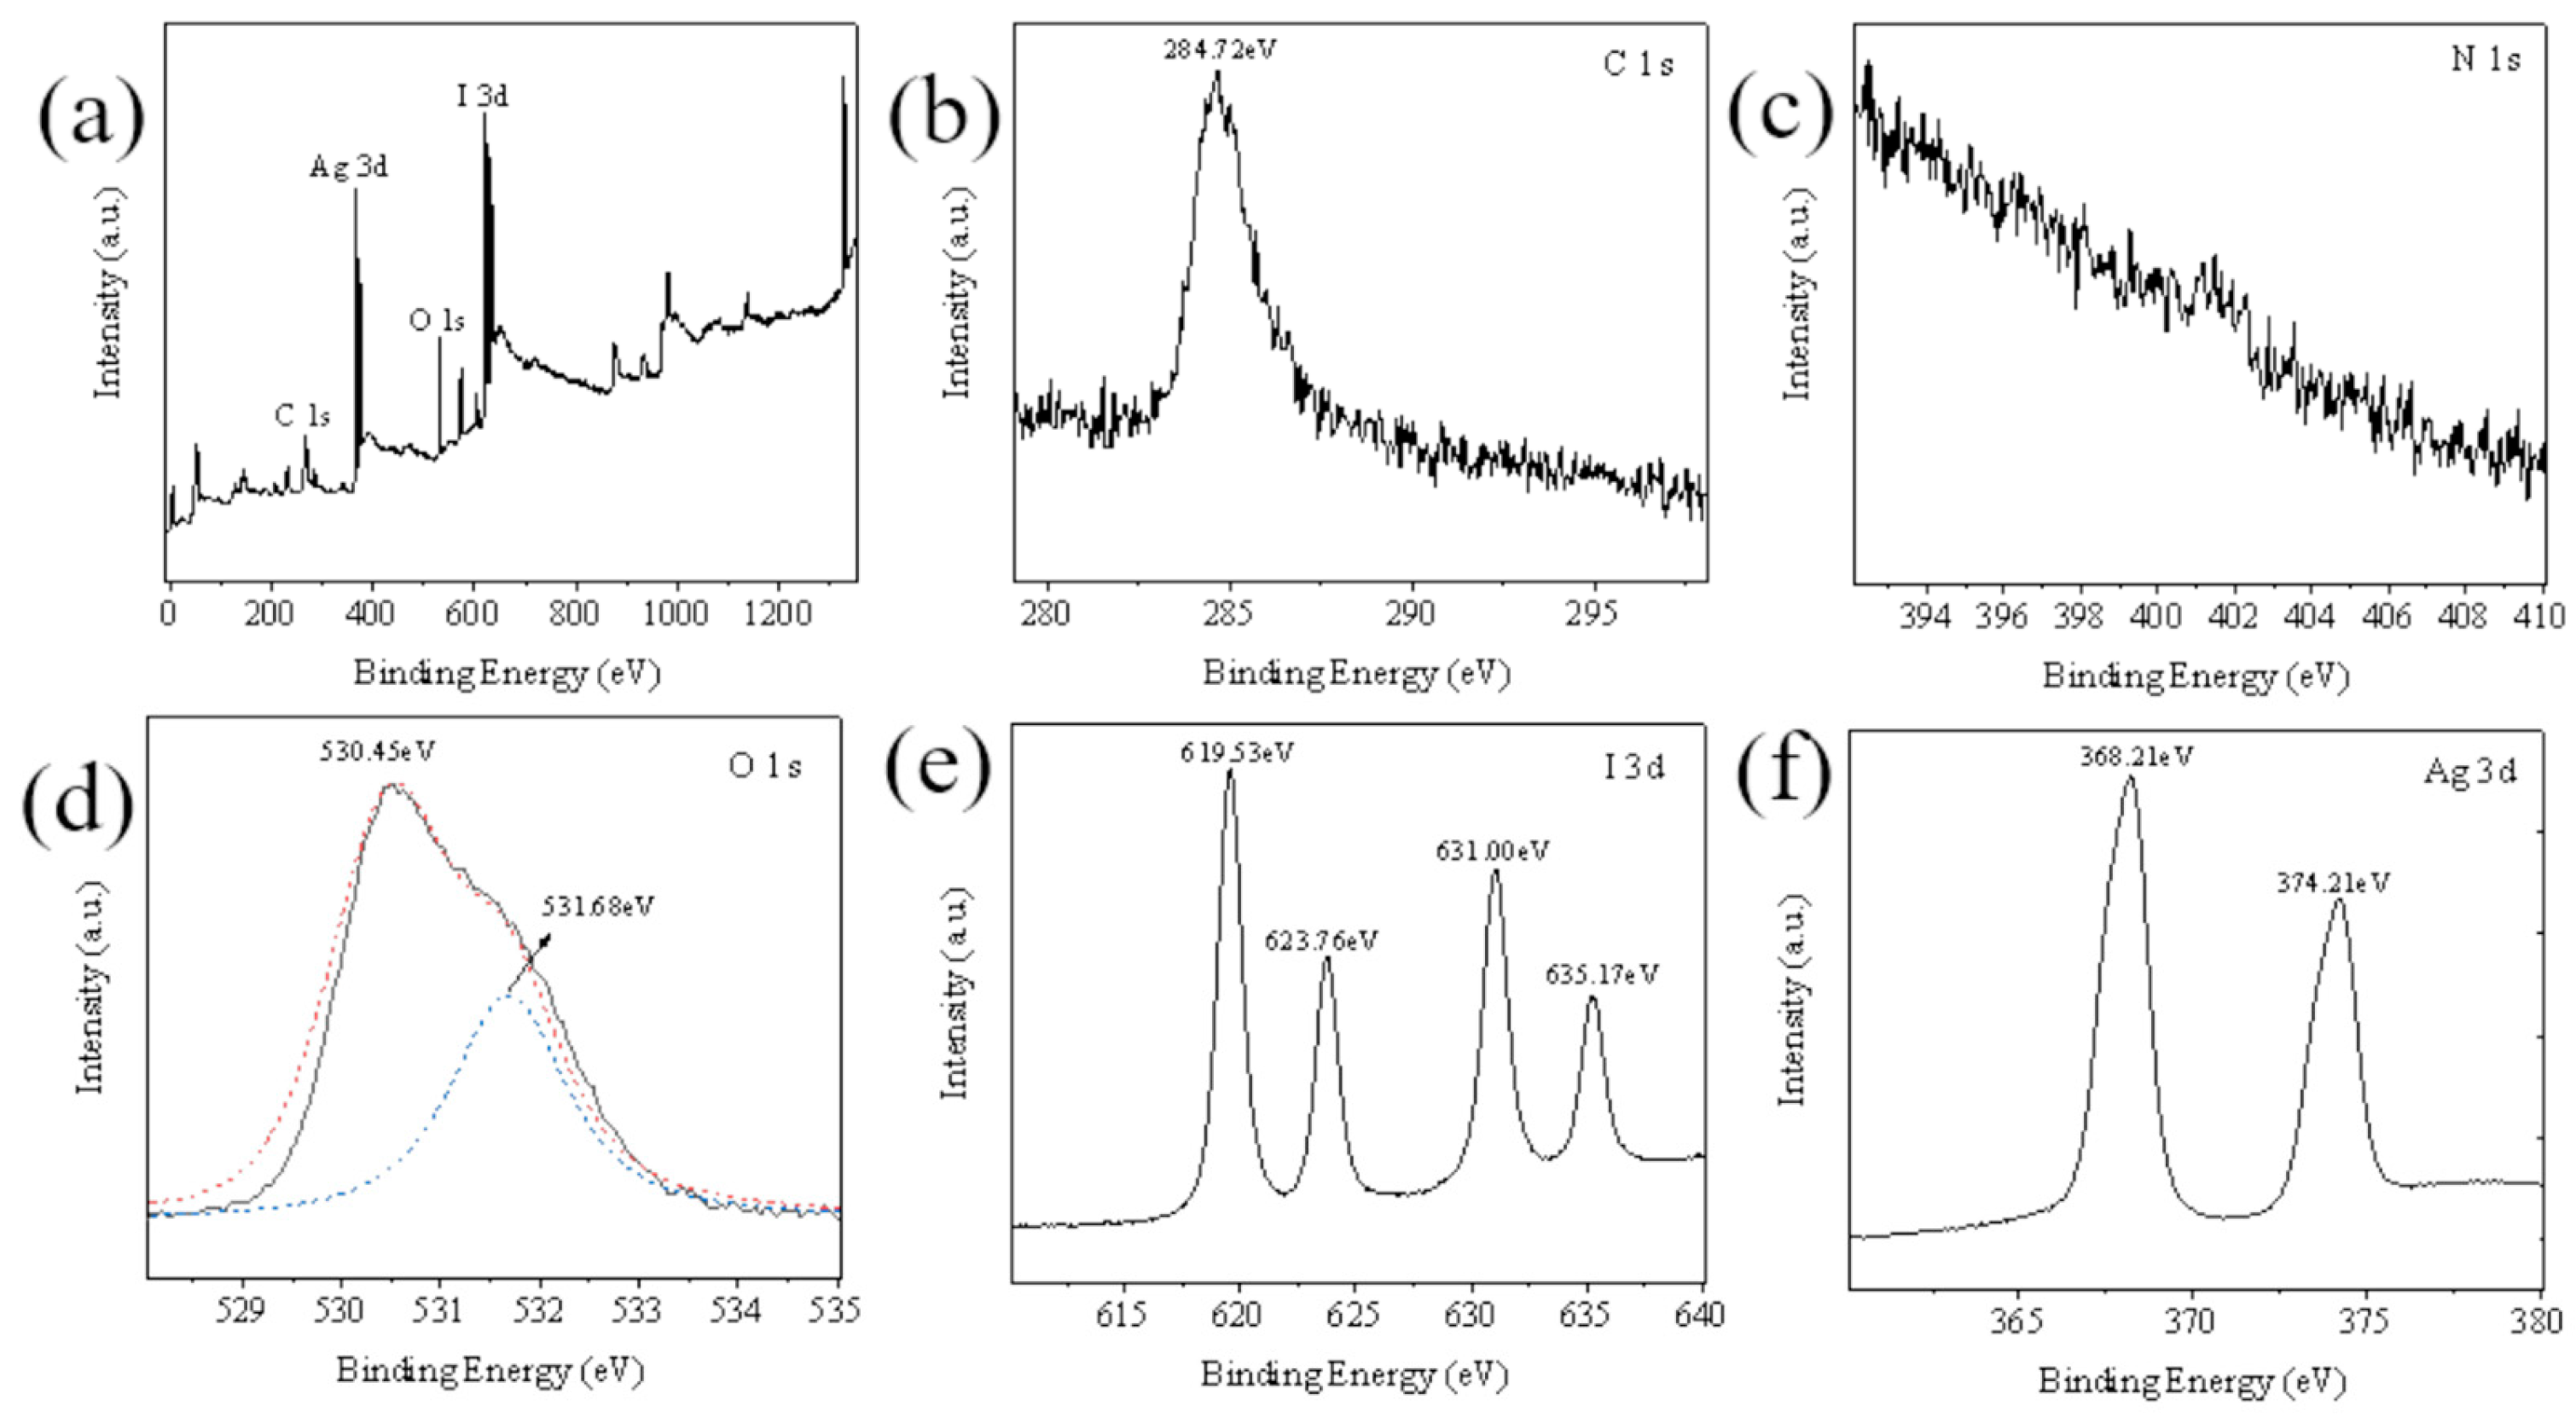
Figure 7.
EPR spectra of AgIO3 and 0.25AgIO3/CTF using DMPO as the spin-trapping agent in water.
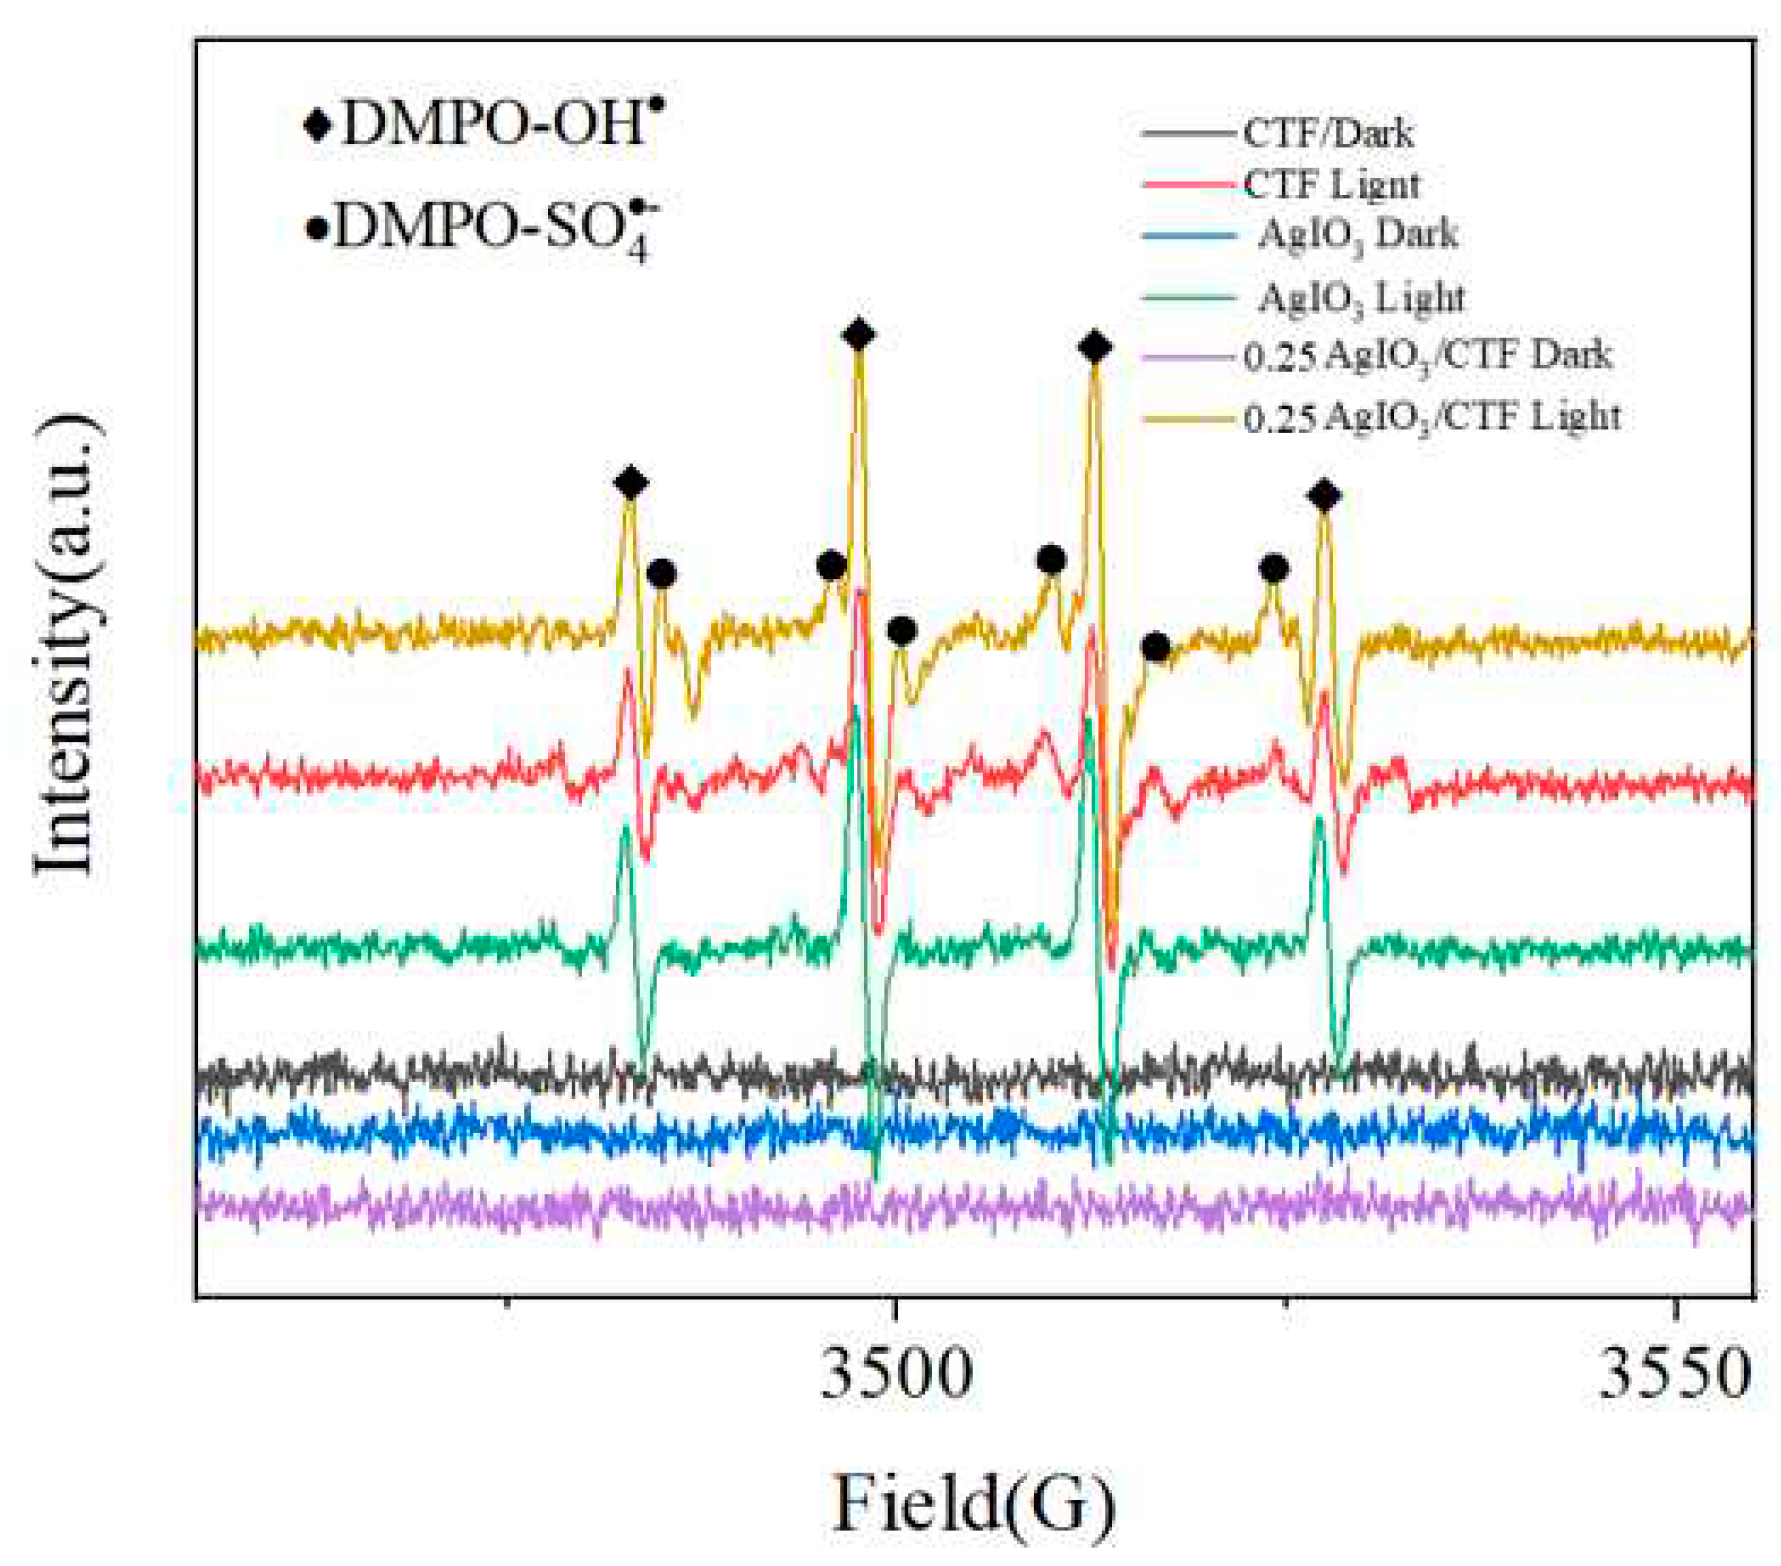
Figure 8.
Inhibiting effects of quenching agents on carbamazepine degradation in 0.25AgIO3/CTF/vis/PMS system.
Figure 8.
Inhibiting effects of quenching agents on carbamazepine degradation in 0.25AgIO3/CTF/vis/PMS system.

Figure 9.
Stable photoluminescence spectra of CTF, AgIO3 and x-AgIO3/CTF.
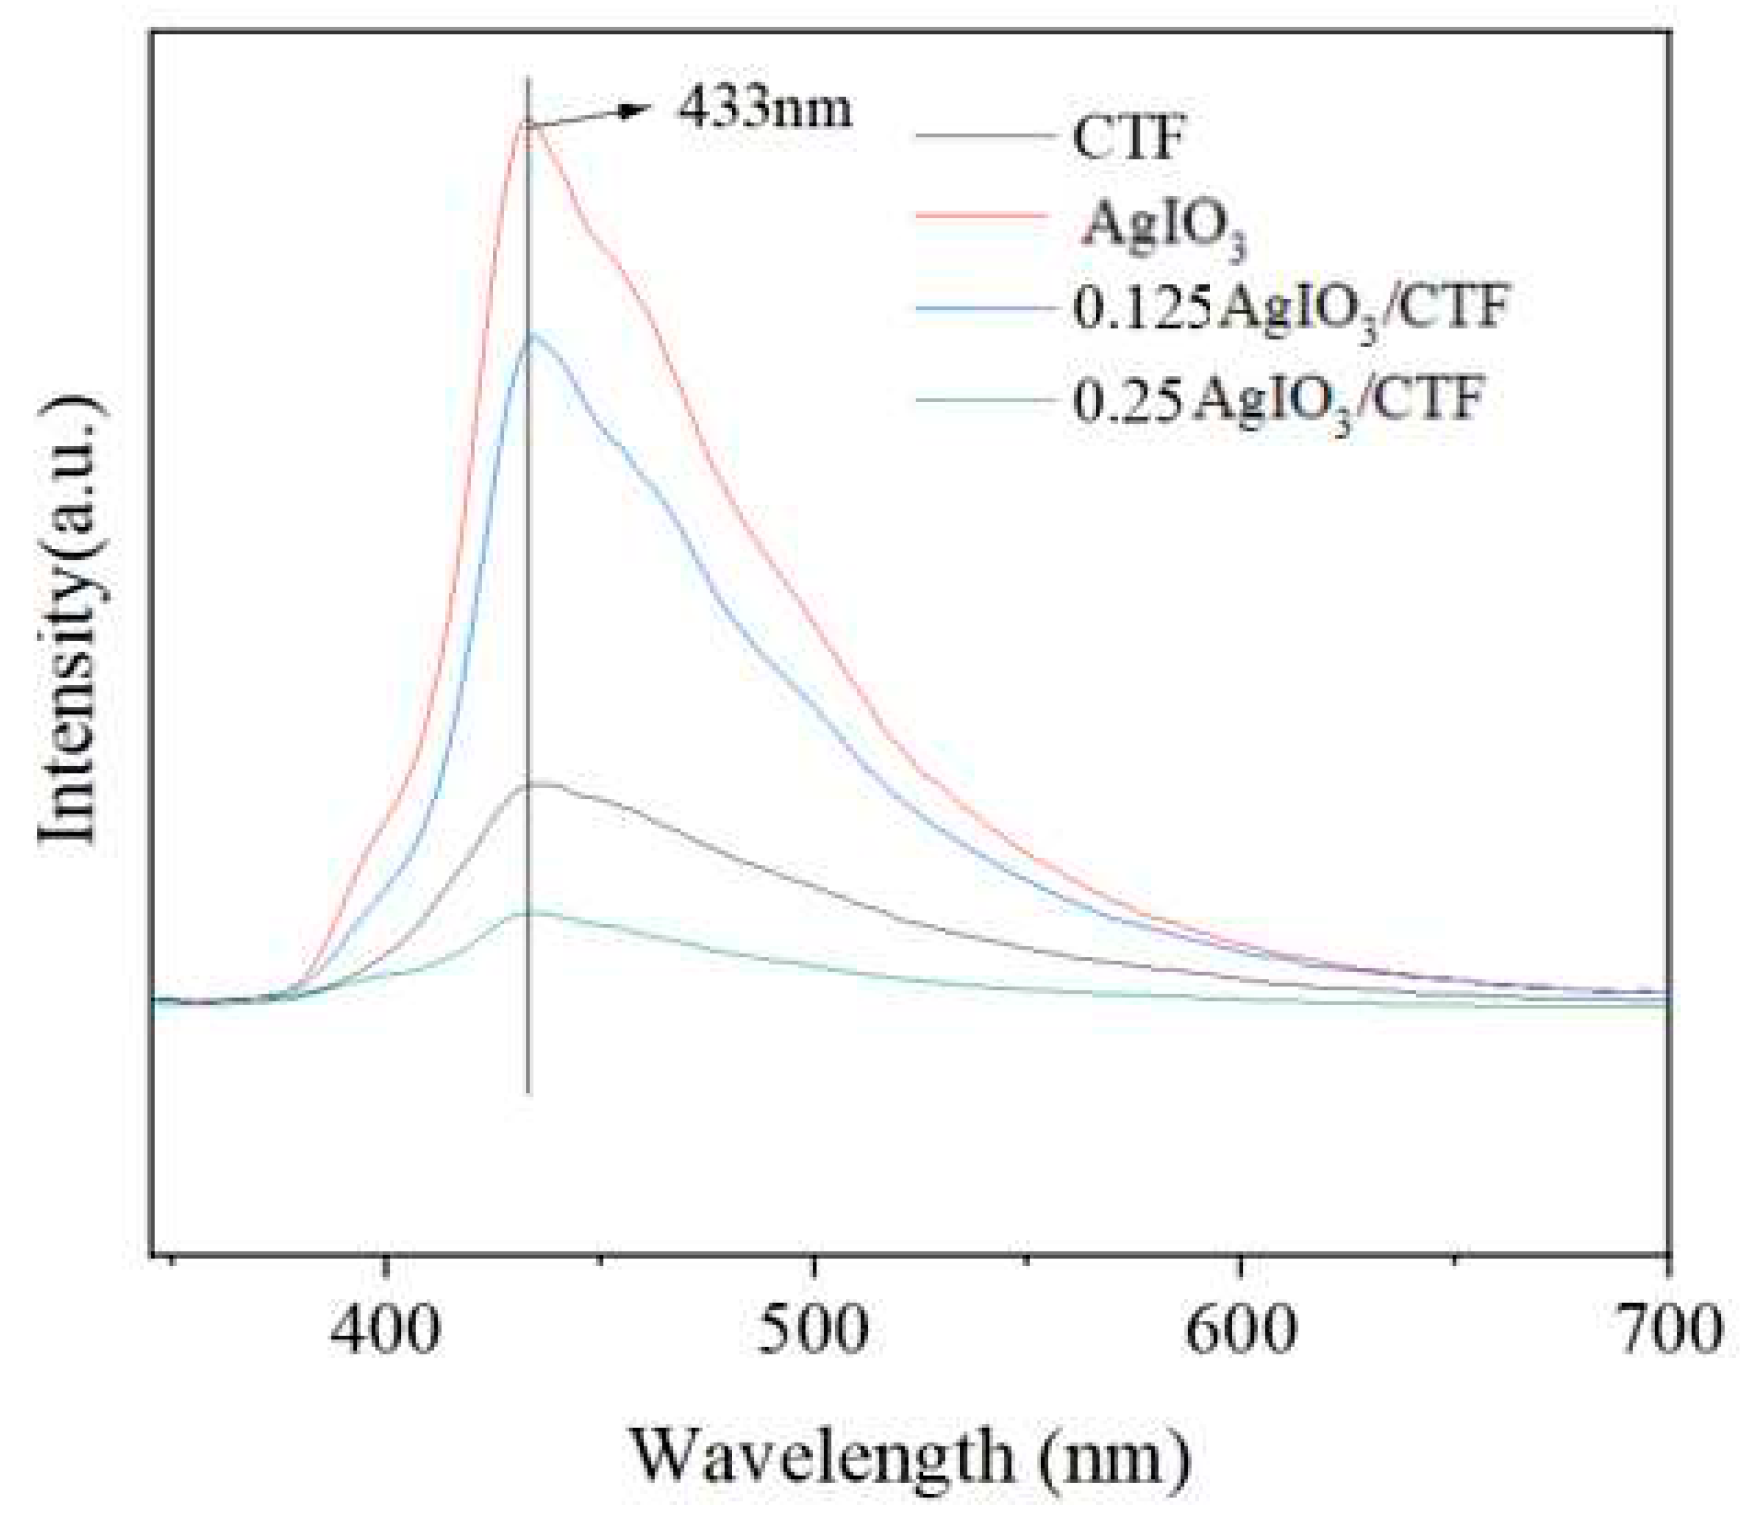
Figure 10.
Degradation of different organic pollutants by photocatalysts/PMS/vis system (a) phenol, (b) p-chlorophenol, (c) carbamazepine, and (d) paracetamol.
Figure 10.
Degradation of different organic pollutants by photocatalysts/PMS/vis system (a) phenol, (b) p-chlorophenol, (c) carbamazepine, and (d) paracetamol.
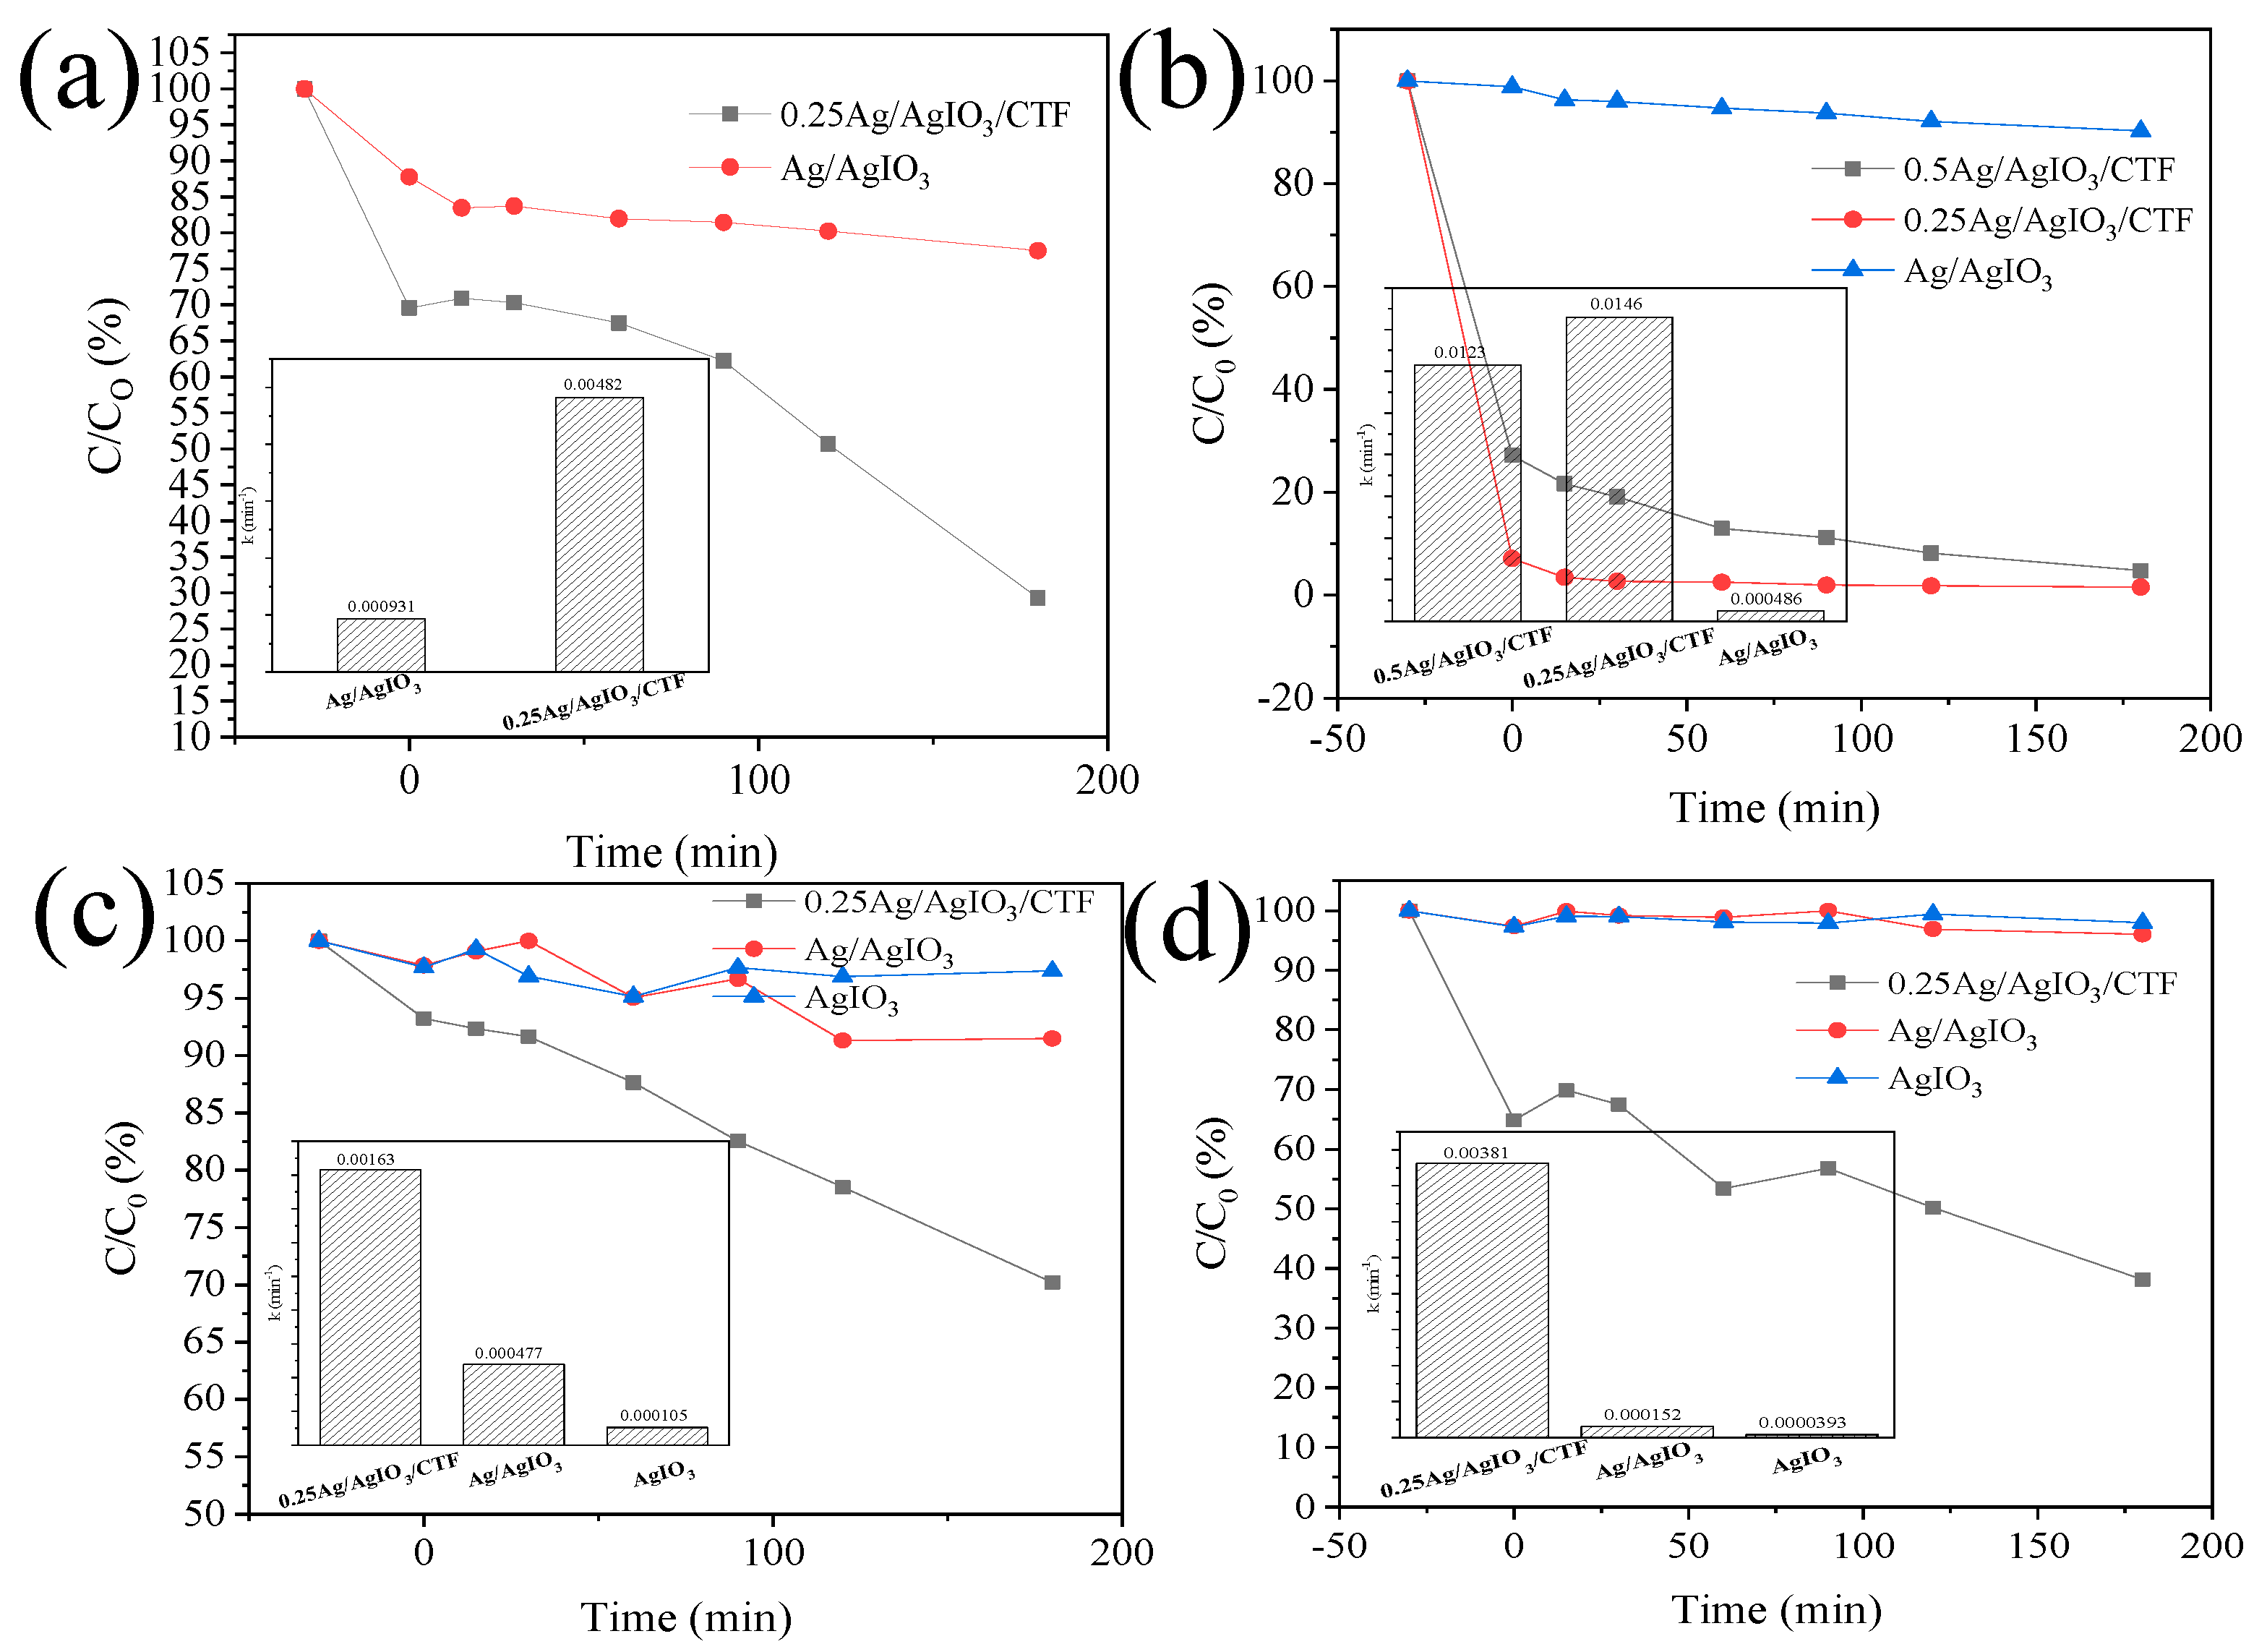
Figure 11.
Periodic ON/OFF photocurrent response of CTF, AgIO3 and 0.25AgIO3/CTF.
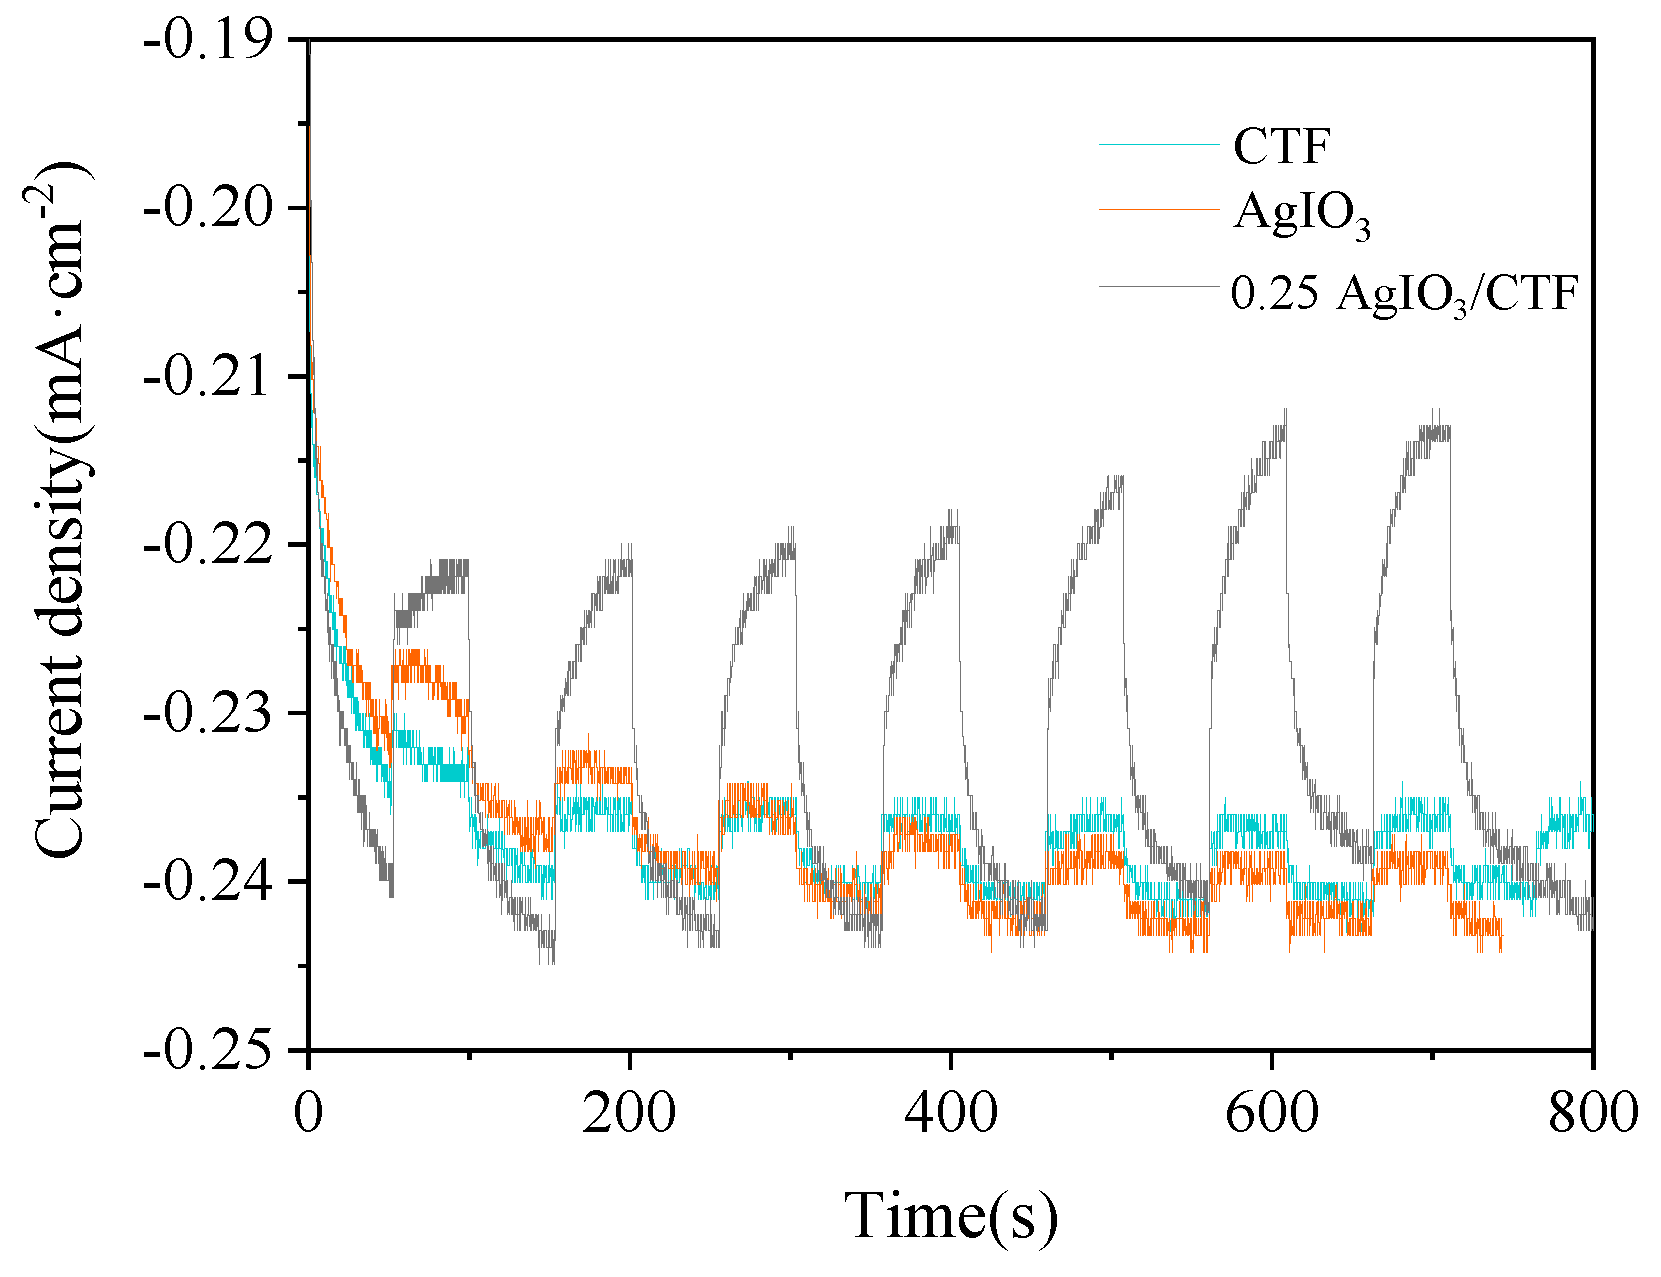
Figure 12.
EIS Nyquist plots measured under the open-circle potential of CTF, AgIO3 and 0.25AgIO3/CTF.
Figure 12.
EIS Nyquist plots measured under the open-circle potential of CTF, AgIO3 and 0.25AgIO3/CTF.
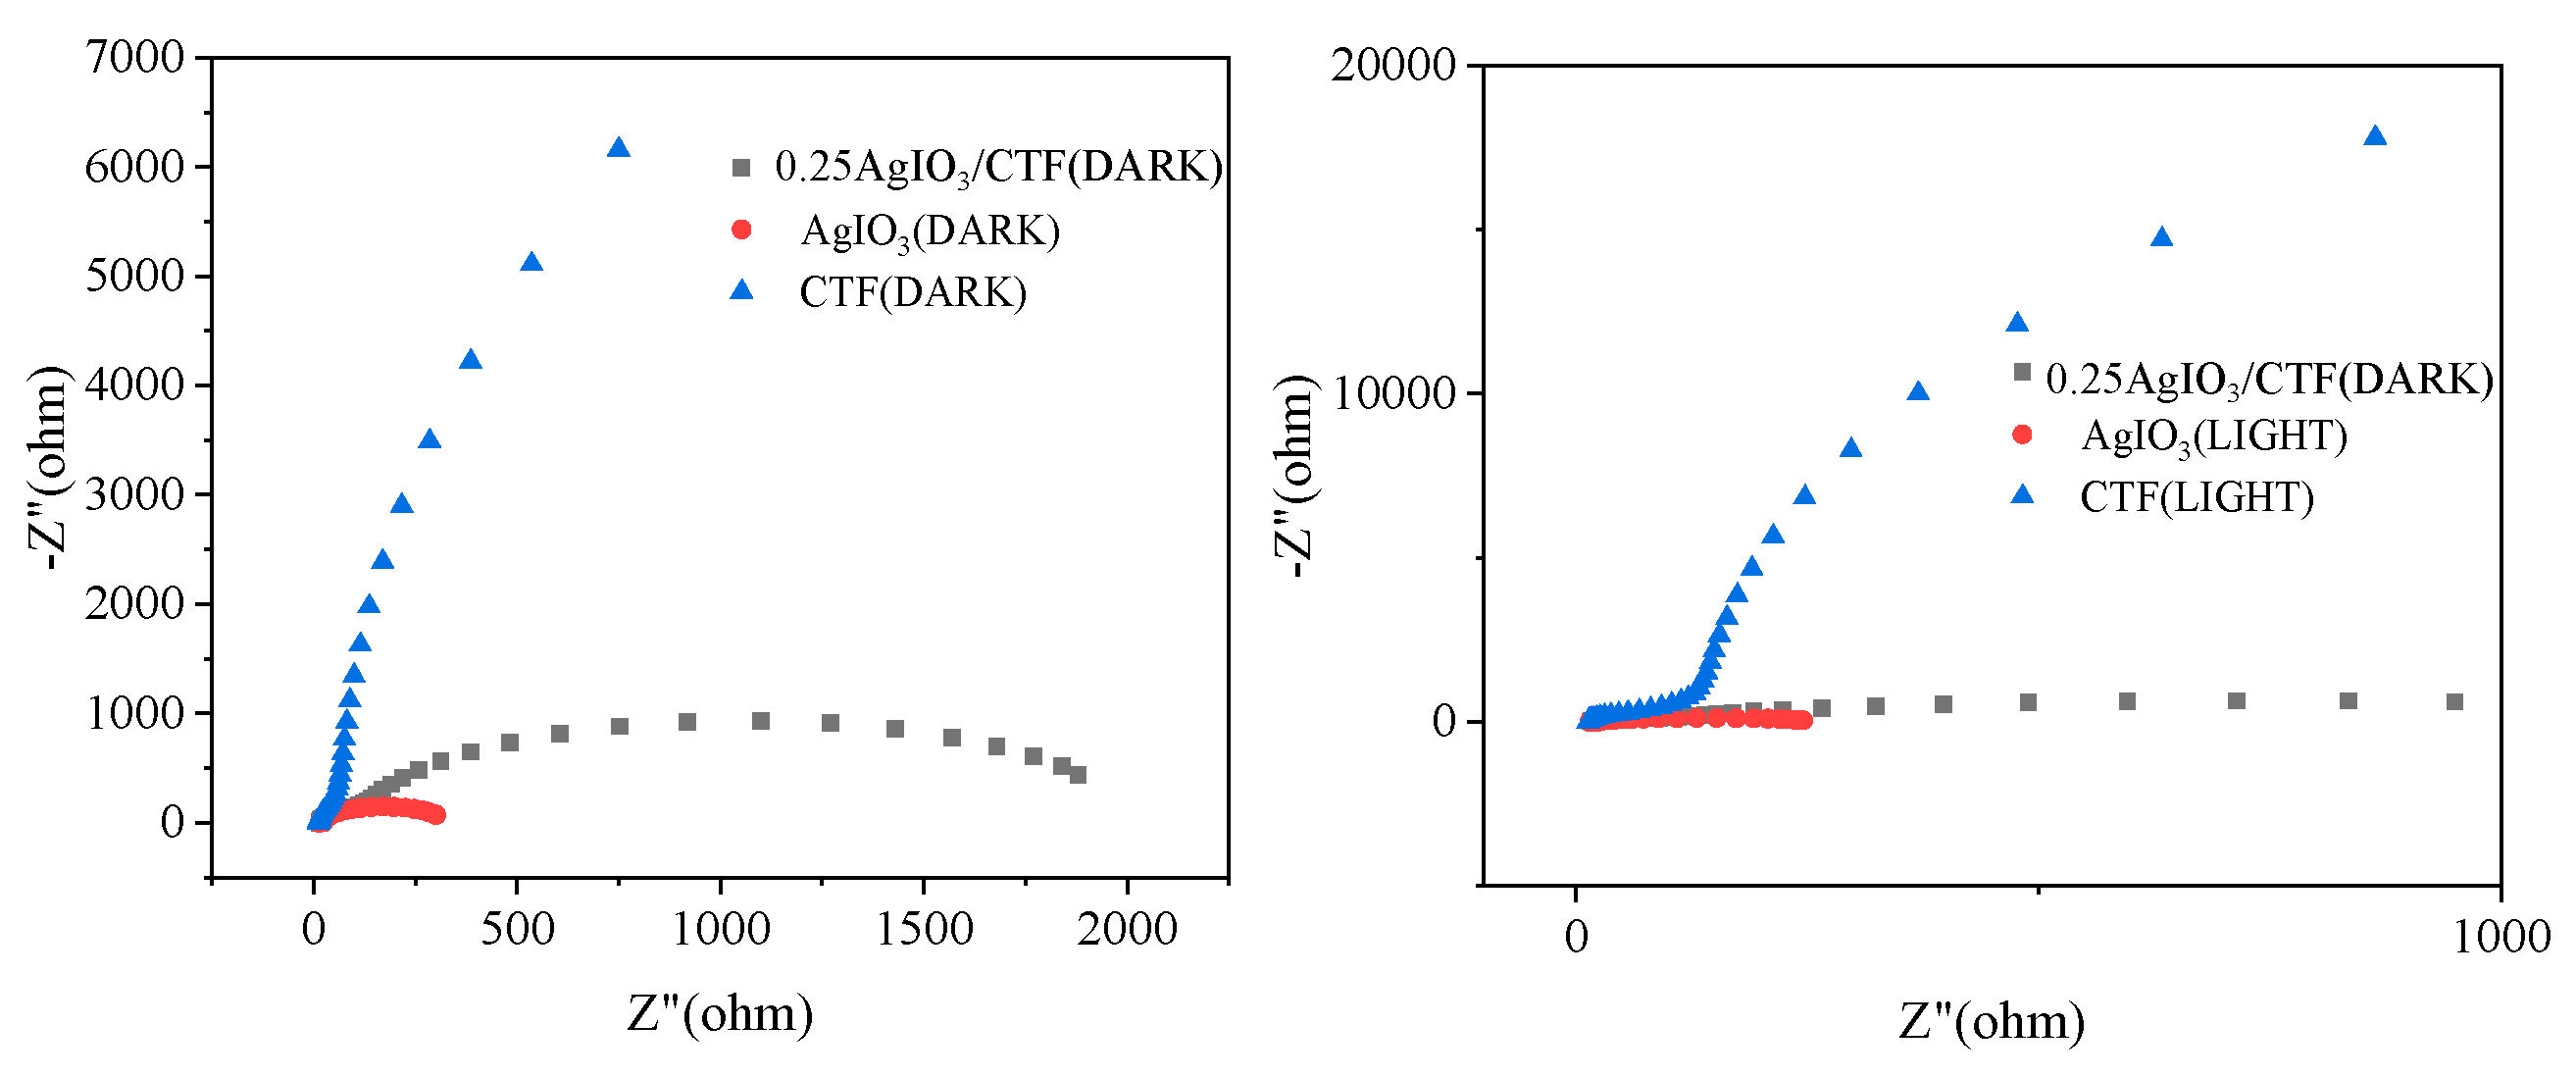
Figure 13.
Mott-Schottky plots spectra of CTF, AgIO3 and 0.25AgIO3/CTF.
Scheme 1.
A schematic representation of the CTF/AgIO3 heterojunction photocatalyst adsorption-photocatalytic degradation of organic pollutants.
Scheme 1.
A schematic representation of the CTF/AgIO3 heterojunction photocatalyst adsorption-photocatalytic degradation of organic pollutants.
Disclaimer/Publisher’s Note: The statements, opinions and data contained in all publications are solely those of the individual author(s) and contributor(s) and not of MDPI and/or the editor(s). MDPI and/or the editor(s) disclaim responsibility for any injury to people or property resulting from any ideas, methods, instructions or products referred to in the content. |
© 2023 by the authors. Licensee MDPI, Basel, Switzerland. This article is an open access article distributed under the terms and conditions of the Creative Commons Attribution (CC BY) license (http://creativecommons.org/licenses/by/4.0/).
Copyright: This open access article is published under a Creative Commons CC BY 4.0 license, which permit the free download, distribution, and reuse, provided that the author and preprint are cited in any reuse.


