Submitted:
05 December 2023
Posted:
06 December 2023
You are already at the latest version
Abstract
This study assessed the perception and use of digital applications for soil fertility management and conservation strategies among small-scale crop farmers in southwest Nigeria. A total of 376 farmers were randomly selected across the six southwest states. The data collected were analyzed using descriptive statistics and Logit regression. Majority of the farmers relied on perception and other non-conventional approaches such as the appearance of weeds and performance of crops in the previous season to assess soil fertility. Only 1.1% and 0.3% of the farmers assessed soil fertility through soil test and digital application respectively. Most farmers adopted bush fallowing and the use of inorganic fertilizer to improve soil fertility. Although, 4.8% of the farmers indicated that they had digital application on their mobile phones, only 2.9% reported to have used such. More than half (56.4%) of the famers stated that lack of awareness of the existence of digital application and internet enabled telephones were reasons they have not been able to use digital applications. Majority of the farmers (97.3%) indicated their willingness to embrace the use of new farm decision digital application which can provide more information especially on soil fertility if introduced. Logit model results revealed that literacy level, membership of farmers’ association and extension contact significantly increased the likelihood of willing to use soil digital application, but older farmers are less likely to use digital application.
Keywords:
Digital soil mapping
; smallholder farmers
; Soil conservation
; Soil fertility
; soil information system
1. Introduction
Soil, which is the unconsolidated material covering most of the land surface, comprises both inorganic particles and organic matter. It serves as a crucial source of water and nutrients for plant growth and provides structural support for agriculture. The chemical and physical properties of soil can vary significantly depending on its location and composition [1]. Soil fertility plays a vital role in ensuring agricultural productivity, which is essential for achieving food security. In addition to other factors such as rainfall, weed control, and pest management, soil fertility is a critical determinant of crop production and yield [2]. Therefore, proper soil management practices that enhance soil fertility are crucial for sustainable agriculture and food security.
There has been an increasing human population and competing demand for land. The increased population has increased the demand for land, housing, road network, telecommunication, and industrial development. Yet, land is fixed in supply. The forgoing makes effective use of available land and indeed land management imperative. Land management is the act of judicious utilization and maintenance of land resources. Land resources are used for various purposes which may include agriculture, afforestation, management of water resource and eco-tourism projects. To ensure effective land management and facilitate its usefulness for farming activities in Nigeria, conscious efforts are needed to be made especially using emerging cutting-edge technologies such as the application of Artificial Intelligence (AI) to soil fertility and conservation management in Nigeria.
Soil fertility refers to the inherent ability of soil to provide crops with adequate supply of nutrients in the right quantities and proportions. It also encompasses the capacity of the soil to sustain the production of economically valuable crops while maintaining soil health without degradation, which ultimately determines the level of crop yields [3]. Effective soil management practices are crucial for optimizing soil fertility and maximizing land productivity and their importance has become increasingly apparent in the face of growing concerns about food security, climate change, and environmental degradation. Such practices are typically oriented towards long-term use and aimed at safeguarding the soil against nutrient depletion and ecological or human-induced degradation [2]. The removal of crops without replenishing the soil with residues such as stalks or by burning plant residues can result in soil nutrient depletion, leading to low crop yields and food insecurity [4]. Therefore, proper soil fertility management strategies are essential to ensure sustainable agriculture and food security. Soil fertility degradation is often acknowledged as a deceptive and slow process, yet farmers' perceptions of the significant of the problem and yield losses associated with soil degradation are critical in influencing adoption of soil fertility enhancing practices [5].
Soil mapping is the process of delineating natural bodies of soil, classifying and grouping the delineated soils into mapping units, and capturing soil information for interpreting and depicting soil spatial distribution on a map. Furthermore, digital soil mapping (DSM) is the computer-assisted production of digital maps of soil types and soil properties. Major advantage of DSM is to obtain real-time information about the soil in a given location. This facilitates farmers’ decisions and impacts positively on agricultural production and productivity.
To interface scientific research with human users of invented technology, there is the need to assess the human components of DSM and associated behavioural issues. The bulk of food crops that are consumed locally and beyond in southwest Nigeria is provided by the arable crop farmers. Hence, they play important role in the food security within the country and to other neighbouring countries [6].
Soil fertility management and conservation strategies are critical for sustainable agriculture and food security in Nigeria, particularly for small-scale farmers who rely on rain-fed agriculture and often have limited access to external inputs. However, the adoption of these practices depends on the farmers' perception, which is mostly determined by farmers knowledge, perhaps, from formal education, experience or through the use of decision aiding devices where available and adopted. Considering the level of internet penetration in Nigeria which is put at 55.4% at the beginning of 2023 [7], the increasing use of internet enabled mobile phones and the proliferation of activity decision application, it becomes imperative to initiate a research with the aim of assessing the use of, and/or, potentials of digital application to farmers’ perception and management of soil fertility, and willingness to use such application.
In Nigeria, the majority of farmers are smallholders who depend on rainfed agriculture and have limited access to information on soil fertility management practices. However, recent advances in digital soil information systems, including the use of artificial intelligence, have the potential to revolutionize soil management by providing real-time information on soil characteristics and management practices.
Obviously, little or nothing is known about the approaches local farmers adopt to improve soil fertility, desire to adopt the use of farming related digital application among others. The present study was therefore conceptualized to address this obvious knowledge gap. Therefore, the study aimed at achieving some key objectives which were to describe the levels of existing knowledge of smallholder farmers about soil fertility, management, and conservation practices; describe areas of soil fertility management where farmers require training; examine farmers’ awareness and use of digital applications in farm decision making; assess farmers’ willingness to use a new digital application; determine factors affecting farmers’ decision to use new digital applications and to assess the existing level of productivity of smallholder farm enterprises in the study area. The second part of this paper describes the methodology adopted for the study. The third section presents results and discussion on the subject matter while the last section summarized and concluded accordingly.
2. Methodology
2.1. Study Area
The study was carried out in southwest Nigeria. The area was formerly known as Western State until 1976 when it was further divided into 3 states. Presently, the southwest geopolitical zone of Nigeria consists of six (6) states namely Ekiti, Lagos, Ogun, Ondo, Osun, and Oyo (Figure 1). The six states together have a total of 137 Local Government Areas (LGAs). The region is the ancestral home of the Yoruba ethnic group of Nigeria with different dialects even within the same states. The region lies between longitude 2o311’ and 6o211’ East and latitude 60,211 and 80371’ North with a total land area of 77,818 km2. The weather conditions vary between two distinct seasons; the rainy season spanning March-November and the dry season from November to March. The majority of the people in the region live in rural area and practice farming due to the large expanse of fertile agricultural land consisting mainly of tropical rain forest and some derived savanna land. The study covered all the six states in the region.
2.2. Sampling technique, sample size and method of data collection
Multi-stage sampling involving cluster sampling and simple random sampling was adopted in the selection of farmers from whom data were collected for the study. A total of 376 smallholder crop farmers made up of 41 farmers from Ekiti state, 39 from Ondo state, 53 from Osun state, 104 from Oyo state, 105 from Ogun state and 34 from Lagos state were selected. Sample size was governed by the extent of agrarian community in each state, though security concern during data collection limited the samples that could be covered in Ondo state. Data were collected by personal interview and recording using structured questionnaire from July 26 to August 17, 2022 with the aid of Open Data Kit (ODK). Relevant data were collected on farmers’ knowledge about soil fertility and its management, awareness and use of digital application in soil fertility assessment, areas of soil fertility management where farmers needed training, willingness to use new digital application e.t.c.
2.3. Analytical Techniques
2.3.1. Descriptive statistic
This involved the use of averages, tables of frequencies and percentages in the description of background facts such as basic socioeconomic characteristics, knowledge of soil fertility, conservation strategies, knowledge and use of digital application on the farm etc.
2.3.2. Logit Regression
This was employed to determine factors affecting decision to use digital application for the pooled data covering the six (6) states in the region Therefore, the general form of the Logit regression models estimated is stated thus:
Where Pi =1 if farmer is willing to use digital App and 0 if otherwise. The Xi is the vector of explanatory variables and i in the explanatory variable ranges from 1 to m where m represents the number of explanatory variables in the model. Regressors included were:
X1 = Age of farmer (in years) ; X2 = Gender (dummy variable - male =1, 0 if otherwise); X3 = Marital status (dummy variable – married = 1, 0 if otherwise); X4 = Farmer’s educational level (years spent in school); X5 = Extension Contact (1 if yes, 0 if otherwise); X6 = Membership of farmers’ association (members = 1, 0 if otherwise); X7 = years of farming experience (in years); X8 = Membership of cooperative society (members =1, 0 if otherwise); X9 = Access to credit (1 if famer has access, 0 if otherwise)
2.3.3. Productivity
This was assessed using simple productivity measure such as average production e.g land productivity = Total Product/Land area = Yield
3. Results and Discussion
3.1. Socioeconomic Characteristics of Farmers
Analysis revealed that 10.9% of the selected farmers were from Ekiti State, 10.4% from Ondo state, 14.1% from Osun state, 27.7% from Oyo state, 27.9% from Ogun state and 9.0% from Lagos state (Table 1). Cumulatively, about 80% of the farmers were < 60 years of age and this implied that majority were still economically active. This was further corroborated by the average age of the farmers value of 48.7 years. Majority (67.3%) of the farmers were male as expected. This is more so as it is believed that farming works are tedious and female are generally not molded for such. Only 14.4% of the farmers do not have any form of formal education. This category of farmers may find it difficult to use internet enabled mobile phone and farm decision application. Majority of the farmers claimed not having access to credit for their farming activities. This may be a major impediment to expansion and possible adoption of modern farm practices. In the same vein, majority of the farmers (59.6%) were not members of cooperative societies, but majority (60.1%) were members of farmers’ association. Membership of cooperative societies is expected to enhance access to credit while membership of farmers’ association is expected to enhance technical knowledge of farmers due to opportunities for knowledge sharing. Average years of farming experience among the farmers in the study area was 22.1 years and this is long enough to have acquired sufficient knowledge about farm practices. Extension contacts supposed to provide access to informal education and learning for the farmers and majority (70.5%) claimed having contact with extension agents (Table 1).
3.2. Knowledge of soil fertility and soil management practices
3.2.1. Assessment of soil fertility of the land use for crop farming
Farmers were asked how they assess fertility of their farmlands before planting. A slight majority (51.1%) stated that the appearance of the weed on the land before clearing was a major indicator of the fertility of the soil. Farmers in this category believed that green and fresh weeds were indicators that the soil was fertile while pale green or light-yellow leaves of the weeds on the land indicate that the soil is not fertile. About half (specifically, 50.8%) stated that performance of the crop(s) planted on such farmland in the previous cropping season was a good indicator of the fertility of the soil (Table 2). Unfortunately, farmers in this category did not factor in, or not aware of, the nutrient mining effect of previously harvested crop which would have diminished the soil nutrients. Furthermore, 32.4% stated soil colour and farmers in this group believed that deep colours (such as black or brown or a combination of such) are good indicators of soil fertility. Other identified indicators were fallow period and soil texture. These approaches are known to be very subjective methods of assessing soil fertility. It is worthy of note that only 1.1% and 0.3% of the farmers stated soil test and digital application respectively. The low level of awareness and use of such objective means of assessing soil fertility calls for urgent intervention in the form of extension services to educate small scale farmers on the need to carry out objective rather than subjective assessment of soil fertility before utilizing such farmland for planting. About 7.4% relied on the presence of earthworm cast/fecal deposits and past experience. It should be noted that farmers were not restricted to selecting only one assessment criterion (Table 2).
3.2.2. Improvement of the soil fertility for crop cultivation
Majority of the farmers (56.6%) adopted bush fallowing in a bid to improving soil fertility (Table 2). This is one of the natural means of restoring soil fertility and one of the traditional methods practiced in Africa. This is, however, an unreliable method as competition for land by other non-agricultural uses continues to limit the amount of land available for shifting cultivation. More than half (53.5%) of the farmers also adopt the use of inorganic fertilizers to enhance soil fertility. Other methods stated by farmers were crop rotation (40.2%), mixed cropping (21.8%), application of farmyard manure (15.2%), application of liquid fertilizer (8.8%) etc (Table 2).
3.2.3. Determination of type and quantity of inorganic fertilizers applied on the farm
Farmers who use inorganic fertilizers were asked to state how they determine the type and quantity of inorganic fertilizers they apply on their farms. Some (27.7%) relied on ‘perception and experience’ while some others relied on advice by extension agents (18.6%), physical appearance of the soil (14.4%), performance of crops planted on the land in the last planting season (13.8%) among others (Table 2). It is worthy of note that only 0.5% and 0.27% relied on soil test and digital application respectively to determine the type and quantity of fertilizer applied on their farms. These require urgent intervention to reduce the danger associated with misuse of fertilizer such as soil pollution and ground water pollution.
3.2.4. Awareness, use and availability of organic fertilizer from the farmers’ point of views
Given the possible negative implication of inorganic fertilizer, the use of organic fertilizer has been advocated [8,9]. Hence, the need to assess farmers’ level of awareness and use of such in their farming activities. Majority of the farmers (77.7%) were aware of existence of packaged organic fertilizer. Only 35.1% of the farmers have at one time or the other applied organic fertilizer on their farms. This may have implications on environmental sustainability, biosafety, and human health in the long run especially when fertilizers are used without appropriate recommendation as it was discovered in this study (Table 2).
3.2.5. Soil water conservation practices on the farm
Majority (67.3%) of the farmers practice one form of soil water conservation or the other. In terms of specific method of soil water conservation, 44.1% indicated that they practice mulching while some stated practice of fallowing (37.8%), planting of cover crops (19.4%) e.t.c (Table 2).
3.2.6. Concern about erosion and mitigation measures
Majority of the farmers (70.7%) stated that they felt concerned about erosion on their farm while others were not bothered about the phenomenon. Given the potential devastating effect of erosion on farmland it is expected that it would be a thing of major concern to all farmers. Such farmers who were not bothered about this may not take any precautionary measure to prevent the occurrence of erosion on the farm. This may have negative effect on crop yield and available land for crop cultivation. Farmers who were concerned about erosion on their farmland stated that they usually adopt practice such as ridging across slopes (47.6%), improving farm drainage (31.6%) and planting vegetative crops (16.2%). Others mentioned were contour farming, planting cover crops and ploughing (Table 2). Appropriate land management education is a necessity to keep the farmers aware of the danger, and methods of control of soil erosion on their farms.
3.2.7. Information on the presence and activities of soil fauna on farmlands
Presence of soil fauna: Most farmers (95.2%) reported that they recently noticed the presence of earthworms on their farm. Earthworm activities enhance the structure and fertility of the soil for agricultural purposes [10]. A little above 60% of the farmers separately reported that they recently noticed the presence of millipedes and centipedes on their farms (Table 2). Others reported by some farmers were butterfly, caterpillar, army worm, ants and grasshoppers. Most micro faunas are beneficial to crop farming as their activities contribute to soil fertility improvement and some help in pollination which enhance production while the activities of some others may be destructive. It is widely believed that the presence of earthworm cast indicates that the soil is fertile. On the other hand, the presence of termiterium indicate that the soil is not fertile. Most of the farmers (91.5%) stated that they have recently noticed the presence of termiterium on their farmland (Table 2). The true situation is that both the presence of earthworm cast and termiterium can be observed on the same farmland at the same time. This is more likely on large farms (possibly more than one hectare) which gives room for variation in the fertility of the soil depending on specific locations on the farm. This underscores the need for knowledge of precision agriculture where resources are allocated according to the exact need which Smart Soil information system requires.
3.2.8. Harmful Practices on the farm
There are some practices by farmers on the farms which are harmful to the soil. Majority of the farmers (76.4%) reported that they have been practicing bush burning on their farms. Bush burning is known to cause depletion of nitrogen from the soil which disappears in the form of nitrogen oxide during burning. Although, the burning usually adds some quantity of potash to the soil through wood ash, this is not enough to justify bush burning due to long-term devastating effect [11]. One of such effects is soil sterilization where hot and slow-moving fire terminates soil fungi and microbes loving within the soil. The bacteria and fungi in the play a crucial role in soil nutrients dynamics for plants use. Soil sterilization can delay recovery for many years after the burn fire and it may take some years for soil microbe activities to reach pre-fire levels.
The use of agrochemicals is presently common even among small scale farmers. The use of agrochemicals significantly contributes to improved crop yield, improved crop quality and improves economic of scale by lowering unit cost of production as yield improves. Meanwhile, its use comes with many side effects which include contamination of crop products with harmful chemical residues, contamination of soil and groundwater, development of crop pest population which are resistant to agrochemical treatment and finally it poses health risk to people who apply it. As high as 73.7% of the farmers also reported the use of agrochemicals on their farms in the study area while 62.2% reported using chemical fertilizer. Other harmful practices identified were continuous cropping and charcoal production (Table 2).
3.3. Knowledge and use of mobile digital applications in farm decisions
This sub-section assessed the farmers’ awareness of the existence of digital application which can help in soil fertility diagnoses, its usage, non-usage, reasons and other related issues.
3.3.1. Awareness and channel of information flow
Majority (71.3%) of the farmers were not aware of the existence of digital applications which may be of help to farmers regarding soil fertility diagnoses. The low level of awareness among farmers implied that most farmers are not likely to have used such decision support application on their farms. This has implication on productivity, return on investment and food sufficiency. Farmers who claimed to be aware of the existence of digital application useful for soil fertility diagnoses stated that they became aware through extension agents (18.6%) and fellow farmers (10.9%). Other channels the farmers stated were social media, mass media and internet (Table 3). Furthermore, only 4.8% of the farmers have such digital applications on their mobile phones. The issue here is that though some farmers were aware of the existence of such application only a few among them possess the application.
3.3.2. Usage and reasons for usage and non-usage
Although, 4.8% of the farmers indicated that they had digital application only 2.9 claimed to have used it. This shows that most of the farmers are yet to appreciate the importance of such digital application in their farm decision process. Only 0.3% of the farmers claimed to be using the application all the times while 1.6% and 1.1% claimed using it occasionally and rarely respectively. The only farmer (0.3% of all farmers) who claimed to be using the application all the times stated that he does so to enhance his yield. About 8% of the smallholder farmers stated that the existing applications they knew were reliable (Table 3). More than half (56.4%) of famers stated that their lack of awareness of the existence of such useful digital application and lack of the appropriate tool (application enabled telephones) were reasons they have not been using it in their farm decision making process. Few other mentioned costs of assessing such digital application and language barriers (illiteracy).
3.3.3. Willingness to use new application with new features
Farmers were asked whether they will be willing to use new digital application which possibly includes more desirable features, especially, those not available on the existing digital application for their farm decisions, specifically as relates to information on soil fertility. Majority (97.3%) indicated their willingness to embrace and use such new application.
3.3.4. Areas of desired training in soil management
Farmers were requested to state specific areas they wish to receive training and most farmers (93.4%) stated soil fertility management while 80.1% stated site-specific crop/soil management. Other areas mentioned by some few other famers were erosion control, use of model to improve soil management etc.
3.3.5. Areas of desired ICT and mobile App use trainings
Farmers were asked to state areas of information communication technology (ICT) and use of application they would like to be trained. Majority (74.7%) stated “receiving information” while more than half (51.6%) stated “application of information in farm management”. Other areas mentioned were “receiving/asking advisory messages”, communicating soil information to other farmers, proper interpretation of soil information on mobile application etc (Table 3).
3.4. Production Activities
3.4.1. Crops cultivated
Majority (92.3%) of the farmers plant cassava, 76.9% plant maize while only 35.6% plant yam. Few other farmers plant melon, pepper and rice among others (Table 4).
Sources of Seeds: The sources of seeds farmers plant are a major factor that may affect yield not minding the fertility of the soil. Yield will still be low if poor seeds (e.g grains) are planted on the most fertile soil. Therefore, selected farmers in the study were asked questions about the sources of seeds they plant. It is worthy of note that some farmers get seeds from two or more different sources. Majority of the farmers (72.6%) plant ‘seeds’ from previous year harvests, 28.2% get seeds from farm produce buyers while 34.3% get seed from fellow farmers. Supply from these three sources are mainly grains as what was planted in so-called previous year was not foundation seeds which could generate viable certified seeds but ordinary seeds (or grains in some instances) which could only bring forth grains appropriate for direct human and animal consumption and other industrial processing rather than for planting. More than half (52.9%) of the farmers obtained seeds from registered seed companies and agro-dealers (seed retailers). These are the few who are planting what should be planted, though some of them also planted seeds from unwholesome sources with those obtained from agro-dealers. The practice of planting wrong planting materials (seeds/seedlings/stem cuttings) calls for major policy intervention.
3.4.2. Input use assessment
3.4.2.1. Herbicides
Weeds compete with crops for nutrients, space, ventilation, water etc and reduce yield. Therefore, weed control is a major issue in crop farming. Weeding and weed control in general is one of the tedious tasks in crop farming therefore the use of herbicides to control the growth of weeds on farmlands is now common than before [12]. There are instances where weeds have taken over established farms and farmers got nothing as output from such farms. In the light of this, farmers were asked whether or not they used herbicide on their farms. Majority (92.8%) used herbicides on their farms while others did not. Further inquiry into why and why not farmers use herbicides revealed that majority of the farmers (59.8%) stated that they use herbicides on their farms because its use was a faster, better and easier weed control method. Another 24.7% stated that they use herbicide on their farms due to unavailability of enough farm labour which have resulted in demand induced high cost of labour in most rural areas. Other motivating factors for the use of herbicides as stated by the farmers included the need to improve yield and output. The assertion of some few famers that they used herbicides because it enhances soil fertility calls for more enlightenment. Most of the farmers who did not use herbicides (4.5% of all farmers) gave lack fund as a reason. Other reasons stated were that it damages the soil (1.6%) while some stated that they did not just like the use of herbicide on their farms (Table 4)
3.4.2.2. Fertilizer Use
Soil fertility is basic to crop productivity. Soil nutrients that are removed by crops from the soil are usually replaced by fertilizers. Without fertilizer application, crop yields and productivity of agricultural lands would be reduced significantly on most soils. For this reason, the soil's nutrient stocks are usually supplemented with mineral fertilizers that can quickly be released for crop uptake. Majority of the farmers (75.8%) in the study area use fertilizer on their farms in order to improve soil fertility why the remaining did not used fertilizer on their farm. Most of the farmers (72.6%) stated that they applied fertilizer on their farm to increase yield while only 3.2% stated that they did so only to hasten crop growth. Those who did not apply fertilizer stated that soils of their farmlands were still fertile (10.9%) which made the need to improve the soil fertility through fertilizer application unnecessary. Others stated financial incapability (10.1%), lack of enough knowledge about fertilizer usage (2.1%) and the negative effect of inorganic fertilizer on farm produce especially at postharvest stage (1.1%) as reasons they did not use fertilizer on their farms (Table 4).
3.4.2.3. Pesticide
Any animal or plant that is harmful to humans or human concerns is referred to as pest. Pests damage agricultural and forest crops, attack livestock and cause a nuisance to people, especially in their homes. Crops are attacked by different types of pests, the most important being insects, mites, nematodes and gastropod molluscs. The loss they cause results both from the direct injury they cause to the plants and from the indirect consequences of the fungal, bacterial or viral infections they transmit. Pest attacks on crop farms can be devastating to the extent of causing monumental crop failure. Hence, the need to control pest on the farm is imperative. Majority of the farmers (67.6%) reportedly used pesticide on their farms (Table 4). Farmers were further requested to state reasons for use or otherwise of pesticides on their farms. About 44% stated that they use pesticides for control of pest and diseases on their farms. Other reasons put forward were to prevent the spread of pest and diseases to other crops (14.9%) and to kill damaging insects (8.2%). Farmers who did not use pesticides stated that the crops they plant was not susceptible to pest infestation (11.7%), it was not necessary (8.8%), no money to purchase pesticides (6.6%), and the pests were very few (3.5%). Other reasons given were that the pesticides lack the required effectiveness to control the pests while some posited that they did not have knowledge about pesticides (Table 4).
3.5. Productivity issues
Assessment of the level of land productivity of the farmers were carried out. This was measured by yield which is the output per unit measure of land. The yield of various crops planted by farmers in the study area was presented (Table 5). This can be compared with national and the world averages.
The results revealed that cassava yield in the study area was 4.6 tons per hectare which is far below the national average of 10 tons per hectare, the world average of 12.5 tons and the potential yield of 80 tons per hectare in well managed plots. The obvious short-fall is a wake-up call to critical stakeholders to make more efforts to improve productivity which will go a long way to improving output, food security and general welfare of farming household. Maize yield of 3.1 tons per hectare reported in the present study was above the national and African average but lower than the world average. This still shows that there is room for improvement. Productivity in yam production among farmers in the study area also fell short of the national, Africa and the world average. [13] reported that Nigeria contributed 64.2% of world total yam production in 2013. Generally, the level of productivity among farmers in the study area showed that with good farm practices, technology aided decisions such as those offered by digital application there is still room to improve the present yield situation (Table 5).
3.6. Factors affecting willingness to use new digital application
There is the need to determine factors affecting the use of new digital application among farmers. Because there are only two possible outcomes, a binary logit regression model (stated in equation 3.1) was estimated and results presented in Table 6. Results show that age of the farmer (P<0.05), educational level (P<0.01), membership of farmers’ association (P<0.05) and extension contact (P<0.05) significantly affected farmers’ willingness to use new soil digital application. Specifically, age came up with significant negative coefficient. This implies that increase in age decreases the likelihood of willing to use the proposed soil digital application. This means that older famers are less likely to use the application compared with younger farmers. Arising from this, special attention should be focused on older farmers to educate and encourage them with a view to achieving wider acceptability. Notwithstanding, this a pointer to the fact that more focus should be placed on reaching out to more youthful farmers during digital tool dissemination. The marginal effect value of -0.75 implies that a year increase in age reduced the probability of using the application by 0.75%.
Educational level returned significant positive coefficient and this implies that more educated farmers are likely to adopt the use of the proposed digital application in line with a priori expectation. The marginal effect value of 1.7118 implies that an increase in years of formal education by a year increased the probability of willing to use the application by 1.71%. Further implication of this is to give special attention to farmers who are less educated or do not have any formal education while persuading farmers to adopt the use of the new digital application. Expectedly and in line with a priori expectation, extension contact returned positive and significant coefficient. It will be recalled that in the quantification of the extension contact dummy variable, those who claimed to have extension contact were scored 1 while those who claimed not to have such contact were scored zero. Therefore, positive and significant coefficient as obtained here implies that farmers who had contacts with extension agents are more likely to be willing to use the new digital application compared with those without extension contacts. This is expected because extension contacts and subsequent extension education are meant to impact positively on farmers’ perception and readiness to adopt innovations such as the use of soil digital application. The marginal effect showed that having extension contact increased the probability of willing to use the new digital application by 2% compared with farmers who claimed not to have extension contact. The implication of this is that farmers who have not been receiving extension services should be further encouraged to adopt the use of the application while extension agents make more efforts to reach out to more of such farmers. There is a need to bring the attention of the Ministry Agriculture of each state to those areas without adequate presence of extension services. Membership of farmers’ association also returned positive and significant coefficient in line with a priori expectation. Here, those who belong to farmers’ association were scored one and the implication of the results is that membership of such associations increased the likelihood of willing to use the application. Membership of such association is part of social capital. People with high social capital and network are likely to receive information and get educated better on innovations and new technology which may be useful in their farm decision.
4. Conclusions
Majority of the farmers in the study area used perception and other non-scientific approaches to assess fertility of the land used for crop farming. These included the physical appearance of weeds on the farmland before clearing and performance of crops planted on the farmland in the previous season. Few farmers also relied on soil colour to assess its fertility. Only 1.1% and 0.3% of the farmers assessed fertility through soil test and digital application respectively. Majority of the farmers adopted bush fallowing and use of inorganic fertilizer in a bid to improving soil fertility. Some of the farmers who apply inorganic fertilizers relied on their experience and perception to determine the types and quantities of fertilizers to be applied and few others relied on advice of the extension agents. Only about one-third of the farmers had at one time or the other applied organic fertilizer on their farms. Majority of the farmers felt concerned about erosion issues on their farmland. Majority of the farmers have been engaging in harmful practices such as bush burning, application of agrochemicals and inorganic fertilizers, conventional tillage, continuous cropping and charcoal production which results in deforestation and soil degradation with multiple environmental sustainability implications.
Majority of the farmers were not aware of the existence of digital applications which may be of help to farmers regarding soil fertility diagnoses and only 4.8% of farmers had the digital application on their mobile telephones while only 2.9 claimed to have used such application for their farm decisions and only 0.3% claimed using the application all the times. Lack of awareness, unaffordability of internet enabled phones, cost of accessing internet and language barriers were reasons given for not using digital application in farm decision making. Meanwhile most farmers were willing to embrace and use of new digital application. Famers wish to receive further training in the areas of receiving information, application of information in farm management, communicating soil information to other farmers, proper interpretation of soil information on the application.
Most farmers in the study area plant one or a combination of cassava, maize, yam, melon, pepper, rice e.t.c. It is worthy of note that majority of the farmers plant seeds from previous year harvests, produce buyers and fellow farmers and most of these could be classified as grains rather than seeds while few others obtain seed from registered seed companies and seed retailers. Existing yield of major crops planted in the study area were lower than the national and the world averages and this requires concerted efforts to raise productivity in the region. Most farmers were willing to adopt the proposed new digital application for farm decision and analyses revealed that the age of farmers, education, extension contact and membership of farmers association were key determinants of the decision to adopt its use.
Finally, and moving forward, the low level of awareness and use of digital application in assessing soil fertility calls for urgent intervention in the form of extension services to educate small scale farmers on the need to carry out objective assessment of soil fertility before planting. Further training in relevant areas as stated earlier to enhance the use of mobile digital application are necessary to encourage the use of the application and improve agricultural productivity. Digital application in local languages may go a long in solving language barriers. Farmers should be encouraged to obtain seeds from the right sources as planting grains in place of seed may affect yield which may be erroneously ascribed to poor soil fertility. The adoption of digital application for farm decisions especially in soil fertility management should be encouraged through improved extension services while farmers are encouraged to join farmers association and cooperative societies as these most times serve as channels of vital agricultural information.
Author Contributions
Conceptualization, Olusegun Folorunso, Muftau Adebayo and Mutiu Busari; Data curation, Sakiru Akinbode; Formal analysis, Sakiru Akinbode; Funding acquisition, Olusegun Folorunso; Investigation, Sodeeq Azeez, Sarafadeen Hammed and Mutiu Busari; Methodology, Florence Olowokere, Muftau Adebayo and Mutiu Busari; Project administration, Muftau Adebayo; Supervision, Olusegun Folorunso and Mutiu Busari; Writing – original draft, Sakiru Akinbode and Taiwo Olutoberu; Writing – review & editing, Taiwo Olutoberu, Florence Olowokere, Sodeeq Azeez and Mutiu Busari.
Funding
Please add: This research was funded by European Union Under the Accelerating Inclusive Green Growth through Agri-Based Digital Innovation in West Africa (AGriDI), which is an ACP Innovation Fund (grant ref: FED/2020/420-491) led by International Centre for Insect Physiology and Ecology (ICIPE), Nairobi Kenya.
Data Availability Statement
Data used for this publication is part of an ongoing sponsored project and as such cannot be made available due to privacy policy.
Acknowledgments
In The authors acknowledge contribution of the Extension Agents in each of the six southwest states in Nigeria that provided links between our survey team and the farmers during data collection.
Conflicts of Interest
The authors declare no conflict of interest.
References
- Brady, N.C.; Weil, R.R. The Nature and Properties of Soils. Pearson 2016, pp 780.
- Oladipo, F.O.; Bolarin, O.; Daudu, A.K.; Kayode, A.O.; Awoyele, P.O. Utilization of soil conservation practices among root and tuber farmers in Oyun local government area of Kwara State, Nigeria. Agrosearch 2017, 17 (2), 99-109. [CrossRef]
- Gicheru, P. An overview of soil fertility management, maintenance, and productivity in Kenya. Arch. Agron. Soil Sci. 2012 58, 522-532. [CrossRef]
- Yirga, C.; Hassan, R.M. Poverty and soil conservation efforts among smallholder farmers in the central highlands of Ethiopia. South African J. Eco. Manag. Sci. 2014, 9 (2), 244–261. [CrossRef]
- Odendo, M.; Obare, G.A.; Salasya, B. Farmers' perceptions and knowledge of soil fertility degradation in two contrasting sites in western Kenya. Land Deg. Develop. 2010, 21.
- Apata, T.G.; Samuel, K.D.; Adeola, A.O. Analysis of Climate Change Perception and Adaptation among Arable Food Crop Farmers in Southwestern Nigeria. 2009, (No. 1005-2016-79140).
- Kemp, S. Digital 2023: Nigeria. Retrieved on July 3, 2023 from https//: www.datareportal.com.
- Busari, M.A.; Salako, F.K. Effect of tillage, poultry manure and NPK fertilizer on soil chemical proerties and maize yield on an Alfisol at Abeokuta, south-western Nigeria. Nig. J Soil Sci. 2013, 23 (2), 206-218. [CrossRef]
- Busari, M.A.; Salako F.K. Soil hydraulic properties and maize root growth after application of poultry manure under different tillage systems in Abeokuta, southwestern Nigeria. Arch Agron Soil Sci. 2015, 61 (2), 223-237. [CrossRef]
- Ramsey, J.A.; Hill, S.; Earthworms: The Agriculturalist’s Friends. Macdonald J. 1978, 39 (10). www.eap.mcgill.ca/publications/eap6.htm.
- Salim, I.S.H.; Reis, A.F.S.; Welker, C.A.D.; Scotti, M.R. Fire shifts the soil fertility and the vegetation composition in a natural high-altitude grassland in Brazil. Environ. Challenges, 2022, 9, 100638. [CrossRef]
- Kraehmer, H.; Laber, B.; Rosinger, C.; Schulz, A. Herbicides as weed control agents: State of the art: Weed control research and safener technology: The path to modern agriculture. Plant Physiol. 2014, 166 (3), 1119-1131. [CrossRef]
- Food and Agriculture Organization – FAO. Food and Agriculture Data. Retrieved on September 25, 2022 from https//:www.fao.org/faostat/en/home.
Figure 1.
Map showing study area.
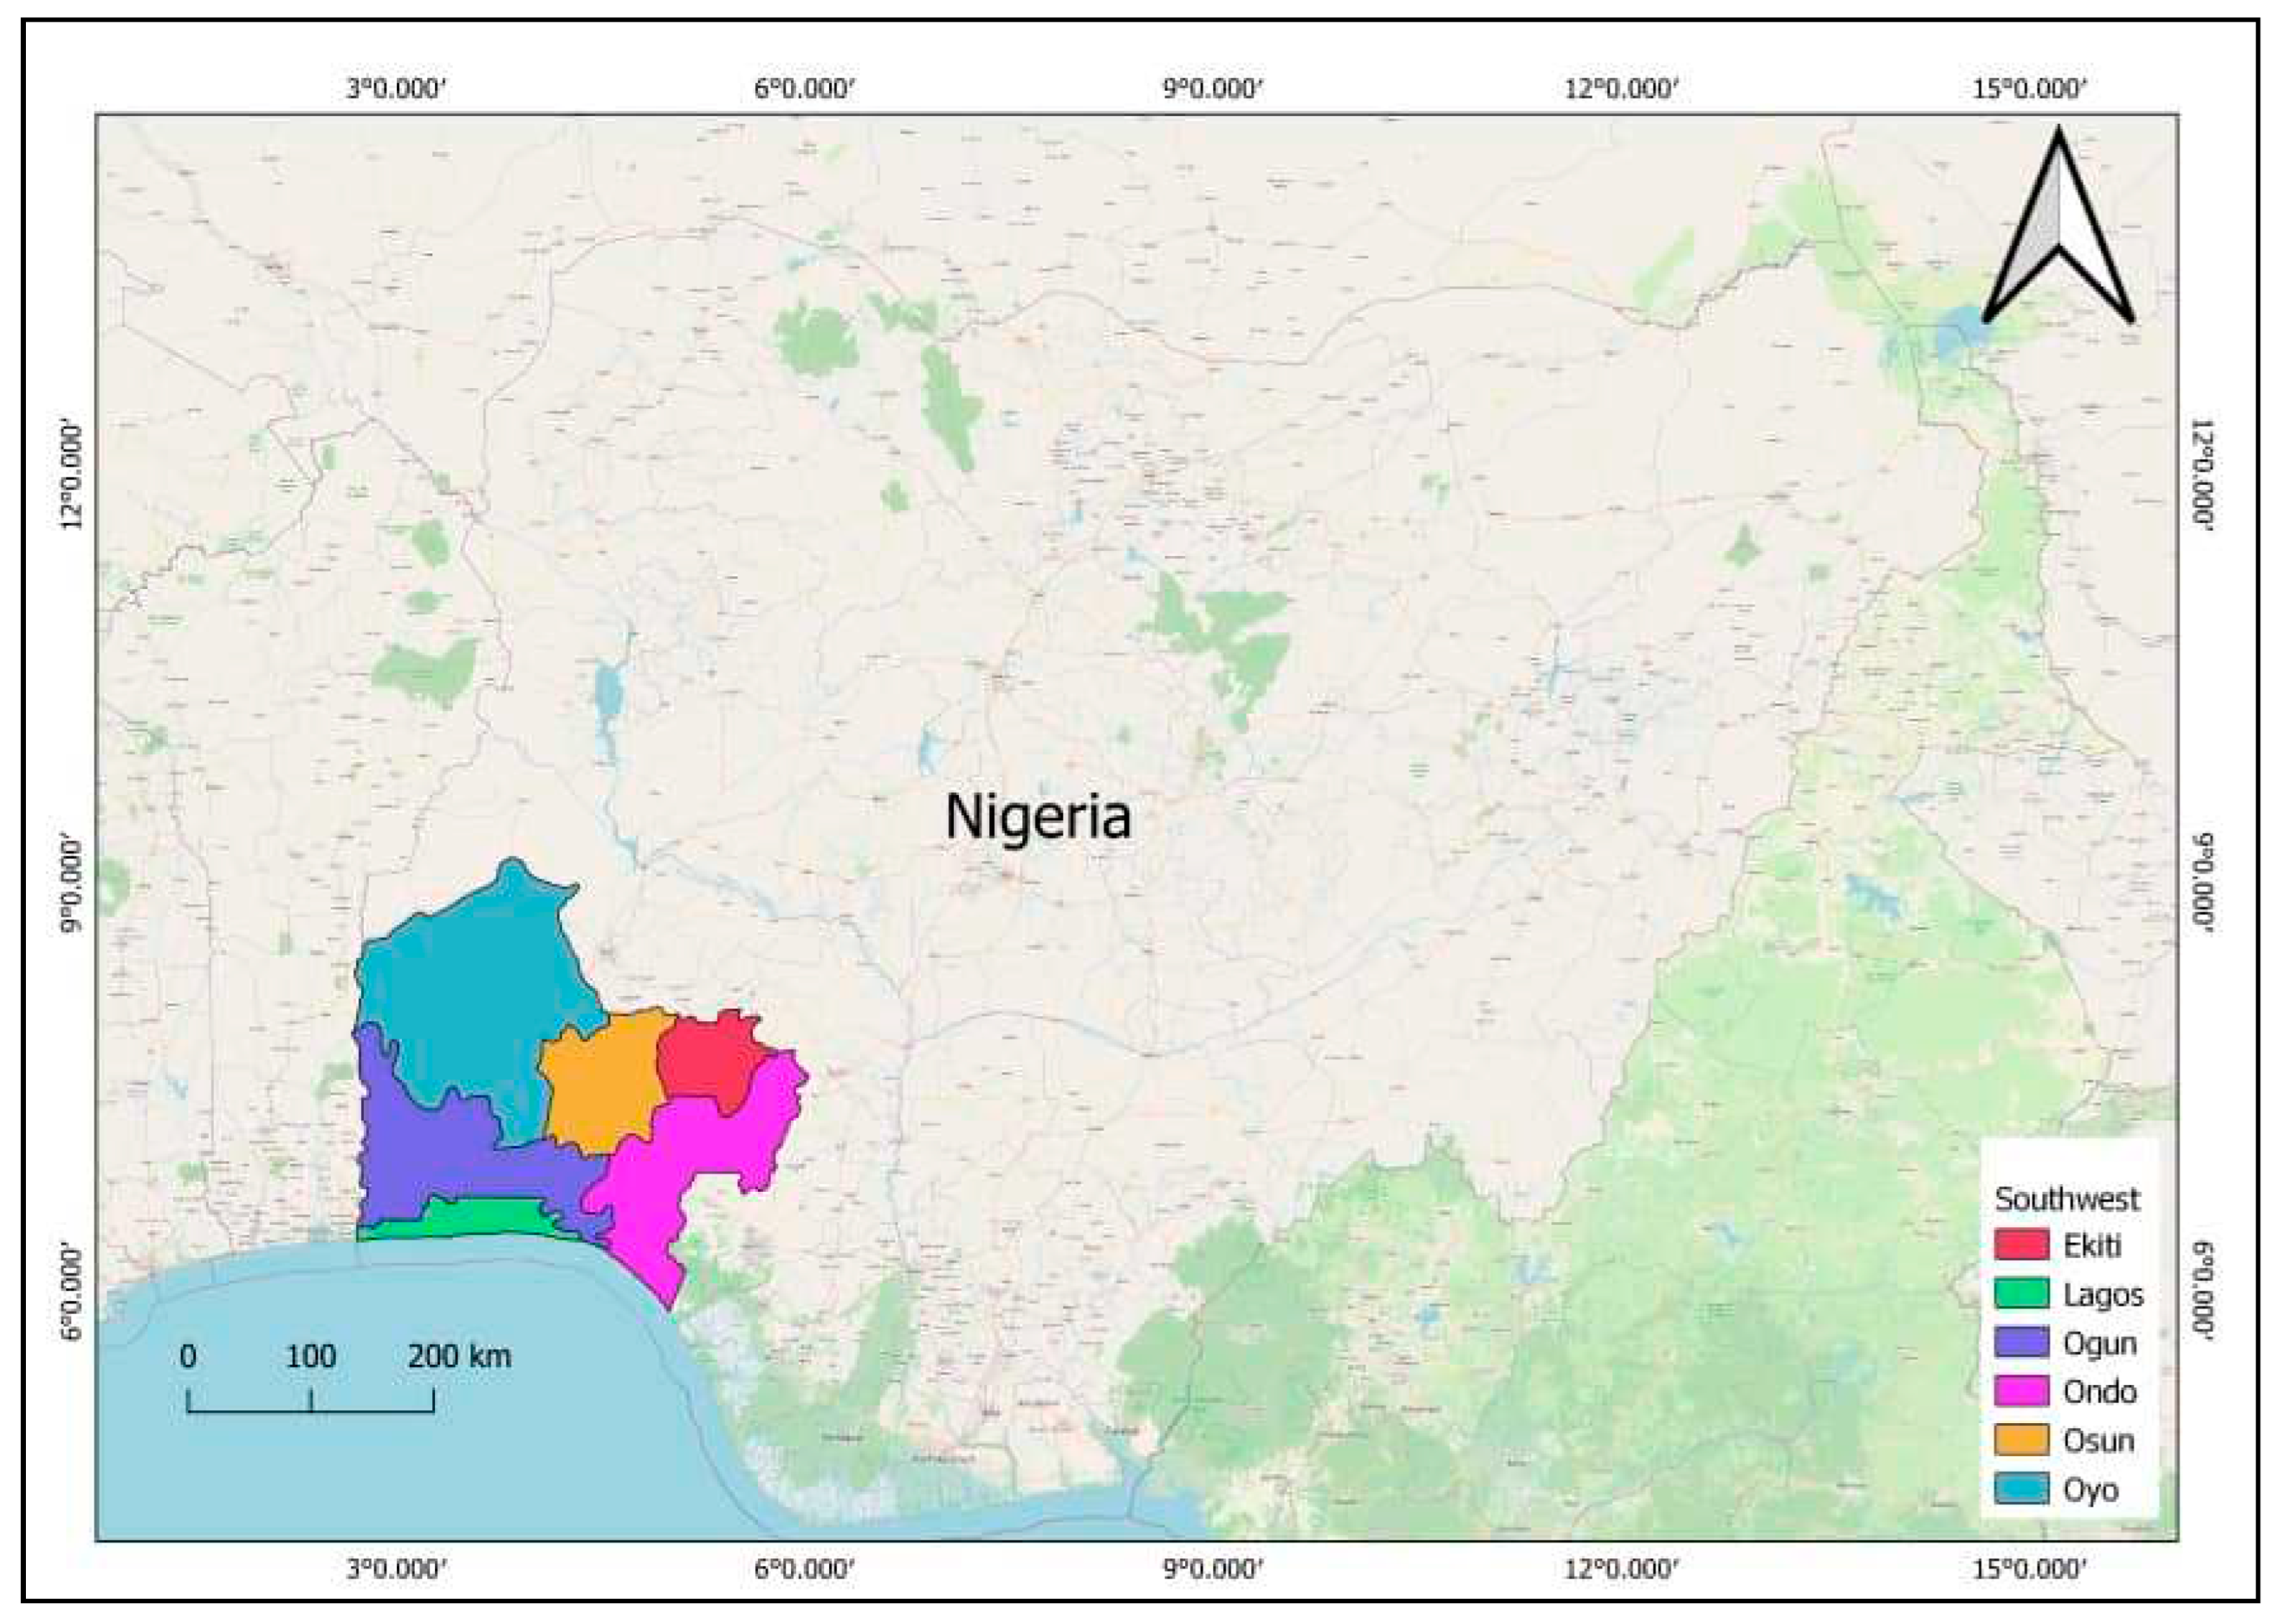

Table 1.
Socioeconomic characteristics of farmers.
| Description | Freq. | % | Description | Freq. | % |
|---|---|---|---|---|---|
| Locations (States) | Access to Credit | ||||
| Ekiti | 41 | 10.9 | Yes | 88 | 23.4 |
| Lagos | 34 | 9.0 | No | 288 | 76.6 |
| Ogun | 105 | 27.9 | Total | 376 | 100.0 |
| Ondo | 39 | 10.4 | Household Size | ||
| Osun | 53 | 14.1 | 1 -5 | 125 | 33.2 |
| Oyo | 104 | 27.7 | 6 – 10 | 195 | 51.9 |
| Total | 376 | 100.0 | 11 – 15 | 44 | 11.7 |
| Age of Farmers | 16 – 20 | 9 | 2.4 | ||
| < or = 30 | 35 | 9.3 | >20 | 3 | 0.8 |
| 31 – 40 | 79 | 21.0 | Total | 376 | 100.0 |
| 41 – 50 | 105 | 27.9 | Mean =7.5 people | ||
| 51 – 60 | 84 | 22.3 | |||
| 61 – 70 | 58 | 15.4 | Cooperative Membership | ||
| 71 – 80 | 15 | 4.0 | Members | 152 | 40.4 |
| Total | 376 | 100.0 | Non-members | 224 | 59.6 |
| Mean Age = 48.7yrs | Total | 376 | 100.0 | ||
| Gender of Farmers | Farmers’ Association | ||||
| Female | 123 | 32.7 | Members | 226 | 60.1 |
| Male | 253 | 67.3 | Non-members | 150 | 39.9 |
| Total | 376 | 100.0 | Total | 376 | 100.0 |
| Marital Status | |||||
| Single | 26 | 6.9 | Farming Experience | ||
| Married | 335 | 89.1 | 1 -10 | 100 | 26.6 |
| Widow/widower | 14 | 3.7 | 11 -20 | 110 | 29.3 |
| Separated | 1 | 0.3 | 21 – 30 | 81 | 21.5 |
| Total | 376 | 100.0 | 31 – 40 | 59 | 15.7 |
| 41 – 50 | 18 | 4.8 | |||
| Educational Level | >50yrs | 8 | 2.1 | ||
| No formal education | 54 | 14.4 | Total | 376 | 100.0 |
| Primary School | 96 | 25.5 | Mean = 22.1 years | ||
| Junior Secondary School | 22 | 5.9 | |||
| Secondary School | 115 | 30.6 | Extension Contact | ||
| OND/NCE | 48 | 12.8 | Yes | 265 | 70.5 |
| HND/BSc | 35 | 9.3 | No | 111 | 29.5 |
| MSc/MPhil | 6 | 1.6 | Total | 376 | 100.0 |
| Total | 376 | 100.0 | |||
| Number of Extension Contacts | |||||
| Sources of credit | None | 133 | 35.4 | ||
| Family and friends | 14 | 3.7 | One | 44 | 11.7 |
| Money lenders | 6 | 1.6 | Two | 52 | 13.8 |
| Cooperative societies | 39 | 10.8 | Three | 37 | 9.8 |
| Microfinance Bank | 21 | 5.6 | Four | 29 | 7.7 |
| Commercial Banks | 9 | 2.4 | Five | 31 | 8.2 |
| Government intervention | 6 | 1.6 | Above five | 50 | 13.3 |
| Others e.g farmers club | 6 | 1.6 | Total | 376 | 100.0 |
| Mean Loan obtained BOA =N564,637.36 | Mean contacts= 2.5 |
Table 2.
Distribution of farmers by knowledge of soil fertility and management practices.
| Description | Freq | % | Description | Freq | % | |
|---|---|---|---|---|---|---|
| How farmers assess soil fertility | Method of water conservation adopted | |||||
| Soil colour | 122 | 32.4 | Mulching | 166 | 44.1 | |
| Weed appearance | 192 | 51.1 | Cover crop | 73 | 19.4 | |
| Past crop performance | 191 | 50.8 | Strip cropping | 6 | 1.6 | |
| Fallow period | 121 | 32.2 | Organic manure | 28 | 7,4 | |
| Soil texture | 65 | 17.3 | Bush fallowing | 142 | 37.8 | |
| Soil test | 4 | 1.1 | Others | 14 | 3.7 | |
| Existing Digital Application | 1 | 0.3 | ||||
| Others e.g present earthworm cast and experience | 28 | 7.4 | Do you care about erosion on your farm? | |||
| Yes | 266 | 70.7 | ||||
| How farmers improve soil fertility | No | 110 | 29.3 | |||
| Crop rotation | 151 | 40.2 | Total | 376 | 100.0 | |
| Bush fallowing | 213 | 56.6 | ||||
| Application of green manure | 45 | 12 | Methods of erosion control adopted | |||
| Application of farmyard manure | 57 | 15.2 | Planting vegetation | 61 | 16.2 | |
| Animal grazing before cultivation | 9 | 2.4 | Contour farming | 32 | 8.5 | |
| Application of inorganic fertilizer | 201 | 53.5 | Planting cover crops | 47 | 12.5 | |
| Application of liquid fertilizer | 33 | 8.8 | Improving farm drainage | 119 | 31.6 | |
| Practice of zero tillage | 31 | 8.2 | Ridging across slope | 179 | 47.6 | |
| Mixed cropping | 82 | 21.8 | Others e.g ploughing, chanelisation | 9 | 2.4 | |
| Erosion control on the farm | 17 | 4.5 | ||||
| Addition of CaCo3 for liming | 2 | 0.5 | Areas of soil management require training | |||
| Addition of sulfuric acid | 1 | 0.27 | Soil fertility management | 351 | 93.4 | |
| Erosion control | 171 | 45.5 | ||||
| How type & quantity of inorganic fertilizers are determined | Site-specific crop/soil management | 301 | 80.1 | |||
| Physical appearance of soil | 54 | 14.4 | Others e.g use of model for fertility | 3 | 0.8 | |
| Crop performance last season | 52 | 13.8 | ||||
| Soil test | 2 | 0.5 | Presence of micro faunas on farm | |||
| Digital application | 1 | 0.27 | Earthworms | 358 | 95.2 | |
| Type of crops to be planted | 20 | 5.3 | Butterfly | 171 | 45.5 | |
| Perception and experience | 104 | 27.7 | Millipede | 243 | 64.7 | |
| Extension agent advice | 70 | 18.6 | Centipede | 230 | 61.2 | |
| Others | 3 | 0.8 | Others e.g snails | 62 | 16.5 | |
| Awareness about organic fertilizer | Have noticed earthworm cast recently | |||||
| Aware | 292 | 77.7 | Yes | 354 | 94.1 | |
| Not aware | 84 | 22.3 | No | 22 | 5.9 | |
| Total | 376 | 100.0 | ||||
| Are there termiterium on the farm | ||||||
| Use of Organic Fertilizer | Yes | 344 | 91.5 | |||
| Used | 132 | 35.1 | No | 32 | 8.5 | |
| Never used | 160 | 42.6 | ||||
| No Response | 84 | 22.3 | Harmful practices on the farm | |||
| Total | 376 | 100.0 | Bush burning | 287 | 76.4 | |
| Agrochemicals | 277 | 73.7 | ||||
| Practice of water conservation | Chemical fertilizer | 234 | 62.2 | |||
| Yes | 253 | 67.3 | Conventional tillage | 162 | 43.1 | |
| No | 82 | 21.8 | Continuous cropping | 120 | 31.9 | |
| No Response | 41 | 10.9 | Charcoal production | 31 | 8.2 | |
| Total | 376 | 100.0 | Others | 3 | 0.8 |
Table 3.
Distribution of farmers by issues relating to the use of mobile application.
| Description | Freq | % | Description | Freq. | % | |
|---|---|---|---|---|---|---|
| Awareness of Digital Application | Reasons for using App always | |||||
| Aware | 108 | 28.7 | To enhance yield | 1 | 0.3 | |
| Not aware | 268 | 71.3 | Not Applicable | 375 | 99.7 | |
| Total | 376 | 100.0 | Total | 376 | 100.0 | |
| Sources of information/awareness | Reliability of existing App | |||||
| Extension agents | 70 | 18.6 | Highly unreliable | 4 | 1.1 | |
| Fellow farmers | 41 | 10.9 | Indifferent | 49 | 13.0 | |
| Social media | 15 | 4.0 | Reliable | 26 | 6.9 | |
| Mass media | 12 | 3.2 | Unstable | 10 | 2.7 | |
| Internet | 5 | 1.3 | Not applicable | 287 | 76.6 | |
| Others | 5 | 1.3 | Total | 376 | 100.0 | |
| Total | 376 | 100.0 | ||||
| Willingness to use improved App | ||||||
| Do you have the application? | Yes | 366 | 97.3 | |||
| Yes | 18 | 4.8 | No | 10 | 2.7 | |
| No | 90 | 23.9 | Total | 376 | 100.0 | |
| Not Applicable (not aware) | 268 | 71.3 | ||||
| Total | 376 | 100.0 | Constraints to the use soil digital App | |||
| Lack of awareness | 212 | 56.4 | ||||
| Do you use the application? | Cost of access | 113 | 30.1 | |||
| Yes | 11 | 2.9 | Language barrier | 90 | 23.9 | |
| No | 7 | 2.9 | Lack of tools (phones) | 212 | 56.4 | |
| Not applicable (not have not aware) | 358 | 95.2 | Others | 16 | 4.3 | |
| Total | 376 | 100.0 | ||||
| Areas of desired training in ICT and mobile App | ||||||
| How frequently do you use the App | Receiving soil information | 281 | 74.7 | |||
| All times | 1 | 0.3 | Receiving advisory message | 154 | 41.0 | |
| Occasionally | 6 | 1.6 | Comm soil info to with other farmers | 145 | 38.6 | |
| Rarely | 4 | 1.1 | Interpretation of soil info on the App. | 159 | 42.3 | |
| Not Applicable | 365 | 97.1 | Appn of information on the farm | 194 | 51.6 | |
| Total | 376 | 100.0 | Others | 4 | 1.1 |
Table 4.
Distribution of farmers by production activities.
| Description | Freq. | % | Description | Freq. | % | |
|---|---|---|---|---|---|---|
| Crops cultivated | Reasons for use of fertilizer | |||||
| Cassava | 347 | 92.3 | Increase yield | 273 | 72.6 | |
| Maize | 289 | 76.9 | Hasten plant growth | 12 | 3.2 | |
| Yam | 134 | 35.6 | Not Applicable (not used) | 91 | 24.2 | |
| Melon | 13 | 3.5 | Total | 376 | 100.0 | |
| Pepper | 101 | 26.9 | ||||
| Rice | 25 | 6.6 | Reason for not using fertilizers | |||
| Others e.g cocoyam, soybean etc | 8 | 2.1 | Soil already fertile | 41 | 10.9 | |
| Financial constraint | 38 | 10.1 | ||||
| Sources of seeds planted | No enough knowledge on fertilizer | 8 | 2.1 | |||
| Seed Companies &retailers | 199 | 52.9 | Negative effects on farm produce | 4 | 1.1 | |
| Fellow farmers | 129 | 34.3 | Not applicable (used) | 285 | 75.8 | |
| Previous year harvest | 273 | 72.6 | Total | 376 | 100.0 | |
| Farm produce buyers | 106 | 28.2 | ||||
| Others e.g NGOs, ADPs etc | 18 | 4.8 | Use of Pesticides | |||
| Used | 254 | 67.6 | ||||
| Use of Herbicide | Not used | 122 | 32.4 | |||
| Use herbicides | 27 | 7.2 | Total | 376 | 100.0 | |
| Do not use herbicides | 349 | 92.8 | ||||
| Total | 376 | 100.0 | Why use Pesticides | |||
| To kill destructive insect | 31 | 8.2 | ||||
| Reasons for using herbicide | To prevent spread of pest and diseases to other plant | 56 | 14.9 | |||
| High cost of manual weeding | 93 | 24.7 | Control pest and diseases | 167 | 44.4 | |
| Faster, better and easier method | 225 | 59.8 | Not Applicable (not used) | 122 | 32.4 | |
| Enhance production | 23 | 6.1 | Total | 376 | 100.0 | |
| Improve fertility | 4 | 1.1 | ||||
| Not Applicable | 27 | 7.2 | Why not use Pesticides | |||
| No fund | 25 | 6.6 | ||||
| Reasons for not using herbicides | Pests are few on my farm | 13 | 3.5 | |||
| Lack of money | 17 | 4.5 | Not necessary | 33 | 8.8 | |
| Damages the soil | 6 | 1.6 | I have no knowledge of pesticide | 3 | 0.8 | |
| Don’t just like using it | 4 | 1.1 | Not Applicable (Used) | 254 | 67.6 | |
| Not Applicable (used) | 349 | 92.8 | Total | 376 | 100.0 | |
| Total | 376 | 100.0 | ||||
| Use of fertilizer | ||||||
| Use fertilizer | 285 | 75.8 | ||||
| Do not use fertilizer | 91 | 24.2 | ||||
| Total | 376 | 100.0 |
Table 5.
Productivity levels in main crops planted.
| S/N | Crops | Yield in study area (t ha−1) |
National average (t ha−1) |
African average (t ha−1) |
World average (t ha−1) |
Ideal yield (t ha−1) |
|---|---|---|---|---|---|---|
| 1. | Cassava | 4.6 | 10 tons | NA | 12.8 | 80 |
| 2. | Maize | 3.1 | 2.0 | 2.0 | 428 | NA |
| 3. | Yam | 6.1 | 10.0 | 16.2 | 8.3 | N.A |
| 4. | Melon | 3.1 | N.A | N.A | N.A | N.A |
NA = Not Available.
Table 6.
Results of the Logit Regression Model. Dependent variable = Willingness to use new soil digital application.
Table 6.
Results of the Logit Regression Model. Dependent variable = Willingness to use new soil digital application.
| Variables | Symbol | Coefficient | Std Error | t-values | Marginal effects |
|---|---|---|---|---|---|
| Constant | Bo | 4.5033*** | 1.7407 | 2.59 | __ |
| Age | X1 | -0.0389** | 0.0196 | -1.98 | -0.7524 |
| Gender | X2 | 0.2213 | 0.7194 | 0.31 | 0.0042 |
| Marital status | X3 | 0.7162 | 1.2549 | 0.57 | 0.0138 |
| Education | X4 | 1.1017*** | 0.3787 | 2.90 | 1.4118 |
| Extension | X5 | 0.8122** | 0.3760 | 2.16 | 2.0157 |
| Farmers’ association | X6 | 1.0356** | 0.4388 | 2.36 | 0.8200 |
| Farming Experience | X7 | -0.0052 | 0.0293 | -0.18 | 0.9960 |
| Cooperative society | X8 | -0.3332 | 0.7598 | -0.44 | -0.0064 |
| Access to credit | X9 | 0.6754 | 1.1343 | 0.60 | 0.0131 |
** &*** imply significance at 5% & 1% respectively.
Disclaimer/Publisher’s Note: The statements, opinions and data contained in all publications are solely those of the individual author(s) and contributor(s) and not of MDPI and/or the editor(s). MDPI and/or the editor(s) disclaim responsibility for any injury to people or property resulting from any ideas, methods, instructions or products referred to in the content. |
© 2023 by the authors. Licensee MDPI, Basel, Switzerland. This article is an open access article distributed under the terms and conditions of the Creative Commons Attribution (CC BY) license (http://creativecommons.org/licenses/by/4.0/).
Copyright: This open access article is published under a Creative Commons CC BY 4.0 license, which permit the free download, distribution, and reuse, provided that the author and preprint are cited in any reuse.


