Submitted:
04 December 2023
Posted:
05 December 2023
You are already at the latest version
Abstract
Identification of Dengue drivers is crucial for pro-active prevention strategies. In semi-arid regions, the relationship between meteorological variables, particularly rainfall, and the dengue vector is complex. This study analyzes associations between the number of dengue cases and rainfall categories in six semi-arid locations in India. Focusing on official website data, we find significant correlations only with heavy rainfall (R>10 mm/day). The findings underscore the importance of heavy rainfall in Dengue incidence and offer insights for pro-active prevention. The study methodology involves rainfall and dengue occurrence over Indian region. This research contributes to the growing body of knowledge on Dengue prevention, emphasizing the need for targeted interventions during periods of heavy rainfall.
Keywords:
Dengue occurrence
; dengue control
; dengue and heavy rainfall
; dengue and rainfall categories
; dengue and climate change
Keywords Dengue occurrence; dengue control; dengue and heavy rainfall; dengue and rainfall categories; dengue and climate change
Introduction
With its life-threatening nature for many patients, dengue has emerged as a rapidly spreading global threat; estimates and modelling suggest dengue to become more prevalent in the future [1,2,3]. The annual dengue infections are estimated at 390 million with 96 millions of these as manifest at different levels of disease severity. While dengue is a global threat, there are many and intricate regional differences in the occurrence and risk owing to differences in immune systems, local climate and urbanization [4,5]. Changes in regional climate also introduce spatio-temporal variability in dengue [6,7,8].
Dengue control faces several challenges due to some unique properties of the dengue vector [9]. Both the infectious agent and the associated vector are very small and devoid of thermostatic mechanisms. Their temperature and fluid levels are therefore determined directly by the local climate. The incubation time of the vector-borne infective agent within its vector organism is typically very sensitive to changes in temperature, usually displaying an exponential relationship [10,11]. However, all the three weather variables, namely rainfall, temperature and humidity, are known to affect mosquito population [12,13,14], the trends in these variables like increase in the intensity and the frequency of extreme rainfall events over endemic regions [15], can play important roles in dengue occurrence. The rainy season provides temperature and humidity conducive for build-up of the vector population. In arid zones where rainfall is scanty during the dry season, high vector population builds up in man-made storage containers. Other climatic sensitivities for the agent, vector and host include level of precipitation, sea level elevation, wind, and duration of sunlight [16,17,18]. However, the effects of the meteorological and other environmental variables can have appreciable regional variations. A challenging task in dengue control is precision identification of the meteorological drivers for preventive efforts.
The important roles of the meteorological variables in dengue vector have been generally acknowledged, and the potential of forecast and prevention of disease, especially mosquito-borne diseases, based on climate and meteorological variables has been suggested in several recent works [19,20,21]. However, an important requirement is an accurate estimate of vector (mosquito) load under different conditions. Thus, a major challenge in effective dengue control is understanding the drivers, especially the meteorological factors, and their regional characteristics [22,23,24]. The climate and the weather variables exhibit complex relationships with dengue; however, the role of rainfall in dengue vector is perhaps the most complex [16,17]. While the wet season provides breeding habitats for Aedes mosquitoes, heavy rainfall can potentially flush away larvae or pupae of the immature stage. Heavy rainfall can also increase the mortality rate of adult mosquitoes, and shorten the life span of outdoor Aedes mosquitoes; at the same time heavy rainfall also creates numerous temporary breeding habitats for mosquitoes, which in turn impacts vector population. Similarly, dry spells can create habitats for vectors by causing small and shallow rivers to dry into pools, thus leading to dry season malaria. An indirect effect of heavy rain is increase in host-vector encounters [18]. Thus while most studies have considered total rainfall or the number of rainy days, the vector dynamics is expected to strongly depend on the rainfall categories.
A conceptual basis for differential impacts of rainfall categories on vector population can be obtained from loss of vector habitat due to the process of evaporative drying. Buildup of a vector population depends on the availability of a water body on ground for at least one time period necessary for vector genesis and emergence of adult mosquitoes. The time scale for evaporative drying is essentially a function of the depth of the water body and meteorological variables like near surface wind and humidity. However, as evaporation is essentially a surface process, under similar meteorological conditions, a thinly spread (shallow) water body would dry sooner compared to a deeper water body even with less water content. At the same time, a water body of small spatial coverage will lose its shallow edges and become unsuitable for vector genesis. Thus water bodies with certain minimum spread and depth are required to allow a vector buildup so that the evaporative drying timescale will be longer than the time required for the immature stage to survive. A typical evaporative drying time scale TE can be defined as
where E is the rate of evaporation from a water surface (gms/m2/sec) and W is the total water. The total water can be estimated as
where S and D are the surface area (m2) and (average) depth (m) of the water pool and is the density of water.
The rate of evaporation from an open surface of area S depends on wind speed u and near surface vertical gradient in humidity Δq and can be represented as
Here is a drag coefficient (~1.5×10⁻³) and is the density of air near the surface.
Typically, under a (near surface) wind speed of 2 m/s and 10% gradient in humidity, equation (1) along with Equations (2) for water depth and Equation (3) for rate of evaporation (loss) would suggest an evaporative drying time of a few days for a water body to retain a depth of at least a few centimeters. Thus, rainfall episodes of low intensity, even though widespread, may have less impact on vector genesis as the shallow water bodies created would evaporate quickly. On the other hand, even sporadic heavy rainfall events will allow development of water bodies that will outlast evaporative drying to allow mosquito genesis. This is likely to be particularly true in arid regions (drier near surface atmosphere) where evaporative drying can be fast. Further, as the rainfall over semi-arid regions is infrequent and permanent water pools may not generally exist, development of vector habitats depends on sufficient water from rainfall. Thus the impacts of different rainfall categories on vector population over semi-arid regions are likely to be quite different from those over high-rainfall areas. The objective of the present work is to examine associations between the number of dengue cases and four rainfall categories over semi-arid regions based on the above scenario; we also consider a coastal region (Goa) for comparison.
Data and Methodology
While the number of deaths due to dengue depends on many socio-economic factors like quality and access to health care, the number of disease incidences can be assumed to be essentially due to host-vector encounters for a given human population of characteristic life style. We have thus considered only the number of dengue cases available in official website. We have adopted data on the annual number of dengue cases from http://www.indiastat.com/health/16/disease/77/dengue/17810/stats.aspx from 1998 to 2011 for six states of India. The daily rainfall data was adopted from Tropical Rainfall Measuring Mission (TRMM) available on a global grid of 25km×25km during 1998 to 2011; we have constructed the annual as well as seasonal data of pre monsoon (March-May), monsoon (June-September) and post monsoon (October-December) rainfall from the daily data. Although station data may provide more accurate rainfall over a fixed location, gridded data provides a better candidate for spatially distributed processes like vector genesis and dengue. Following our hypothesis, we have considered daily rainfall(R) in four categories 0<R<3, 3≤R<10, 10≤R<15 and high rainfall i.e. (R≥15mm). Here we have correlated the number of rainy days and the number of cases by using the Pearson correlation. According to the Pearson correlation coefficient table the 95% of the significance value is 0.49 (http://www.nzdl.org/gsdl/collect/hdl/index/assoc/HASH3b4d.dir/t802.png).
The six regions selected represent different socio-climatic conditions, from semi-arid urban (Delhi) to arid (Rajasthan); the number of dengue cases as % of population for respective states varies from 11 to 1 (Table 1). The use of only annual data on dengue cases is currently an unavoidable constraint.
We have used Pearson correlation without any Z-transformation. For assigning significance of correlation, we have used the Pearson correlation coefficient table (http://www.nzdl.o Pearson correlation coefficient table rg/gsdl/collect/hdl/index/assoc/HASH3b4d.dir/t802.png) for assigning the significance value for the degrees of freedom involved (e.g is 0.49 for 95%).
The linear trend in our analysis refers to the coefficient in a linear fit of the form y=mx + c (here m is being referred to as the coefficient of linear trend). The significance of liner trend is normally judged by comparing against standard deviation (natural variability or noise) in the data. However, the threshold of significance is not strictly defined; we have adopted a threshold of 10% of respective standard deviation as the threshold for significance.
Results
In presenting our results below we have organized the states in the order of increasing annual rainfall. It is worth noting that each of the six states experiences appreciable number of days with heavy rainfall (R≥10 mm/day) in a year; the average number of such heavy rainfall days is naturally smaller than the number of days with weak (0<R<3) rainfall, but not small (Supplementary Fig.1). For location like Goa such heavy rainfall days in a year can easily exceed 80; however, even for arid and semi-arid regions like Rajasthan and Delhi, an average number of 40-50 heavy rainfall episodes in a year is observed (Supplementary Fig.1). Expectedly, most of the heavy rainfall episodes take place during the monsoon season (June-September); however other seasons also experience some episodes of such heavy rainfall events (Supplementary Fig.1). We shall therefore consider rainfall episodes at both annual and seasonal scales to identify periods of vulnerability.
As argued above, heavy rainfall episodes that lead to accumulation of water and for a prolonged period are likely to be more conducive for dengue than weak rain episodes. Indeed, the annual number of dengue cases is found to be strongly correlated with the annual number of days of heavy rainfall (R≥10 mm/day) for all the six states (Figure 1A). In contrast, the correlation between the annual number of weak rainfall (0<R<3) days and the annual number of dengue cases is insignificant; however, as expected, this correlation is significant for Goa (Figure 1A), a coastal location with high annual rainfall. Consistent with much fewer cases of heavy rainfall episodes in the March-May period (Supplementary Figure 1B), there is no significant association between the seasonal (March-May) number of rainfall days and the annual number of dengue cases (Figure 1B). The situation, however, drastically changes for the monsoon (June-September) season, with all the six states showing significant (>95%) correlation between the annual number of dengue cases and the seasonal number of heavy (R≥10) rainfall episodes (Figure 1C). For rainfall during October-December, only Goa shows a strong association between weak rainfall days with the annual number of dengue cases (Figure 1D). In our subsequent analysis we shall primarily examine association between heavy rainfall days and the annual number of dengue cases.
On a year-to-year basis also, each state exhibits significant (≥95%) correlation between the annual number of dengue cases and the heavy rainfall days (Figure 2). It may be noted that for each of the states and for each of the 15 years, there is non-zero number of heavy rainfall (R≥10mm/day) days; however, there are examples like, for Haryana, Goa and Rajasthan during 1998-2000, for which the number of dengue cases was essentially zero (Figure 2). It may be also noted that for states like Goa, Gujarat and Punjab, there are indications of sharp increases in the number of dengue cases (Figure 2). While many factors are likely to contribute to such increases, the changes in the rainfall characteristics could be important. Indeed, there are significant (in term of % of respective standard deviation as a measure of noise) linear trends in the number of heavy (R≥10mm/day) rainfall days essentially for all the states except Delhi (Figure 3A); the rather weak trend for Delhi (Figure 3A) is consistent with lack of any trend in the annual number of dengue cases for Delhi (Figure 2A). It is important to note that the trend in the number of heavy rainfall days is significant only for the monsoon (June-September) season (Figure 3C); for the other two seasons the trends are insignificant (Figure 3B, D). Although the variability (standard deviations) in the number of dengue cases and the number of rainy days is very different quantitatively, there are strong similarities in the state-wise distribution of this variability (Supplementary Figure 2).
Conclusions
While heavy rainfall can affect dengue vector in opposite directions, our results indicate that the resultant effect of heavy rainfall is to enhance dengue cases, especially over arid regions; this association is the strongest for rainfall above 10 mm/day. This threshold in rainfall amount can be understood in terms of time scale for loss of vector habitat due to evaporative drying and time scale for vector genesis. For a vector population to emerge, a habitat needs to last long enough for the larval stage to survive. Over the semi-arid and arid regions considered here, weak rainfall events cannot result in lasting vector habitats due to quick percolation of water and evaporative drying. An indirect support to our hypothesis comes from the fact that over a coastal and generally wet region (Goa) where rainfall events are frequent with large number of heavy rainfall events (Supplementary Figure 1) even weak rainfall events show significant correlation, with the number of dengue cases (Figure 1). Over such wet regions, there is near continuous but non-disruptive (not strong enough to fresh larvae) replenishment of the water habitats.
Although the vector species, being a domestic breeder, is endothermic and endophilic, it largely remains insulated by fitting into human ecological requirements. Thus buildup of vector population also depends on socio-environmental factors like sanitation, drainage and processes that control transmission; however, the strong association between the number of heavy-rainfall days and the number of dengue cases over six different socio-climatic zones strongly suggest the number of heavy rainfall episodes as a major driver of dengue. Quite clearly, the effect of heavy rainfall will also have indirect effects like increased vector human contacts due to crowding [25].
Our results also imply elimination of post-rainfall water accumulation as an effective measure of reducing risk of outbreaks of vector population; such measures can be potentially implemented pro-actively based on recent advances in skill in forecasting such rainfall events. It is worth mentioning that there has been considerable progress in such forecasting in recent years. It has been shown that seasonal outlooks for mosquito-borne disease like malaria can be now attempted with tools of dynamical seasonal forecasting based on global circulation models [26,27]; similarly, global circulation models as well regional models with optimized configuration have been shown to possess sufficient skill in forecasting heavy rainfall events more than 48 hours in advance [28,29]. At short timescale (~1 day) also, vector genesis model driven by high-resolution meteorological forecasts can be used to identify locations of mosquito genesis with sufficient precision for pro-active control [20]; the skill of such forecasts is improving due to techniques in meteorological forecasting like downscaling and debiasing [30]. Thus, integration of such forecasts with disease/vector models provides a promising avenue for pro-active control. At the same time, there are several reports of increase in the number of extreme events due to climate change [15]; our results on relation between dengue and extreme rainfall events point to increased vulnerability to dengue in a changed climate, although the severity will be modulated by the local environmental conditions. It is important therefore to calibrate and apply these tools for pro-active dengue control.
The present study can be enhanced in scope through use of disease (dengue) data at higher spatio-temporal resolution. In particular, the data on the number of cases should be available at weakly, and preferably daily, scale for establishing more precise relations between rainfall and other meteorological variables and dengue. However, such optimal data sets are essentially lacking over most locations. Given the diverse Socio-climatic conditions of the six regions, the disease data may suffer from under reporting, although this may not adversely affect the conclusion from this study.
Acknowledgments
This work is supported by the project Integrated Analysis for Impact, Mitigation and Sustainability, funded by CSIR, India.
Conflicts of Interest
The authors have no conflict of interest.
References
- Bhatt, S., et al. The global distribution and burden of dengue. Nature 496, 504–507(2013). [CrossRef]
- Hales, S., De Wet, N., Maindonald, J., Woodward, A. Potential effect of population and climate changes on global distribution of dengue fever: an empirical model. Lancet 360, 830–834(2002). [CrossRef]
- Kyle, J.L., Harris, E. Global spread and persistence of dengue. Annu Rev Microbiol 62, 71–92(2008). [CrossRef]
- Luz, P.M., Vanni, T., Medlock, J., Paltiel, A.D., Galvani, A.P. Dengue vector control strategies in an urban setting: an economic modelling assessment. Lancet 377, 1673–1680(2011). [CrossRef]
- Cummings, D.A. et al. The impact of the demographic transition on dengue in Thailand: insights from a statistical analysis and mathematical modeling. PLoS Med. 6, e1000139(2009). [CrossRef]
- Balmaseda, A. et al. Trends in patterns of dengue transmission over 4 years in a pediatric cohort study in Nicaragua. J Infect Dis. 201, 5–14(2010). [CrossRef]
- Bhatia, R., Dash, A., Sunyoto, T. Changing epidemiology of dengue in South-East Asia. WHO-SEAJPH 2, 23–27(2013). [CrossRef]
- Johansson, M.A., Dominici, F., Glass, G.E. Local and global effects of climate on dengue transmission in Puerto Rico. PLoS Negl Top Dis. 3, e382(2009). [CrossRef]
- WHO, Dengue haemorrhagic fever: diagnosis, treatment, prevention and control (http://www.who.int/csr/resources/publications/dengue/Denguepublication/en/;1997). (Date of access: June 7, 2014).
- Caminade, C. et al. Impact of climate change on global malaria distribution. Proc Natl Acad Sci USA 111, 3286–3291(2014). [CrossRef]
- Beugnet, F., Chalvet-Monfray, K. Impact of climate change in the epidemiology of vector-borne diseases in domestic carnivores. Comp Immunol Microbiol Infect Dis.36, 559–566(2013). [CrossRef]
- Goswami, P., Murty, U.S., Mutheneni, S.R., Kukkuthady, A., Krishnan, S.T. Relative Roles of Weather Variables and Change in Human Population in Malaria: Comparison over Different States of India. PLoS ONE 9(6), e99867(2014). doi:10.1371/journal.pone.0099867. [CrossRef]
- P. Goswami, U.S. Murty, S.R. Mutheneni, A. Kukkuthady, S.T. Krishnan, A Model of Malaria Epidemiology Involving Weather, Exposure and Transmission Applied to North East India. PLoS ONE 7(11), e49713(2012). doi: 10.1371/journal.pone.0049713. [CrossRef]
- Descloux, E. et al. Climate-Based Models for Understanding and Forecasting Dengue Epidemics. PLoS Negl Trop Dis.6, e1470(2012). [CrossRef]
- Rajeevan, M., Bhate, J., Jaswal, A.K. Analysis of variability and trends of extreme rainfall events over India using 104 years of gridded daily rainfall data. Geophysical Research Letter 35, L18707(2008). [CrossRef]
- Glenn, L.S.S. Correlation of climatic factors and dengue incidence in Metro Manila, Philippines. AMBIO A Journal of the Human Environment 37(4), 292-94(2008). [CrossRef]
- Xuan, L.T.T., Van Hau, P., Thi Th, D., Toan, D.T.T. Estimates of meteorological variability in association with dengue cases in a coastal city in northern Vietnam: an ecological study. Glob Health Action 7, 23119(2014).
- Hsieh, Y.H., Chen, C.W.S. Turning points, reproduction number, and impact of climatological events for multi-wave dengue outbreaks. Trop Med Int Health 14, 628–638(2009). [CrossRef]
- Hii, Y.L., Zhu, H., Ng, N., Ng, L.C., Rocklov, J. Forecast of Dengue Incidence Using Temperature and Rainfall. PLoS Negl Trop Dis.6, e1908(2012). [CrossRef]
- Goswami, P. Prevention of malaria through forecast based precision vector sanitation and exposure advisory: A Conceptual and Feasibility Analysis, Current Science 108, 19-21(2015).
- Thomas, S.M., Fischer, D., Fleischmann, S., Bittner, T., Beierkuhnlein, C. Risk assessment of dengue virus amplification in Europe based on spatio-temporal high resolution climate change projections. Erdkunde 65, 137–150(2011). [CrossRef]
- Lowe, R. et al. Spatio-temporal modeling of climate-sensitive disease risk: Towards an early warning system for dengue in Brazil. Computers & Geosciences 37, 371-381(2011). [CrossRef]
- Githeko, A.K., Lindsay, S.W., Confalonieri, U.E., Patz, J.A. Climate change and vector-borne diseases a regional analysis. Bulletin of the World Health Organization 78(9), 1136–1147(2000).
- Gubler, D.J. Dengue and dengue hemorrhagic fever in the Americas. P. R. Health Sci. J. 6, 107–111(1987).
- Shepard, D.S., Undurraga, E.A., Halasa, Y.A. Economic and disease burden of dengue in southeast Asia. PLoS Negl Trop Dis.7, e2055(2013). [CrossRef]
- Lauderdale, J.M. et al. Towards seasonal forecasting of malaria in India. Malaria Journal 13 (310), p.20( 2014). [CrossRef]
- Morse, A.P., Francisco, J.D.R, Hosen, M., Hagedorn, R., Palmer, T.N. A forecast quality assesment of an end-to-end probabilistic multi-model seasonal forecast system using a malaria model. Tellus 57A, 464-475(2005). [CrossRef]
- Goswami, P., Rao, K.B. Simulation of heavy rainfall events over Indian region: a benchmark skill with a GCM. Climate Dynamic (2014). doi:10.1007/s00382-014-2444-6. [CrossRef]
- Goswami, P., Himesh, S., Goud, B.S. Comparative Analysis of the Role of Domain Size, Horizontal Resolution and Initial Conditions in the Simulation of Tropical Heavy Rainfall Events Meteorological Applications. Meteorol. Appl. 19, 170 – 178(2011). [CrossRef]
- Goswami, P., Mallick, S., Gouda, K.C. Objective De biasing for Improved Forecasting of Tropical Cyclone Intensity with a Global Circulation Model. Mon. Wea. Rev. 139, 2471–2487(2011). [CrossRef]
Figure 1.
Correlation coefficients between the annual number of dengue cases and the number of days in four categories of rainfall during the period 1998-2011 at annual and three seasonal timescales. The horizontal dash line represents 95% significance (0.497) level of correlation for the degree of freedom involved.
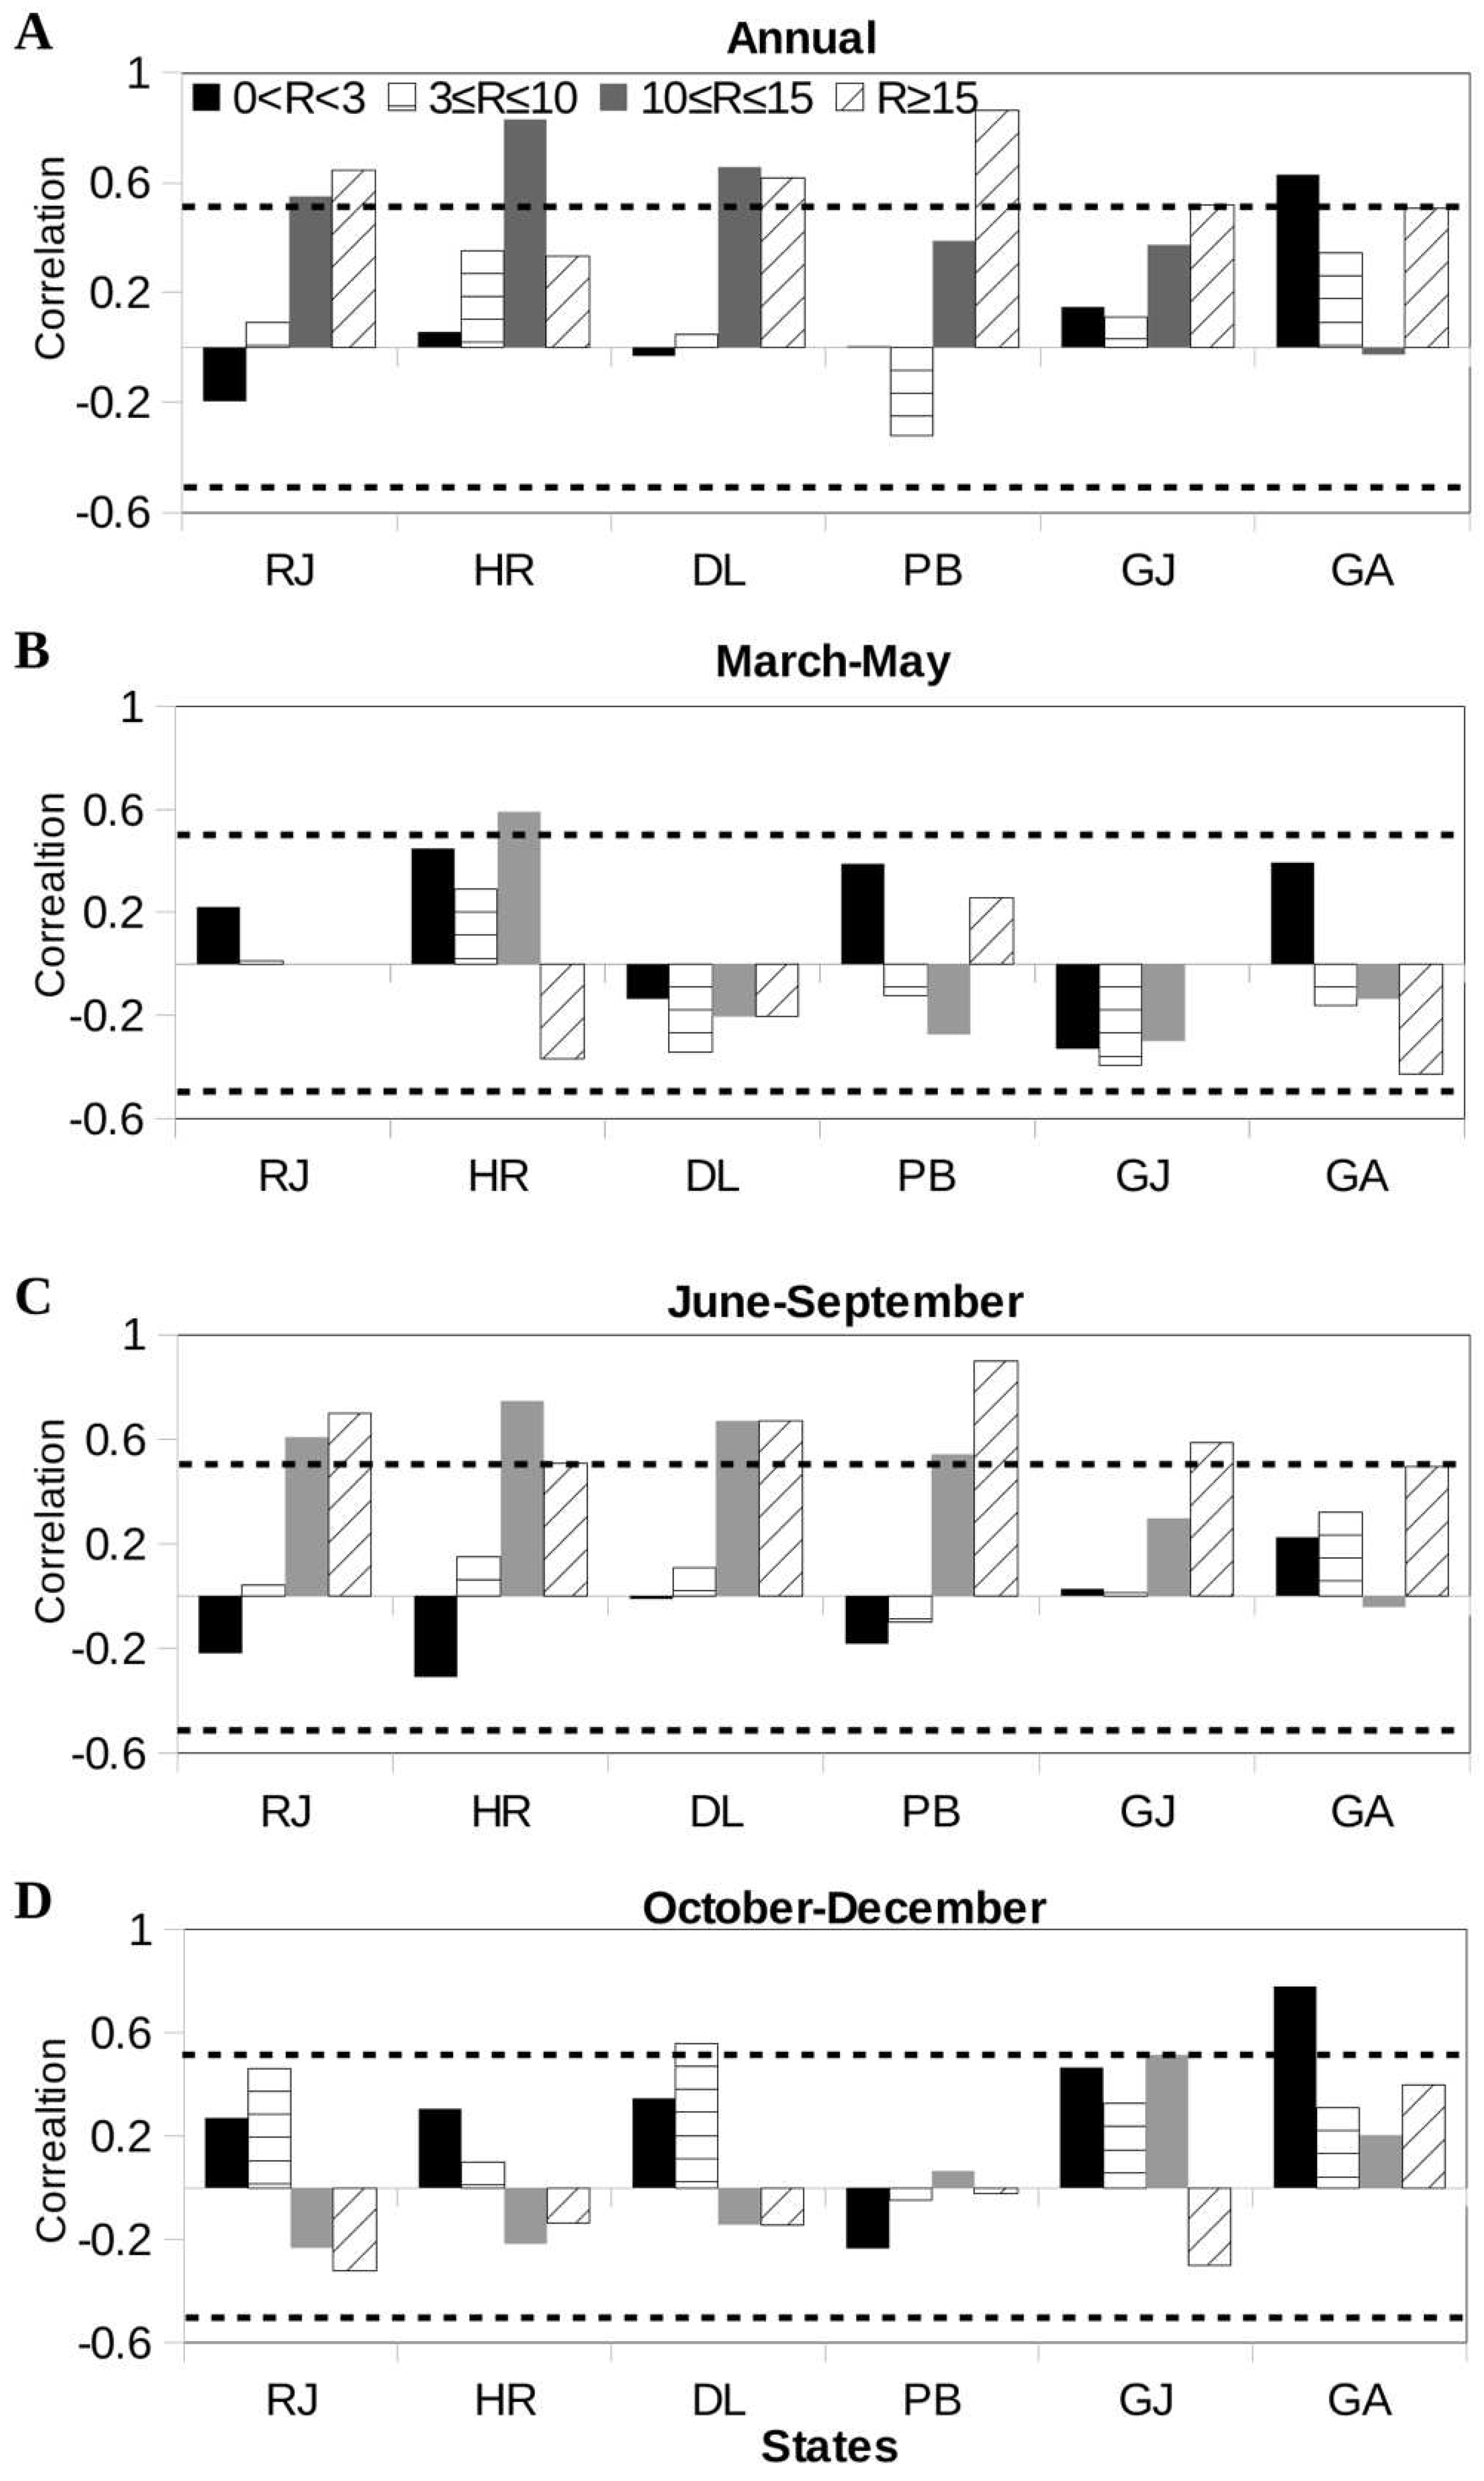
Figure 2.
Inter annual variability in the annual number of heavy rainfall days and the annual dengue cases for the six states. The numbers in the brackets represent correlation coefficients between dengue cases and the annual number of rainy days for the respective rainfall categories for the period of 1998-2011; the 95% significance of correlation is 0.497.
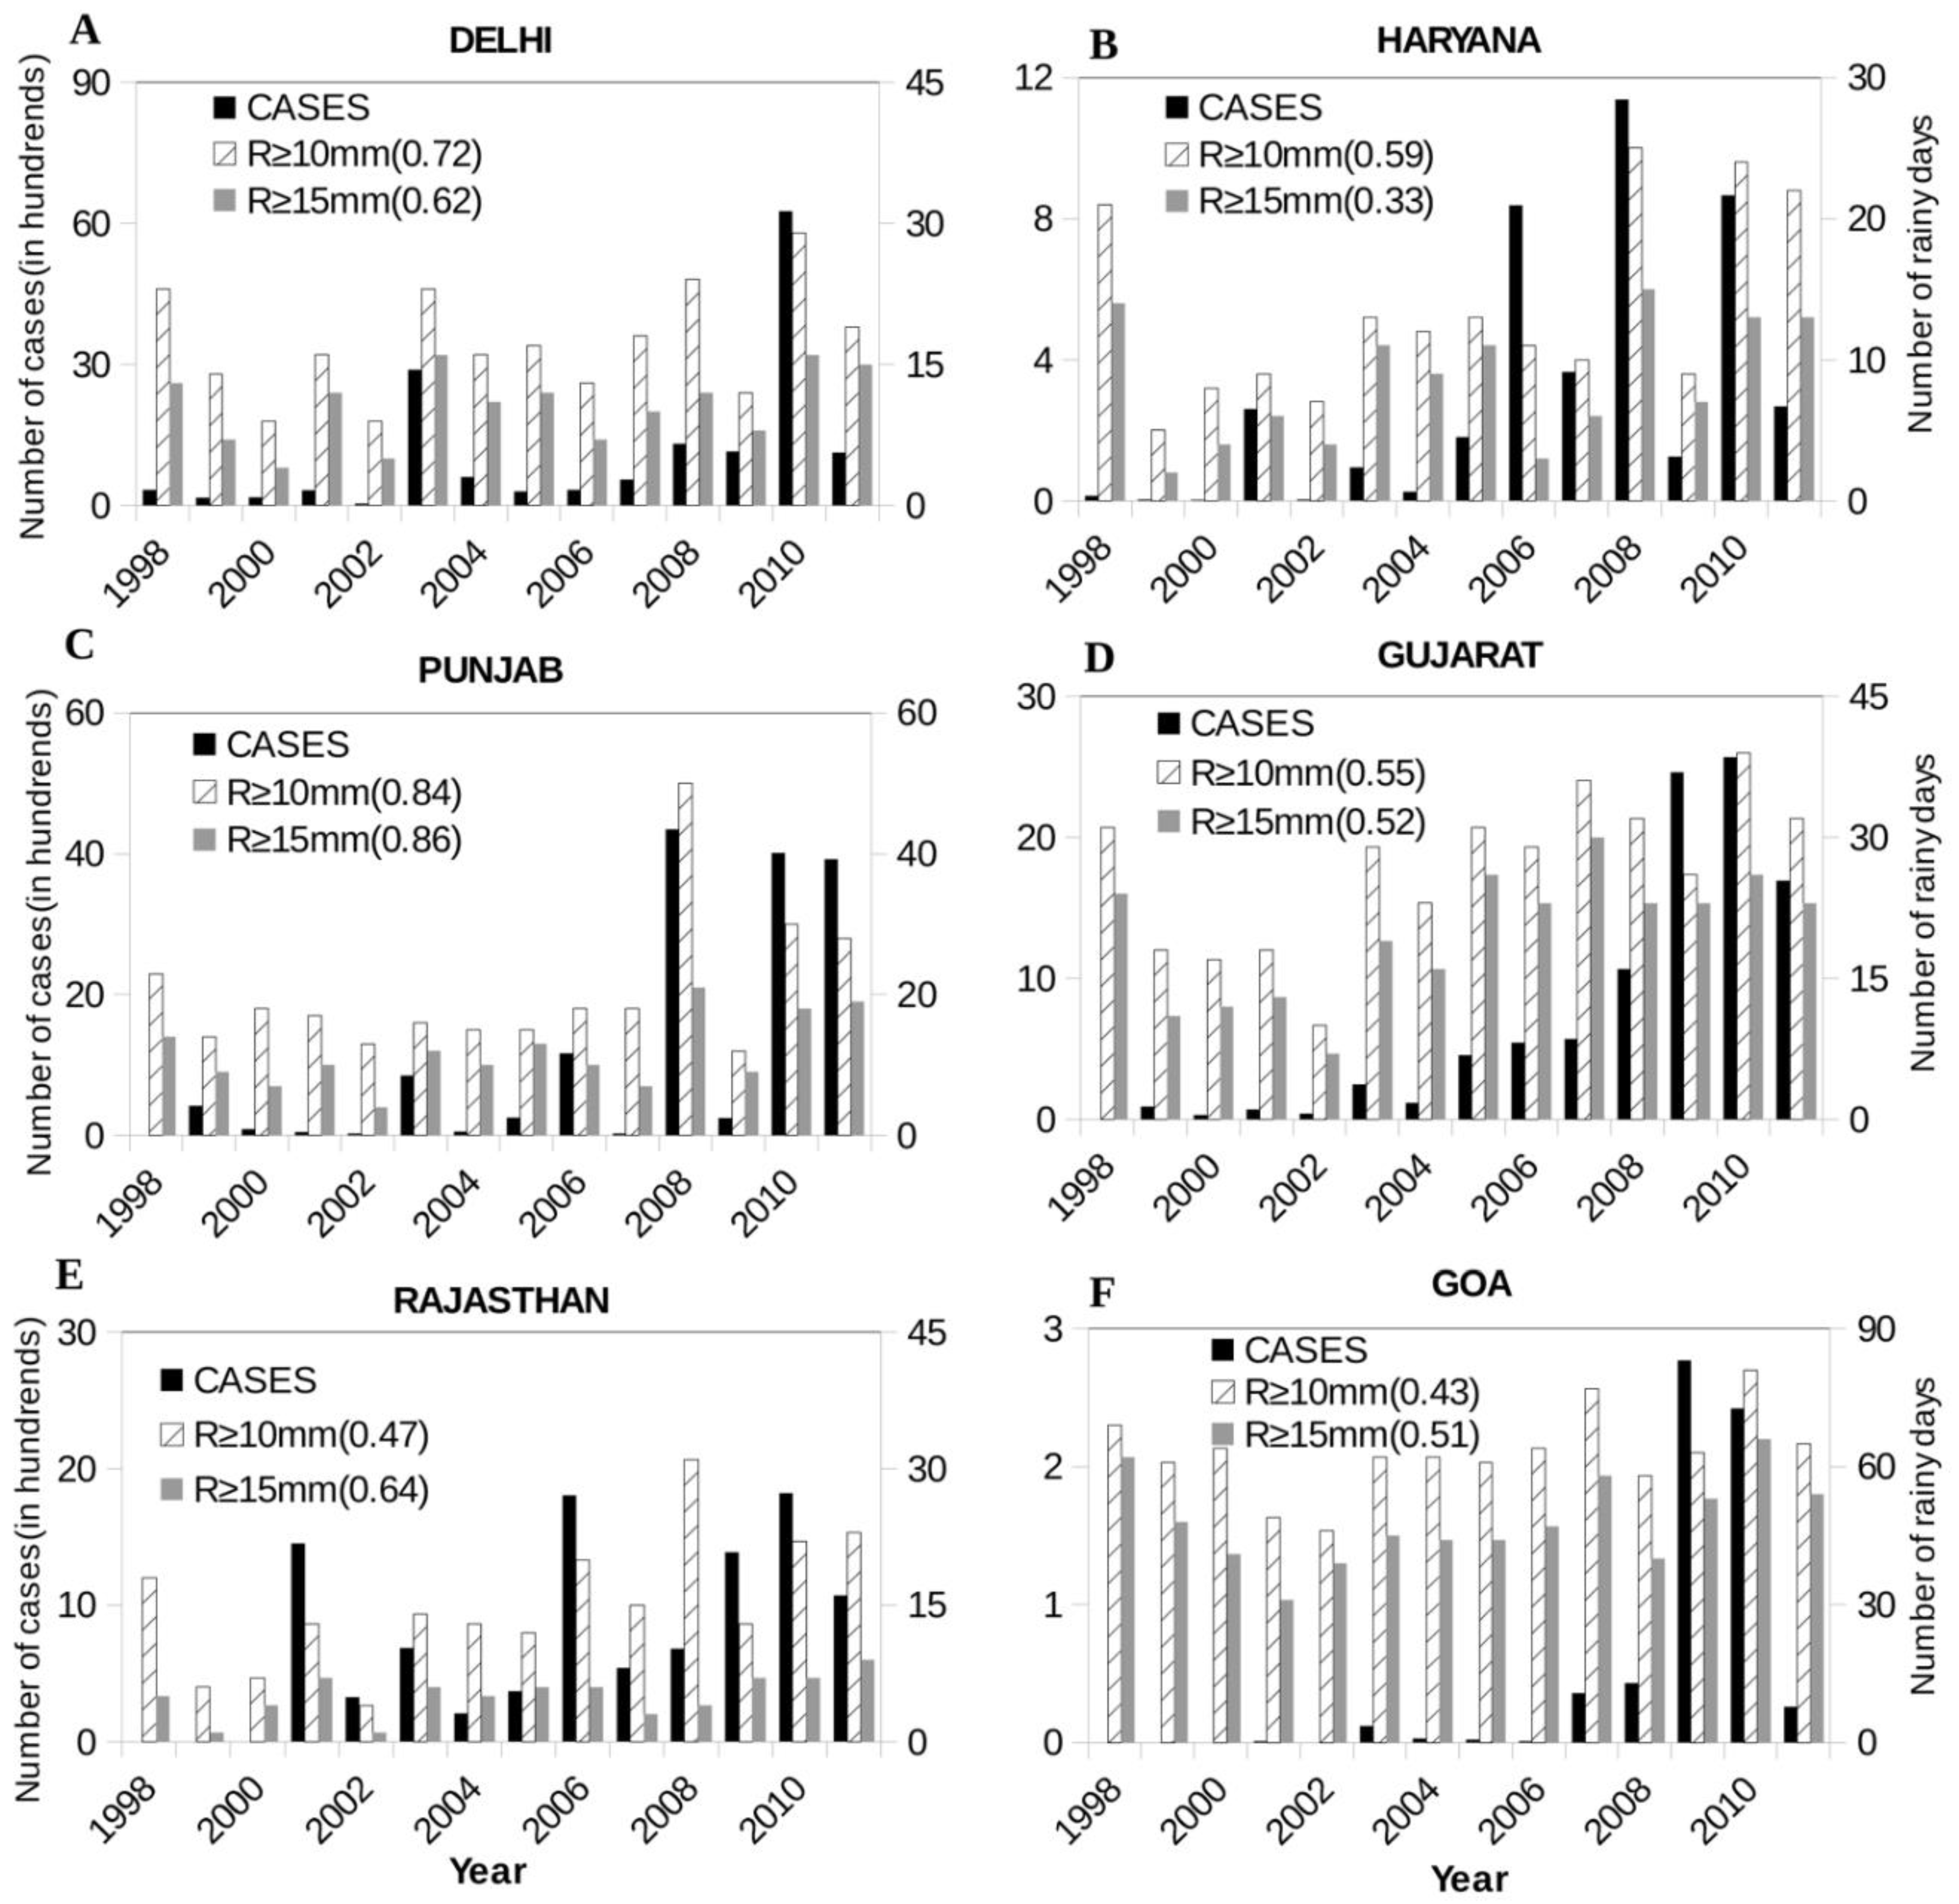
Figure 3.
Coefficient of linear trends in days /year (left Y axis) and as % of respective standard deviation (right Y axis) for the period of 1998-2011 for the four time scales (seasons) and six states. The results are for the heavy rainfall category (R≥10 mm/day).The horizontal dash line represents ±10% of linear trend (% of SD).
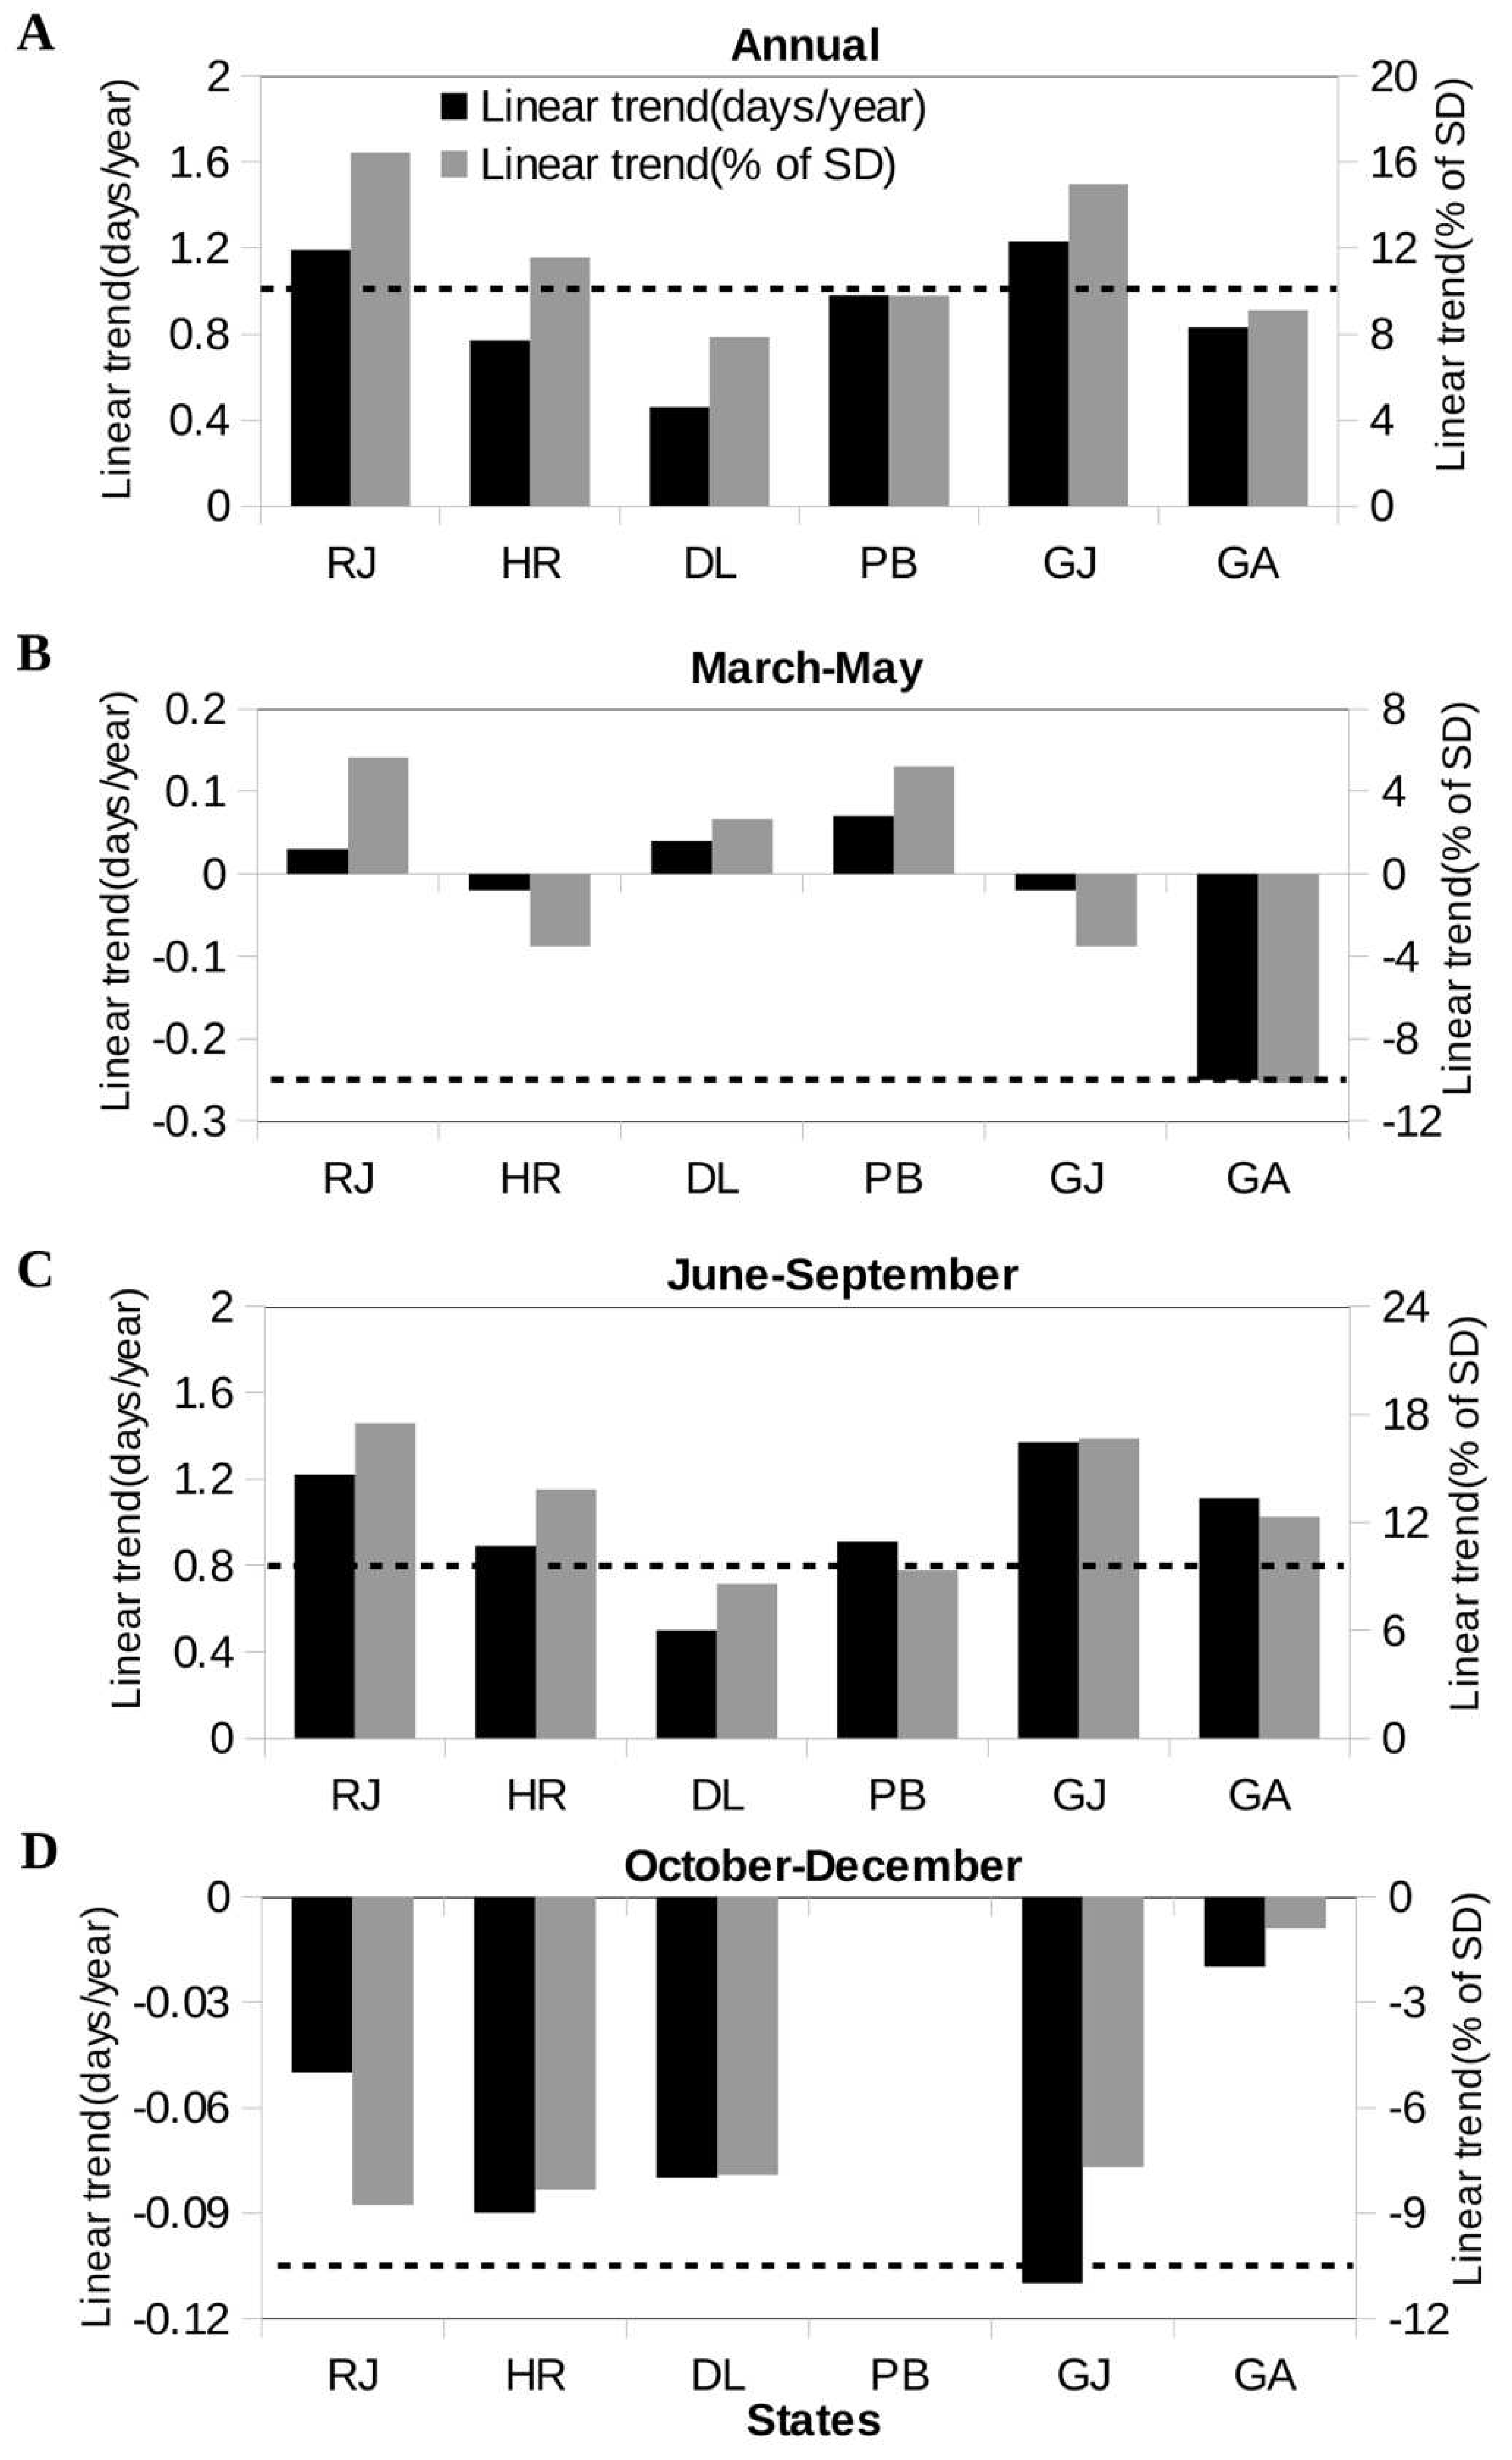

Table 1.
Characteristics of the six locations (in order of increasing annual rainfall) from 1998 to 2011.
Table 1.
Characteristics of the six locations (in order of increasing annual rainfall) from 1998 to 2011.
| States | Population (1000) | General climate | Annual mean rainfall (mm) | Average no of cases (% of population) |
|---|---|---|---|---|
| Rajasthan (RJ) | 14456 | Arid | 1.49 | 0.005 |
| Haryana (HR) | 7098 | Semi-arid | 1.49 | 0.004 |
| Delhi (DL) | 14794 | Semi-arid | 1.62 | 0.007 |
| Punjab (PB) | 9253 | Semi-arid | 2.18 | 0.011 |
| Gujarat (GJ) | 54208 | Semi-arid | 2.51 | 0.001 |
Disclaimer/Publisher’s Note: The statements, opinions and data contained in all publications are solely those of the individual author(s) and contributor(s) and not of MDPI and/or the editor(s). MDPI and/or the editor(s) disclaim responsibility for any injury to people or property resulting from any ideas, methods, instructions or products referred to in the content. |
© 2023 by the authors. Licensee MDPI, Basel, Switzerland. This article is an open access article distributed under the terms and conditions of the Creative Commons Attribution (CC BY) license (http://creativecommons.org/licenses/by/4.0/).
Copyright: This open access article is published under a Creative Commons CC BY 4.0 license, which permit the free download, distribution, and reuse, provided that the author and preprint are cited in any reuse.


