

Submitted:
29 November 2023
Posted:
30 November 2023
You are already at the latest version
Abstract
This paper presents the mathematical modeling for designing a 10[kW] DC-AC inverter system from 48 [V] DC to 120 V ACrms, considering its non-linear operation, allowing to obtain a detailed simulation to assess the proposed fuzzy PI control (with anti-windup action) and its optimal operation. The performance assessment of the converter was carried out with the discrete treatment of the voltage and current signals using spectral analysis, filtering considerations, and evaluation of limit cycle technique to determine the system's stability. The main results showed that THD at the filter output (transformer and capacitor) was around 0.0322% and 0.0632% at nominal load in open loop and closed loop, respectively. The inverter system presented more sensitivity in the current signal with a ripple at 120 [Hz] of 2.02% and at 5000 [Hz] of 10.62% (at nominal load). However, when the system operates in a closed loop, the current ripple at 120 [Hz] is 2.38% and at 5000 [Hz] is 10.62%.
Keywords:
DC-AC Inverter
; anti-windup
; fuzzy PI control
; spectral analysis
; microgrids
1. Introduction
Power electronics play a fundamental role in efficient energy conversion and control in various applications, ranging from consumer electronics applications to electric propulsion systems and integrating renewable energy resources in microgrids [1,2,3]. For instance, electric mobility applications demand the implementation of voltage inverter systems for the power supply and control of AC motors for electric traction, such as those reported in [4,5]. Likewise, DC-AC inverters assume a crucial role by allowing the conversion of direct current voltages into alternating current, thus facilitating the integration of DC sources into conventional electrical grids or the power supply of AC loads. Inverter systems are also used in applications of injection of renewable energy in DC into the conventional grid in AC, such as the works reported in [6,7]. However, optimizing and controlling inverters remains a substantial challenge, as it involves both ensuring the quality of the output waveform and the energy efficiency of the conversion [8].
More broadly, a significant body of knowledge has been accumulated within the scope of application of DC-AC inverters. Oh et al. [9] presented an innovative approach using an integrated Z-source DC-AC inverter controlled by symmetrical and asymmetrical voltages, contributing to the advancement of high-performance power converters. Research, such as that of Hsieh et al. [10], has explored the design and implementation of a novel 7-level output voltage inverter, achieving a notable decrease in harmonics upon conversion with an efficiency greater than 96%. Regarding the use of DC-AC inverters in microgrid applications, Engelhardt et al. [6] carried out the optimized control of a DC microgrid with a busbar array for high-power electric vehicle charging keeping the DC-AC conversion out of the control. Furthermore, Huynh et al. [11] explored the design and implementation of modified three-level reverse-phase inverters for powering three-phase loads. Villanueva et al. [12] investigated the reliability of transformerless DC/AC photovoltaic converters based on the mission profile, contributing to the development of robust and efficient solutions.
In the context of the control algorithms of DC-AC voltage inverters and their applications, control techniques based on fuzzy logic and its different variants have demonstrated their effectiveness. Lim et al. [13] proposed a fuzzy PI controller for energy management and zero power flow between the main and local grid in photovoltaic systems. Javadi et al. [14] introduced a fuzzy logic-controlled intelligent transformer for current imbalance compensation in a power grid. Furthermore, Srikanth et al. [7] presented a bidirectional operation of a dual-mode PV inverter for seamless power transfer between DC and AC loads along with the grid interface. The research of Rodríguez-Flores et al. [15] is cited for expanding the use of fuzzy logic in electrical applications, who demonstrated the application of a proportional-integral controller and a proportional controller based on Mandani fuzzy logic and connected in cascade to determine the reference generation power and the reference phase shift of the generator in order to perform synchronization between the main grid and a decentralized microgeneration system through a 140 [kVA] inverter.
This paper presents a comprehensive approach for designing a 10 [kW] transformer-isolated DC-AC inverter controlled by a fuzzy PI controller with anti-windup mitigation techniques. The proposed methodology fuses fuzzy control principles with anti-windup mitigation techniques [16,17,18], intending to improve both the quality of the output waveform and the transient response of the inverter. Throughout this study, the theoretical aspects, the design, and control implementation of the inverter will be detailed, as well as the results obtained and their meaning in the context of efficient and high-quality DC-AC energy conversion, contrasting the data obtained from open and closed loop performance assessment. In particular, the effect of anti-windup in the controller on the output AC signal's total harmonic distortion (THD) are discussed.
2. Materials and Methods
2.1. Nomenclature

| DC-DC booster capacitance | |
| Inverter filter capacitance | |
| COS | Command of Switch |
| Switching duty cycle | |
| DC-DC booster switching frequency | |
| Fundamental frequency for the spectral study | |
| Frequency under study | |
| Indexer | |
| Diode current | |
| DC input current from the DC-DC booster or battery pack | |
| Reverse leakage current | |
| Average current (at zero frequency in the spectral study) | |
| DC-DC booster inductance | |
| Number of samples in the register | |
| Inverter power | |
| DC-DC booster output power | |
| Input power of the DC-DC booster or supplied by battery pack | |
| pwm | Pulse Width Modulation |
| Resistance seen from the AC side at the output of the invertir | |
| Resistance seen from the DC side at the output of the booster | |
| Equivalent resistance with parallel connection between , and | |
| Resistance seen from the DC side at the output of the invertir | |
| Non-linear resistance at the inverter switch 1 | |
| Non-linear resistance at the inverter switch 2 | |
| Non-linear resistance at the inverter switch 3 | |
| Non-linear resistance at the inverter switch 4 | |
| Percent ripple | |
| Booster switch | |
| Inverter switch 1 | |
| Inverter switch 2 | |
| Inverter switch 3 | |
| Inverter switch 4 | |
| Period or inverse of DC-DC booster switching frequency | |
| Temperature | |
| Filtering time constant at the inverter output | |
| Total harmonic distortion | |
| Sample time | |
| Average voltage (at zero frequency in the spectral study) | |
| Voltage in the capacitor | |
| Diode voltage | |
| Voltage in the invertir | |
| Voltage in the inductor | |
| DC voltaje in the output of the booster | |
| Quadratic value of the DC voltaje at the booster output | |
| RMS voltage | |
| Quadratic value of the RMS voltage | |
| DC voltage at the booster input or at the battery pack | |
| Voltage in the booster switch | |
| Voltage in the invertir switch 1 | |
| Voltage in the invertir switch 2 | |
| Voltage in the invertir switch 3 | |
| Voltage in the invertir switch 4 | |
| Voltage by termal effect | |
| i-th sample in the register | |
| Absolute variation of DC-DC booster output current | |
| Absolute variation of DC-DC booster output voltage |
2.2. Parameterization of the DC-DC boost converter
The primary consideration to be considered for the design of this stage is the equivalent load the DC-DC source has connected, considering that the active power after modulation is . Equations (1) to (6) enable the determination of the minimum impedance value seen by the DC-DC boost converter and its value reflected by inverter.
Equation (1) displays the output power of the inverter system as a reference for the designed system.
Equation (2) demonstrates the relationship between the power of the inverter system and the output of the DC-DC converter.
Starting from equation (2), equations (3) to (5) are obtained, with the latter equation relating the load resistance of the inverter system to achieve the maximum design power with the minimum resistance for the maximum power of the DC-DC converter.
Hence, it is determined that the resistance of the DC-DC converter should be twice the value seen by the inverter system, as depicted in equation (5).
Considering the root mean square voltage of the inverter system as and its maximum power of , the minimum resistance to achieve this power is obtained, thereby determining the minimum resistance with which the DC-DC converter must be designed to deliver the maximum power, as shown in equation (6).
Taking into account the fundamental equations regarding switching in the boost DC-DC converter:
Given and supplied by the battery pack, the following results are obtained:
Considering a switching frequency of , a ripple factor of , and with , the value of can be determined using equation (9).
Therefore, the capacitance value can be observed in the equation (10).
With the calculated values for capacitance and resistance, along with the switching frequency and duty cycle, using equation (11), the minimum value of inductance is determined to satisfy a desired DC voltage level at the output of the DC-DC converter.
Thus, the inductor value must exceed the calculated value in equation (12), to ensure continuous current flow in the inductor.
Considering the minimum inductance value ensures a minimum inductor current of zero Amperes in steady-state, which does not guarantee continuous current. However, if the current variation is equal to one-eighth of the average current, a value of inductance can be determined that satisfies the source's performance with the criterion of continuous current in the inductor, as shown in equation (13) to (16).
2.3. Nonlinear and dynamic model of the DC-DC boost and AC inverter system
Figure 1 illustrates the basic topology for voltage boosting from to , which is used in the inverter stage to generate .
The load seen by the DC-DC source depends on the load of the inverter system, which can be simplified as depicted in Figure 2.
The load seen by the DC-DC source will depend on the state of the switches. If it is assumed that the operation of the switches is synchronized in pairs, and each pair has identical resistance values, such that y , then, if there is an equivalent resistance given by (17) and an instantaneous resistance seen at the output of the DC-DC converter, given by (18) and presented in a simplified form in (19).
In equation (19), if y values tend towards high impedance, then will also tend towards high impedance. Conversely, if y tend towards low impedance, will tend towards low impedance, considered an undesired condition. Control actions are implemented to prevent this. An impedance seen by the DC-DC source with a value of is achieved when the values alternate between low and high impedance for y . In summary, takes the following values based on the impedances of switches , , y , considering = y =, as observed in equation (20).
The determination of switch impedance values is conditioned by comparison criteria. If we first analyze , we can determine its impedance behavior. Figure 3 illustrates how the duty cycle signal is generated, and this signal controls on DC-DC converter. Equation (21) represents the trend of impedance when it receives the Command of Switching (COS).
If, in the second place, the remaining switches, , , and , are analyzed, their impedance behavior is determined. Figure 4 illustrates how the control signals for both sinusoidal modulation and the operation of the inverter bridge are generated, with these signals commanding switches, , , and . Equation (22) depicts the impedance trend of the switches when they receive the switching command, considering that = and =.
For this purpose, the impedances of the switches or transistors have values of expression (23):
The instantaneous considerations of the model are ultimately formulated with the Schockley equation for the diode, as shown in the equation (24).
The following values are used as parameters for the diode in equation (24).
The system's dynamics are characterized by two fundamental dynamic elements: one that stores energy in a magnetic field, and the other that stores energy in an electric field, namely, the inductor and the capacitor. The dynamics of the inductor are described by equation (26) while those of the capacitor are represented by equation (27).
Considering that the voltage across the inductor is given by equation (28) and the current through the capacitor by equation (29), the nonlinear model that replicates the dynamic behavior of the DC-DC boost converter with a final inverter stage and sinusoidal PWM modulation is depicted in Figure 5.
2.4. Assessment of open-loop performance
The assessment of the open-loop performance of the source is based on the behavior of ripple in steady-state conditions at both the switching design frequency and the inverter system frequency, as well as the synthesized sinusoidal signal frequency. The study relies on the spectral behavior of the resulting signals at the frequencies of interest and the mathematical framework that enables this assessment.
At the frequency of interest , the ripple equation allows for quantifying its value. Considering that the frequency at which ripple occurs has two causes—one related to switching and the other associated with load variation subjected to sinusoidal modulation—the design criterion is evaluated at the switching frequency, and the overall performance criterion is assessed at twice the frequency of the synthesized sinusoidal signal. Equation (30) presents a mathematical expression developed to assess ripple with dependence on the frequency of interest in the study.
The equation developed to assess the THD aims to provide the flexibility to assign the sinusoidal frequency, with set at for this study, as it corresponds to the frequency of the local electrical grid. However, the signal sample must be selected when the system is in a steady-state condition to ensure that the study is not affected by transients. The equation developed for this purpose is shown in (31).
The study of open-loop behavior is conducted considering a time response within an interval of , during which the transient is reduced and the steady state of operation is reached. For the steady-state study, the time beyond 1 second after startup is considered.
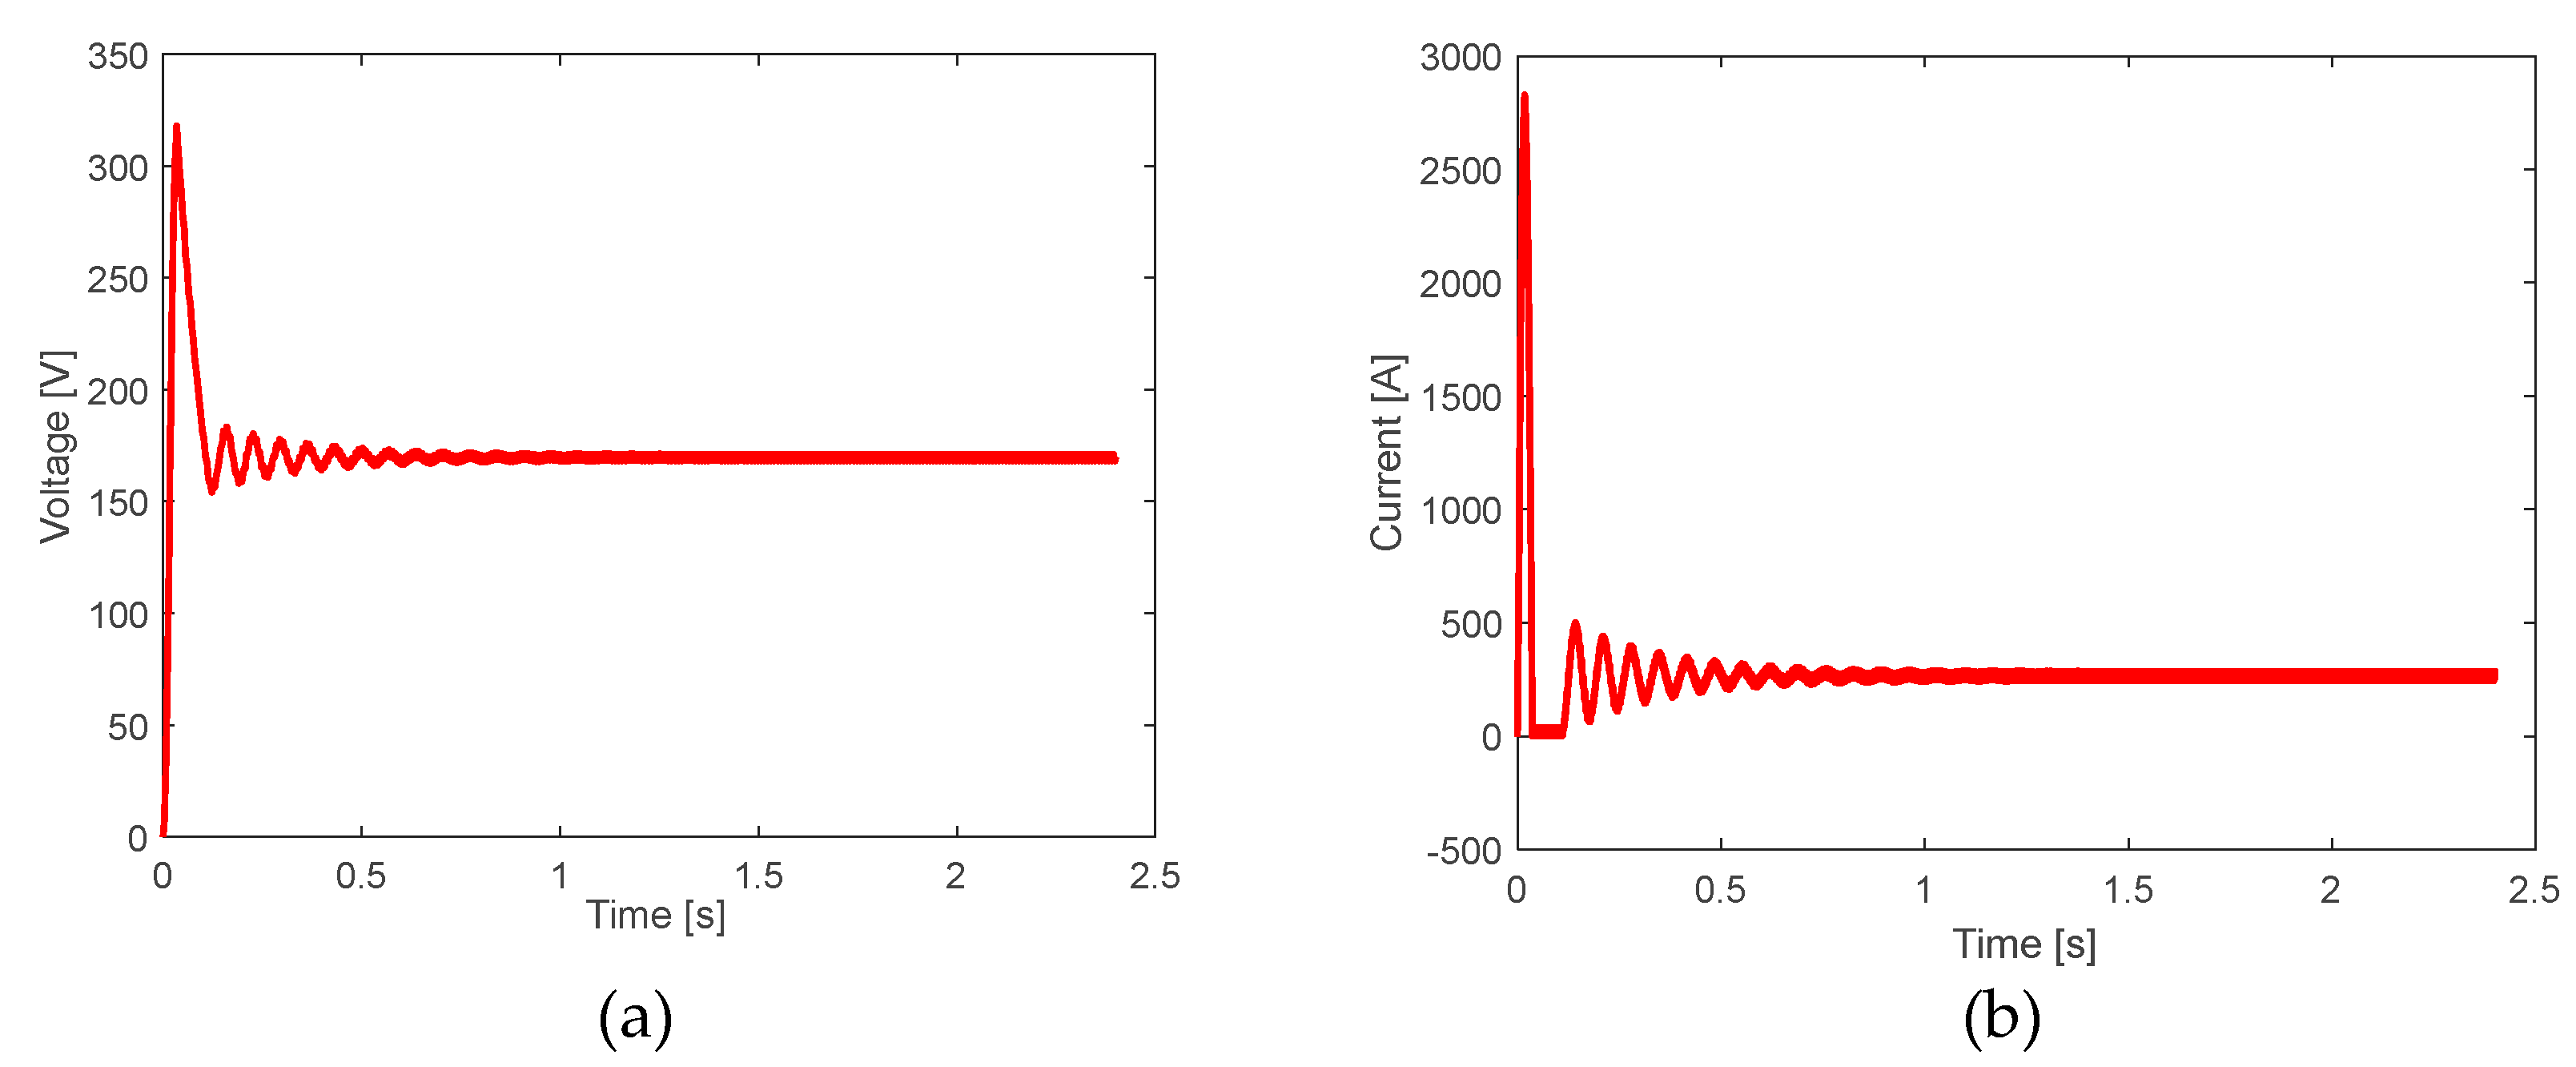
Figures 8(a) and 8(b) allow to observe the voltage and current transients of the source during startup. The voltage measured at the capacitor of the boost source in steady-state is , with , which is the current measured in the loop that includes the inductor for a nominal load. It is possible to observe that during the transient, the voltage reaches a peak that exceeds twice the steady-state voltage, while in terms of current, the peak or overshoot exceeds more than 12 times its value compared to the steady-state current.
Figure 8.
(a) Output voltage of the to DC-DC source. (b) Current measured in the inductor of the DC-DC source.
Figure 8.
(a) Output voltage of the to DC-DC source. (b) Current measured in the inductor of the DC-DC source.
A spectral study allows to determine the value of the magnitude at zero frequency of the capacitor voltage and inductor current belonging to the output boost stage was carried out. Figures 9(a) and 9(b) shown such a voltage and current signals presented in , when these are normalized with respect to a unit value (taking their mean value as a reference), providing information about the behavior of the signals at frequencies of interest in the study.
In this cases, both for voltage and current, frequencies of and become evident. The former is the frequency of the inverter system for generating the PWM sinusoidal signal, and the latter is the chosen switching and elevation system frequency and PWM modulation frequency. Equations (30) and (31) allow for assessing performance indicators under statistical considerations, both for the boost output voltage and the inductor current. Table 1 presents average and ripple values obtained through spectral analysis, highlighting that the study at a frequency of satisfies design conditions for both voltage and current. The frequency appears as a condition due to load variation resulting from sinusoidal PWM switching, and that is why operational ripples are observed for both voltage and current.
Figure 9.
Spectrum in normalized concerning to magnitude at frequency 0 Hz of the: a) output voltage of the to DC-DC source, and b) the output inductor current.
Figure 9.
Spectrum in normalized concerning to magnitude at frequency 0 Hz of the: a) output voltage of the to DC-DC source, and b) the output inductor current.
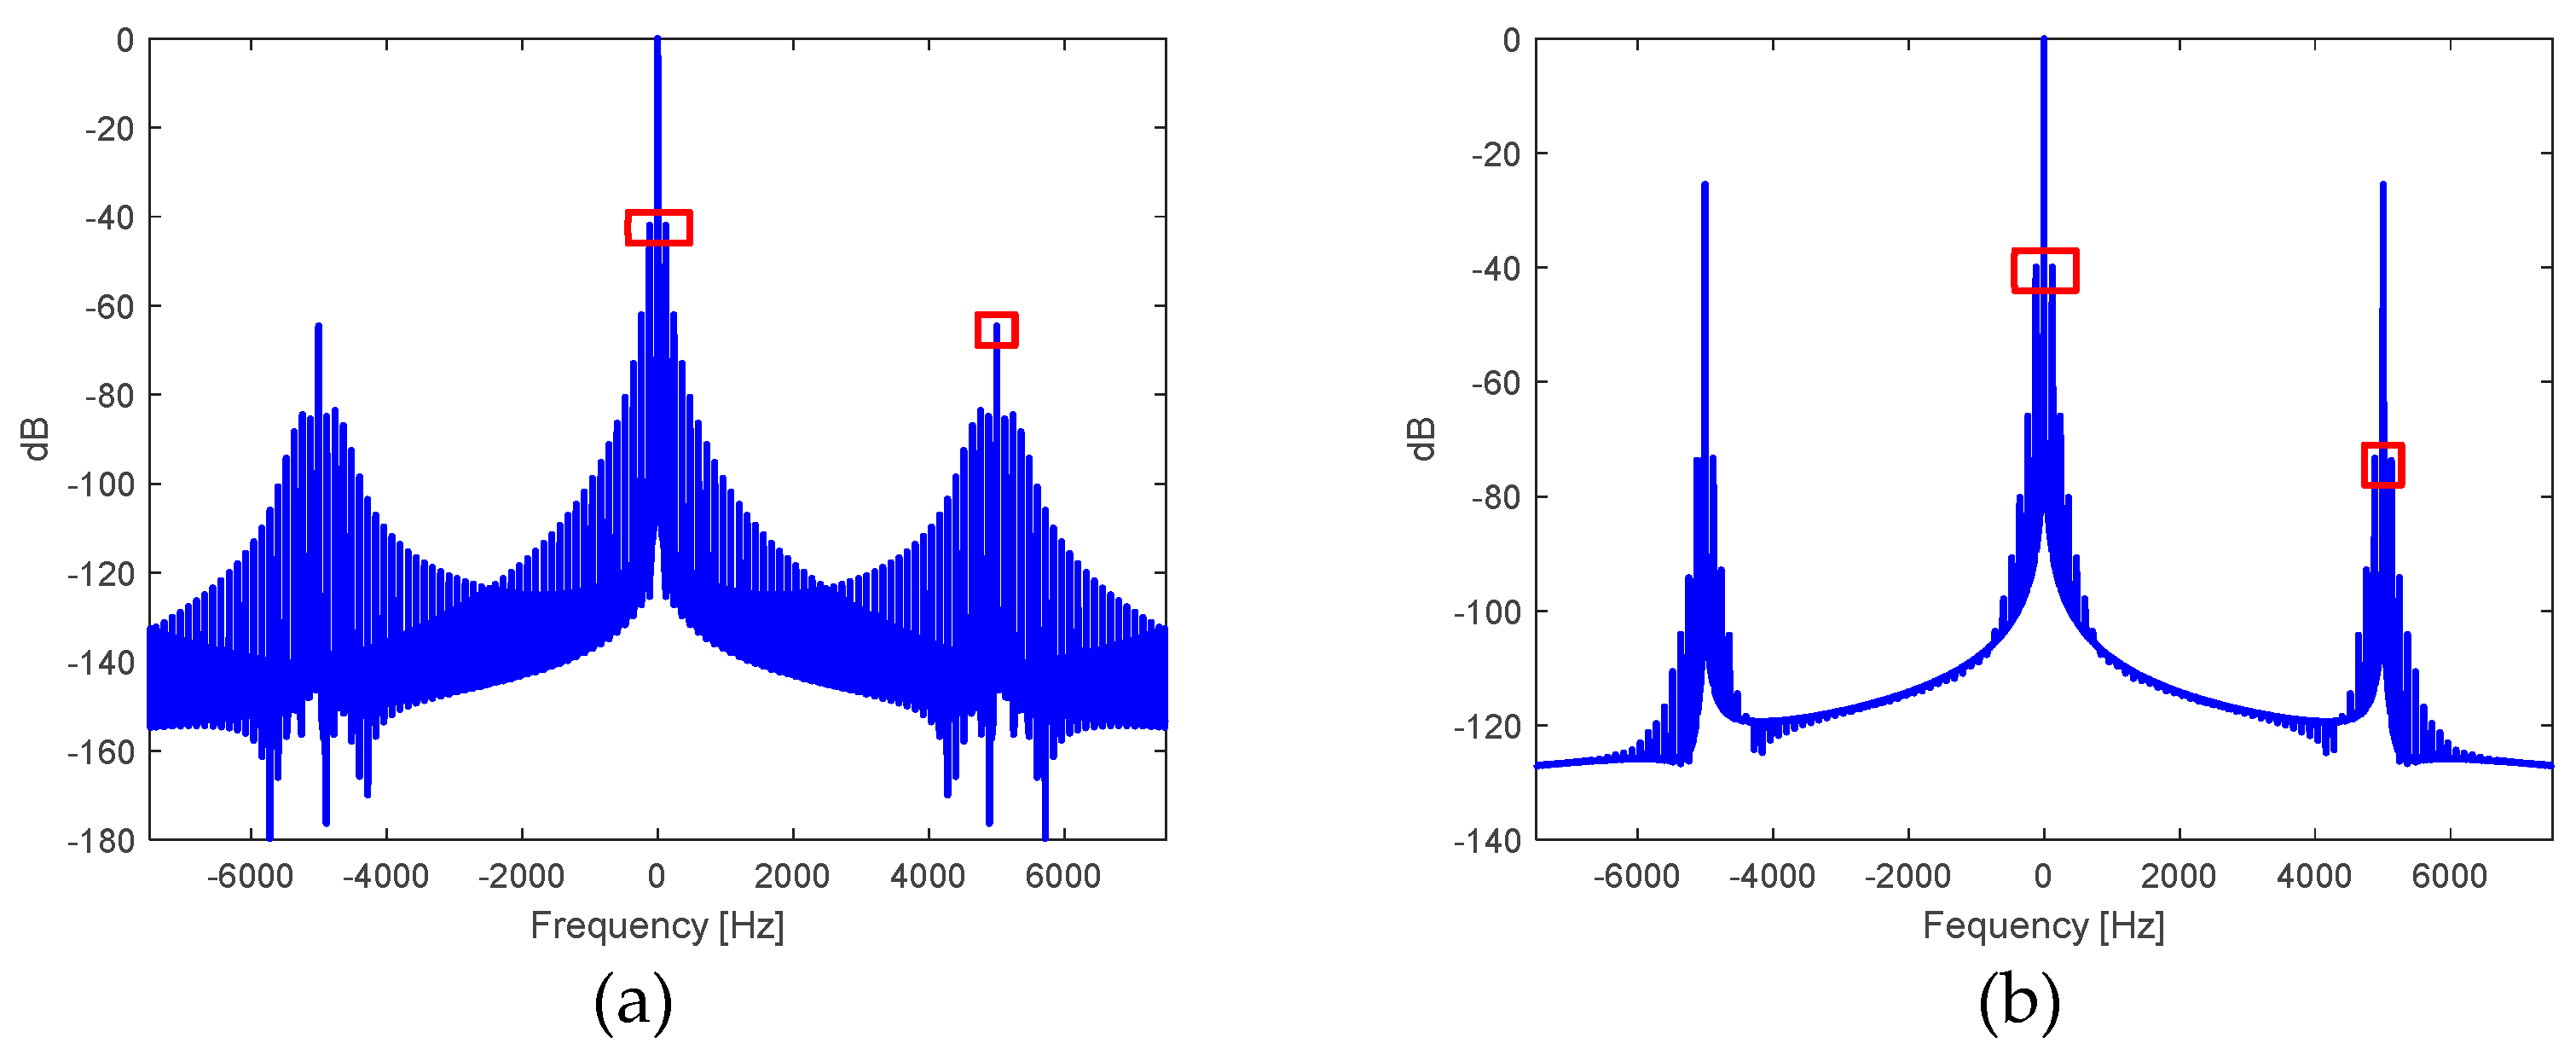
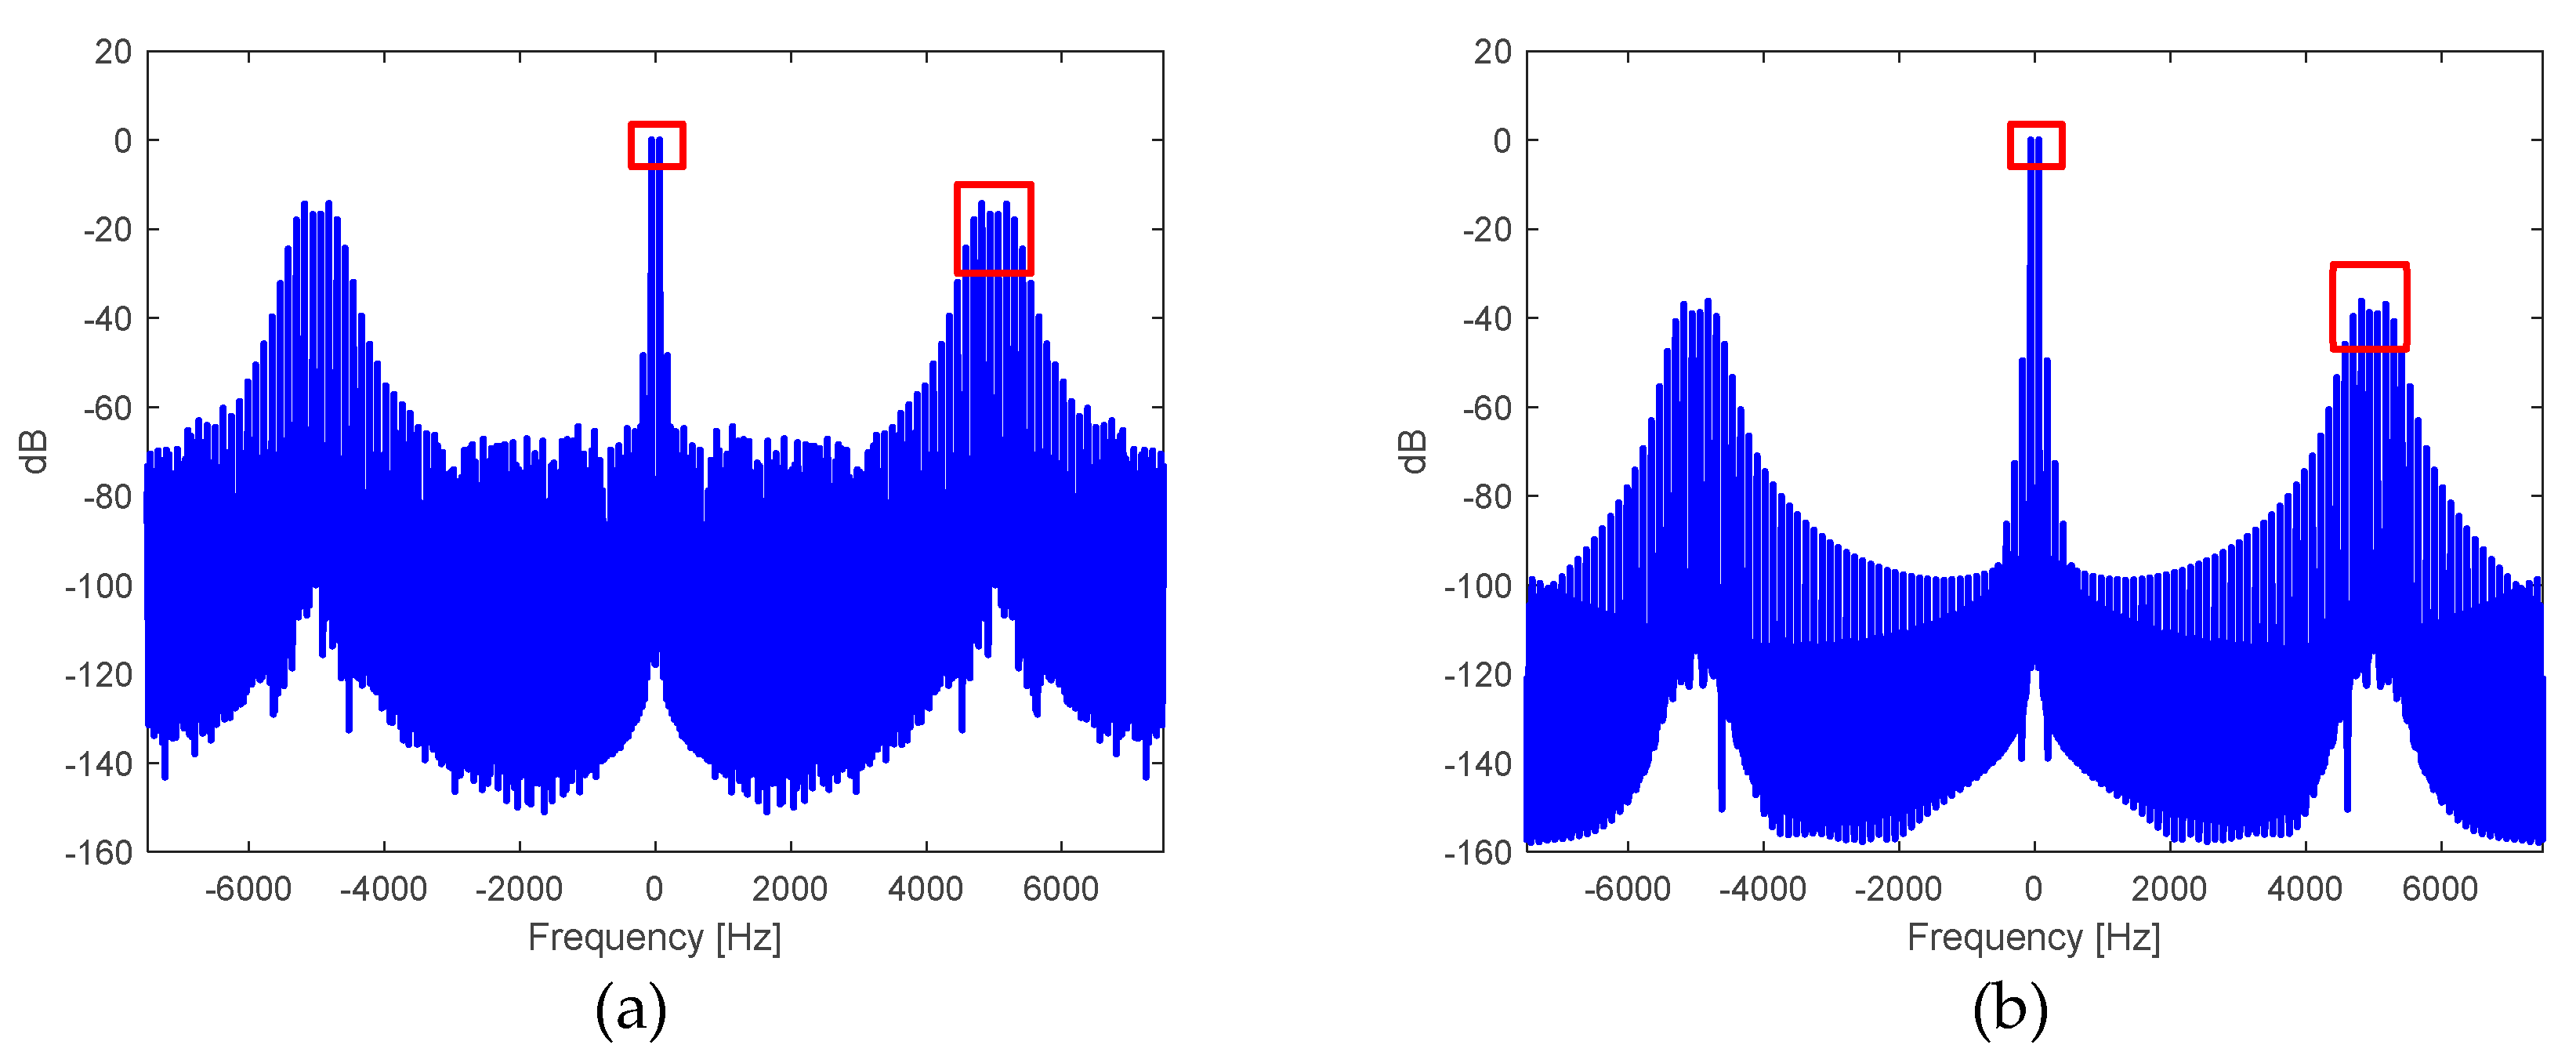
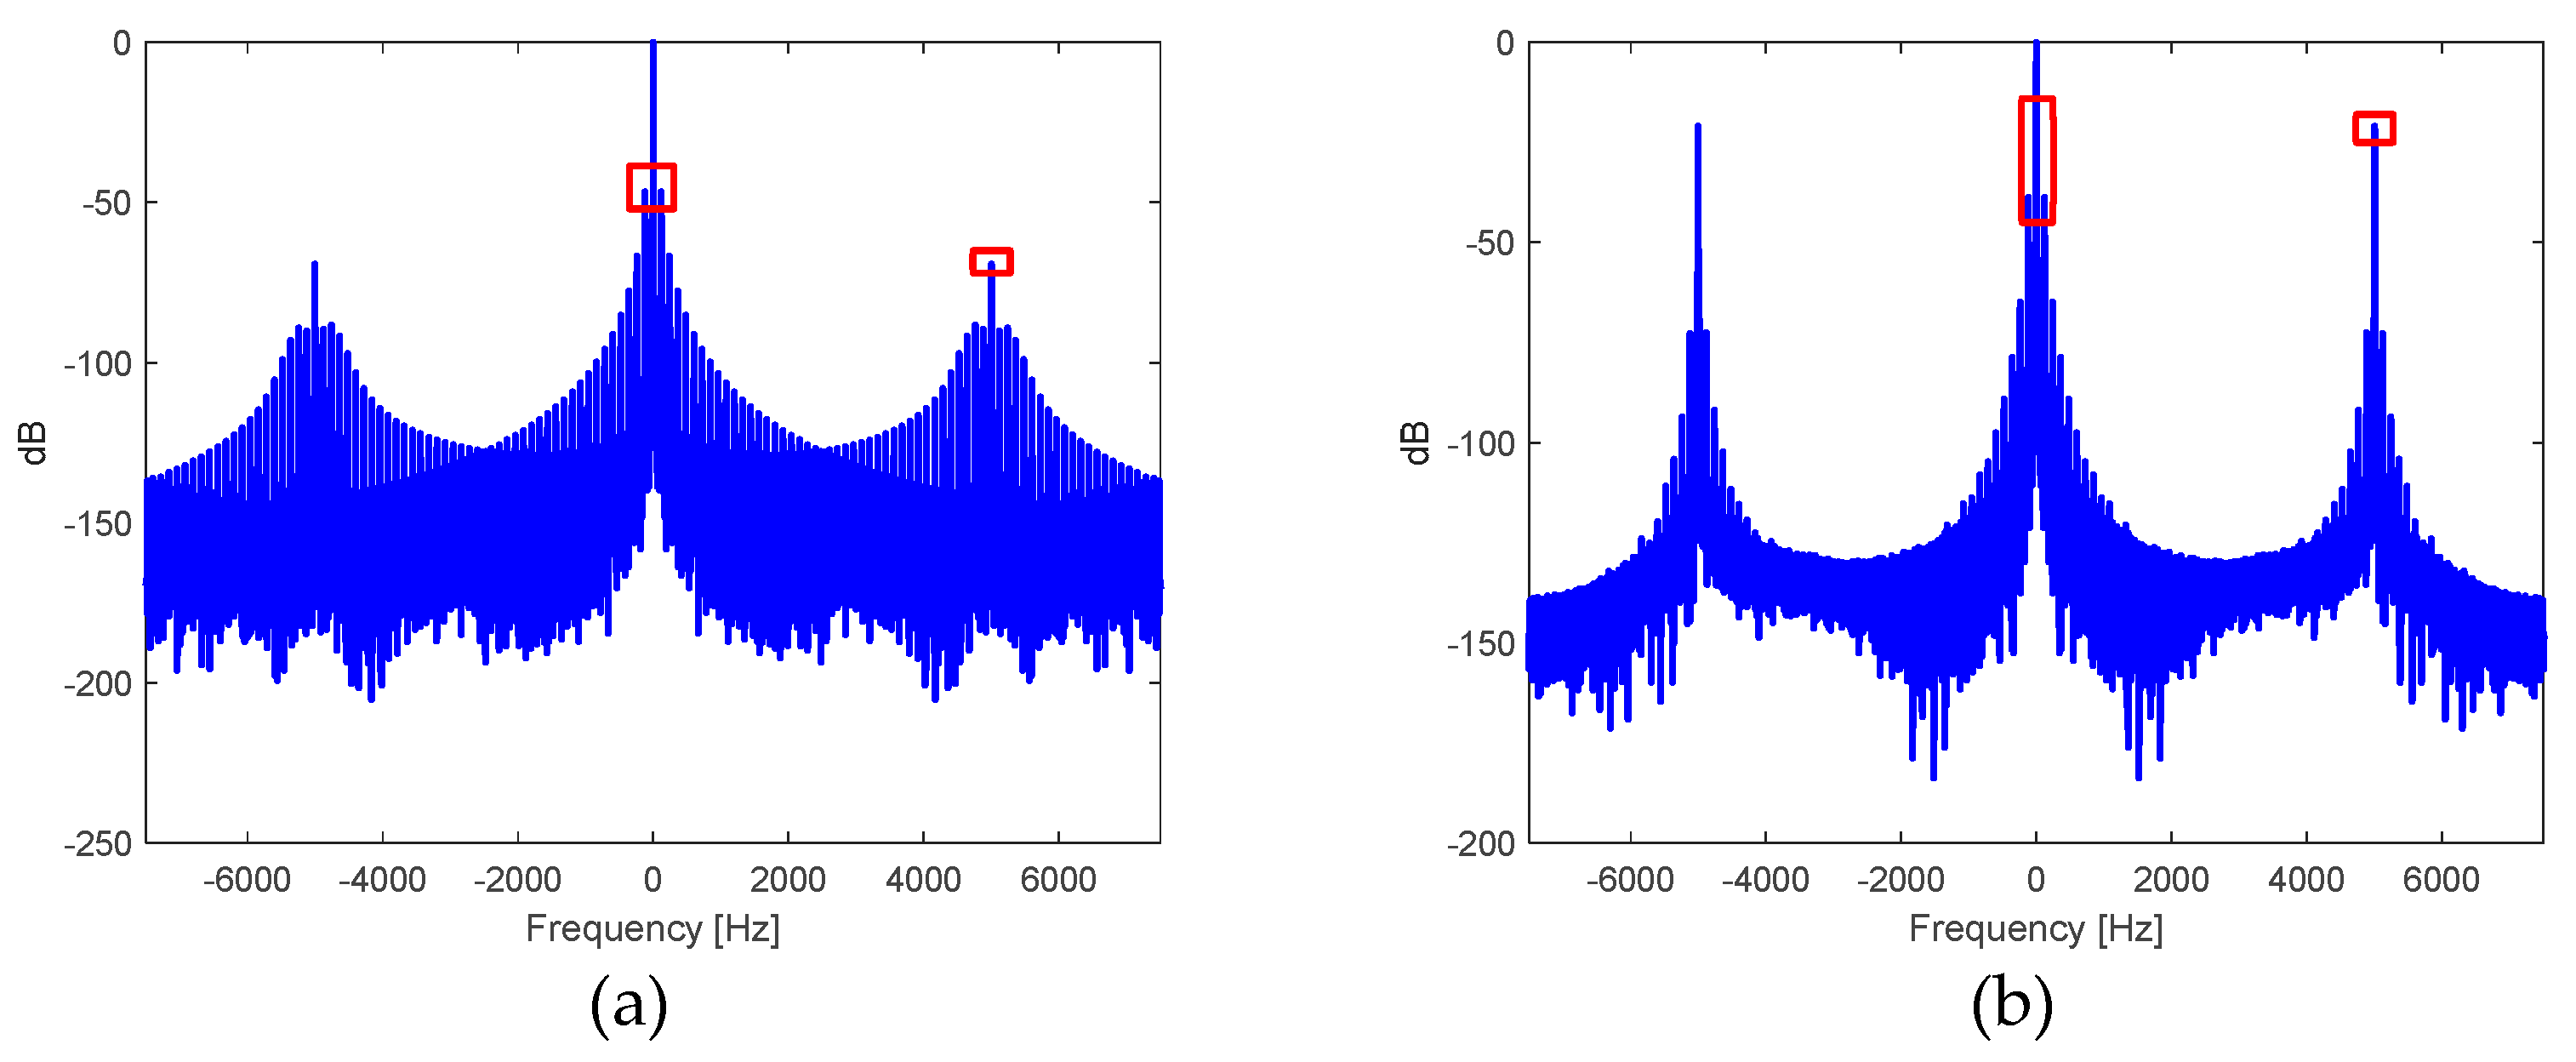
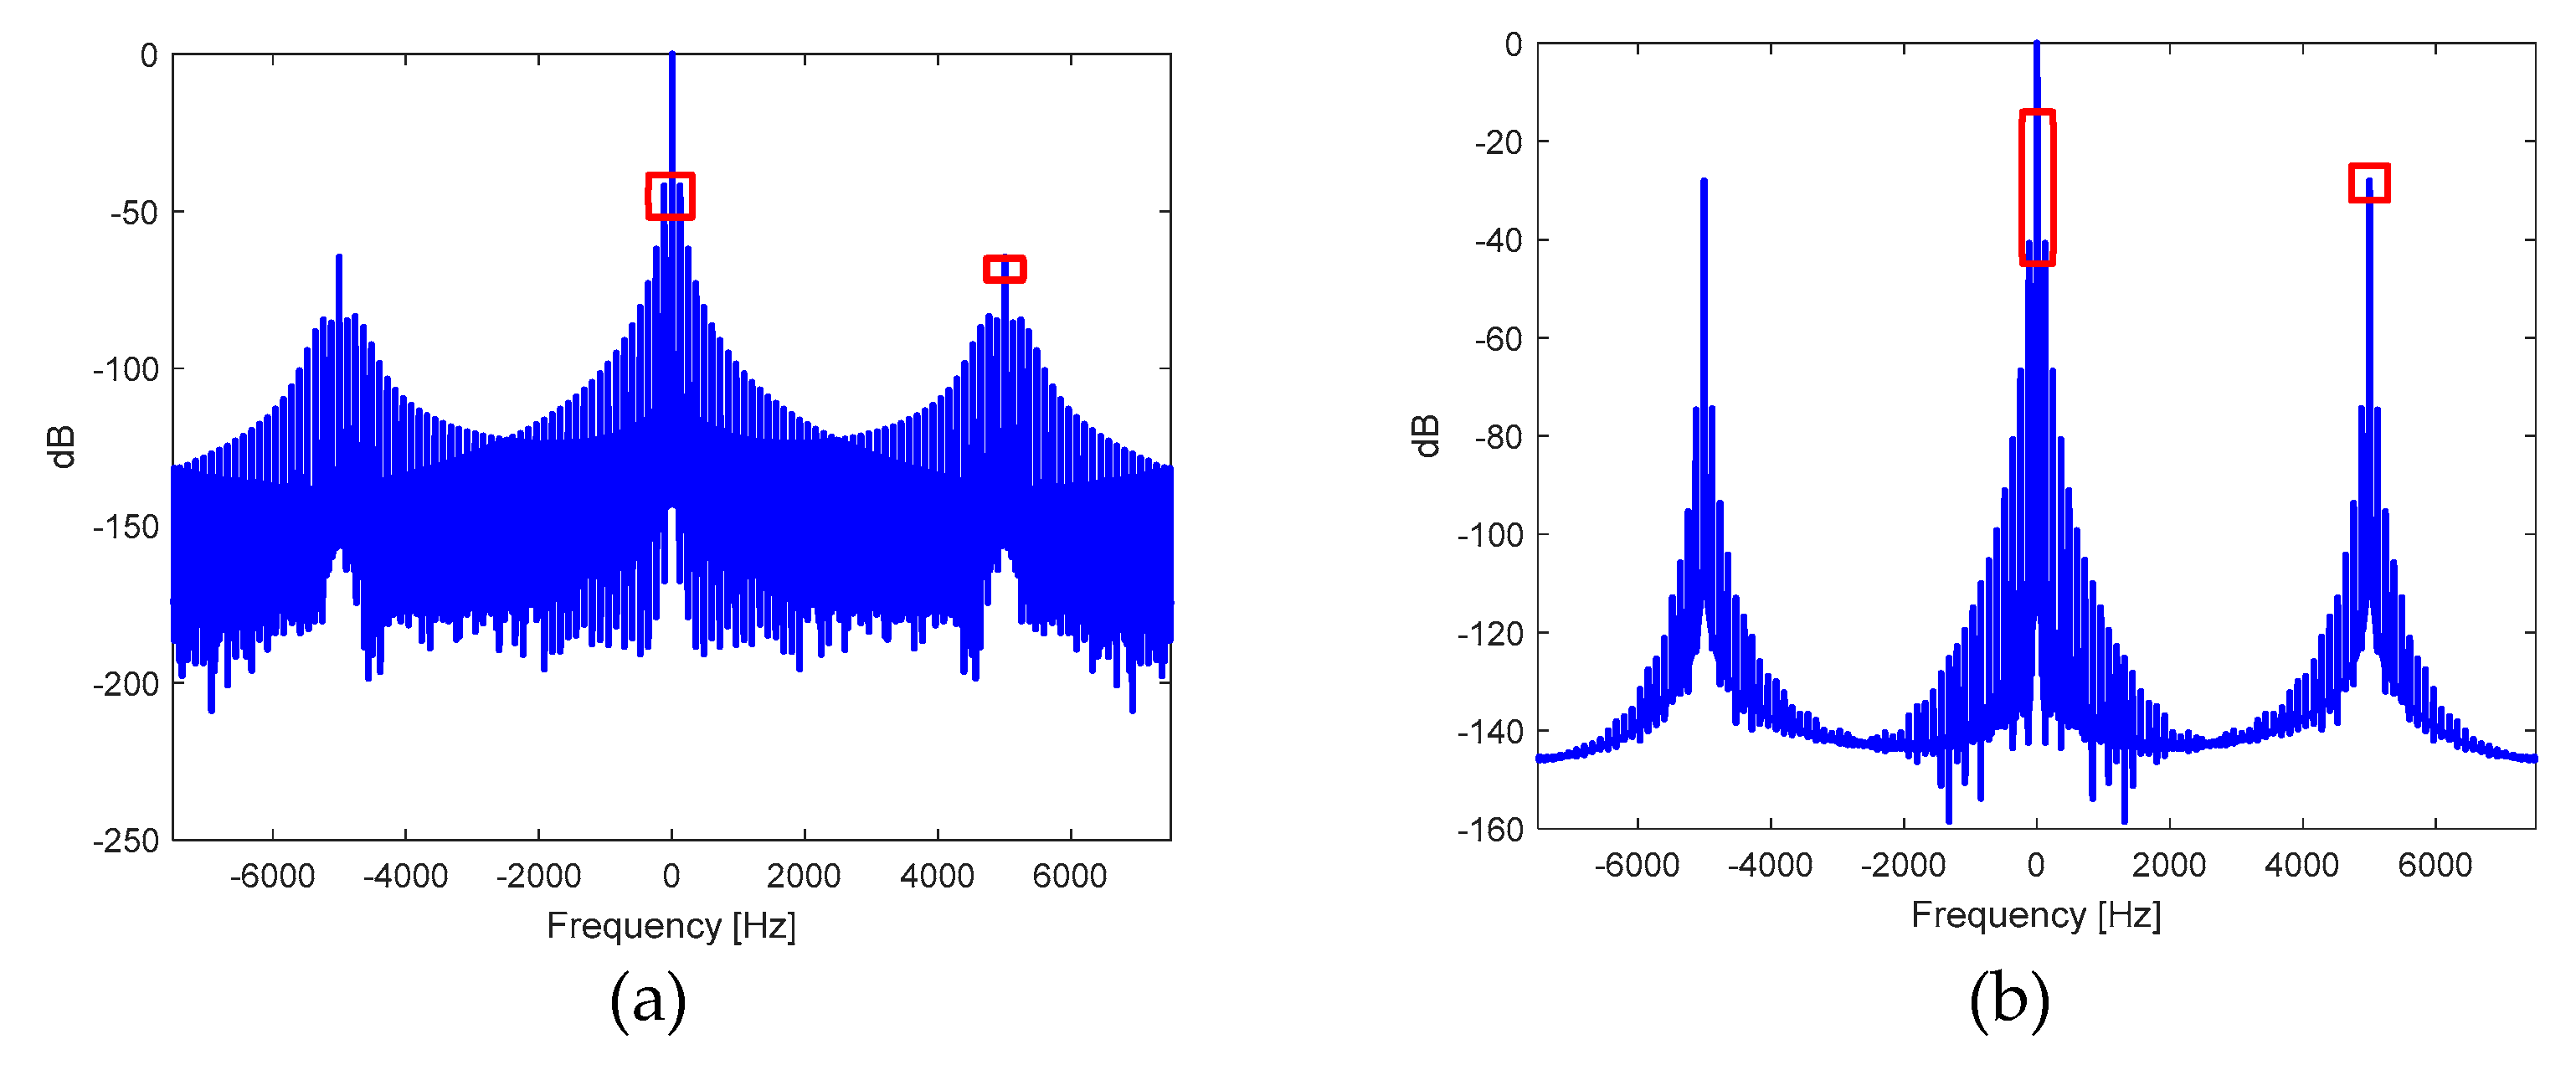
Similarly, the assessment of the inverter system at the output of PWM modulation, considering a carrier and a modulator at full load, is carried out using spectral analysis. Figure 10(a) displays the spectral analysis of the voltage signal at the inverter output in [dB], which is normalized based on the spectral voltage value corresponding to . The way to improve the harmonic distortion factor, especially when galvanic isolation is introduced, is by incorporating a transformer with an added capacitive filter. Again, the assessment of the inverter system at the output of the filtering using spectral analysis in [dB] is presented in Figure 10(b), highlighting voltage amplitude components around and , but normalized based on the spectral voltage value corresponding to . Table 2 provides the harmonic distortion factor and the rms value of the sinusoidal voltage at the output of the inverter and after filtering.
2.5. Assessment of closed-loop performance
2.5.1. Design of the fuzzy controller
In order to design the fuzzy controller, we obtain a simplified model of the response of the switched boost source. It does not have to reflect the dynamic behavior precisely; it only needs to provide a satisfactory response in terms of timing. Equation (32) fulfills these requirements.
Considering open-loop performance, adjustments were made to the parameters in equation (32) using the gradient descent method. Figures 11(a) and 11(b) show the evolution of the K, T1 and T2 parameters of the simplified dynamic model when descending the gradient of the cost function in Figure 11(c). Finally, the time responses of the simulated and modeled dynamics of Boost stage are presented in Figure 11(d), named as Data 1 and Data 2, respectively.
Once a simplified model is obtained a PI (Proportional-Integral) control action is implemented which will be a reference model in the fuzzy controller training process. To do this, consider the response of the model system, shown in blue in Figure 11(d), and specific desired response to verify that a classic PI controller can approximate this response when operating on the given model system, as shown in Figure 12(a). Figure 12(b) represents the optimized cost function given by equation (33). Figures 12(c) and (d) show the evolution of the proportional gain and integral time parameters.
With the reference for training weights or singletons of the fuzzy control system, the training scenario is implemented as shown in Figure 13. This model considers the switched process relevant aspects that allow voltage boosting before moving on to the inverter process. The control loop is closed, considering that the duty cycle of the elevator switching is determined by the control output of the fuzzy PI, whose value must always be between 0 and 1. For this reason, it not only needs to be bounded but also needs to have an impact on the integration process to avoid the wind-up effect. Therefore, the system is configured as a fuzzy PI with an anti-windup effect.
Fuzzy PI control is based in 25 rules, which are described as singletons. At first, the singleton weights are set randomly, as shown in Figure 14(a), while Figure 14(b) depicts the surface of the fuzzy PI control output once the singletons are adjusted. Figure 14(c) displays the evolution of the cost function between the system signal with the fuzzy PI controller and the established pattern signal as a viable training criteria. Finally, Figure 14(d) illustrates the 25 singletons, which are gradually adjusted according to the cost function minimization.
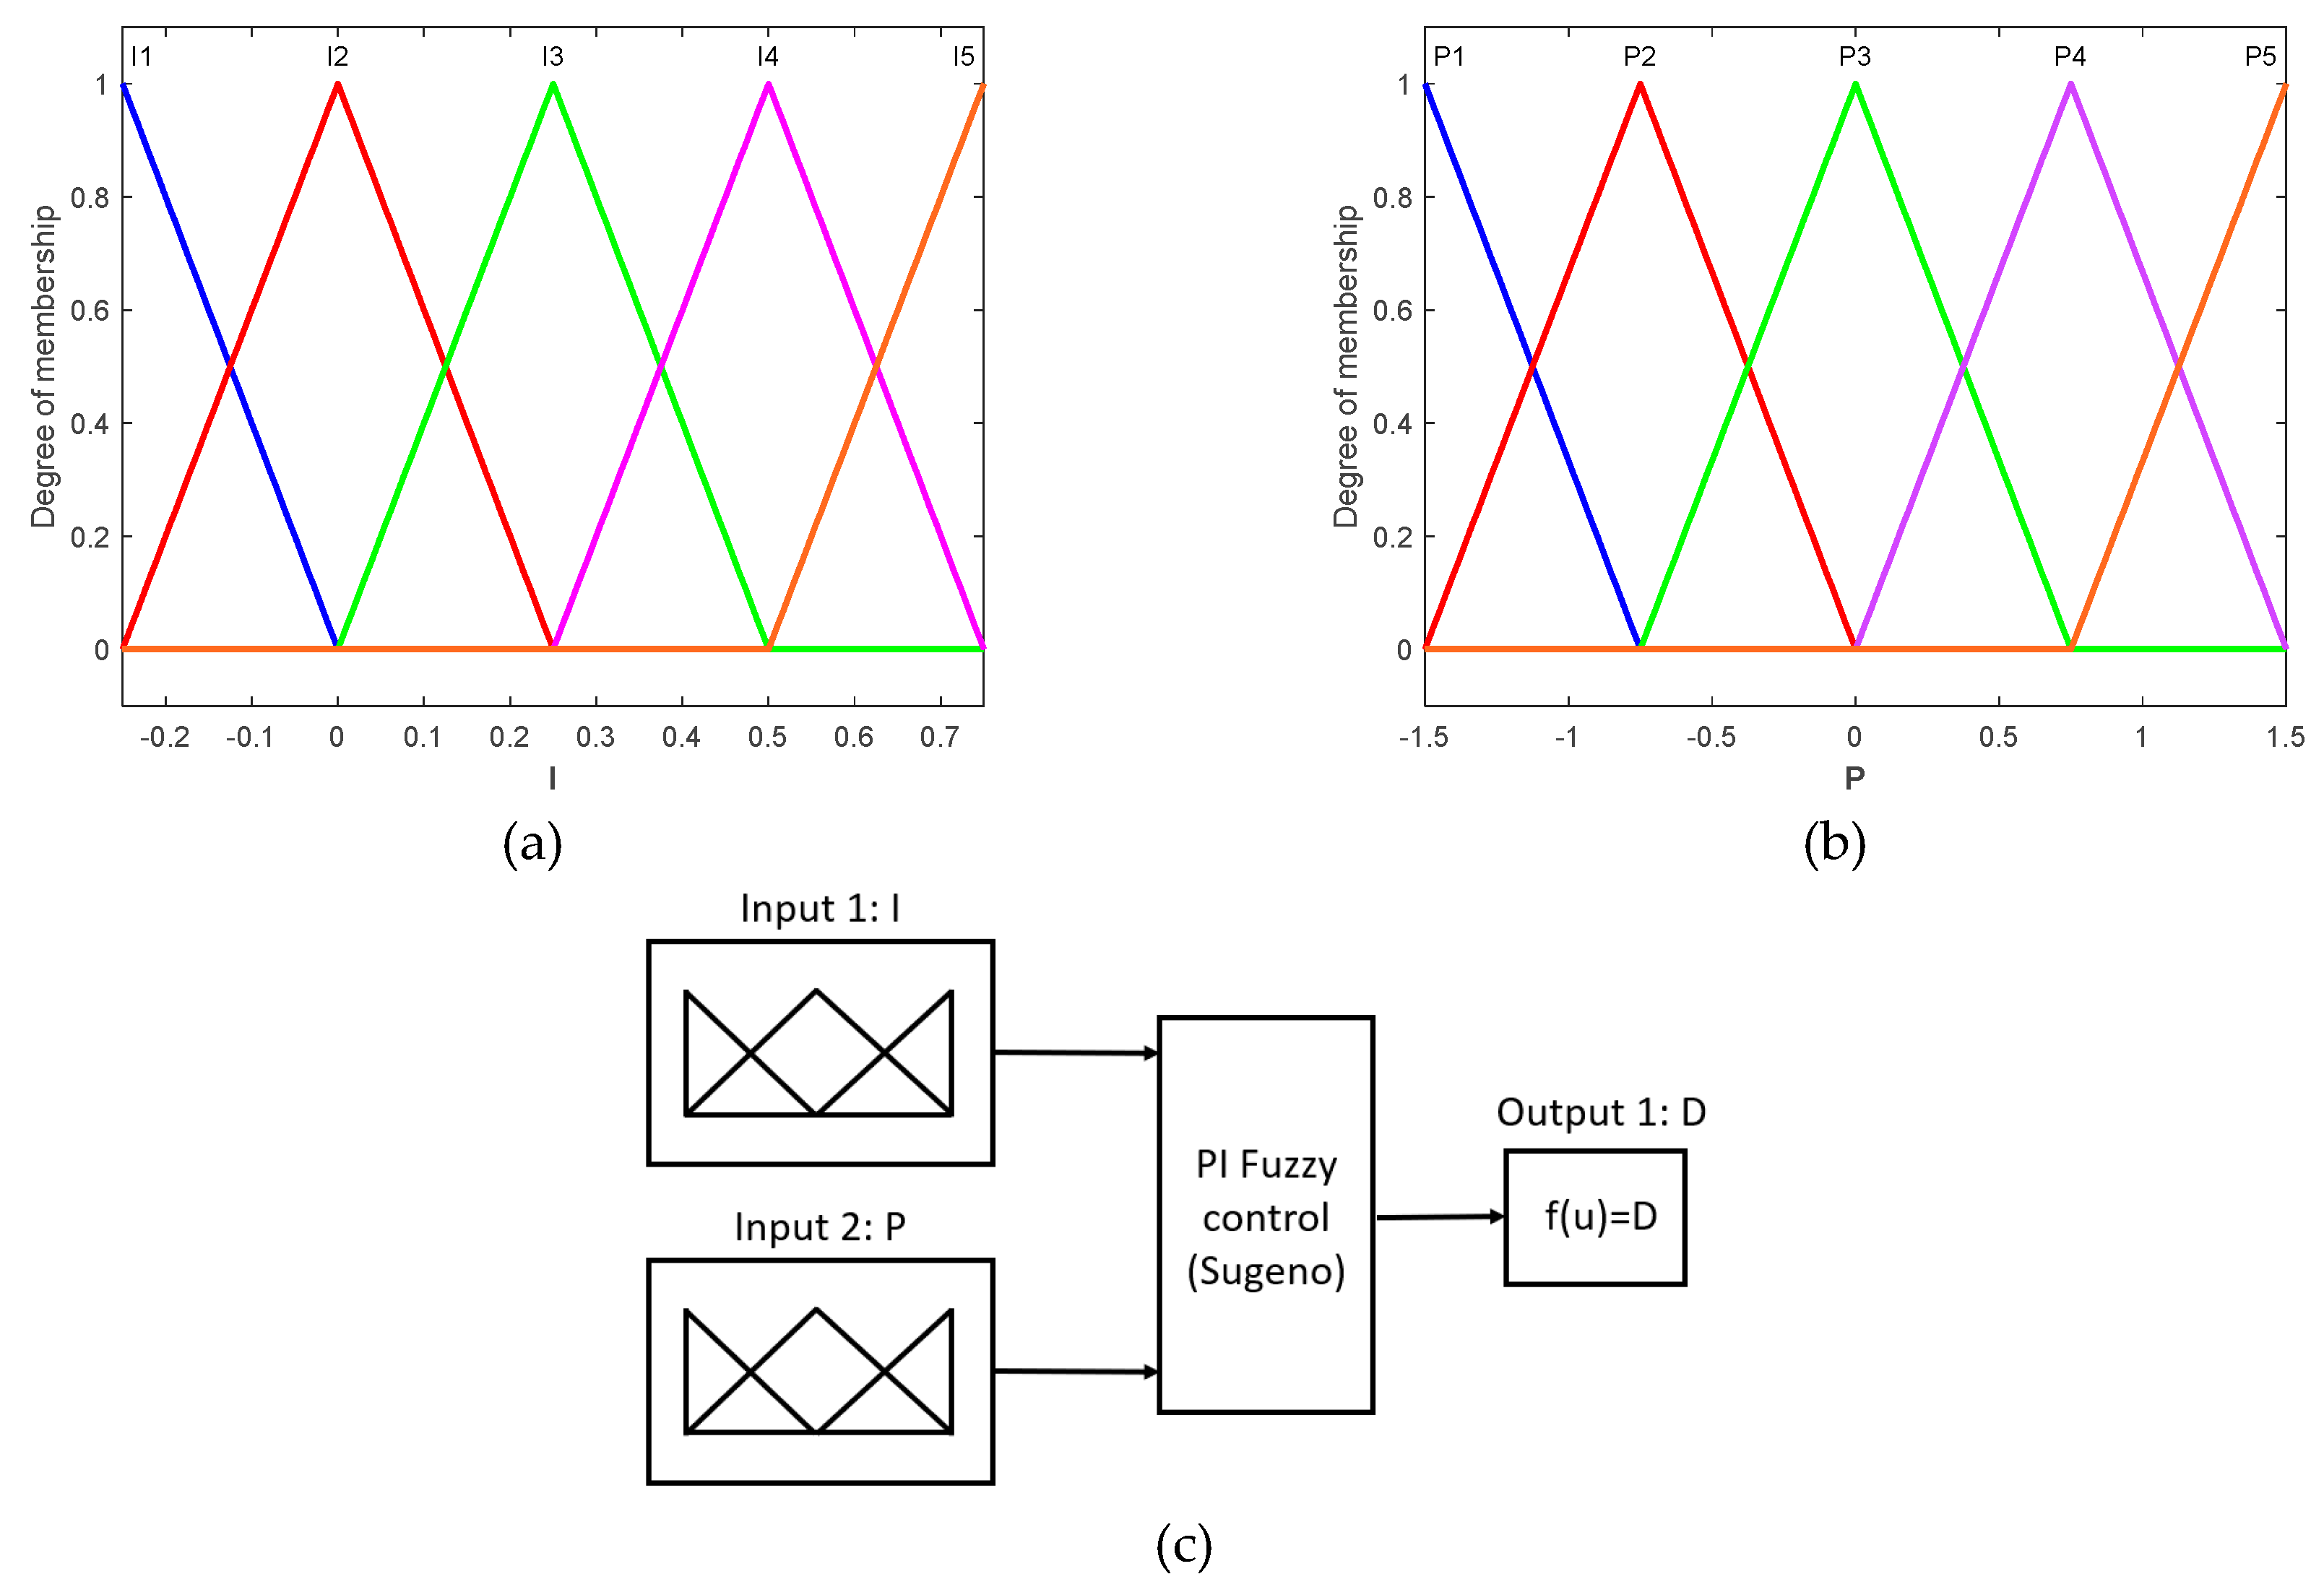
Table 3 presents the structure of each of the triangular membership functions that are part of the universes of discourse for both the integral effect and the proportional effect, which are depicted in Figures 15(a) and 15(b), respectively. Figure 15(c) shows the structure of the inference system with its 25 rules that allow obtaining the univalued control output. Finally, Table 4 presents each of the antecedents and consequents associated with each rule, highlighting the value or weight of the singletons with their saturation effect between 0 and 1.
2.5.2. Study of stability based on the limit cycle of the deviation trend
The stability evaluation of a switched system cannot be performed using classical stability techniques such as the Routh-Hurwitz criterion or Lyapunov criteria [16]. The definition of stability itself is satisfied by verifying that, when an input as a limited interval, the resulting output value is also located in a limited interval. However, confirming this stability criterion in control is only possible by conducting a study based on the limit cycle of the deviation trend.
The study of the limit cycle of the deviation trend is a statistical analysis based on smoothing techniques similar to those implemented by Savitzky-Golay, which allows for the evaluation of the behavior of the deviation. In a switched source, the deviation oscillates around an operating point [18]. To apply the suggested method, which consists on the limit cycle of the deviation trend, the first step is to determine the deviation trend based on Equation (34):
The cost function , given by equation (34), allows us to find the optimal cubic fit around , which serves as a temporal index and accounts for deviation throughout an odd number of samples . This affirmation leads to the prediction and smoothing function presented in equation (35). With equation (35), it can be determined the deviation trend while mitigating the inherent effects of switching in the source.
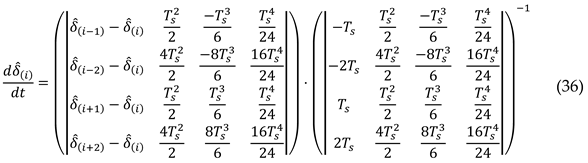
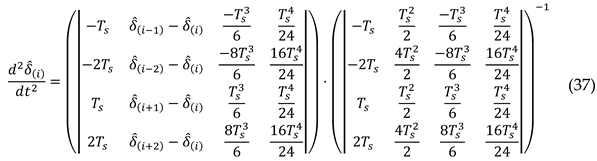
Once the deviation trend is obtained, the study of the limit cycle will operate on this signal, therefore, it is necessary to determine its first derivative. Finally, as part of the field lines determining the direction of the limit cycle establishment, the second derivative of deviation must be obtained. Equations (36) and (37) show the numerical procedure for determining the first and second derivatives using a 5-term polynomial approximation.
In Figure 16, the deviation of the fuzzy control action is shown in red, and the deviation trend is shown in blue. With the smoothing achieved through filtering, the inherent tendency of the switched system to oscillate around the setpoint is suppressed, as at least third-order differentiability is achieved to apply the limit cycle stability criterion, which requires second-order differentiability of the studied signal.
The study of the limit cycle is achieved by plotting the results obtained with equations (35) and (36), i.e., by plotting the variation or rate of change over time of the deviation trend versus the deviation trend, as shown in Figure 17(a). In order to confirm the trend towards the establishment, the direction of the field lines is determined by considering the derivative of the rate of change of the deviation trend concerning the deviation trend, which is accomplished by implementing the ratio of equations (36) and (37), with the convergence direction being clockwise, seeking the (0,0) point on the limit cycle graph, as observed in Figure 17(b).
2.5.3. Closed-loop behavior under nominal load
The study of closed-loop behavior is conducted by considering a time response within an interval of , during which the transient response fades away and steady-state operation is achieved. The steady-state study begins after startup.
Figures 18(a) and 18(b) show the voltage and current transient response in the source during startup. The voltage measured at the elevation source capacitor in the steady state is . In contrast, the average current in the inductor measures , considering the inductor's loop, for a nominal load. It can be observed that during the transient, the voltage does not exhibit significant overshoot, and its increase is relatively gradual. On the other hand, the current has a peak that exceeds slightly more than three times its steady-state value.
A spectral magnitude study allows the observation of magnitude at zero frequency, where the signal under investigation should remain constant, and amplitudes of the signal at any other frequency may be attenuated. This scenario is observed in Figure 19(a) and 19(b), corresponding to the spectrum of the normalized signal, presented in , providing an insight into the behavior of the signals at frequencies of interest in the study. It is worth to note that such figures depict the operating conditions of the Boost stage power source in which the voltage and current signals are affected.
In both cases, frequencies of and are prominent for voltage and current. The former is the frequency of the inverter system for generating the PWM sinusoidal signal at . At the same time, the latter is the chosen switching and PWM modulation frequency for the switching and boost system. Equations (30) and (31) allow for evaluating performance indicators under statistical considerations, both for the output voltage of the boost stage and the inductor current.
Table 5 depicts average and ripple values for output voltage and inductor current obtained through spectral considerations. Notably, for both voltage and current, the study at a frequency of satisfies design conditions. However, at the frequency of , there is a condition due to load variation resulting from sinusoidal PWM switching; this is why there are operational ripples for both voltage and current, which differ slightly from open-loop operation due to a slight increase in current ripple at .
The assessment of the inverter system at the output of the PWM modulation, considering a carrier frequency of and a modulating frequency of , when DC-DC power supply is in closed-loop PI fuzzy control, is carried out using spectral studies. Figure 20(a) illustrates the spectral analysis in of the output voltage signal normalized based on the spectral value of voltage corresponding to . Table 6 presents the value of the harmonic distortion factor and the RMS value of the sinusoidal PWM modulated voltage when the fuzzy PI controller regulates the DC-DC source.
In the same way, a transformer with a capacitive filter is introduced to improve the harmonic distortion factor, especially with the incorporation of galvanic isolation. The evaluation of the inverter system at the output of the transformer with capacitive coupling is performed using spectral studies. Figure 20(b) depicts the spectral analysis in of the signal normalized based on the spectral value of voltage corresponding to of the voltage signal at the output of the inverter, highlighting voltage amplitude components around and when the source is regulated in a closed loop using the fuzzy PI controller.
Table 6 presents the harmonic distortion factor of and the RMS value of the sinusoidal voltage of resulting from filtering following expected standard values for this inverter system.
2.5.4. Closed-loop behavior under load variation
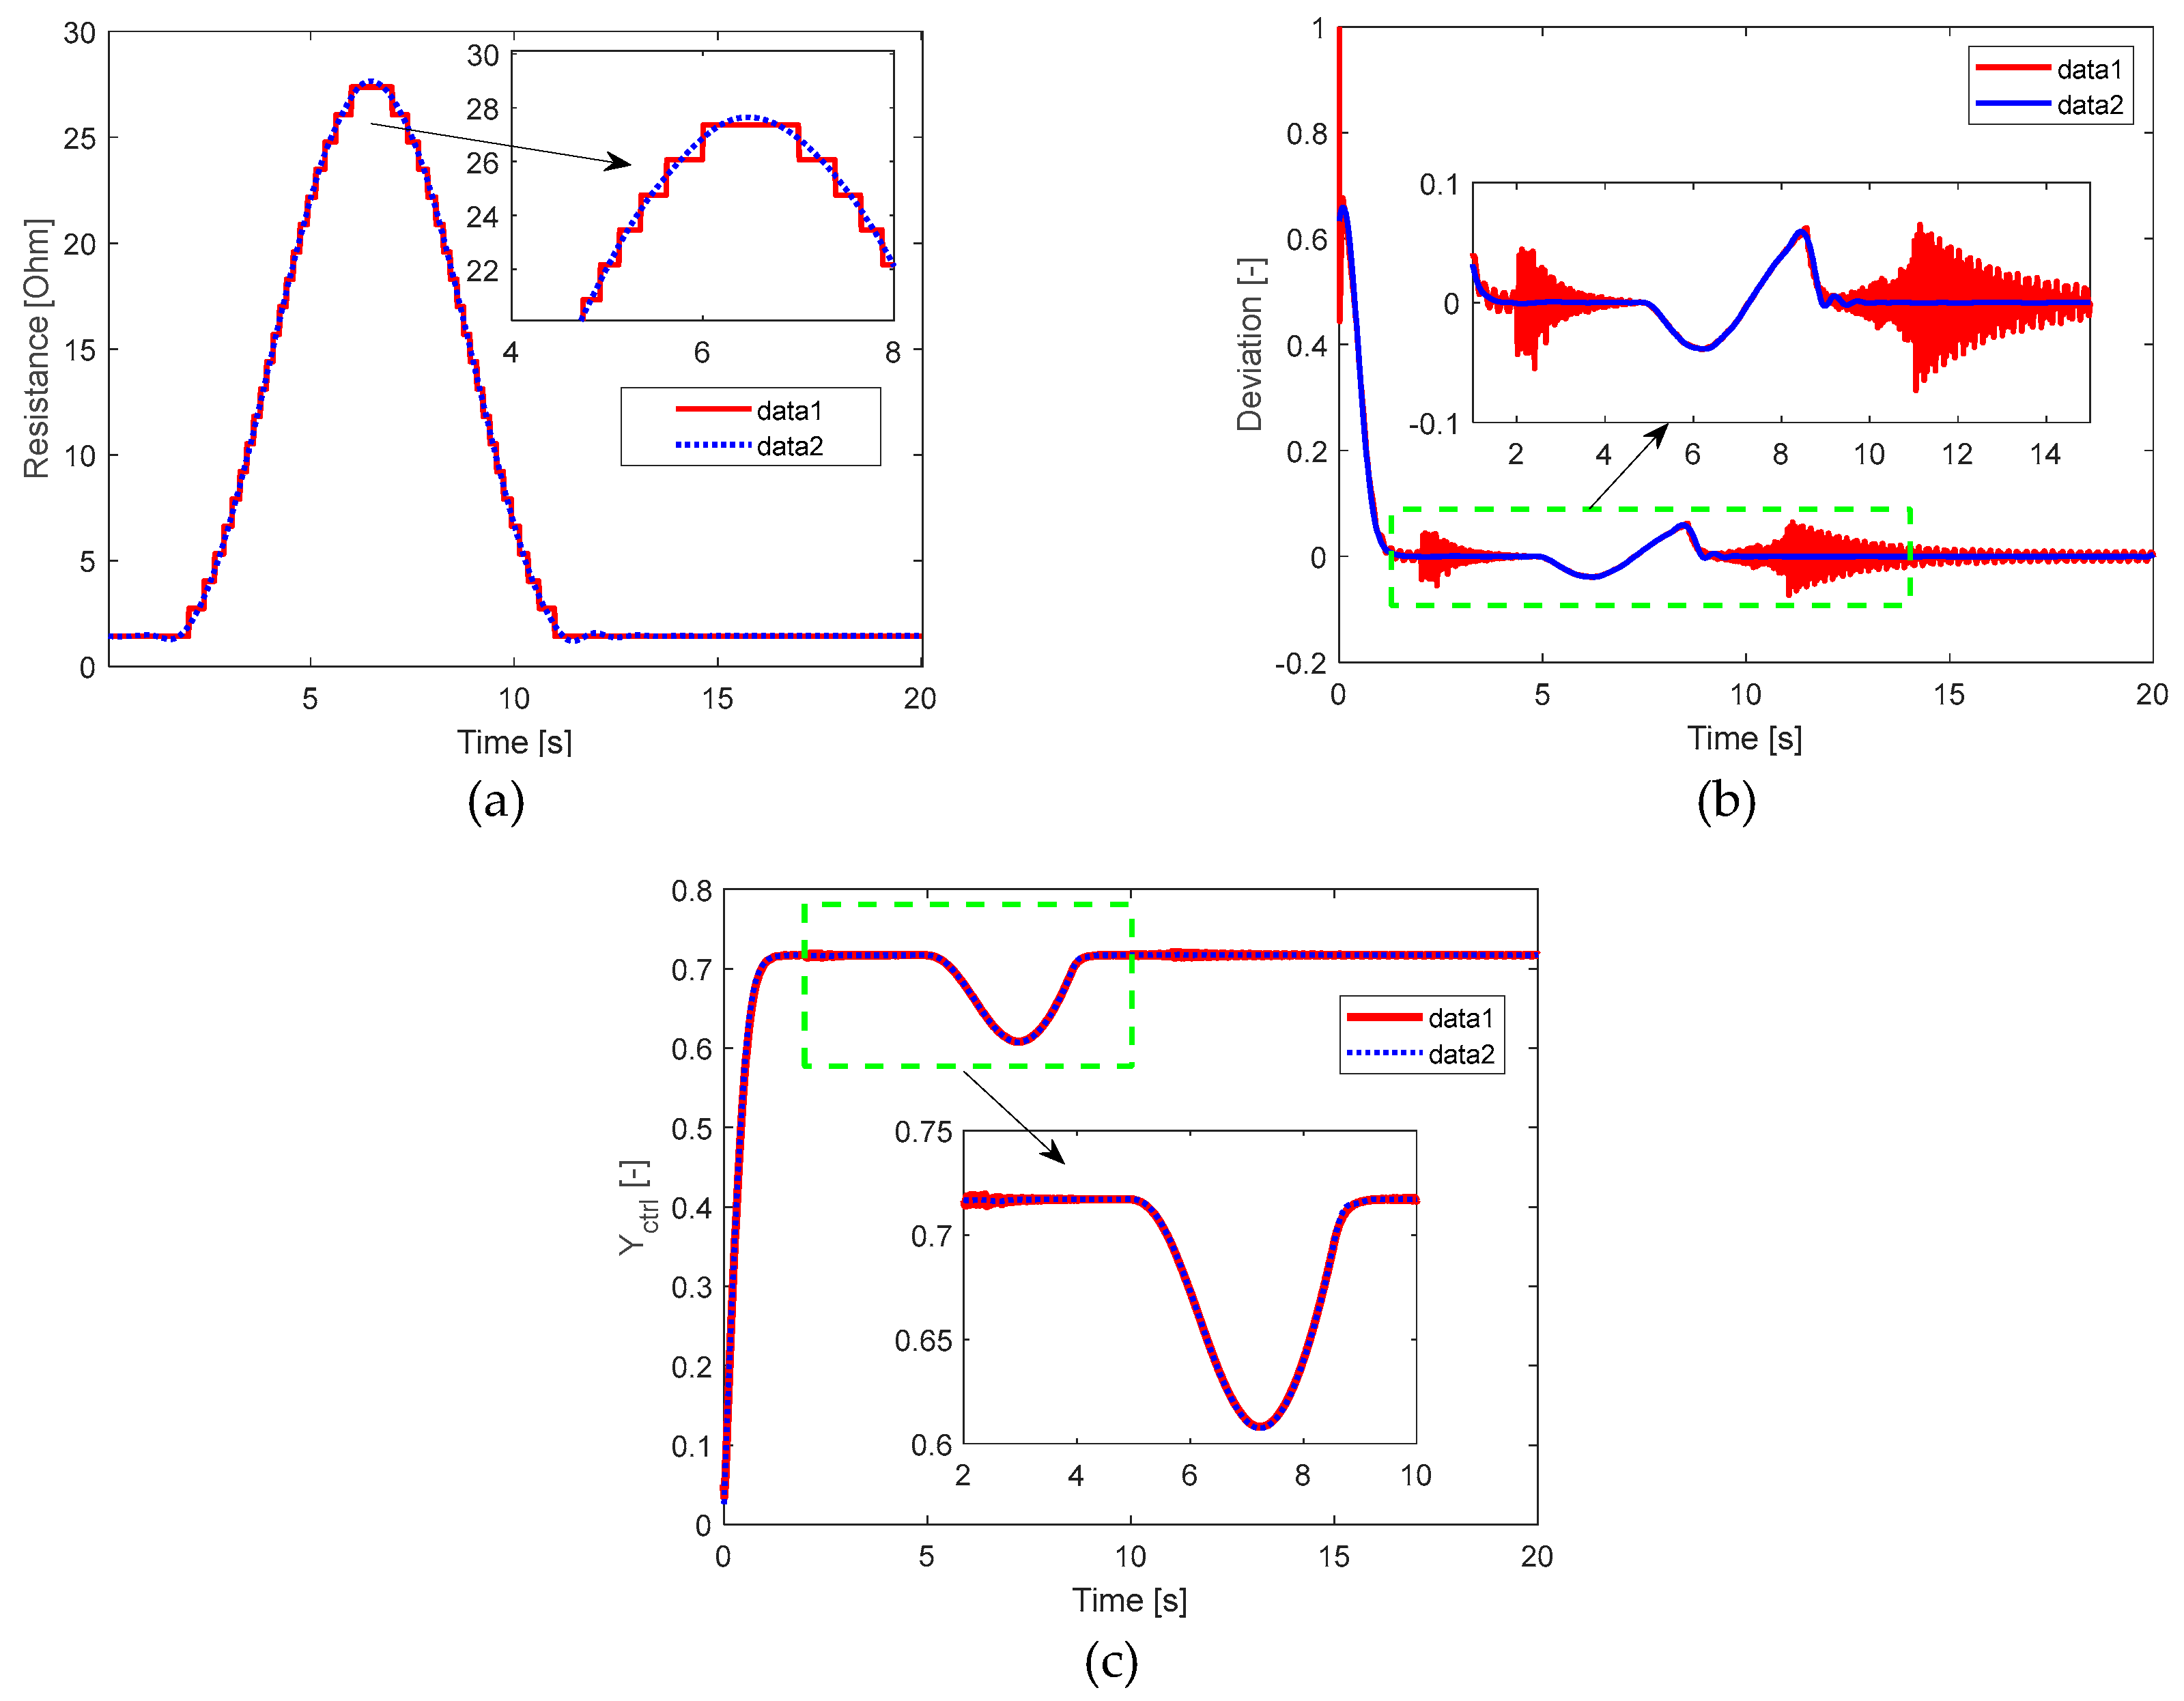
Considering that this study corresponds to the dynamics of a rigid system, computational demands are much more stringent. Therefore, the study is critically conducted over , with load variation occurring over . The test performed corresponds to a load step starting from the maximum load. Considering that the maximum load occurs at the lowest ohmic value of , this value will be increased by until it reaches , as depicted in Figure 21(a).
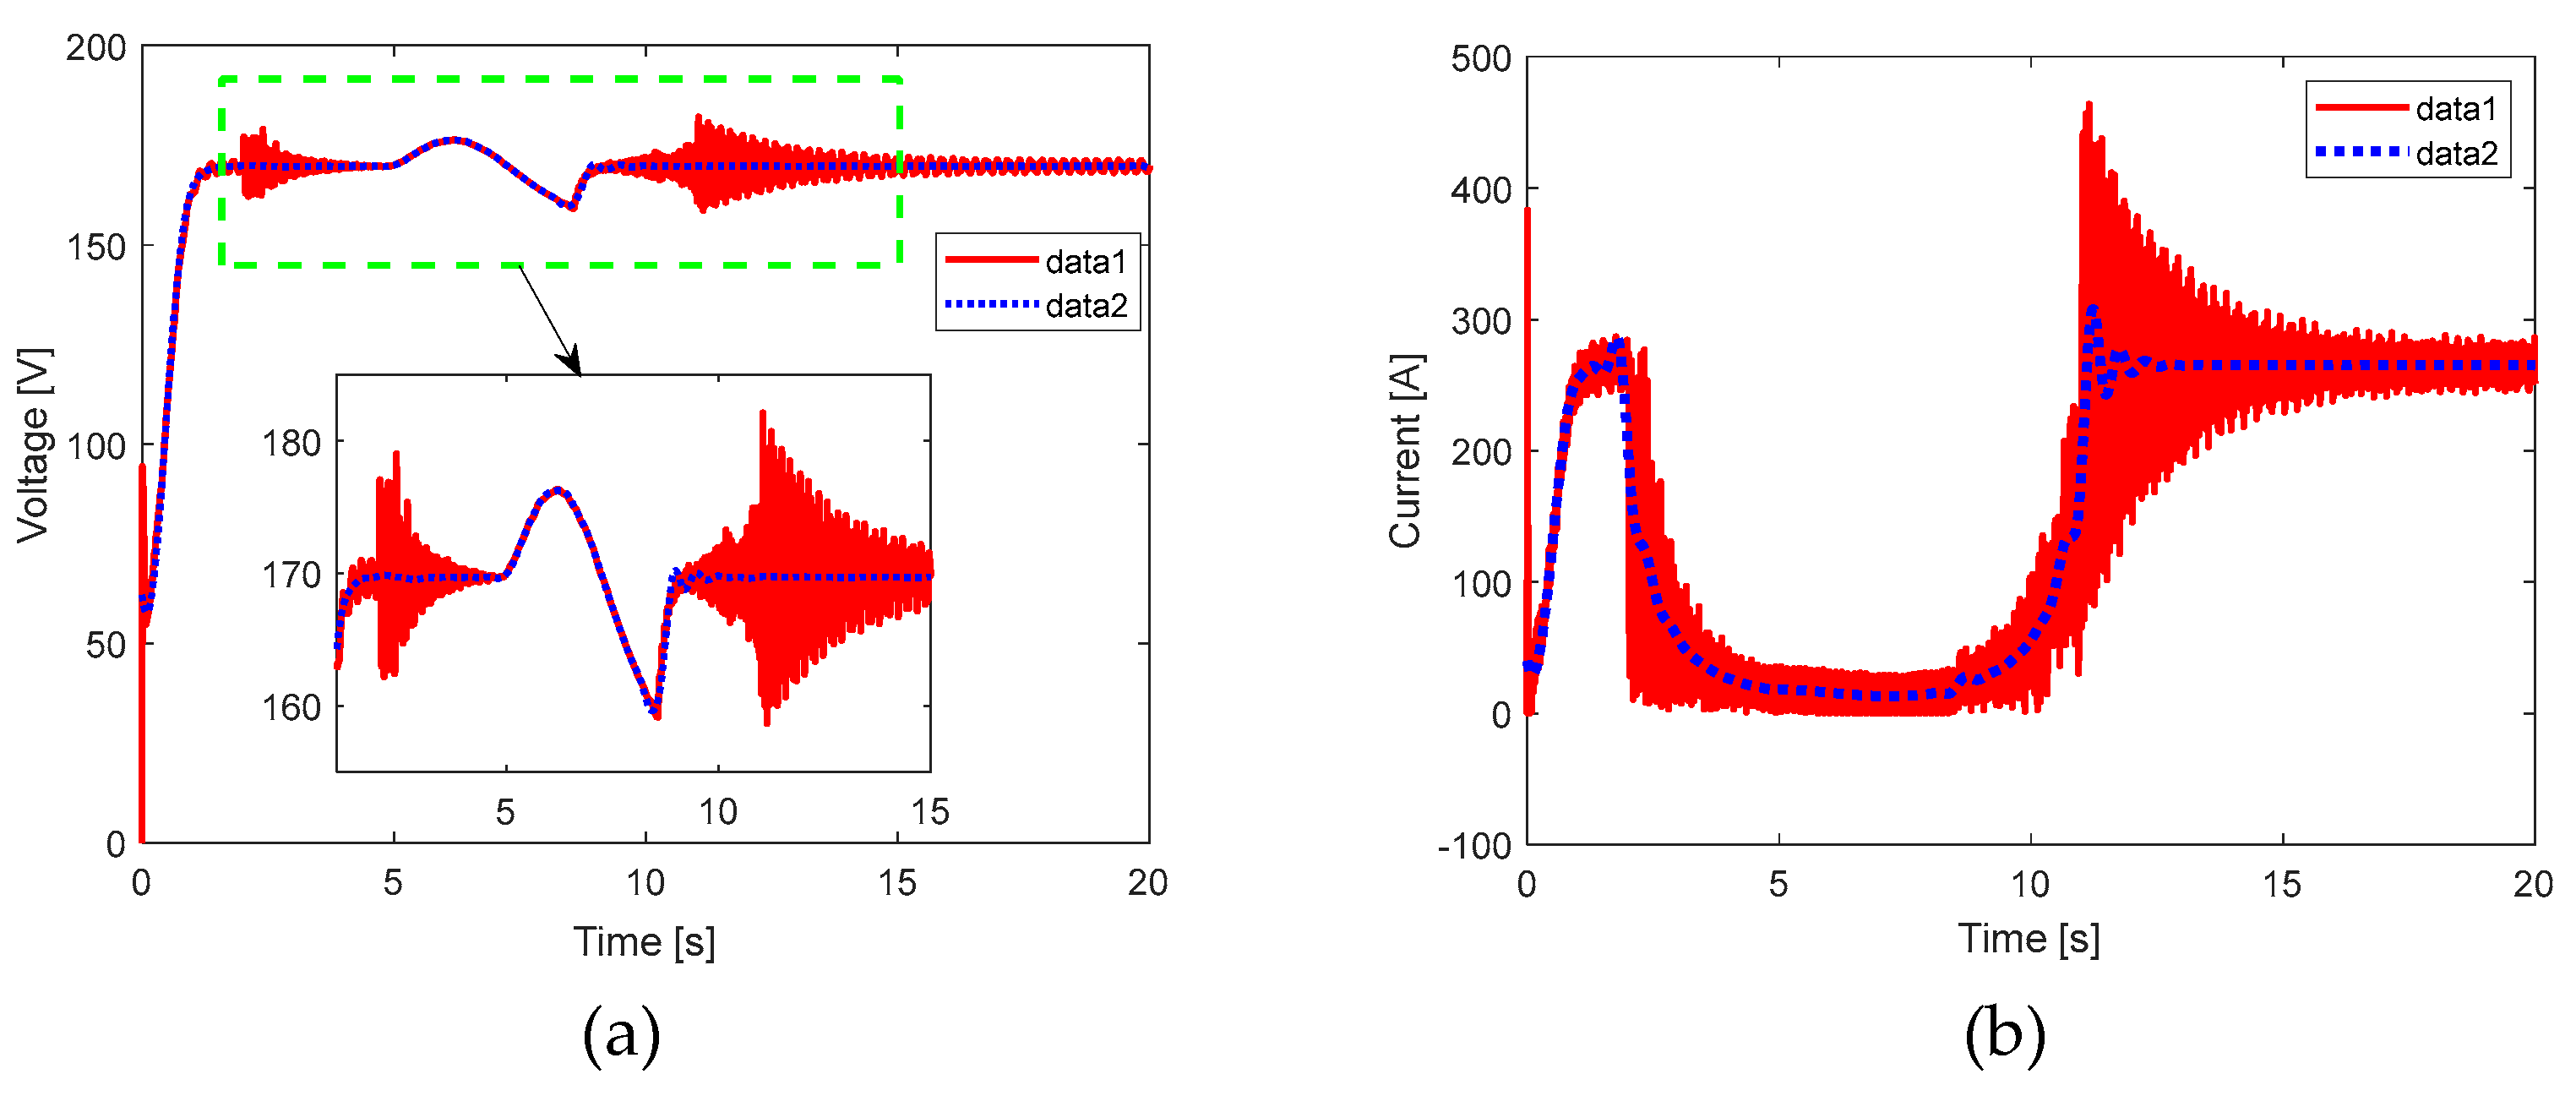
Figure 21(b) displays the deviation per unit (p.u.). After reaching , the voltage has stabilized, as seen in Figure 22(a), with slight fluctuations in the deviation occurring after the load step, but these variations are imperceptible around the mark.
Figure 21(c) shows that the highest control action is when the ohmic value is at its maximum, meaning when the load is minimal. Figure 22(b) illustrates the sensitivity to load variation exhibited by the current variable, i.e., the control action is most pronounced when the load is minimal. However, by design, the current can regulate the system in response to load variation, which is why the regulation acts with minimal control action Figure 22(a) shows the sensitivity to load variation exhibited by the voltage variable of the boost stage capacitor. However, it is significantly lower compared to the sensitivity exhibited by the inductor current.
As performed previously, a spectral magnitude study is presented in Figure 23(a) and Figure 23(b), corresponding to the voltage across the output capacitor and current through the inductor of the boost stage, respectively. The signals are normalized by dividing them by their mean values and expressed in . This way allows components at frequencies of interest emerge for. In both cases, for both voltage and current, frequencies of and are prominent (red boxes). The former is due to the frequency of the inverter system for generating the PWM sinusoidal signal at . At the same time, the latter is the chosen switching and PWM modulation frequency for the switching, boosting, and PWM modulation system. However, a component associated with the stepped load change at emerges, which affects the inductor current spectrum. Equations (30) and (31) allow for evaluating performance indicators under statistical considerations, both for the output voltage of the boost stage and the inductor current.
Table 7 summarizes average and ripple values obtained through spectral considerations. It is worth noting that, for voltage, the study at the frequency satisfies design conditions. However, for current, the ripple increases by ]. In both cases, for both voltage and current, the component at the frequency corresponds to the load variation resulting from sinusoidal PWM switching, which is why operational ripples are present for both voltage and current. However, the normalized current spectrum shows a component at .
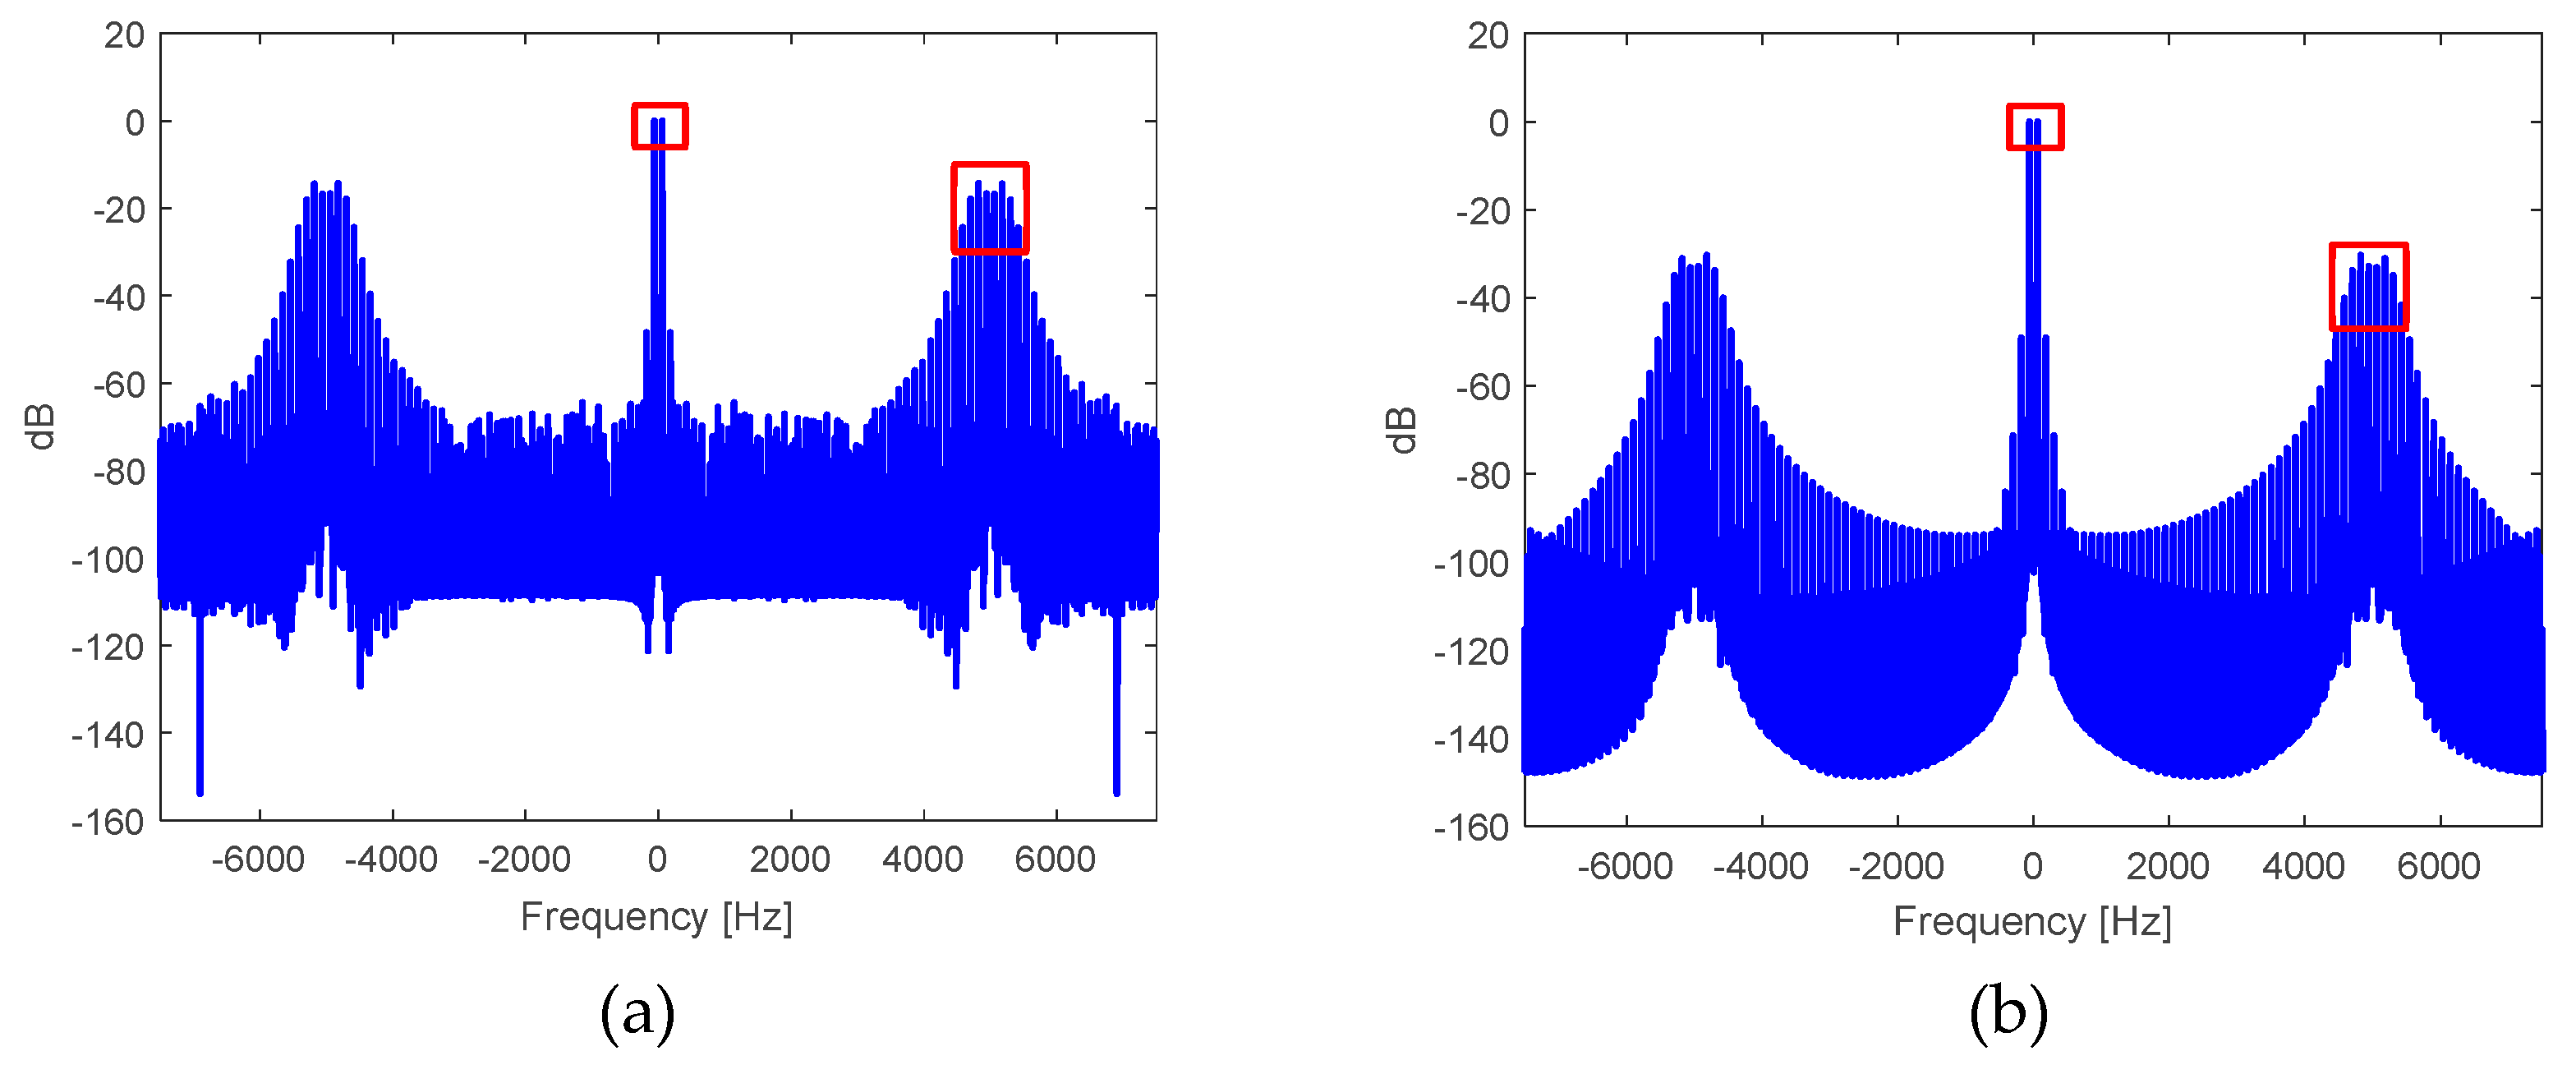
Similarly, the assessment of the inverter system in response to load variation at the transformer's output with capacitive coupling is conducted using spectral studies. Figure 24 displays the spectral analysis in of the signal normalized based on the spectral value of voltage corresponding to of the voltage signal at the output of the inverter, where voltage amplitude components around and are highlighted. Table 8 presents the harmonic distortion factor and the RMS value of the sinusoidal voltage resulting from filtering at the inverter output when a load variation is introduced.
2.5.5. Closed-loop behavior under voltage variation in the battery system
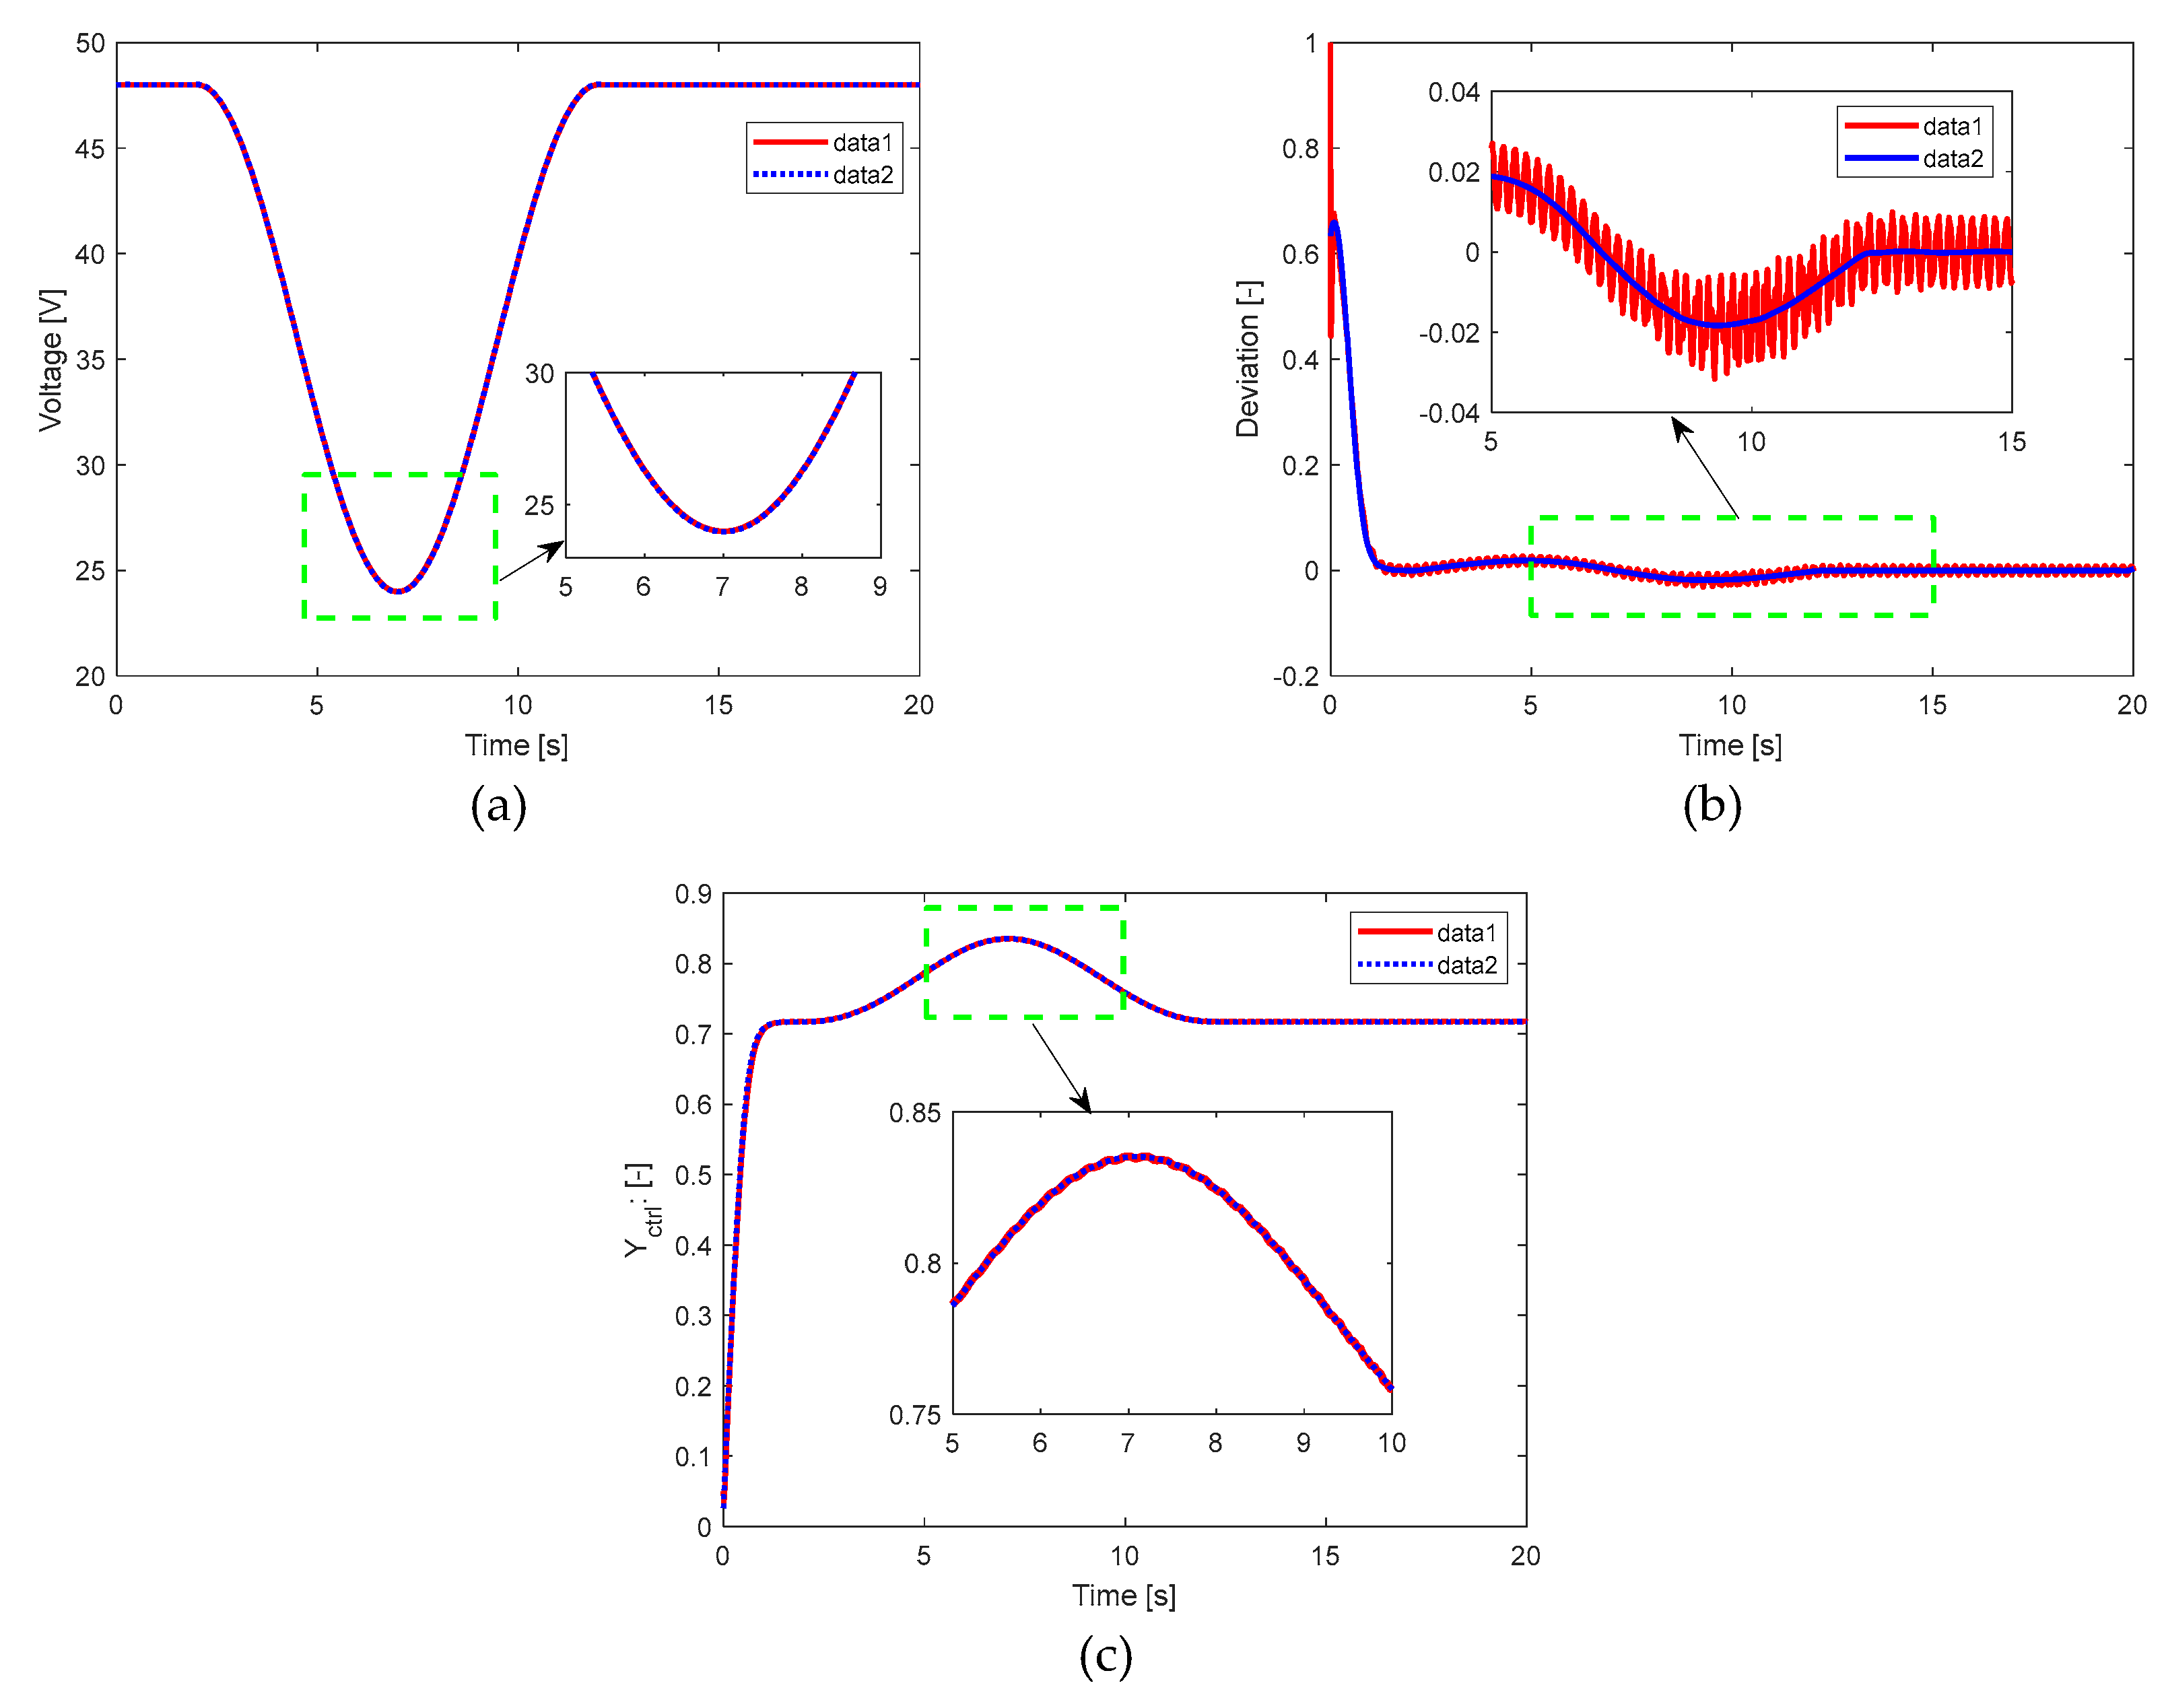
Like the previous section, this study aligns with the dynamics of a rigid system with significantly stricter computational demands. Consequently, the study is critically conducted over a interval, with a variation in the source voltage. The conducted test corresponds to a voltage drop from its nominal value of , which is decreased until it reaches , as depicted in Figure 25(a). This value was selected as it represents the maximum allowable discharge condition for a lead-acid battery.
Furthermore, Figure 25(b) displays the deviation per unit (p.u.). After reaching , the voltage has stabilized, as observed in Figure 25(a), with slight fluctuations in the deviation occurring after the source voltage variation. Figure 25(c) shows the highest control action when the source voltage value is at its minimum.
Consequently, Figure 26(a) shows how the control action makes the voltage variable seen at the capacitor of the voltage boost source almost insensitive. However, Figure 26(b) illustrates the sensitivity to source voltage variation showed by the current variable.
As previously mentioned, a spectral magnitude study only allows to observe the zero-frequency component, representing the average values of both voltage and current, belonging to the boost stage. However, once the signals are normalized by dividing them by their mean values and their values in are obtained, components at frequencies of interest emerge, as observed in the normalized voltage spectrum in for voltage (Figure 27(a)) or current (Figure 27(b)). In both cases, for both voltage and current, frequencies of and are prominent. The former is due to the frequency of the inverter system for generating the PWM sinusoidal signal at . At the same time, the latter is the chosen switching and PWM modulation frequency for the switching, boosting, and PWM modulation system. However, in Figure 27(b), a component associated with source voltage variation at emerges, which affects the inductor current spectrum.
Again, Equations (30) and (31) allow evaluating the performance indicators under statistical considerations, both for the output voltage of the boost stage and the inductor current. Table 9 depicts average and ripple values obtained through spectral considerations, highlighting that the study at the frequency satisfies design conditions for both voltage and current. In both cases, for both voltage and current, the component at the frequency corresponds to load variation resulting from sinusoidal PWM switching, which is why operational ripples are present for both voltage and current.
The assessment of the inverter system, at the output of the PWM modulation, considering a carrier frequency of and a modulating frequency of , in response to source voltage variation, is conducted using spectral studies. Figure 28 displays the spectral analysis in , with the signal normalized based on the spectral value of voltage corresponding to , of the voltage signal at the output of the inverter when closed-loop regulation is active. It highlights voltage amplitude components around and . Table 10 details the harmonic distortion factor and the RMS value of the sinusoidal PWM-modulated voltage when the source is regulated by the fuzzy PI controller in the presence of source voltage variation.
3. Discussion
Considering the final effect at the design and performance levels of the boost and inverter system, from to RMS, it can be observed that, when comparing Tables II, VI, VIII, and XIII, the harmonic distortion factor is affected by the regulation process, averaging . However, the harmonic distortion factor is without regulation at full load.
By developing a comparison among Figures 8, 19, 23, and 27, it can be concluded that there is a significant reduction in electrical stress on components and an increase in electrical safety for loads connected to the power system, which is due to a decrease in transient voltage and current spikes, though settling time is increased for the nominal voltage and current values of the to RMS conversion system.
Beyond comparing transient responses, where extreme values must be considered for both voltage and current of the power source, the normalized spectral study has significantly contributed to evaluating statistical behaviors. These could represent a judgment criterion in the performance evaluation process.
If the behavior of the voltage variation or ripple is evaluated, at the DC level, it can be concluded that at the frequency of it is around and at is . On the other hand, when a test is carried out with load variation, the voltage ripple at is around and at is 0.06%. The inverter system presents more sensitivity in the current, that is, in open loop at nominal load the current ripple at is and at is . However, when the inverter system operates in closed loop, the current ripple at is and at is . Besides, when the inverter system operates in closed loop, but with load variation, the current ripple at is and at is . This is a great variation compared to the previous cases and even more so if the case of closed loop regulation is considered with varying the source voltage of the battery pack. In this last case, the current ripple at is and at is .
The simulated study, carried out with a rigid model, allowed the evaluation of details and the application of offline training criteria associated with the fuzzy control system, particularly the fuzzy PI control system with anti-windup. Otherwise, online training could have been risky for both experimenters and the integrity of the power electronics system and its associated components.
Figures 22(b) and 26(b), representing the deviation of control action per unit (p.u.) in response to variations, either in load or source voltage, respectively, demonstrate an improved capability of the fuzzy PI controller with anti-windup to compensate for variations caused by source voltage disturbances than for load variations. However, both situations will occur, and not necessarily separately, as it is an inherent operating condition for the considered light electric vehicle power supply system.
4. Conclusions
In this paper, the mathematical modeling of the power electronics of the inverter system and its switched and non-linear operation was carried out, allowing the develop of a detailed simulation that shows the possibility of evaluating aspects associated with the proposed fuzzy PI control and its optimal operation.
The quantitative evaluation related to the converter's performance was carried out through the discrete treatment of the voltage and current samples using spectral techniques as well as filtering considerations and evaluation of limit cycle for the determination of the system's stability with the proposed control strategy. The THD at the output of the filter (transformer and capacitor) was around and at nominal load in open loop and closed loop, respectively.
The behavior of the system power source is stable enough to operate the connected system (no need for control). However, the difficulty of guaranteeing nominal voltage at the output of the equipment rises when the inversion system is without load or with a load close to the nominal value, events for which the fuzzy PI control is capable of reacting to maintain the system's stability.
The study yields conclusions highlighting the parameterization of the dynamic components of the system because the load variation around the nominal value does not cause significant control action. However, significant variations in the ripple occur at the level of the DC rise voltage prior to the inverter process, highlighting (in the spectral studies) two ripple frequencies, one at the switching frequency in the voltage rise process and another at the double the frequency of the inversion system. In open loop and nominal load, the current ripple at is and at is . However, when the inverter system operates in closed loop, the current ripple at is and at is The design of an optimized fuzzy PI control with anti-windup action was possible by replicating a known behavior and incorporating the variants do not present in a linear regulator (in this case, a classic PI). The development of the fuzzy PI controller, with anti-windup, showed more sensitivity to the source voltage variation of the battery pack than to the load variation.
Author Contributions
Conceptualization, J.R.-F; methodology, J.R.-F and V.H.-P; validation, V.H.-P and J.H.-A; formal analysis, J.R.-F and V.H.-P; investigation, J.H.-A and M.M.-S; data curation, J.H.-A and M.P.-C; writing—original draft preparation, J.R.-F and V.H.-P; writing—review and editing, J.H.-A and M.P.-C; All authors have read and agreed to the published version of the manuscript.
Conflicts of Interest
The authors declare no conflict of interest.
References
- Y. Asadi, M. Eskandari, M. Mansouri, A. V. Savkin, and E. Pathan, “Frequency and Voltage Control Techniques through Inverter-Interfaced Distributed Energy Resources in Microgrids: A Review,” Energies, vol. 15, no. 22, 2022. [CrossRef]
- S. Chakraborty, H. N. Vu, M. M. Hasan, D. D. Tran, M. El Baghdadi, and O. Hegazy, “DC-DC converter topologies for electric vehicles, plug-in hybrid electric vehicles and fast charging stations: State of the art and future trends,” Energies, vol. 12, no. 8, 2019. [CrossRef]
- K. Sayed, A. Almutairi, N. Albagami, O. Alrumayh, A. G. Abo-Khalil, and H. Saleeb, “A Review of DC-AC Converters for Electric Vehicle Applications,” Energies, vol. 15, no. 3, pp. 1–32, 2022. [CrossRef]
- D. Murthy-Bellur, E. Ayana, S. Kunin, B. Palmer, and S. Varigonda, “WBG inverter for commercial power generation and vehicle electrification,” IEEE Int. Work. Integr. Power Packag. IWIPP 2015, pp. 36–39, 2015. [CrossRef]
- V. Vijayan and S. Ashok, “Hybrid control for bidirectional Z-source inverter for locomotives,” Adv. Power Electron., vol. 2015, 2015. [CrossRef]
- J. Engelhardt, S. Grillo, L. Calearo, M. Agostini, M. Coppo, and M. Marinelli, “Optimal control of a DC microgrid with busbar matrix for high power EV charging,” Electr. Power Syst. Res., vol. 224, no. 9090, p. 109680, 2023. [CrossRef]
- M. Srikanth, B. Pakkiraiah, P. Upadhyay, and S. T. Kalyani, “Dual-mode photovoltaic bidirectional inverter operation for seamless power transfer to dc and AC loads with the grid interface,” Sci. World J., vol. 2019, 2020. [CrossRef]
- M. Trabelsi, A. N. Alquennah, and H. Vahedi, “Review on Single-DC-Source Multilevel Inverters: Voltage Balancing and Control Techniques,” IEEE Open J. Ind. Electron. Soc., vol. 3, no. November, pp. 711–732, 2022. [CrossRef]
- S. Y. Oh, S. J. Kim, Y. G. Jung, Y. C. Lim, B. C. Park, and J. R. Shin, “A single-phase embedded Z-source DC-AC inverter by symmetric and asymmetric voltage control,” IEEE Int. Symp. Ind. Electron., pp. 1–6, 2013. [CrossRef]
- C. H. Hsieh, T. J. Liang, S. M. Chen, and S. W. Tsai, “Design and Implementation of a Novel Multilevel DC-AC Inverter,” IEEE Trans. Ind. Appl., vol. 52, no. 3, pp. 2436–2443, 2016. [CrossRef]
- T. Huynh, A. V. Ho, and T. W. Chun, “Three-Phase Embedded Modified-Z-Source Three-Level T-Type Inverters,” IEEE Access, vol. 8, pp. 130740–130750, 2020. [CrossRef]
- I. Villanueva et al., “On the Reliability of Transformerless Photovoltaic DC/AC Converters Based on Mission Profile,” Int. J. Photoenergy, vol. 2021, 2021. [CrossRef]
- Y. S. Lim, J. Wong, M. S. S. Liew, and L. Y. A. Khaw, “Proportional integrator (PI) and fuzzy-controlled energy storage for zero-power flow between grid and local network with photovoltaic system,” Sustain. Energy Technol. Assessments, vol. 37, no. January, p. 100629, 2020. [CrossRef]
- S. Javadi et al., “Grid current unbalance compensation using a fuzzy controlled smart transformer,” Electr. Power Syst. Res., vol. 209, no. April, p. 108041, 2022. [CrossRef]
- J. Rodríguez-Flores, V. Herrera-Perez, J. Gavilanes, A. Morocho, and J. Hernandez-Ambato, “Synchronization and Optimal Operation of a 140 kVA Inverter in On-Grid Mode Using Mamdani Controllers in Cascade,” J. Electr. Comput. Eng., vol. 2023, 2023. [CrossRef]
- A. Adegbege and R. M. Levenson, “Linear Multivariable Antiwindup Control Design: Singular Perturbation Approach,” IFAC-PapersOnLine, vol. 50, no. 2, pp. 289–294, 2017. [CrossRef]
- V. Papadopoulos and A. Leva, Antiwindup-aware PI autotuning, vol. 2, no. PART 1. IFAC, 2012.
- N. P. Lawrence, G. E. Stewart, P. D. Loewen, M. G. Forbes, J. U. Backstrom, and R. B. Gopaluni, “Optimal PID and antiwindup control design as a reinforcement learning problem,” IFAC-PapersOnLine, vol. 53, no. 2, pp. 236–241, 2020. [CrossRef]
Figure 1.
Simplified topology of the 48 [V] DC to 120 [V] RMS voltage boost and inverter system.
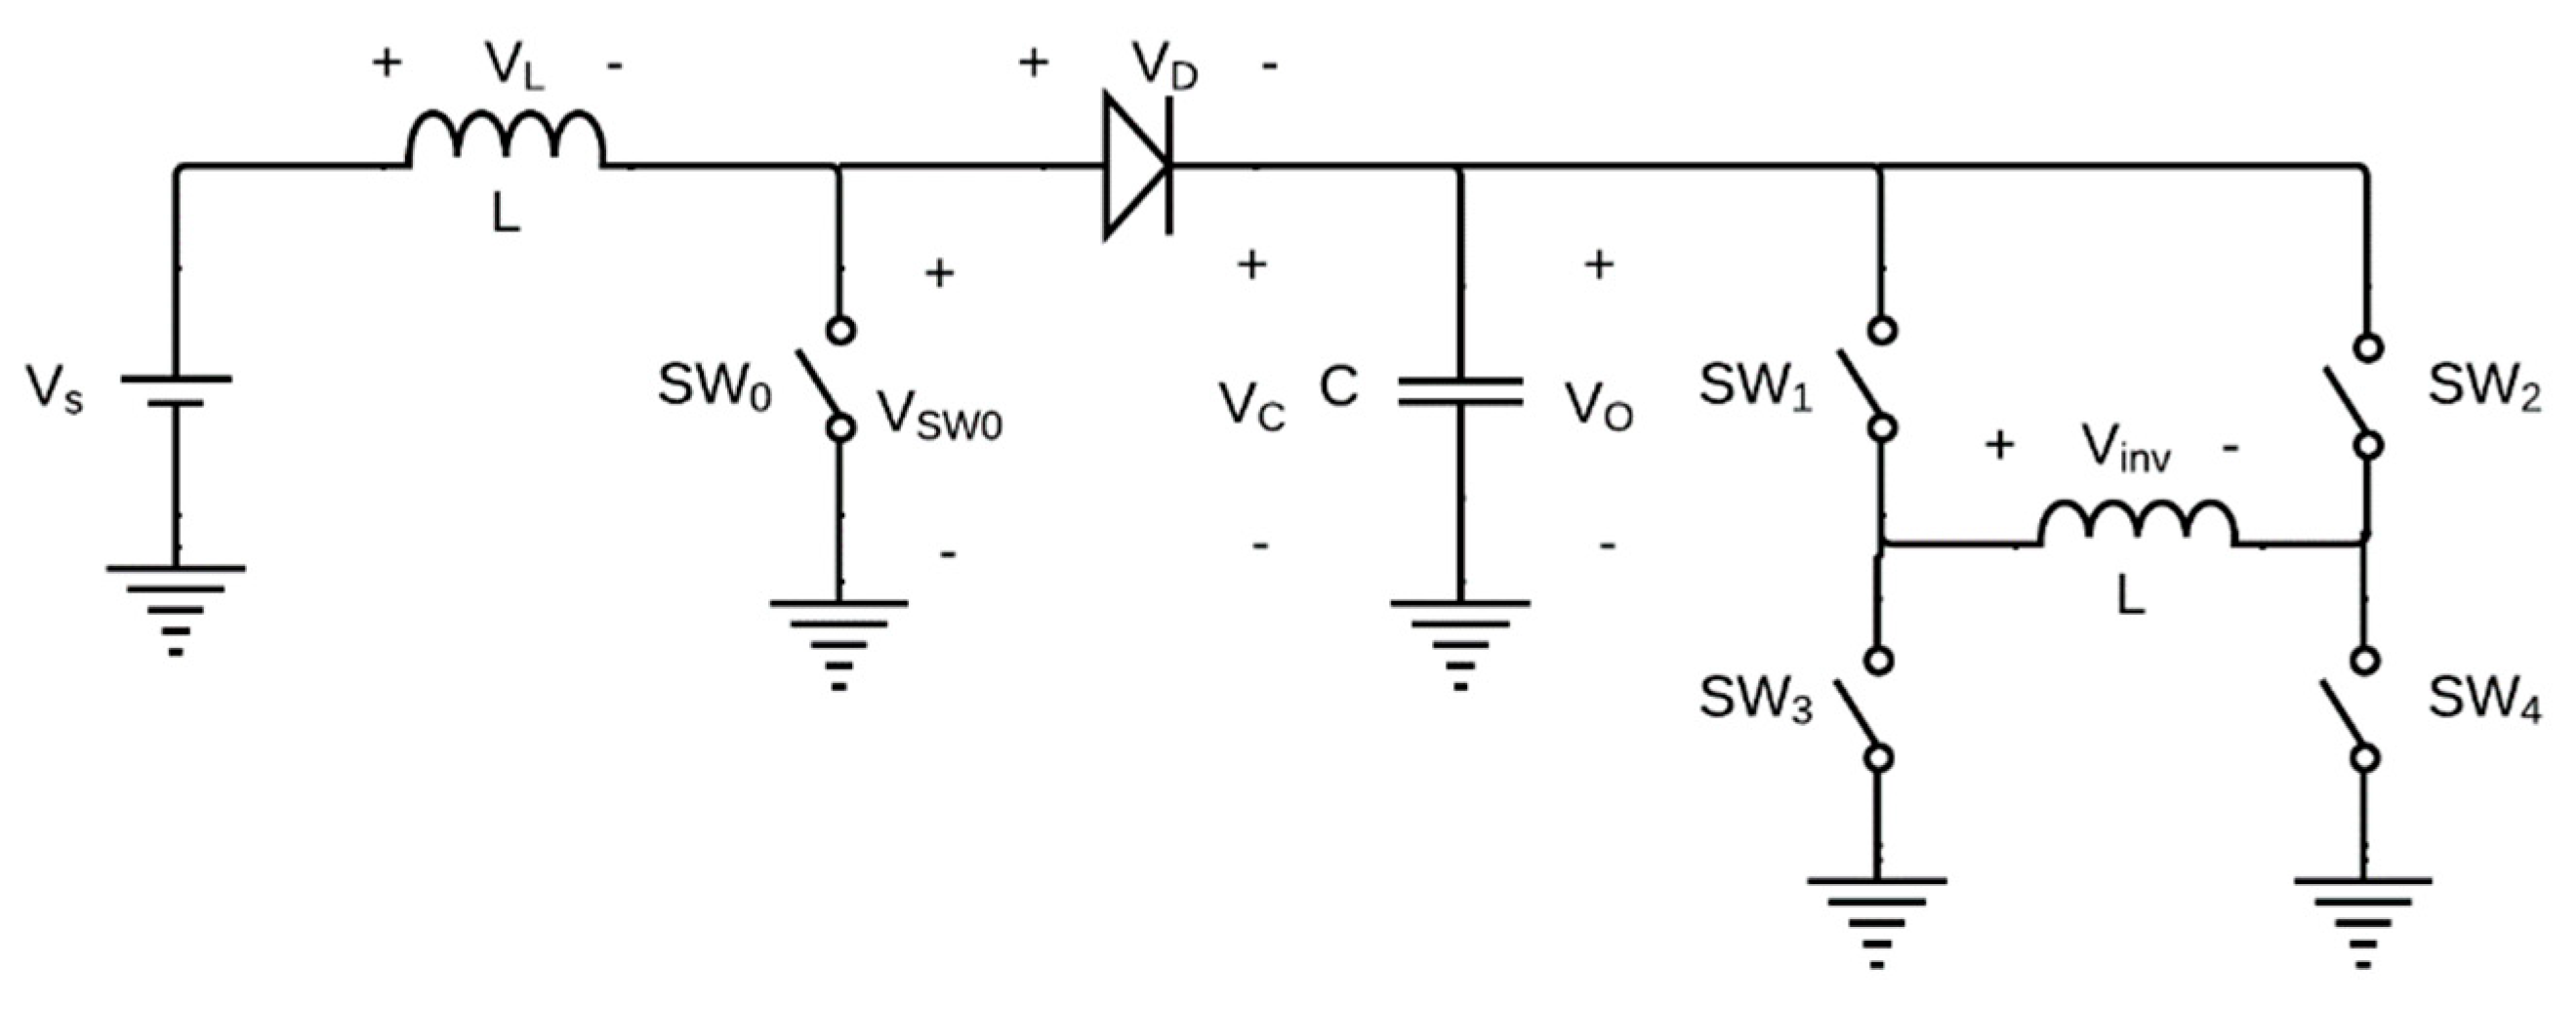
Figure 2.
The output stage of the DC-DC source and the AC inverter system schematic for determining the equivalent resistive load .
Figure 2.
The output stage of the DC-DC source and the AC inverter system schematic for determining the equivalent resistive load .
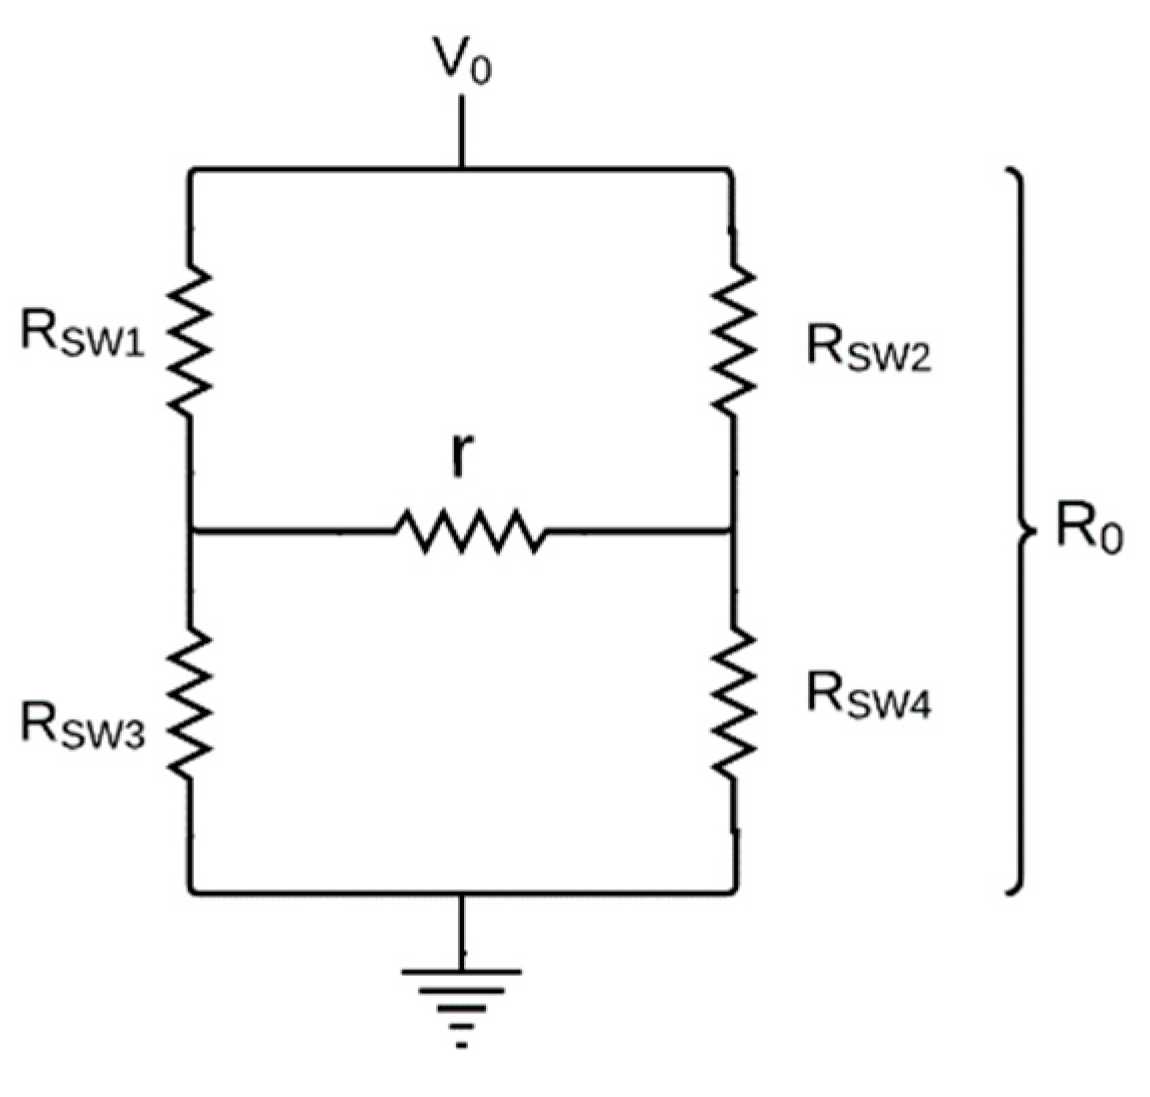
Figure 3.
Comparison criteria for generating the COS for , which corresponds to the duty cycle.
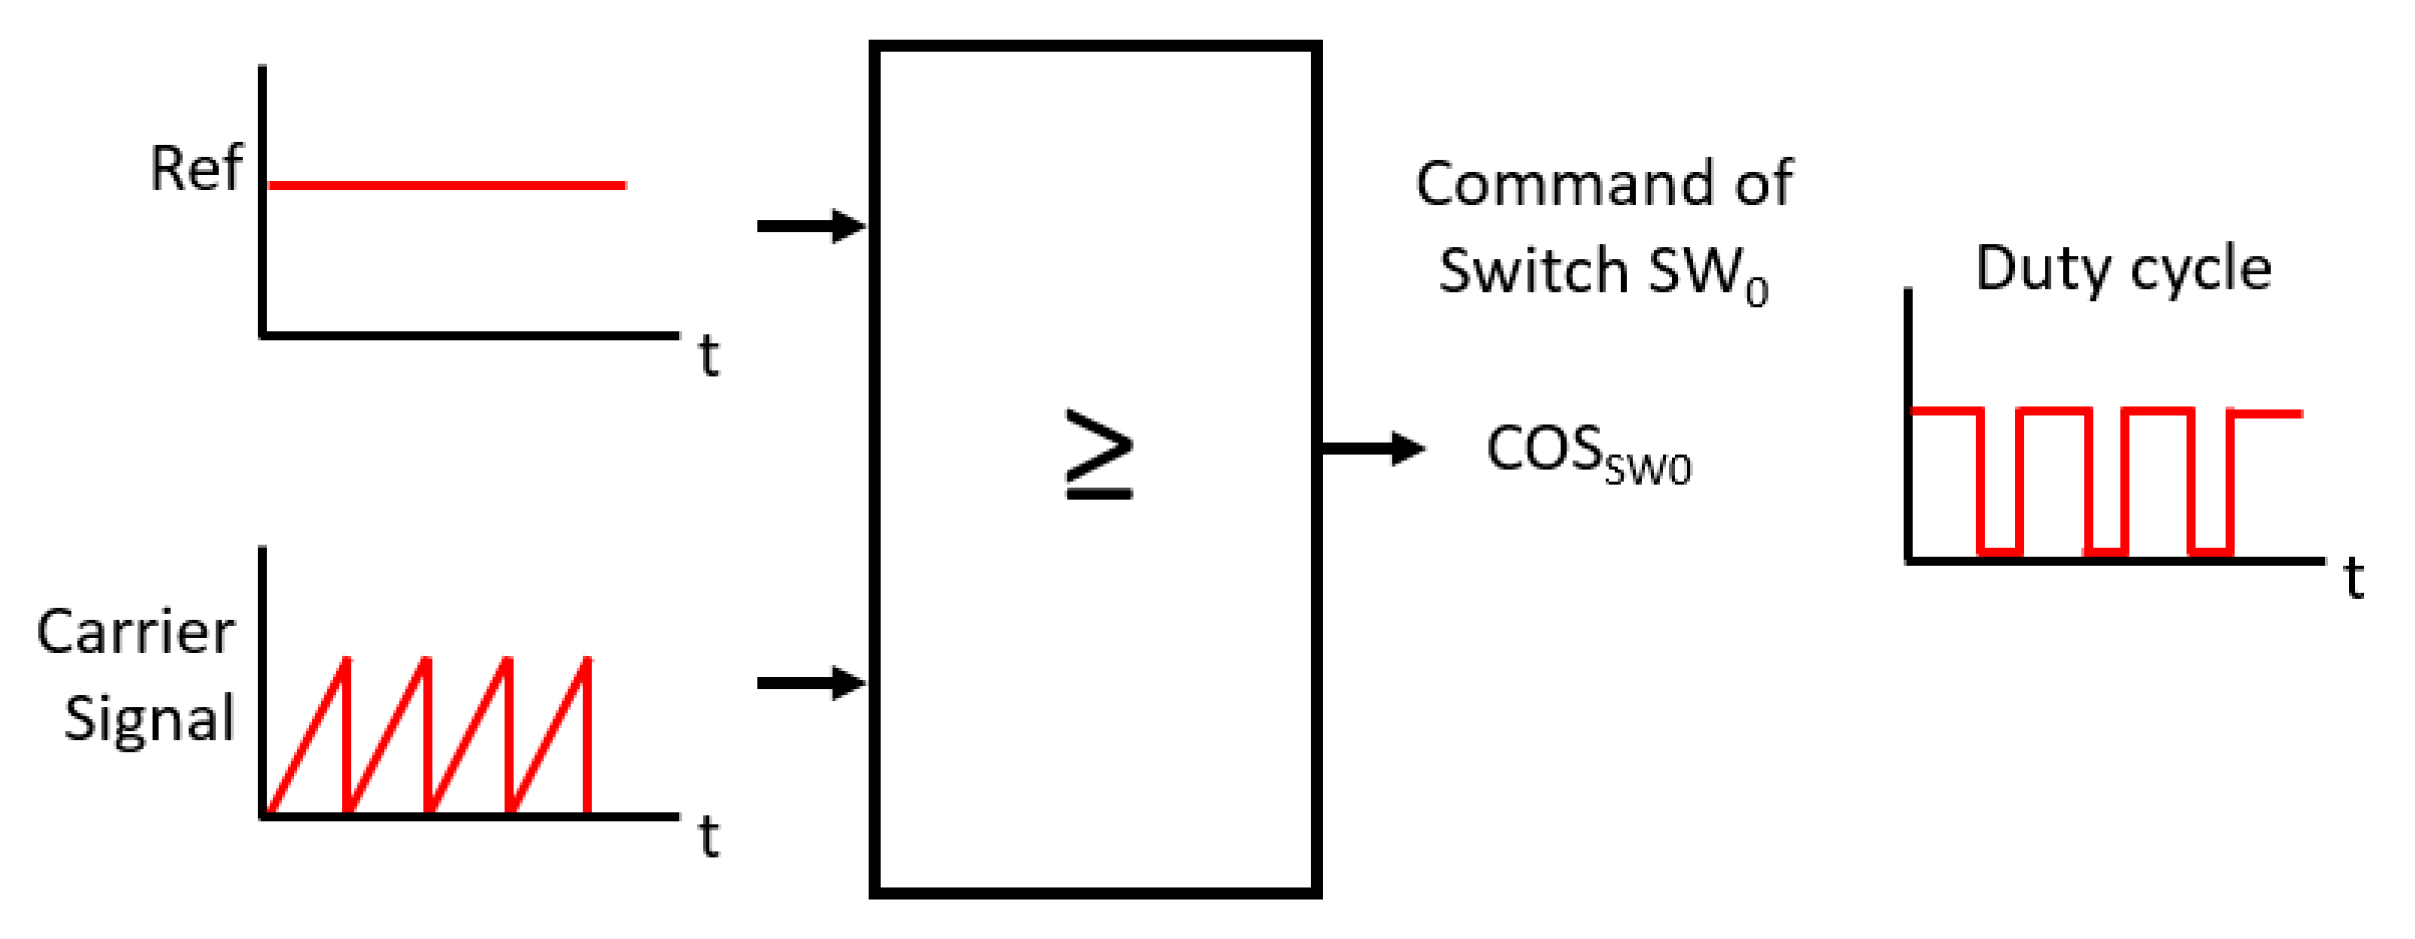
Figure 4.
Generation of pulse width modulation commands and the inverter system.
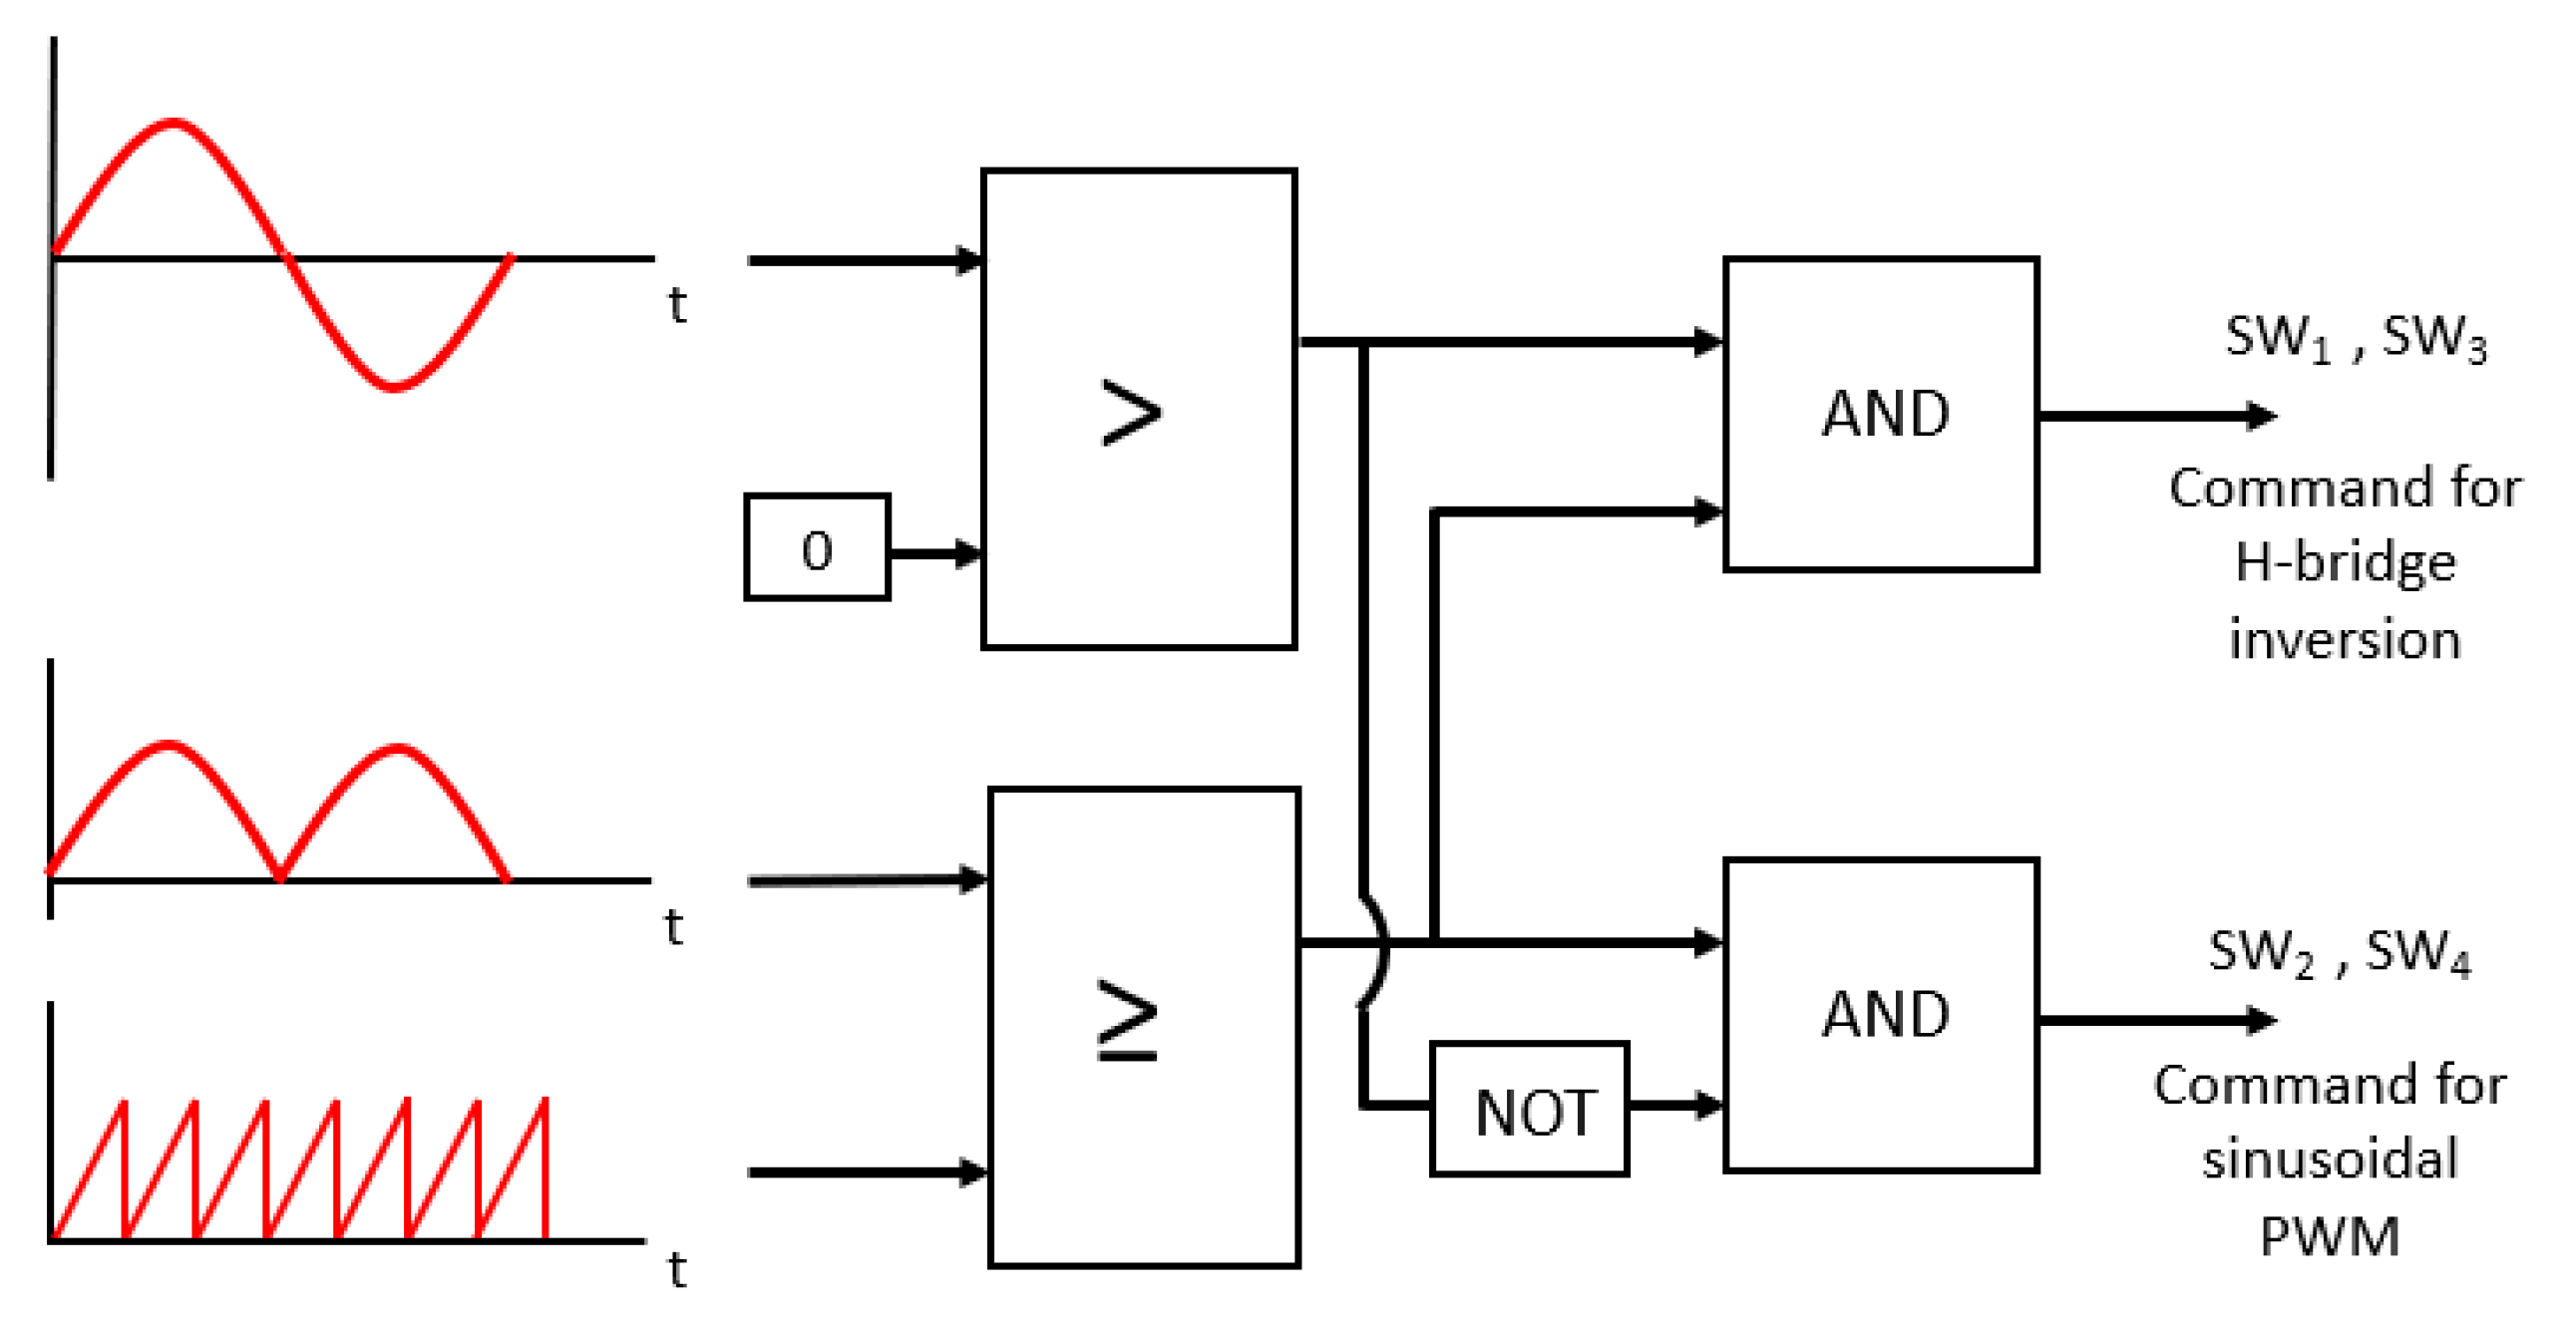
Figure 5.
Simplified nonlinear diagram of the dynamics of the boost and inverter system.
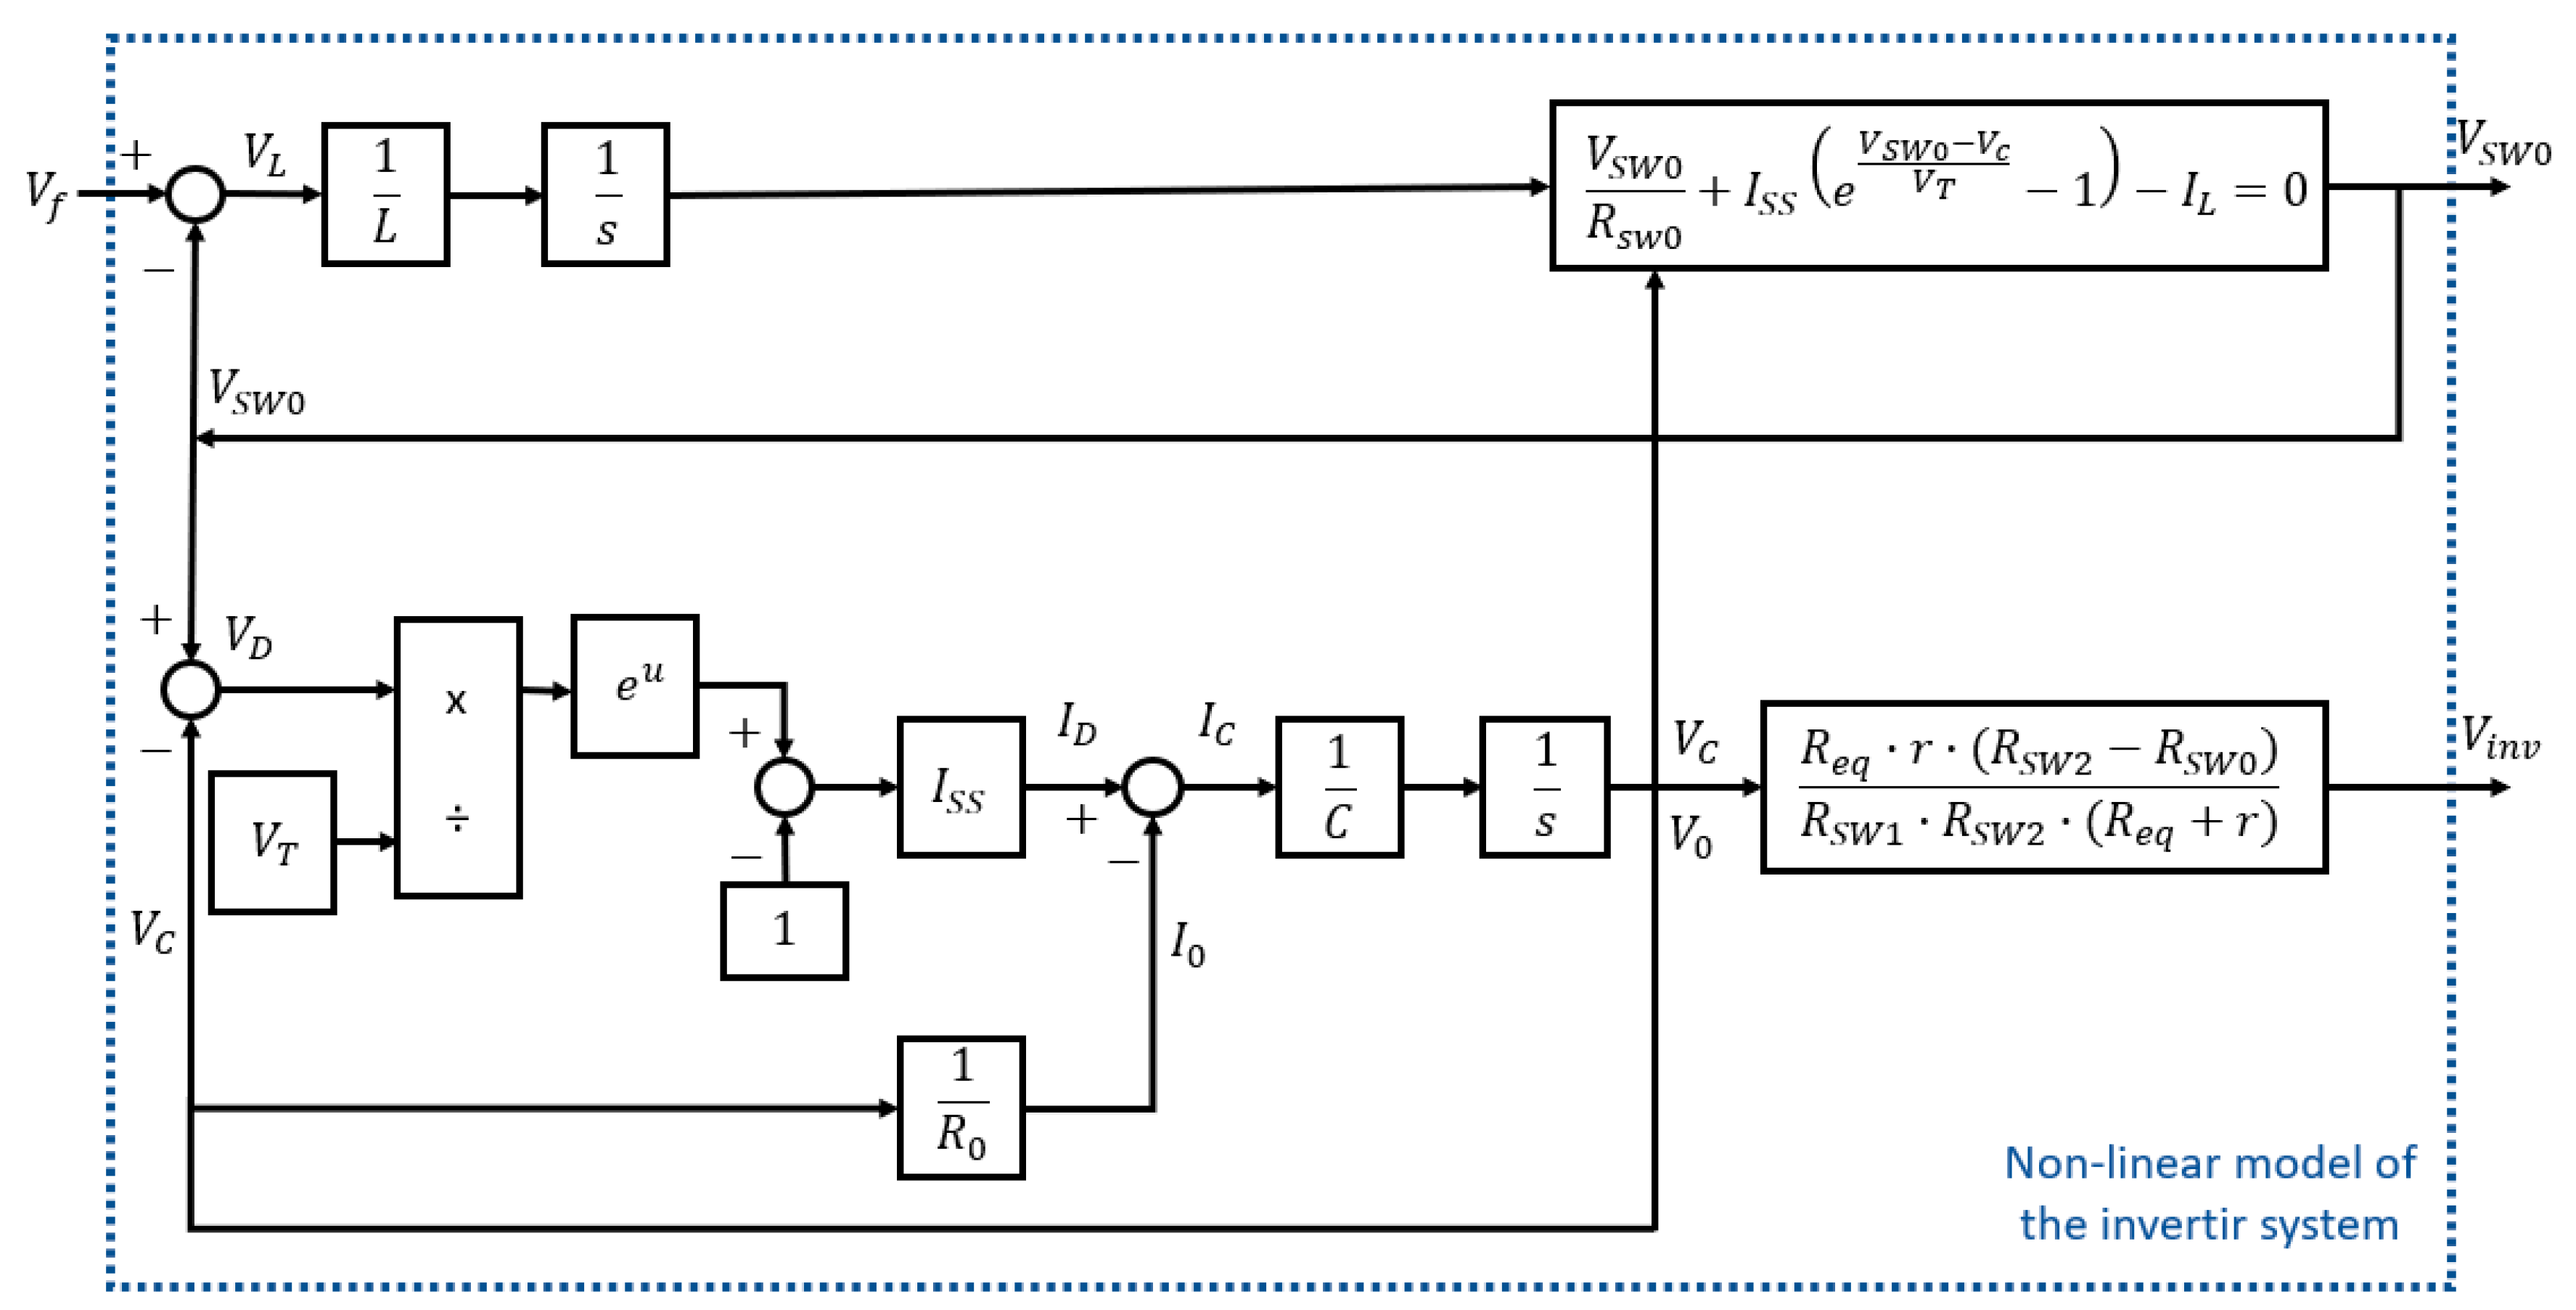
Figure 6.
Simplified topology of the 48 [V] DC to 120 [V] rms boost and inverter system with coupling transformer and filtering.
Figure 6.
Simplified topology of the 48 [V] DC to 120 [V] rms boost and inverter system with coupling transformer and filtering.
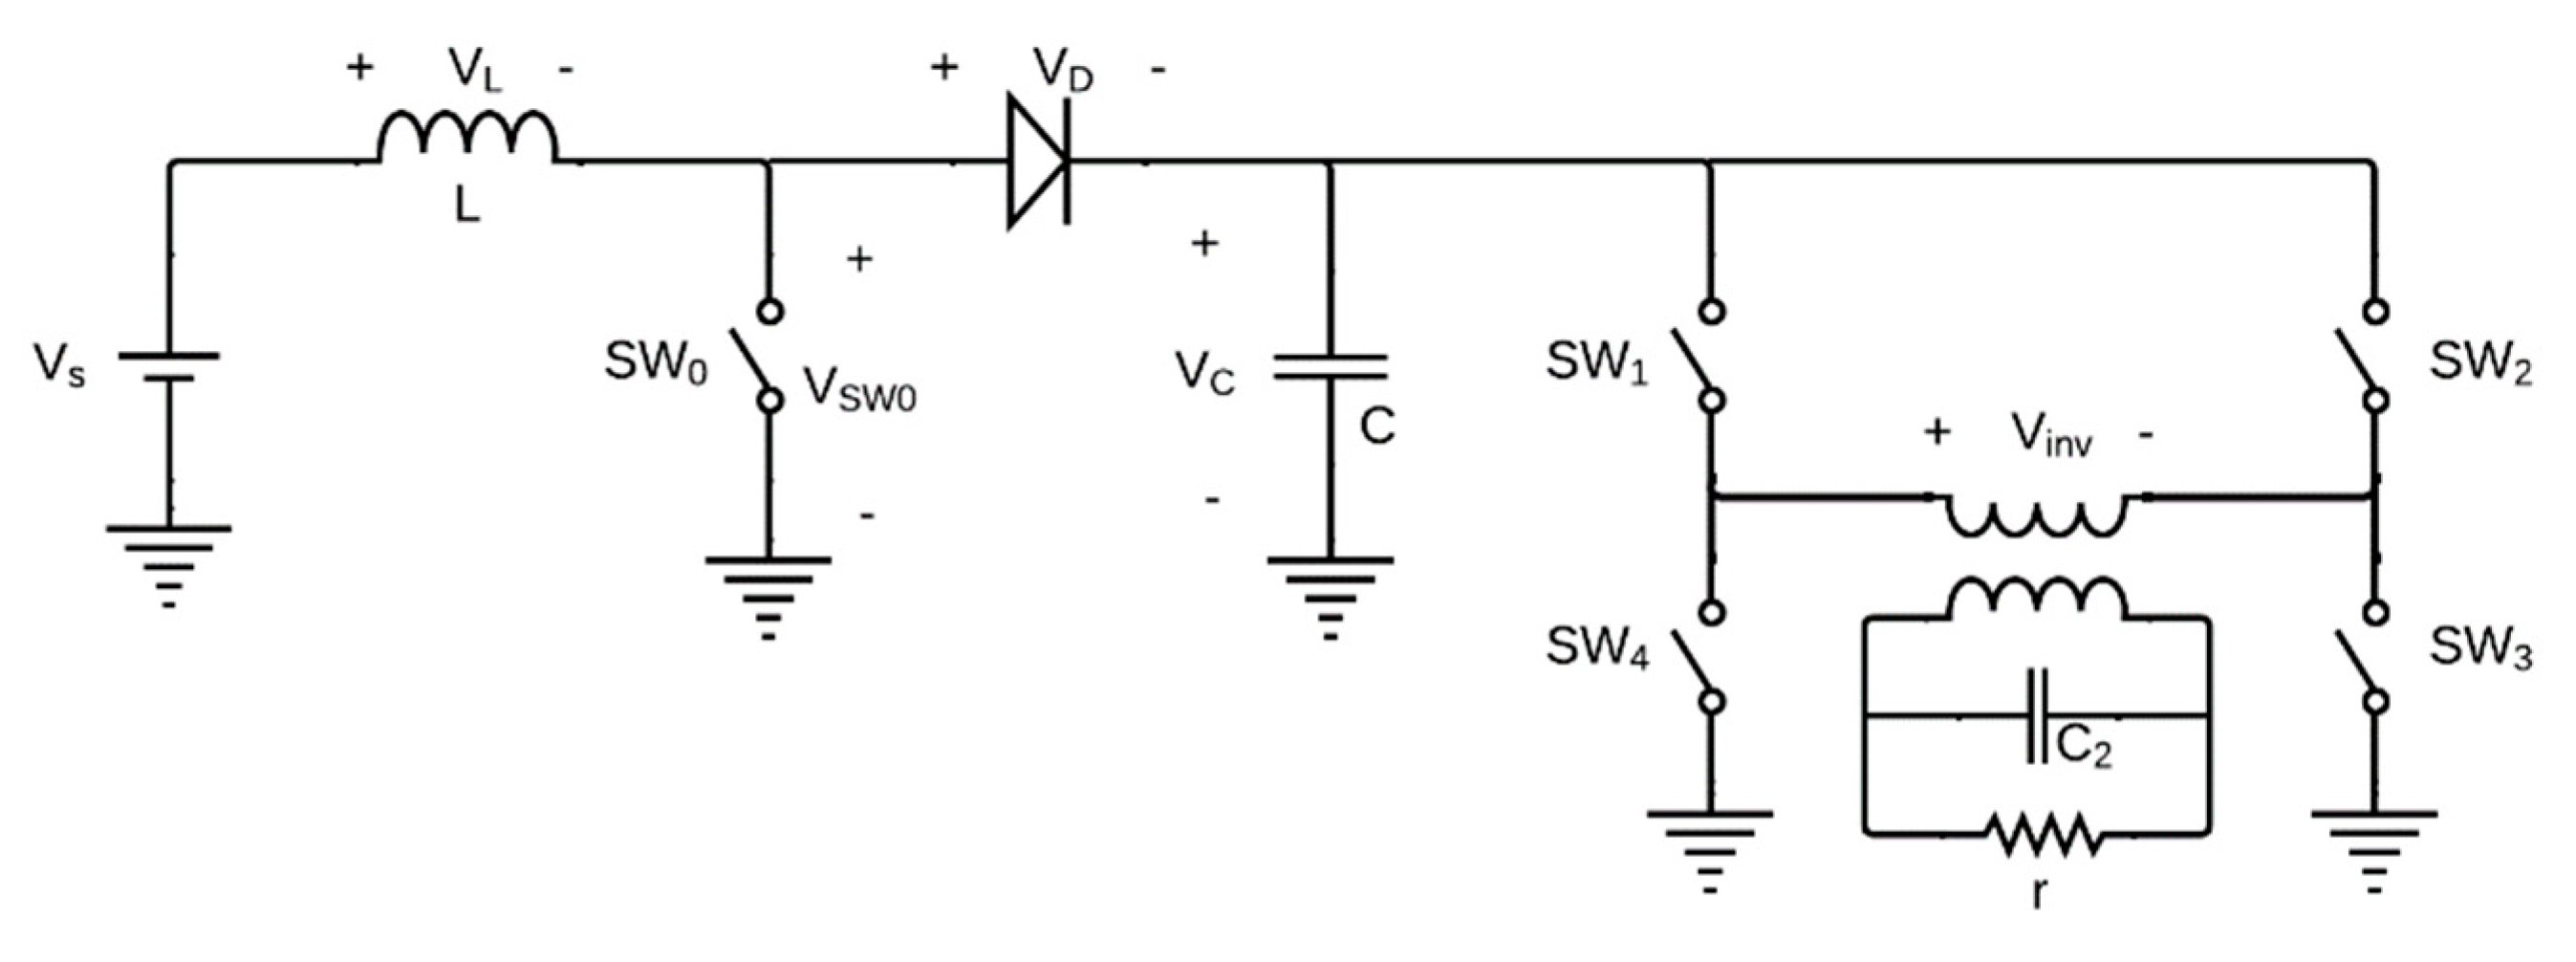
Figure 7.
Simplified nonlinear diagram of the dynamics of the boost and inverter system with the coupling transformer and filtering.
Figure 7.
Simplified nonlinear diagram of the dynamics of the boost and inverter system with the coupling transformer and filtering.
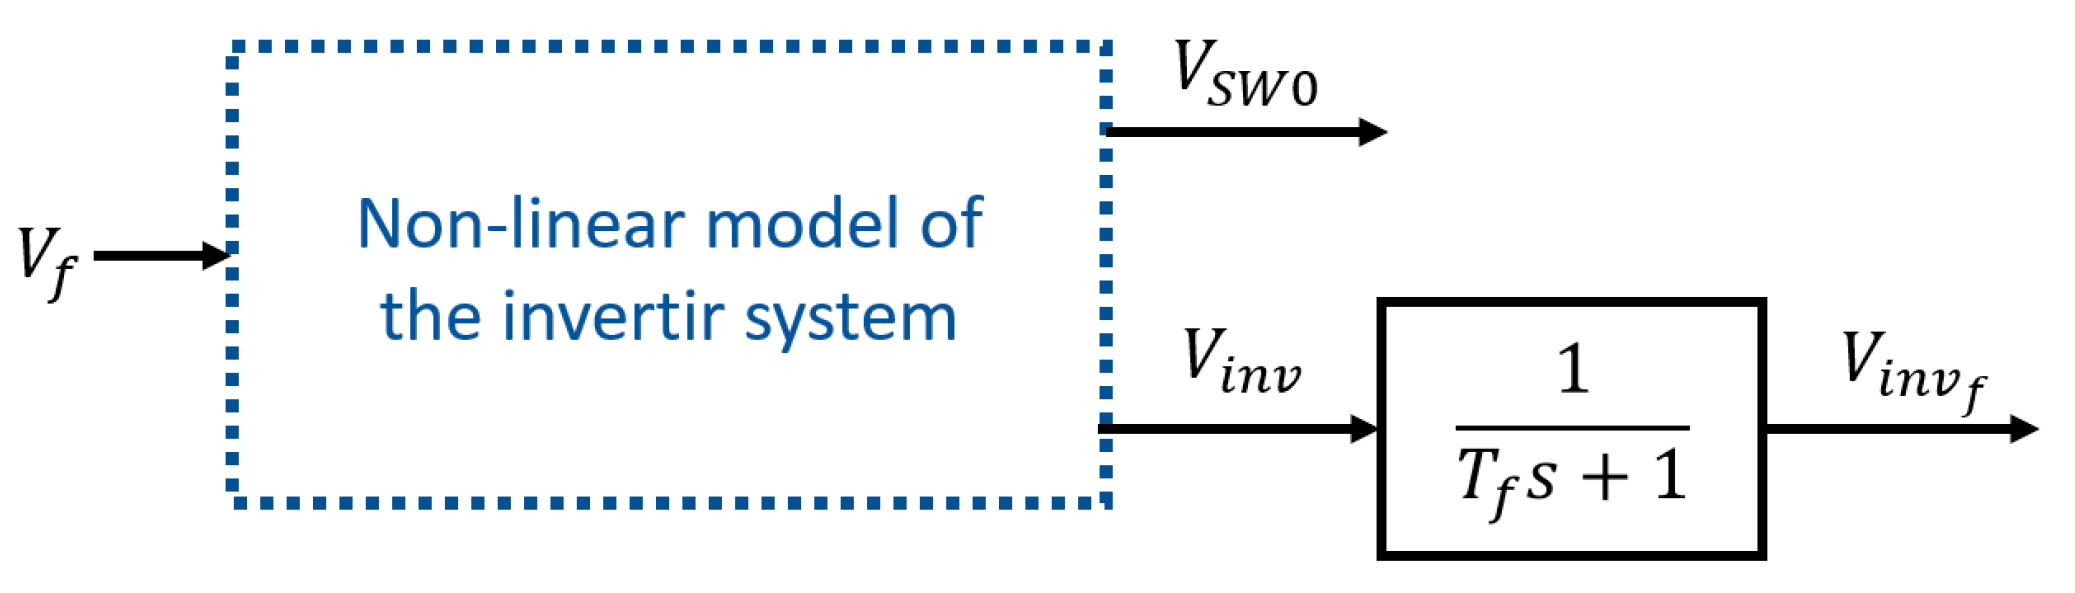
Figure 10.
Spectrum in , normalized with respect to the magnitude at the frequency of the: a) output voltage in the DC-AC inverter stage, and b) voltage at the output of the filtering transformer.
Figure 10.
Spectrum in , normalized with respect to the magnitude at the frequency of the: a) output voltage in the DC-AC inverter stage, and b) voltage at the output of the filtering transformer.
| Parameter | Mean Value | ||
|---|---|---|---|
| % Rizo | % Rizo | ||
| Output Voltage | V | ||
| Inductor Current | A |
Figure 11.
a) and b) show the evolution of the fitted parameters of the simplified model. c) presents the cost function descending gradient of the optimization process, and d), denotes the time response of the output voltage of the boost converter, where Data 1 represents the simulated dynamics, and Data 2 represents the best fitted second-order system.
Figure 11.
a) and b) show the evolution of the fitted parameters of the simplified model. c) presents the cost function descending gradient of the optimization process, and d), denotes the time response of the output voltage of the boost converter, where Data 1 represents the simulated dynamics, and Data 2 represents the best fitted second-order system.
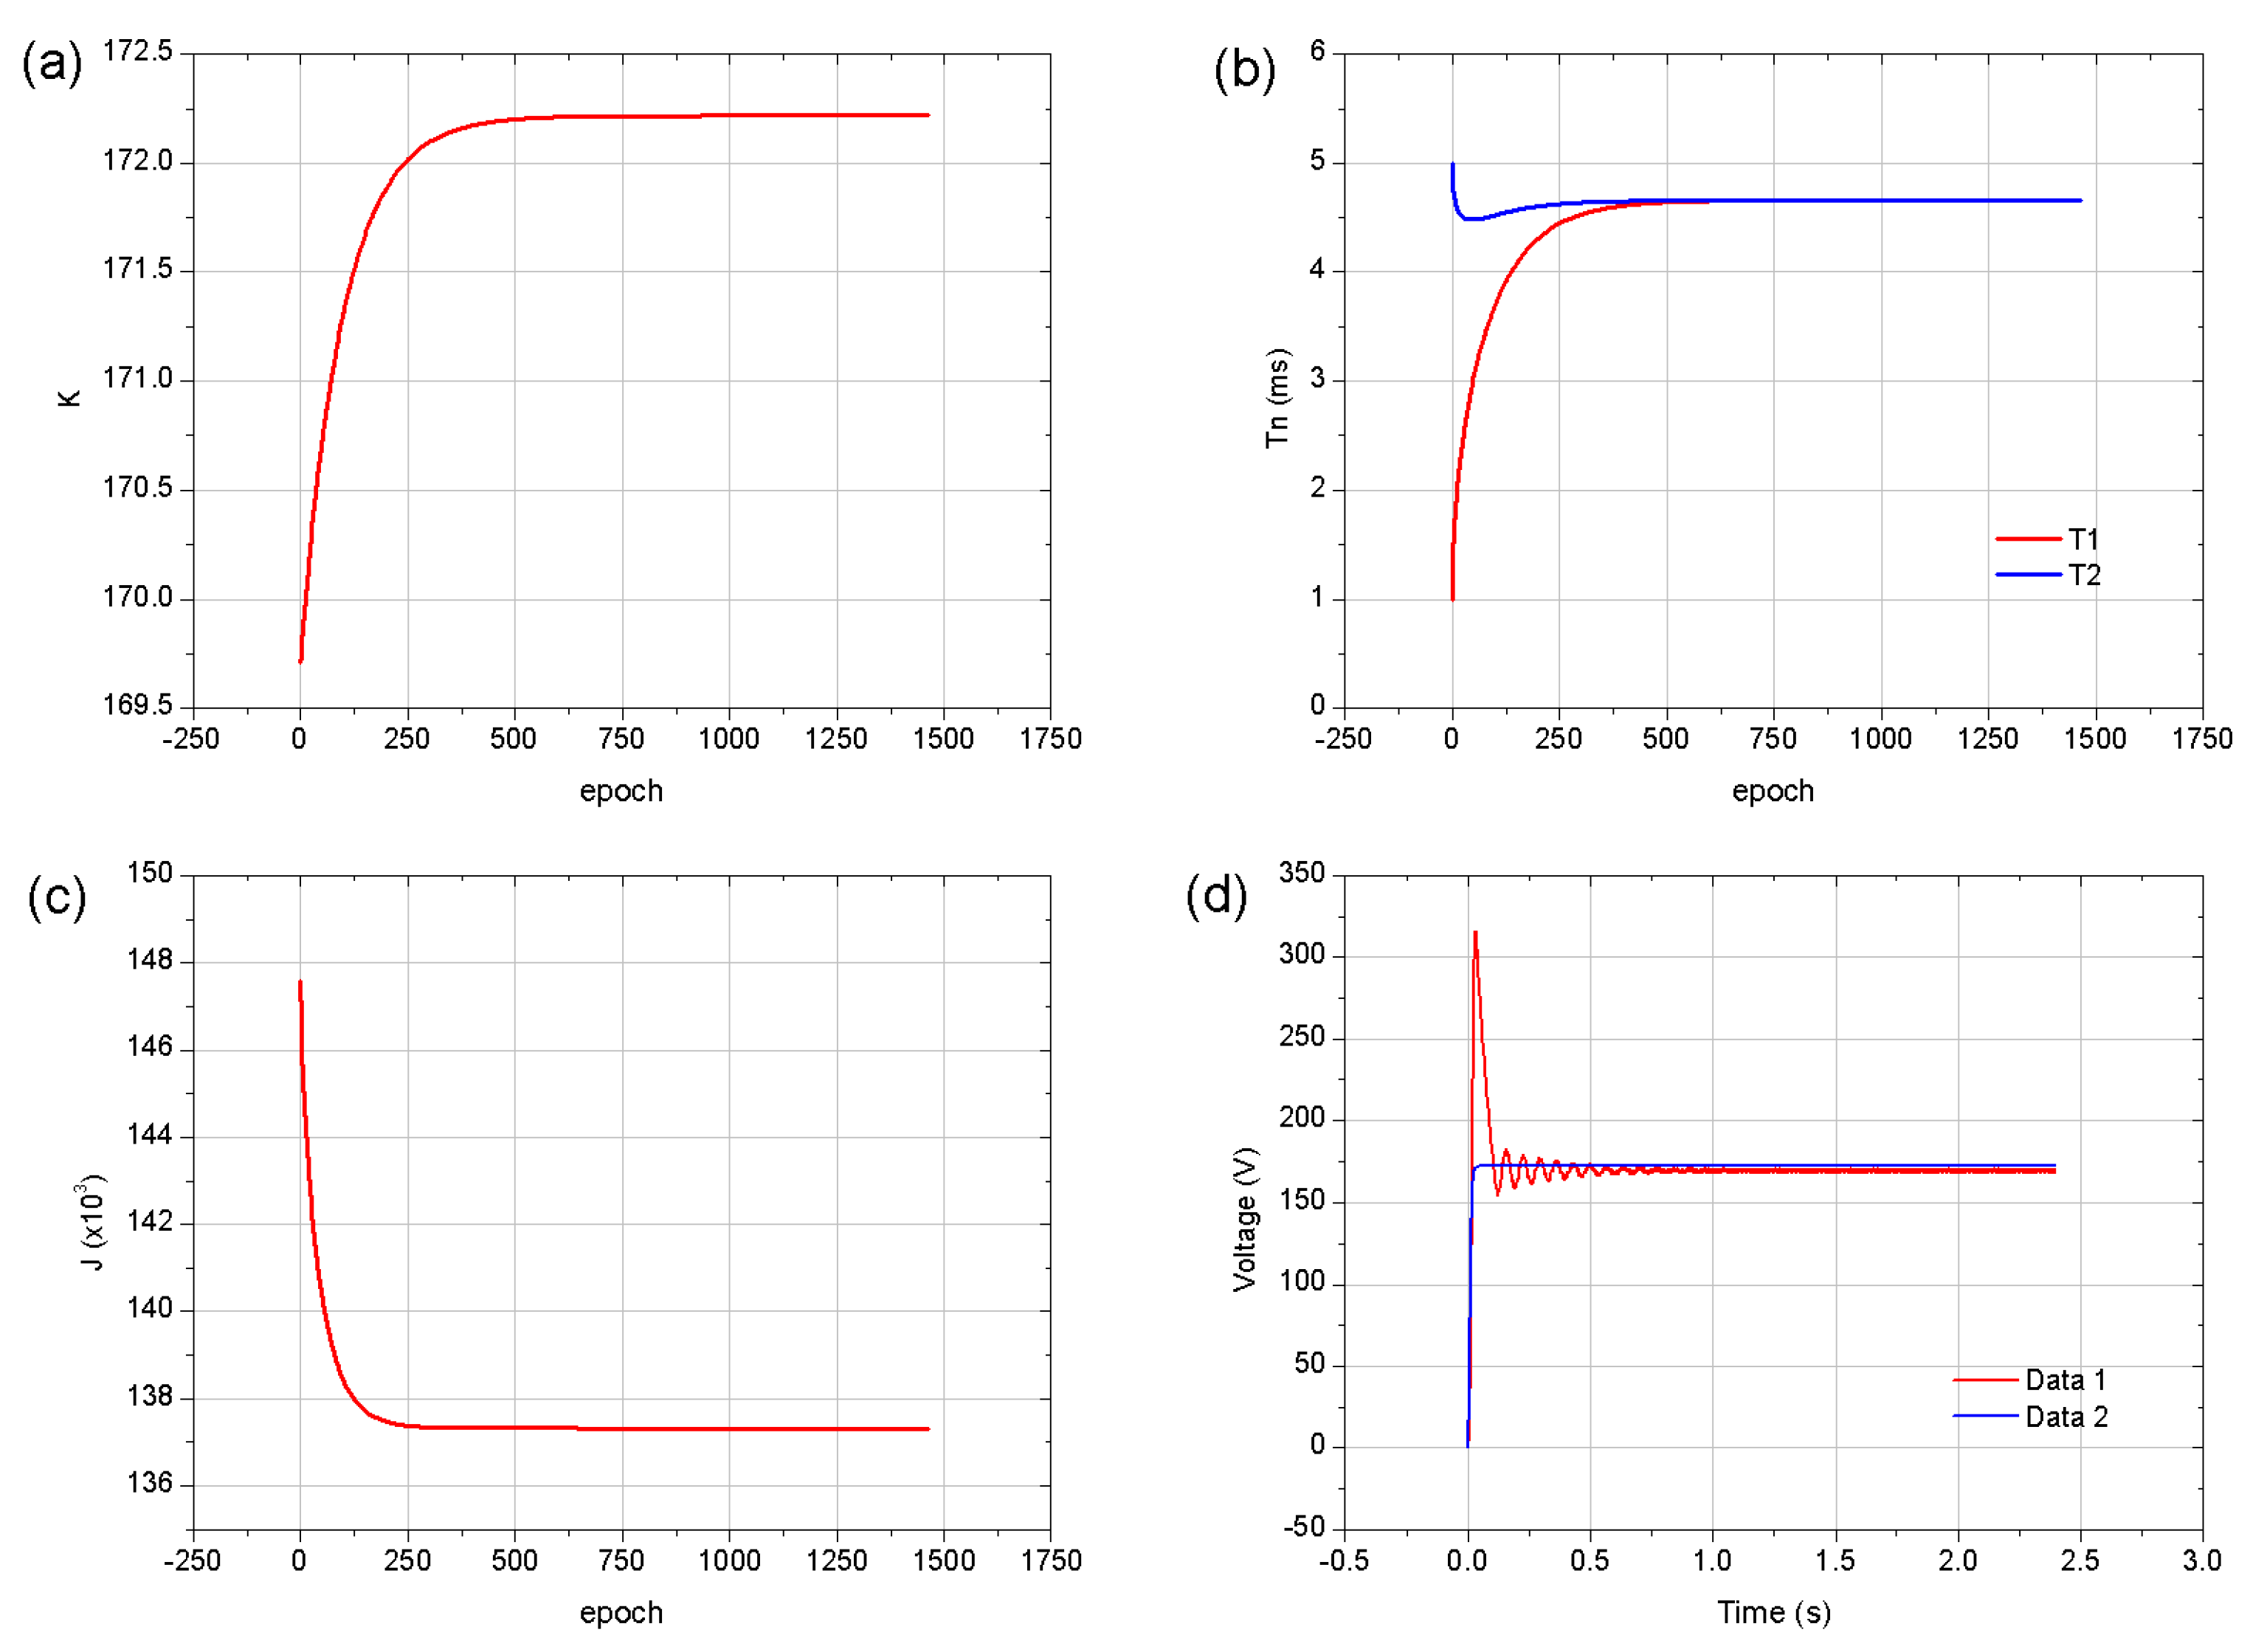
Figure 12.
a) Adjustment of the response of the approximate system with a PI controller, b) optimized cost function, c) evolution of the proportional gain, and d) evolution of the integral time.
Figure 12.
a) Adjustment of the response of the approximate system with a PI controller, b) optimized cost function, c) evolution of the proportional gain, and d) evolution of the integral time.
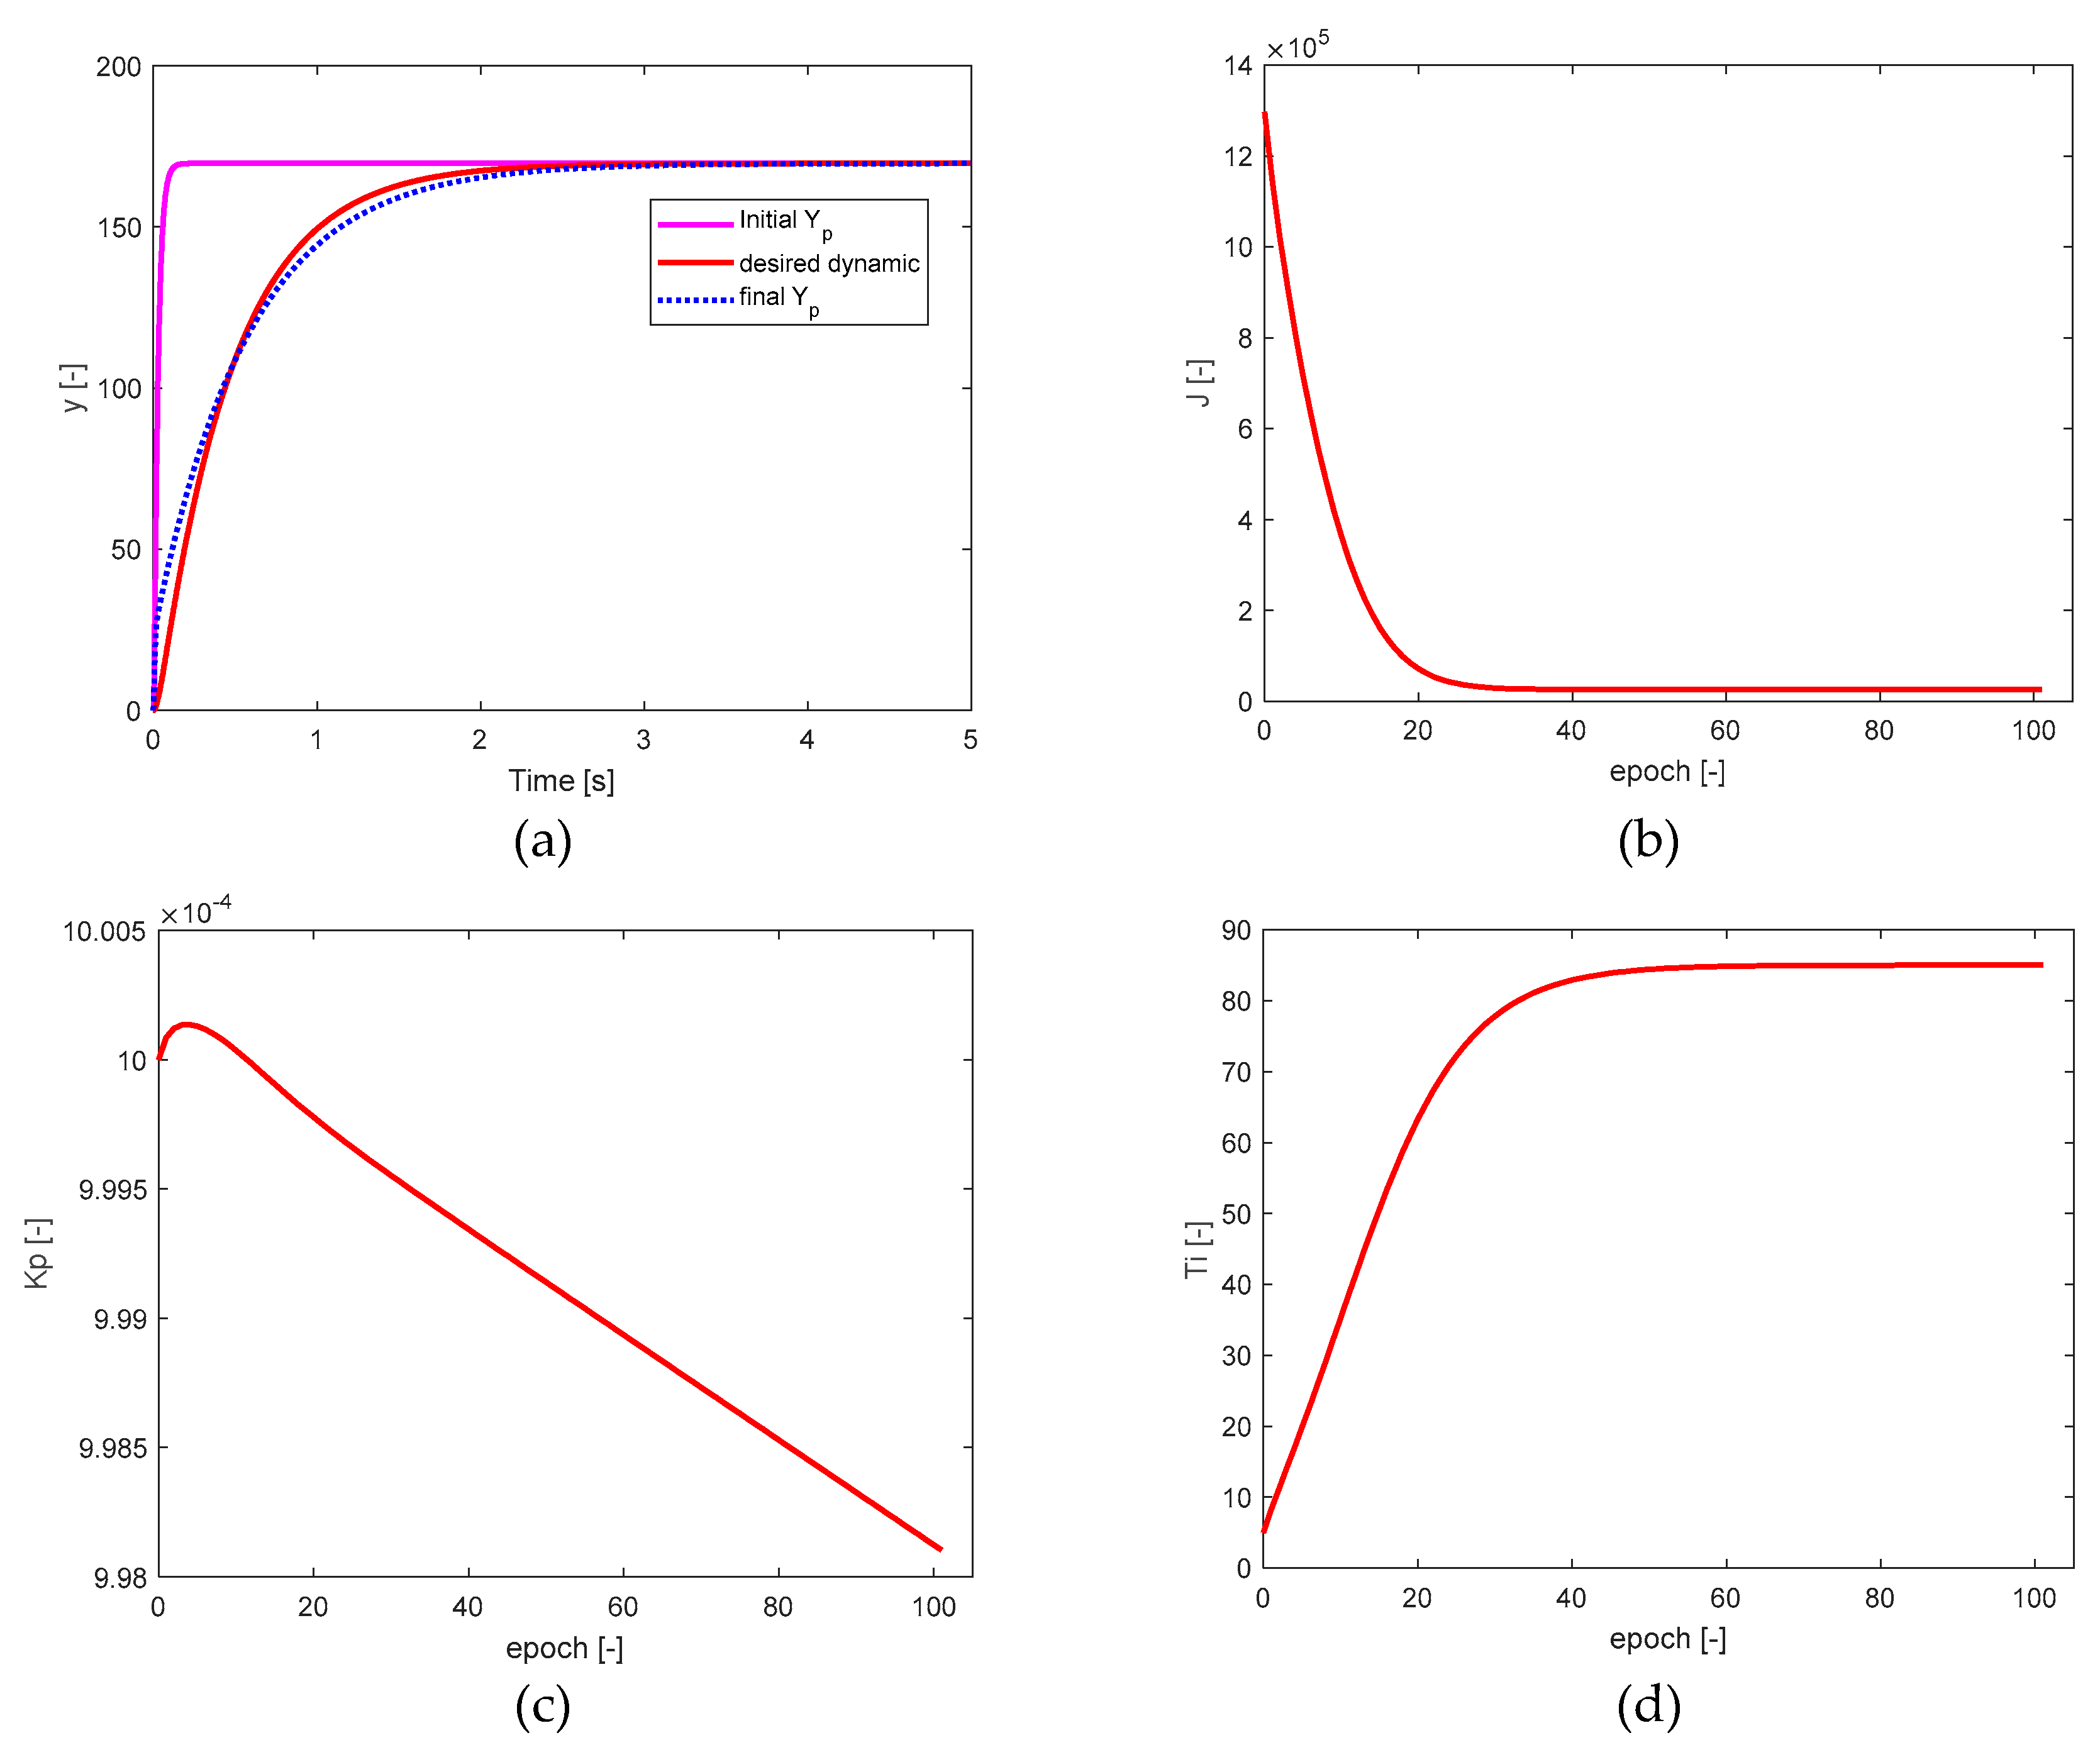
Figure 13.
a) Control scheme of the fuzzy PI controller with anti-windup effect for voltage regulation of the inverter system from a battery pack.
Figure 13.
a) Control scheme of the fuzzy PI controller with anti-windup effect for voltage regulation of the inverter system from a battery pack.
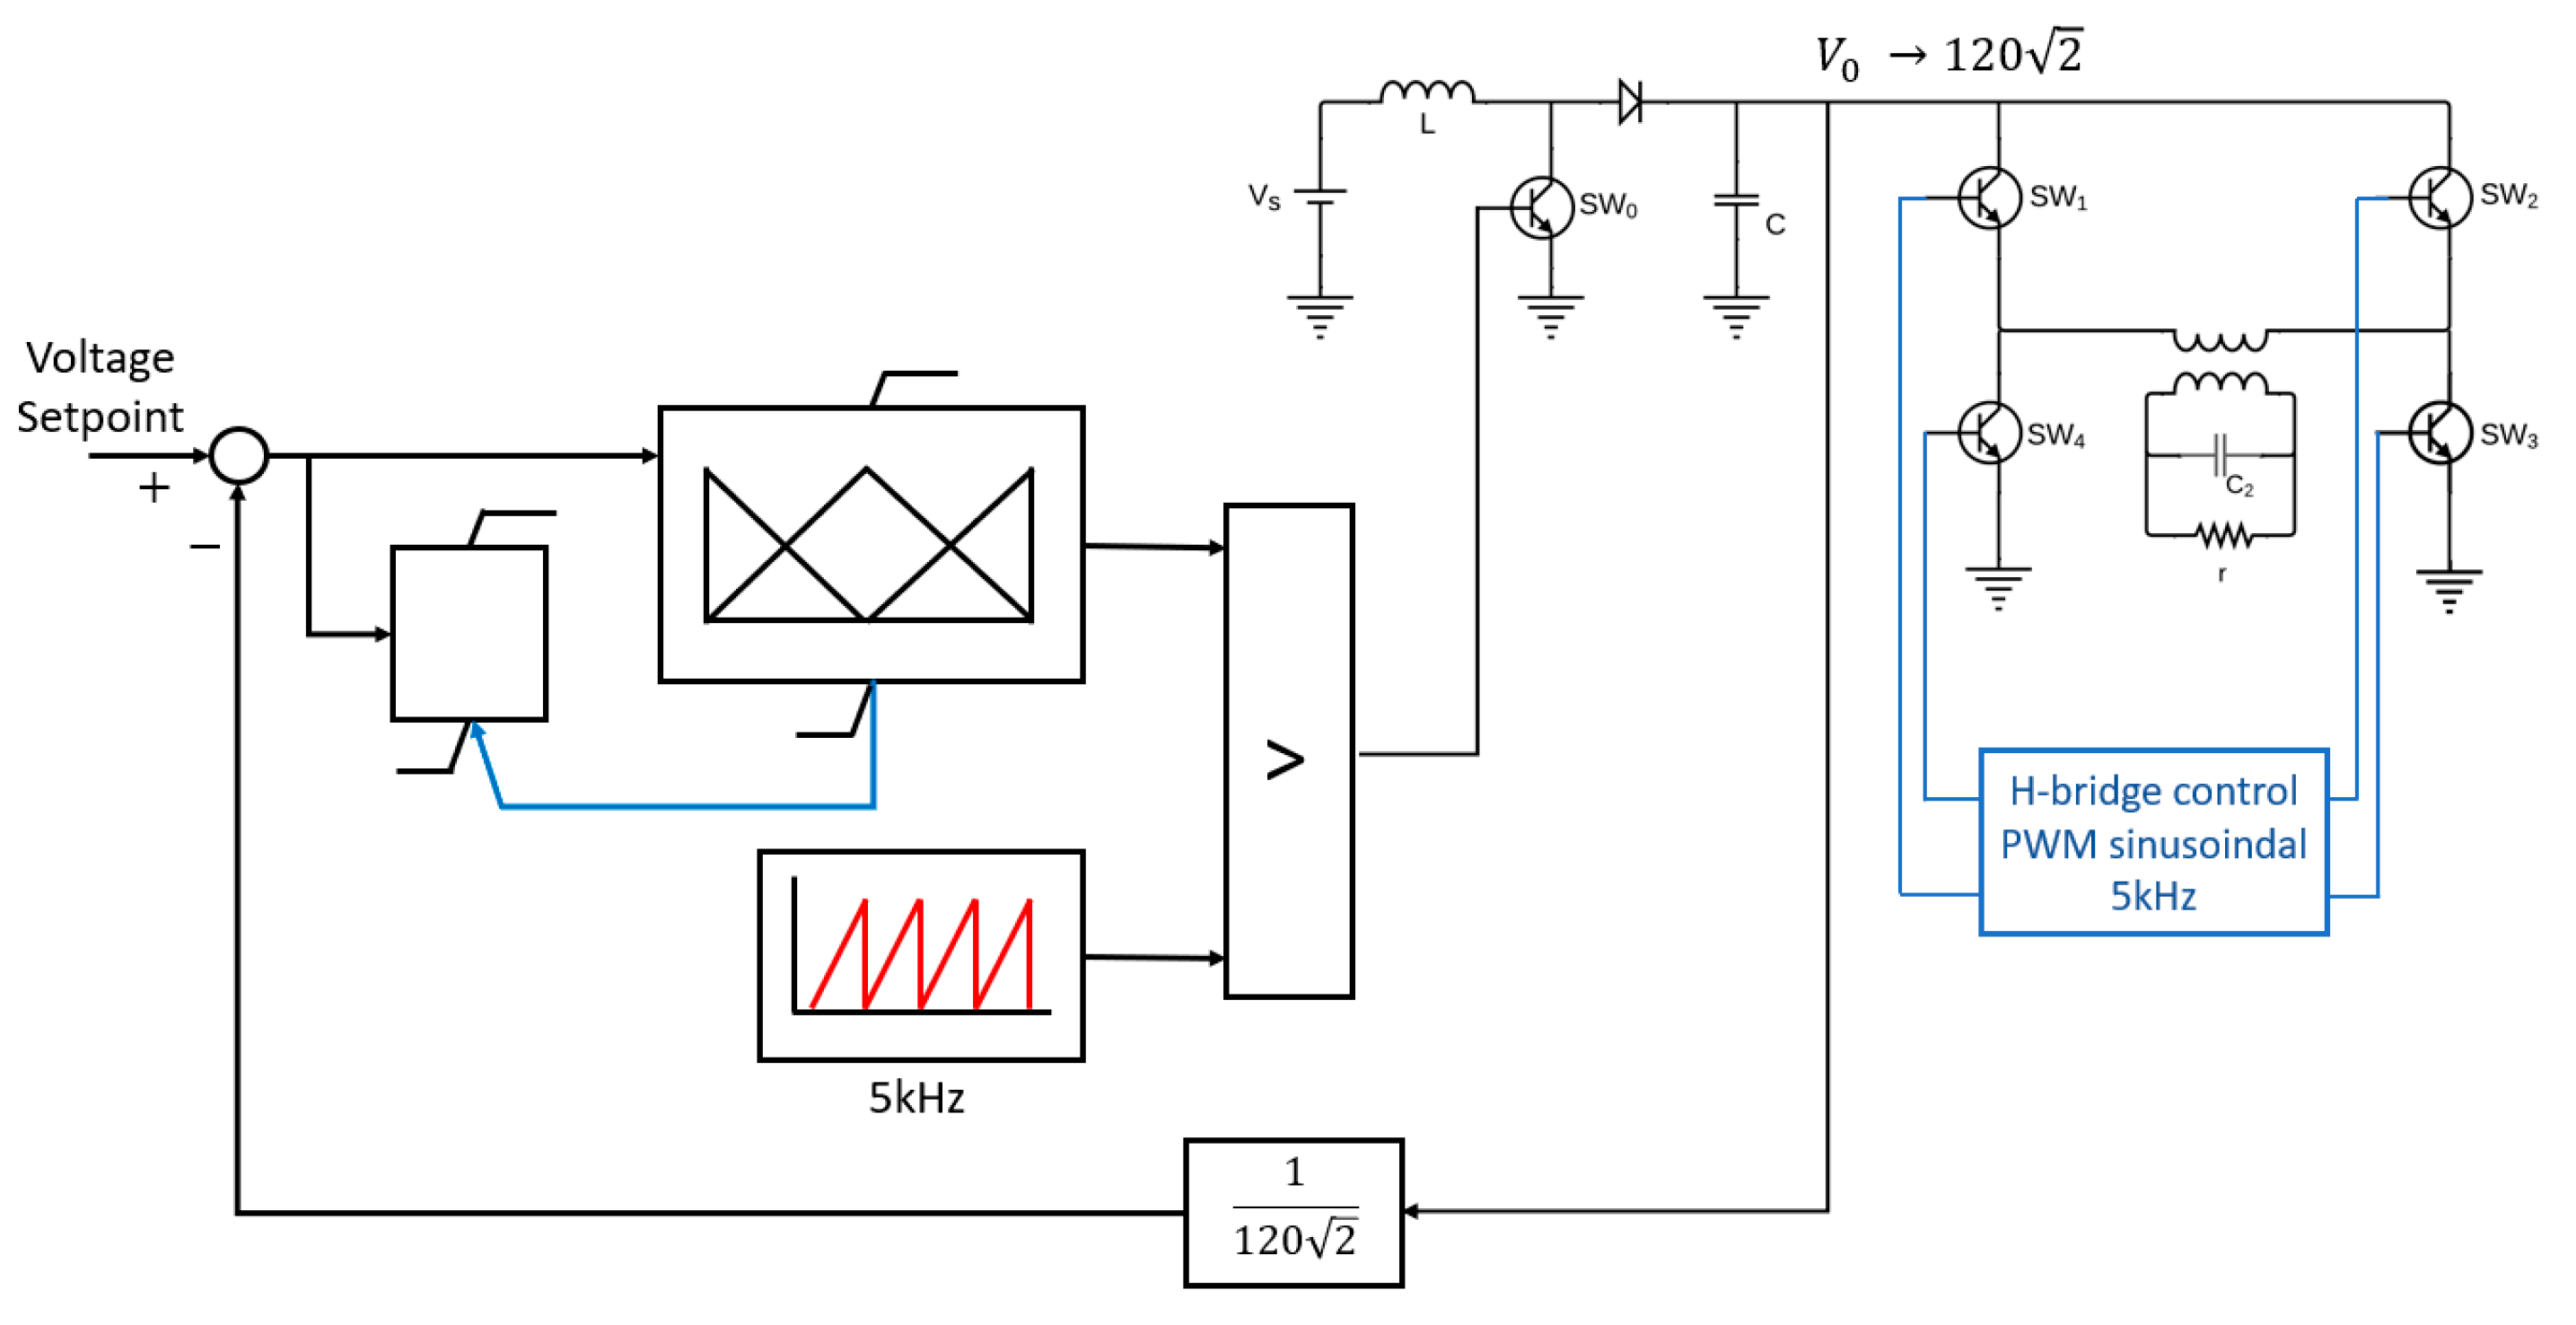
Figure 14.
a) Control output prediction surface defined by randomly adjusted singletons. b) Control output prediction surface after adjusting the weights of the singletons. c) Cost function evolution of training. d) Evolution of the 25 singletons in the fuzzy PI control system training.
Figure 14.
a) Control output prediction surface defined by randomly adjusted singletons. b) Control output prediction surface after adjusting the weights of the singletons. c) Cost function evolution of training. d) Evolution of the 25 singletons in the fuzzy PI control system training.
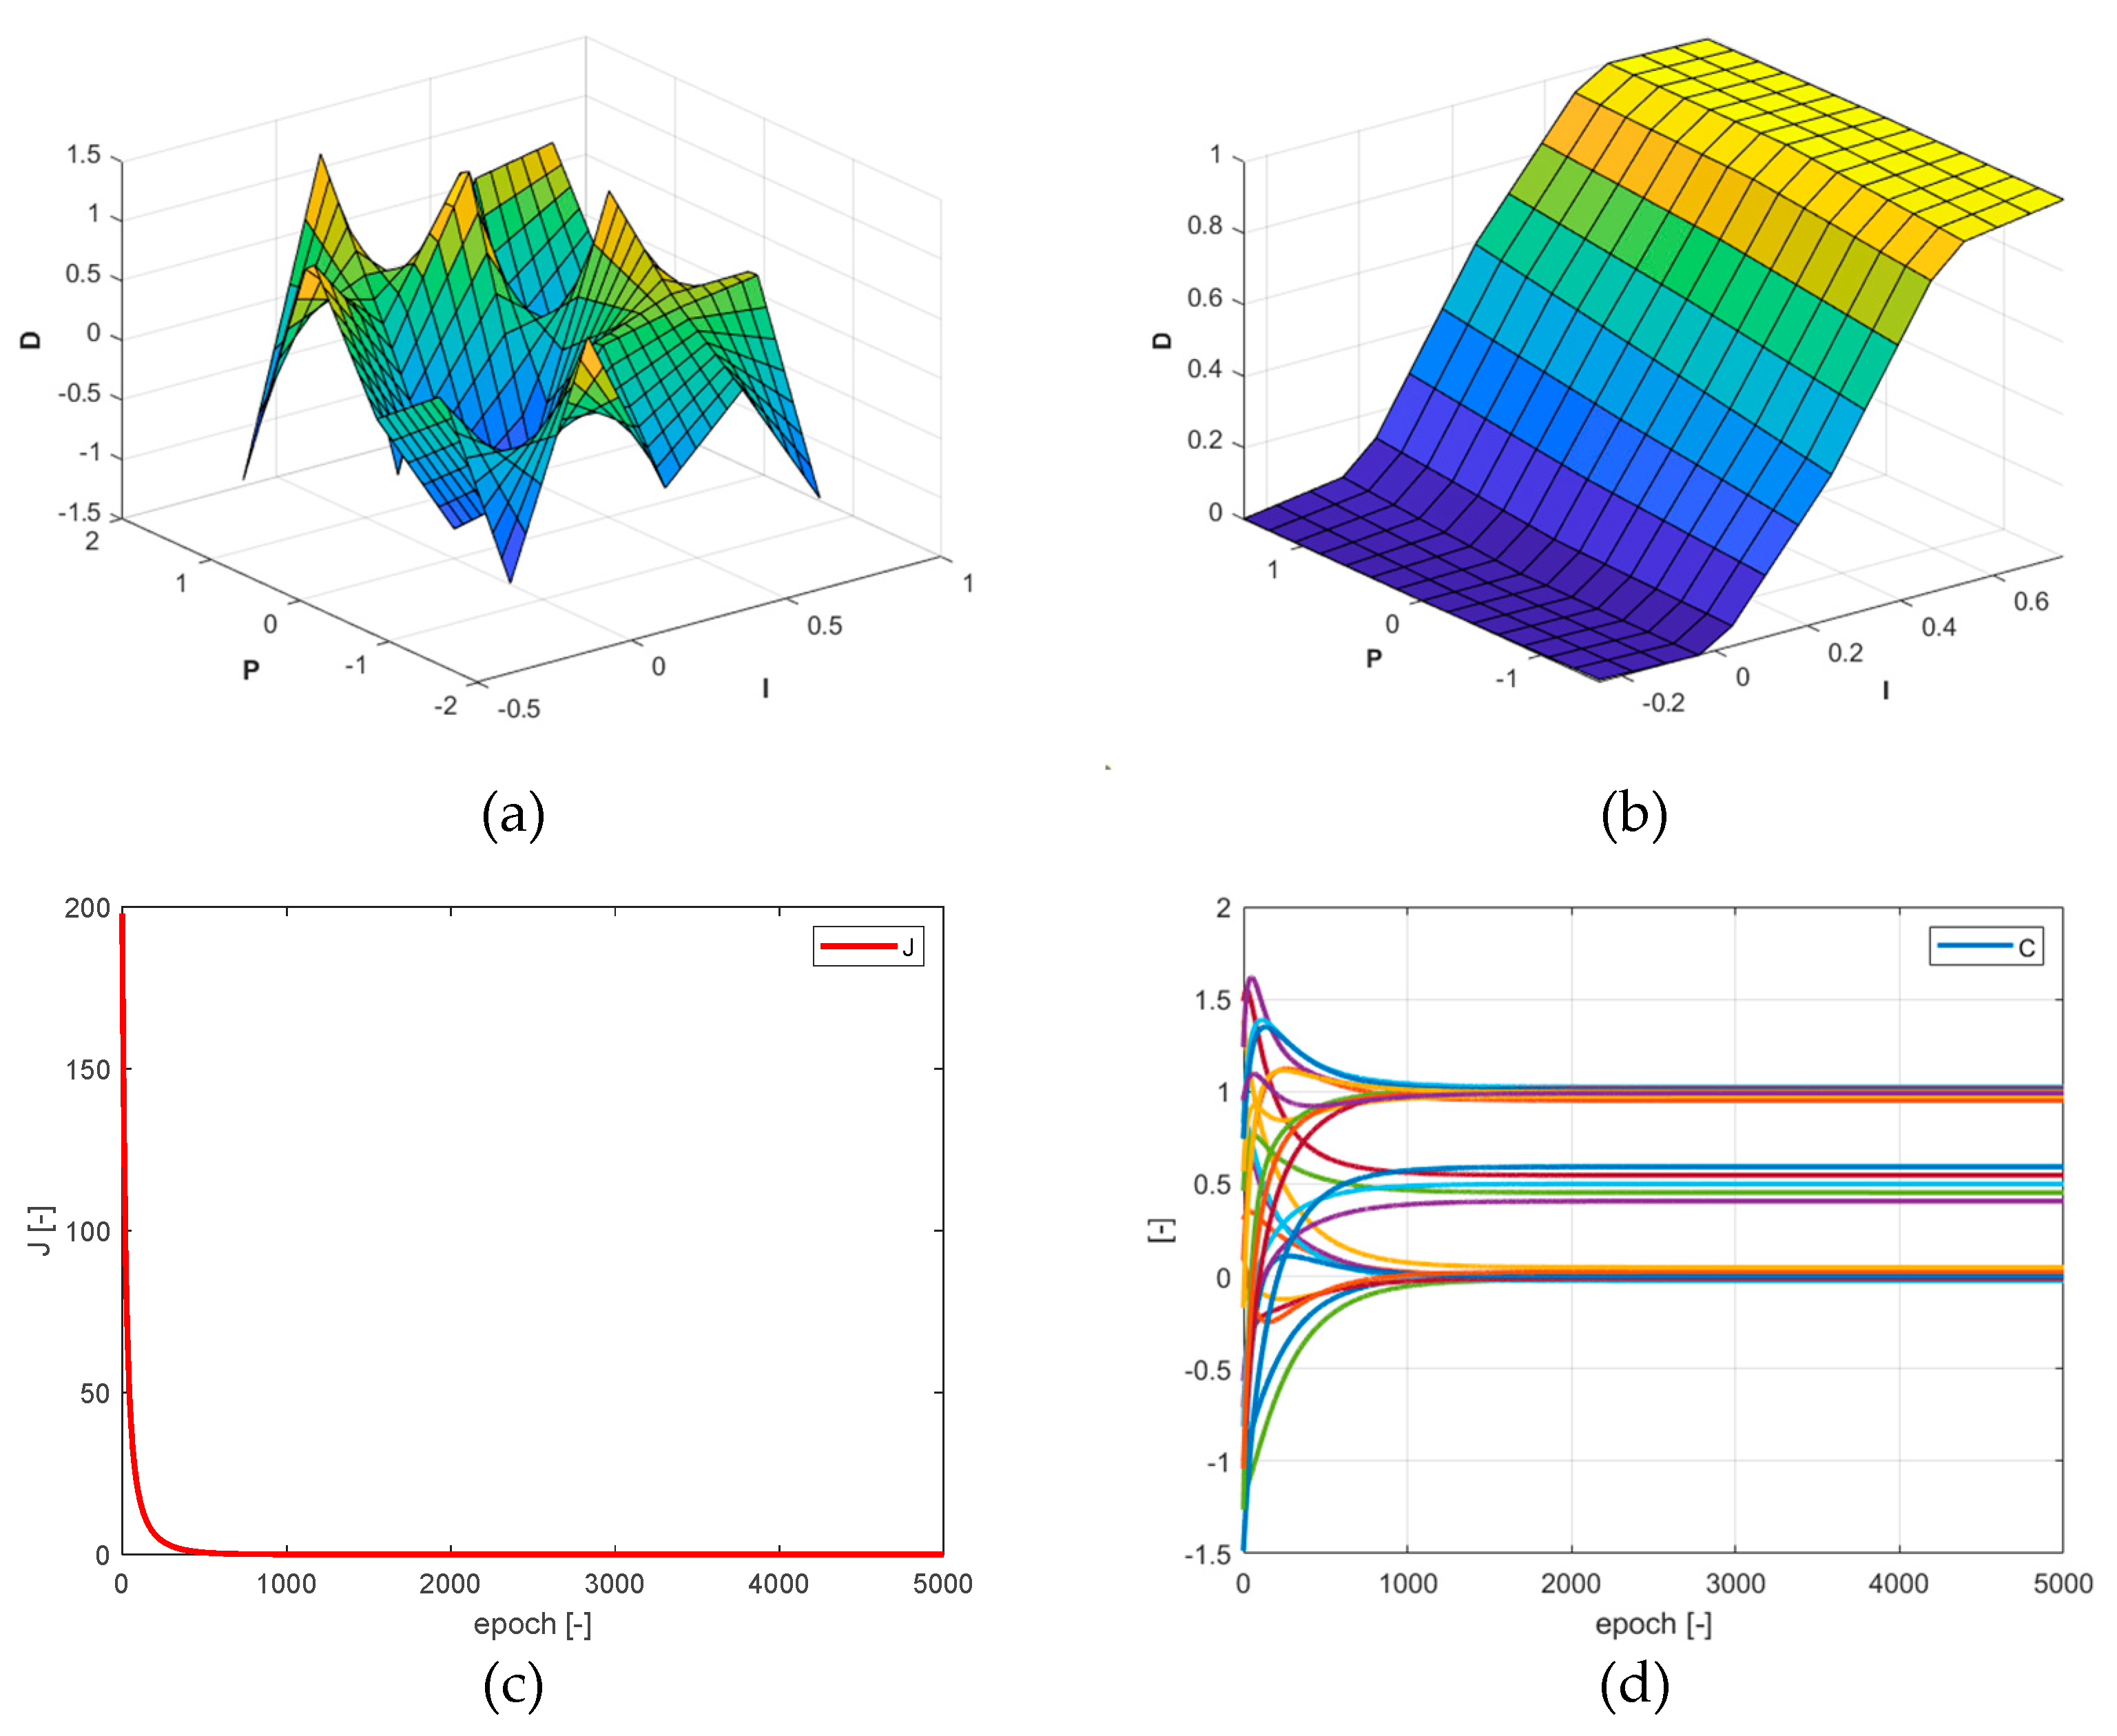
Figure 15.
a) Universe of discourse for the integral effect and its membership functions. b) Universe of discourse for the proportional effect and its membership functions. c) Sugeno-type inference system structure for the implementation of fuzzy PI control.
Figure 15.
a) Universe of discourse for the integral effect and its membership functions. b) Universe of discourse for the proportional effect and its membership functions. c) Sugeno-type inference system structure for the implementation of fuzzy PI control.
| Numeration and order | Membership functions for the integral effect | Membership functions for the proportional effect | ||||
|---|---|---|---|---|---|---|
| 1 | -0.5 | -0.25 | 0 | -2.25 | -1.5 | -0.75 |
| 2 | -0.25 | 0 | 0.25 | -1.5 | -0.75 | 0 |
| 3 | 0 | 0.25 | 0.5 | -0.75 | 0 | 0.75 |
| 4 | 0.25 | 0.5 | 0.75 | 0 | 0.75 | 1.5 |
| 5 | 0.5 | 0.75 | 1 | 0.75 | 1.5 | 2.25 |
Figure 16.
Red path: deviation of the fuzzy control system, Blue path: deviation trend.
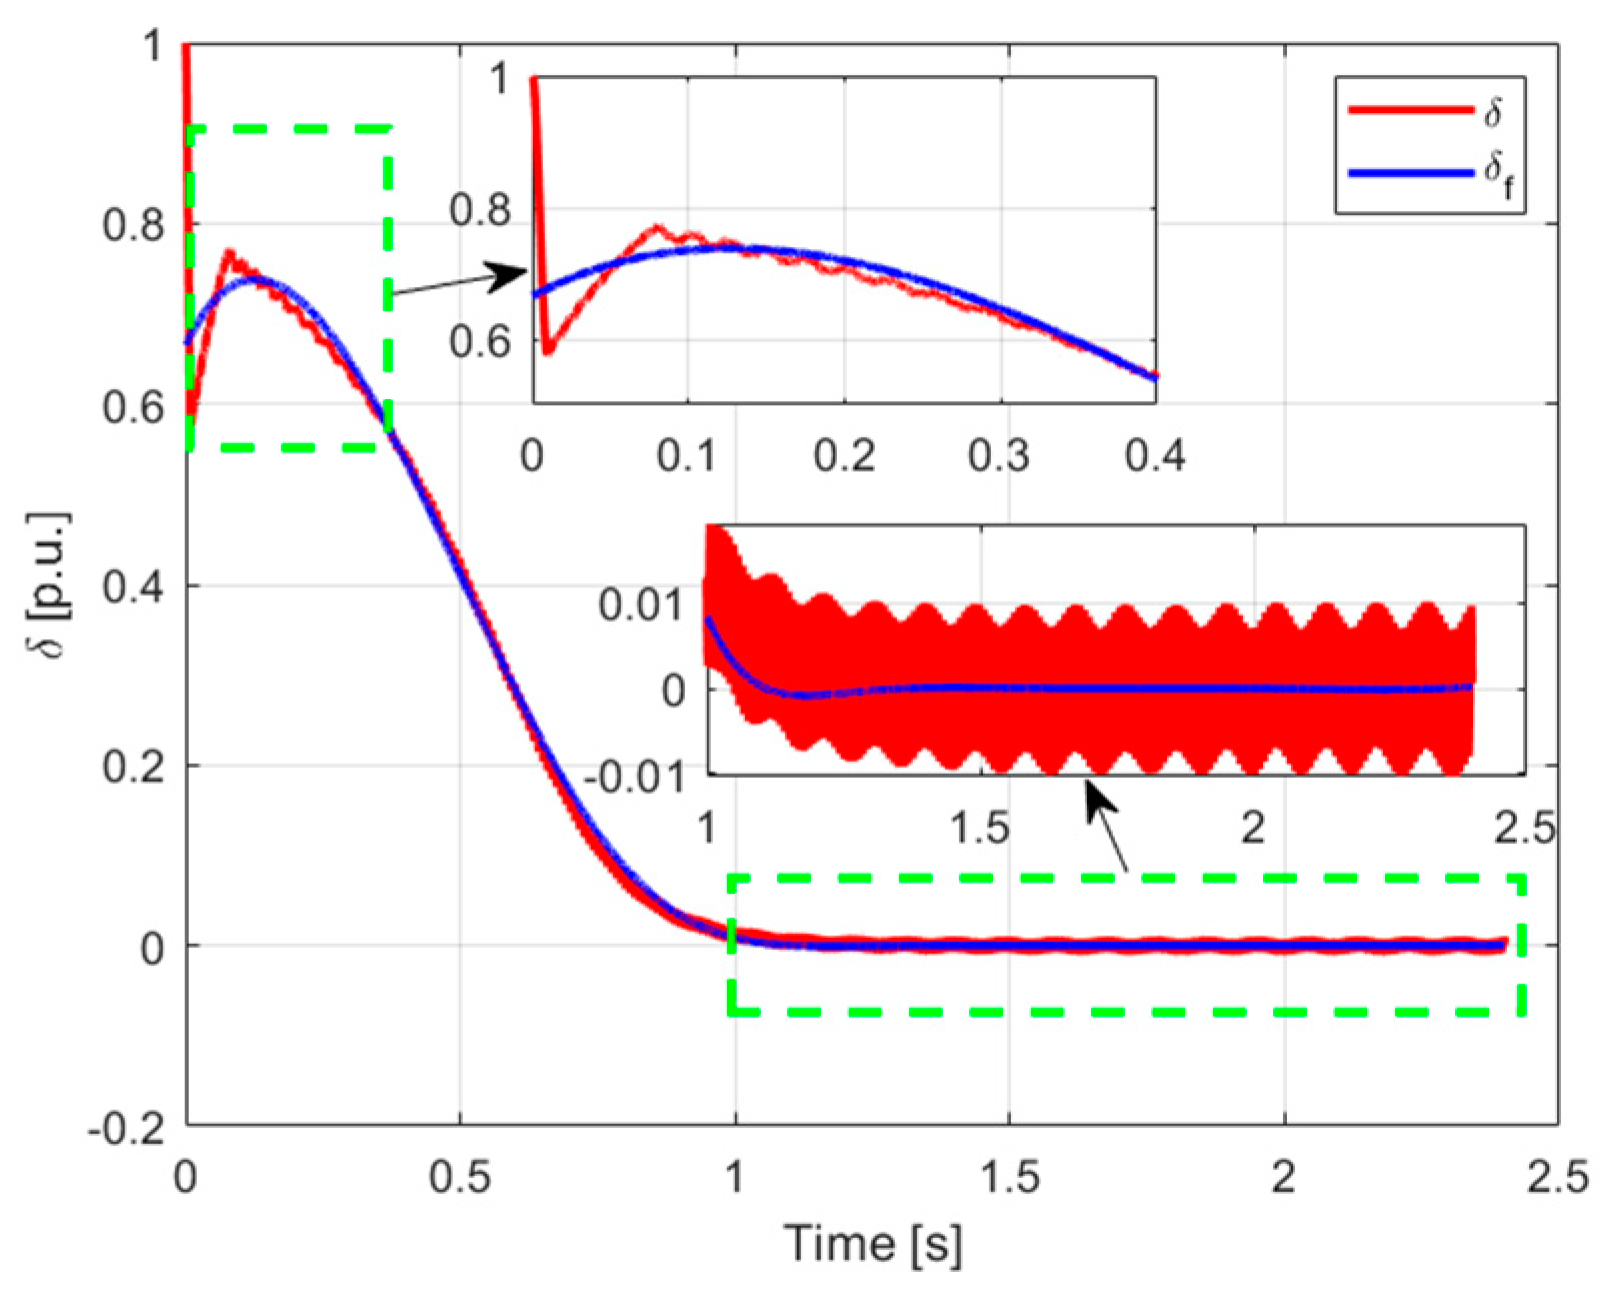
Figure 17.
a) Limit cycle of the fuzzy control deviation trend, b) beginning of the limit cycle of the fuzzy control deviation trend, with field lines indicating a clockwise direction for convergence to the stable point of zero deviation and zero deviation gradient change.
Figure 17.
a) Limit cycle of the fuzzy control deviation trend, b) beginning of the limit cycle of the fuzzy control deviation trend, with field lines indicating a clockwise direction for convergence to the stable point of zero deviation and zero deviation gradient change.
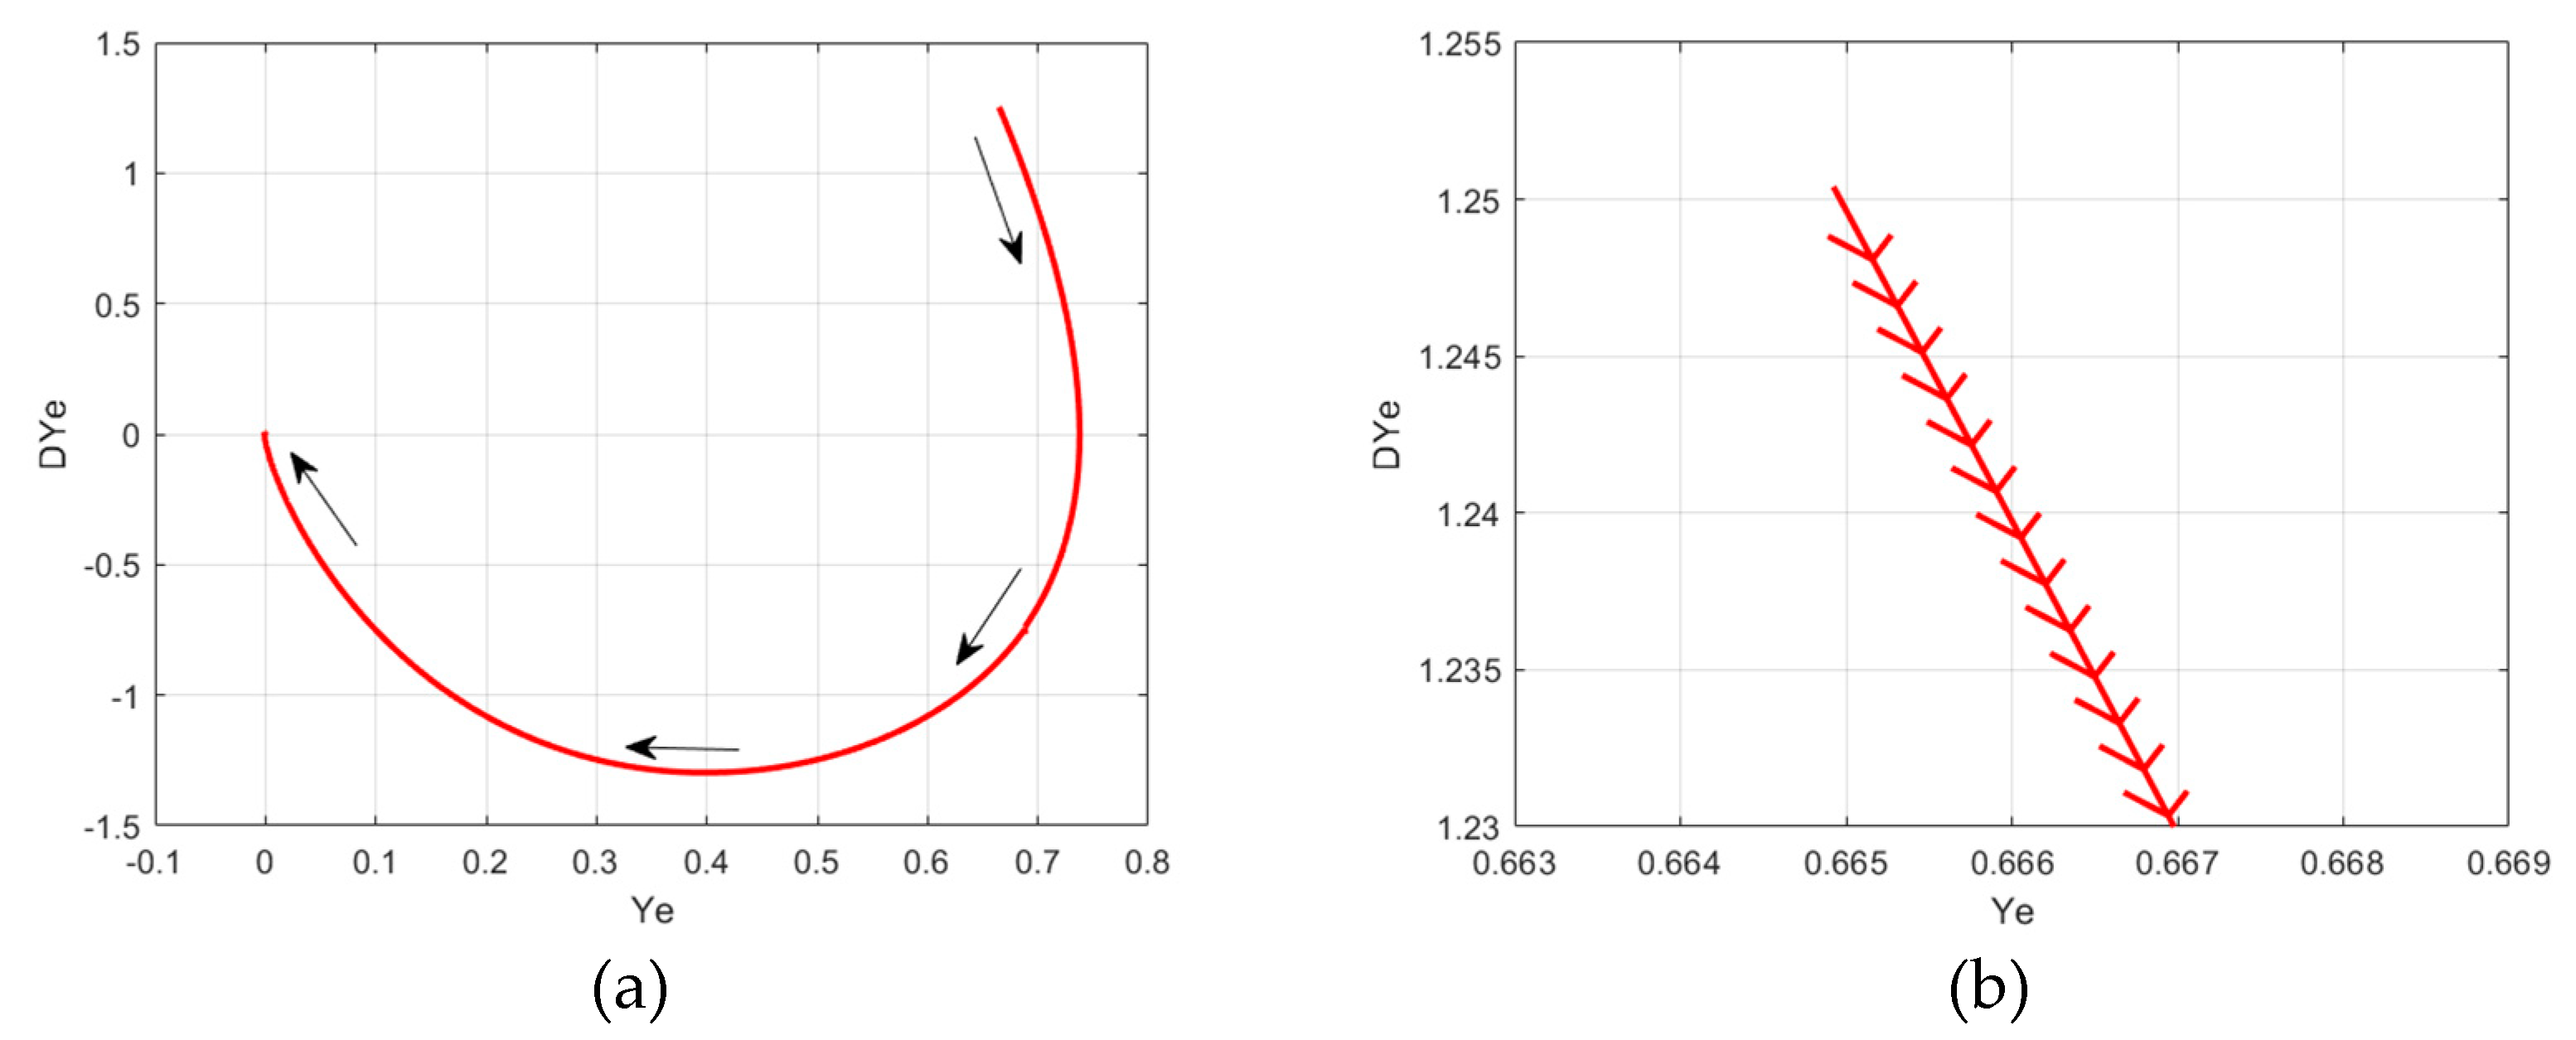
Figure 18.
Closed-loop behavior: a) Output voltage of the DC-DC source from to . b) Current measured in the inductor of the DC-DC source.
Figure 18.
Closed-loop behavior: a) Output voltage of the DC-DC source from to . b) Current measured in the inductor of the DC-DC source.
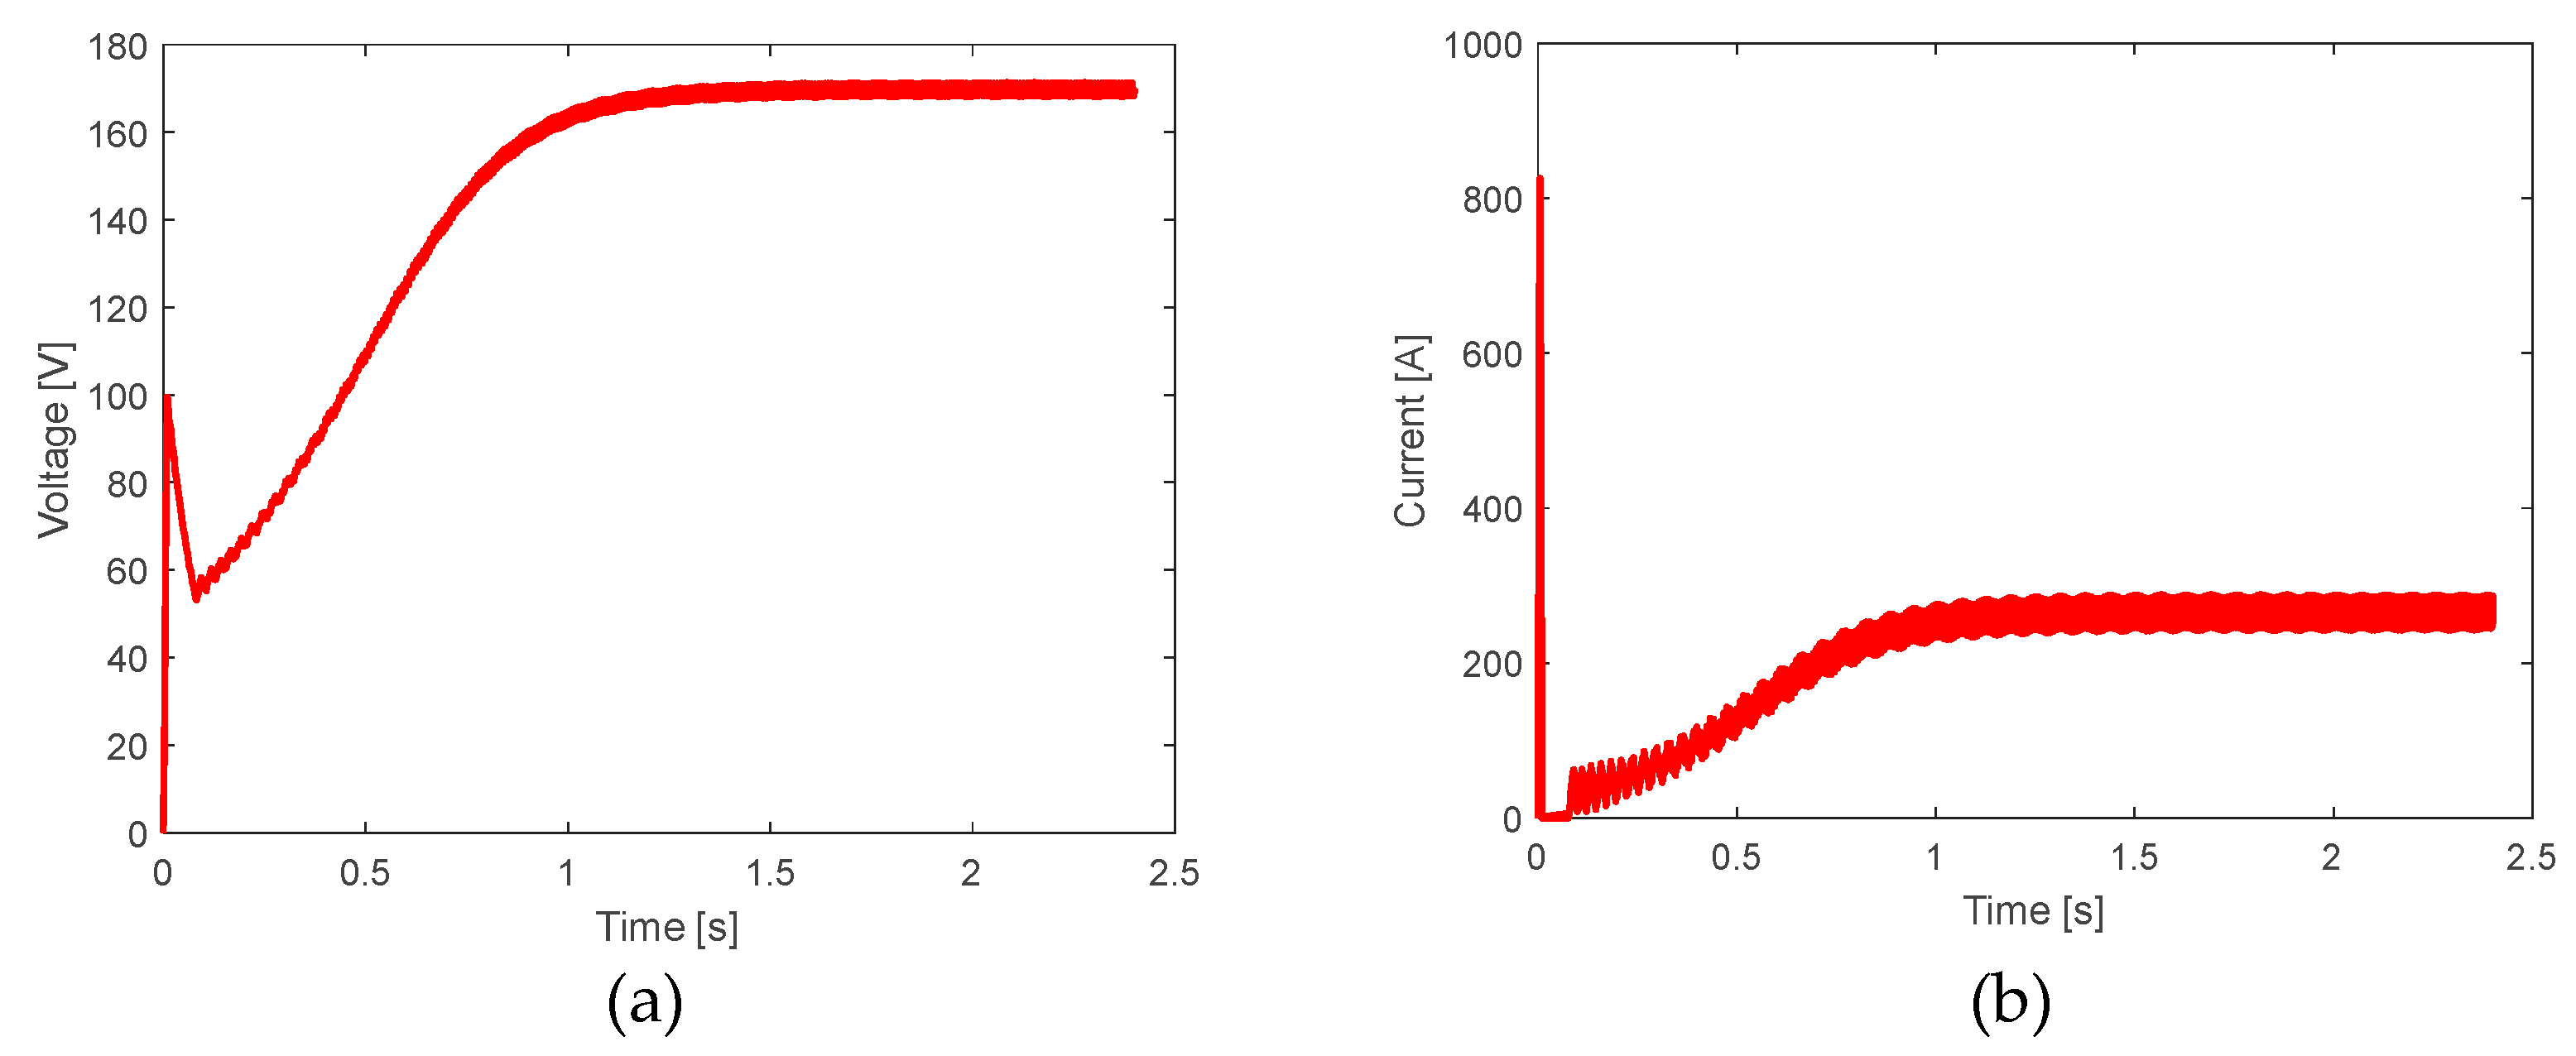
Figure 19.
Spectrums in normalized concerning the magnitude at frequency , of the closed-loop DC-DC converter from to of the: a) voltage at the output capacitor and b) current in the closed-loop inductor.
Figure 19.
Spectrums in normalized concerning the magnitude at frequency , of the closed-loop DC-DC converter from to of the: a) voltage at the output capacitor and b) current in the closed-loop inductor.
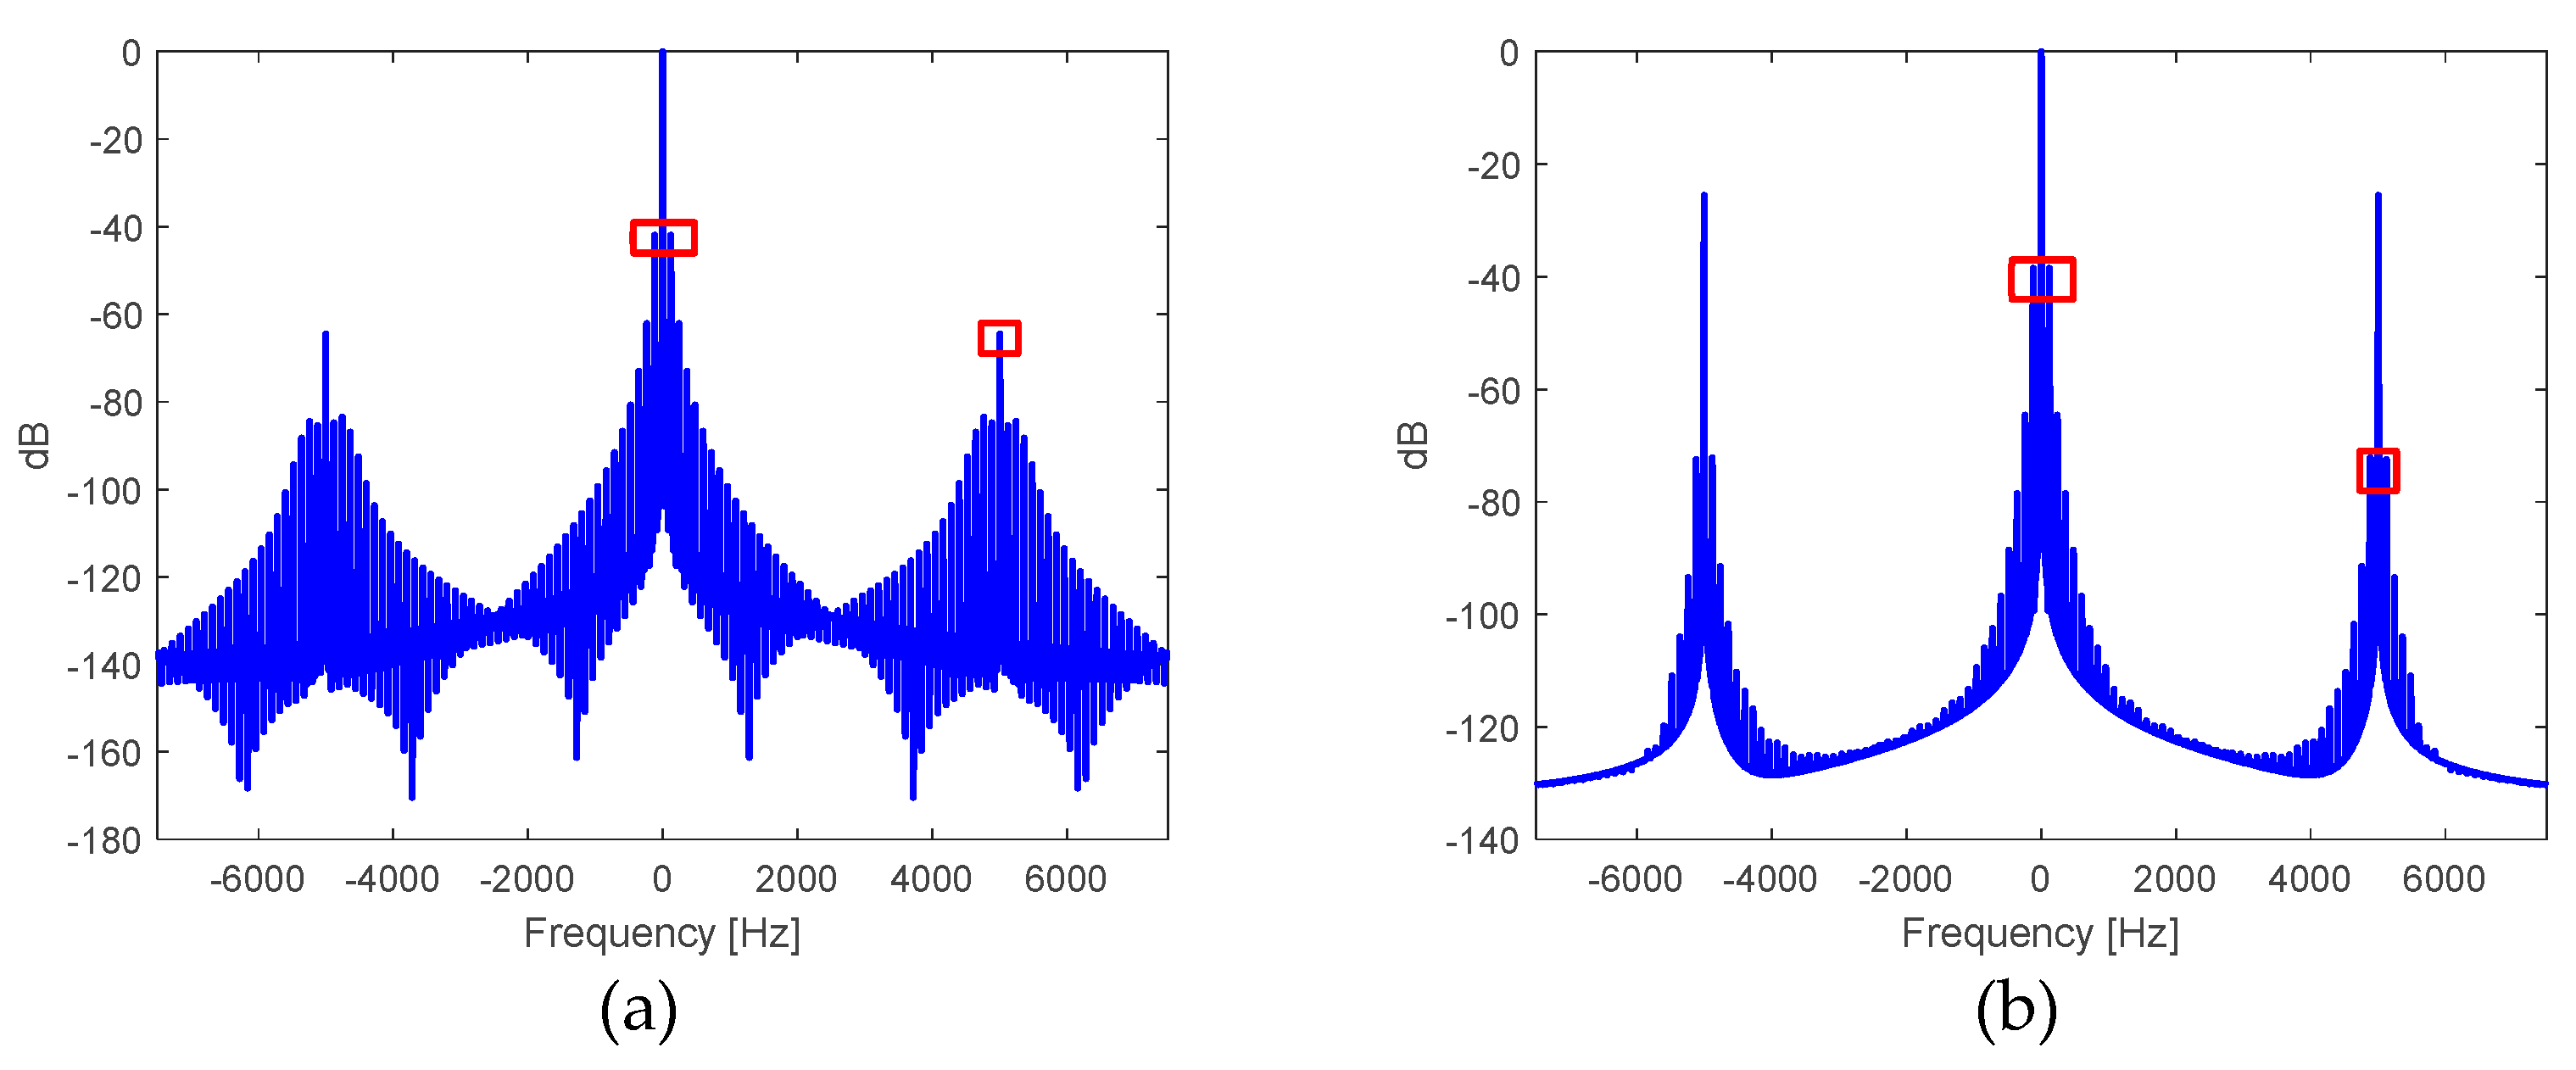
Figure 20.
Spectrum in , normalized with respect to the magnitude at the frequency, with the source in closed-loop control using the fuzzy PI controller and in the presence of load variation of the: a) output voltage in the DC-AC inverter stage, and b) voltage at the output of the filtering transformer.
Figure 20.
Spectrum in , normalized with respect to the magnitude at the frequency, with the source in closed-loop control using the fuzzy PI controller and in the presence of load variation of the: a) output voltage in the DC-AC inverter stage, and b) voltage at the output of the filtering transformer.
| Parameter | Mean value | ||
|---|---|---|---|
| % Rizo | % Rizo | ||
| Output Voltage | V | ||
| Inductor Current | A |
Figure 21.
a) Load variation in b) Deviation of the fuzzy PI control system in per unit (p.u.). c) Output of the fuzzy PI controller. In all cases, data 1 represents the signal at each instant, and data 2 represents the filtered signal or its trend.
Figure 21.
a) Load variation in b) Deviation of the fuzzy PI control system in per unit (p.u.). c) Output of the fuzzy PI controller. In all cases, data 1 represents the signal at each instant, and data 2 represents the filtered signal or its trend.
| Parameter | THD | |
|---|---|---|
| Output Voltage Inverter | ||
| Output Voltage Transformer | 0.0632 | 119.82 |
| Parameter | Mean value | ||
|---|---|---|---|
| % Rizo | % Rizo | ||
| Output Voltage | V | ||
| Inductor Current | A |
Figure 22.
a) Output voltage of the DC-DC converter from to in response to load variation. b) Current measured in the inductor of the DC-DC converter in response to load variation. In all cases, data 1 represents the signal at each instant, and data 2 represents the filtered signal or its trend.
Figure 22.
a) Output voltage of the DC-DC converter from to in response to load variation. b) Current measured in the inductor of the DC-DC converter in response to load variation. In all cases, data 1 represents the signal at each instant, and data 2 represents the filtered signal or its trend.
| Parameter | THD | |
|---|---|---|
| Output Voltage Inverter | ||
| Output Voltage Transformer | 0.0632 | 119.82 |
| Parameter | Mean value | ||
|---|---|---|---|
| % Rizo | % Rizo | ||
| Output Voltage | V | ||
| Inductor Current | A |
Figure 23.
Spectrum in , normalized with respect to the magnitude at frequency , of the DC-DC converter from to in response to load variation for: a) output voltage and b) inductor current.
Figure 23.
Spectrum in , normalized with respect to the magnitude at frequency , of the DC-DC converter from to in response to load variation for: a) output voltage and b) inductor current.
| Parameter | THD | |
|---|---|---|
| Output Voltage Inverter | ||
| Output Voltage Transformer | 0.0632 | 119.82 |
| Parameter | Mean value | ||
|---|---|---|---|
| % Rizo | % Rizo | ||
| Output Voltage | V | ||
| Inductor Current | A |
Figure 24.
Spectrum in , normalized with respect to the magnitude at the frequency, of the voltage at the output of the filtering transformer in response to load variation.
Figure 24.
Spectrum in , normalized with respect to the magnitude at the frequency, of the voltage at the output of the filtering transformer in response to load variation.
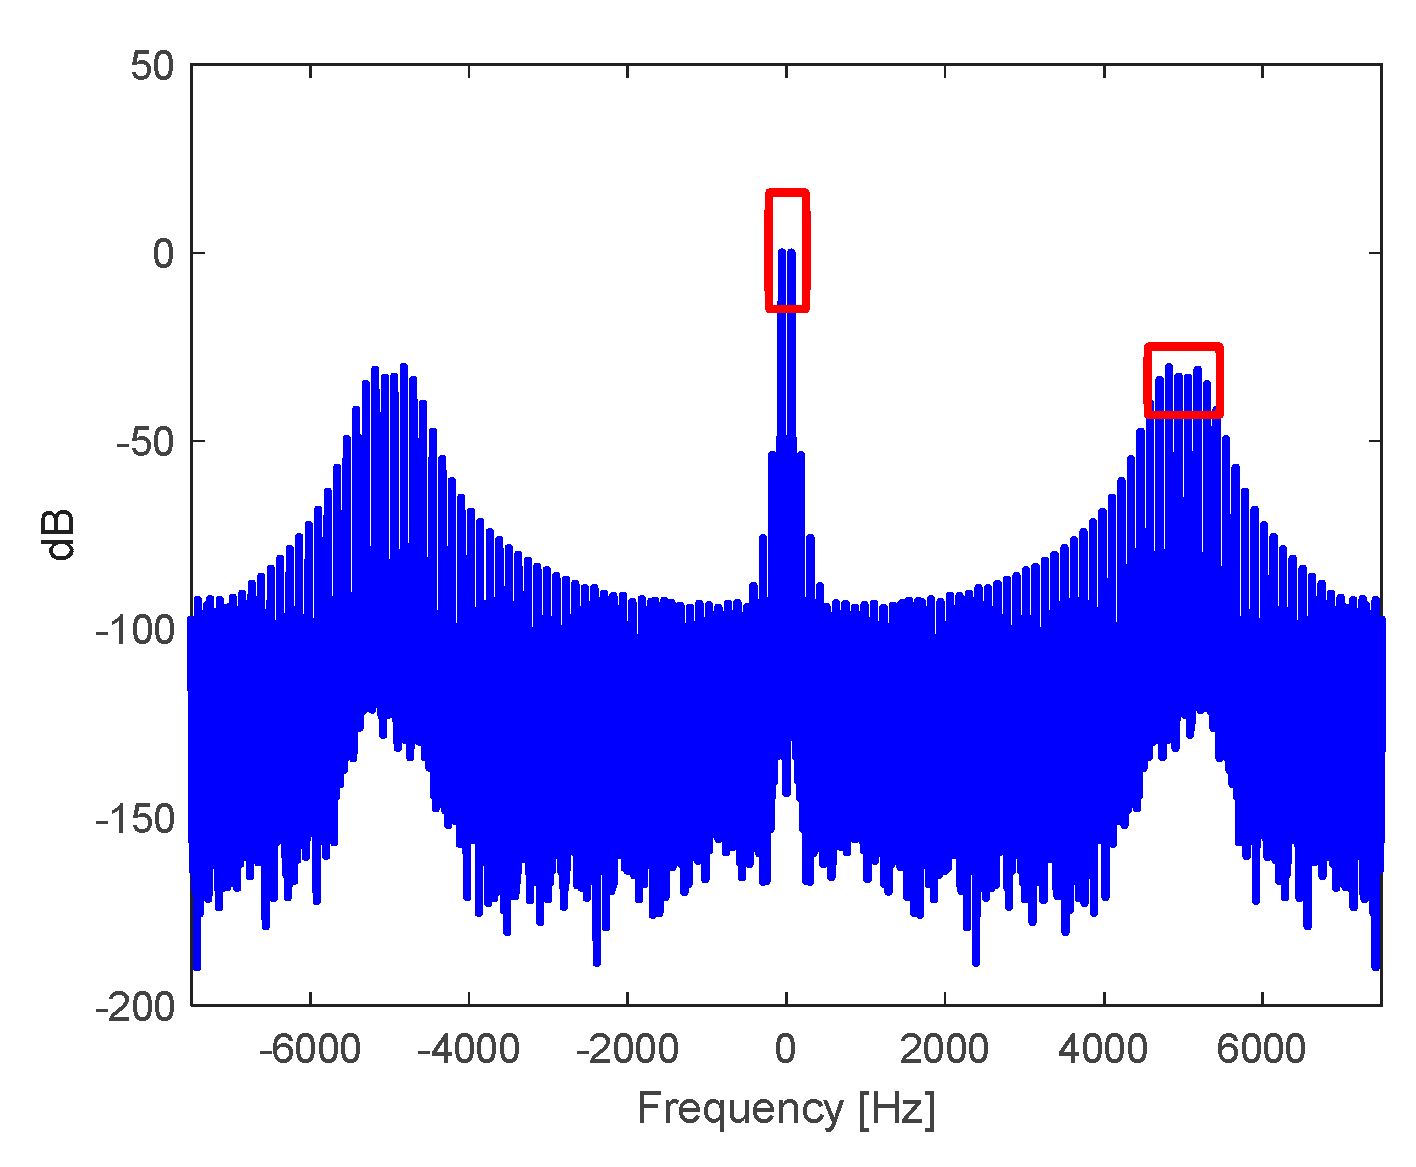
Figure 25.
a) Source voltage variation. b) Deviation of the fuzzy PI control system in per unit (p.u.). c) Output of the fuzzy PI controller. In all cases, data 1 represents the signal at each instant, and data 2 represents the filtered signal or its trend.
Figure 25.
a) Source voltage variation. b) Deviation of the fuzzy PI control system in per unit (p.u.). c) Output of the fuzzy PI controller. In all cases, data 1 represents the signal at each instant, and data 2 represents the filtered signal or its trend.
| THD | |
|---|---|
Figure 26.
a) Output voltage of the DC-DC converter from to in response to source voltage variation. b) Current measured in the inductor of the DC-DC converter in response to source voltage variation. In all cases, data 1 represents the signal at each instant, and data 2 represents the filtered signal or its trend.
Figure 26.
a) Output voltage of the DC-DC converter from to in response to source voltage variation. b) Current measured in the inductor of the DC-DC converter in response to source voltage variation. In all cases, data 1 represents the signal at each instant, and data 2 represents the filtered signal or its trend.
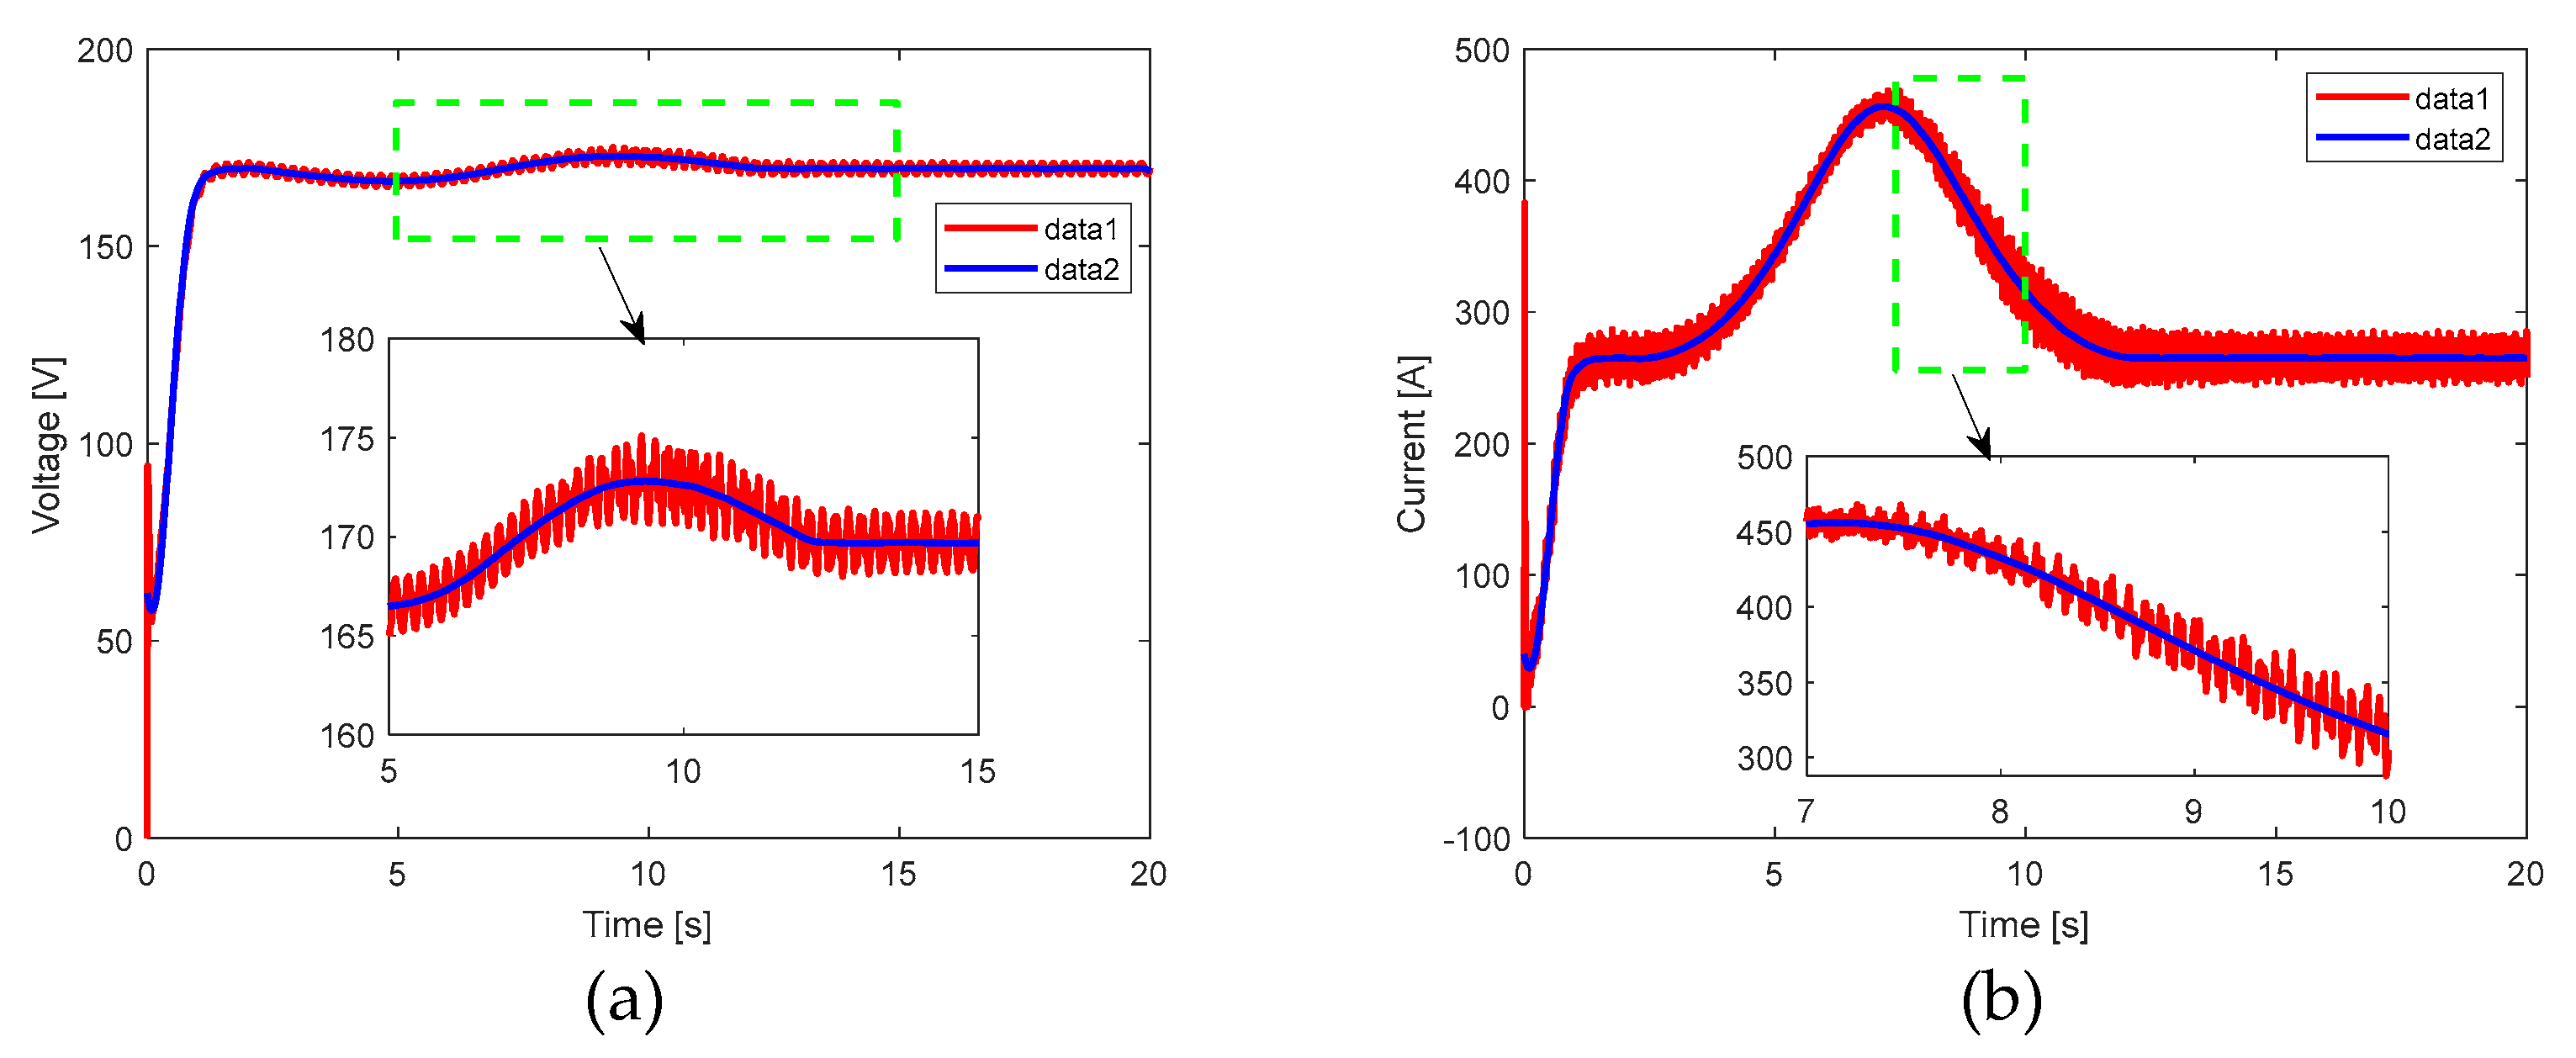
Figure 27.
a) Spectrum in , normalized concerning the magnitude at frequency , of the DC-DC converter from to in response to source voltage variation for the: a) output voltage and b) inductor current at boost stage.
Figure 27.
a) Spectrum in , normalized concerning the magnitude at frequency , of the DC-DC converter from to in response to source voltage variation for the: a) output voltage and b) inductor current at boost stage.
| THD | |
|---|---|
Figure 28.
Spectrum in , normalized concerning the magnitude at the frequency of the voltage at the DC-AC inverter stage, when the source in closed-loop using the fuzzy PI controller and in the presence of source voltage variation.
Figure 28.
Spectrum in , normalized concerning the magnitude at the frequency of the voltage at the DC-AC inverter stage, when the source in closed-loop using the fuzzy PI controller and in the presence of source voltage variation.
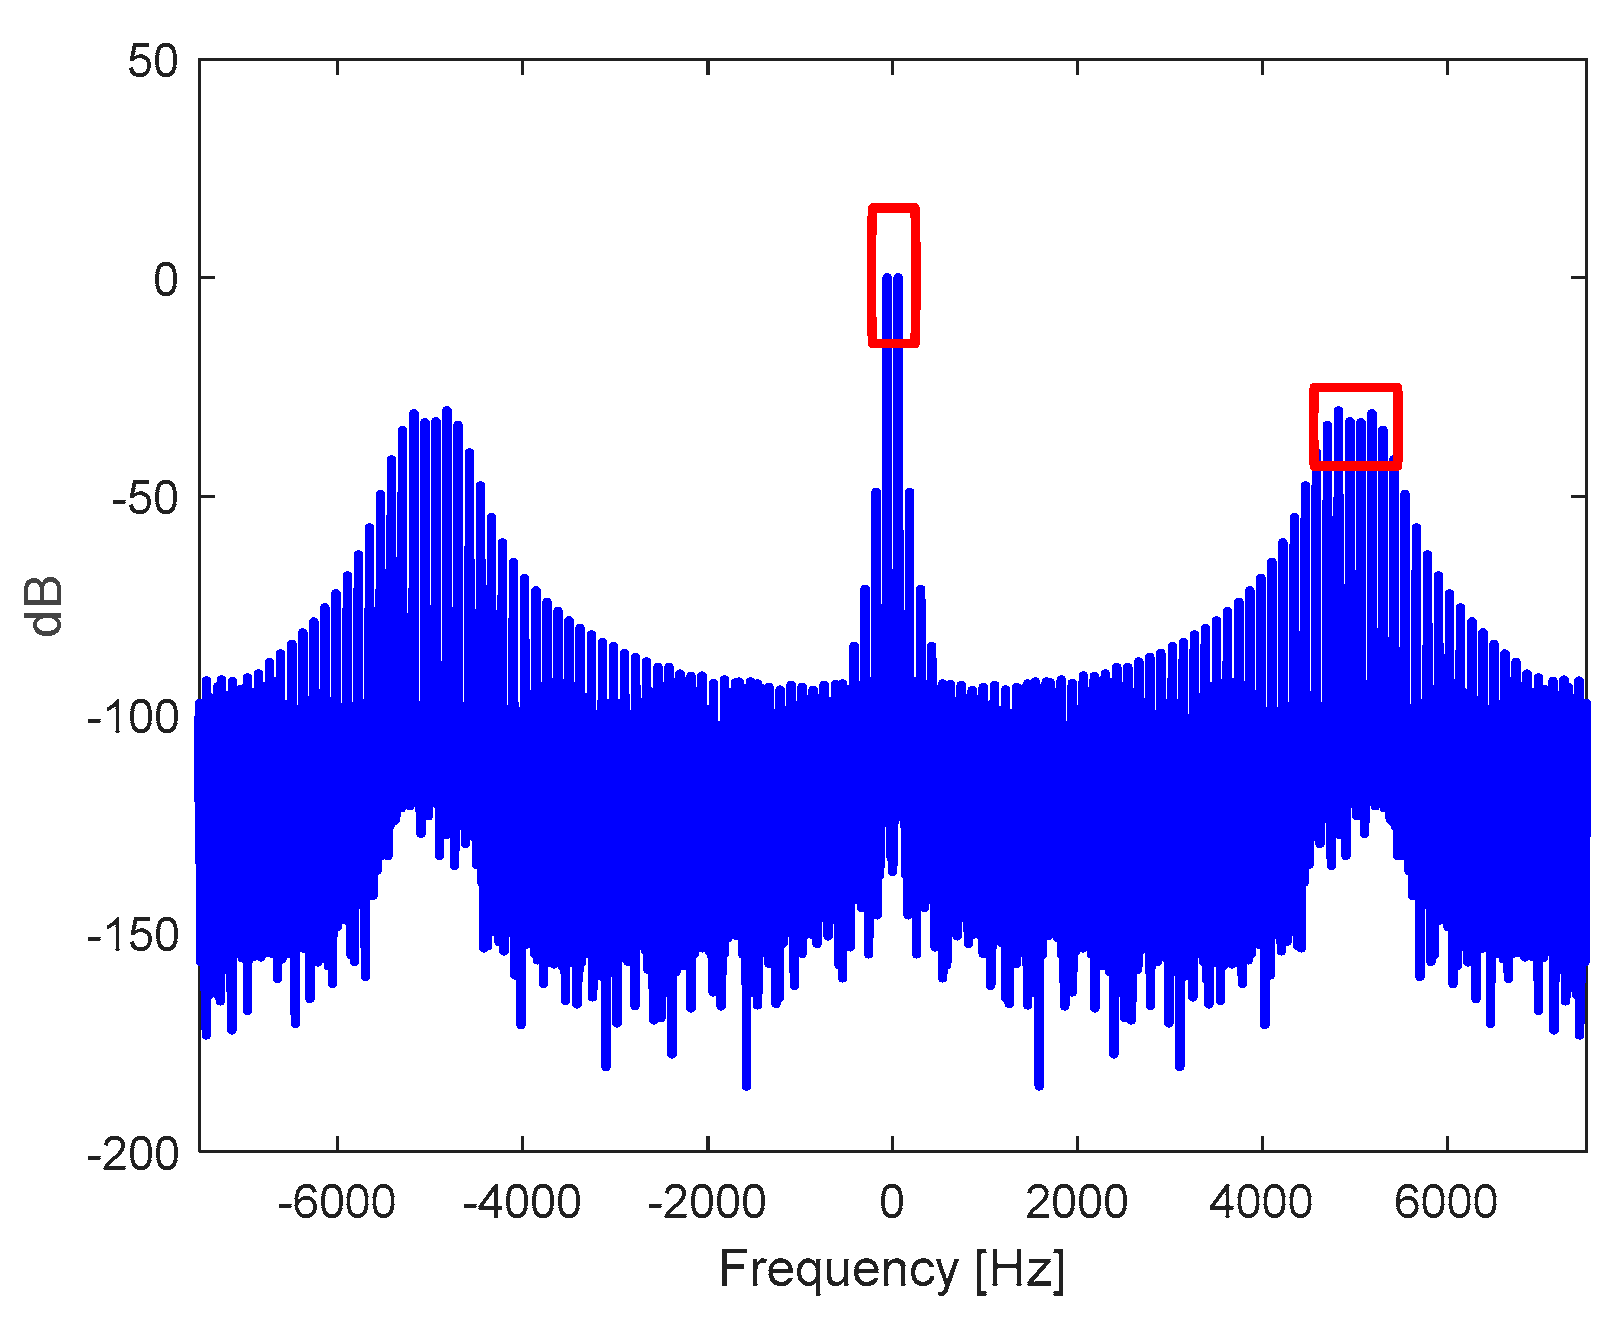
Table 1.
Percentage Ripple of Output Voltage and Inductor Current at Boost.
| Parameter | Mean Value | ||
|---|---|---|---|
| % Rizo | % Rizo | ||
| Output Voltage | V | ||
| Inductor Current | A |
Table 2.
THD and Vrms of the sinusoidal PWM signal.
| Parameter | THD | |
|---|---|---|
| Output Voltage Inverter | ||
| Output Voltage Transformer | 0.0322 | 118.57 |
Table 3.
Abcissae values of the Delta membership functions of the controller universes of discourse.
Table 3.
Abcissae values of the Delta membership functions of the controller universes of discourse.
| Numeration and order | Membership functions for the integral effect | Membership functions for the proportional effect | ||||
|---|---|---|---|---|---|---|
| 1 | -0.5 | -0.25 | 0 | -2.25 | -1.5 | -0.75 |
| 2 | -0.25 | 0 | 0.25 | -1.5 | -0.75 | 0 |
| 3 | 0 | 0.25 | 0.5 | -0.75 | 0 | 0.75 |
| 4 | 0.25 | 0.5 | 0.75 | 0 | 0.75 | 1.5 |
| 5 | 0.5 | 0.75 | 1 | 0.75 | 1.5 | 2.25 |
Table 4.
Structure of the Inference Rules for the Fuzzy PI Control System.
| Rule | Integral Membership Function | Fuzzy Logic Operation | Proportional Membership Function | Implication | Singleton | Rule weight | |
|---|---|---|---|---|---|---|---|
| Denomination | Value | ||||||
| 1 | "I==I1 | & | P==P1 | => | D=D1 | 0.008823 | (1)" |
| 2 | "I==I1 | & | P==P2 | => | D=D2 | 0.004411 | (1)" |
| 3 | "I==I1 | & | P==P3 | => | D=D3 | 0 | (1)" |
| 4 | "I==I1 | & | P==P4 | => | D=D4 | 0 | (1)" |
| 5 | "I==I1 | & | P==P5 | => | D=D5 | 0 | (1)" |
| 6 | "I==I2 | & | P==P1 | => | D=D6 | 0 | (1)" |
| 7 | "I==I2 | & | P==P2 | => | D=D7 | 0 | (1)" |
| 8 | "I==I2 | & | P==P3 | => | D=D8 | 0 | (1)" |
| 9 | "I==I2 | & | P==P4 | => | D=D9 | 0.024193 | (1)" |
| 10 | "I==I2 | & | P==P5 | => | D=D10 | 0.048387 | (1)" |
| 11 | "I==I3 | & | P==P1 | => | D=D11 | 0.4068 | (1)" |
| 12 | "I==I3 | & | P==P2 | => | D=D12 | 0.4534 | (1)" |
| 13 | "I==I3 | & | P==P3 | => | D=D13 | 0.499999 | (1)" |
| 14 | "I==I3 | & | P==P4 | => | D=D14 | 0.546599 | (1)" |
| 15 | "I==I3 | & | P==P5 | => | D=D15 | 0.593199 | (1)" |
| 16 | "I==I4 | & | P==P1 | => | D=D16 | 0.951612 | (1)" |
| 17 | "I==I4 | & | P==P2 | => | D=D17 | 0.975806 | (1)" |
| 18 | "I==I4 | & | P==P3 | => | D=D18 | 1 | (1)" |
| 19 | "I==I4 | & | P==P4 | => | D=D19 | 1 | (1)" |
| 20 | "I==I4 | & | P==P5 | => | D=D20 | 1 | (1)" |
| 21 | "I==I5 | & | P==P1 | => | D=D21 | 1 | (1)" |
| 22 | "I==I5 | & | P==P2 | => | D=D22 | 1 | (1)" |
| 23 | "I==I5 | & | P==P3 | => | D=D23 | 0.999999 | (1)" |
| 24 | "I==I5 | & | P==P4 | => | D=D24 | 0.995588 | (1)" |
| 25 | "I==I5 | & | P==P5 | => | D=D25 | 0.991176 | (1)" |
Table 5.
Percentage ripple of output voltage and inductor current at boost in closed-loop operation.
Table 5.
Percentage ripple of output voltage and inductor current at boost in closed-loop operation.
| Parameter | Mean value | ||
|---|---|---|---|
| % Rizo | % Rizo | ||
| Output Voltage | V | ||
| Inductor Current | A |
Table 6.
THD and Vrms of the sinusoidal PWM signal with the source in closed-loop control using the fuzzy PI controller.
Table 6.
THD and Vrms of the sinusoidal PWM signal with the source in closed-loop control using the fuzzy PI controller.
| Parameter | THD | |
|---|---|---|
| Output Voltage Inverter | ||
| Output Voltage Transformer | 0.0632 | 119.82 |
Table 7.
Percentage ripple of output voltage and inductor current at boost in closed-loop operation as response to load variations.
Table 7.
Percentage ripple of output voltage and inductor current at boost in closed-loop operation as response to load variations.
| Parameter | Mean value | |||
|---|---|---|---|---|
| % Rizo | % Rizo | % Rizo | ||
| Output Voltage | V | --- | ||
| Inductor Current | A |
Table 8.
THD and Vrms of the signal at the output of the transformer in response to load variation.
| THD | |
|---|---|
Table 9.
Percentage ripple of output voltage and inductor current at boost in closed-loop operation as response to voltage source variations.
Table 9.
Percentage ripple of output voltage and inductor current at boost in closed-loop operation as response to voltage source variations.
| Parameter | Mean value | |||
|---|---|---|---|---|
| % Rizo | % Rizo | % Rizo | ||
| Output Voltage | V | --- | ||
| Inductor Current | A |
Table 10.
THD and Vrms of the sinusoidal PWM signal with source in closed loop using fuzzy PI controller under source voltage variation.
Table 10.
THD and Vrms of the sinusoidal PWM signal with source in closed loop using fuzzy PI controller under source voltage variation.
| THD | |
|---|---|
Disclaimer/Publisher’s Note: The statements, opinions and data contained in all publications are solely those of the individual author(s) and contributor(s) and not of MDPI and/or the editor(s). MDPI and/or the editor(s) disclaim responsibility for any injury to people or property resulting from any ideas, methods, instructions or products referred to in the content. |
© 2023 by the authors. Licensee MDPI, Basel, Switzerland. This article is an open access article distributed under the terms and conditions of the Creative Commons Attribution (CC BY) license (http://creativecommons.org/licenses/by/4.0/).
Copyright: This open access article is published under a Creative Commons CC BY 4.0 license, which permit the free download, distribution, and reuse, provided that the author and preprint are cited in any reuse.


