
Submitted:
27 November 2023
Posted:
29 November 2023
You are already at the latest version
Abstract
Background: Data suggest that food allergies greatly impact a child’s health and growth due to inadequate nutrient intake. Our study aimed to establish the long-term outcome of children with food allergies compared to a control group. Methods: This study was a retrospective cohort study with longitudinal follow-up with a mean period of 4.85 years from the diagnosis to the last study visit. The patients’ nutritional intake was assessed using a three-day food diary and analysed by a dietitian. Patients (61 boys and 33 girls, mean age 6.9 years) had a single food allergy including 21 patients with cow’s milk, 34 with egg, and 39 with peanut allergies. The control group included 36 children (19 boys and 17 girls, mean age 8.03 years). Blood analysis was performed on all participants. Results: Data from our study showed that patients with cow’s milk, egg or peanut allergies had normal growth and achieved catch-up growth from the diagnosis until the last study visit. In the cow's milk allergy group, the allergy was shown to affect calcium intake (p<0.05), while egg and peanut allergies did not impact the dietary intake of nutrients. None of the investigated food allergies affected blood results (p<0.05). Conclusions: In the present study, we showed that single food allergies do not compromise growth in children if they are provided with appropriate support and that the affected children reach catch-up growth from the diagnosis.
Keywords:
food allergy
; children
; adequate nutrition
; catch-up growth.
1. Introduction
Food allergies have been shown to affect the lives of children with them adversely [1,2,3,4,5,6]. The basic management of food allergy is still based on food avoidance [7,8]. Therefore, the role of a dietitian in managing food-related deficits is very important [6,8,9,10,11]. Most evidence comes from studies of children allergic to cow’s milk. The evidence shows lower dietary calcium intake, slower growth, and reduced bone mineral density in children with cow’s milk allergy [8,9,10]. Similar findings have been reported in children with egg allergy [12]. The influence on growth and nutrient deficiencies is more pronounced in children with multiple food allergies [13,14]. Atopic dermatitis may also affect growth in combination with food allergy or alone [2,14]. Food allergy can also be a common cause of severe, life-threatening reactions in paediatric patients. It can last a lifetime, placing a significant burden on their quality of life and causing other allergic diseases to develop [5].
Nutritional counselling, as a part of food allergy management, has an important role in ameliorating the effects of food allergy on growth and nutrient intake [9,15]. Compared with healthy children, children with cow’s milk, egg, and peanut allergy may have impaired growth. Catch-up growth (catch-up weight and height) is one of the desired outcomes of food allergy management so that their growth can be similar to that of healthy peers from infancy onwards [16].
The influence of egg and peanut allergies on nutritional status is much less studied in the current literature [2]. To our knowledge, peanut allergy alone has not been studied regarding food intake, probably because peanut is not considered an essential food in the European diet.
The present study aimed to determine the long-term effects of allergy to cow’s milk, egg, or peanut on the nutritional status of children compared to their peers without food allergy (control group). We also examined the influence of a single food allergy on their growth and development.
2. Materials and Methods
2.1. Study design
A single-centre retrospective cohort study with longitudinal follow-up was conducted at the Department of Allergology, Rheumatology and Clinical Immunology of the University Children’s Hospital of the University Medical Center Ljubljana, Slovenia, from May 2019 to June 2022. The study included three intervention groups (cow’s milk, egg, and peanut allergy) and one control group (healthy children without food allergy but with suspected drug or insect venom allergy). Consecutive patients with a single IgE-mediated food allergy, confirmed by skin prick testing and/or specific IgE in combination with an allergy-focused history were enrolled. They were divided into three groups: children allergic to cow’s milk only (1), children allergic to eggs only (2), and children allergic to peanuts only (3). Exclusion criteria were non-atopic chronic diseases and a vegetarian or vegan diet. Patients in the control group were enrolled during routine outpatient clinic visits or hospital admissions.
The study was conducted in accordance with the tenets of the Declaration of Helsinki and approved by the Ethics Committee of the Slovenian Ministry of Health. Written informed consent was obtained from all the subjects’ caregivers. According to the standard protocol of our department, upon confirmation of food allergy, all caregivers received written instructions (previously prepared by dietitians and clinicians) on the diet and were regularly followed and managed at the outpatient clinic by the established centre protocol, where diets were checked and relevant advice given.
Our food allergy management included regular medical follow-up by an allergy specialist (mostly 6-month visits). They were given food allergy education at the time of diagnosis, regular dietary counselling if needed, and additional education about the effects of food allergy. Children with confirmed cow-milk allergy were prescribed vitamin D and calcium if not accepting hydrolysed formula or being breastfed. A dietitian was involved in more complex cases and new diagnoses to educate caregivers about dietary management.
We collected data on weight (kg) and height (cm) from the patient's electronic medical record or the patient's primary paediatrician or caregiver. For three months, the dietitian collected food diary data (energy intake, protein intake, calcium intake, iron intake, and percentage of daily energy intake from protein, fat, and carbohydrate). On the day of the appointment, caregivers brought a 3-day food diary, which the dietitian later analysed. The caregivers attended the dietitian’s appointment, where they were informed of the results of the food diary analysis and advised on how to improve the diet if necessary. We analysed and compared the diets of the intervention and control groups for the percentage of recommended energy intake, protein intake per kilogram of body weight, percentage of iron and calcium requirements met, and percentage of fat in the diet (percentage of total energy intake).
The mean follow-up time from the allergy diagnosis to the last study visit was 4.85 ± 2.79 years.
2.2. Blood sampling
Blood samples were collected from all enrolled patients at regular outpatient clinic appointments. The blood tests included complete blood count (CBC), iron status (serum iron, transferrin, ferritin, TIBC level), and serum protein level. All blood samples were analysed in the central biochemistry laboratory at the University Medical Center Ljubljana, Slovenia).
2.3. Statistical analysis
Data were analysed with the R programming language with tidyverse, arsenal, and ggstatsplot packages (R Foundation) [16,17,18,19,20]. Differences between groups (peanut and egg allergy vs control group) were determined with a t-test (numerical data), and a chi-squared test (nominal data) was used to assess differences in frequencies between groups (complete blood count, iron status, serum proteins, anthropological measurements, and food intake analysis). A Mann-Whitney U test (numerical data) and Fisher’s exact test (nominal data) were used to compare cow’s milk allergy and the control group.
Statistical analysis of the retrospective growth data was performed using a t-test for the peanut allergy group and a signed-rank test for the cow’s milk and egg allergy group.
The growth parameters of the children with cow’s milk, egg, or peanut allergy were compared with those of the control group. P < 0.05 was considered statistically significant. P-values were adjusted using the Benjamini-Hochberg and Yekuielti methods. Measures of central tendency were presented as medians and means (SD).
The World Health Organization (WHO) standards for nutritional status were used for data analysis. They define normal growth as weight for age (WA), weight for height (WH), and height for age (HA) of 0 to -2 Z-scores, moderate malnutrition as 2 to 3 Z-scores, and severe malnutrition as < 3 Z-scores. In contrast, overweight was defined as weight for age, body mass index (BMI) for age > +2 Z-scores, and obesity as > +3 Z-scores. A low weight for height indicates wasting (< 2 Z-scores), a low height for age (< 2 Z-scores) indicates stunting, and weight for age (< 2 Z-scores) indicates an underweight child [22,23].
3. Results
In total, 130 children were recruited for the study. Ninety-four children (62 boys and 33 girls) were enrolled with food allergies including 21 patients with cow’s milk allergy, 34 with egg allergy and 39 with peanut allergy, respectively. The mean age ranged from 2 to 12 years (mean age 6.9 +/- 3.2 years). In the control group, 36 children were recruited. It included 19 boys and 17 girls; the mean age ranged from 2 to 12 years (mean age of 8.03+/-2.79 years). (Table 1).
3.1. Growth and nutritional status in children with cow’s milk allergy
Children with cow’s milk allergy were meeting their calcium needs with food significantly less than the control group (44.8 % vs. 63.8 %, p=0.027) (Table 2). Supplementation was not included. Almost all had calcium and Vitamin D supplementation at enrolment in the study (90% calcium and 100% Vitamin D).
Mean carbohydrate intake (as a percentage of energy intake) in the cow’s milk allergy group was also significantly higher than in the control group (57.7% ± 5.8 vs. 53.6% ± 5.8, p=0.048). In the cow's milk allergy group, this is probably due to a lower fat and/or protein intake (Table 2).
3.2. Growth and nutritional status in children with egg allergy
No statistically significant differences in energy intake, percentage of calcium intake, percentage of iron intake, and protein intake in grams per kilogram of body weight were found in the egg allergy group compared to the control group (p>0.05).
In the same group, the catch-up growth from diagnosis until enrolment in the study was found to be statistically significant (Figure 2), and improvements were observed in the median Z values for body height for age from -0,288+/-1,073 to 0,084+/-0,893 (p=0,017). Statistical analysis of Z values for body mass index and weight for age showed no significant difference from the time of diagnosis of food allergy to enrolment in the study (p>0.05). Egg allergy did not affect the long-term growth of the children.
3.3. Growth and nutritional status in children with peanut allergy
In the peanut allergy group, no statistically significant differences were observed between the intervention and control groups for energy intake, percentage of calcium intake, percentage of iron intake, and protein intake in grams per kilogram of body weight (p>0.05).
In the same group, the catch-up growth from diagnosis until enrolment in the study was statistically significant, and improvements were observed in the median Z values of body weight for age from 0.183+/-1.014 Z to 0.415+/-1.232 Z (p=0.044). (Figure 3) Statistical analysis of body mass index Z value and height for age Z value showed no significant difference from the time of food allergy diagnosis to enrolment in the study (p>0.05). Peanut allergy did not affect the long-term growth of the children.
3.4. Laboratory results
Blood samples were obtained from all 130 participants. Statistical analysis of the laboratory test results did not reveal any statistically significant differences between patients with cow’s milk allergy and the control group (p>0.05).
In patients with egg allergy, we found a statistically significant difference in leukocyte count (8.17±2.1) and mean corpuscular volume (MCV 78.5±3.85, p<0.05) compared to the control group (leukocytes 6.89±1.72, p 0.019; MCV 80.7±3.75, p 0.047). None of these findings were clinically relevant. No significant evidence of increased anaemia compared to the control group was found.
In patients with peanut allergy, we found statistically significant differences in haemoglobin concentration (128.18±7.49) and mean cell haemoglobin concentration (MCHC 349.95±3.85) for the peanut allergy group versus the control group (haemoglobin 123.97±6.722, p 0.025; MCHC 344.76±5.94, p 0.012). None of these findings were clinically relevant.
4. Discussion
To our knowledge, this study was the first retrospective, controlled study with longitudinal follow-up to determine the impact of peanut allergy on the nutritional status of children; it was also the first to evaluate the impact of allergy to cow’s milk, egg, and peanut on nutritional status in children from Southern and Eastern Europe. Peanut allergy has not yet been studied, mainly because peanuts are not considered essential food. Our study provides important insights into the nutritional status of children with food allergies and the impact of early dietary interventions.
Food allergy represents a significant burden for affected children and their caregivers, which can continue into adulthood.24 In all of the food allergy groups we studied, weight for age improved from the time of diagnosis to the time of enrolment in the study. This is the opposite of what has been found in the literature, where dietary concerns were quite common [25,26].
For atopic dermatitis, previous studies have shown a negative influence on growth and nutrient intake [1,14] It is a self-limited disease that very rarely affects children with good management of food allergy or lasts for a very long time. The present study found no negative impact of atopic dermatitis on growth. We think that the likely cause for these positive outcomes is the high level of nutritional awareness, thorough education provided to our caregivers, and strict management of food allergies. Regular education of patients and their caregivers by our hospital teams (physicians, nurses, dietitians) and the availability of many free food allergy education resources are also important. Increased awareness of the impact of allergies on growth is crucial. Currently, a wide range of food products are available for individuals with food allergies. Additionally, the role of a dietitian in this area is essential [9,15], which is why our practice offers regular dietary consultations.
Previous studies suggest there is still a concern regarding calcium intake for individuals with cow's milk allergy [1,8]. There was a statistically significant lower calcium intake compared to the control group. In our clinical practice, we aim to address calcium deficiency through various means, such as supporting breastfeeding, increasing the intake of appropriate formulas or vegetable drinks fortified with calcium, and calcium supplementation as another resort. The majority of patients rely on calcium supplementation. Insufficient data prevented us from demonstrating the effect of reduced calcium intake on bone density as in previous studies [27]. We collected data on bone mineral density from only 9 out of 21 patients with cow's milk allergy, and all showed normal bone mass density. Conducting statistical analysis was not feasible.
The average consumption of carbohydrates (as a percentage of energy intake) was significantly greater in the cow’s milk allergy group compared to the control group. This is likely due to a reduced fat and/or protein intake in the cow’s milk allergy group. It is the first discovery of its kind in the literature, implying that fat and fat-soluble vitamin consumption may be lower in this population. Contrary to previous research studies [1,4,13,26], our study demonstrated that children with cow’s milk allergy were able to achieve normal growth and development without any notable impact.
Normal growth may be attributed to higher awareness and improved education regarding cow’s milk allergy and its effects. We promote breastfeeding in our practice and provide education for our patients following allergy diagnosis, implementing appropriate measures as necessary. Additionally, a wide range of hypoallergenic formulas and vegetable drinks with added calcium are readily available.
There was no statistically significant difference in dietary energy and nutrient intake between the egg allergy group and the control group (p>0.05). Contrary to previous research, our study suggests that children with egg allergy can achieve normal growth and development if good education of caregivers is achieved [1,4,26,28]. The food and nutrient intake among children with egg allergy was comparable to that of the control group and no significant difference was observed (p>0.05). In contrast to previous studies, our findings indicate no increased occurrence of anaemia in children with egg allergy compared to the control group [11].
The peanut allergy group had no statistical difference in dietary energy and nutrient intake compared to the control group (p>0.05). To our knowledge, there has been no study on how peanut allergy affects growth and nutrient intake. Previous studies have mainly focused on the early introduction of peanuts and preventing future allergies [29,30]. Our study found no significant impact of the peanut allergy on growth. No statistically significant differences in the blood laboratory parameters were found in children with peanut allergy compared to the control group. Research on this topic is lacking, likely because peanuts are not considered an essential food.
A potential limitation of our study is that certain weight and height data at the time of diagnosis were reported by caregivers, which could potentially result in inaccuracies. Another limitation is the retrospective design employed, which may have introduced confounding variables. It was also not possible to rule out potential errors in dietary intake reporting by caregivers of children with food allergies or control participants. However, it is unlikely that this error would differ between children in the two groups. In addition, our study has the limitation of lacking follow-up data for children in the control group. Furthermore, we encountered the significant drawback of insufficient data regarding mineral bone density in children with cow's milk allergy, and statistical analysis was not feasible. The study and control groups differed in some aspects that could influence the results. Children in the cow’s milk allergy group were considerably younger than children in the control group. The likely reason is that cow’s milk allergy is usually diagnosed and resolved earlier in life.
5. Conclusions
In conclusion, our study showed that allergies to cow’s milk, eggs, or peanuts do not directly impact an individual's nutritional status. Children with food allergies were able to achieve growth similar to their peers with no food allergies. To achieve the best results, a clinical care for children with food allergies should include patient-tailored dietary counselling with written instructions for child’s caregivers and regular outpatient visits with an allergy specialist. The child’s caregivers should receive also comprehensive information about the possible negative effects of food allergies on growth and nutrient intake as well as information on appropriate food substitutes to avoid the deficits. In managing food allergies, these actions can provide optimal care and ensure normal growth and development of children with cow’s milk, egg, or peanut allergies.
Author Contributions
Conceptualization, T.A. and T.P.; methodology, T.A.; validation, T.A., T.P.; investigation, T.P., T.V.T., A.K.J., M.Z.A., G.M., N.E., T.A.; resources, T.A.; writing—original draft preparation, T.P.; writing—review and editing, T.A., T.V.T., A.K.J., G.M., N.E.; visualization, T.P.; supervision, T.A.; project administration, T.A.; funding acquisition, T.A. All authors have read and agreed to the published version of the manuscript.
Funding
Financial support: This work was partially supported by the Slovenian Research Agency grant J3-3072 and by the University Medical Center Ljubljana research grant 20200133.
Institutional Review Board Statement
The study was conducted in accordance with the Declaration of Helsinki, and approved by the Ethics Committee of the Slovenian Ministry of Health (protocol code 0120-633/2016, the 12th of December 2018). The study was registered at www.clinicaltrials.gov, protocol code NCT05937061.
Informed Consent Statement
Informed consent was obtained from all subjects involved in the study.
Data Availability Statement
The data that support the findings of this study are available from the corresponding author upon reasonable request.
Acknowledgments
The authors would like to thank all the patients, family members and staff of the Department of Allergology, Rheumatology and Clinical Immunology, University Children’s Hospital, University Medical Center Ljubljana for their participation and valued contributions.
Conflicts of Interest
The authors declare no conflict of interest.
References
- Beck C et, Koplin J, Dhamarge S et al. Persistent Food Allergy and Food Allergy Coexistent with Eczema Is Associated with Reduced Growth in the First 4 Years of Life. J Allergy Clin Immunol Pract. 2016 Mar-Apr; 4(2): 248-56. [CrossRef]
- Flammarion S, Santos C, Guimber D et al. Diet and nutritional status of children with food allergies. Pediatr Allergy Immunol 2011; 22: 161–165. [CrossRef]
- Meyer R, De Koker C, Dziubiak R et al. The impact of the elimination diet on growth and nutrient intake in children with food protein-induced gastrointestinal allergies. Clin Transl Allergy. 2016 Jul; 14:6:25. [CrossRef]
- Lynn C, Jean Hine R, Parkes JG. Food allergies in children affect nutrient intake and growth. J Am Diet Assoc. 2002 Nov;102(11): 1648-51. [CrossRef]
- Prescott SL, Pawankar R, Allen KJ, et al. A global survey of changing patterns of food allergy burden in children. World Allergy Organ J. 2013 Dec 4; 6(1):21. [CrossRef]
- Mehta H, Groetch, Wang J. Growth and Nutritional Concerns in Children with Food Allergy. Curr Opin Allergy Clin Immunol. 2013 June; 13(3): 275–279. [CrossRef]
- D’Auria E, Abrahams M, Zuccotti GV et al. Personalized Nutrition Approach in Food Allergy: Is It Prime Time Yet? Nutrients (2019), 11, 359. [CrossRef]
- Skypala I, McKenzie R. Nutritional Issues in Food Allergy. Clin Rev Allergy Immunol 2019 Oct; 57(2):166-178. [CrossRef]
- Venter C, Laitinen K, Vlieg-Boerstra B. Nutritional Aspects in Diagnosis and Management of Food Hypersensitivity - The Dietitians Role. J Allergy (Cairo). 2012;2012:269376. [CrossRef]
- Corica D, Aversa T, Caminiti L et al. Nutrition and Avoidance Diets in Children With Food Allergy. Front. Pediatr. 2020: 8. [CrossRef]
- Mazocchi A, Venter C, Maslin K et al. The Role of Nutritional Aspects in Food Allergy: Prevention and Management. Nutrients (2017) Aug 9;9(8):850. [CrossRef]
- Meyer R, De Koker C, Dziubak R et al. Malnutrition in children with food allergies in the UK. J Hum Nutr Diet. 2014 Jun; 27(3):227-35. [CrossRef]
- Sova C, Feuling MB, Baumler M, et al. A systematic review of nutrient intake and growth in children with multiple IgE-mediated food allergies Nutr Clin Pract. 2013 Dec; 28(6):669-75. [CrossRef]
- KIM J, Kwon J, Noh G, et al. The effects of nutritional status in subjects with atopic dermatitis. J Nutr Res Pract 2013; 7(6):488-494. [CrossRef]
- Canani RB, Leone L, D´Auria E et al. The Effects of Dietary Counseling on Children with Food Allergy: A Prospective, Multicenter Intervention Study. J Acad Nutr Diet. J Acad Nutr Diet. 2014 Sep;114(9):1432-9. [CrossRef]
- Dupont C, Hol J, Nieuwenhuis E E S. An extensively hydrolyzed casein–based formula for infants with cows˙ milk protein allergy: tolerance/hypo-allergenicity and growth catch up. Br J Nutr 2015 Apr 14; 113(7):1102-12. [CrossRef]
- Wickham H, Averick M, Bryan J, et al. Welcome to the tidyverse. Journal of Open Source Software. 2019 Nov; 4(43): 1686. [CrossRef]
- Firke S. Janitor: Simple Tools for Examining and Cleaning Dirty Data. R package version 2.2.0. 2022. Available online: https://cran.r-project.org/web/packages/janitor/index.html.
- Xie Y, Cheng J, Tan X. DT: A Wrapper of the JavaScript Library 'DataTables'. R package version 0.27. 2022. Available online: https://cran.r-project.org/package=dt.
- Kuhn M. Caret: Classification and Regression Training. R package version 6.0-93. 2022. Available online: https://cran.r-project.org/package=caret.
- Slowikowski K (2022). Ggrepel: Automatically Position Non-Overlapping Text Labels with 'ggplot2'. R package version 0.9.2. Available online: https://cran.r-project.org/package=ggrepel.
- World Health Organization & UNICEF. WHO Child Growth Standards and the Identification of Severe Acute Malnutrition in Infants and Children. Geneva: World Health Organization and UNICEF. 2009.
- World Health Organization. Global Database on Child Growth and Malnutrition. Geneva: World Health Organization. 2004.
- Primeau MN, Kagan R, Joseph L, Lim H, Dufresne C, Duffy C, et al. The psychological burden of peanut allergy as perceived by adults with peanut allergy and the parents of peanut-allergic children. Clin Exp Allergy. 2000; 30:1135–43. [CrossRef]
- Dupont C, Chouraqui JP, Linglart A et al. Nutritional management of cow's milk allergy in children: An update. Arch Pediatr 2018 Apr;25(3):236-243. [CrossRef]
- Robbins KA, Wood RA, Keet CA. Milk allergy is associated with decreased growth in US children. J Allergy Clin Immunol. 2014 Dec; 134(6):1466-1468. [CrossRef]
- Mailhot G, Perrone V, Alos N et al. Cow's Milk Allergy and Bone Mineral Density in Prepubertal Children. Pediatrics. 2016 May;137(5). [CrossRef]
- Maslin K, Oliver EM, Scally KS, et al. Nutritional adequacy of a cows' milk exclusion diet in infancy. Clin Transl Allergy. 2016 Jun 2; 6:20. [CrossRef]
- Du Toit G, Roberts G, Sayre PH, Bahnson HT, Radulovic S, Santos AF, et al. Randomized trial of peanut consumption in infants at risk for peanut allergy. N Engl J Med. 2015 372:803–13. [CrossRef]
- Du Toit G, Sayre PH, Roberts G, Sever ML, Lawson K, Bahnson HT, et al. Effect of avoidance on peanut allergy after early peanut consumption. N Engl J Med. 2016 374:1435–43. [CrossRef]
Figure 1.
Comparison of weight for age and height for age (cow’s milk allergy group, time of diagnosis vs enrolment). Comparison of the cow’s milk allergy group to the control group showed a statistically significant difference in the mean age of the children (5.90 +/- 3.06 versus 7.9 +/- 2.7 years in the control group).
Figure 1.
Comparison of weight for age and height for age (cow’s milk allergy group, time of diagnosis vs enrolment). Comparison of the cow’s milk allergy group to the control group showed a statistically significant difference in the mean age of the children (5.90 +/- 3.06 versus 7.9 +/- 2.7 years in the control group).
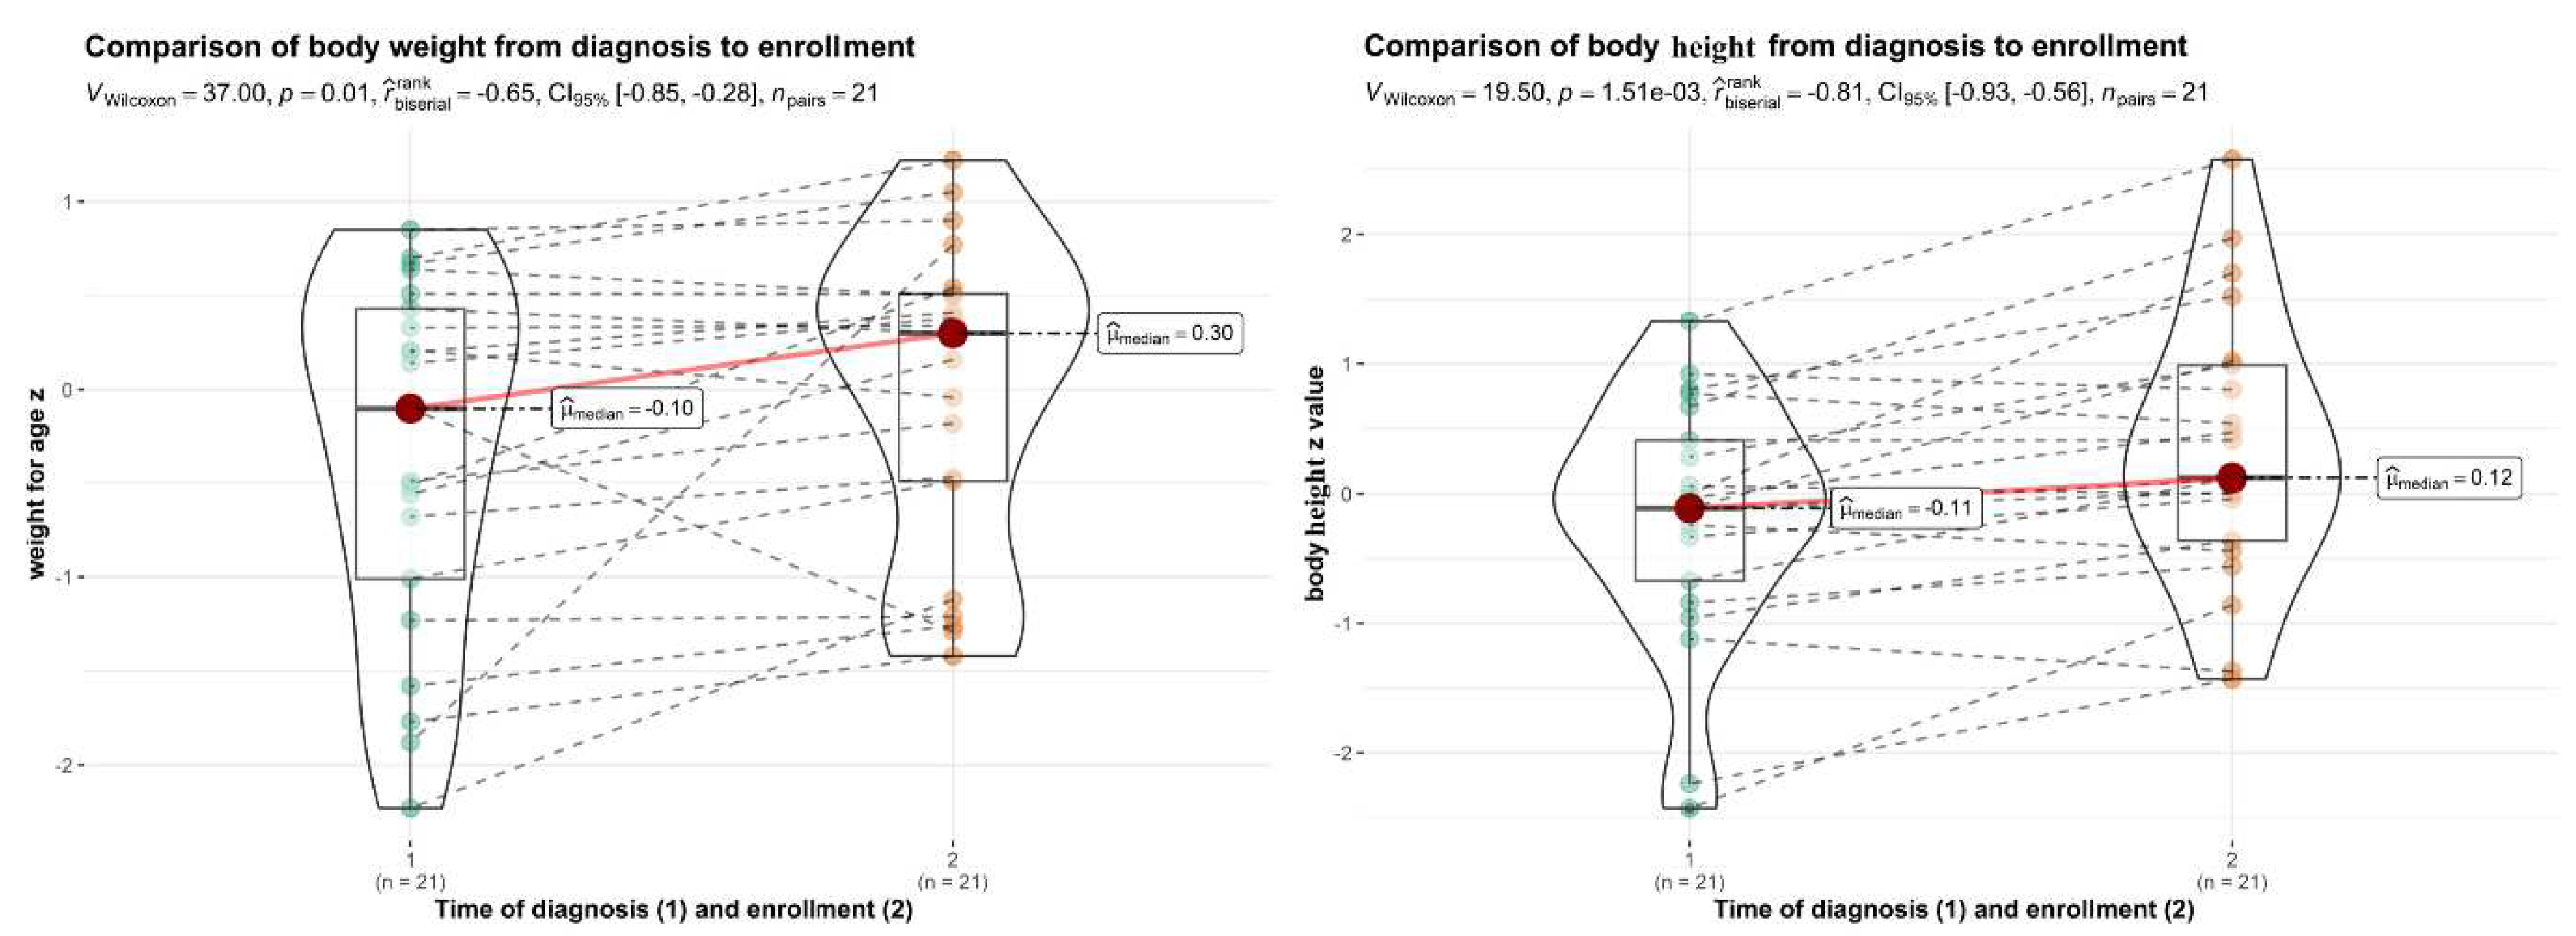
Figure 2.
Comparison of weight for age and height for age (egg allergy group, time of diagnosis vs enrolment).
Figure 2.
Comparison of weight for age and height for age (egg allergy group, time of diagnosis vs enrolment).
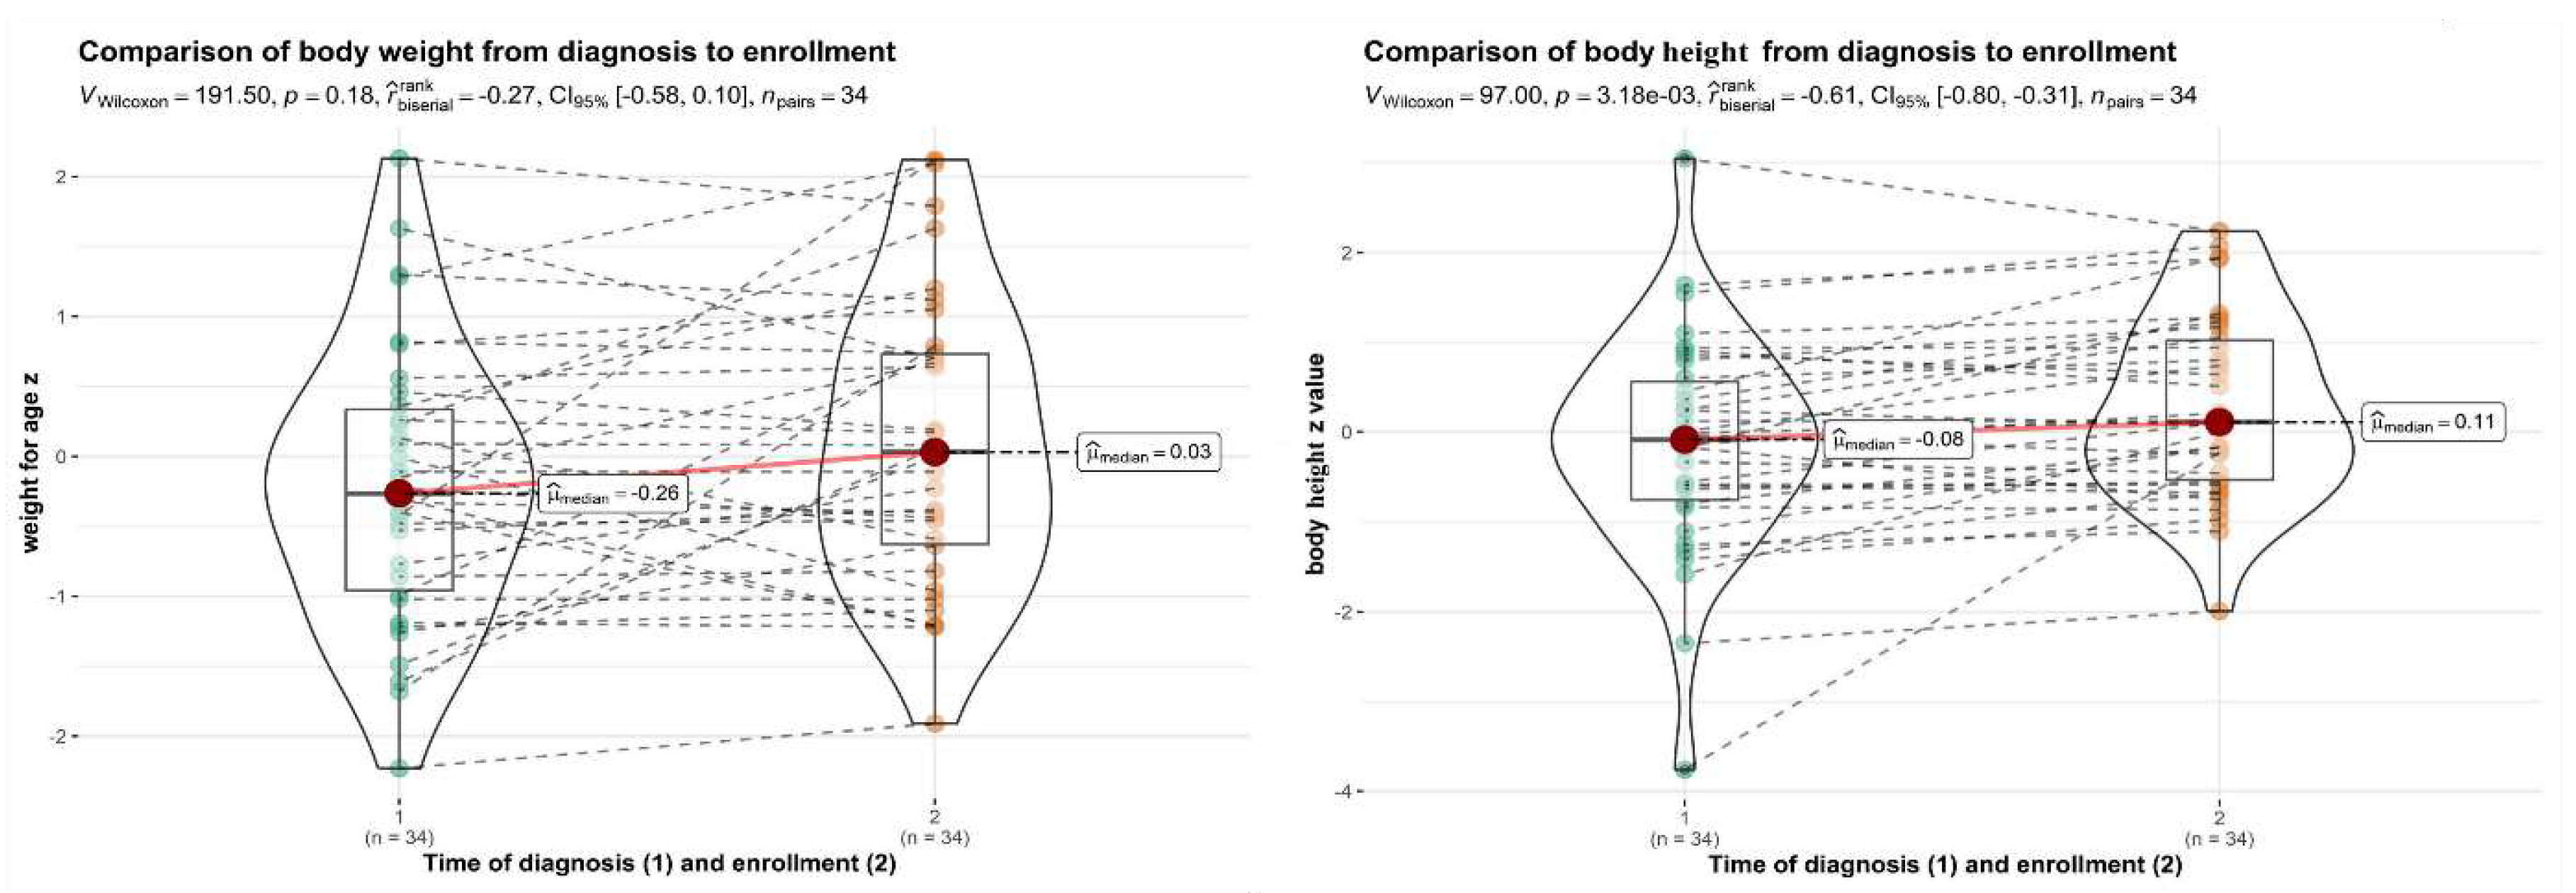
Figure 3.
Comparison of weight for age and height for age (peanut allergy group, time of diagnosis vs enrolment).
Figure 3.
Comparison of weight for age and height for age (peanut allergy group, time of diagnosis vs enrolment).
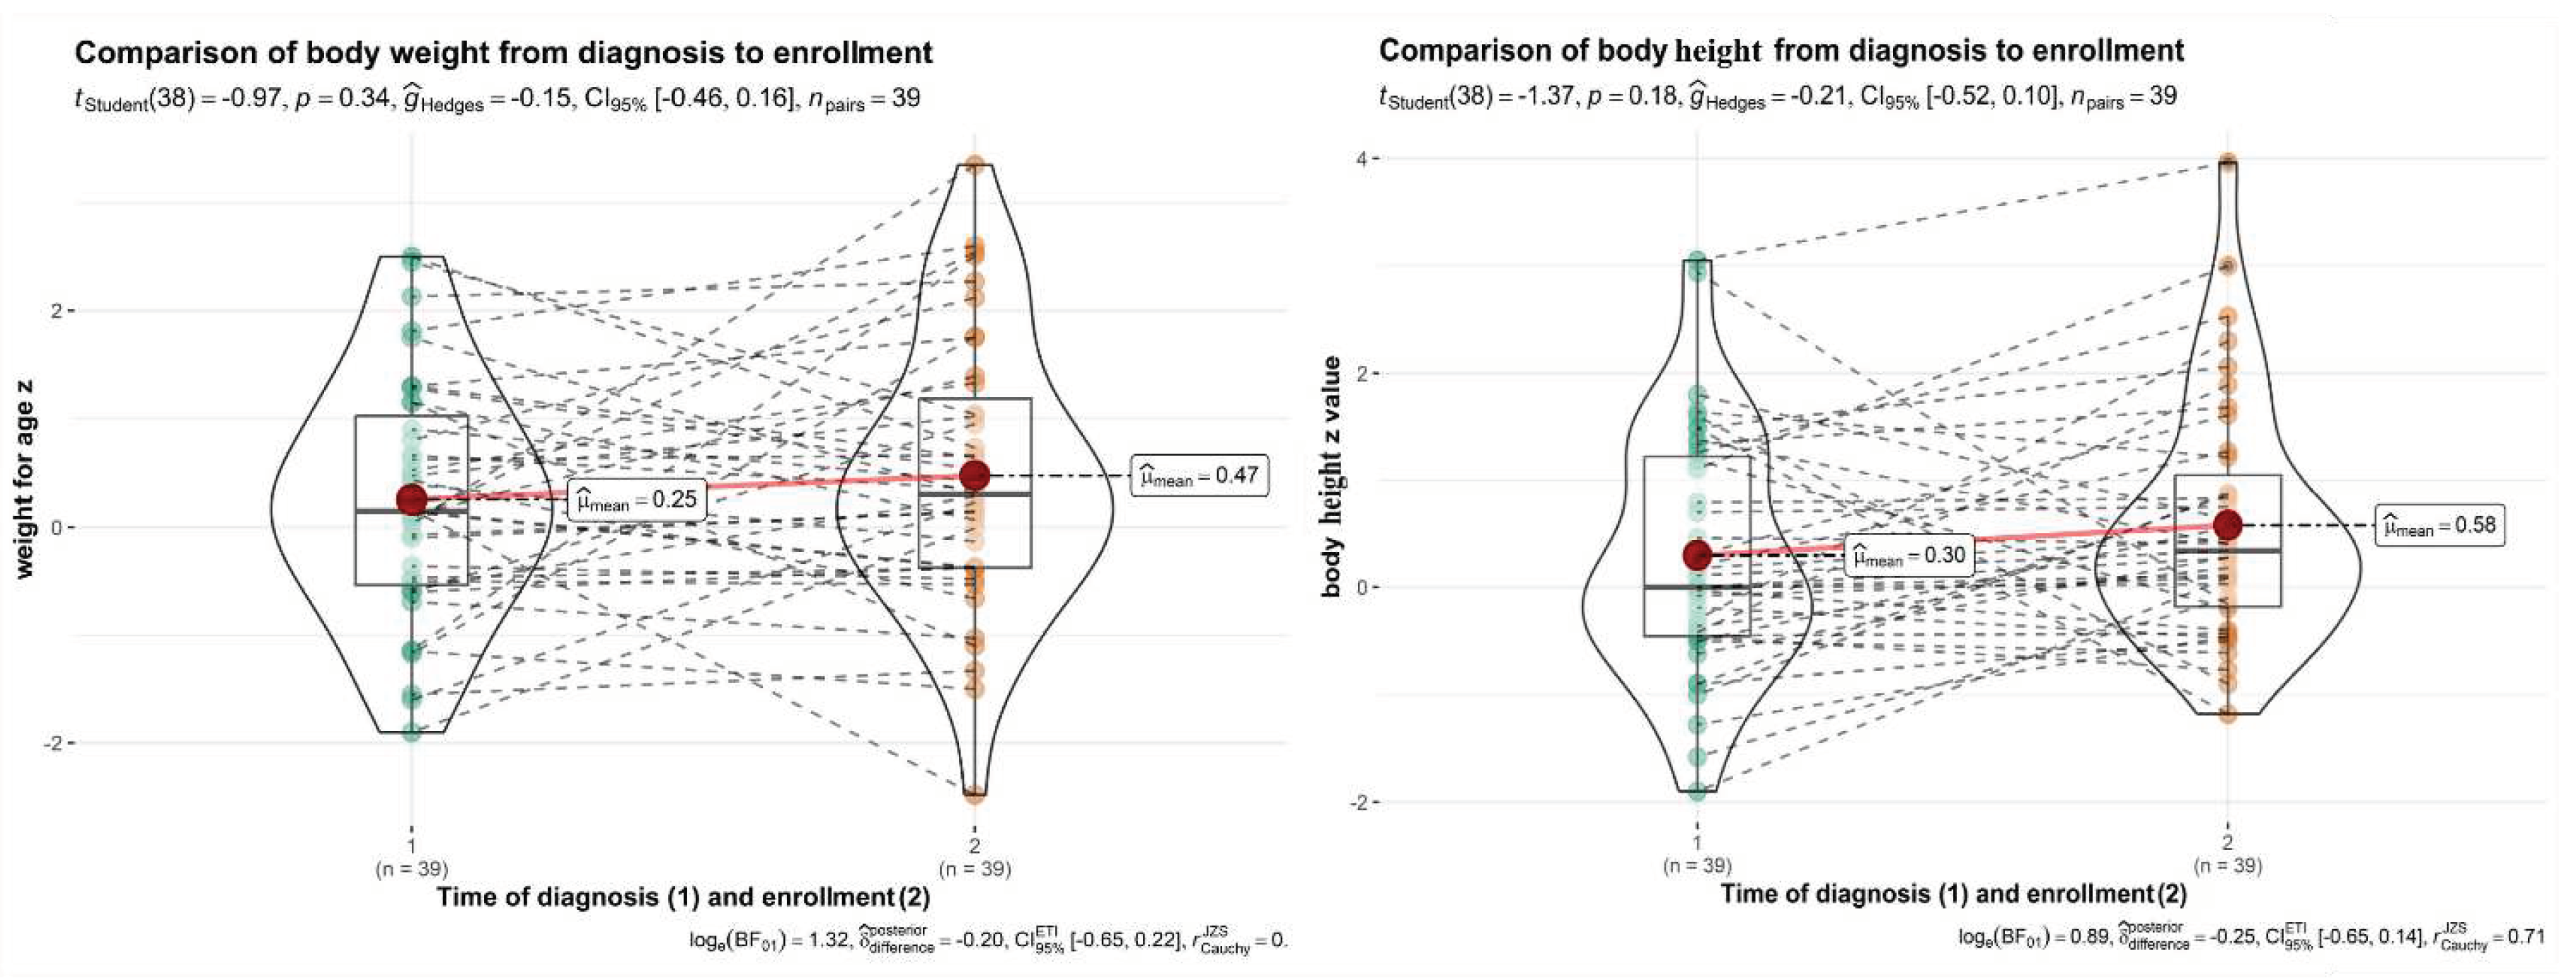

Table 1.
Patients’ characteristics.
| All participants (n=130) | Cow's Milk (n=21) | Egg (n=34) | Peanuts (n=39) | Control group (n=36) |
|---|---|---|---|---|
| Age (years) at diagnosis (SD) | 1.58 (0,99) | 1.41 (1.12) | 2.88(2.11) | / |
| Age (years) at enrolment (SD) | 5.90 (3.06) | 6.24 (3.06) | 8.08 (2.99) | 8.03 (2.79) |
| Sex (male) | 14 (66.7%) | 20 (55%) | 25 (64%) | 18 (48.7%) |
| Body weight for age z at diagnosis |
-0.254 (0.866) | -0.347 (0.838) | 0.183 (1.014) | / |
| Body height for age z at diagnosis |
0.252 (1.020) | -0.288 (1.073) | 0.229 (1.092) | / |
| Body weight for age z at enrolment |
-0.02 (0.83) | 0.09 (1.03) | 0.47 (1.26) | 0.35 (0.97) |
| Body height for age z At enrolment |
0.34 (1.05) | 0,27 (1.01) | 0,58 (1.13) | 0,74 (1.04) |
| Body mass index z At enrolment |
-0.33 (0.68) | -0,12 (1.06) | 0,21 (1.37) | -0,12 (1.20) |
| Comorbidities | ||||
| Atopic dermatitis (n, %) | 7 (33%) | 14 (41.1%) | 15 (38.4%) | 5 (13.8%) |
| Asthma (n, %) | 6 (28.5%) | 8 (23.5%) | 12 (30.7%) | 4 (11.1%) |
| Hay fever (n, %) | 4 (19%) | 11 (32.3%) | 18 (46.1%) | 5 (13.8%) |
| Anaphylaxis (n, %) | 0 | 0 | 2 (0.05%) | 3 (8.3%) |
| Angioedema (n, %) | 0 | 4 (11.7%) | 12 (30.7%) | 2 (5.5%) |
| Dietary intake | ||||
| Coverage of energy needs (%) | 88.73 (22.97) | 86.40 (25.87) | 86.70 (22.86) | 89.59 (26.97) |
| Coverage of iron needs (%) | 77.39 (28.22) | 68.16 (25.87) | 71.76 (25.80) | 77.92 (38.82) |
| Coverage of calcium needs (%) | 44.86 (22.89) | 70.01 (32.10) | 65.21 (27.02) | 63.83 (25.69) |
| Protein intake (g/kg) | 2.31 (0.88) | 2.30 (0.91) | 2.17 (0.82) | 2.20 (0.89) |
| Fat intake (% daily energy) | 27.48 (4.61) | 31.09 (5.34) | 31.85 (5.37) | 30.30 (5.03) |
| Carbohydrate (% daily energy) | 53.65 (5.80) | 53.68 (6.66) | 51.97 (6.69) | 53.65 (5.80) |
| Vitamin D supplementation (n, %) | 21 (100%) | / | / | / |
| Calcium supplementation (n, %) | 19 (90%) | / | / | / |
Children in the food allergy groups presented clinically with atopic dermatitis (34), asthma (26), hay fever (33), anaphylaxis (2), and angioedema (16). Some children had more than one condition: 3 in the cow’s milk allergy group (14.2%), 9 in the egg allergy group (26.4%), and 8 (20.5%) in the peanut allergy group.
Table 2.
Calcium needs coverage (%) and carbohydrate intake in the cow's milk allergy and control group.
Table 2.
Calcium needs coverage (%) and carbohydrate intake in the cow's milk allergy and control group.
| Calcium need coverage (%) | Control | Cow’s milk | Total | p |
| Mean (SD) | ||||
| 63.83 (25.69) | 44.86 (22.89)* |
7.26 (3.05) | 0.027 | |
| Median (Q1, Q3) | 61.91 (46.56, 74.55) |
45.60 (29.20, 53.50)* |
53.89 (38.10, 70.40) |
|
| Min – Max | ||||
| 13.89 – 124.67 | 17.55 – | 13.89 – | ||
| 118.83 | 124.67 | |||
| Carbohydrate (% energy intake) | Control | Cow’s milk | Total | p |
| Mean (SD) | ||||
| 53.65 (5.80) | 57.76 (5.80)** | 55.14 (6.09) |
0.048 | |
| Median (Q1, Q3) |
61.91 (46.56, 74.55) |
57.00 (53.00, 63.00) |
54,00 (51.00, 58.00 |
|
| Min – Max | ||||
| 44.00 – 76.00 | 49.00 – 66.00 | 44.00 – 76.00 | ||
In the cow’s milk allergy group, catch-up growth from diagnosis until enrolment in the study was shown to be statistically significant. Improvements in mean body height for age from -0.252±1.020 Z to 0.161±1.071 Z (p=0.012) were observed (Figure 1). Statistical analysis of body mass index Z scores and weight for age Z scores did not show significant differences from the time of diagnosis of food allergy until enrolment in the study (p>0.05). We could not find any negative impact of food allergy on growth (Figure 1). Statistical analysis of body mass index Z-scores did not show a significant difference from the time of food allergy diagnosis to enrolment in the study (p>0.05).
Disclaimer/Publisher’s Note: The statements, opinions and data contained in all publications are solely those of the individual author(s) and contributor(s) and not of MDPI and/or the editor(s). MDPI and/or the editor(s) disclaim responsibility for any injury to people or property resulting from any ideas, methods, instructions or products referred to in the content. |
© 2023 by the authors. Licensee MDPI, Basel, Switzerland. This article is an open access article distributed under the terms and conditions of the Creative Commons Attribution (CC BY) license (http://creativecommons.org/licenses/by/4.0/).
Copyright: This open access article is published under a Creative Commons CC BY 4.0 license, which permit the free download, distribution, and reuse, provided that the author and preprint are cited in any reuse.


