
Submitted:
24 November 2023
Posted:
27 November 2023
You are already at the latest version
Abstract
Airworthiness certification requires proof of structure strength, which is performed generally through building block approach. To achieve this, representative intermediate scale experiments generated by test benches are in general needed, additionally to material characterization at coupons scale and structure testing at large scale. The VERTEX test bench can generate combined loading of tension/compression-shear-pressure on structural elements and was modelled with Finite Elements to perform virtual testing representative of its intermediate-scale specificity. The numerous bolted joints of the bench were modelled and their behavior identified in previous tests, so the model could quantitatively estimate the transfer function of the bench, which is the relation between the displacements imposed by the jacks and the resulting loads on a given sample. The VERTEX model was identified to represent load shapes and amplitudes on a training set, and was later confronted to a validation set of tests of tension and shear. A model with ideal boundary conditions was also developed for comparison but it failed to predict some load shape specificities and did not give any indication of loading amplitude. Application cases of the developed model are shown to assess a range of virtual testing possibilities.
Keywords:
composite structure
; airworthiness certification
; pyramid of tests
; intermediate scale experiment
; multiaxial loading
1. Introduction
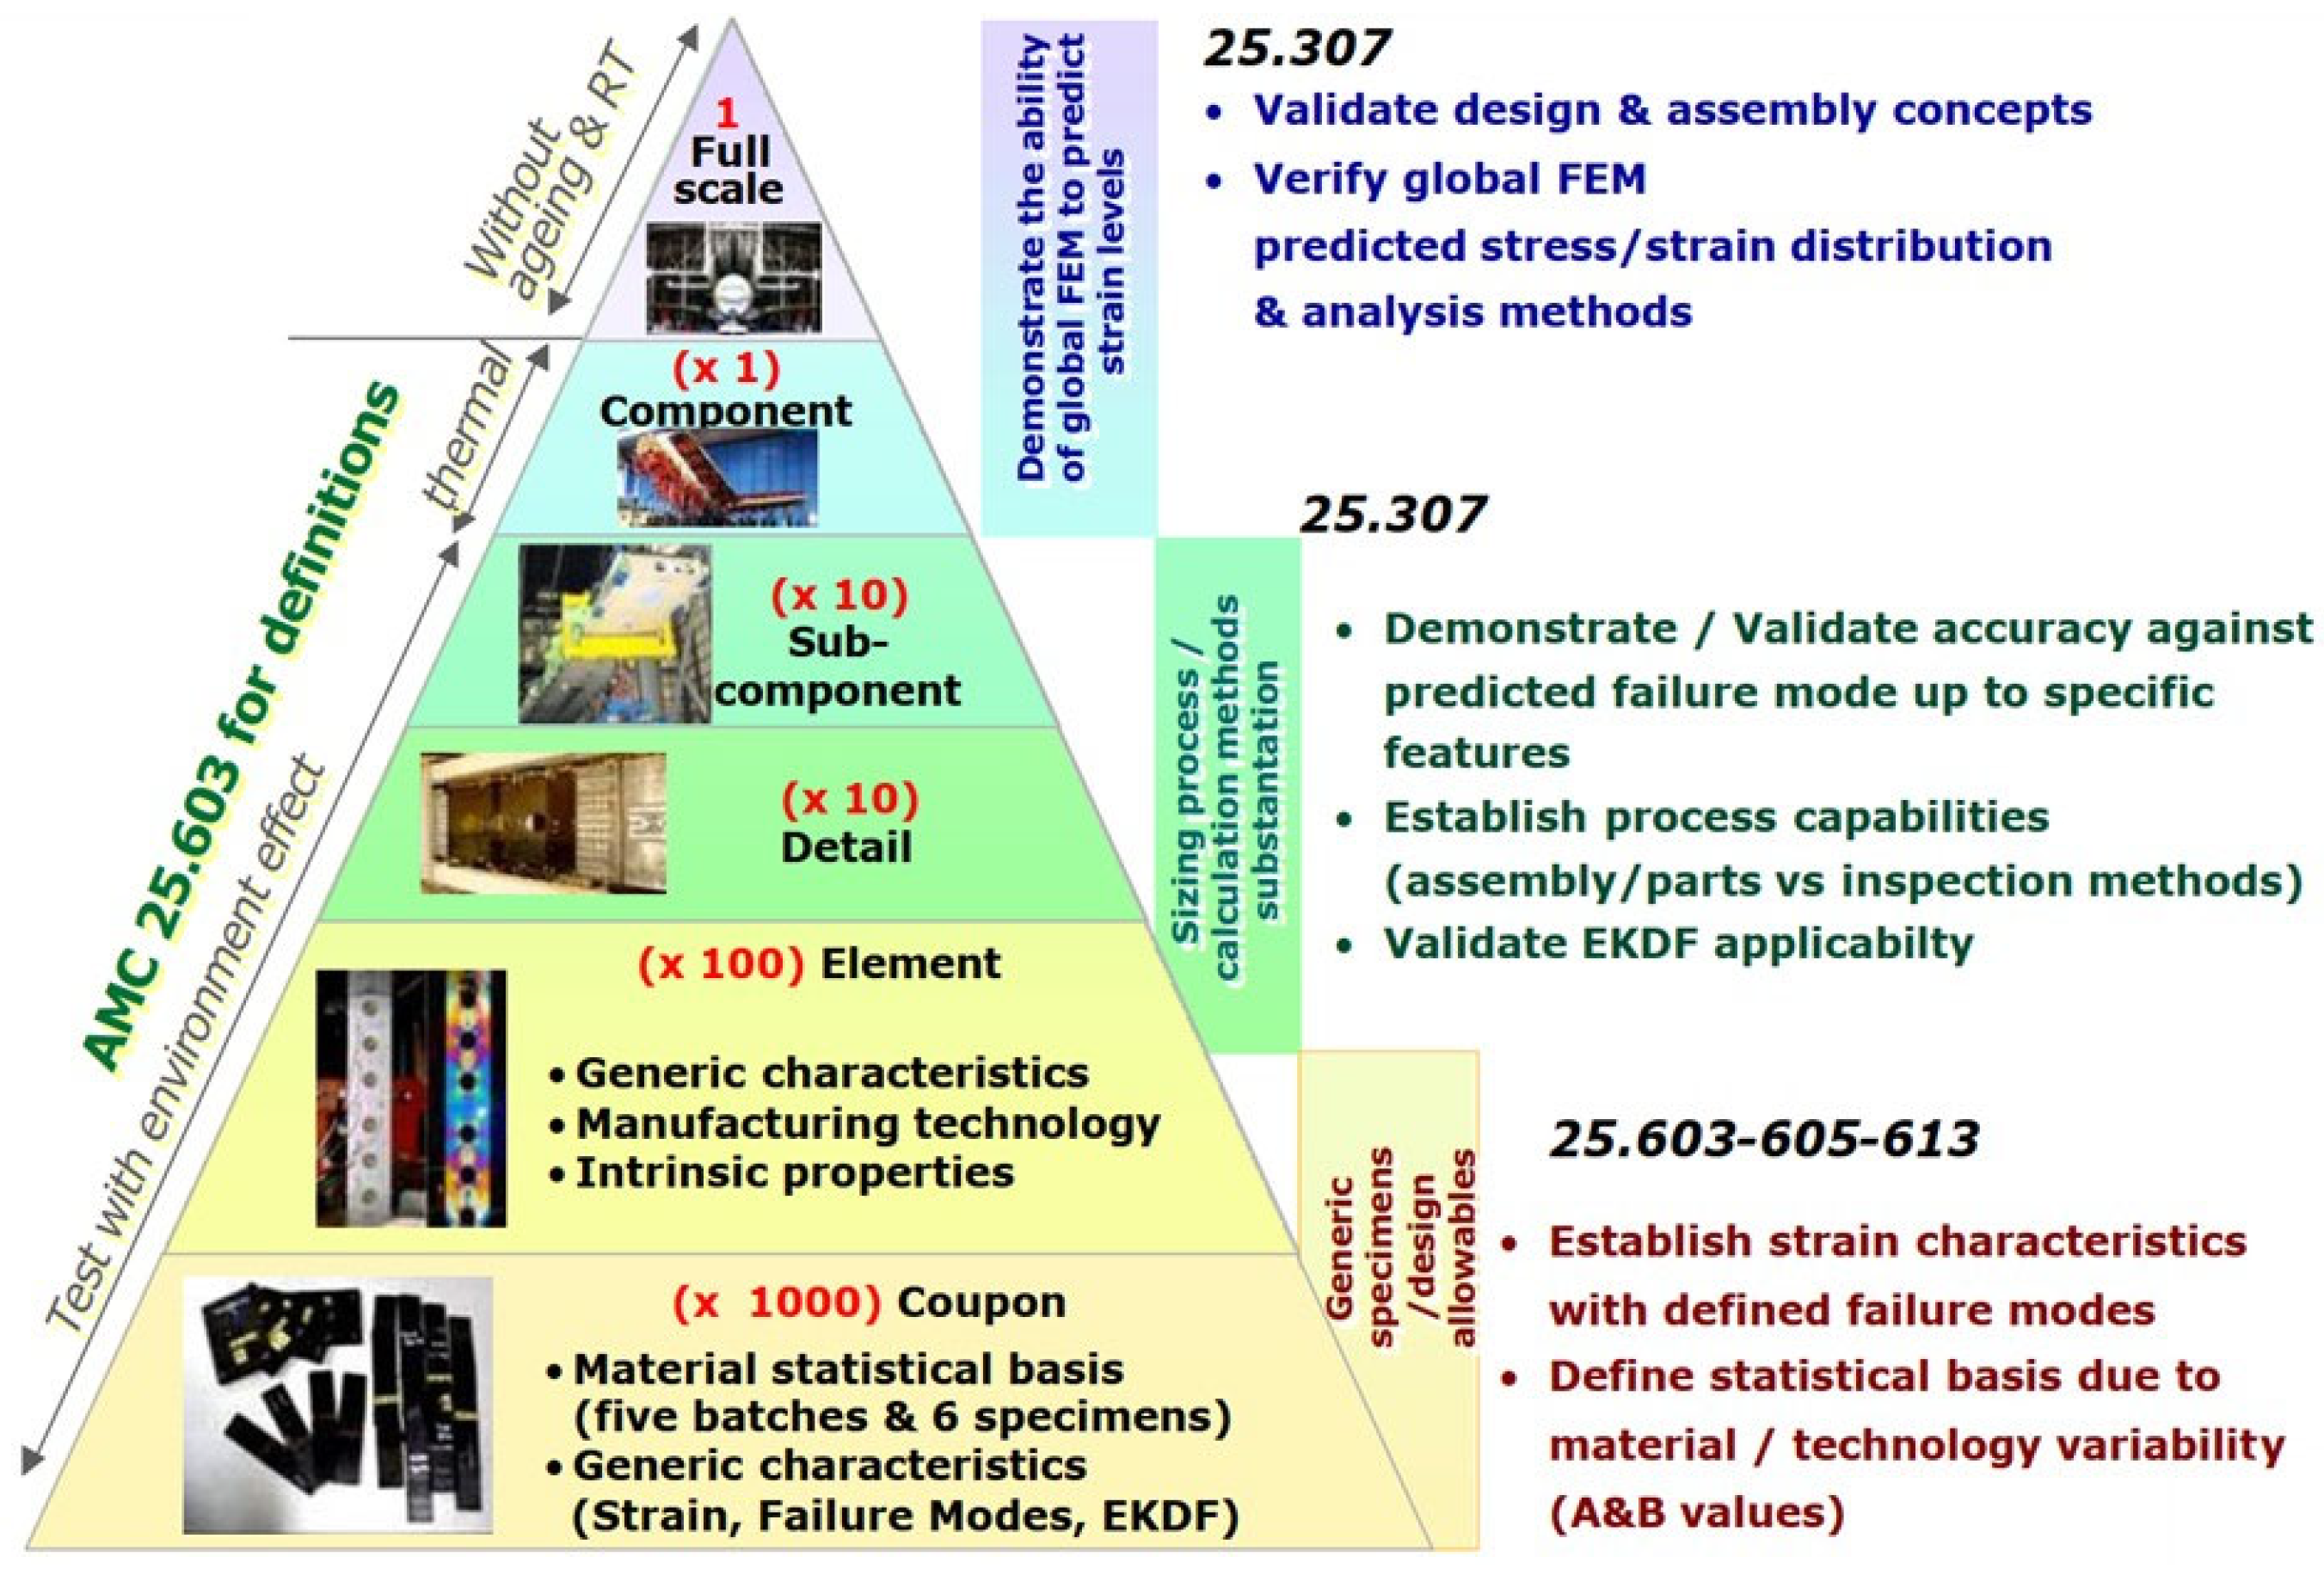
The certification of aeronautical structures is generally based on the pyramid of tests [1] (Figure 1), which is a representation of the design process and the structural validation for airworthiness certification [2]. At the bottom of the pyramid, coupon tests give low-scale characterization of the material behavior, from design allowables to failure phenomenology [3,4]. Based on coupon characterizations, the next level of the pyramid focuses on structural detail issues such as the strength of bolted [5], the unfolding of L-shaped specimens [6] or the post-buckling behavior of stiffened structures [7,8]. Based on coupon and of elementary structural phenomena characterization, specimens of growing complexity and scale can be designed and validated, up to high scale testing. The design is performed to conservatively prove that the manufactured aircraft can withstand loads specified by regulation authorities. Numerical simulations can be extensively used to simulate the behavior of structures but structural performances demonstration need to be supported with test evidence. This numerical/experimental approach is also used for the analysis of particular problems such as the debonding of stiffeners [7,8] or the strength of Z-pinned junctions [9,10].
In recent decades, the aeronautical industry has been showing growing interest in composite materials for their competitive strength to mass ratio. However, each new material requires regeneration of the coupon level of the test pyramid with numerous tests to update allowables. Thus, the design/validation for new aircraft programs is generally costly and time consuming, and can also lead to structural oversizing because of some remaining unexploited potential of composite structures [11].
Figure 1.
The pyramid of tests [1] representing the numerous small mechanical tests providing a design basis for the fewer and larger tests [12] (Courtesy of Airbus).
This paper focuses on the testing of specimens at the intermediate scale of the test pyramid, situated between the coupon level and the sub-component level. The main interest of this scale lies in the study of elementary structures under uniaxial loadings (Figure 2). This scale also studies the effects of local damages on the structural integrity, resulting from incidents such as stiffeners impacts or a notch on a fuselage caused by an uncontained engine failure. In-flight experiences stress the fuselage structures globally and locally generate multi-directional loading (combined and not uniform) on fuselage sections. Therefore, there is a need for multi-axial testing at this intermediate scale to assess the strength of elements under the wide range of possible loads. Whereas coupon tests mostly abstract from the way exterior loading is applied, larger tests must consider a specific test bench to load a specific sample. A test bench is designed to apply specific loads to a sample in a specific way, in order to address the sample behavior under such loading. A large spectrum of loads (tension, compression, bending, torsion, pressure, shear, etc.) can occur on a fuselage section: thus a few configurations are tested with specific test benches, then validated models and conservative approaches are used to address any relevant loading combination to be validated.
The intermediate-scale test benches are reviewed here to position the interest and originality of the tests considered in this paper. Basic test machines for coupons are introduced to contextualize the intermediate-scale practices, but full-scale tests at the component level are outside the scope of this literature review. Basically, the range of in-plane loadings is dealt with by using unidirectional coupon tests [14,15], with bi-axial tests on cruciform samples [16,17,18] and with shear on deformable squares [19,20,21]. Cruciform samples are cross-shaped specimens where the two main directions are loaded independently to enforce bi-axial loading states of tension-tension, compression-compression or tension-compression. Most cruciform tests study pure reference loads on a very small area of interest, which places them in the coupon level of the test pyramid, but structural issues similar to larger tests already appear: undesired failure at corner edges [22], kinematic consistency regarding the two directions loaded simultaneously and the non-homogeneity of loading on the zone of interest (usually handled with [23] for biaxial tests). Deformable square tests generally use small panels at the element level of the test pyramid, where approximate shear is applied to the full contour of the specimen. This is a first step towards structural testing with a specific bench, since, for each case, a somewhat different technical solution is implemented to enforce loading, which does not ensure the reproducibility of load shapes from one bench to another. Therefore, it becomes of interest to study the bench itself and the specific loads it produces.
Most tests at the intermediate scale enforce loading directly from actuators to the sample, so they will be referred to as "direct actuation benches". Uniaxial tension or compression on a large stiffened panel is often directly applied with a single powerful actuator [24]. Some other benches are simply scaled up implementations of usual coupon principles, such as large deformable squares [25,26]. More complex loadings can also be applied directly to the sample, either by using many actuators along the specimen contour, or through a rigid structure that enforces specific kinetics on the sample [27,28]. Figure 3 shows a few examples of such benches and points out load combination possibilities. The civil engineering field faces similar structural testing needs, so very similar test benches (generally bigger) are used to load wall structures (Figure 4).
Tests at large scale on components or subcomponents are also directly loaded with global efforts and moments that are not properly representative of the in-flight experience of the global structure. However, local sections are loaded by the rest of the component, which generates local representative load shapes. Such major scale tests are rare and very costly but are necessary to validate the uppermost part of the test pyramid, notably to verify possible structural phenomena and effects of local damage (such as a large notch [35,36]) on a representative structure. The complexity and cost of such large tests can be substantial for development purposes so there is a need for intermediate scale testing with benches able to generate loadings representative of larger tests.
A second category of test benches exists, where the sample is fixed into a larger compliant structure, which role is to apply loading representative of sections of larger structures locally on the sample. This category will be referred to as "structurally embedding benches", in opposition to the "direct actuation benches" discussed above. The interest of this approach is to study representative intermediate scale structural issues without the cumbersome aspect of larger scale testing and its cost. Note that, in certain direct actuation benches, an intermediate structure is also often placed between the sample and the actuators, but with the fundamental difference that they are rigid and that the intention is to enforce simple kinetics instead of reproducing an interaction with a larger structure. Figure 5 shows such benches with loading structures explicitly representing fuselage sections, with large panel specimens that can be positioned at the top of the intermediate-scale range of tests. Alternatively, bench loading structures can be built from compliant closed sections, typically rectangular boxes as initially published by Peters [37] as early as 1946. Klein et al. [38] later considered a rectangular box and bolted the sample to the lower face; When the box was globally loaded in bending or torsion, the specimen was subjected to tension/compression or shear. Castanié et al. [39,40] developed a test bench on the same principle, but with a more compliant structure to apply realistic loading on asymmetric sandwich structures used for helicopters. However, the area of interest of the sample was found to be limited, and this later motivated the development of the VERTEX test rig, basically a larger version of the previous machine, "to investigate composite structures at the scale of technological specimens and under complex loads" [35,36,41]. Recently, Zucco et al. [42] have developed a specific test bench to introduce combined loads of bending, shear and torsion on a thermoplastic wingbox specimen. A compliant intermediate structure of "aluminum dummy wingboxes" was designed to minimize boundary effects of load introduction on the useful composite wingbox. The same authors [43] also developed a numerical model of the specimen and the loading structure, to assess stress concentrations and the effect of the loading structure on the prescribed loading of the useful specimen.
Mechanical experiments require instrumentation to monitor the test, especially the loading state of the sample. To numerically simulate the tests (for model identification, numerical investigation, virtual testing or validation), boundary conditions need to be applied to the model: the load shape (nature and spatial distribution of boundary conditions) can be assumed ideal (uniform/constant or basic kinetics) or realistic fields can be applied (generally displacement measured during the test, to simulate the same test). Forces and displacements of the actuators are the first data easily obtained from such tests. In the case of direct actuation benches, this provides very rich information for boundary conditions; possible intermediate parts between the actuators and the specimen can be considered rigid or modelled with a coarse description. In the case of structurally embedding benches, the transfer function of the bench (relation between actuator setpoints and the resulting loading on the sample) is complex. Previous studies on the VERTEX test bench [47] showed non-uniform load shapes for reference loads of tension and shear. Moreover, structural phenomena came into play to complexify the reference loadings: longitudinal tension was followed by substantial transverse compression, and the Wagner effect deviated shear post-buckling towards combined shear and tension.
Hopgood et al. [22] and Williamson et al. [48] considered bi-axial testing on cross-shaped samples, to assess the failure envelope of open-hole specimens under combined in-plane loads. They systematically performed a "calibration" process on each sample, to know the relation between the actuator forces and the resulting nominal strain on the sample; the open hole on the sample was drilled after the calibration and then tested up to failure. The loading state of the sample during the tests was therefore assumed, given the measured forces of the actuators and the basic transfer function obtained by calibration. A similar process could be applied to more complex test benches but, for compliant loading structures, the dependency on the sample stiffness evolution must be considered: boundary conditions may be sensitive to the loss of stiffness of the sample (initial central defect of interest and damage propagation).
Carpiuc-Prisacari [49] considered a hexapod test bench to directly apply tension-shear load on a double edge notch specimen. Various complexities of boundary conditions were tried (from constant/uniform to regular shapes and actual measured displacements without smoothing) to numerically simulate crack propagation in the tested specimen. It was found that the crack propagation (maximum stable crack length and direction) was sensitive to the load shape (uniform, linear, parabolic, raw measurement) and that more complex load shapes gave more representative propagation of the experiment. The authors emphasized "the importance of using the measured boundary conditions and the high sensitivity to the applied boundary conditions" [49] as opposed to the configuration with ideal boundary conditions: "boundary conditions in the numerical simulations are assumed to be matching the ideal prescribed conditions, i.e. as if the experimental setup was perfect"[49]. Therefore, specific load shape complexities need to be captured by the transfer function used for numerical simulations.
One solution is to use in situ local measurements: rosette strain gauges are massively used to measure strains locally. To compensate for the rosette’s spatial restriction to a single point, arrays of them can be placed in order to have many measuring points to appreciate spatial distributions of loads [40]. Digital Image Correlation allows extremely rich data (fields of displacements and strains) to be simply obtained over the total area of the sample. The loading state of the sample can therefore be measured comprehensively instead of being assumed from distant actuator forces or assessed from poor local data of rosettes. Actual fields of displacements measured on the sample during the test can therefore be imposed as boundary conditions of numerical simulations [35,36,41,50]. However, this method is limited to the simulation of experiments already tested, and complexity arises with damage of the sample, as they may interact with the boundary conditions.
Given the interest in structurally embedding benches because of the load shape they produce, the interest in the bench transfer function (sample loading resulting from the bench load setpoint), and the importance of load shapes in the tests, it is important develop a transfer function representative of the specific load shapes of the bench. A calibration process or test measurements offer in-situ solutions to deal with this problem. However, they do not provide suitable predictions for tests on new specimens or new complex load paths. The numerical modelling of the test bench and the specimen with Finite Elements was therefore the solution adopted here to assess the transfer function, predictively and relatively to the load shape specificities. To the best of the authors' knowledge, the literature hardly ever covers the modelling of mechanical test benches [42], especially for compliant test benches with consideration of load shapes.
The modelling of the test rig was a first step towards representative virtual testing of crack propagation and towards the study of envelope loadings as introduced by Serra et al. [35], which requires quantitative estimations of loading states.
The first part of this paper presents the working principle of the VERTEX test rig (loading and measurements), to assess some modelling complexities and actually model the VERTEX bench with Finite Elements in the following part. Results from this model are compared with both experiments and simulations with ideal boundary conditions, to evaluate the model’s ability to make predictions and to evaluate the load shape specificities of the VERTEX bench. Finally, test cases are shown to illustrate the capabilities of the model regarding virtual testing.
2. Materials and Test Rig
2.1 Specimens and Test Matrix
The specimen geometry considered (Figure 6—left) was a 558 mm × 536 mm plane plate, with 128 holes to bolt it to the test bench, which left a 400 mm × 400 mm useful zone. On some samples, a central notch of 100 mm was milled. Table 1 lists the samples considered in this study to benchmark the apparatus and the model under different test cases. For confidentiality reasons, material properties and stackings are not disclosed and loads are normalized.
Samples were loaded under reference proportional loadings of the VERTEX bench (compression, tension, shear), so each test is referred to by a combination of the sample and the loading: ALU-compression, TSs-tension, TP-shear, etc.
2.2. Presentation of the VERTEX Test Rig
The VERTEX test rig (Figure 7 and Figure 8) has been used in previous works [35,36,47,51]: it was developed and first used by Serra et al. [35,36], from a previous similar machine [39,40]. The VERTEX bench is mainly a long box composed of simple plates jointed with thousands of bolts, and the sample is bolted to the center of the bench to complete the top surface. Jacks 1 and 2, at the tips of the bench, can push or pull symmetrically to globally bend the main beam, which generates tension or compression locally on the sample (Figure 9). Jacks 3 and 4 can push to twist the central box, generating negative shear locally on the sample. The main beam and the central box are hollow, which allows an air-pressurized rubber bladder to be placed inside the central box, to possibly apply pressure to the sample. The four jacks and the bladder pressure can be controlled independently in order to apply pure or combined structural loads of tension/compression + shear + pressure on the sample.
Usually, for coupon tests, the load going through the specimen is known because it is directly equal to the force of the actuator. However, for structural testing and notably with the VERTEX test bench, the load can take multiple paths through the bench structure thus the sample loading is a complex function of the jack displacements. Two optical cameras were used in this study (Figure 7), focusing on the full field of the sample, to perform digital image stereo-correlation and thus assess the loading of the sample.
2.3 Test Data Processing
An important issue in structural testing is to monitor the sample loading state, without using the load amplitude of the actuators, which are not relevant for structurally embedded samples. Stereo-correlation was performed with the commercial software VIC-3D-v7 thanks to the pair of full-field cameras capturing the motion of the speckle painted on the area of interest of the sample. Fields of positions and displacements obtained (Figure 10) allowed load shapes to be appreciated and load amplitudes to be measured as the difference of extreme values of a given field.
Structural panels are usually sized with plate force fluxes (Nx, Ny, Txy) and moment fluxes (Mx, My, Mxy) so it is of interest to be able to describe the sample loading state with the appropriate metric. On the top surface of the sample, the measured displacements can be derived with respect to space once, to obtain strains, or derived twice, to obtain curvatures. Knowing the elastic properties of the sample material, measured strains and curvatures can be used to compute force and moment fluxes using the plate theory [47] (Equation 1 and Equation 2). Each flux field of each frame was spatially averaged on the borders of the sample (in orange rectangles plotted in Figure 6), to obtain a single scalar representative of its global intensity, allowing to plot the evolution of flux intensities during a test. For example, Figure 11 plots the force and moment fluxes over time for the TSs-shear test: the clamping introduced significant compression, then tension and shear increased gradually, up to a sudden crack propagation generating a major load drop. Only the Nx and Txy force fluxes were considered here because they were the main metrics relevant to describe the tension and shear tests considered.
The crack propagation was not modelled in the numerical simulations of the bench so this paper focuses on the elastic part of tests and not far stages of crack propagation where it interacts with the bench behavior.
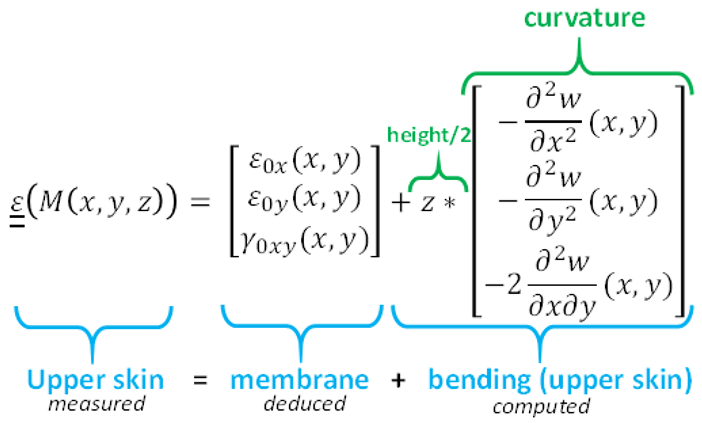
Equation 1: Computation of membrane strains from upper skin measurements, assuming classical plate theory.
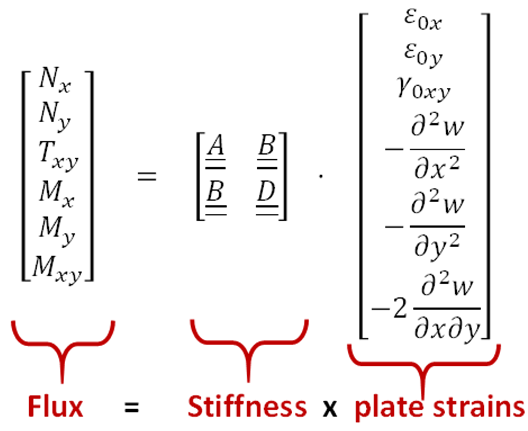
Equation 2: Computation of force and moment fluxes from the stiffness matrix and plate strains, assuming classical plate theory.
3. Modelling of the VERTEX Test Rig
The main goal of the bench modelling was to estimate the loading (amplitude and shape) applied to the sample, from the driving parameters of the bench, which are the imposed displacement of the four actuators. Prediction of load shapes is important to evaluate which phenomenology should appear and to size or validate the sample parameters according to the test objectives. Prediction of load amplitudes is useful, first to verify that the target load is within the bench range of displacement/force and, secondly, to know the jack displacement setpoints required to reach a target load point.
3.1.Modelling Strategies for the VERTEX Bench
The purpose of this section is to assess some modelling strategies, from simple to complex, and justify the choice of the latter to model the VERTEX specificities.
3.1.1. Transfer Function
The first simple method would be to define a transfer function, as a surrogate model of past tests. It would be a complex interpolation of the desired outputs (sample displacement fields or simpler data) from the main input parameters (four displacements of jacks).
Experimentally, for a given jack displacement setpoint, the displacement imposed on the sample was found to be very sensitive to the sample stiffness (Figure 12). For tension, the force transfer function gave consistent results among the three samples (Figure 13), but this was not the case for shear because there was a discrepancy between TSs and the other two samples. Beyond average loading, the load shapes were found to be sensitive to the sample stiffness and the defect installed. Therefore, the transfer function method would not be reliable when considering new samples that are: globally more or less stiff than the database narrow interval, with different damage on the center, with different structure types such as sandwich or stiffened panels, etc. Moreover, this approach does not have the scalability of Finite Element modelling to evaluate sensitivity and optimize secondary parameters (sample shape, evaluate bearing failure under the tab, etc.). Hence, the transfer function approach was not adopted.
3.1.2. Ideal Boundary Conditions: Reference Model
Basically, the sample to be tested can be modelled with Finite Element software and with boundary conditions applied to the contour. Figure 14 proposes ideal displacement shape function of tension and shear. These base functions can be bi-linearly combined to generate any combined loading of tension-shear. A uniform pressure can also be applied to the bottom face of the sample to represent the internal pressure applied by the pneumatic bladder of the test rig.
Unlike the transfer function approach, this model was very simple to set up. The finite element modelling is very scalable (geometry, material parameters) and gives rich data for virtual testing (stress in any element, criterion evaluation, representation of crack propagation, etc.).
The first shortcoming of this method is that it does not give any relation between the bench driving parameters (four jack displacements) and the resulting load magnitude in the sample. In a first approach, this issue can be handled with a basic transfer function, as it would only need to output the displacement amplitudes and not the displacement shape. For example, Figure 12 could be used as a nomograph to know the relation between the displacement of jacks 1-2 and the resulting tensile displacement amplitude in the sample, i.e. applied as a virtual boundary condition. The same nomograph would need to be plotted for shear and compression to describe the useful spectrum of the test bench. A combination of loading could simply be approximated by a linear combination of supposedly independent tension/compression, shear and pressure. However, this solution suffers from the main shortcoming of the transfer function discussed above, i.e. its representativity for samples outside the database range.
The second main shortcoming of this ideal boundary modelling is the representativity of the load shapes to the actual VERTEX test bench. The VERTEX test rig was found to create non-uniform load shapes [47] (Figure 10 and Figure 15), which is an asset of this bench, built from closed sections, as it is assumed to be more representative of actual loads seen by an aircraft fuselage section. It is preferable to develop a model representative of this valuable specificity.
3.1.3. Bench FEM Modelling
The thorough approach is to model the structure of the bench and the sample with Finite Elements. It could meet the main objectives of load shape representativeness, being able to make predictions for untested configurations, and to establish a direct relation between load amplitude on the sample and the bench driving parameters.
The scalability of Finite Element modelling can be used to investigate the bench behavior, for example: sample buckling under tensile loading, flank plasticization, the role of the four thousand bolted joints holding the bench parts, etc. Moreover, Finite Element modelling allows virtual testing for new testing configurations, like upgrades to avoid undesired sample corner failures [47]: filleted geometry of the sample, new tabs to smooth loading introduction to the sample, etc. These application possibilities are explored in section 5.
The VERTEX test rig is composed of many parts joined with many bolt connections, thus a large number of surfaces undergo contacts. An almost infinite range of modelling complexities can be implemented, from the basic finite beam element to represent the main beam structure, to the over-complex modelling of 3D geometries of each part and connection. The challenge is to balance modelling effort, representativeness, processing time, and unwieldiness in use.
3.2. Development of the VERTEX Finite Element model
3.2.1. Modelling Strategy
Elastic shells and beams
All main structural parts were modelled in Abaqus FE software, with thin shell or beam elements (Figure 16 and Figure 17), from dimensions measured directly on the bench (Figure 7). The basic elastic behaviors of the steel and aluminum forming them were considered.
Bolted joints
The VERTEX test rig is composed of four thousand bolts tying the numerous structural parts to each other (Figure 18). Bolts had a rectified shaft to ensure proper cylinder to cylinder contact with the bolted parts and all machine bolts had pristine loosening indicators. However, bolted joints could still introduce local complex behaviors of friction, backlash and finite stiffness that should be considered to obtain global representative simulations of the bench behavior.
Each bolted joint was modelled with a connector element, binding two parts meshed with either volume, shell or beam elements (Figure 19). In this case, the connector was a spring element and its axial and radial (i.e. transverse) stiffnesses could be specified to define a displacement-force relation in each direction. Each of the two end nodes of this connector element was tied to the nodes of the closest element of the nearby part through Coupling interactions. In this way, the two parts could interact mechanically through the connector element and its defined behavior. Couplings were mostly of the distributed-type, because this gives more consistent load repartition on the parts. Moreover, in some cases the mesh was too coarse to avoid having nodes that were slaves of several neighboring connectors, which prohibited the use of kinematic-type couplings. However, kinematic-type couplings were specifically used on beam elements, as the distributed-type was not robust for specific configurations of two slave nodes aligned with the master node.
This modelling approach requires the generation of two couplings for each connector, towards the two tied parts (Figure 21). However, the connectors were tied to nearby parts' nodes and there were many bolted joints so this led to a mesh dependency that was too cumbersome to be defined and maintained manually. Therefore, it required scripting to automatically generate virtual joints (connectors, couplings, sets of slave nodes) from the list of joint positions and the part meshing.
All four thousand structural bolts between parts were represented. Usually, the engineering approach calls for a simplification of the problem by considering only the central bolts as relevant and not the ones far from the sample, which would be replaced by simple surface ties or merged parts. Indeed, the general modelled could have been simplified, however, all bolted joints were already defined in a previous version of the model for the sizing of the bench structure. Since the process of virtual joint creation was automated for Abaqus modelling, it was actually simpler to directly model all of them than to actively suppress some and replace them with ties. Bolted joints still represented a minority of overall elements so the processing time should not be substantially affected. Moreover, this thorough approach allowed to actually assess the role of distant joints instead of assuming perfect ties. The identification of virtual joints’ stiffnesses is discussed in detail in the next section.
Sample modelling
The sample was modelled with pseudo-volume thick shell elements (Abaqus SC8R), and with an elastic composite-layup material property. The composite layup property gave us the opportunity to evaluate strains and criteria directly, ply per ply, and also to represent the ALU sample with a single ply. The thick shell representation eased thickness visualizations (notably for surface contacts) and vertical relative positions of stacked parts (bench-sample-tabs or stiffeners bonded to the skin/sample for future stiffened samples). Moreover, it gave good volume compatibility for a local damage model to be integrated later around the notch [51].
A 5 mm nominal size of elements was enough to describe representative general load shapes (Figure 20). The mesh was locally refined at the notch tips to capture stress gradients for failure initiation considerations, which are not discussed in this article. The sample bolting holes were actually modelled, whereas they were ignored and thus filled for all other parts of the rig. There was a connector element for each bolt-hole in the sample, which was linked to the sample mesh with an individual Coupling. A given sample's connector was anchored to all peripheral nodes of the bolt-hole, whatever the hole's mesh refinement, allowing junctions loads to be assessed on any hole.
The tabs were modelled as a single part, distinct from the sample since, in reality, they were just bolted with the sample and not bonded. However, tabs were linked to the sample's connectors with additional couplings (Figure 21).
Contacts
Bench/sample and sample/tab surface contacts were modelled (with friction) to represent the local flexural boundary conditions that were important for substantial bending of the sample.
For the sake of simplicity, no other contact was modelled between the numerous parts of the bench. The later identification of virtual joint stiffnesses was expected to render the global rigidity of the bench, including the effects of local contacts.
Loading
The VERTEX tests are driven by the displacement setpoints of the four jacks, so they needed to be modelled to drive simulations in the same way. Finite Element simulations are not intended to impose the relative displacement of both end nodes of a jack. Each jack was modelled with a single truss element, then its temperature was controlled to dilate the initial length. A virtual Coefficient of Thermal Expansion was defined in such a way that a +1°C temperature rise caused a +1 mm dilatation. The Young’s modulus of the truss was set extremely high so that the final length of the truss was not significantly dependent on the loading force. Therefore, in the model, the displacements of the jacks can be controlled with a simple temperature boundary condition, individually on each truss-jack element (+X°C giving +X mm).
Other modelling limits
The bench structure is bolted to a massive steel base (Figure 8) which was not meshed but modelled as infinitely rigid by clamping boundary conditions on the bench tips. As a first step toward more complex simulations, the sample was also modelled as purely elastic, so its loss of stiffness due to crack propagation could not be represented. Experiments and simulations were therefore only compared up to a significant crack propagation in the experiment.
The sample was modelled as perfectly flat, without any geometrical manufacturing defect or initial internal stress. The clamping of the sample (process of bolting the 128 holes of the sample to the bench) was known to introduce substantial loads [47] but the spread of the load over the holes was unknown, variable and too complex to be modelled. The clamping boundary condition was modelled through the representation of the tabs and the bench base, interacting with the sample thanks to virtual joints and contacts. However, the compression introduced by the bolts tightening was not modelled. Future works could model this compression in order to realistically transfer the radial load of the bolt to the sample, through friction and bearing.
Explicit solving of Finite Element Method
At first, an implicit solver was used and gave good results except for the shear buckling of the sample since this high non-linearity classically resulted in poor convergence of the implicit solving. The model was later systematically simulated with an explicit solver to represent any load path robustly and capture the buckling instabilities of interest. However, the explicit solving tended to oscillate and required a stable time increment to be considered, depending on the size and stiffness of the elements. The modelling of notched samples requires very small elements for the meshing of the notch tip, which leads to a drastic reduction of the time increment and thus increases computation times. Artificial viscosity was set to default values of Abaqus Explicit: 0.06 linear bulk viscosity and 0.12 quadratic bulk viscosity [52]. Numerical simulations of 600 000 degrees of freedom took 8 hours to complete on 36 CPUs, for a time step of 7.10-8 s.
3.2.2. Identification of Bolted Joint Parameters
Motivation
As illustrated in Figure 19, bolt connections between two parts were modelled with connector elements and couplings. A connector element has a longitudinal stiffness and a radial stiffness, like two springs oriented longitudinally and transversely to the bolt direction. Chandregowda and Reddy [53] modelled a shear lap joint with six bolts and considered the effect of the connector radial stiffness. They found that existing semi-empirical equations gave very different stiffness estimations, which had a substantial effect on the load distribution on bolts. Bearing failure was not the main goal of the VERTEX bench modelling but connector finite stiffnesses were considered because they were expected to influence numerical load shapes. Therefore, the stiffness parameters of the connectors were identified such that the simulated bench behavior matched the actual VERTEX bench. Parameters were first identified on past tests on ALU and TSs samples, and then validated on subsequent TP tests. Considering samples from a thick-stiff pristine configuration to a thin-soft notched configuration allowed the bench behavior to be identified over a wide range of sample stiffnesses, possibly with different phenomenology.
Parameters to be identified
Connectors allowed the stiffness behavior to be differentiated in the two transverse directions but this was not exploited, given the bolt invariance to rotation. Note that complex behavior can be implemented in the connectors thanks to user-defined displacement-force laws, especially to represent initial non-linearities of the machine stiffness. Friction and backlash were initially implemented in the sample connectors but were not kept because the effects of non-linearities were subject to high experimental variability [47] and were not substantial for the tests considered. In any case, linear stiffnesses were identified so that, globally, the model fitted the experimental behavior as well as possible, including possible friction and backlash effects.
Given that couplings linked connectors to the nodes of their closest element, and given that the bench parts were meshed coarsely, the bench global rigidity was found to be dependent on the mesh size. Therefore, the mesh size of shell parts was set to 20 mm before identification of the connector stiffnesses, because this was approximately the size of the compression cone of the bolts considered [54] and thus the size of their zone of influence.
Depending on the region of the bench, bolts do not have the same size and the holes of the sample were specifically bolted with a +0.3 mm clearance to ease the awkward and frequent process of bolting a sample to the bench. Accordingly, the bench joints were divided into three regions (Figure 22) and specific stiffness parameter values were identified for each region.
Because each region (SAMPLE, BOX, BEAM) had connectors with different axial and radial stiffnesses, six scalar parameters had to be considered: SAMPLE-axial, SAMPLE-radial, BOX-axial, BOX-radial, BEAM-axial, BEAM-radial.
Identification features
The input parameters (axial and radial stiffness of connectors, for the three regions) were identified in such a way that the following outputs of the numerical model were representative of experiments: first the useful stiffness of the machine (Figure 23), which is the global amount of in-plane flux that a specific sample undergoes for a given imposed jack displacement; second, the load shape of the sample that is described by displacement fields (Figure 10); and third, the machine jack stiffness, which is the relation between a jack-imposed displacement and its resulting force (Figure 25). The jack force curves were smoothed to damp numerical oscillations, which are typical of explicit simulations and were exceptionally high for jack forces because of the unrealistic stiffness of their finite elements. In Figure 23, Figure 24 and Figure 25, a reference simulation (reference set of input parameters) is compared to the corresponding experiment, and also compared to two other simulations launched with modified parameters (only one input modified at a time), which enables the effect of each input parameter on the simulation results to be assessed individually. This is referred to as a sensitivity analysis.
The machine jack stiffness was not actually useful for the direct purpose of the model but it was very easy to obtain (experimentally and numerically), simple to analyses and gave a meaningful global physical feature of the bench to be identified. Note that the first two identification features were the direct purpose of the model but were harder to obtain and more complex to compare: the machine jack stiffness gave an easy starting point for the identification of the numerous input parameters.
Tension tests gave simple outputs, basically the amplitude of the tension flux on the sample in reaction to a jack displacement (Figure 23). The shear test gave more complex outputs since the Wagner post-buckling effect [47,55] generated a combination of tension flux and shear flux on the sample. Figure 24 shows the tension-shear coupling obtained on the sample, despite the pure shear initially intended by the setpoints on jacks 3-4. Therefore, in addition to the previous (jack displacements - force flux intensity) relation, the tension/shear coupling ratio should be considered (Figure 24). Moreover, shear tests on thin notched samples tended to generate different buckling modes depending on the parameters, which complexified the identification features.
Identification method
Starting with initial connector stiffnesses from analytical values, an initial sensitivity analysis was performed to understand which parameter (SAMPLE-axial, SAMPLE-radial, BOX-axial, BOX-radial, BEAM-axial, BEAM-radial) had what influence on the sample loading, for every load case (tension, shear), for ALU and TSs samples. The parameter identification needed to be methodical because of the very high number of inputs, the complexity of outputs, the high computational time and the manual pre-processing and post-processing.
Physically driven constraints were applied in the parameter optimization domain. SAMPLE stiffnesses were taken to be lower than or equal to BOX stiffnesses since it was basically the same bolt that was considered in both cases, but with more clearance and mounting variability for the SAMPLE. The BEAM stiffnesses were taken to be greater than the SAMPLE and BOX stiffnesses because the BEAM bolts were much larger. In agreement with [53], 103 N/mm and 106 N/mm were found to be extreme stiffness values and thus were considered extremum values for the identification. Lower stiffness values gave unrealistic deformations of the joints. Higher stiffness values were useless since 106 N/mm can already be considered as infinite relative to the connected parts’ stiffnesses. Identification features were only sensitive to large variations of inputs.
First, as illustrated in Figure 26 and Table 2, a first sensitivity analysis showed that some parameters impacted specific outputs and other parameters impacted other specific outputs, with various intensities. The first parameters to identify were the most impacting: SAMPLE-axial and BOX-axial seemed to play a major role in the machine stiffness, so they were tuned first and coarsely to come close to the solution. Parameters had quite similar effects on the Alu and the TSs samples so the focus was initially on one of them to simplify the first approach of the identification.
Second, it is possible to exploit non-dependencies: shear tests were sensitive to all axial/radial parameters in SAMPLE/BOX whereas tension tests were sensitive to axial stiffness but not to radial stiffnesses. Therefore, it was better to first identify the axial stiffness on the tension tests, and then keep the same values to identify the radial stiffnesses on the shear tests. Another parameter non-dependency appeared when looking at the tension-shear coupling on shear tests (Figure 24): the BEAM axial parameter specifically impacted the tension-shear coupling without significantly impacting the shear useful stiffness (unlike other parameters), therefore it can be identified last when focusing on this specific feature. Similarly, the parameter SAMPLE-radial only impacted the machine useful stiffness but not the machine jack stiffness (unlike other parameters). This offers another non-dependency to exploit but it also illustrates that the machine jack stiffness offers additional identification features of the physical behavior of the bench, even though it is not directly useful for the final purpose of the bench model.
Finally, a second and last sensitivity analysis should be performed to fine-tune all parameters in all configurations. The influence of a parameter may be non-linear and cross-dependent, so sensitivity may vary greatly depending on the reference point.
Results: parameters identified
Table 2 shows the stiffness parameters identified with the method described above. Thanks to these parameters, the model can be evaluated on new configurations and is expected to give representative values of the experimental bench, since it was identified on very different configurations (tension and shear, on ALU and TSs) and on physically meaningful parameters.
Table 2 also shows a qualitative summary of the sensitivity analysis, specifically for the TSs sample under tension and shear, taking the identified parameters as a reference. Axial stiffnesses were found to make a major contribution to the machine stiffness for both tension and shear cases. However, for shear loading, the radial stiffnesses were emphasized on the central box and the sample, whereas the BEAM stiffness faded. These trends were logical because of the bench mechanisms to load the sample (Figure 9): for tension, the bench is bent globally, which is expected to stress all regions axially; for shear, the central box is twisted, which is expected to involve radial stiffnesses of the BOX and the SAMPLE but not the BEAM region.
The parameters of the SAMPLE and the BOX had very similar impacts (see Figure 23 and Figure 25) and no test case or output was found to clearly isolate individual stiffness value contributions. This pointed towards the fact that several sets of parameters can give very similar bench behavior, both numerically and experimentally. On the one hand, this may call for a thorough analysis to find the true minimum of this optimization process and not just a good solution restricted to some test cases. On the other hand, this solution was good enough for the objectives considered and further identification efforts may be pointless because of experimental variability. Figure 24 and Figure 25 show significant discrepancies remaining between experiments and reference simulations (especially on curves feet), which could be attributed to backlash and friction not being modelled. As mentioned above, it was decided not to use them in the modelling of connectors' behaviors because of high experimental variability and non-substantial effects.
4. Results and Validation
The VERTEX model behavior was identified on previous ALU and TSs tests, as discussed in section 3.2.2. Then, the VERTEX model was evaluated on TP tests to validate its representativeness.
The critical buckling loads were not compared because the experimental buckling event on such a slender structure cannot be properly simulated, because manufacturing defects and clamping pre-loading were not modelled.
First, this section focuses on the model’s capacity to predict the machine useful stiffness, without consideration of the loading shapes. It should not be forgotten that the ideal boundary conditions model does not give any information on the machine stiffness; therefore, only the VERTEX model is considered for this matter (Figure 27). The machine stiffness was found to be very sensitive to most bolted joints' stiffnesses, as illustrated in Figure 24 and Figure 25. Figure 27 shows a great loss of machine useful stiffness in the experiments for displacements of jacks 1-2 above 40 mm. This was due to a major crack propagation in the sample that directly reduced the structural stiffness of the sample itself. The model developed was purely elastic so it could not represent this structural softening of the sample and therefore was not evaluated on such far stages of the test.
Finally, this section disregards the model’s prediction capacity of amplitudes to focus on the representativeness of loading shapes. The loading shapes predicted by simulation with the VERTEX model are compared to VERTEX experiments and simulations of the reference model of ideal boundary conditions. The simpler model with ideal boundary conditions (as introduced above) was also developed to offer a basis for comparison with the bench model. In this way, the load shape specificities of the VERTEX bench could be appreciated by comparison with ideal loadings. Moreover, this provided the tools for later studies dealing with the damage severity of various load shapes. In order to directly compare the results from the two models, exactly the same sample modelling file was used in both cases. In the case of the VERTEX bench model, the sample was loaded through each bolt-hole (peripheral slave nodes), interacting with the rest of the bench with coupling-connectors. For the ideal boundaries model, the same couplings were used on each bolt-hole, but they were loaded according to imposed ideal displacement (Figure 14), applied to each central master node.
Figure 28 and Figure 29 show the in-plane displacement fields and the out-of-plane position field to compare three configurations: the experiment on the VERTEX test rig, the simulation of the VERTEX model and the simulation with ideal boundary conditions. Tension and shear test cases on the TP sample were considered to evaluate and validate the VERTEX model after identification on ALU and TSs tests. The three configurations were compared with the same global load amplitudes (Nx≈0.60 (normalized) for all tension configurations and Txy≈-0.23 (normalized) for all shear configurations) so the focus is on the field shapes here and not on how well the machine stiffness is predicted. Note that in plane displacement amplitudes were an order of magnitude lower than the out-of-plane position/displacement because of the large post-buckling of such a slender sample. The reference position for the visualization of experimental displacement fields was chosen to be the sample after clamping (bolting of the sample's holes), and not the free sample before clamping, so as to neglect the parasitic rigid motion and the pre-loading induced by the clamping phase, which was variable and not modelled. The reference position of the sample was substantially curved (because of manufacturing defects and the buckling induced by clamping) so the Z out-of-plane position represents a meaningful bending state to compare configurations, whereas experimental W displacement was impaired and gave misleading shapes.
Figure 28 shows the load shapes induced by tension loading on the TP sample. The VERTEX model captured the useful U displacement field of the experiment really well, whereas the ideal tension showed straight isolines and linear evolutions on the four edges. Usually, longitudinal tension is expected to produce transverse tension through the Poisson effect when the edges are supported. However, the tension experiments with the VERTEX test rig showed transverse compression (Figure 28 -V displacement) that generated buckling on the sample (Figure 28 - Z position): the "tension" load case with VERTEX was actually a longitudinal tension with secondary transverse compression. The VERTEX model was able to capture that aspect and allowed the phenomenon to be understood through numerical investigation: Figure 30 illustrates and explains that, in the VERTEX test bench, for the tension configuration, the flanks bent towards the center of the central box, which directly induced transverse compression on the sample. The ideal boundary model could not capture this effect and thus failed to represent both the substantial transverse compression and the buckling of the sample. Note that, experimentally, the buckle was not properly aligned with the longitudinal direction and, accordingly, the V displacement field was not properly symmetrical: this was considered to be a backlash take-up issue resulting from the previously tested shear load [47]. The VERTEX model did not represent backlash history but also showed a very slight misalignment in the opposite direction, attributed to the slight un-symmetry of the bench in the (Oxz) plane: see diagonally opposed jacks 3-4 in Figure 8.
Figure 29 shows the load shapes induced by shear loads on the TP sample. As for the tension discussed above, the VERTEX model managed to capture the specific complex load shapes whereas the ideal model captured the general idea but failed to represent relevant specificities. In particular, the VERTEX bench generated shear mostly through V displacements applied to the left and right edges, in contrast to the U displacements that were expected to be applied additionally on the bottom and top edges to generate complete ideal shear.
The samples were modelled perfectly flat with no manufacturing defect, so mode I buckling could occur upward or downward without a clear trend, whereas experimental buckling was upward for tension and shear on TP samples. Given that the buckling direction of the sample could significantly alter the in-plane displacements observed on the upper face, the shear simulations were run with an initial flick to initiate the upward buckling, thus allowing proper comparison of in-plane displacements separately from the buckling direction issue. Likewise, the substantial discrepancy between experimental and simulated out-of-plane amplitudes was attributed to the unmodeled initial curvature of the real samples, which were initially curved upward by approximately 2 mm in their center. Numerically simulated in-plane displacement amplitudes were also substantially lower than those found in experiments for the same useful force flux. This lack of experimental stiffness was also attributed to the samples' initial curvatures and to variable backlash take-up issues.
Finally, Figure 31 compares the VERTEX model and the ideal boundary model, exploiting the non-modelling of sample defects to clearly observe shear buckling and subsequent tension-shear coupling in post-buckling. The ideal shear simulated shows a characteristic Wagner behavior: before buckling the imposed shear displacement gives pure shear flux, then, after buckling, the additional loading gives an additional combination of tension and shear fluxes. For the VERTEX shear simulated on the TP sample, the same Wagner effect was observed. However, there was an additional tension bias from the start. The ALU-shear has been added to Figure 31 because it did not buckle, therefore it also gives an insight into the VERTEX's tension-shear coupling independently of the Wagner effect. Hence, the confrontation of the two models explains that, additionally to the Wagner effect, the VERTEX bench behavior enforces a tension coupled to shear when jacks 3-4 are pushed.
5. Case Studies
The transfer function of the VERTEX test rig was chosen to be implemented with Finite Element modelling, to extend the domain of application (geometry, material, defects). This section is a brief presentation of the model capabilities regarding its virtual testing capabilities, rather than a development of results of case studies.
The model of the VERTEX test rig is capable of investigating plasticization and failure on any part, since they are all meshed with Finite Elements. This is especially relevant for the flanks and the bottom face of the central BOX because these parts were designed to undergo plasticization and to be replaceable. The model is also capable of evaluating bolts load distribution. Figure 32 shows the radial force of each connector element, representing the radial local force going through the screws. Specifically, Figure 32 shows radial forces on the sample bolts, and, notably, a load concentration on the corner bolts (see red points on the tab tips).
Figure 33 shows modelling of fillets on the sample corners, inspired from cruciform samples [56] and experience from shear deformable square tests, which is an ongoing investigation to avoid corner failures in shear tests [47]. The numerical investigation of this configuration had three main goals: i) to verify the negligible impact of the new geometry on load shapes on the useful part of the sample, ii) secondly to investigate bearing occurrences on the sample's remaining bolting holes, and iii) to optimize the geometry of the filleted corners to avoid corner failures. Meshing was refined on the tab region and especially on the contours of the relevant holes to obtain meaningful results regarding the sample's bearing failure. As mentioned earlier (Figure 21), the coupling between a connector and a sample hole was anchoring on all peripheral nodes of the hole meshing. This feature was introduced precisely with a view to meaningful bearing evaluation on the holes of samples. Since the compression of the bolts tightening is not modelled, the bolt radial load is mostly transferred as bearing instead of friction, so the maximum radial loads of the bolts give conservative values for the composite bearing.
Figure 34 focuses on the strain along the fiber direction, for the most critical ply of the TSs sample under shear (ply #2 at -45°). Meshing refinement around the notch tips was too coarse for the failure mechanisms to be properly studied but still allowed the first failure occurrence of the specimen to be evaluated, for example with a criterion of maximum fiber strain. Figure 35 plots the maximum strain evolution for a tension loading, with the VERTEX model and with the ideal boundary condition model: for the same equivalent flux [47] on the same sample, the VERTEX case generated higher strains than the ideal boundary conditions. This is a first step towards assessing the relative severities of load shapes but this issue needs a specific study because the severity interpreted depends on the failure criterion and the metric used to quantify the nature and intensity of loading [47]. For the example of Figure 35, the overall multi-directional loading intensity is quantified by the equivalent flux, which is the quadratic norm of force fluxes in the principal directions: Neq=√(NI2+NII2).
The VERTEX model can also be solved with a linear buckling approach to estimate the sample's buckling mode shapes and critical values (Figure 36). Twenty-three shear buckling modes were found with critical loads below the failure load. The first two modes were found to have small and similar critical loads compared with failure loads of interest, which were higher by an order of magnitude.
6. Conclusion and Perspectives
In this paper the VERTEX test bench was numerically modelled with Finite Elements using an explicit scheme to implement a predictive transfer function, that is the knowledge of the sample loading (boundary conditions' shape and amplitude) from the displacement setpoints applied to the bench actuators. This relation is complex because the VERTEX bench is a compliant structure, in order to load the sample so that it is representative of large structure sections.
A special modelling effort was made concerning bolted joints, because their stiffnesses were found to have a major impact on the transfer function. Each bolted joint of the test bench structure was modelled with connector elements and coupling interactions, binding the modelled part together. A sensitivity analysis was performed to evaluate relevant parameters (axial/radial stiffness, SAMPLE/BOX/BEAM region) for the transfer function. Tension and shear loadings on two different samples (TSs and ALU) were considered to identify stiffness parameters on a large range of past tests.
Afterwards, the VERTEX model and a reference model (ideal boundary conditions) were compared with VERTEX experiments, on TP samples under tension and shear. The VERTEX model was found to produce good predictions of the load amplitudes and of the complex load shapes. However, the ideal boundary condition model did not manage to properly grasp load shape features and it did not give any notion of amplitude prediction. The complex modelling effort of the VERTEX test bench was therefore necessary to be able to represent the load shape of such a structurally embedding bench.
Ultimately, application cases were shown to demonstrate the scalability of the chosen modelling complexity. The model allowed structural phenomenology to be investigated and failure to be evaluated on any configuration, especially at the notch in the sample. The bench modelling is essential to better understand such structural element tests, which are still generic but more representative than coupon tests and cheaper than large scale structure tests.
Other applications of the VERTEX model are also possible and currently being studied, such as an exploration of the failure envelopes with non-proportional loadings in the tension-shear domain. Other ongoing research is studying the debonding of stiffened samples under loading after impact. These two applications are tackling important validation points of aircraft sizing. Thus, it is of interest to study them with intermediate-scale tests/simulations, representative of larger structural experiments. The bench modelling allows complex/costly tests to be better prepared, and a true test-simulation dialogue to take place.
Author Contributions
Conceptualization, Florent Grotto, Oscar Peta, Christophe Bouvet, Bruno Castanié, Joël Serra; methodology, Florent Grotto, Oscar Peta, Christophe Bouvet, Bruno Castanié, Joël Serra; software, Florent Grotto, Oscar Peta, Joël Serra; validation, Florent Grotto, Oscar Peta, Christophe Bouvet, Bruno Castanié, Joël Serra; formal analysis, Florent Grotto, Oscar Peta, Christophe Bouvet, Bruno Castanié, Joël Serra; investigation, Florent Grotto, Oscar Peta, Christophe Bouvet, Bruno Castanié, Joël Serra; resources, Florent Grotto, Oscar Peta, Christophe Bouvet, Bruno Castanié, Joël Serra; data curation, Florent Grotto, Oscar Peta, Joël Serra; writing—original draft preparation, Florent Grotto, Oscar Peta; writing—review and editing, Florent Grotto, Oscar Peta, Christophe Bouvet, Bruno Castanié, Joël Serra; visualization, Florent Grotto, Oscar Peta; supervision, Christophe Bouvet, Bruno Castanié, Joël Serra; project administration, Joël Serra; funding acquisition, Joël Serra. All authors have read and agreed to the published version of the manuscript.
Funding
This work was funded by the “Fondation Jean-Jacques et Felicia Lopez-Loreta pour l’Excellence Académique” as part of the VIRTUOSE (VIRTUal testing of aerOnautical StructurEs) project (https://websites.isae-supaero.fr/virtuose/).
Acknowledgments
The academic authors gratefully acknowledge Airbus contribution. The authors would like to duly thank CALMIP High Performance Computing platform (https://www.calmip.univ-toulouse.fr) for providing the computational means required to conduct the numerical simulations under the project reference p1026.).
Conflicts of Interest
Declare conflicts of interest or state “The authors declare no conflict of interest.”
References
- Rouchon, J. 1990. Certification of large airplane composite structures, https://www.icas.org/ICAS_ARCHIVE/ICAS1990/ICAS-90-1.8.1.
- Thomsen, O., J. Dulieu-Barton, S. Halett, and R. Butler. 2022. Validation of Composite Aerostructures through Integrated Multi-Scale Modelling and High-Fidelity Substructure Testing Facilitated by Design of Experiments and Bayesian learning. presented at the ECCM 20, Lausanne, Switzerland.
- Sola, C. B. Castanié, L. Michel, F. Lachaud, A. Delabie, and E. Mermoz. 2016. On the role of kinking in the bearing failure of composite laminates. Compos. Struct., vol. 141, pp. 184–193. [CrossRef]
- Castanié, B., S. Crézé, J. J. Barrau, F. Lachaud, and L. Risse. 2009. Experimental analysis of failures in filled hole compression tests of carbon/epoxy laminate. Compos. Struct., vol. 92, no. 5, pp. 1192–1199, Apr. 2010. [CrossRef]
- Montagne, B., F. Lachaud, E. Paroissien, D. Martini, and F. Congourdeau. 2020. Failure analysis of single lap composite laminate bolted joints: Comparison of experimental and numerical tests. Compos. Struct., vol. 238, p. 111949, Apr. 2020. [CrossRef]
- Journoud, P., C. Bouvet, B. Castanié, F. Laurin, and L. Ratsifandrihana. 2020. Experimental and numerical analysis of unfolding failure of L-shaped CFRP specimens. Compos. Struct., vol. 232, p. 111563. [CrossRef]
- Bertolini, J., B. Castanié, J.-J. Barrau, and J.-P. Navarro. 2009a. Multi-level experimental and numerical analysis of composite stiffener debonding. Part 1: Non-specific specimen level. Compos. Struct., vol. 90, no. 4, pp. 381–391. [CrossRef]
- Bertolini, J., B. Castanié, J.-J. Barrau, J.-P. Navarro, and C. Petiot. 2009b. Multi-level experimental and numerical analysis of composite stiffener debonding. Part 2: Element and panel level. Compos. Struct., vol. 90, no. 4, pp. 392–403. [CrossRef]
- Toral-Vasquez, J., B. Castanié, J.-J. Barrau, and N. Swiergiel. 2011a. Multi-level analysis of low -cost Z-pinned composite junctions. Part 1 : SINGLE Z-PIN BEHAVIOR. Compos. Part Appl. Sci. Manuf., vol. 42, no. 12, pp. 2070–2081. [CrossRef]
- Toral-Vasquez, J., B. Castanié, J.-J. Barrau, and N. Swiergiel. 2011b. Multi-level analysis of low -cost Z-pinned composite junctions. Part 2: Joint Behavior. p. 41.
- Meeks, C., E. Greenhalgh, and B. G. Falzon. 2004. Stiffener debonding mechanisms in post-buckled CFRP aerospace panels. Compos. Part Appl. Sci. Manuf., vol. 36, no. 7, pp. 934–946. [CrossRef]
- Leon-Dufour, J.-L. 2008. Dimensionnement des structures composites aux dommages. presented at the Journée de l’Association Aéronautique et Astronautique de France - 3AF, CNES, Toulouse, Airbus.
- Harris, C. E., J. H. Starnes, and M. J. Shuart. 2002. Design and Manufacturing of Aerospace Composite Structures, State-of-the-Art Assessment. J. Aircr., vol. 39, no. 4, pp. 545–560. [CrossRef]
- Codolini, A., Q. M. Li, and A. Wilkinson. 2018. Mechanical characterization of thin injection-moulded polypropylene specimens under large in-plane shear deformations. Polym. Test., vol. 69, pp. 485–489. [CrossRef]
- Gan, K. W., T. Laux, S. T. Taher, J. M. Dulieu-Barton, and O. T. Thomsen. 2018. A novel fixture for determining the tension/compression-shear failure envelope of multidirectional composite laminates. Compos. Struct., vol. 184, pp. 662–673. [CrossRef]
- Lin, S. B., J. L. Ding, H. M. Zbib, and E. C. Aifantis. 1993. Characterization of yield surfaces using balanced biaxial tests of cruciform plate specimens. Scr. Metall. Mater., vol. 28, no. 5, pp. 617–622. [CrossRef]
- Lucía Zumaquero, P., E. Correa, J. Justo, and F. París. 2022. Transverse biaxial tests on long fibre reinforced composites. Compos. Struct., vol. 297, p. 115868. [CrossRef]
- Moncy, A., O. Castro, C. Berggreen, and H. Stang. 2021. Understanding the effect of anisotropy in composite materials on the performance of cruciform specimens. Compos. Struct., vol. 273, p. 114225. [CrossRef]
- Shahverdi Moghaddam, H., S. R. Keshavanarayana, D. Ivanov, C. Yang, and A. L. Horner. 2021. In-plane shear response of a composite hexagonal honeycomb core under large deformation – A numerical and experimental study. Compos. Struct., vol. 268, p. 113984. [CrossRef]
- Damghani, M., R. A. Pir, A. Murphy, and M. Fotouhi. 2022. Experimental and numerical study of hybrid (CFRP-GFRP) composite laminates containing circular cut-outs under shear loading. Thin-Walled Struct., vol. 179, p. 109752. [CrossRef]
- Li, X., W. Gao, and W. Liu. 2015. Post-buckling progressive damage of CFRP laminates with a large-sized elliptical cutout subjected to shear loading. Compos. Struct., vol. 128, pp. 313–321. [CrossRef]
- Hopgood, P., J. Cook, and A. Clarke. 1999. Multi-axial testing of planar composite specimens. Proc. 12th Int. Conf. Compos. Mater. Paris Fr., pp. 5–9.
- Boehler, J. P., S. Demmerle, and S. Koss. 1994. A new direct biaxial testing machine for anisotropic materials. Exp. Mech., vol. 34, no. 1, pp. 1–9. [CrossRef]
- Soto, A., E. V. González, P. Maimí, J. A. Mayugo, P. R. Pasquali, and P. P. Camanho. 2018. A methodology to simulate low velocity impact and compression after impact in large composite stiffened panels. Compos. Struct., vol. 204, pp. 223–238. [CrossRef]
- Feng, Y., S. Liu, T. Zhang, and S. Jiao. 2022. Experimental and theoretical investigation on the shear performance of stiffened composite panel with I-shaped stiffeners. Compos. Struct., vol. 284, p. 115234. [CrossRef]
- Wu, X., Q. Chen, B. Zhao, K. Zhang, P. Wang, and Z. Yue. 2022. Experimental behavior and shear bearing capacity simulation of stiffened composite panels subjected to invisible damage impact. Thin-Walled Struct., vol. 178, p. 109454. [CrossRef]
- Carpiuc-Prisacari, A., M. Poncelet, K. Kazymyrenko, H. Leclerc, and F. Hild. 2017a. A complex mixed-mode crack propagation test performed with a 6-axis testing machine and full-field measurements. Eng. Fract. Mech., vol. 176, pp. 1–22. [CrossRef]
- Carpiuc-Prisacari, A., M. Poncelet, K. Kazymyrenko, F. Hild, and H. Leclerc. 2017b. Comparison between experimental and numerical results of mixed-mode crack propagation in concrete: Influence of boundary conditions choice. Cem. Concr. Res., vol. 100, pp. 329–340. [CrossRef]
- Fields, R. A., W. L. Richards, and M. V. DeAngelis. 2004. Combined Loads Test Fixture for Thermal-Structural Testing Aerospace Vehicle Panel Concepts. H-2488. https://ntrs.nasa. 2004. [Google Scholar]
- Bergan, A., J. Bakuckas, J. Awerbuch, and T.-M. Tan. 2014. Assessment of damage containment features of a full-scale PRSEUS fuselage panel. Compos. Struct., vol. 113, pp. 174–185. [CrossRef]
- Rouse, M. and D. Anbur. 1995. Fuselage response simulation of stiffened panels using a pressure-box test machine. in 36th Structures, Structural Dynamics and Materials Conference, New Orleans, LA, U.S.A. [CrossRef]
- Arabzadeh, A., M. Soltani, and A. Ayazi. 2011. Experimental investigation of composite shear walls under shear loadings. Thin-Walled Struct., vol. 49, no. 7, pp. 842–854. [CrossRef]
- Kaufmann, W., A. Beck, D. Karagiannis, and D. Werne. 2019. The Large Universal Shell Element Tester LUSET. ETH Zurich, Report. [CrossRef]
- French C., W. et al. 2002. Multi-axial subassemblage testing (MAST) system: description and capabilities. Porceedings 13th WCEE, Vancouver, British Columbia, Canada, p. 12.
- Serra, J., J. E. Pierré, J.C. Passieux, J.N. Périé, C. Bouvet, B. Castanié, and C. Petiot. 2017a. Validation and modeling of aeronautical composite structures subjected to combined loadings: The VERTEX project. Part 2: Load envelopes for the assessment of panels with large notches. Compos. Struct., vol. 180, pp. 550–567. [CrossRef]
- Serra, J., J. E. Pierré, J. C. Passieux, J. N. Périé, C. Bouvet, and B. Castanié. 2017b. Validation and modeling of aeronautical composite structures subjected to combined loadings: The VERTEX project. Part 1: Experimental setup, FE-DIC instrumentation and procedures. Compos. Struct., vol. 179, pp. 224–244. [CrossRef]
- Peters, R. W. 1946. Buckling tests of flat rectangular plates under combined shear and longitudinal compression’. https://ntrs.nasa.gov/api/citations/19930082377/downloads/19930082377.
- Klein, H. 1989. General buckling tests with thin-walled shells.
- Castanié, B., J. -J. Barrau, and J.-P. Jaouen. 2002. Theoretical and experimental analysis of asymmetric sandwich structures. Compos. Struct., vol. 55, no. 3, pp. 295–306. [CrossRef]
- Castanié, B., J. J. Barrau, J. P. Jaouen, and S. Rivallant. 2004. Combined shear/compression structural testing of asymmetric sandwich structures. Exp. Mech., vol. 44, no. 5, pp. 461–472. [CrossRef]
- Trellu, A., G. Pichon, C. Bouvet, S. Rivallant, B. Castanié, and J. Serra. 2020. Combined loadings after medium velocity impact on large CFRP laminate plates: Tests and enhanced computation/testing dialogue. Compos. Sci. Technol., p. 108194. [CrossRef]
- Zucco, G. et al. 2018. Static Test of a Thermoplastic Composite Wingbox Under Shear and Bending Moment. in 2018 AIAA/ASCE/AHS/ASC Structures, Structural Dynamics, and Materials Conference, Kissimmee, Florida. [CrossRef]
- Zucco, G. et al. 2020. Static test of a variable stiffness thermoplastic composite wingbox under shear, bending and torsion. Aeronaut. J., vol. 124, no. 1275, pp. 635–666. [CrossRef]
- Best, R., T. Fleischer, M. Götze, M. Sachse, and M. Semsch. 2009. A Test Concept For Future Aircraft Fuselage Panels. in ICAF 2009, Bridging the Gap between Theory and Operational Practice, Dordrecht, pp. 3–14. [CrossRef]
- Rouse, M., R. D. Young, and R. E. Gehrki. 2003. Structural Stability of a Stiffened Aluminum Fuselage Panel Subjected to Combined Mechanical And Internal Pressure Loads. AIAA Pap., p. 10.
- Ge, D., Y. Mo, B. He, Y. Wu, and X. Du. 2016. Experimental and numerical investigation of stiffened composite curved panel under shear and in-plane bending. Compos. Struct., vol. 137, pp. 185–195. [CrossRef]
- Grotto, F., C. Bouvet, B. Castanié, and J. Serra. 2023. Experimental behaviour of aeronautic notched carbon fibre reinforced thermoplastic panels under combined tension-shear-pressure loadings. Eng. Fail. Anal., doi.org/10.1016/j.engfailanal.2023.107075.
- Williamson, C., J. Cook, and A. B. Clarke. 2007. Investigation into the failure of open and filled holes in CFRP laminates under biaxial loading conditions. p. 10, ed. Springer.
- Carpiuc-Prisacari, A. 2015. Innovative tests for characterizing mixed-mode fracture of concrete: from pre-defined to interactive and hybrid tests. phdthesis, Université Paris Saclay (COmUE), 2015. Accessed: Jul. 07, 2022. [Online]. Available: https://tel.archives-ouvertes. 0127. [Google Scholar]
- Sztefek, P. , and R. Olsson. 2008. Tensile stiffness distribution in impacted composite laminates determined by an inverse method. Compos. Part Appl. Sci. Manuf., vol. 39, no. 8, pp. 1282–1293. [CrossRef]
- Serra, J., C. Bouvet, B. Castanié, and C. Petiot. 2016. Scaling effect in notched composites: The Discrete Ply Model approach. Compos. Struct., vol. 148, pp. 127–143. [CrossRef]
- Dassault Systemes Simulia. 2016. Abaqus Analysis user’s Manual. V6.12., vol. 6.3.3 Explicit dynamic analysis / Bulk viscosity, [Online]. Available: http://193.136.142.5/texis/search/hilight2.html/+/usb/pt03ch06s03at08.html?CDB=v6.
- Chandregowda, S. , and G. In R. C. Reddy. 2018. Evaluation of fastener stiffness modelling methods for aircraft structural joints. presented at the ADVANCES IN MECHANICAL DESIGN, MATERIALS AND MANUFACTURE: Proceedings of the First International Conference on Design, Materials and Manufacture (ICDEM 2018), Karnataka, India; p. 020001. [CrossRef]
- Guillot, J. 2007. Modélisation et calcul des assemblages vissés. Généralités. Fonct. Compos. Mécaniques. [CrossRef]
- Wagner, H. 1928. Structures of thin sheet metal their design and construction. NACA Memo 490. https://ntrs.nasa.gov/api/citations/19930090854/downloads/19930090854.
- Smits, A., D. Van Hemelrijck, T. P. Philippidis, and A. Cardon. 2005. Design of a cruciform specimen for biaxial testing of fibre reinforced composite laminates. Compos. Sci. Technol., vol. 66, no. 7, pp. 964–975. [CrossRef]
Figure 2.
Building block approach for an aircraft wing-extensive testing of structural elements under unidirectional loadings [13].
Figure 2.
Building block approach for an aircraft wing-extensive testing of structural elements under unidirectional loadings [13].
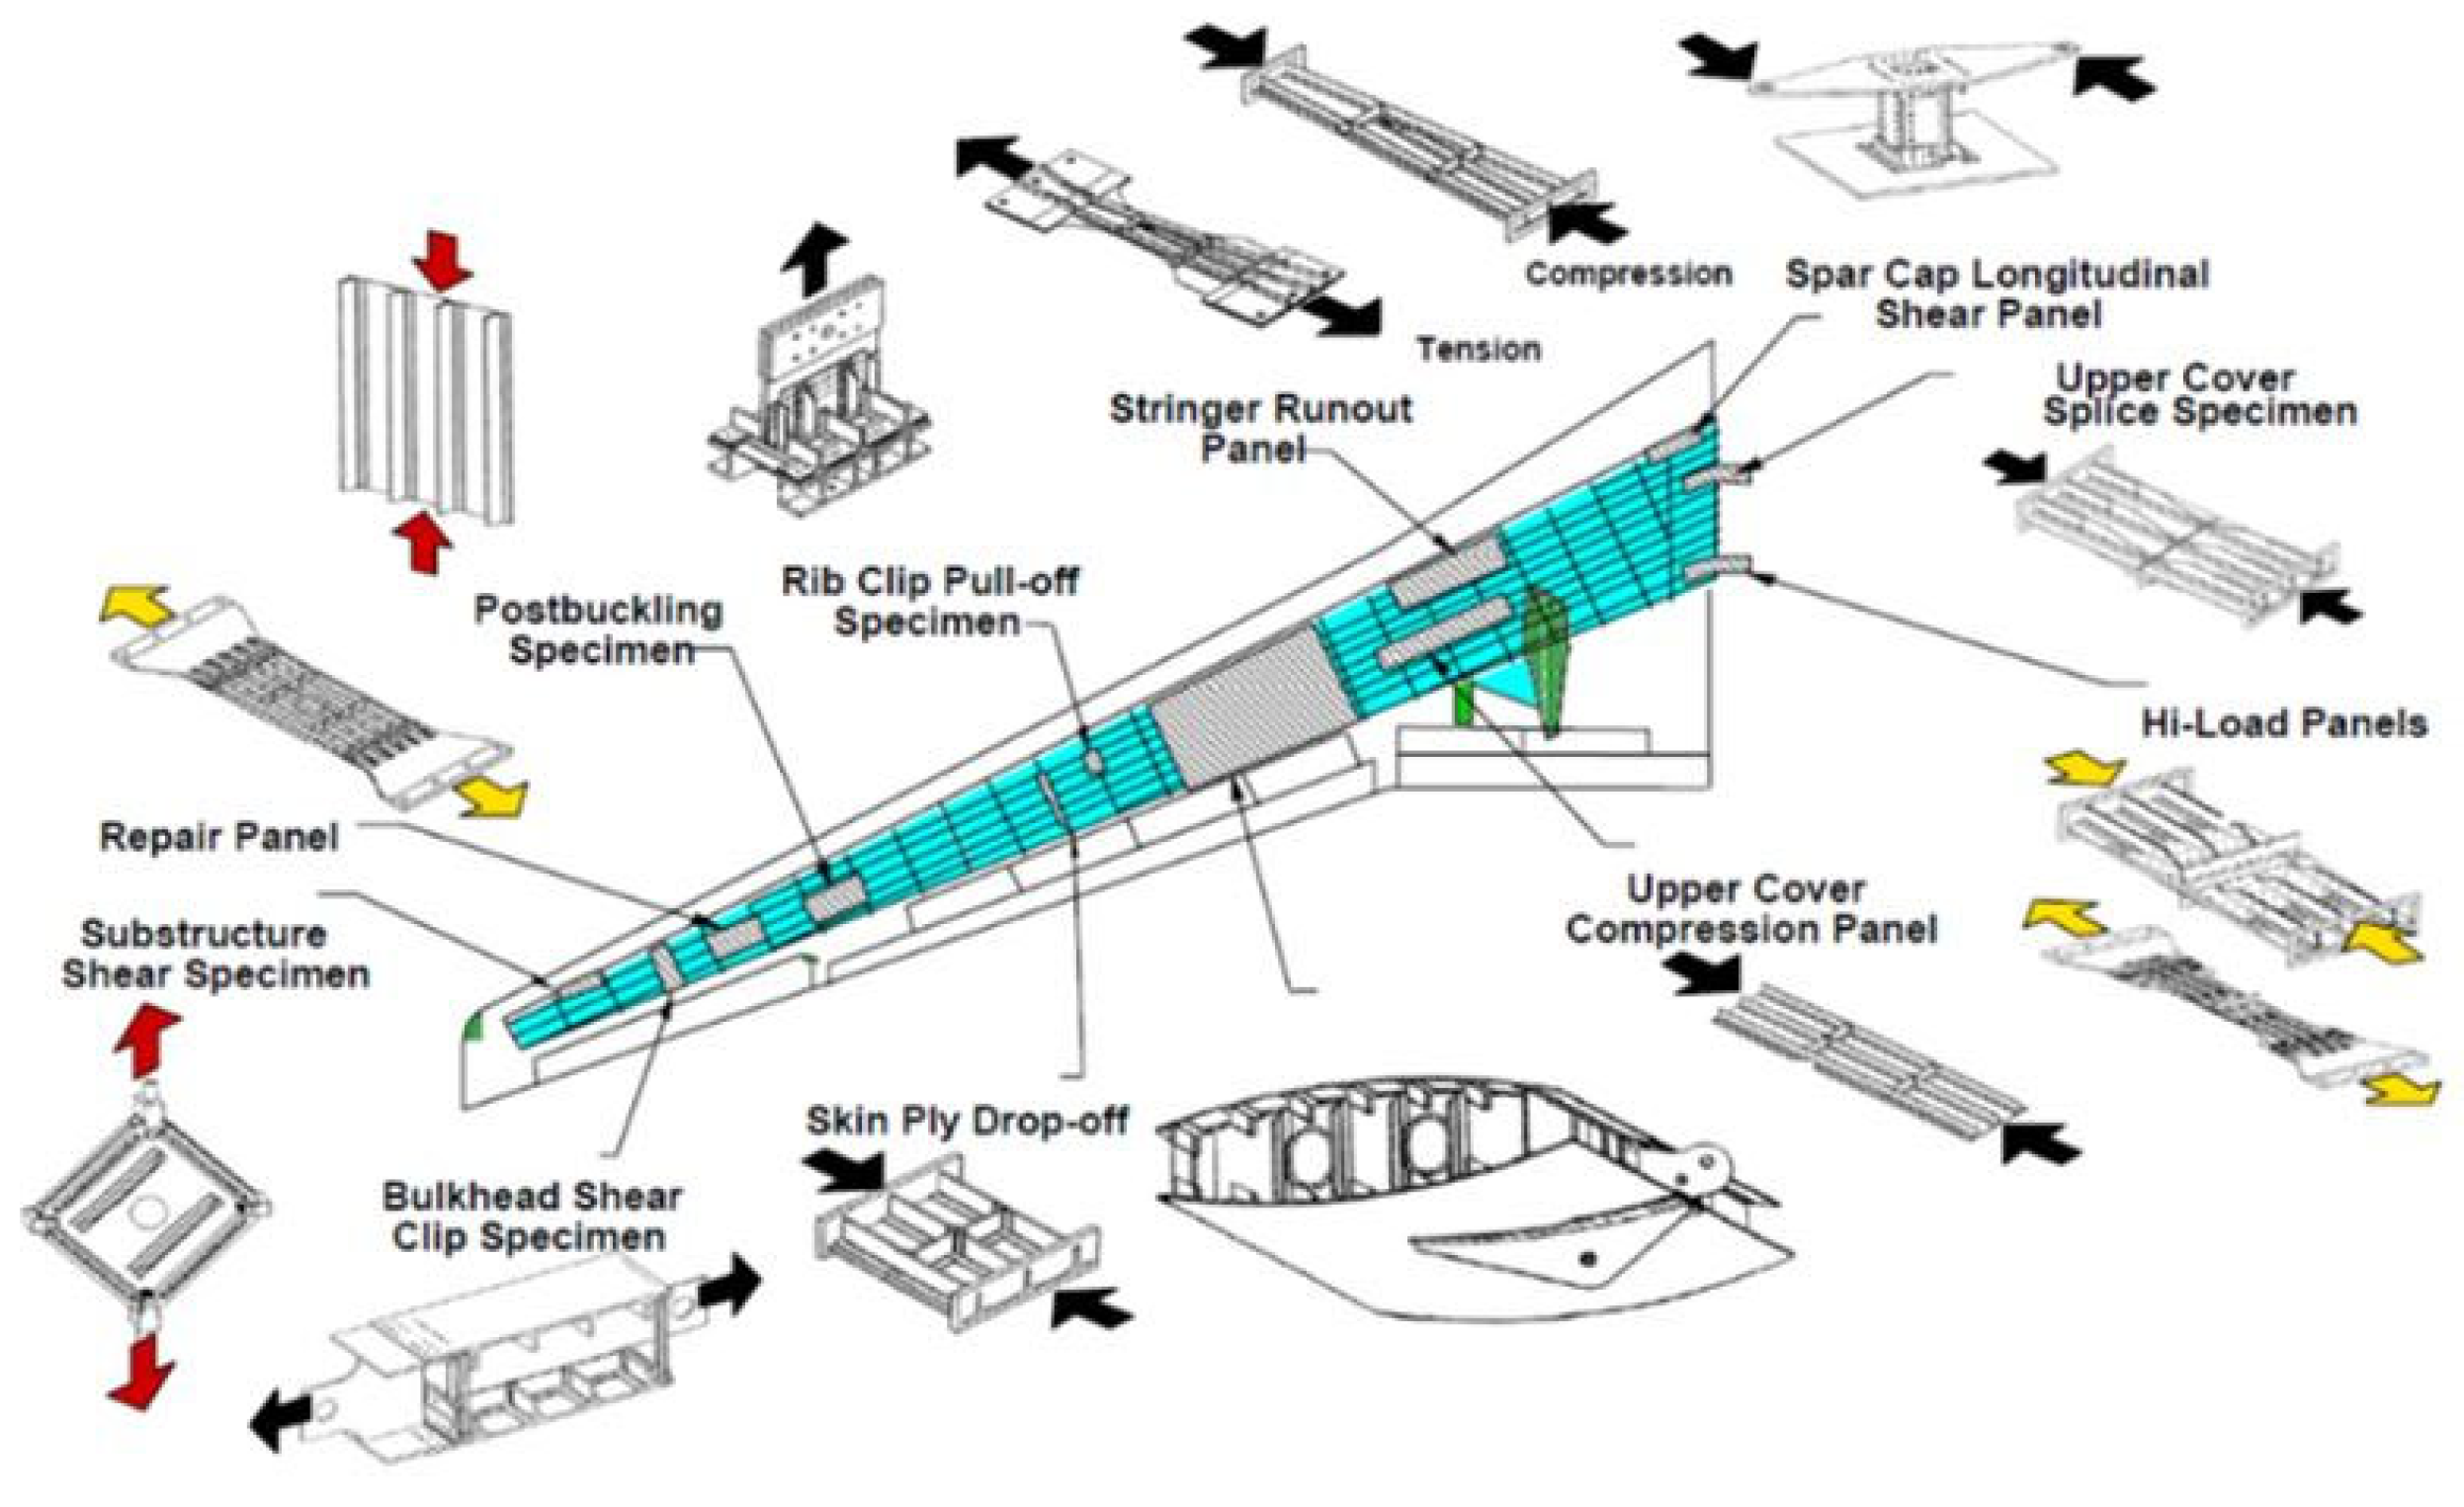
Figure 3.
Test benches from the aerospace field with direct actuation of the sample: a) shear deformable square test enriched with tension/compression combination capability [29], b) internal pressure combined with tension and shear applied by numerous actuators on the large curved panel [30], c) internal pressure and tension with few actuators on a curved panel [31].
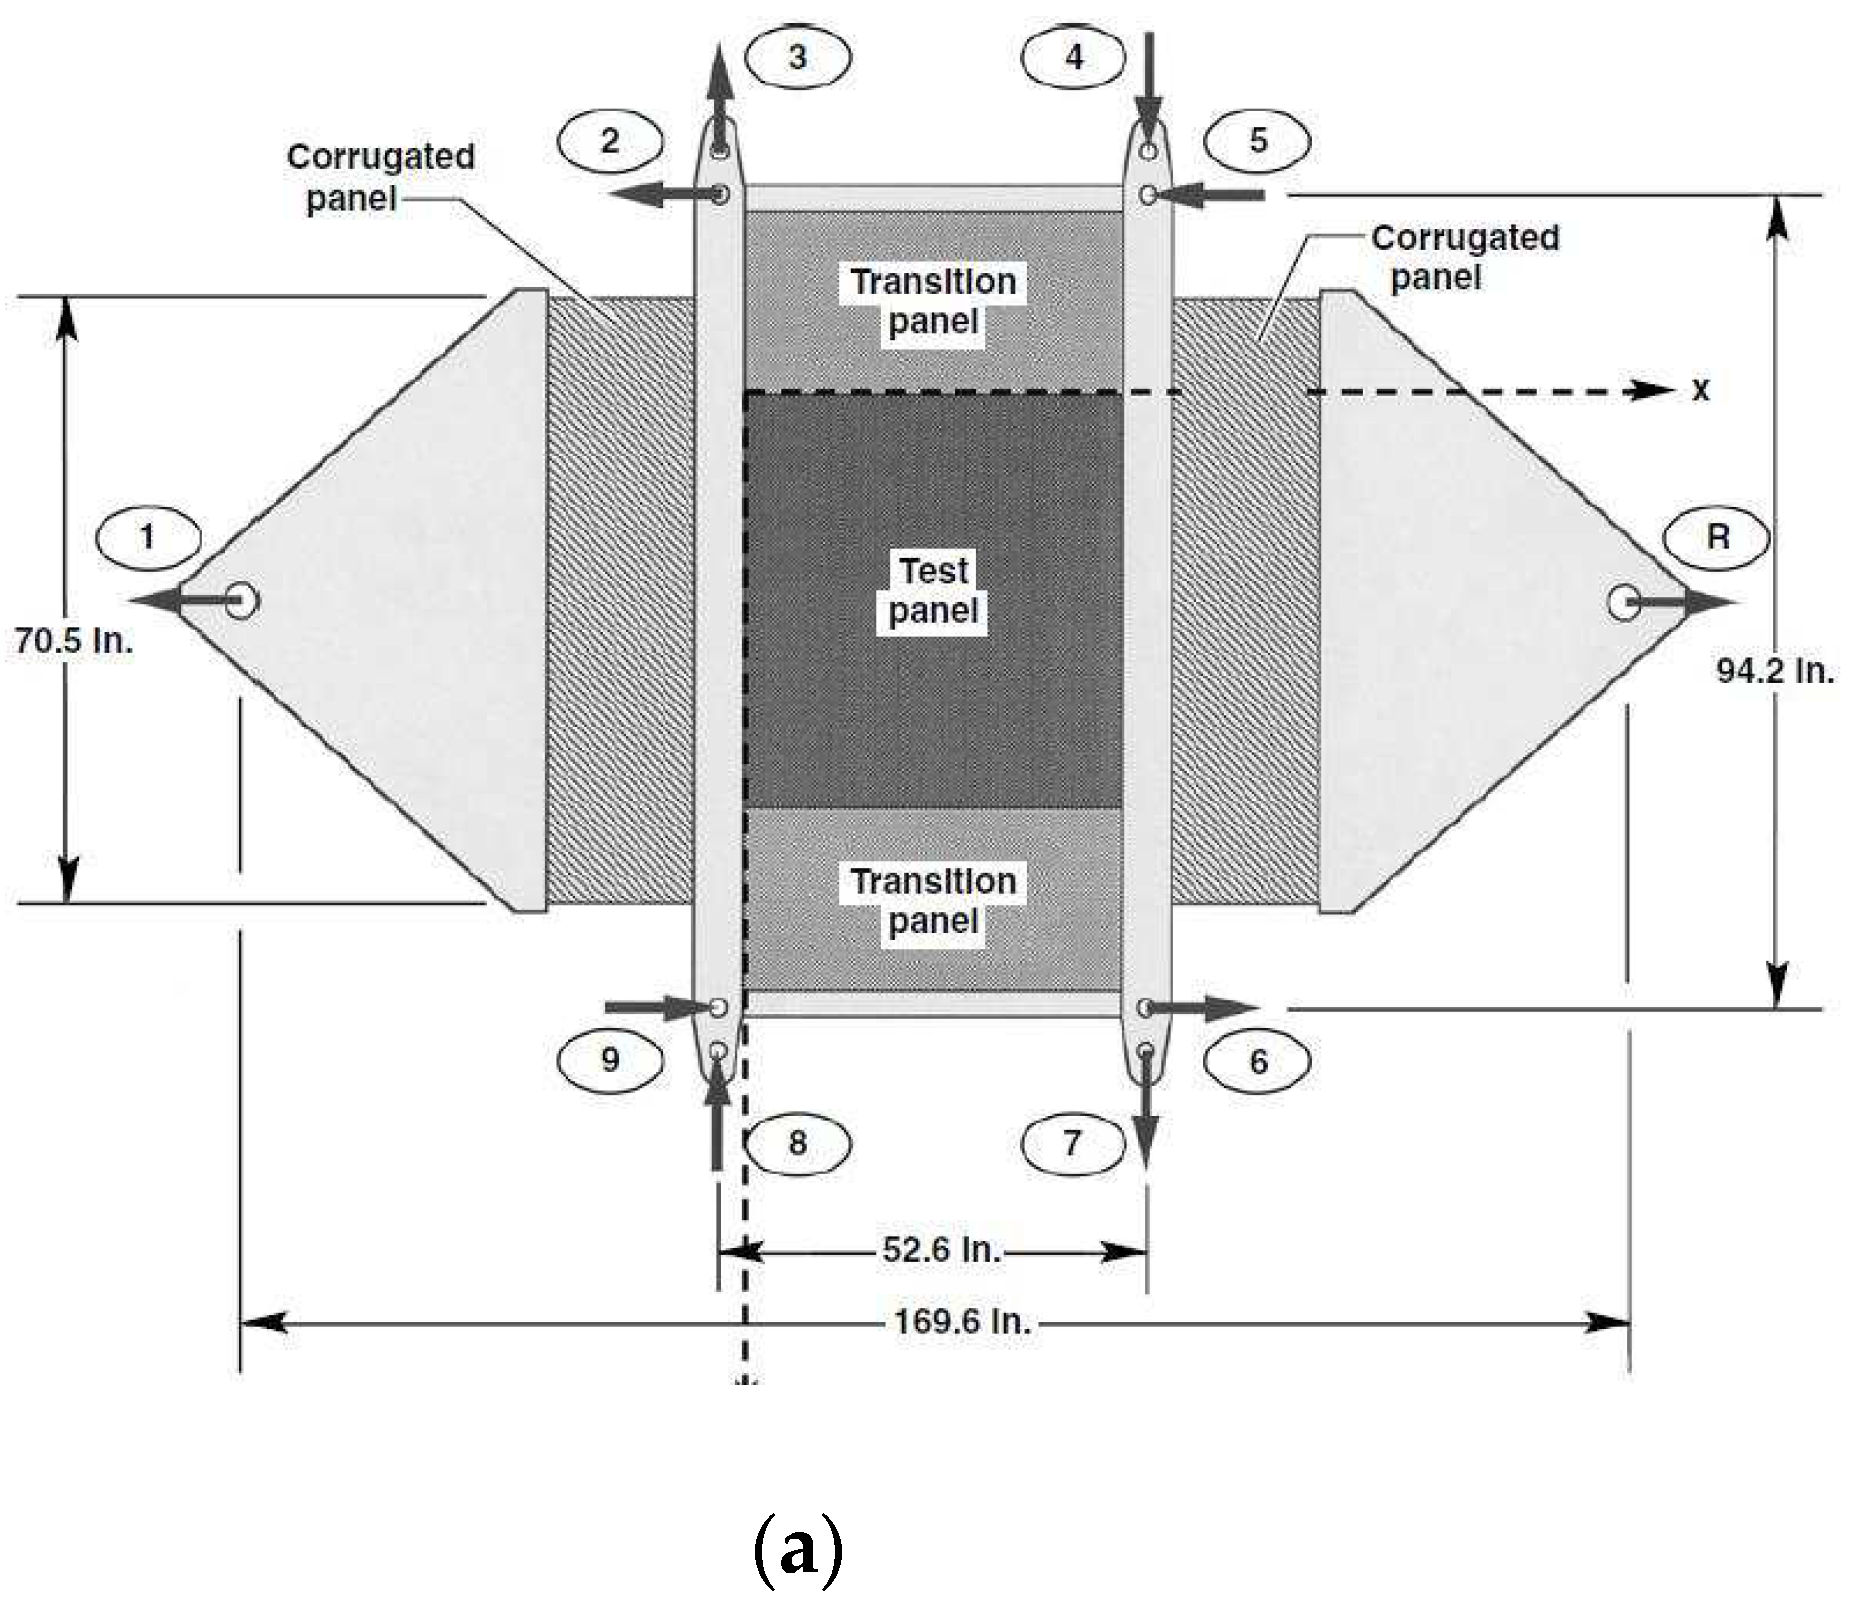
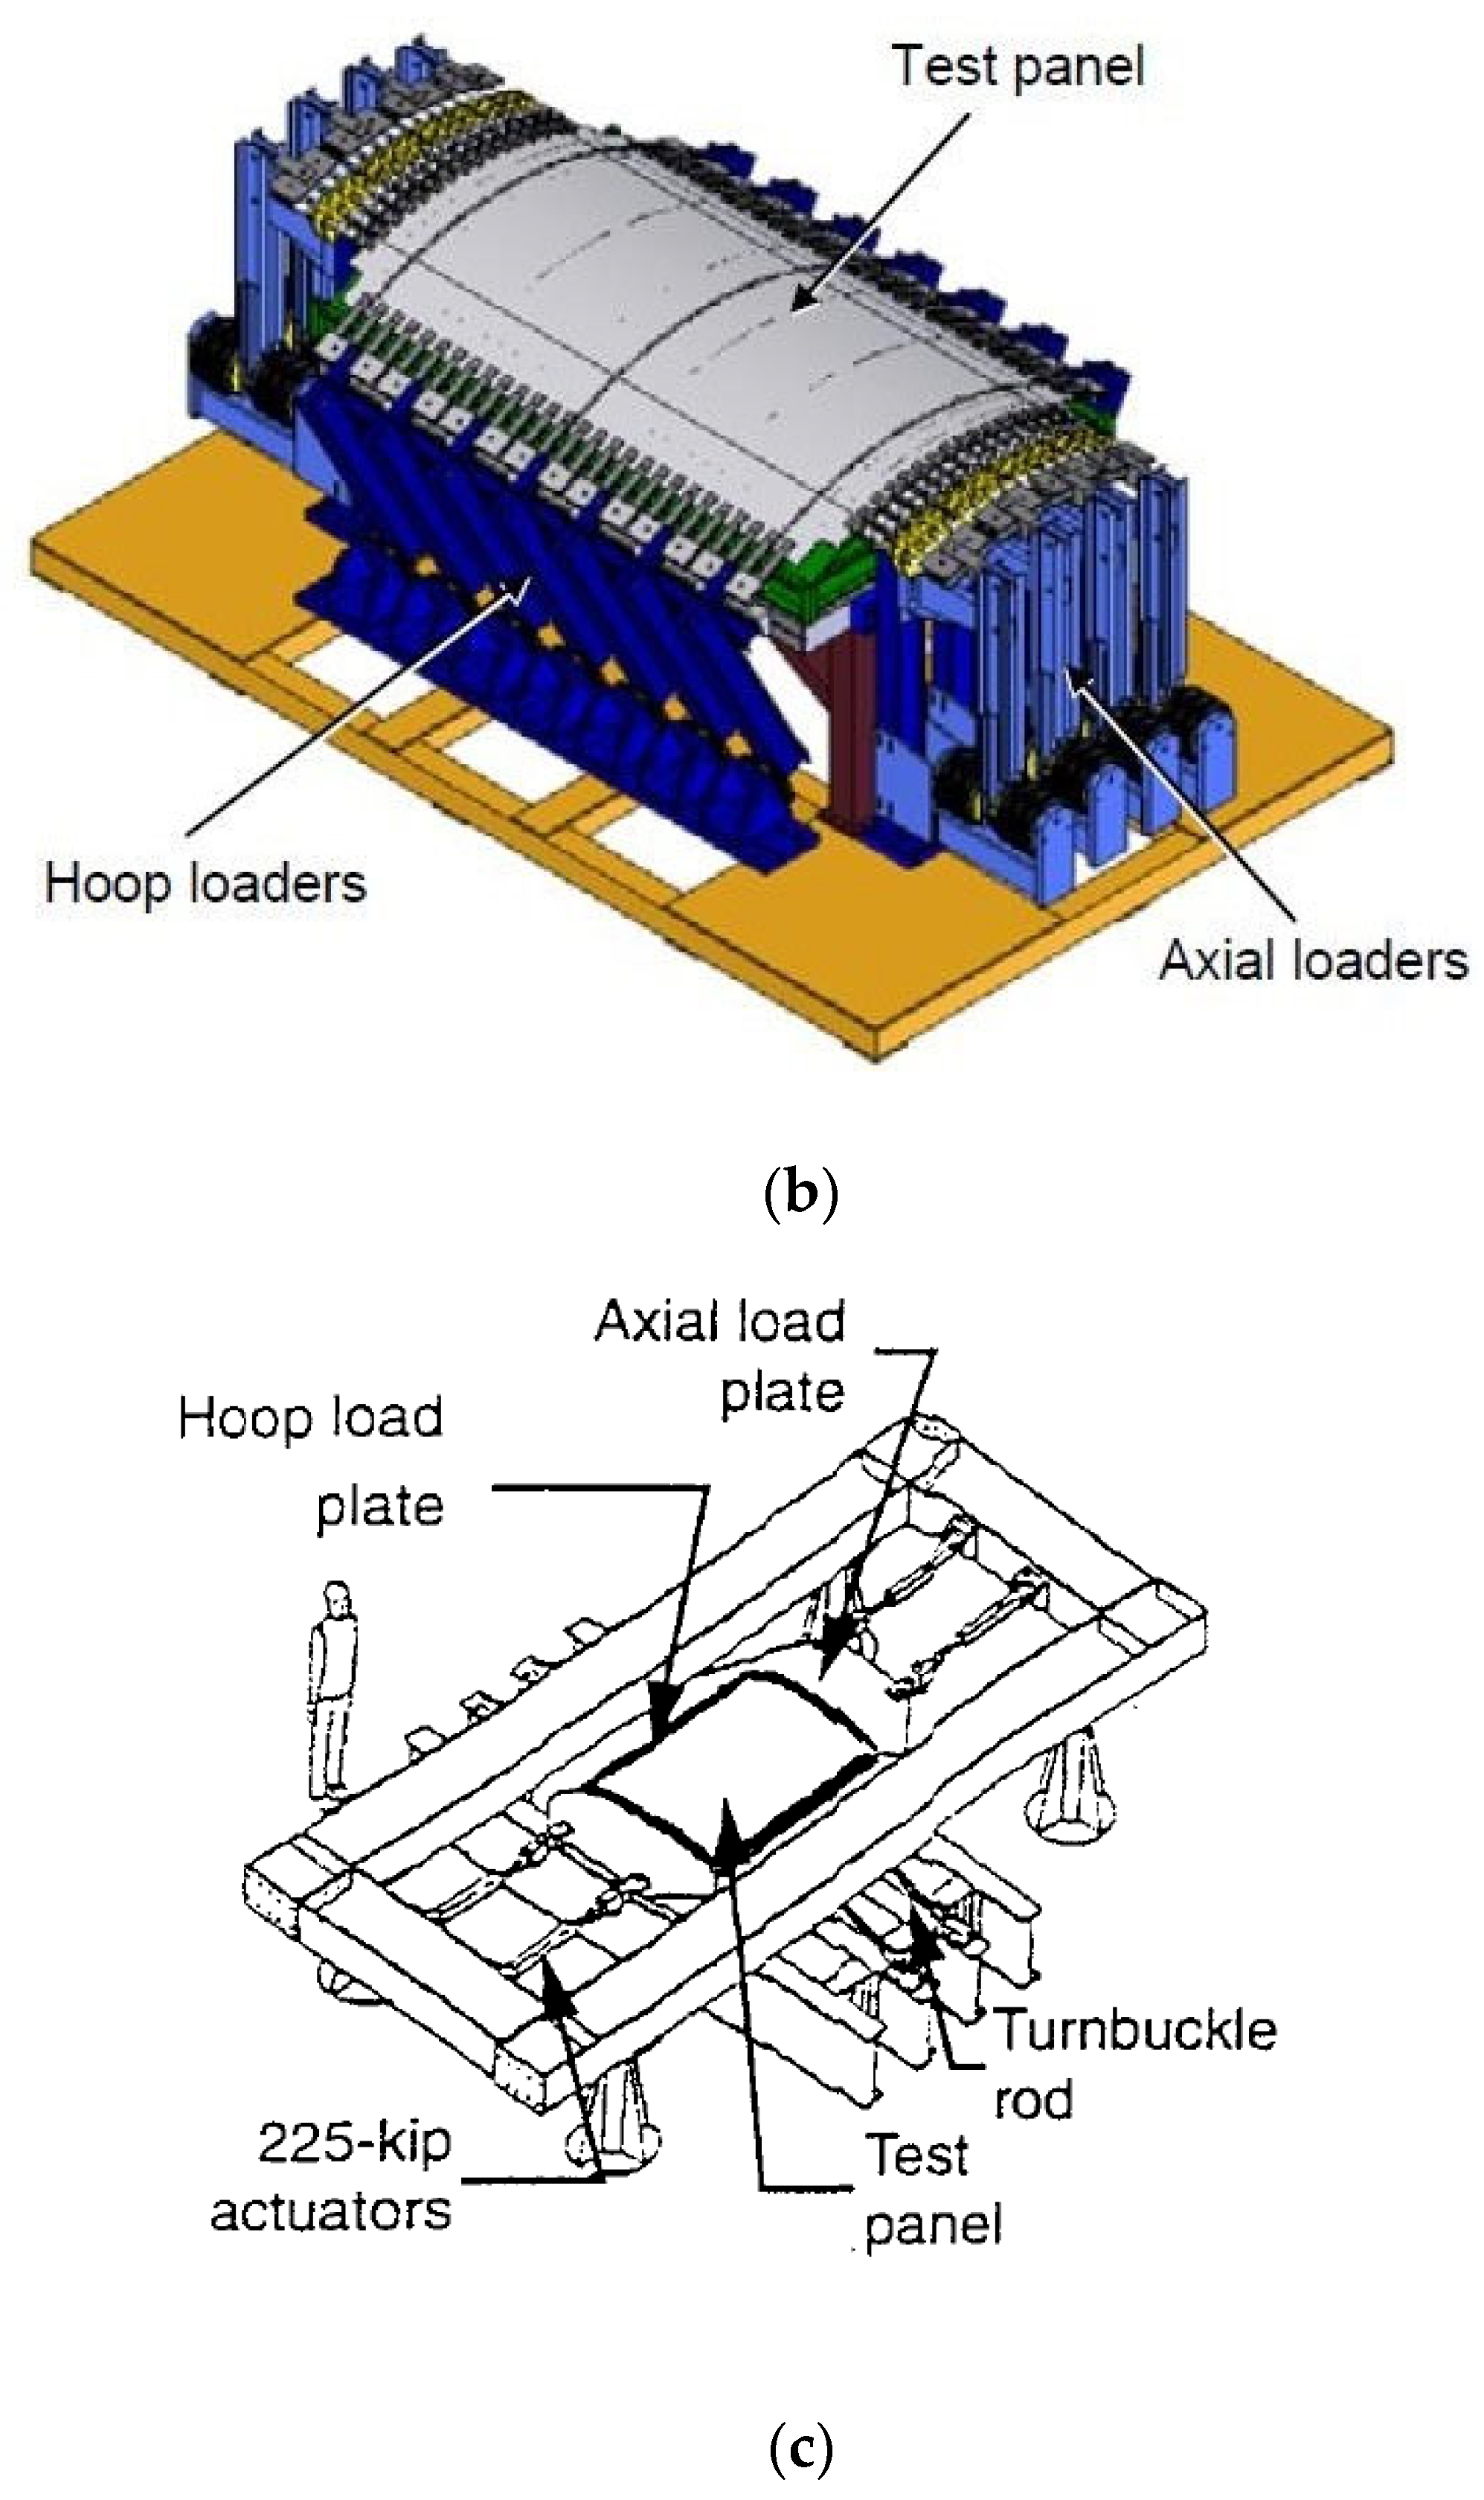
Figure 4.
Test benches from the civil engineering field with direct actuation of the sample: a) deformable square test on a wall specimen [32], b) numerous actuators to directly load the sample in plane and out-of-plane [33], c) few actuators to enforce load combinations on the sample through a rigid intermediate structure [34].
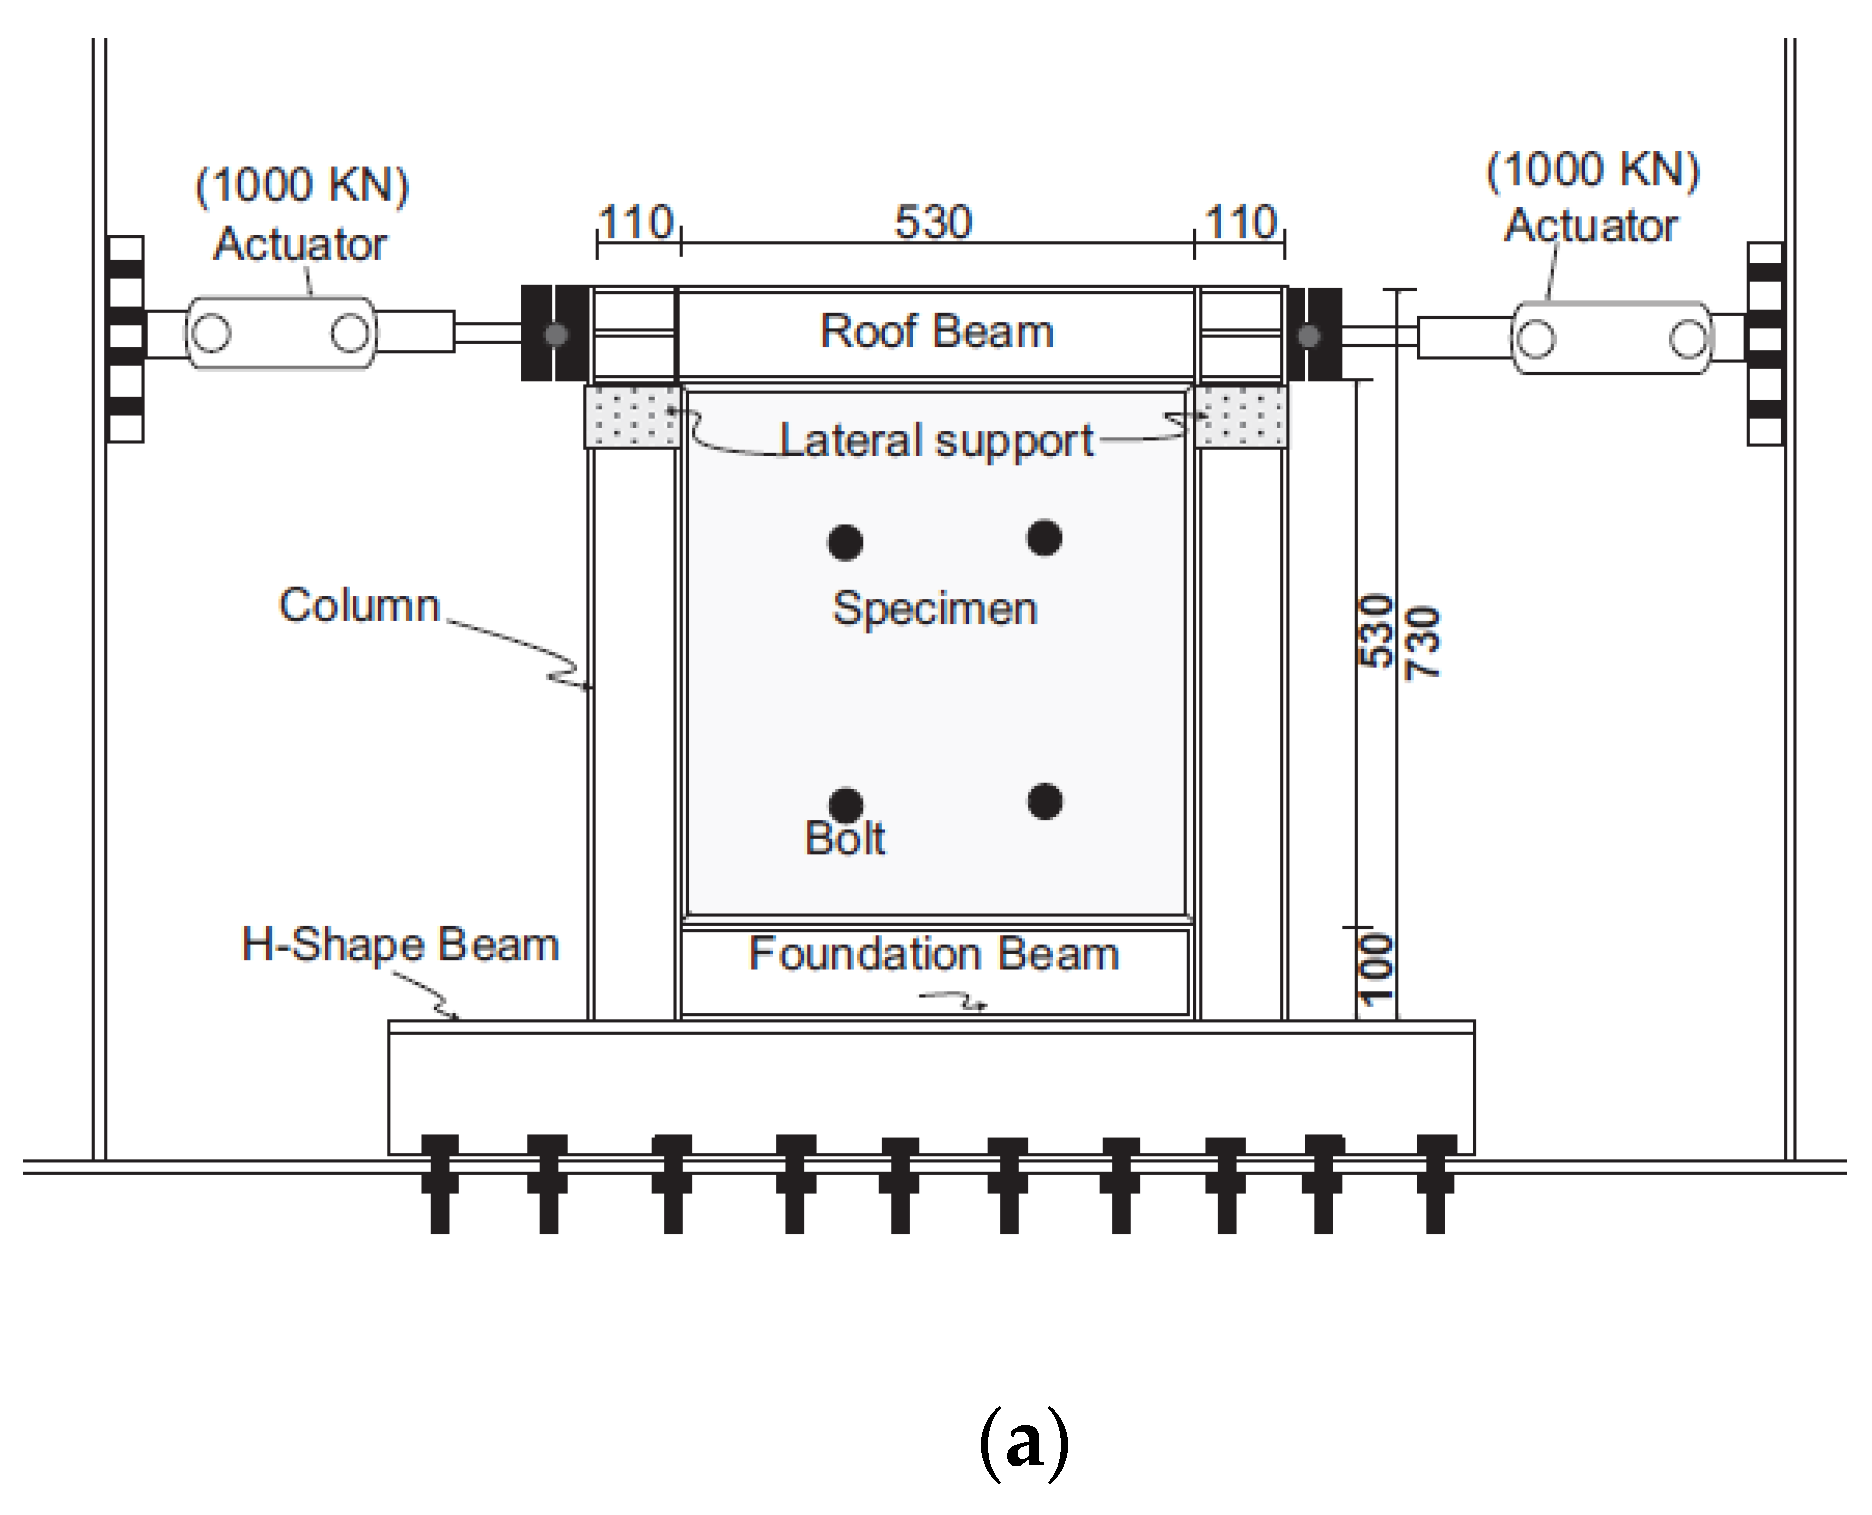
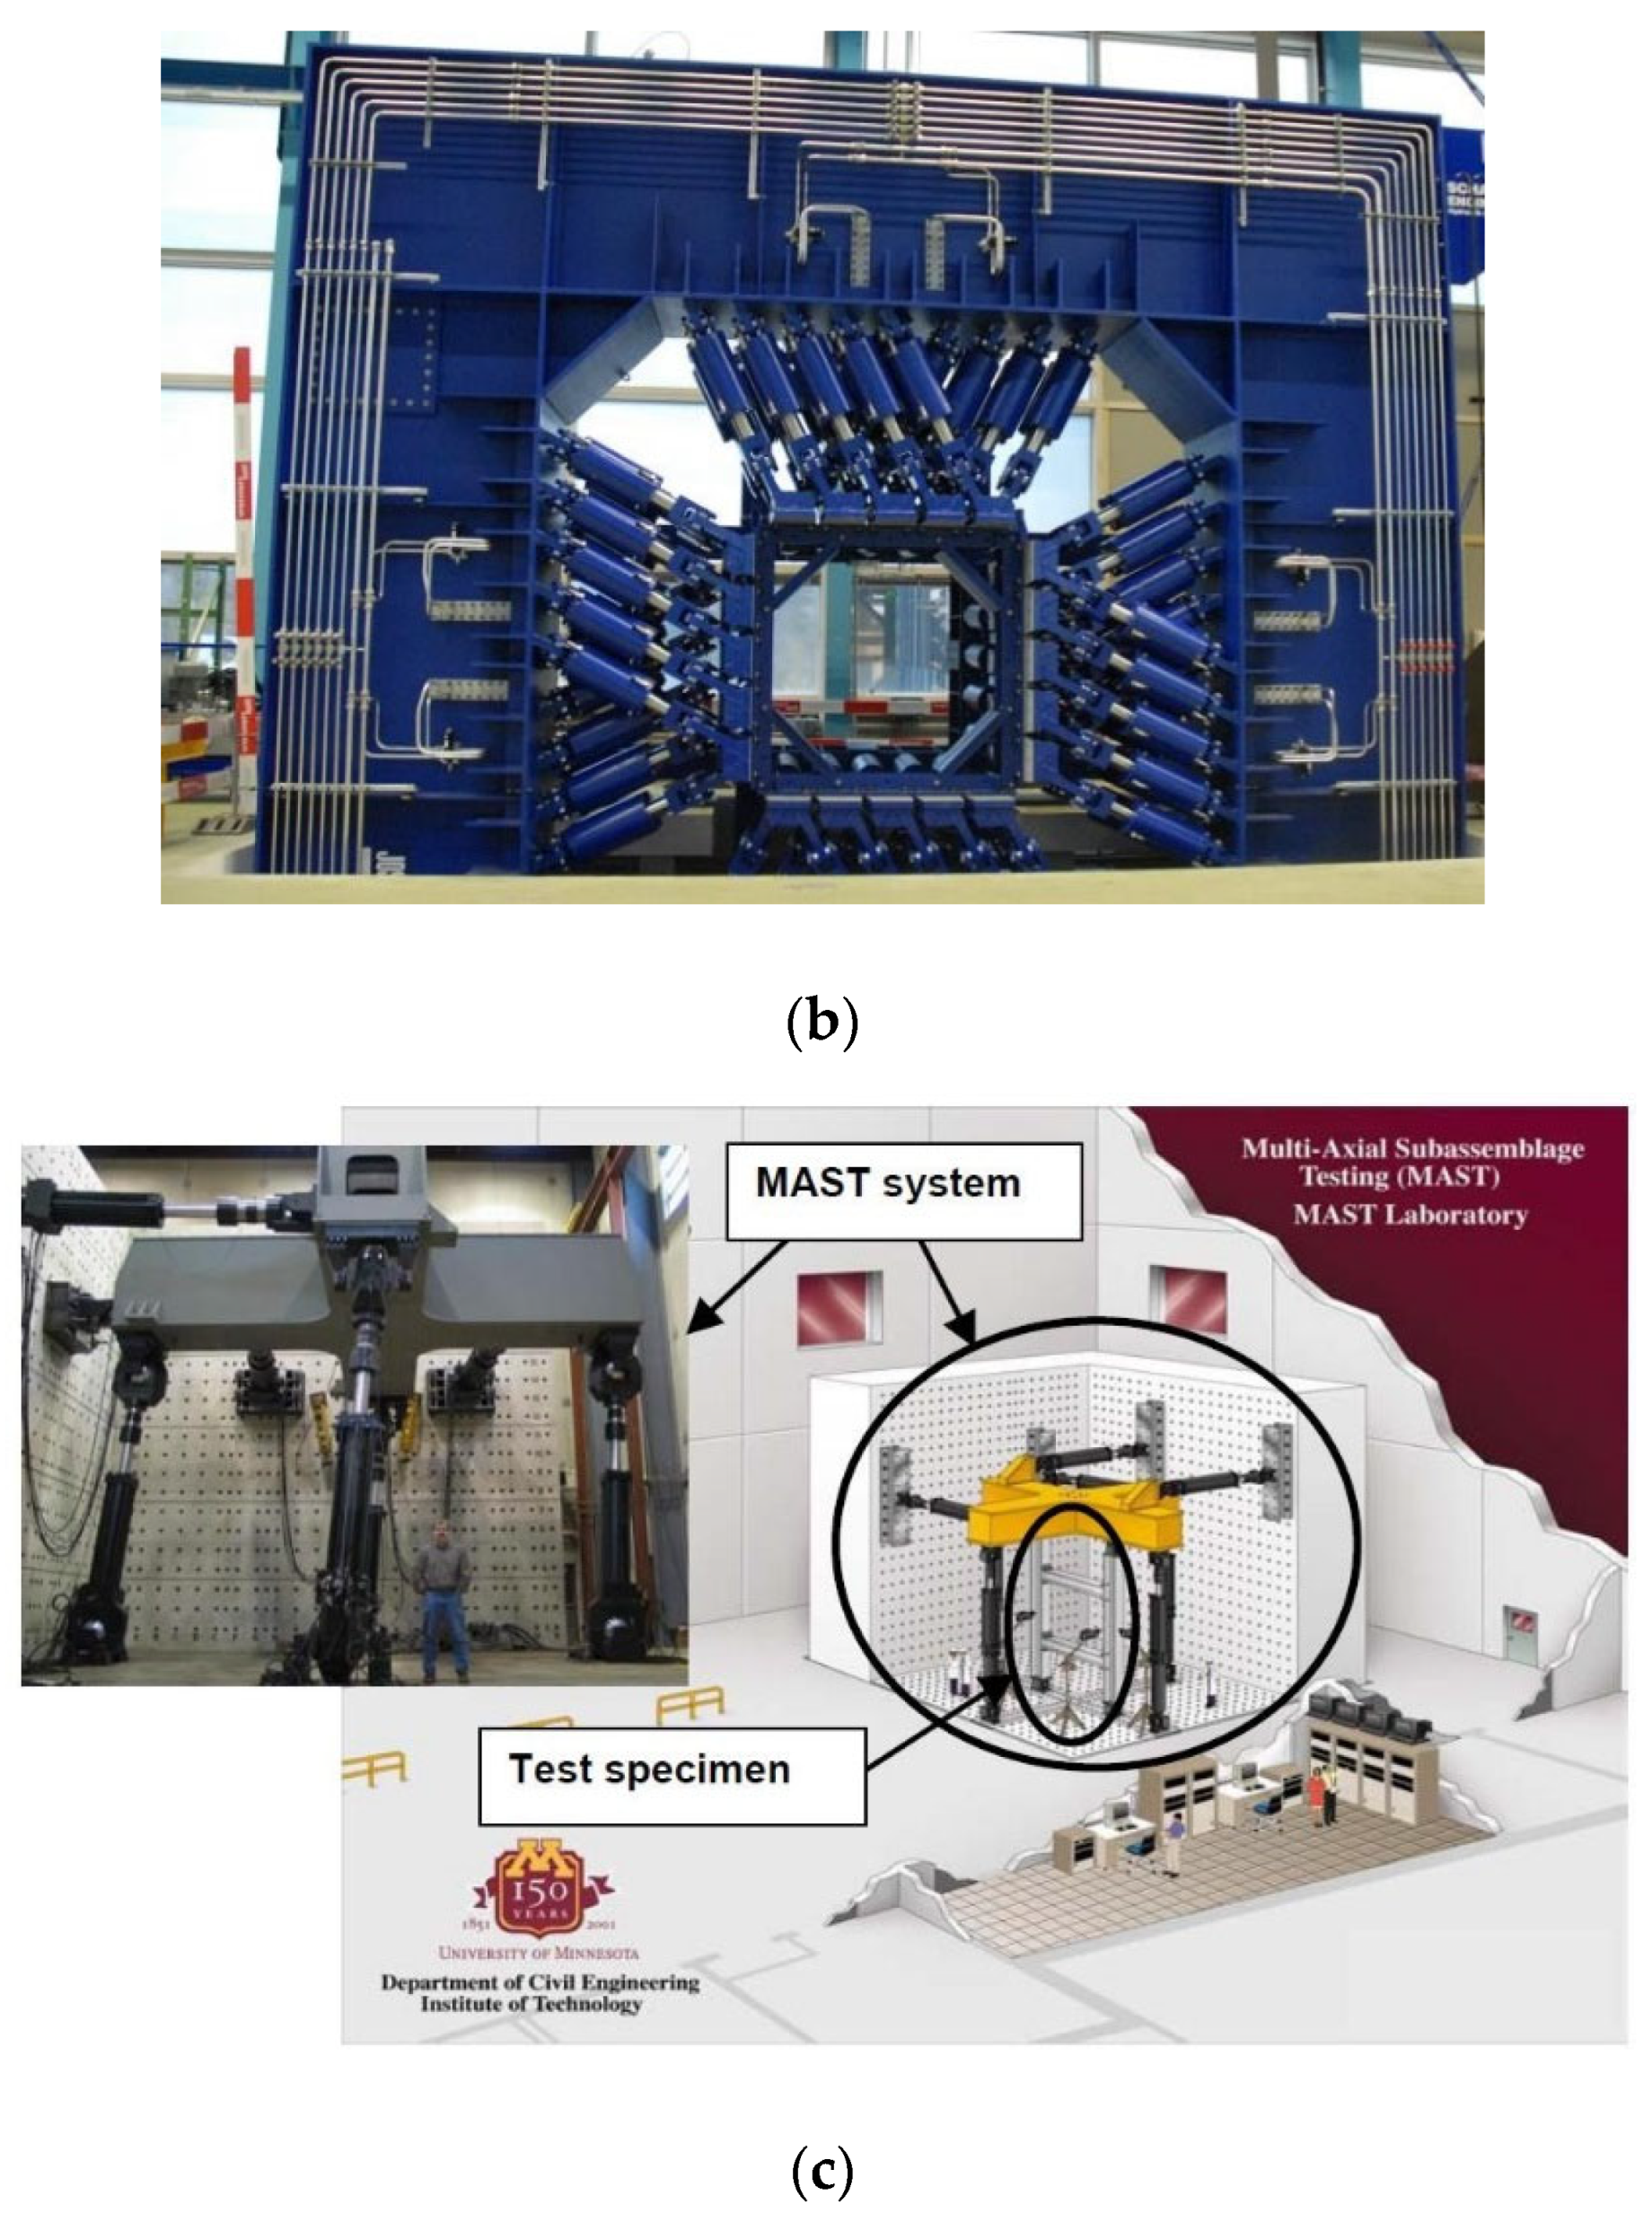
Figure 5.
Test benches that structurally embed the sample: a) Shear, tension and pressure introduced to the sample through a D-box assembly [44] (from [45] concept), b) Shear on large stiffened panel: deformable square principal, loaded by a rotating structure emulating a fuselage torsion [46].
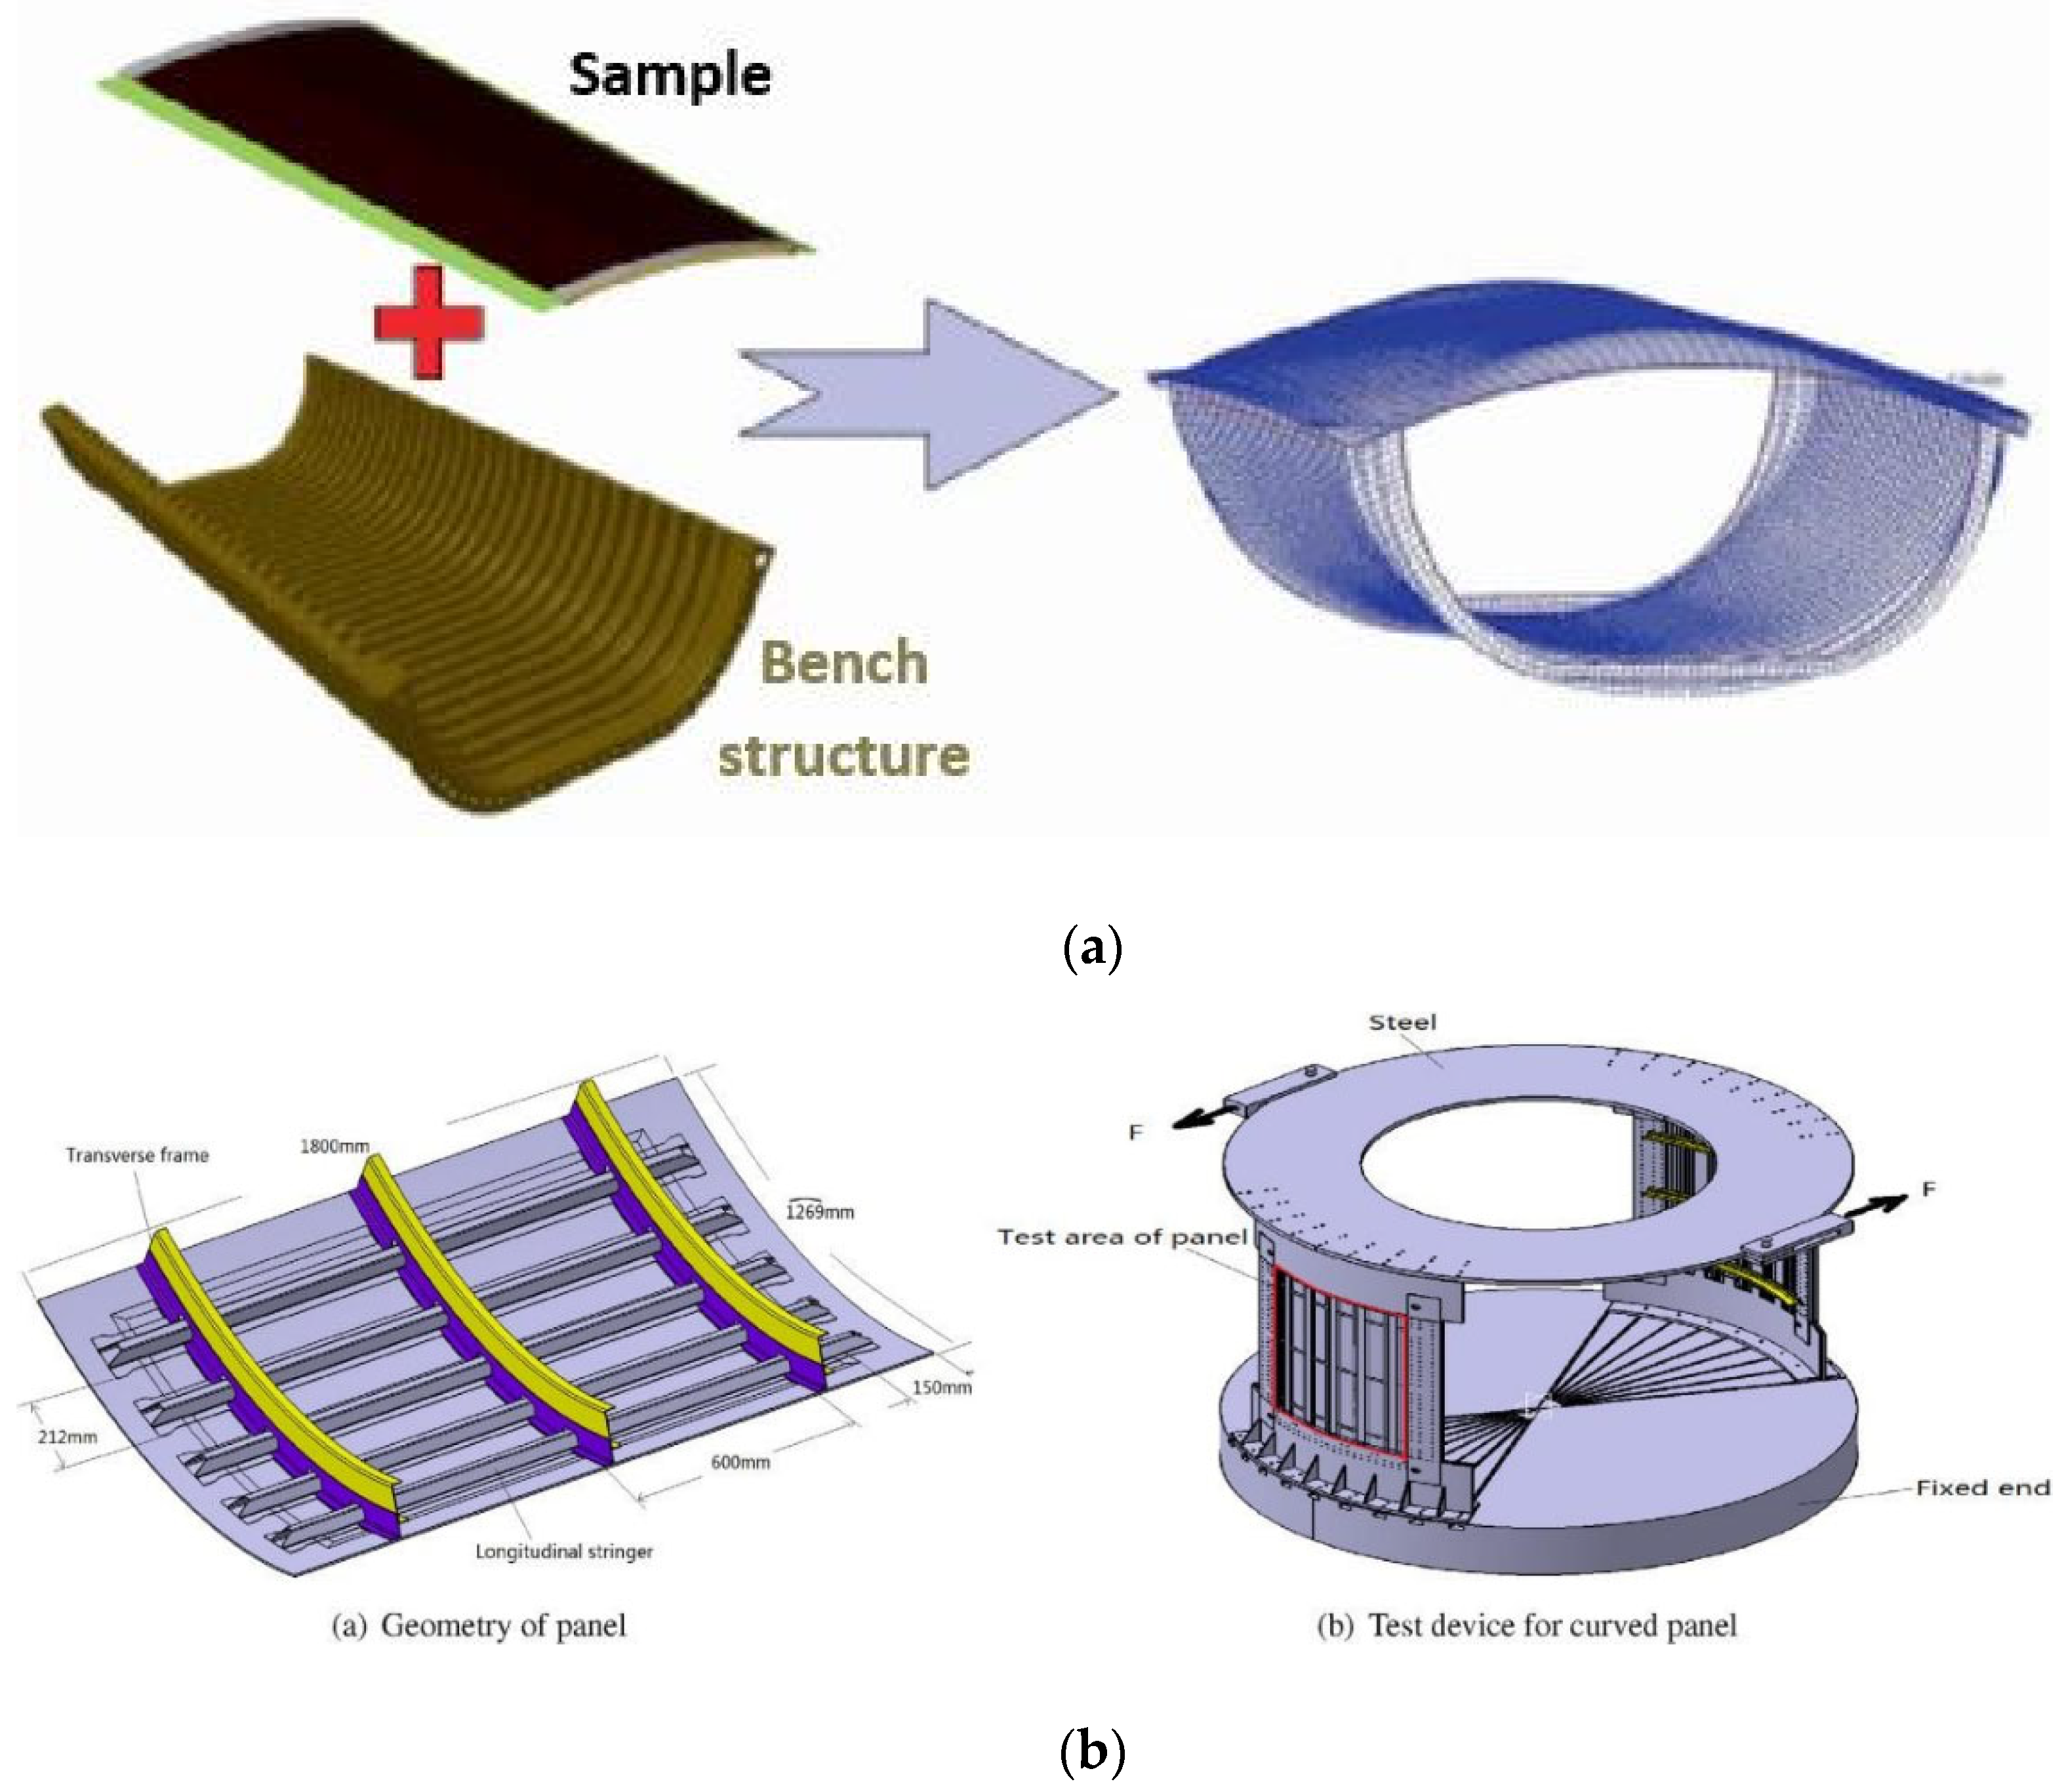
Figure 6.
(left) VERTEX specimen geometry, with a central notch - (right) sample bolted to the VERTEX test bench, viewed through one of the two optical cameras used for digital image stereo-correlation (5 Mpx, 2 fps).
Figure 6.
(left) VERTEX specimen geometry, with a central notch - (right) sample bolted to the VERTEX test bench, viewed through one of the two optical cameras used for digital image stereo-correlation (5 Mpx, 2 fps).

Figure 7.
The VERTEX test rig.
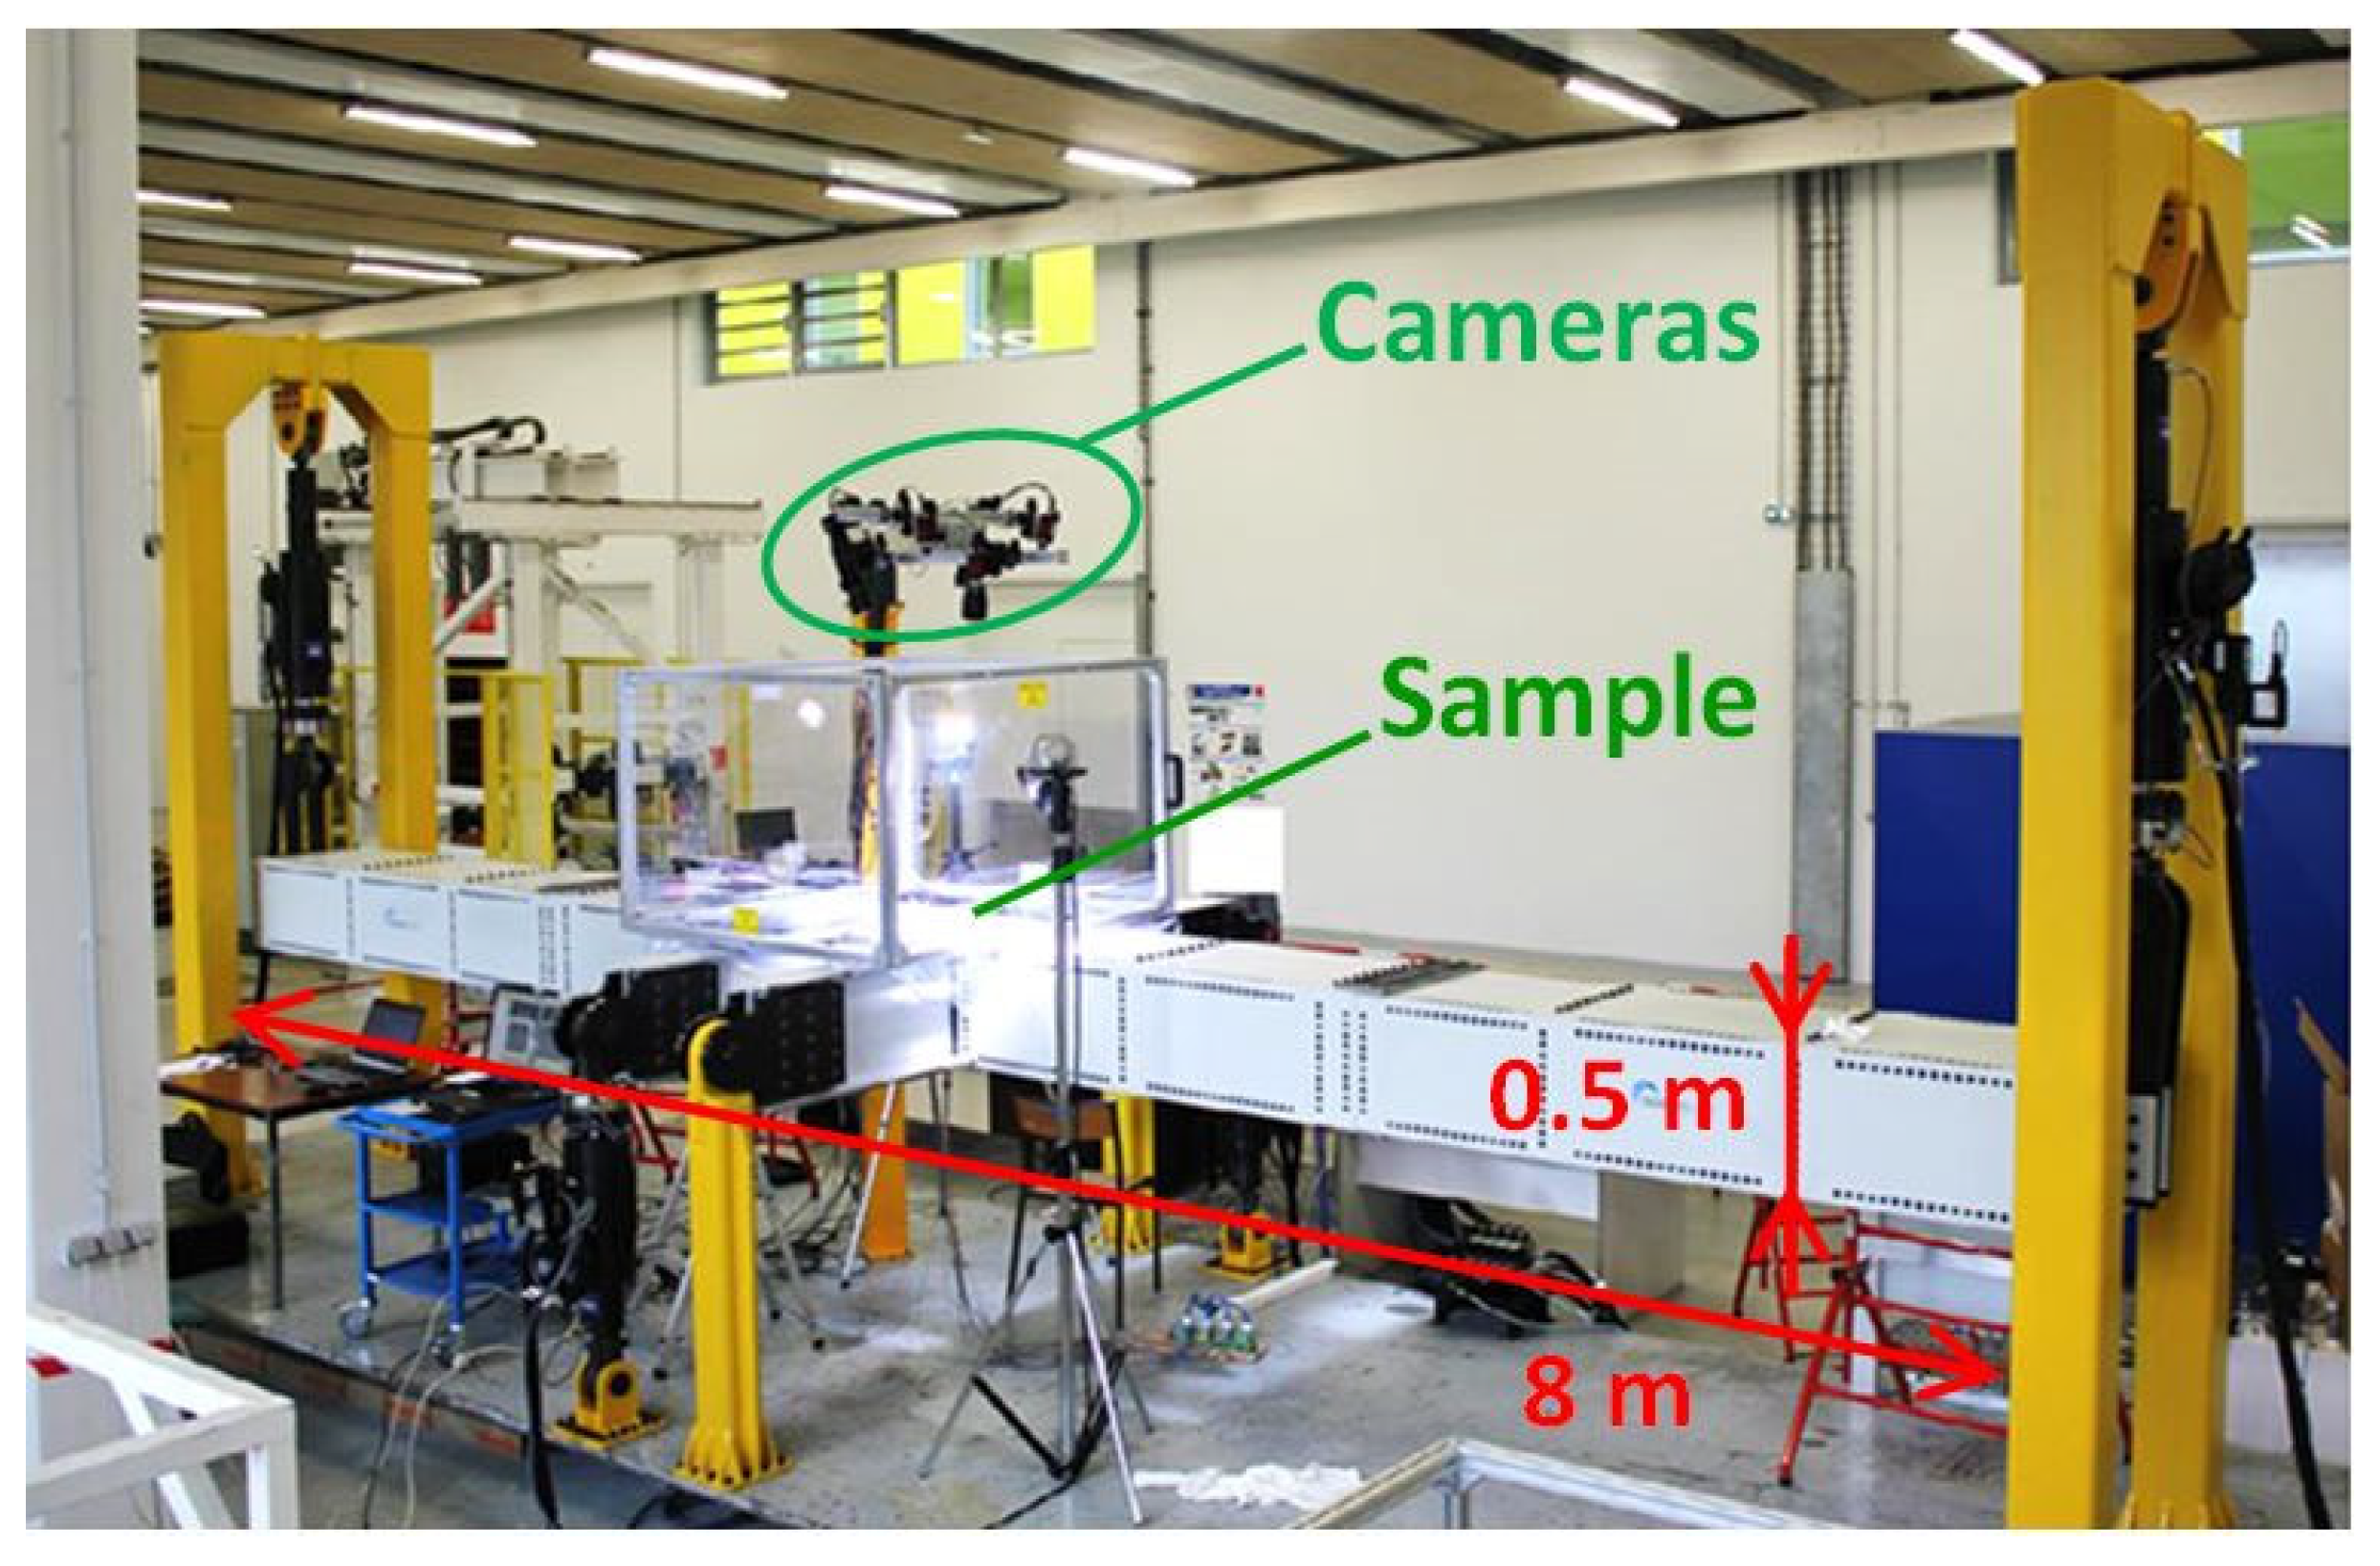
Figure 8.
Scheme of the VERTEX test rig and its four jacks to load the sample placed in the middle.
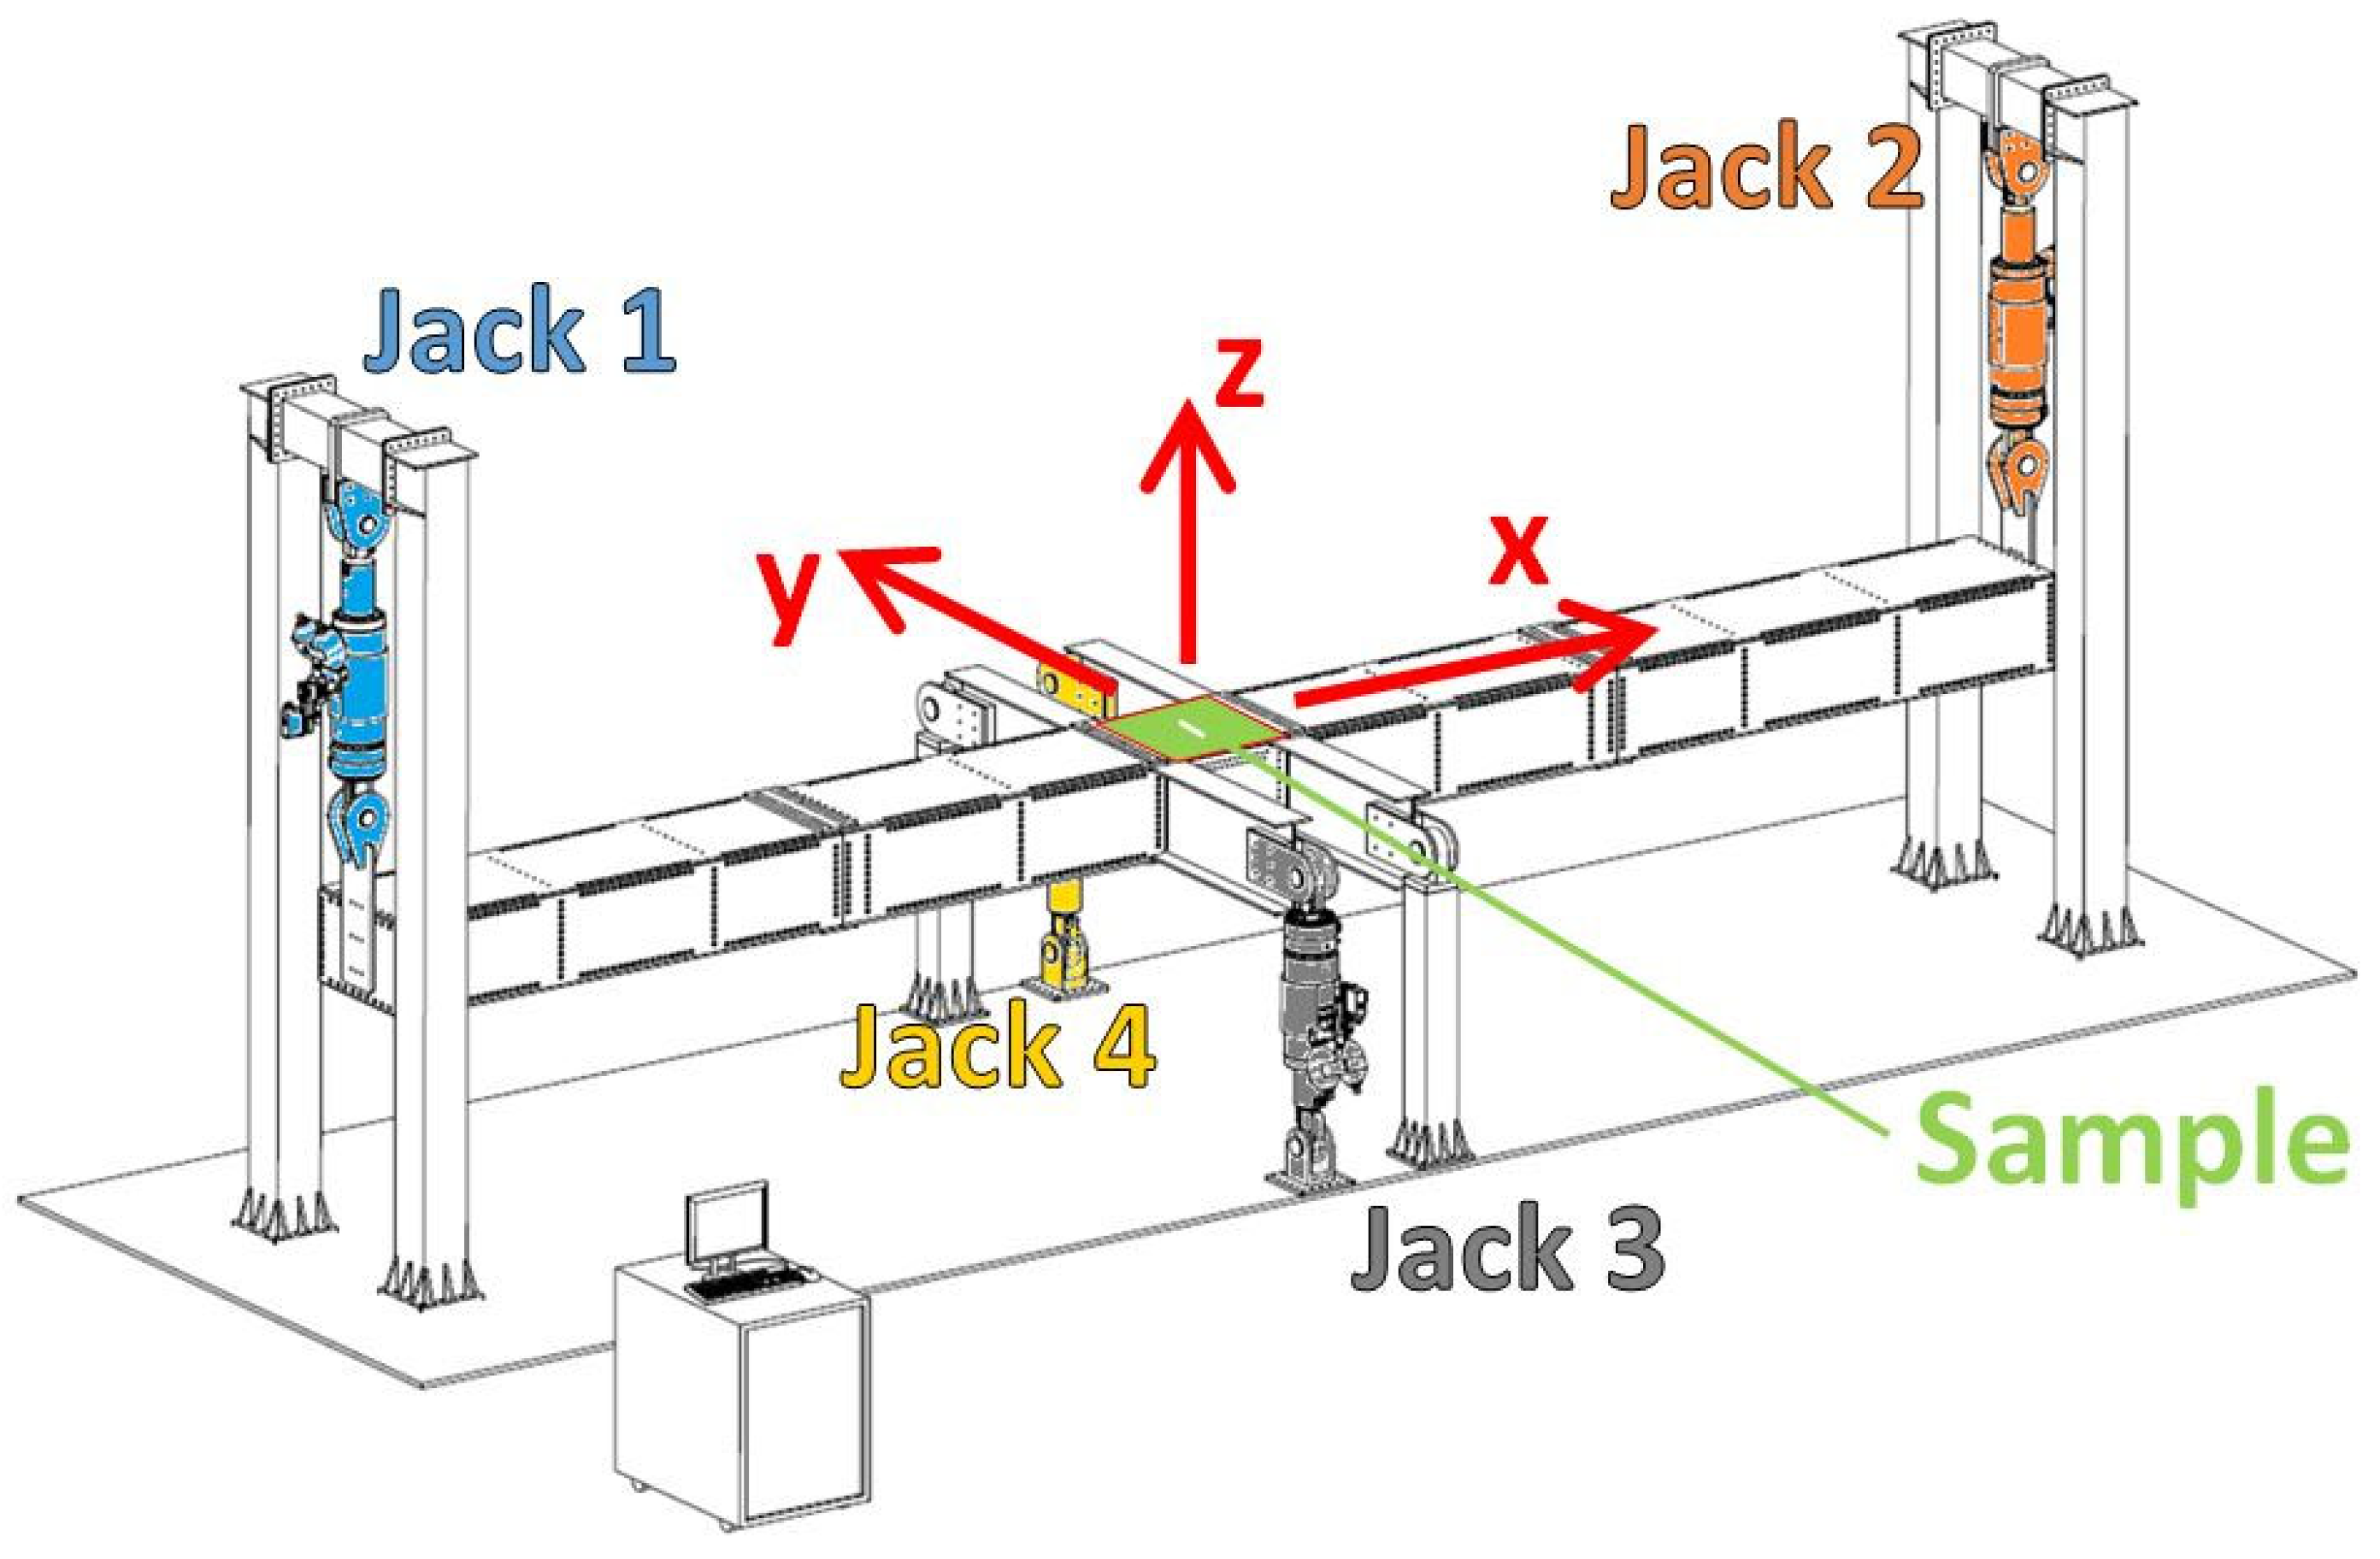
Figure 9.
Actuation of the four jacks of the VERTEX test rig to deform the bench and locally apply tension/compression and shear to the sample.
Figure 9.
Actuation of the four jacks of the VERTEX test rig to deform the bench and locally apply tension/compression and shear to the sample.
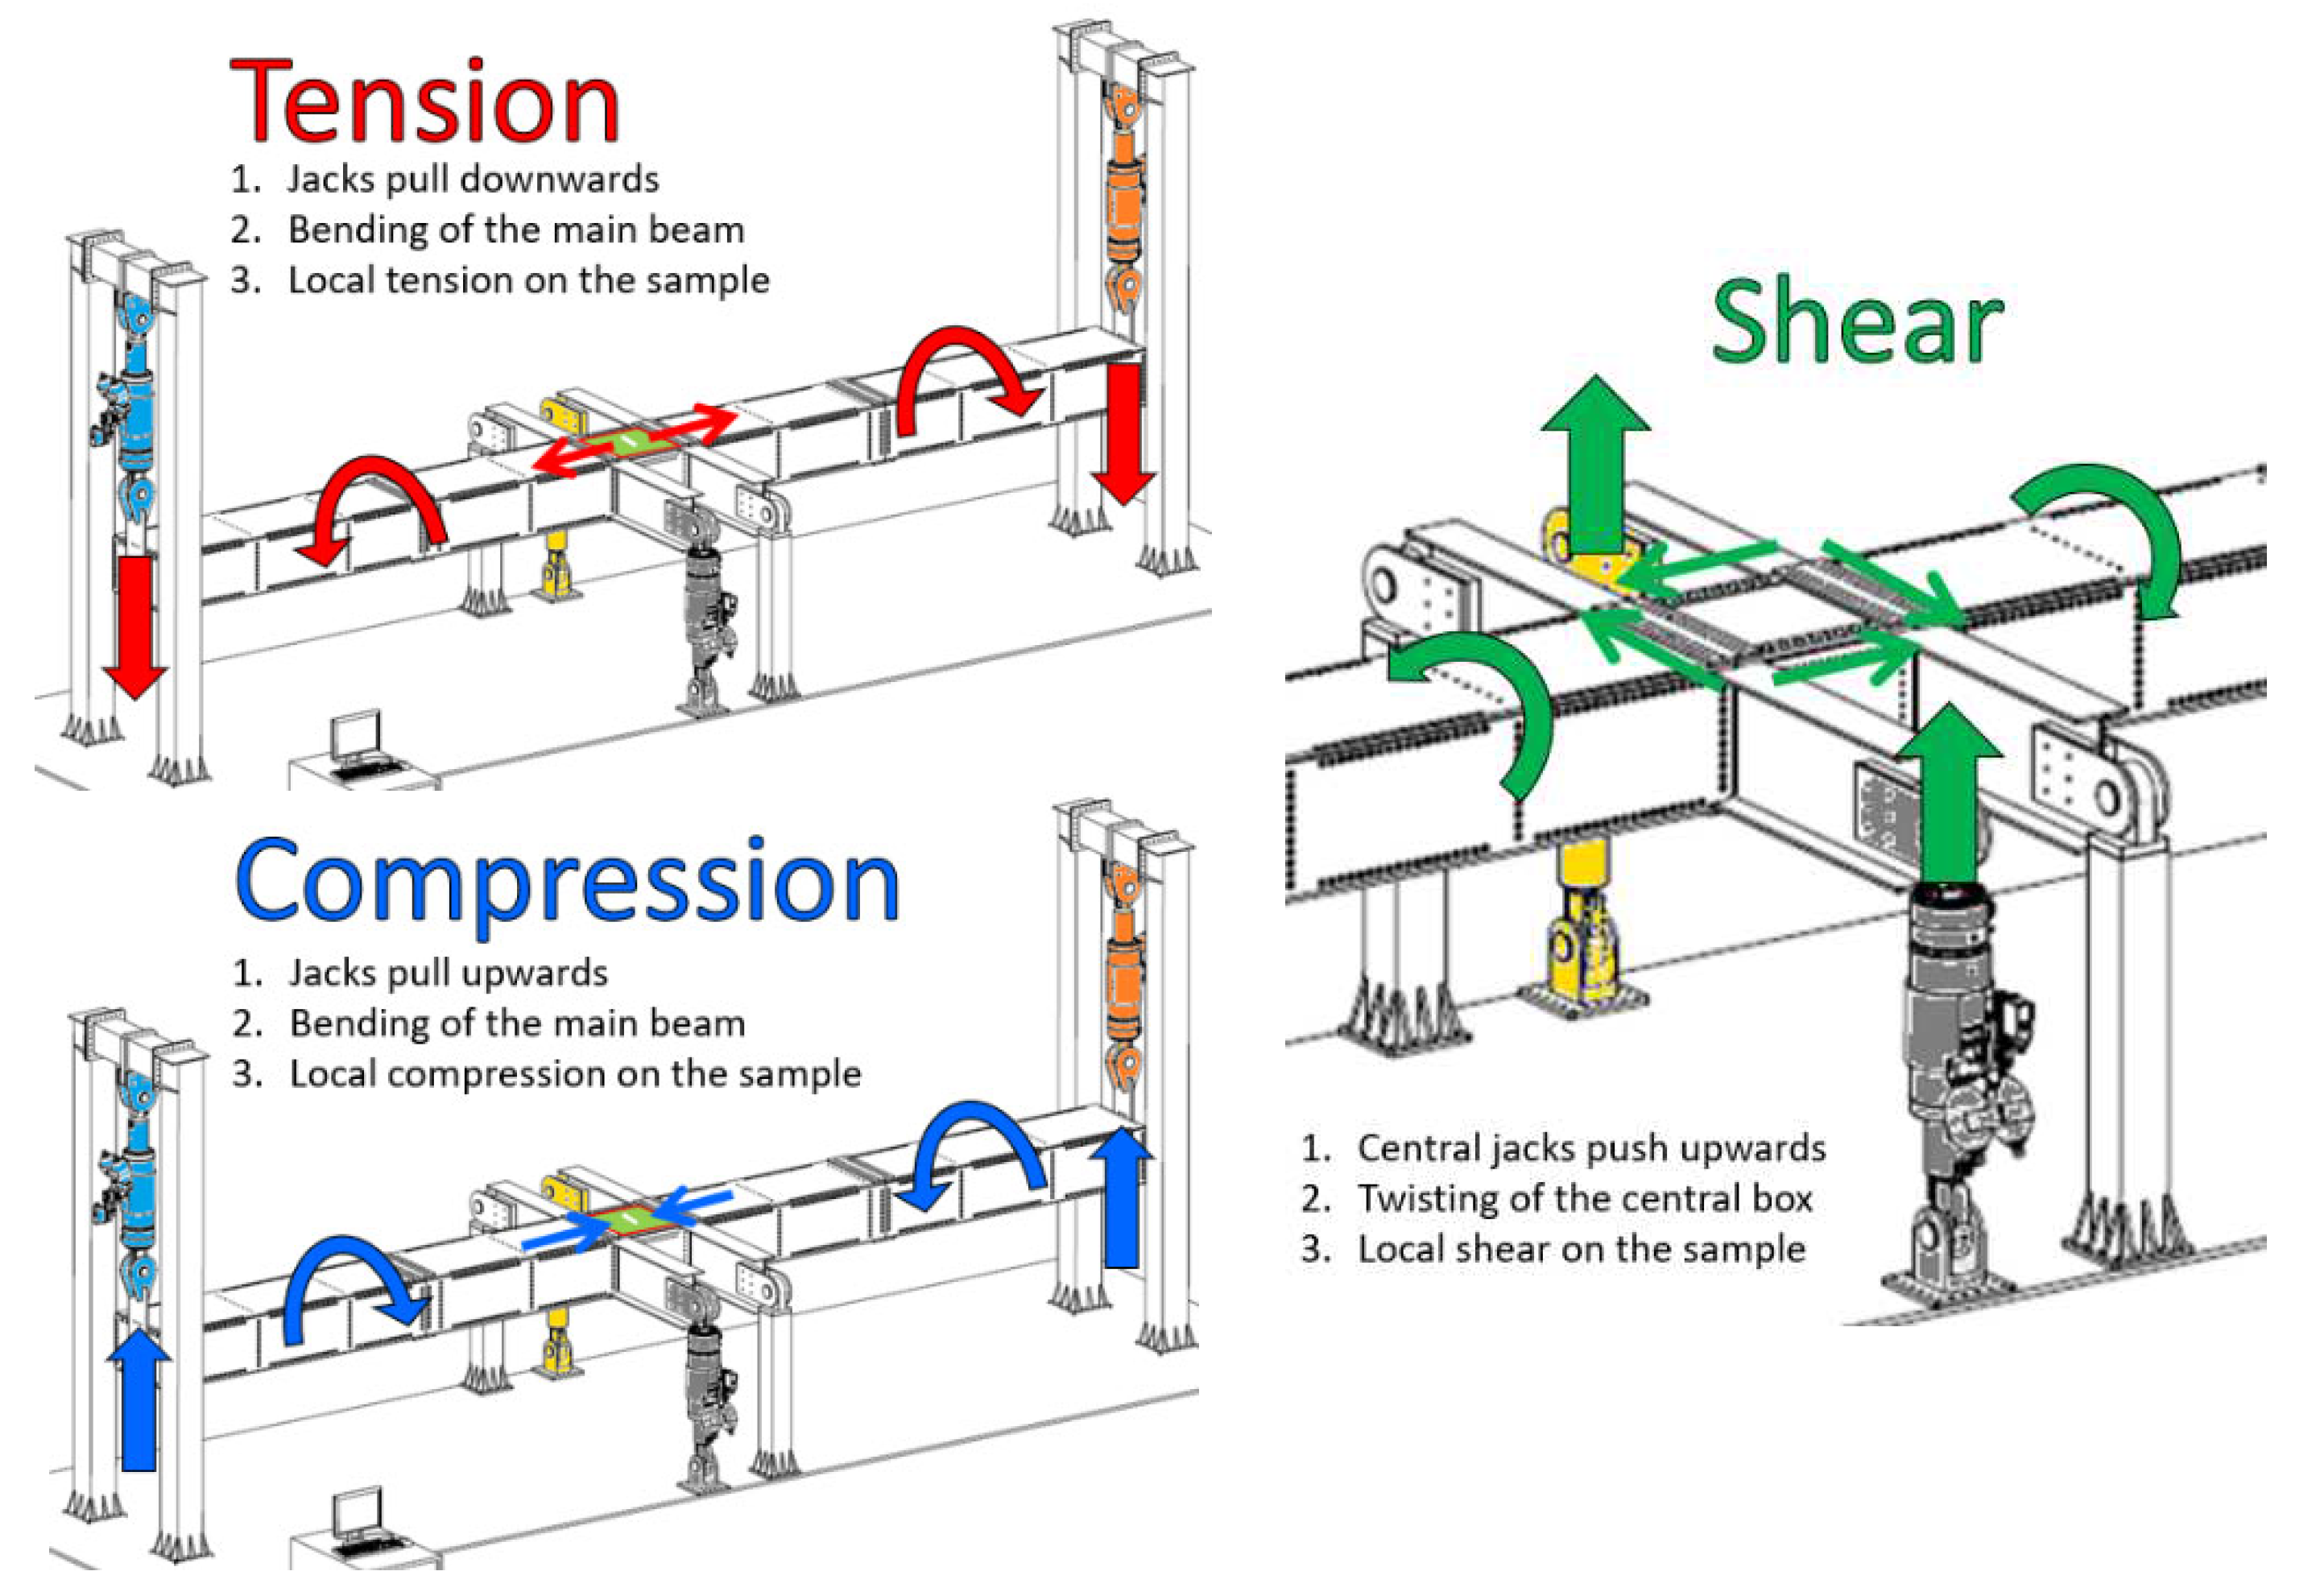
Figure 10.
Shapes of loading illustrated through in-plane displacements and out-of-plane shape, for tension and shear tests on TSs samples, using stereo-correlation on the 400 mm × 400 mm useful zone.
Figure 10.
Shapes of loading illustrated through in-plane displacements and out-of-plane shape, for tension and shear tests on TSs samples, using stereo-correlation on the 400 mm × 400 mm useful zone.
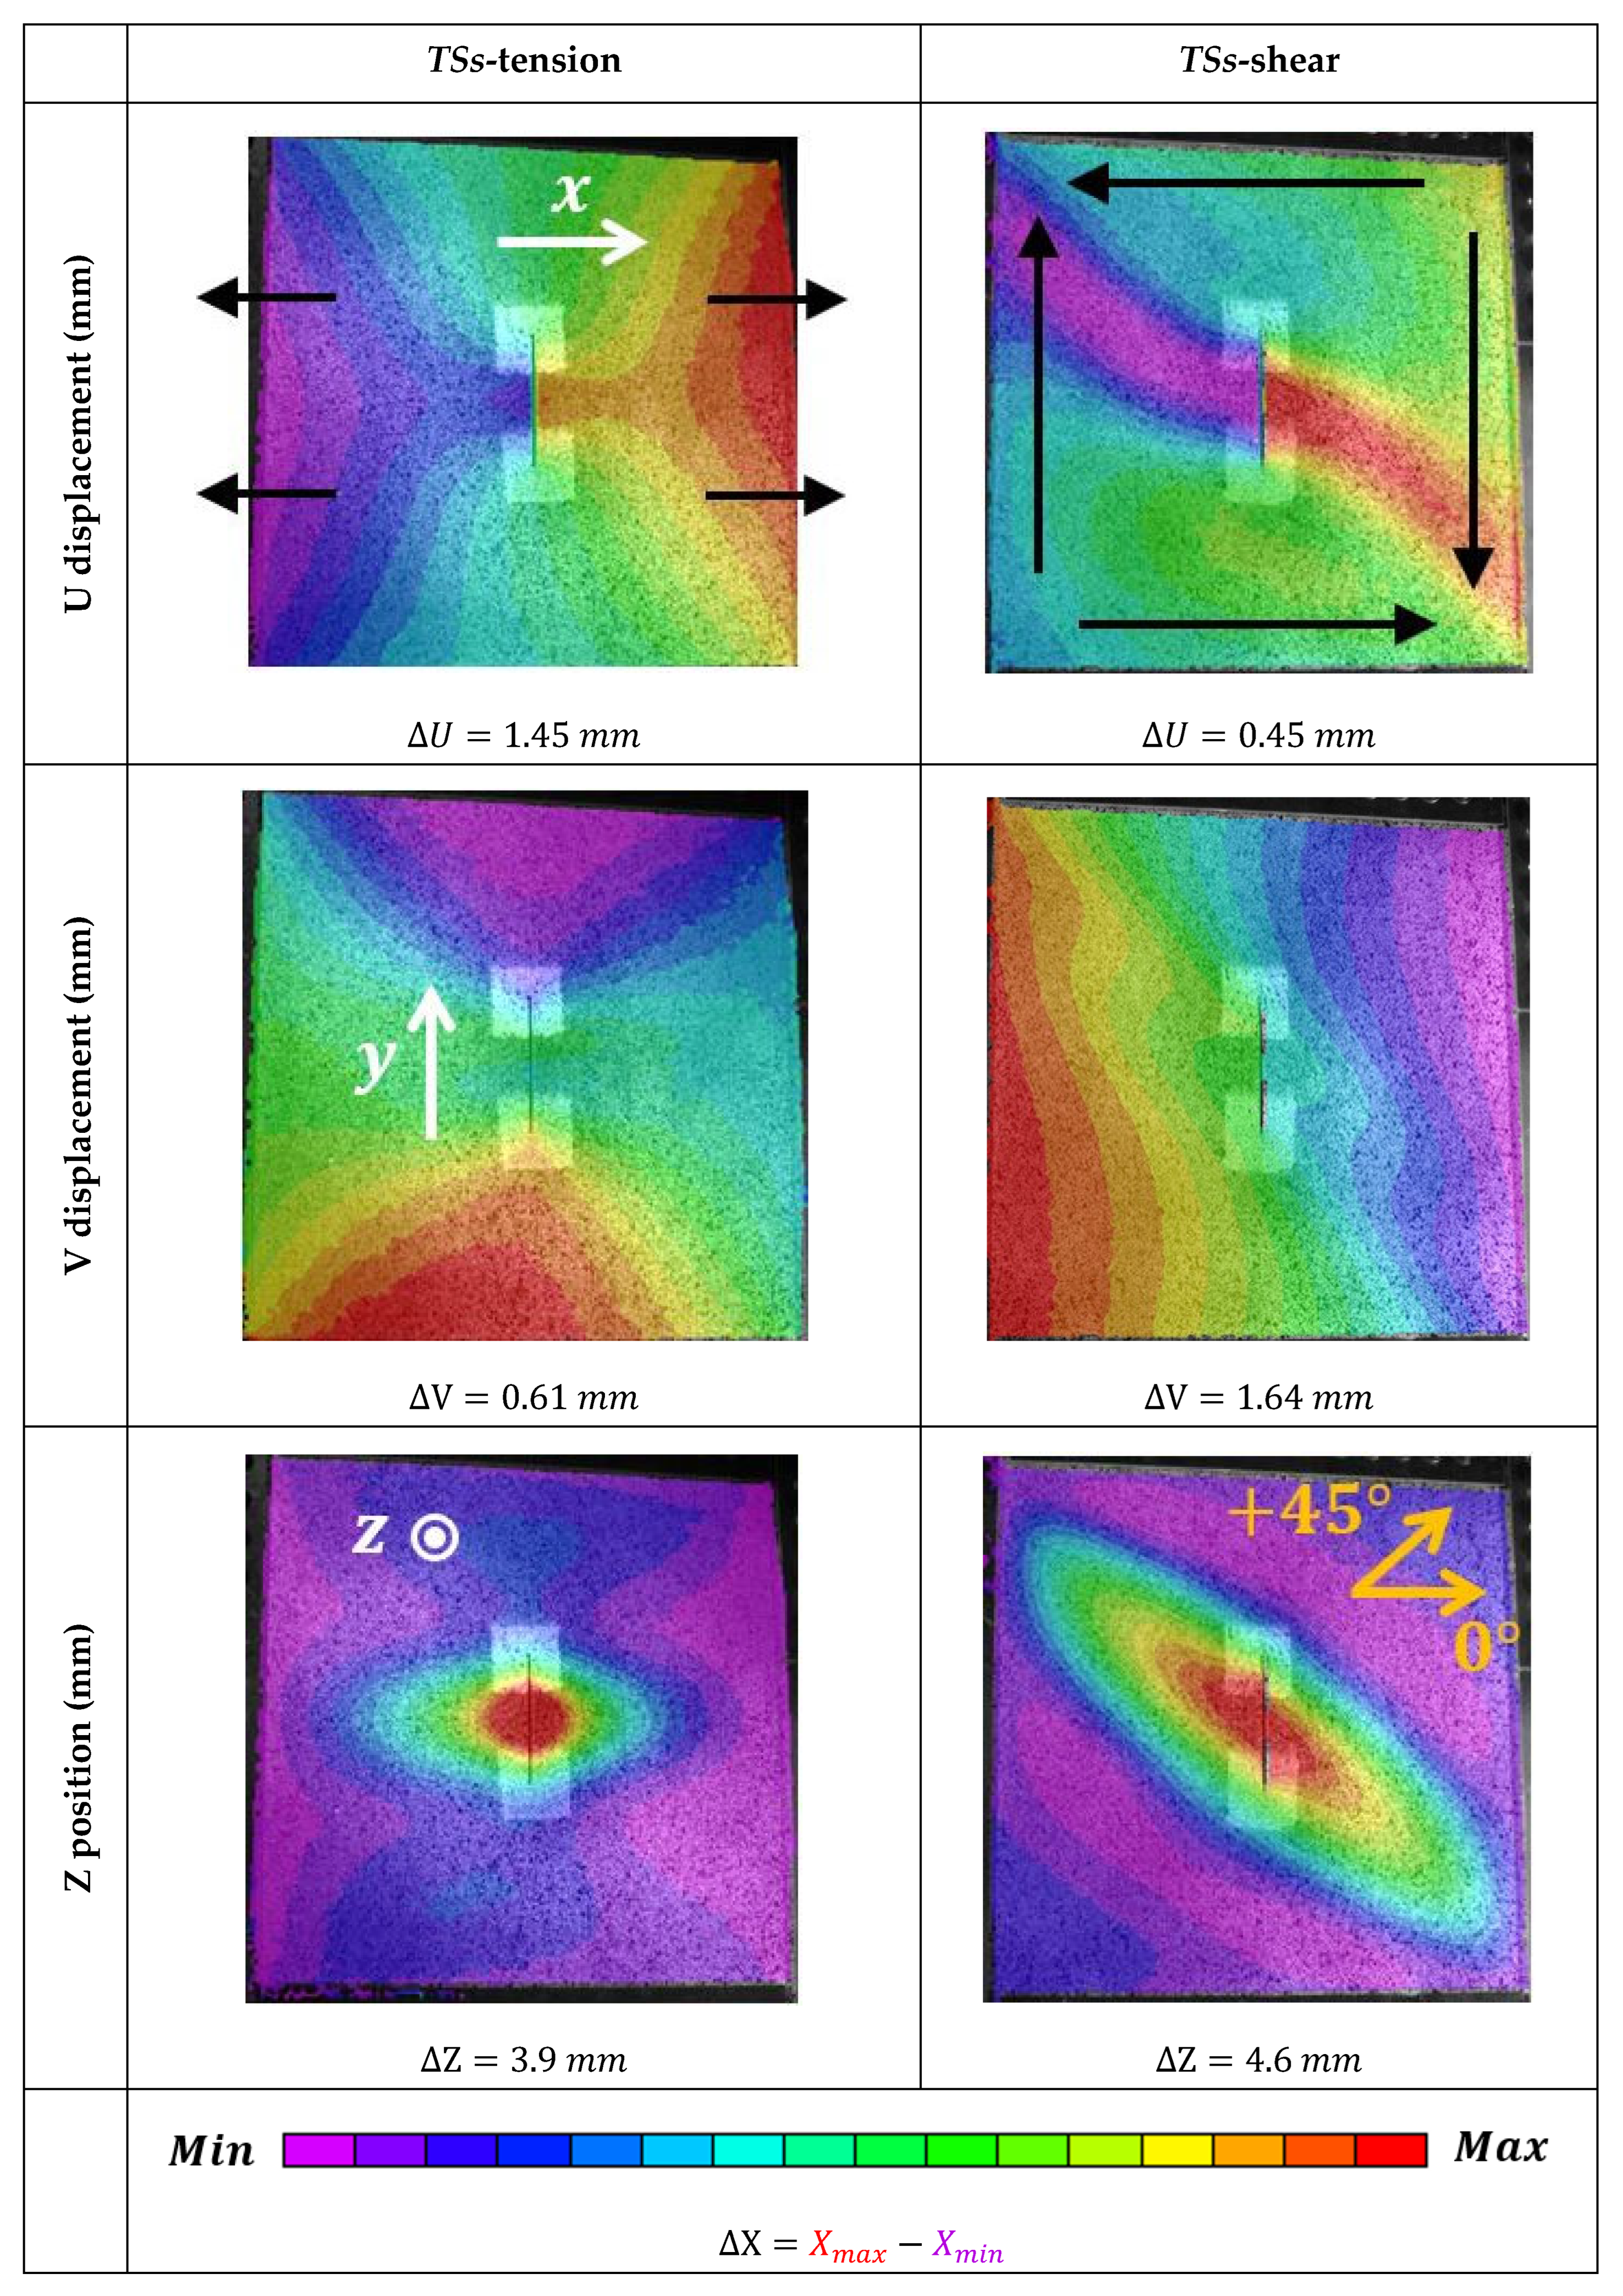
Figure 11.
Spatially averaged force and moment fluxes over time for the TSs-shear test [47].
Figure 11.
Spatially averaged force and moment fluxes over time for the TSs-shear test [47].
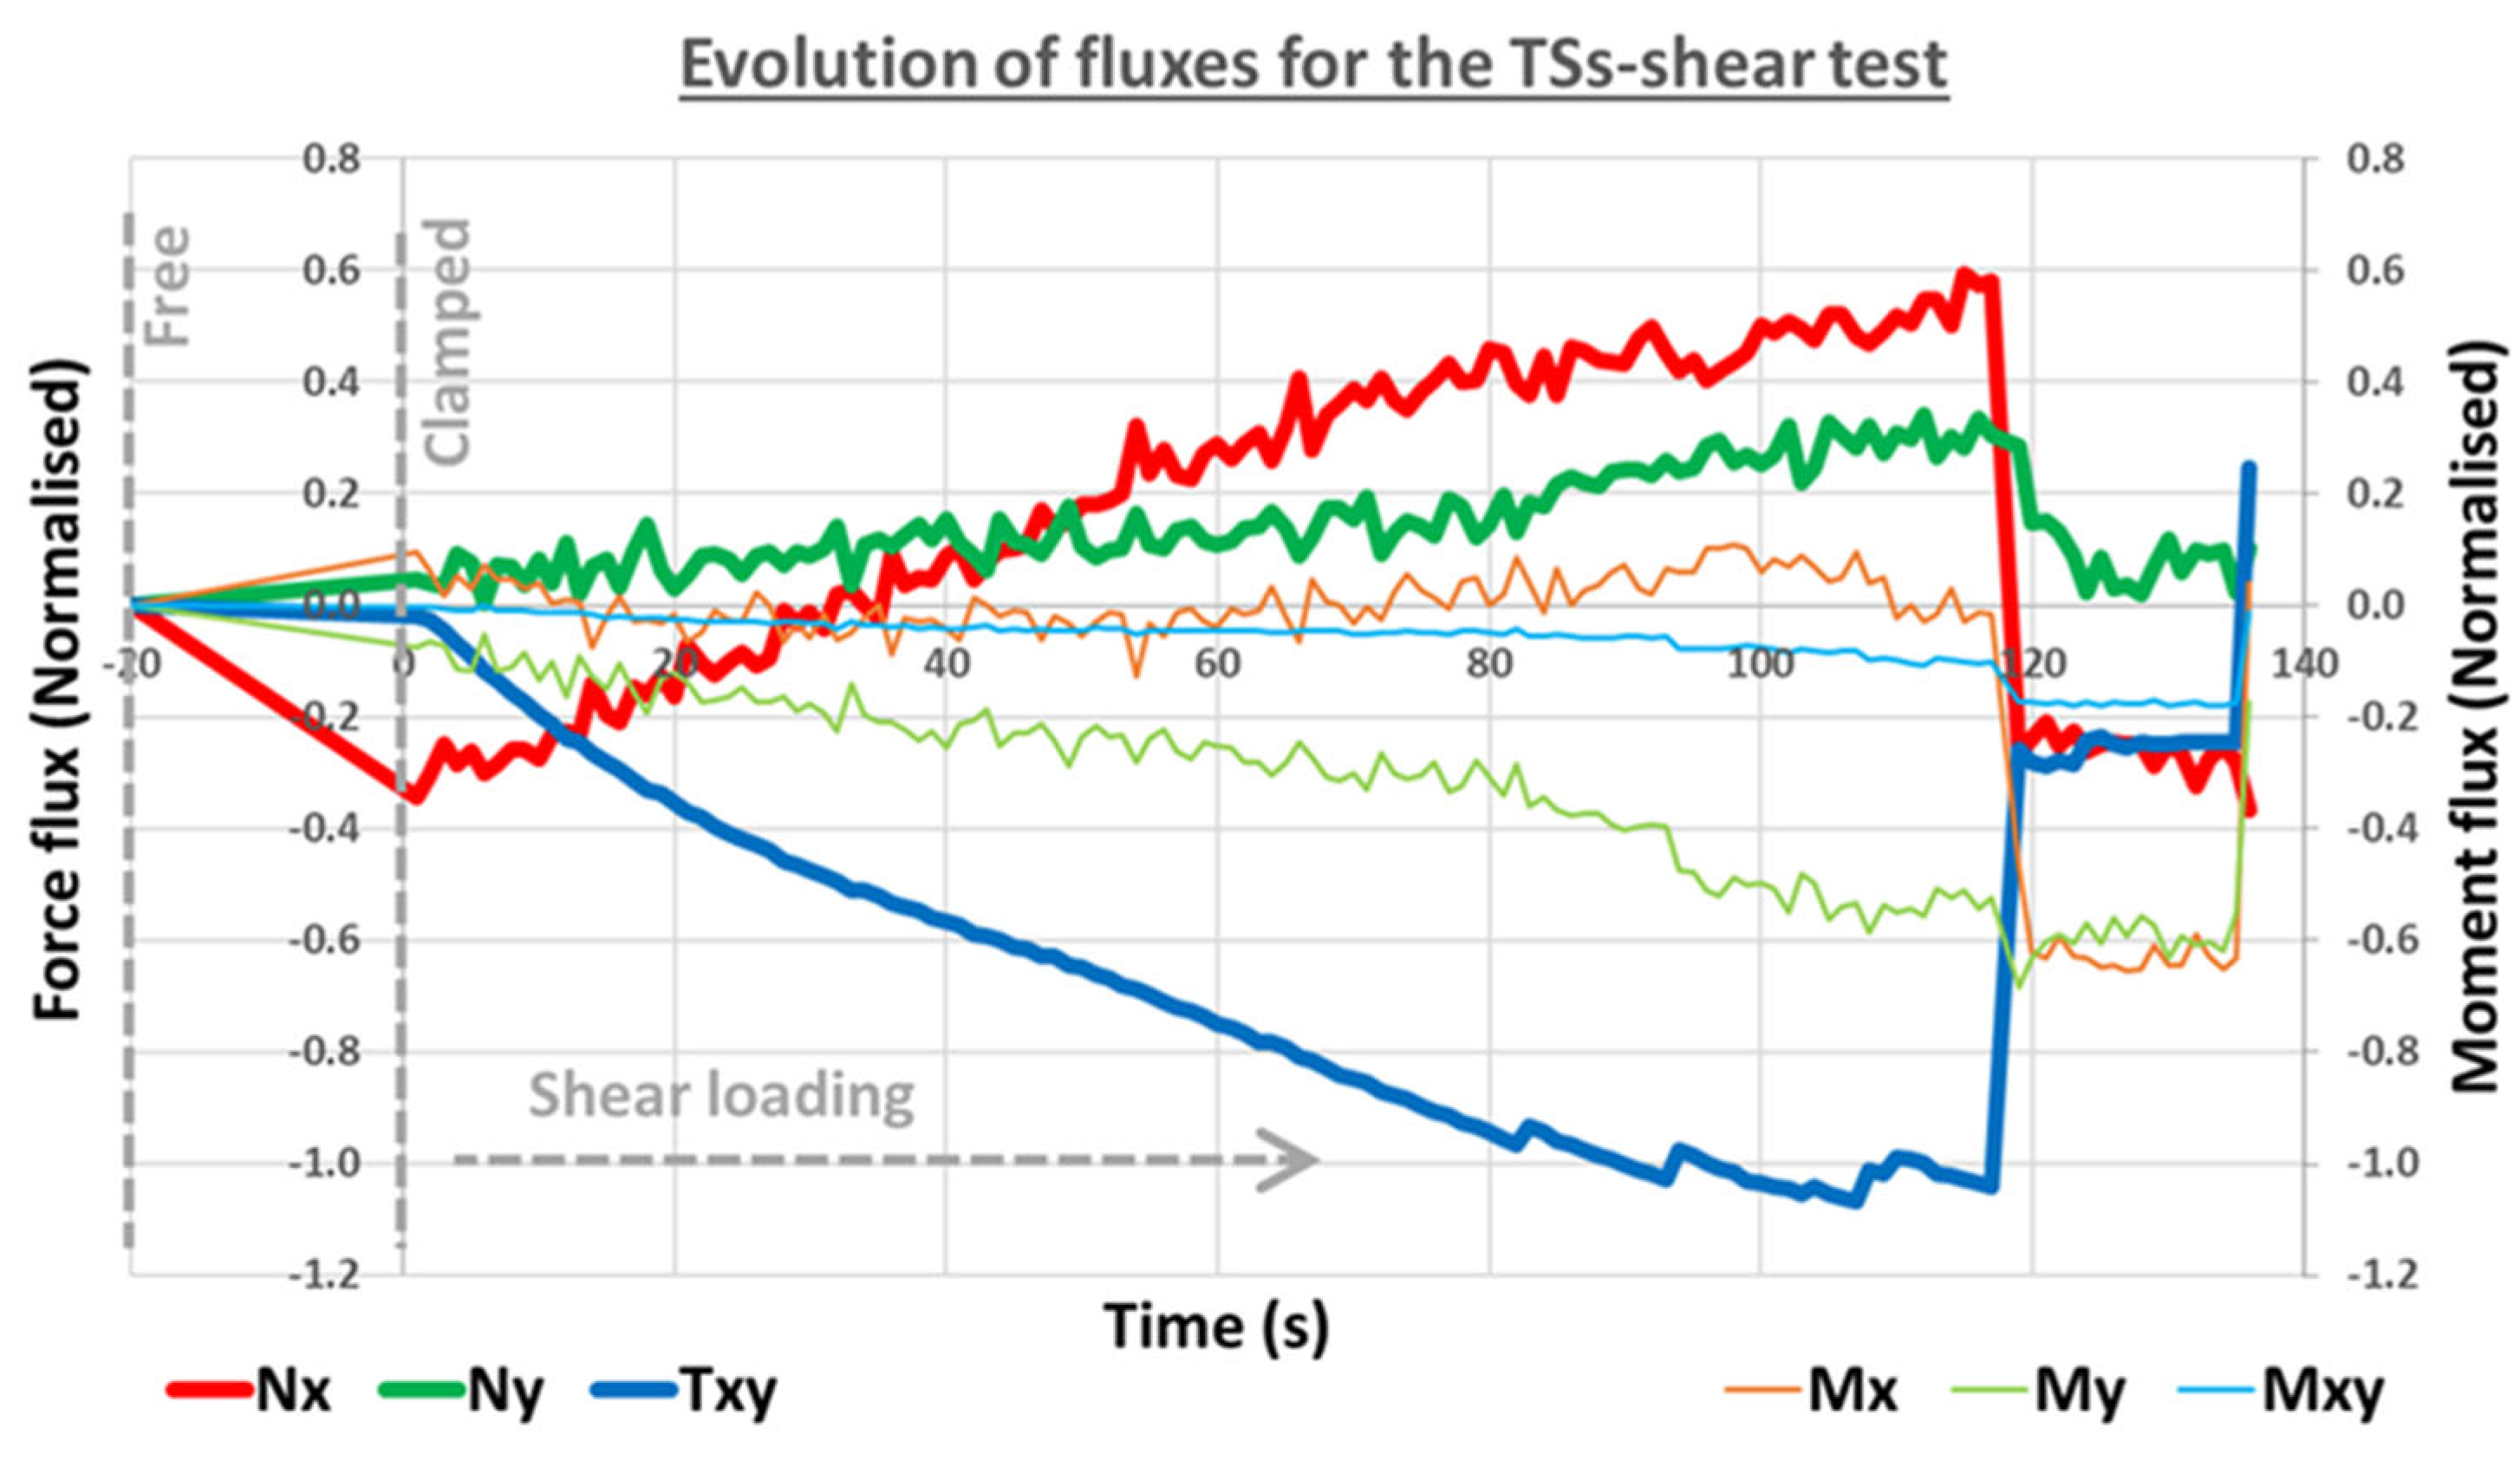
Figure 12.
Sample displacement amplitude in response to jack displacements, for three different samples under tension before failure - illustration of the bench loading dependency on the sample stiffness.
Figure 12.
Sample displacement amplitude in response to jack displacements, for three different samples under tension before failure - illustration of the bench loading dependency on the sample stiffness.
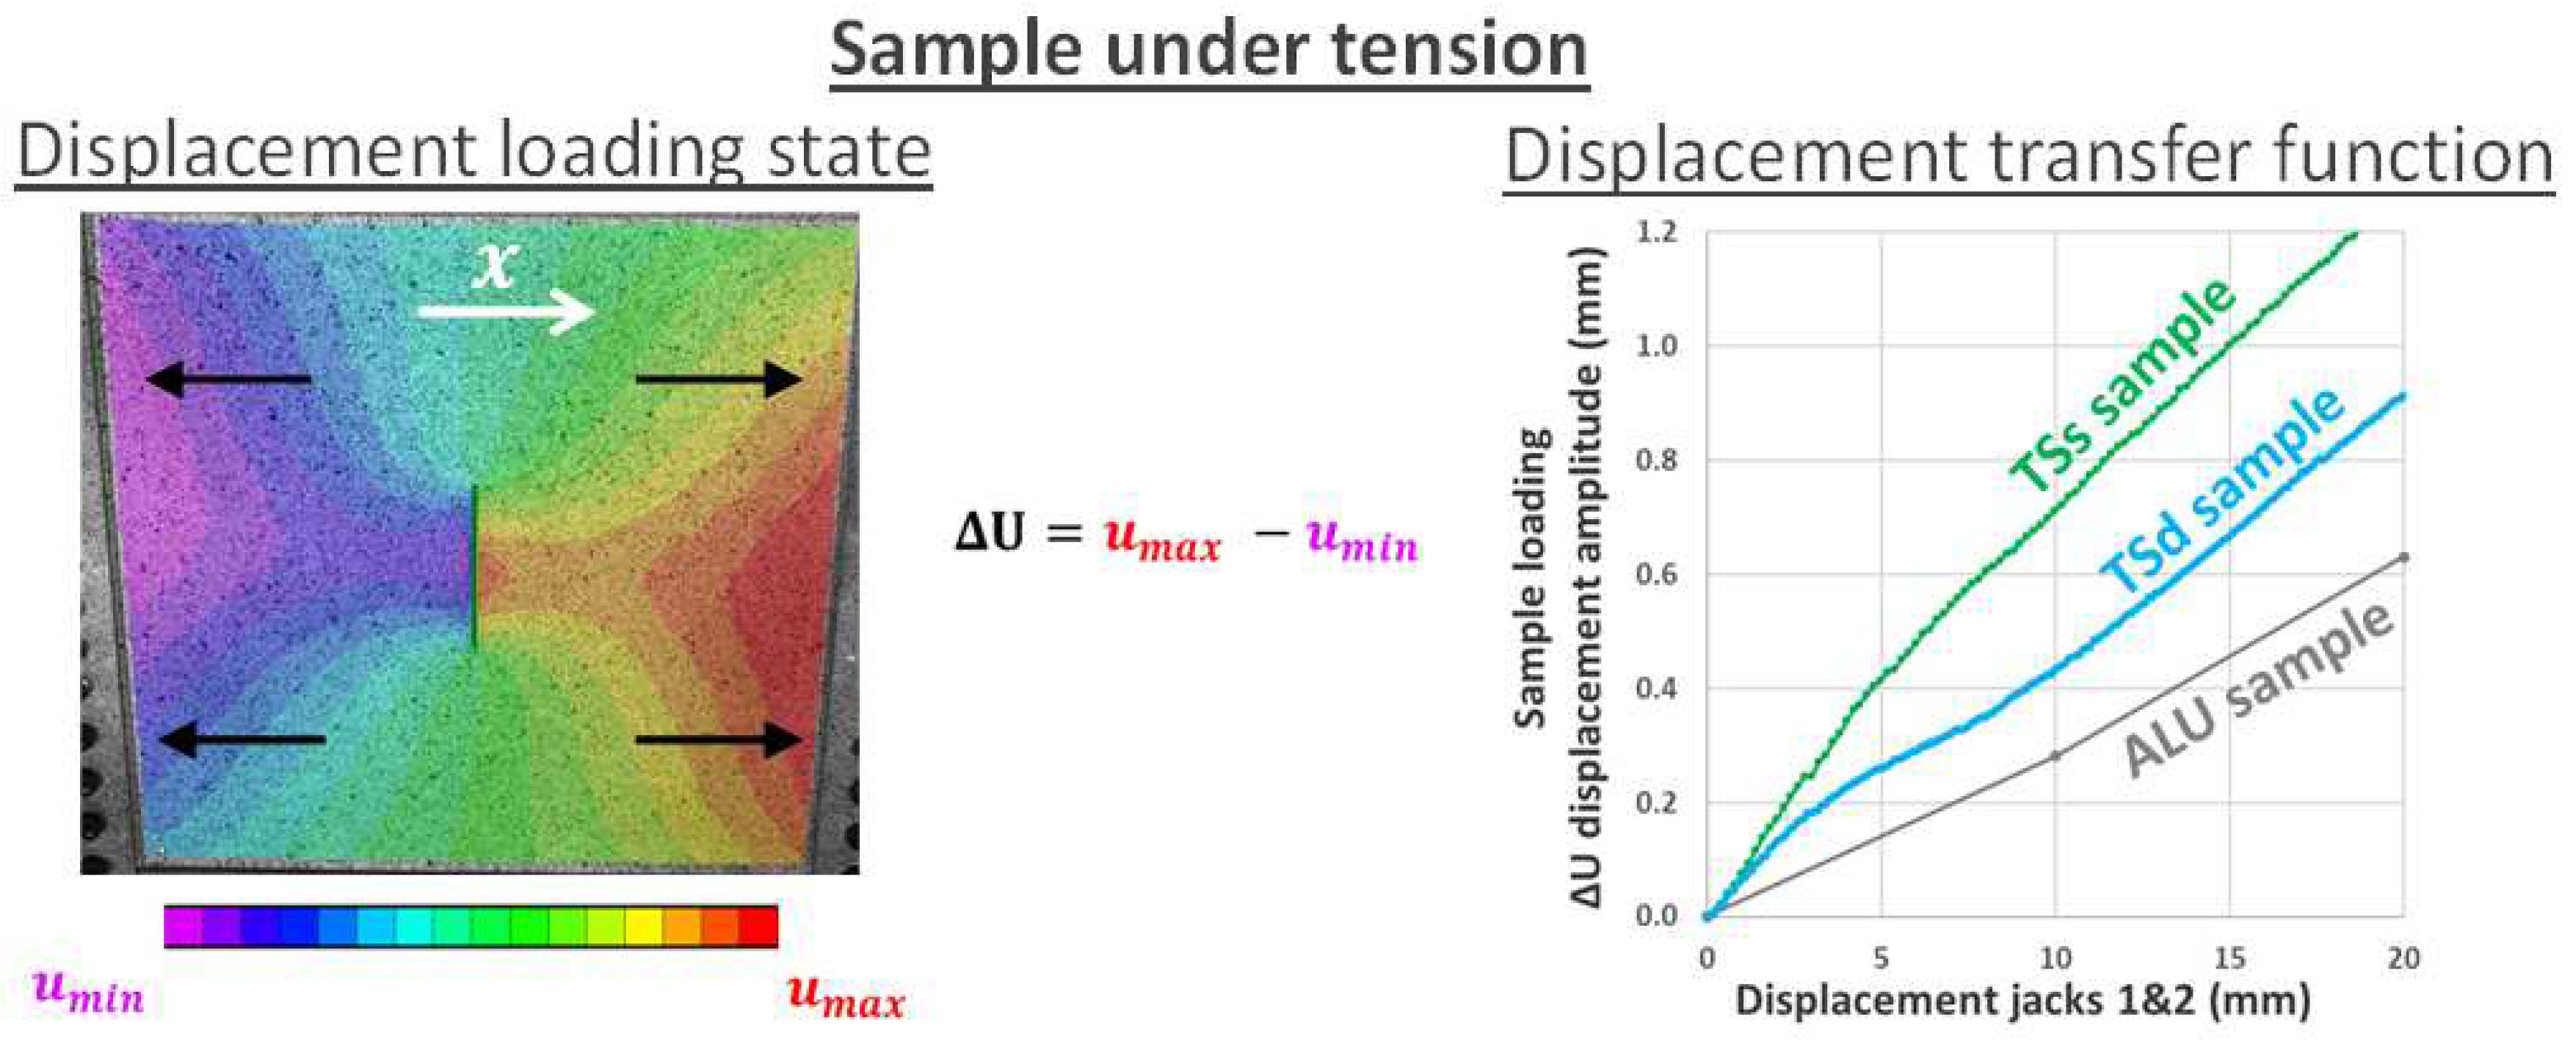
Figure 13.
Sample average force flux resulting from jack forces (referred to as force transfer function), for three different samples under tension and shear.
Figure 13.
Sample average force flux resulting from jack forces (referred to as force transfer function), for three different samples under tension and shear.
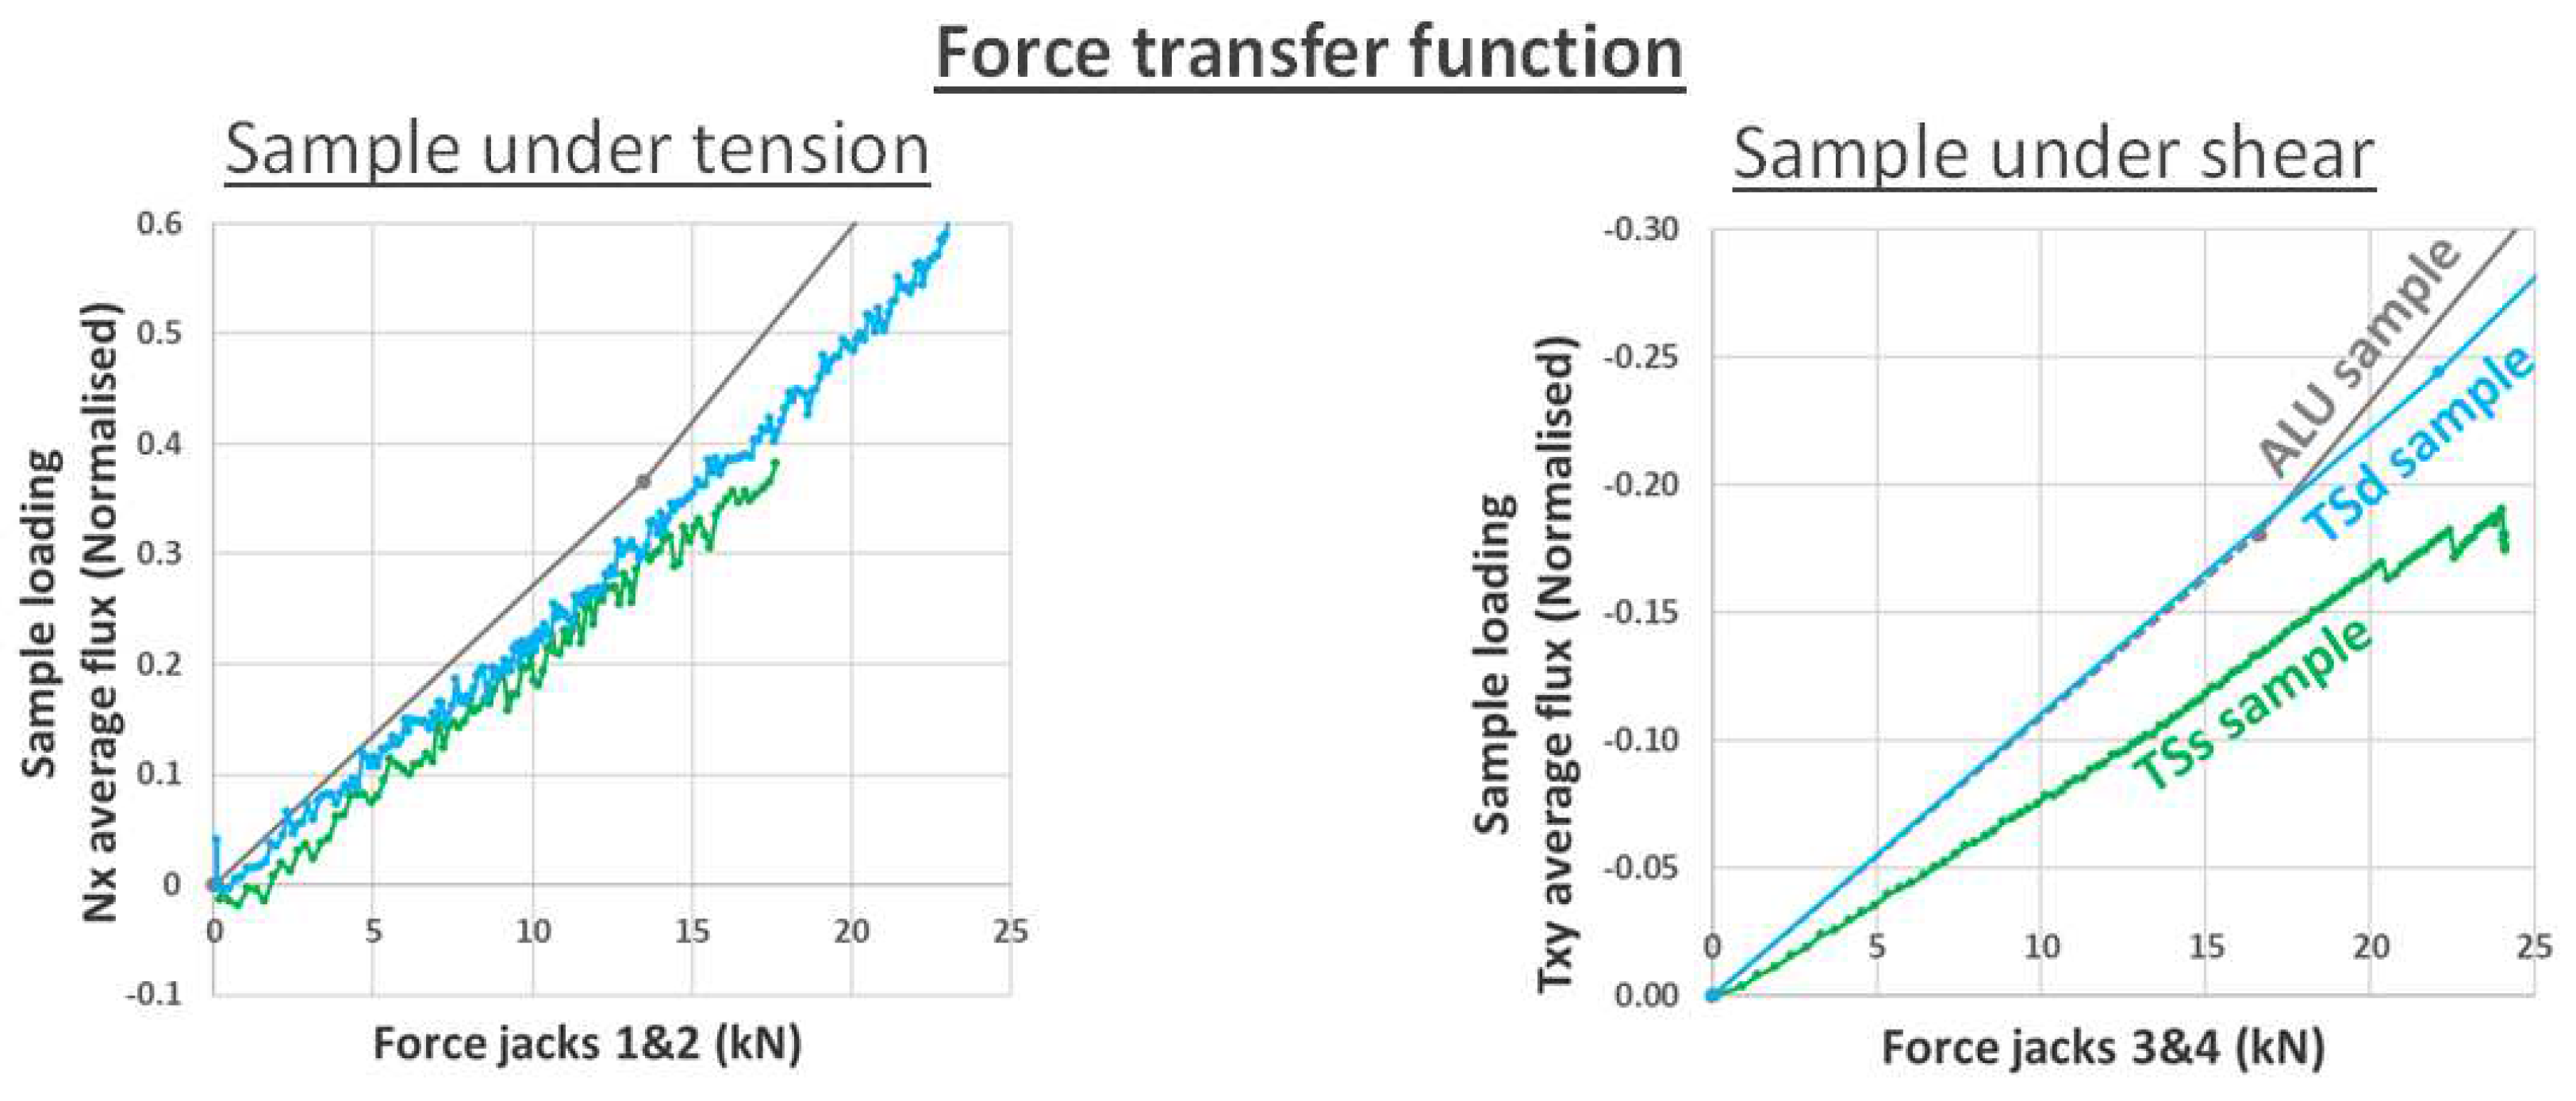
Figure 14.
Tension and shear idealized as homogeneous displacements imposed on the entire contour of a square panel.
Figure 14.
Tension and shear idealized as homogeneous displacements imposed on the entire contour of a square panel.
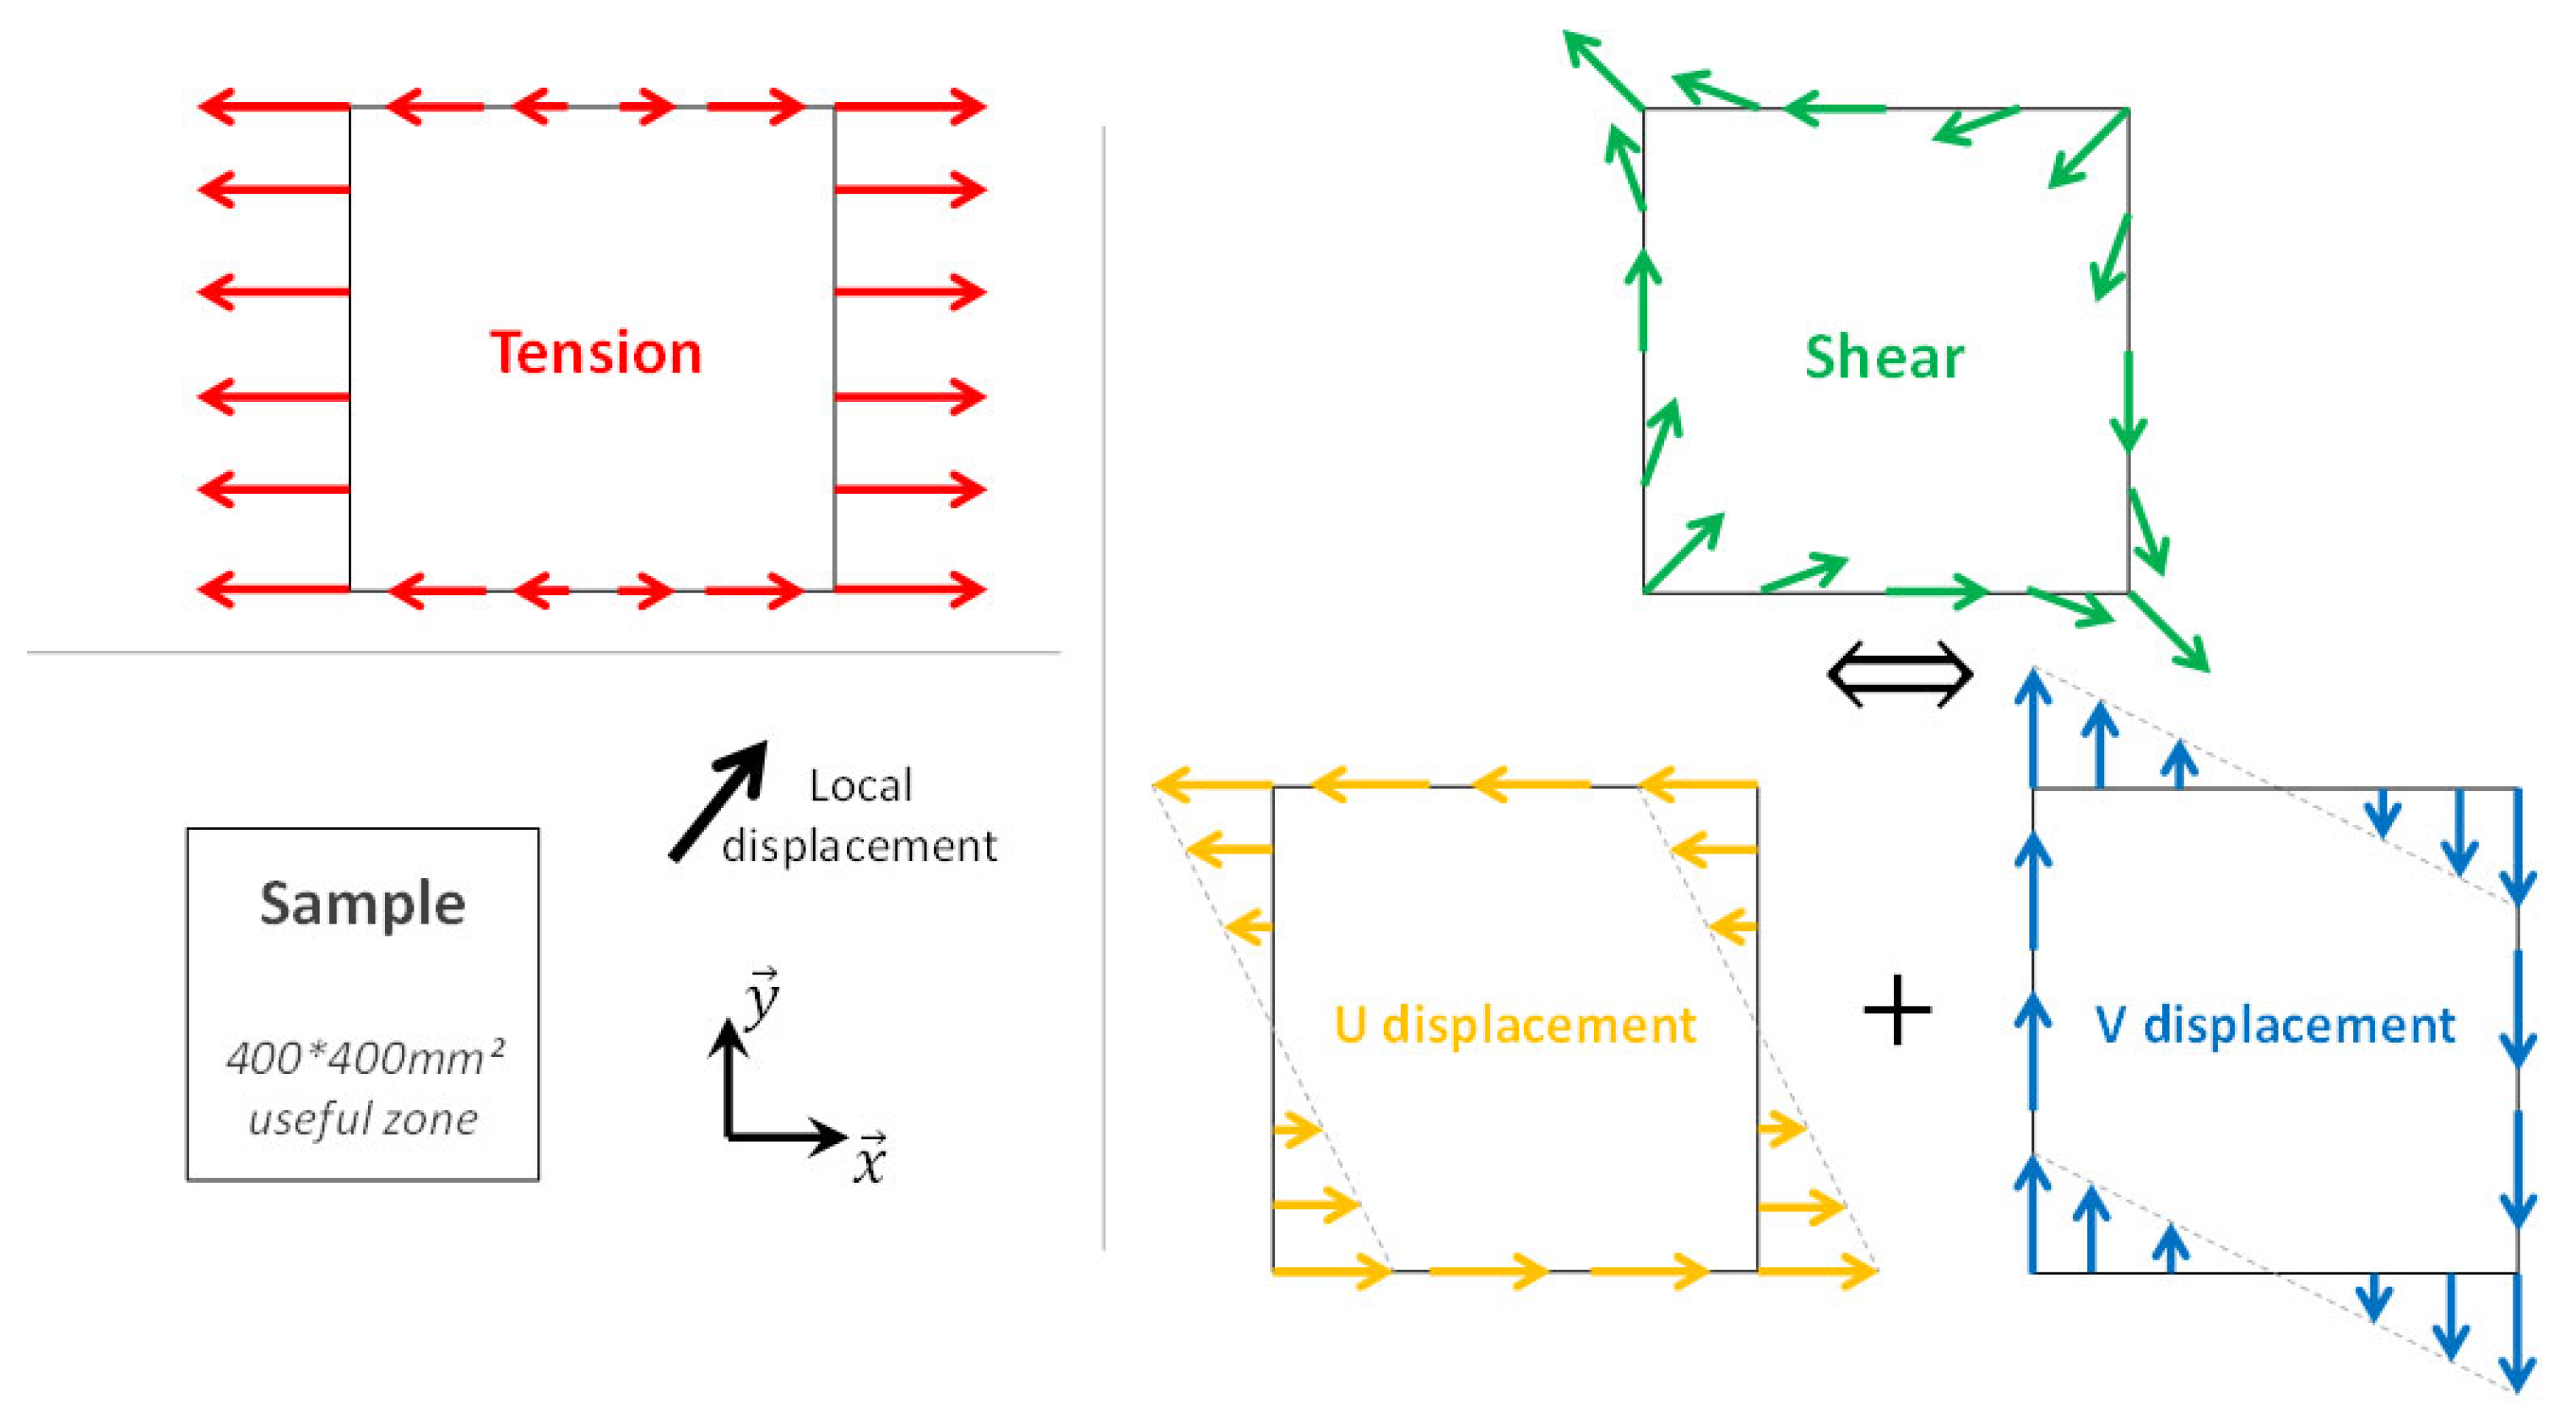
Figure 15.
Force flux (blue arrows) shapes with the VERTEX test rig (just before first failure) compared with ideal tension and shear, for a TP sample [47].
Figure 15.
Force flux (blue arrows) shapes with the VERTEX test rig (just before first failure) compared with ideal tension and shear, for a TP sample [47].
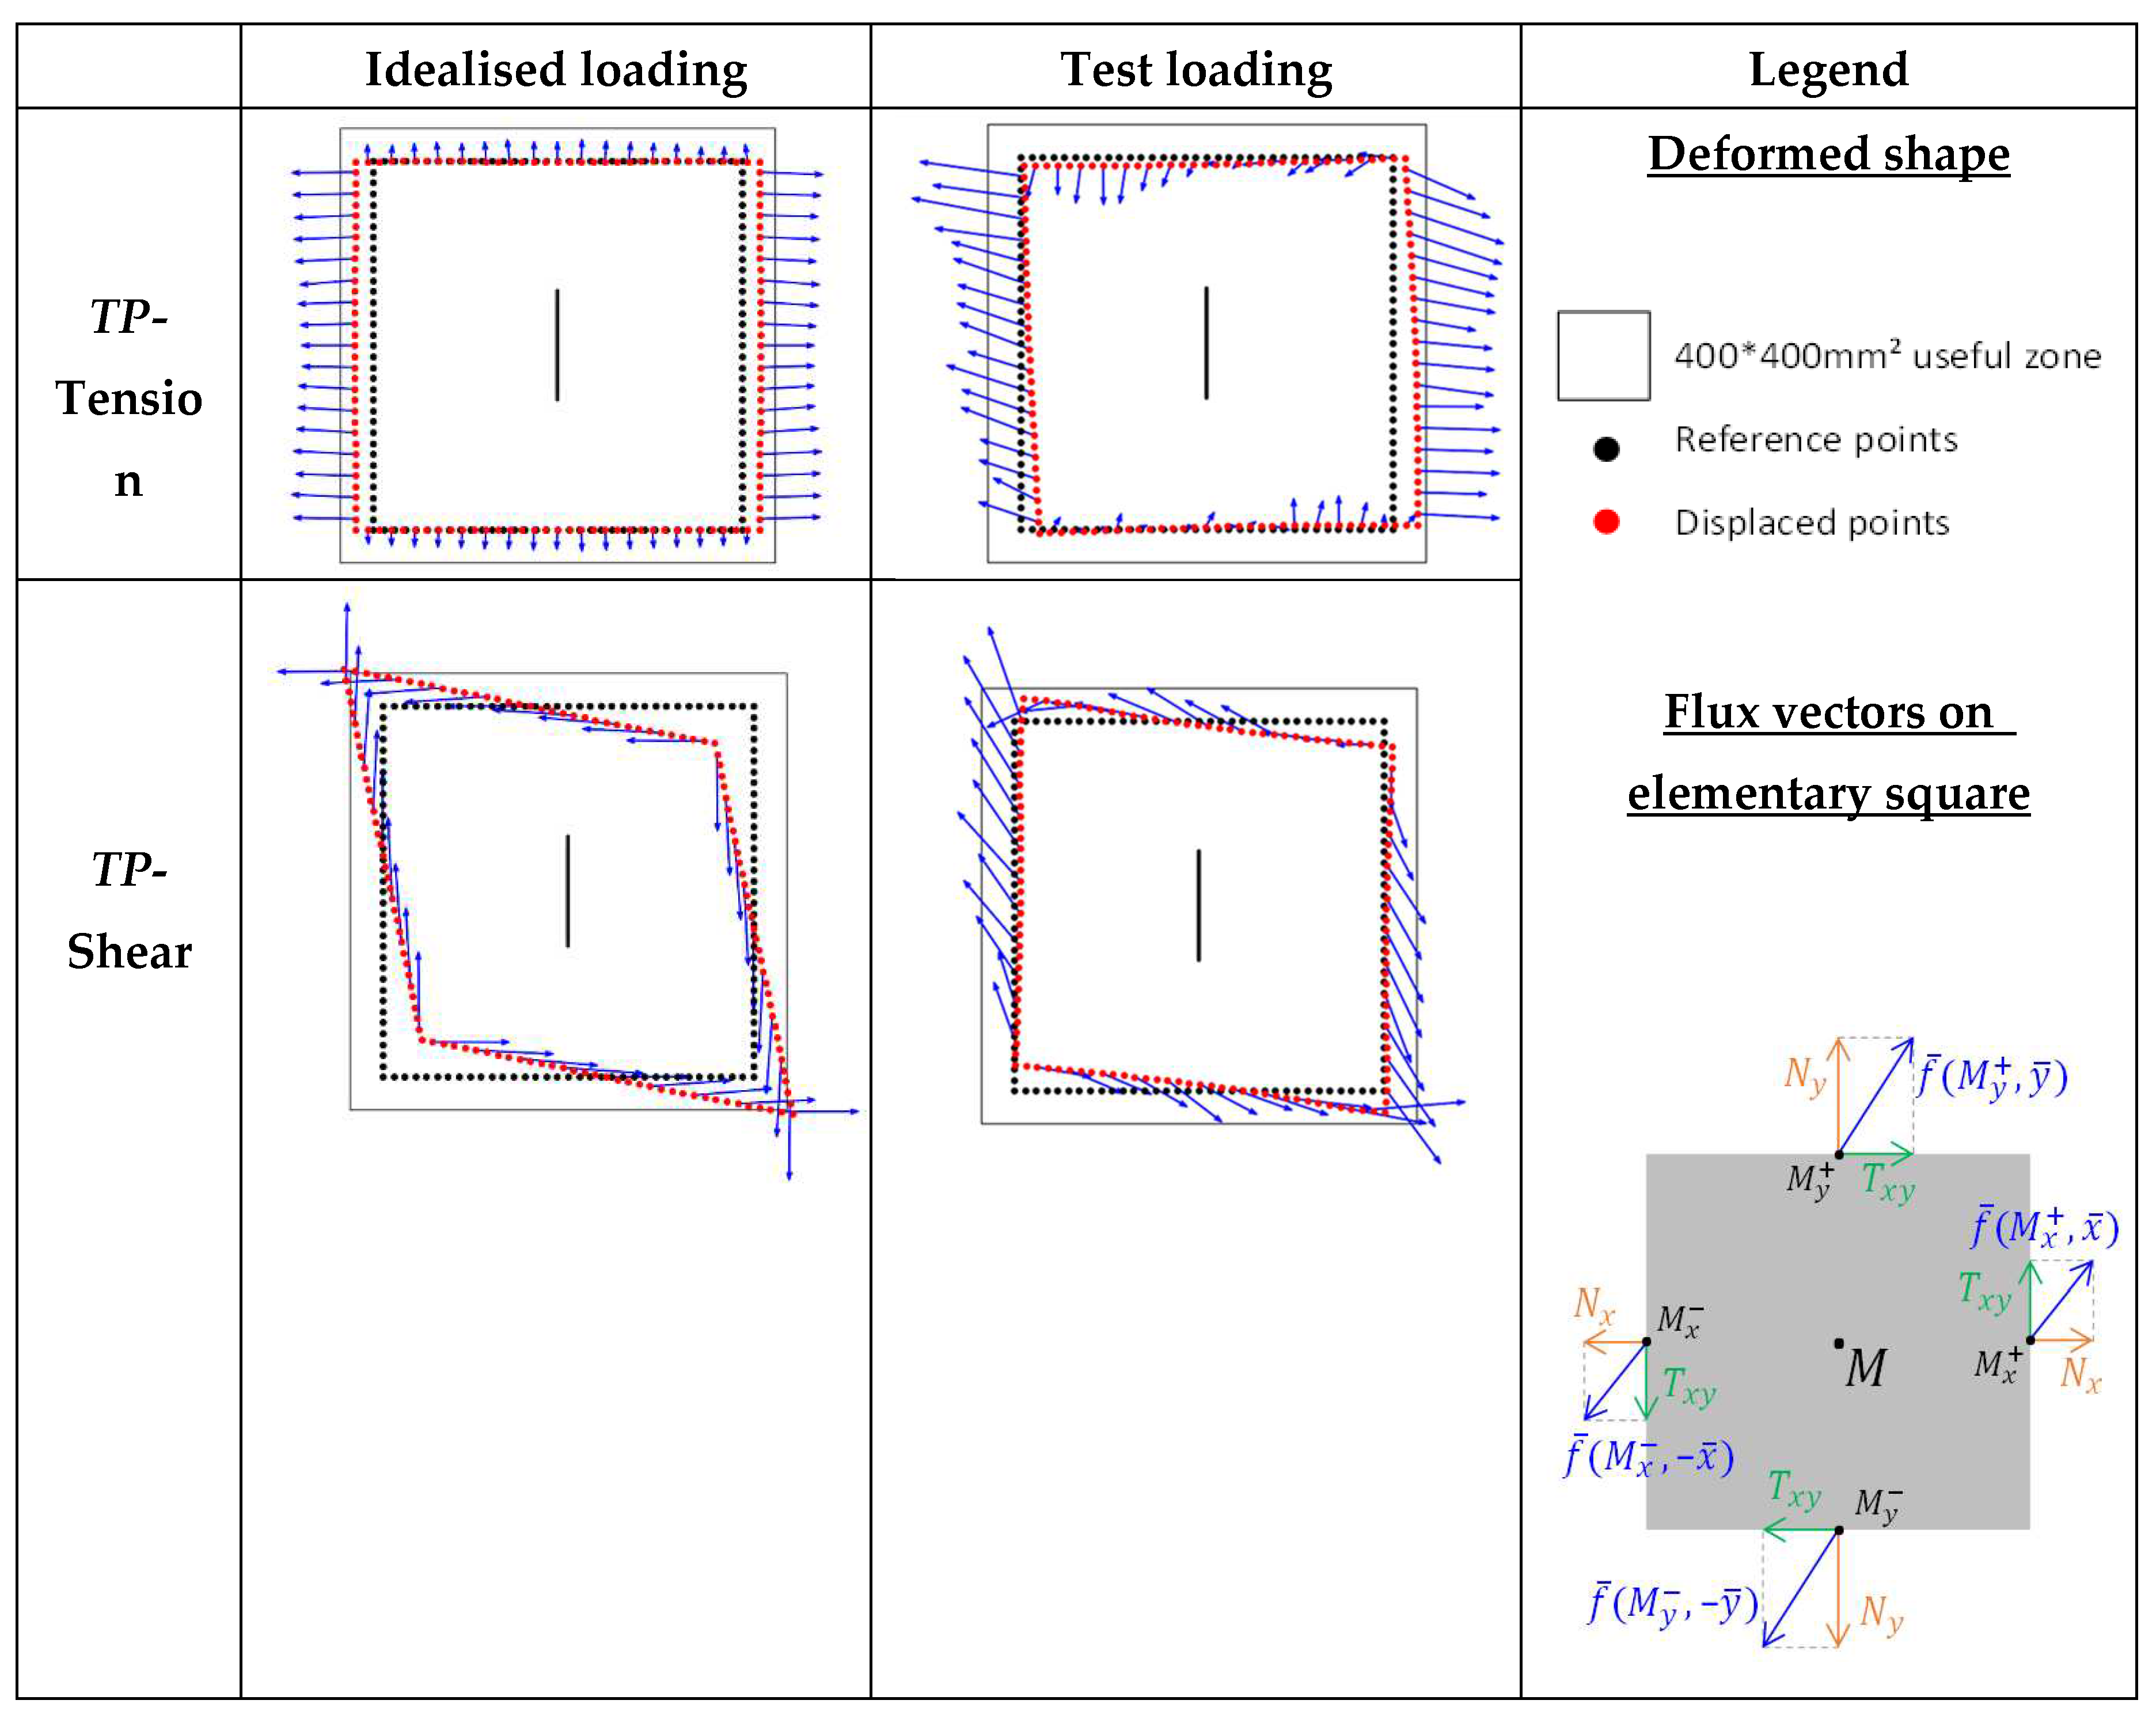
Figure 16.
Finite element modelling of the VERTEX test rig, composed of thin shell and beam elements (shell-thickness and beam-section rendering enabled).
Figure 16.
Finite element modelling of the VERTEX test rig, composed of thin shell and beam elements (shell-thickness and beam-section rendering enabled).
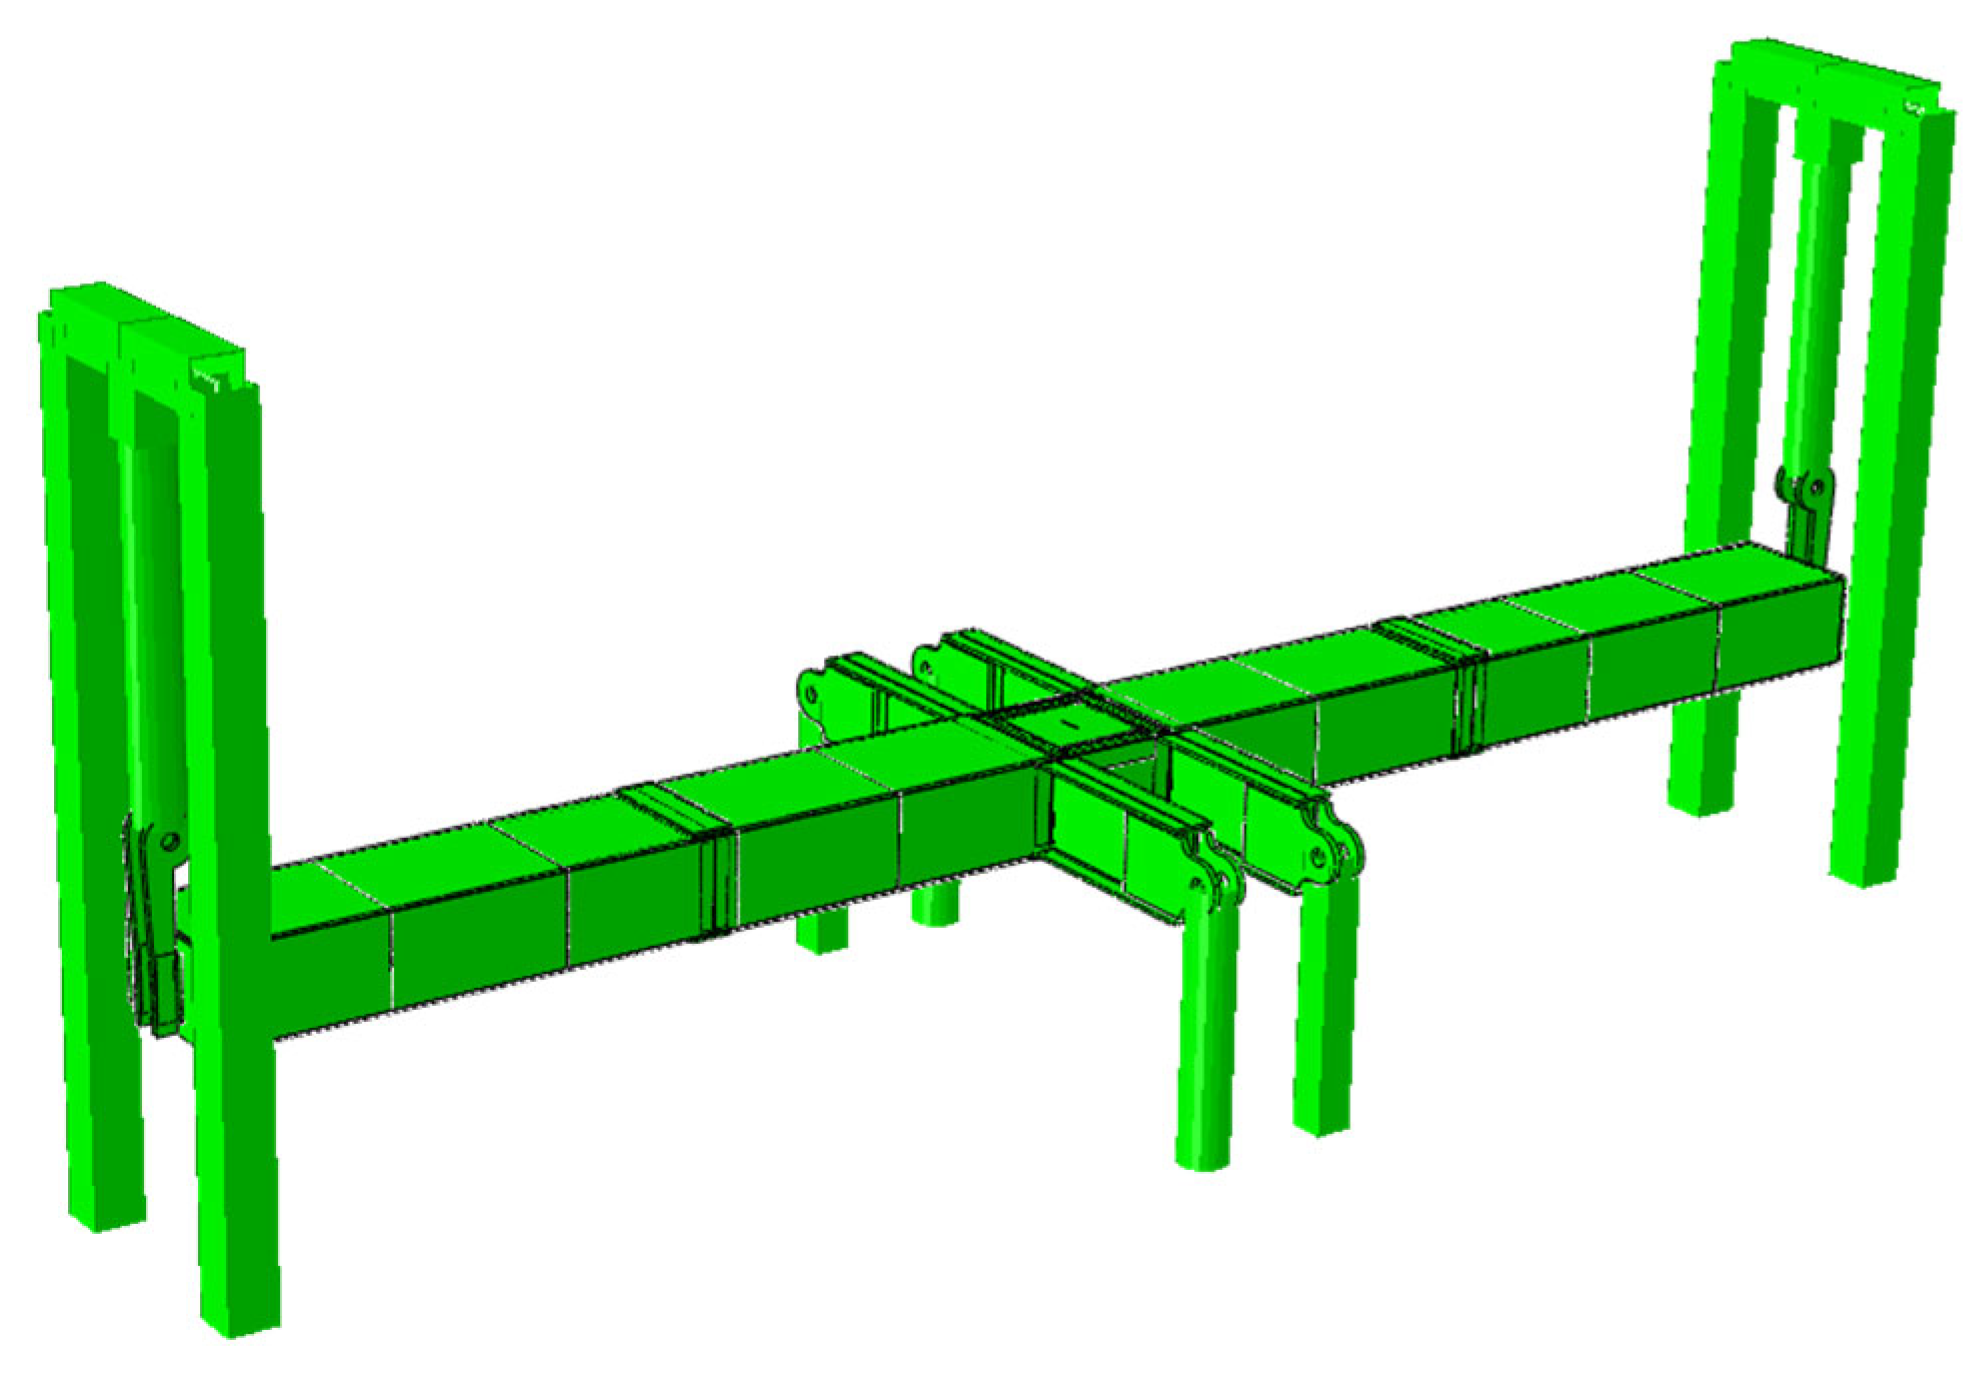
Figure 17.
View of the model meshed parts, with the main occulting panels removed to appreciate the internal structure serving the parts assembly (shell-thickness and beam-section rendering enabled).
Figure 17.
View of the model meshed parts, with the main occulting panels removed to appreciate the internal structure serving the parts assembly (shell-thickness and beam-section rendering enabled).
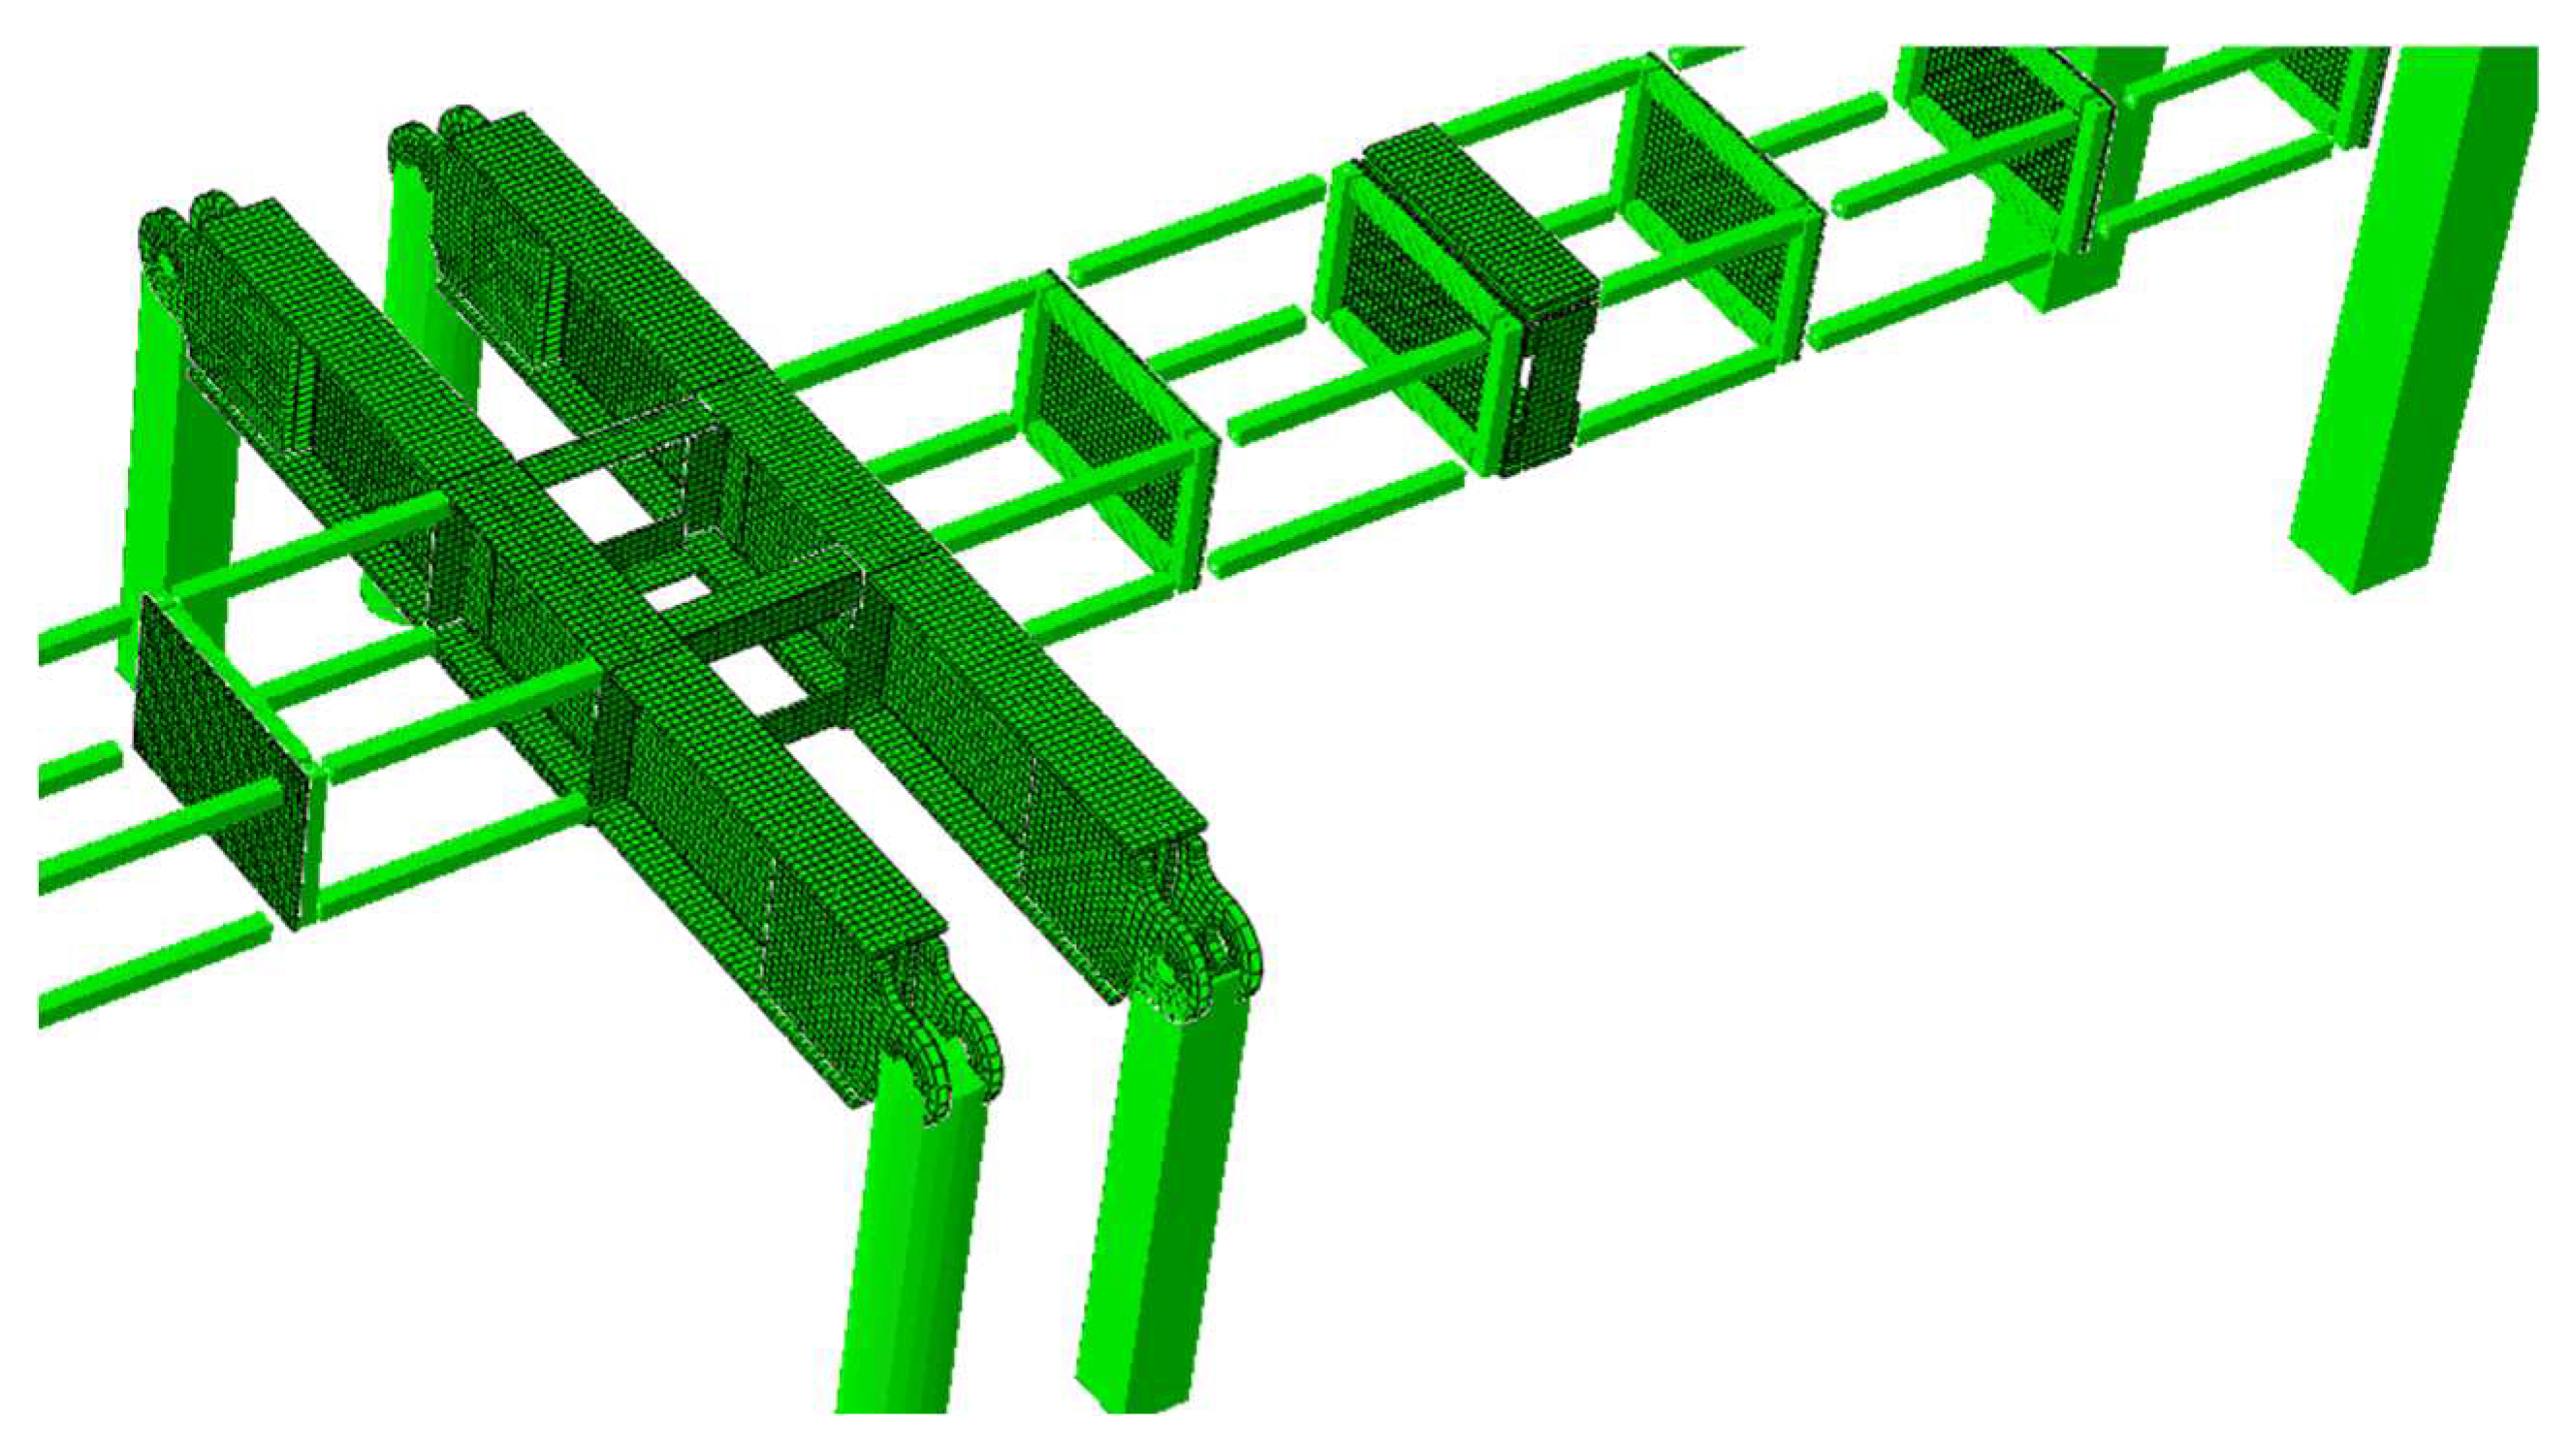
Figure 18.
Picture showing the many bolts (black dots) composing the VERTEX test rig up to the sample, focusing on the central box (open-hole VERTEX sample, not presented here).
Figure 18.
Picture showing the many bolts (black dots) composing the VERTEX test rig up to the sample, focusing on the central box (open-hole VERTEX sample, not presented here).
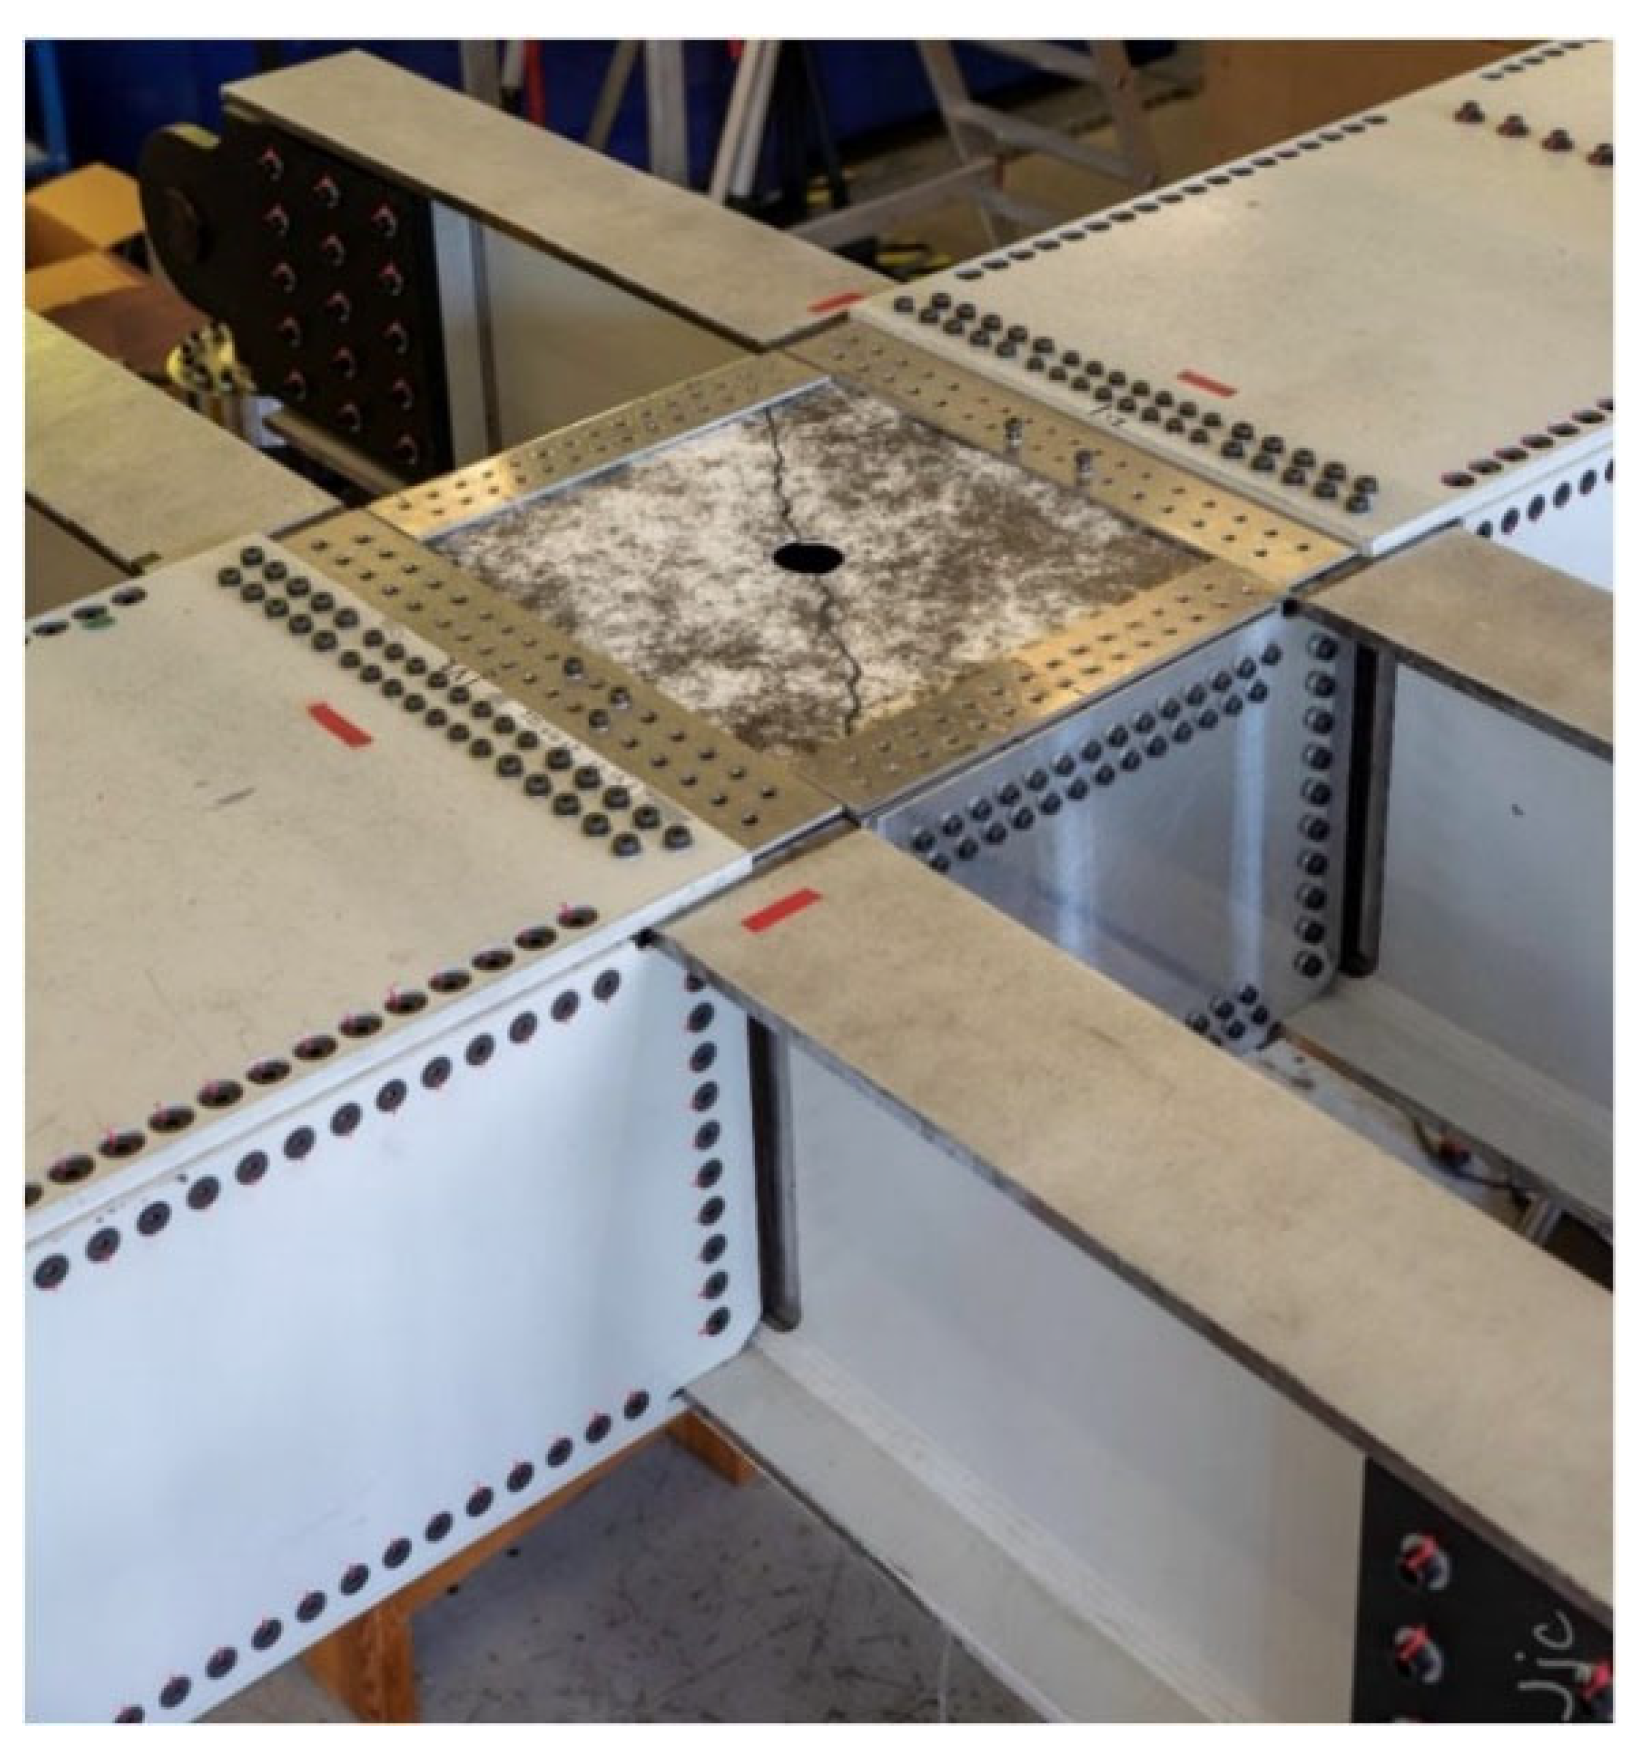
Figure 19.
Working principle of the modelling of bolted joint binding two parts, thanks to an intermediate connector tied to each part's nodes with a coupling.
Figure 19.
Working principle of the modelling of bolted joint binding two parts, thanks to an intermediate connector tied to each part's nodes with a coupling.
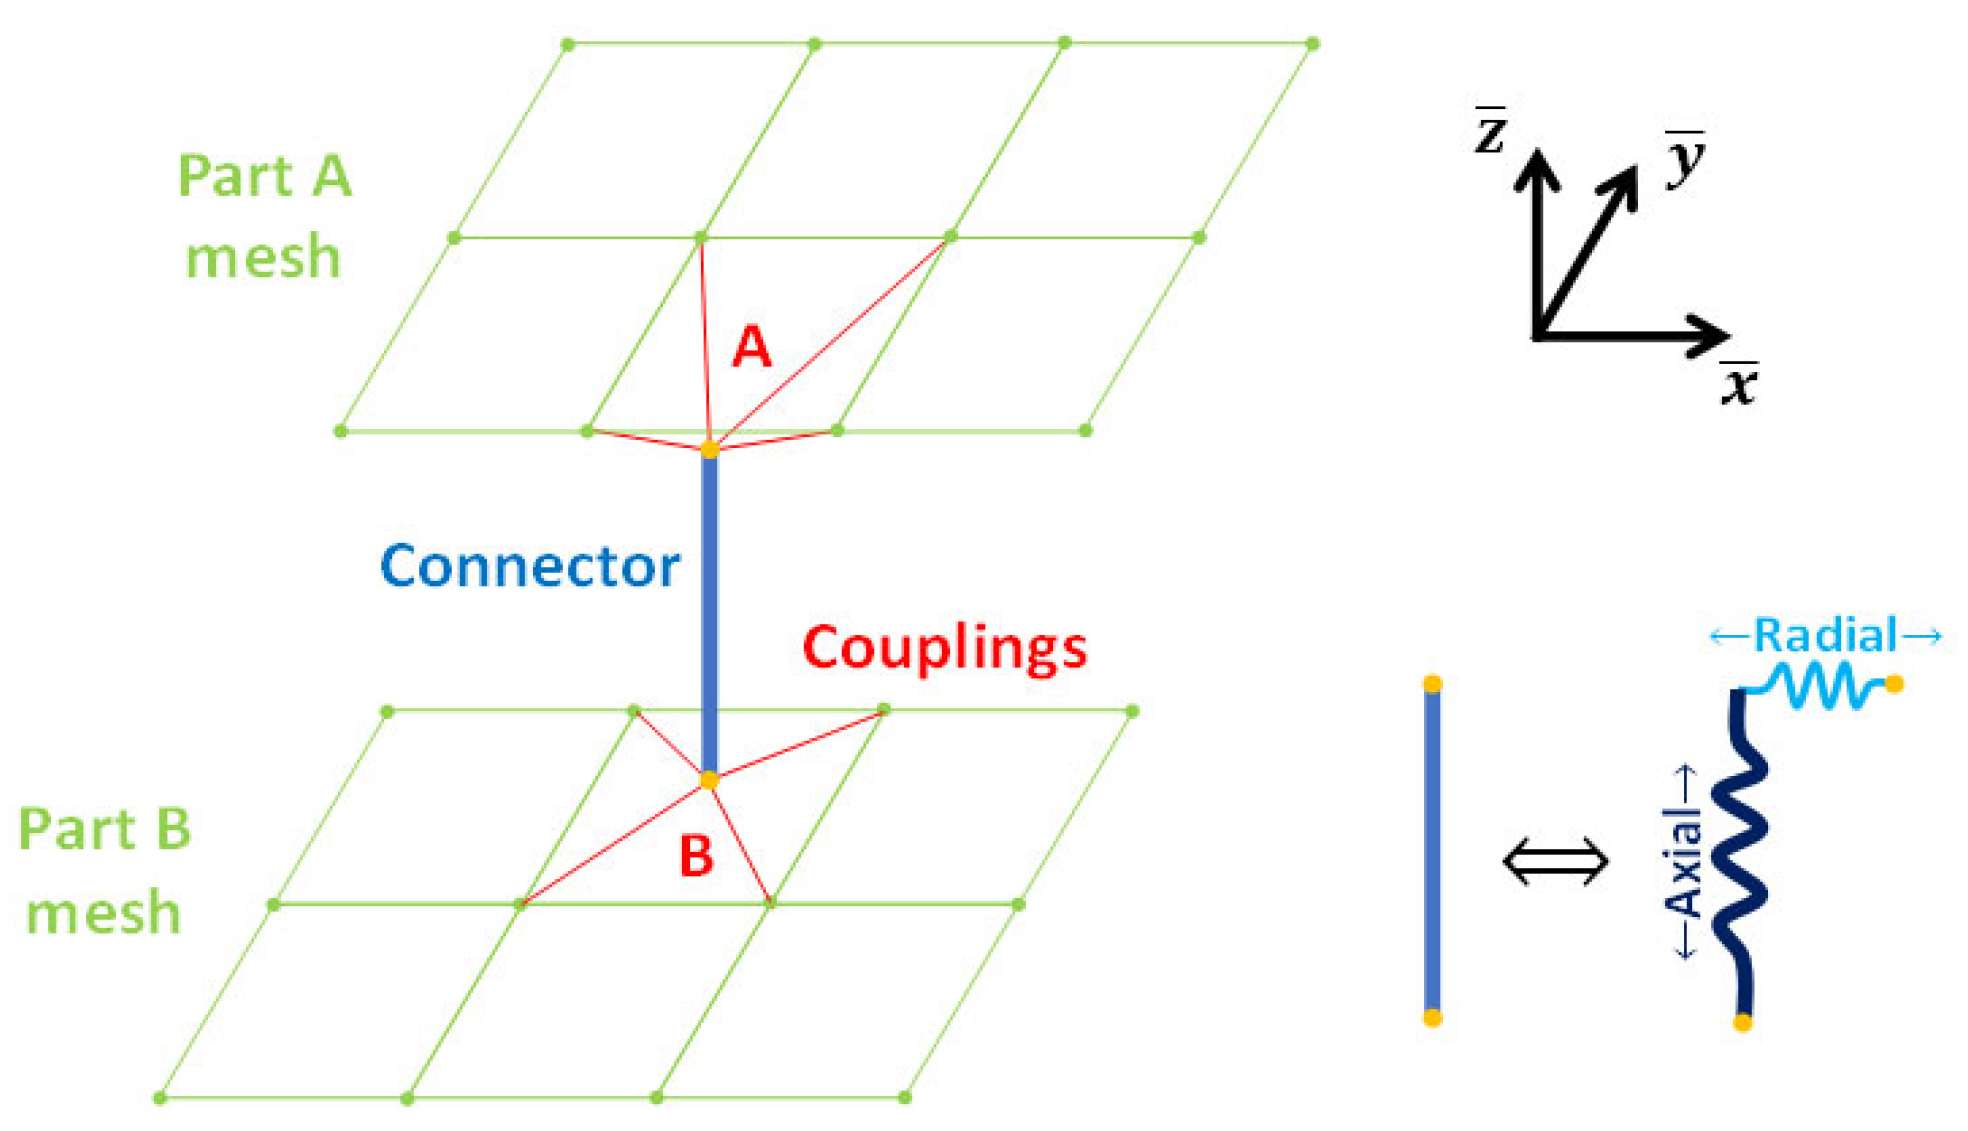
Figure 20.
Finite element meshing of the sample with only one element in the thickness to implement thick shell elements.
Figure 20.
Finite element meshing of the sample with only one element in the thickness to implement thick shell elements.
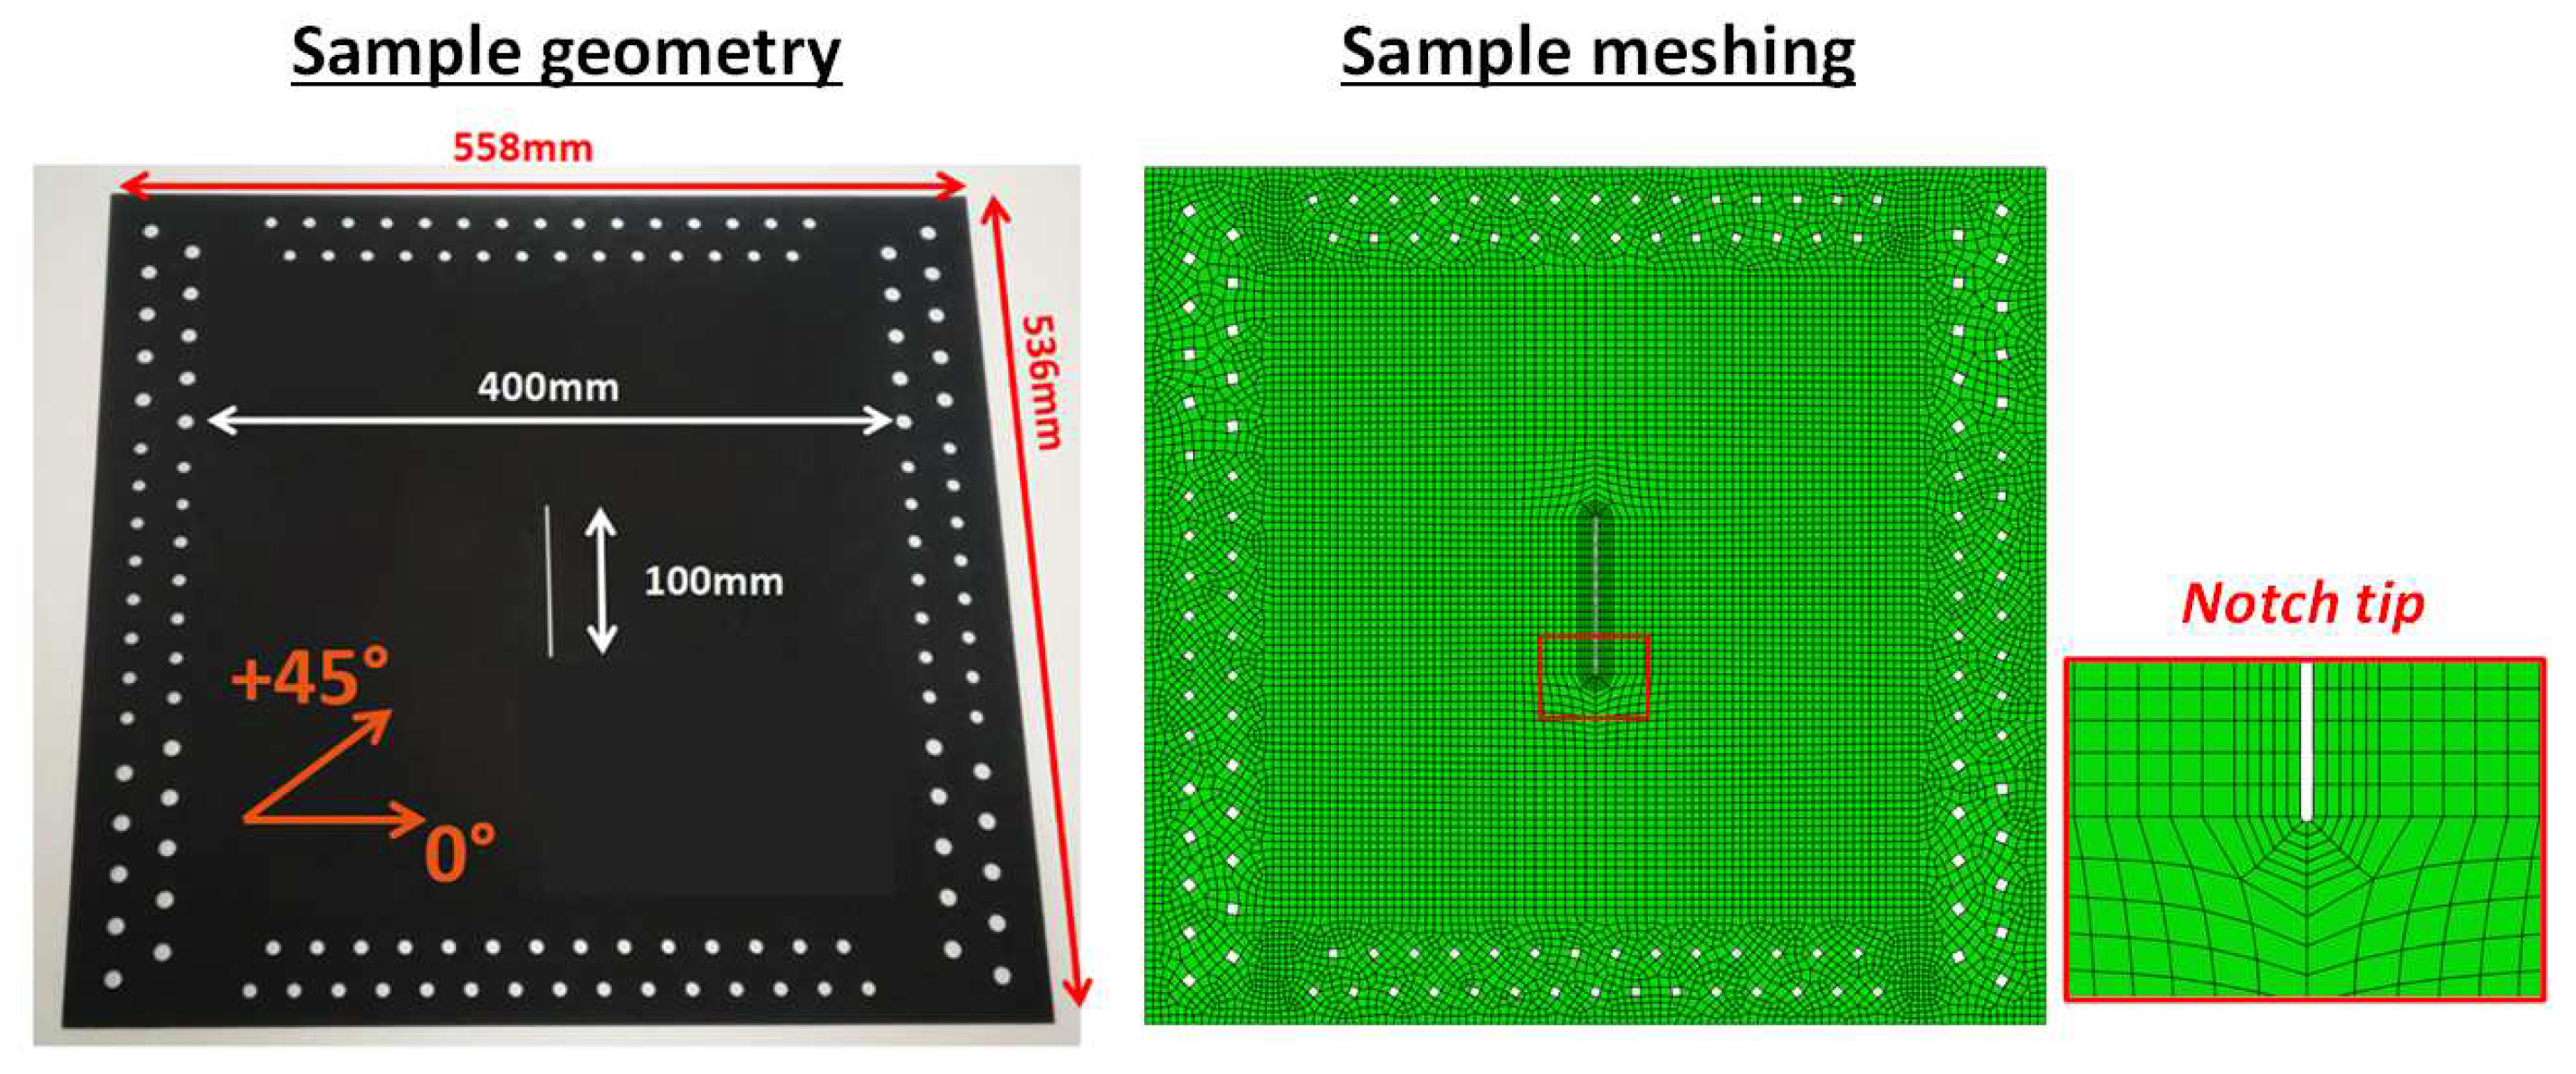
Figure 21.
Exploded view around the sample to illustrate the connector-coupling modelling of bolted joints – only a few couplings are plotted to avoid visualization overload.
Figure 21.
Exploded view around the sample to illustrate the connector-coupling modelling of bolted joints – only a few couplings are plotted to avoid visualization overload.
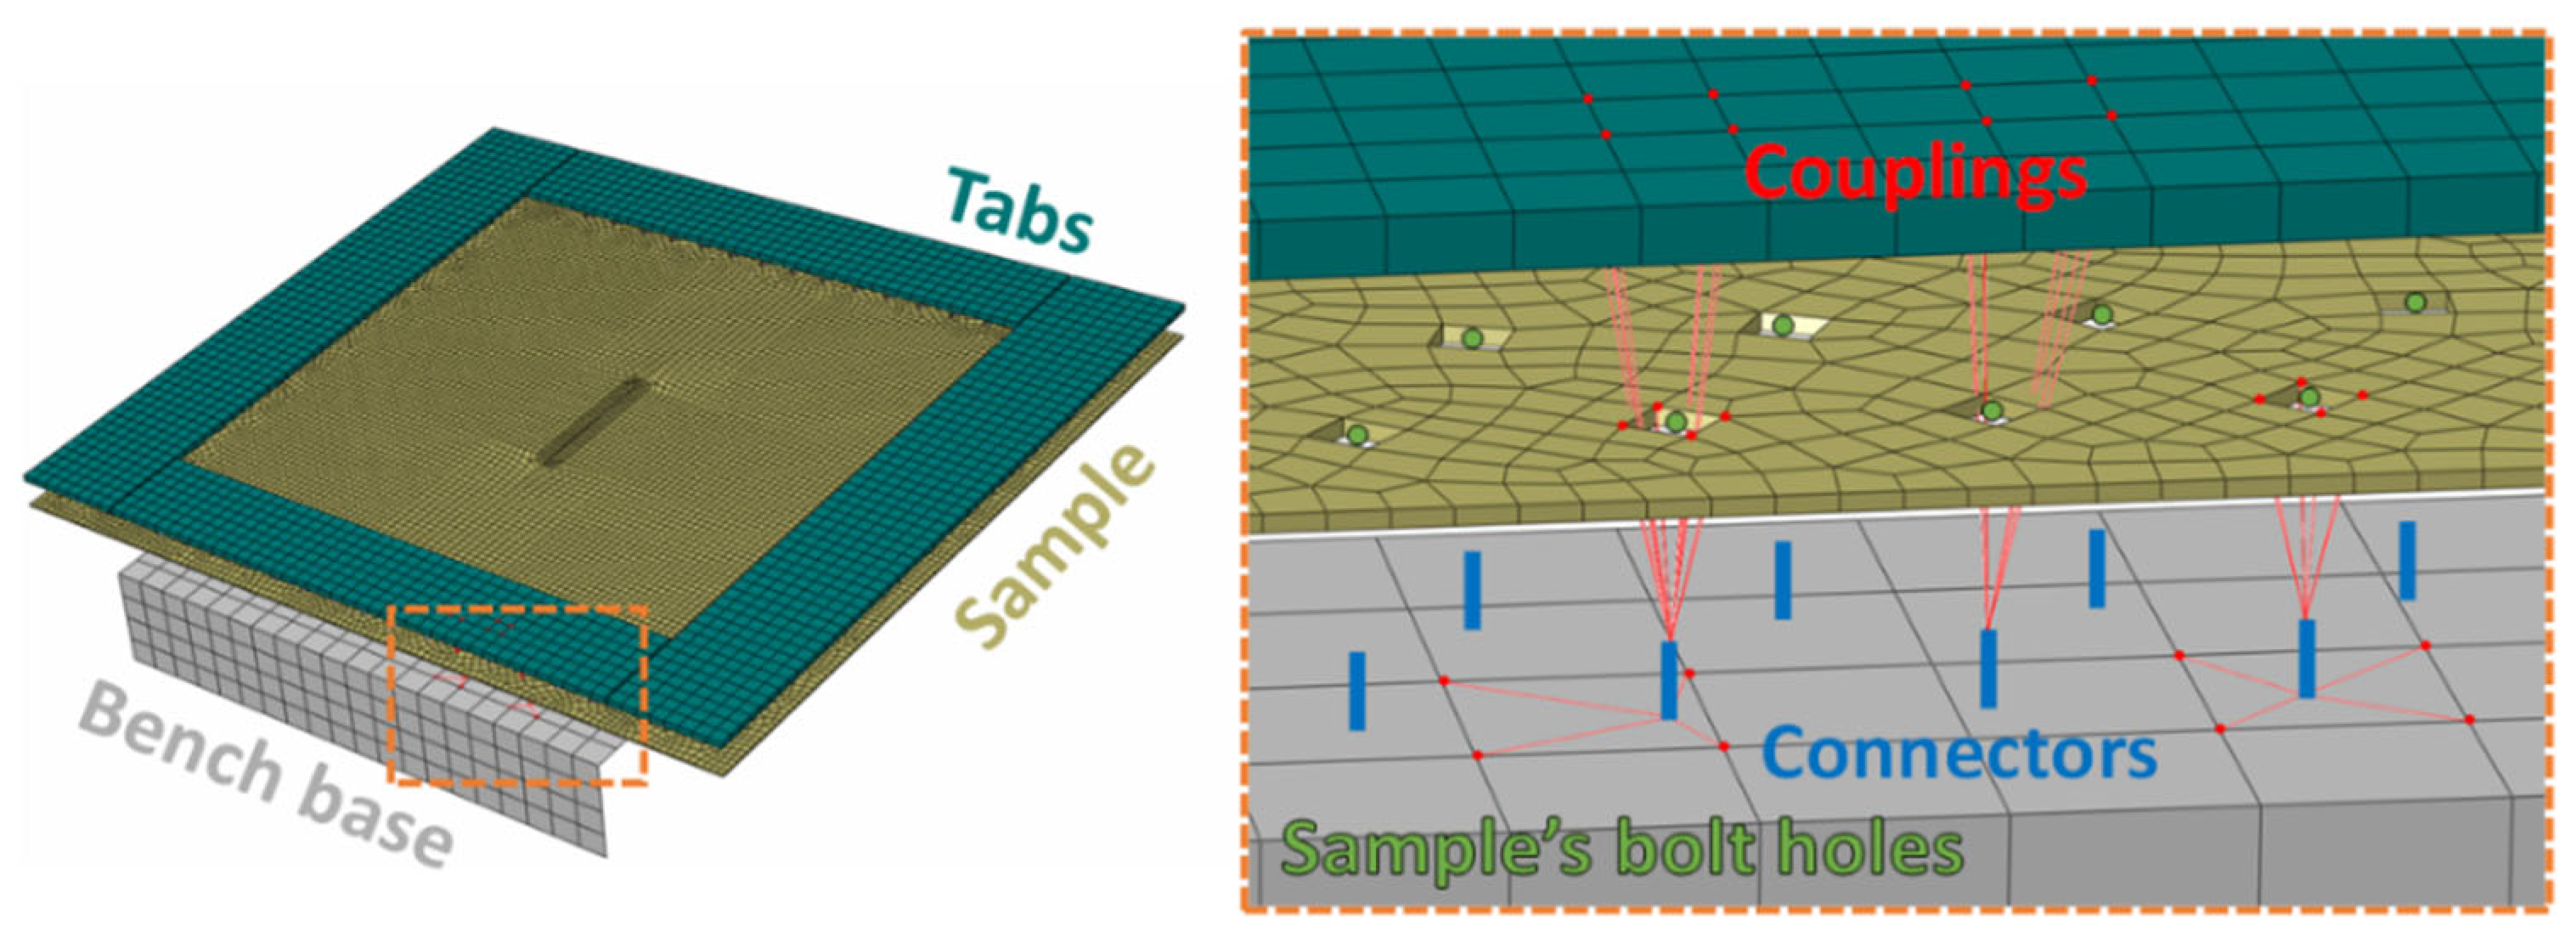
Figure 22.
Separation of all bolts of the VERTEX bench into three sets (main beam, central box, sample) to differentiate the stiffnesses of the connectors.
Figure 22.
Separation of all bolts of the VERTEX bench into three sets (main beam, central box, sample) to differentiate the stiffnesses of the connectors.
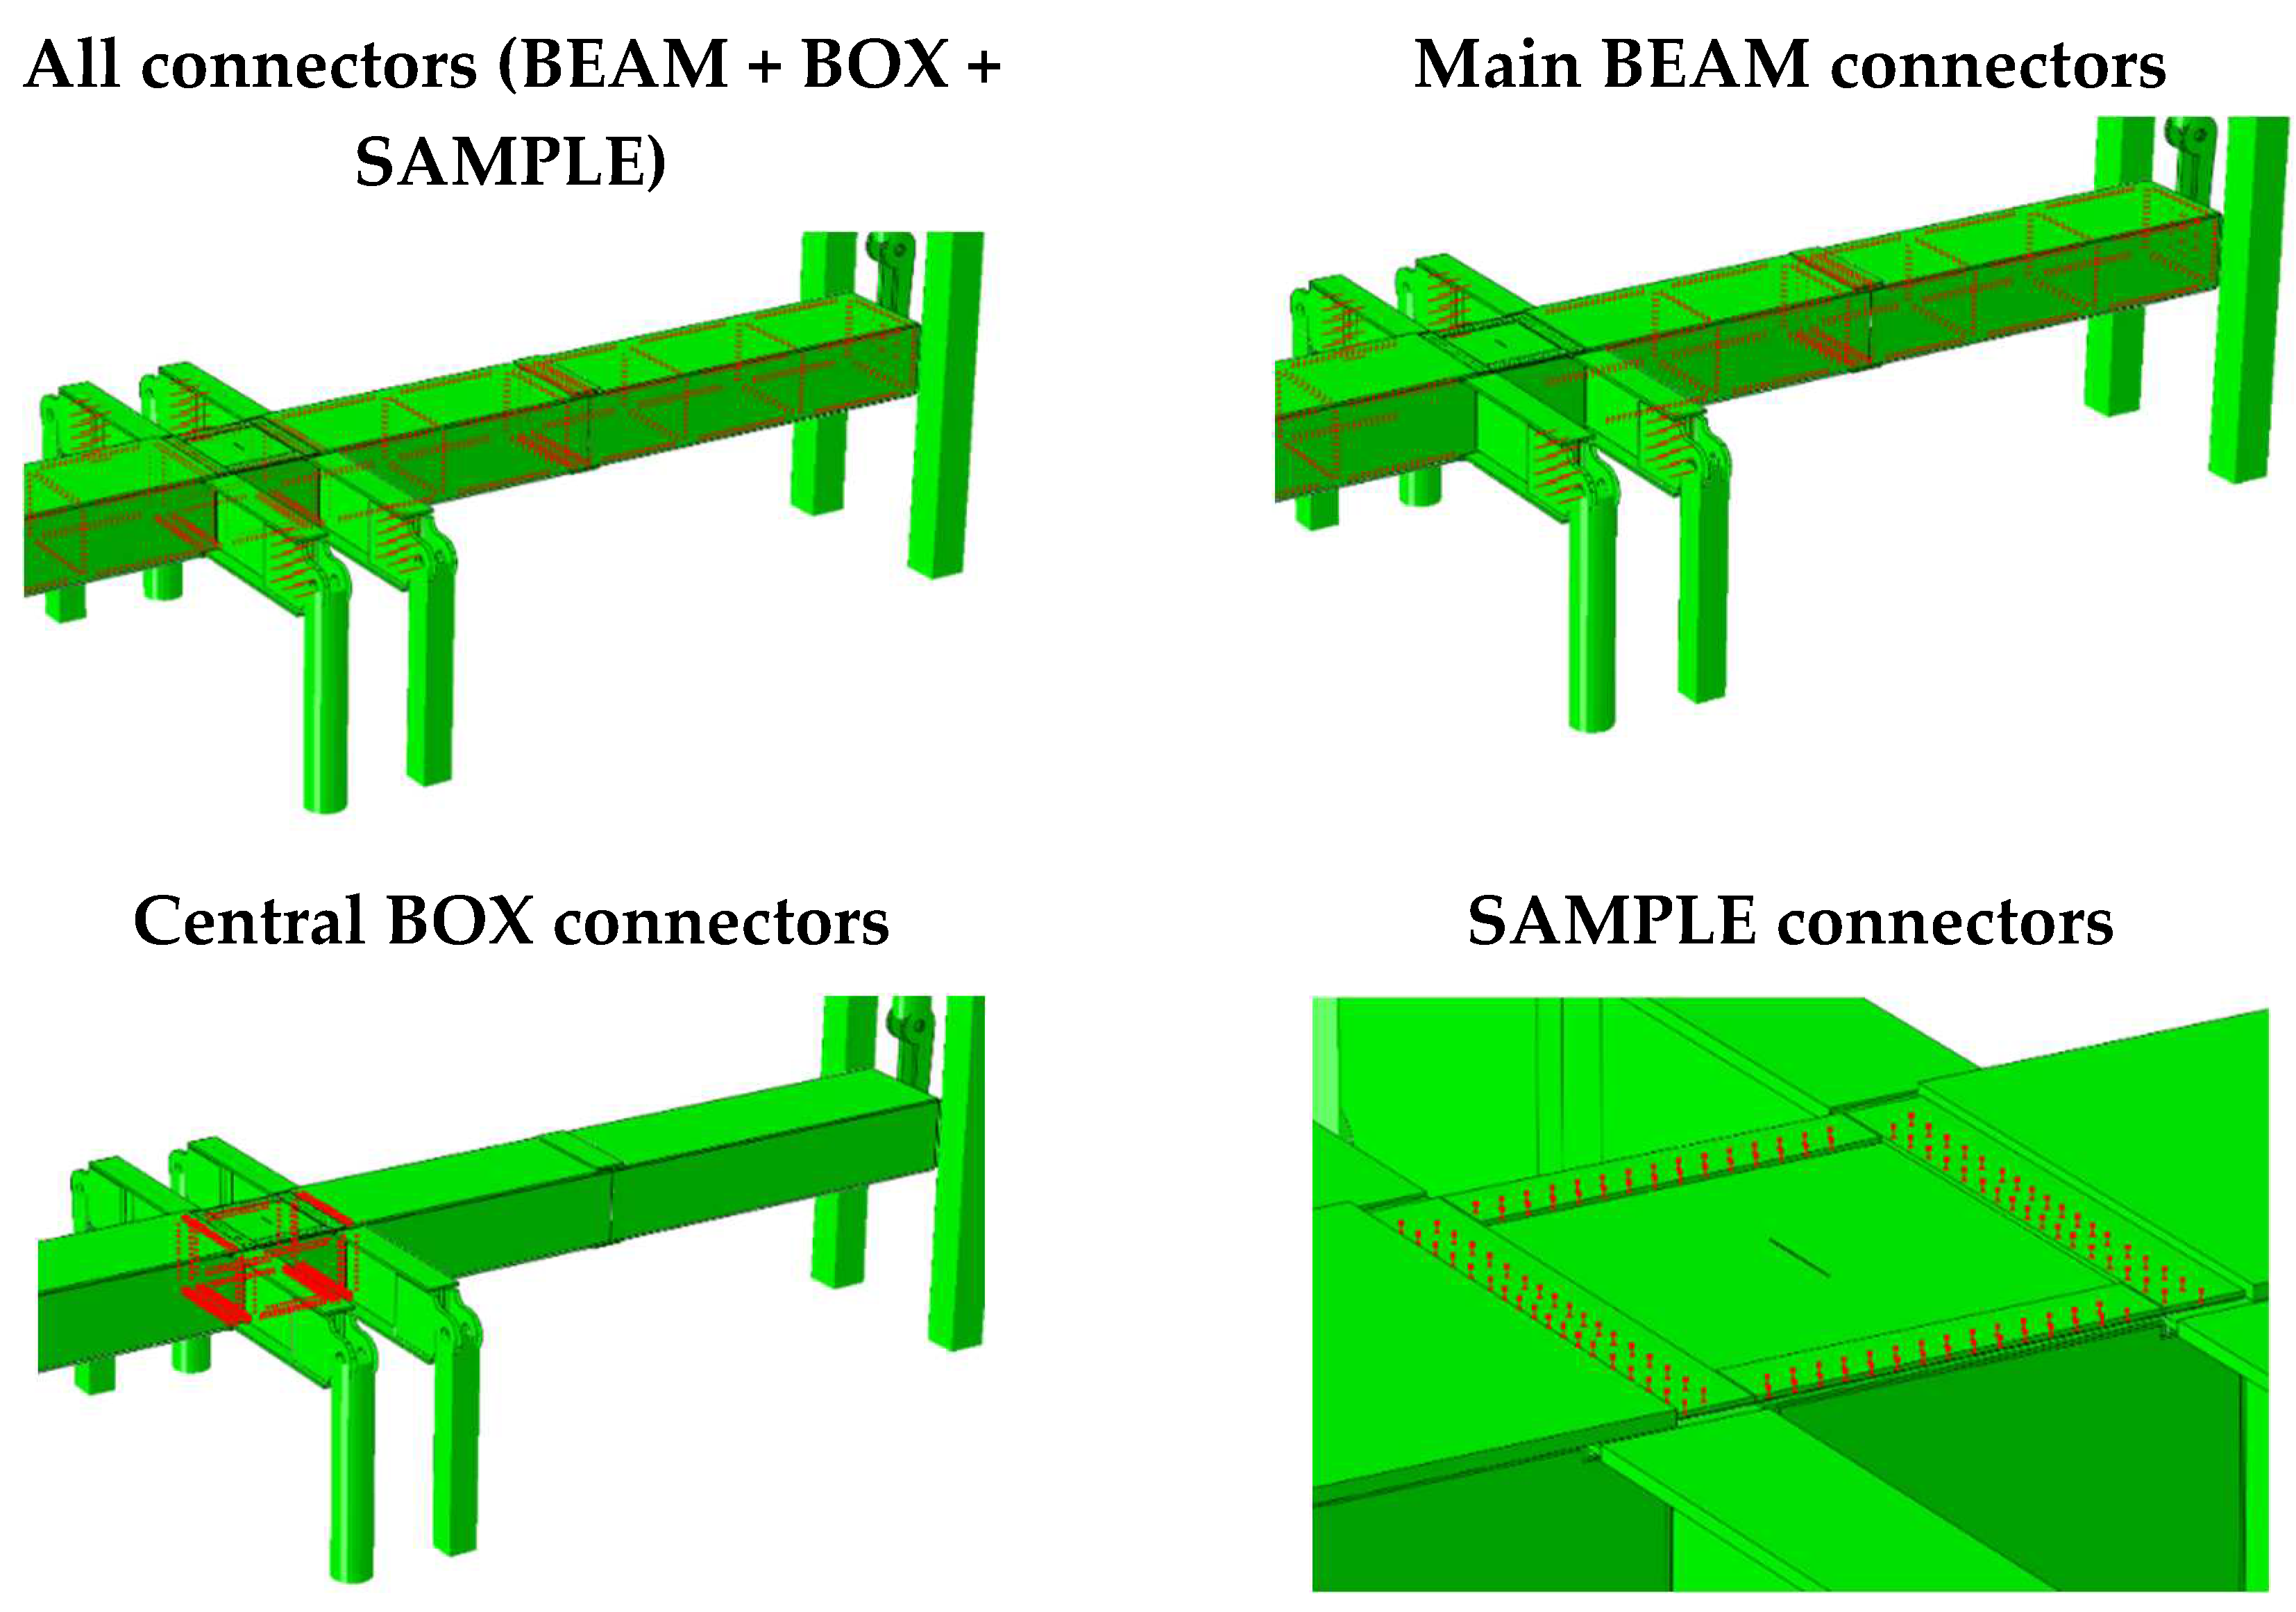
Figure 23.
TSs sample under tension: effect of the variation of a few parameters on the machine useful stiffness and comparison with experiment.
Figure 23.
TSs sample under tension: effect of the variation of a few parameters on the machine useful stiffness and comparison with experiment.
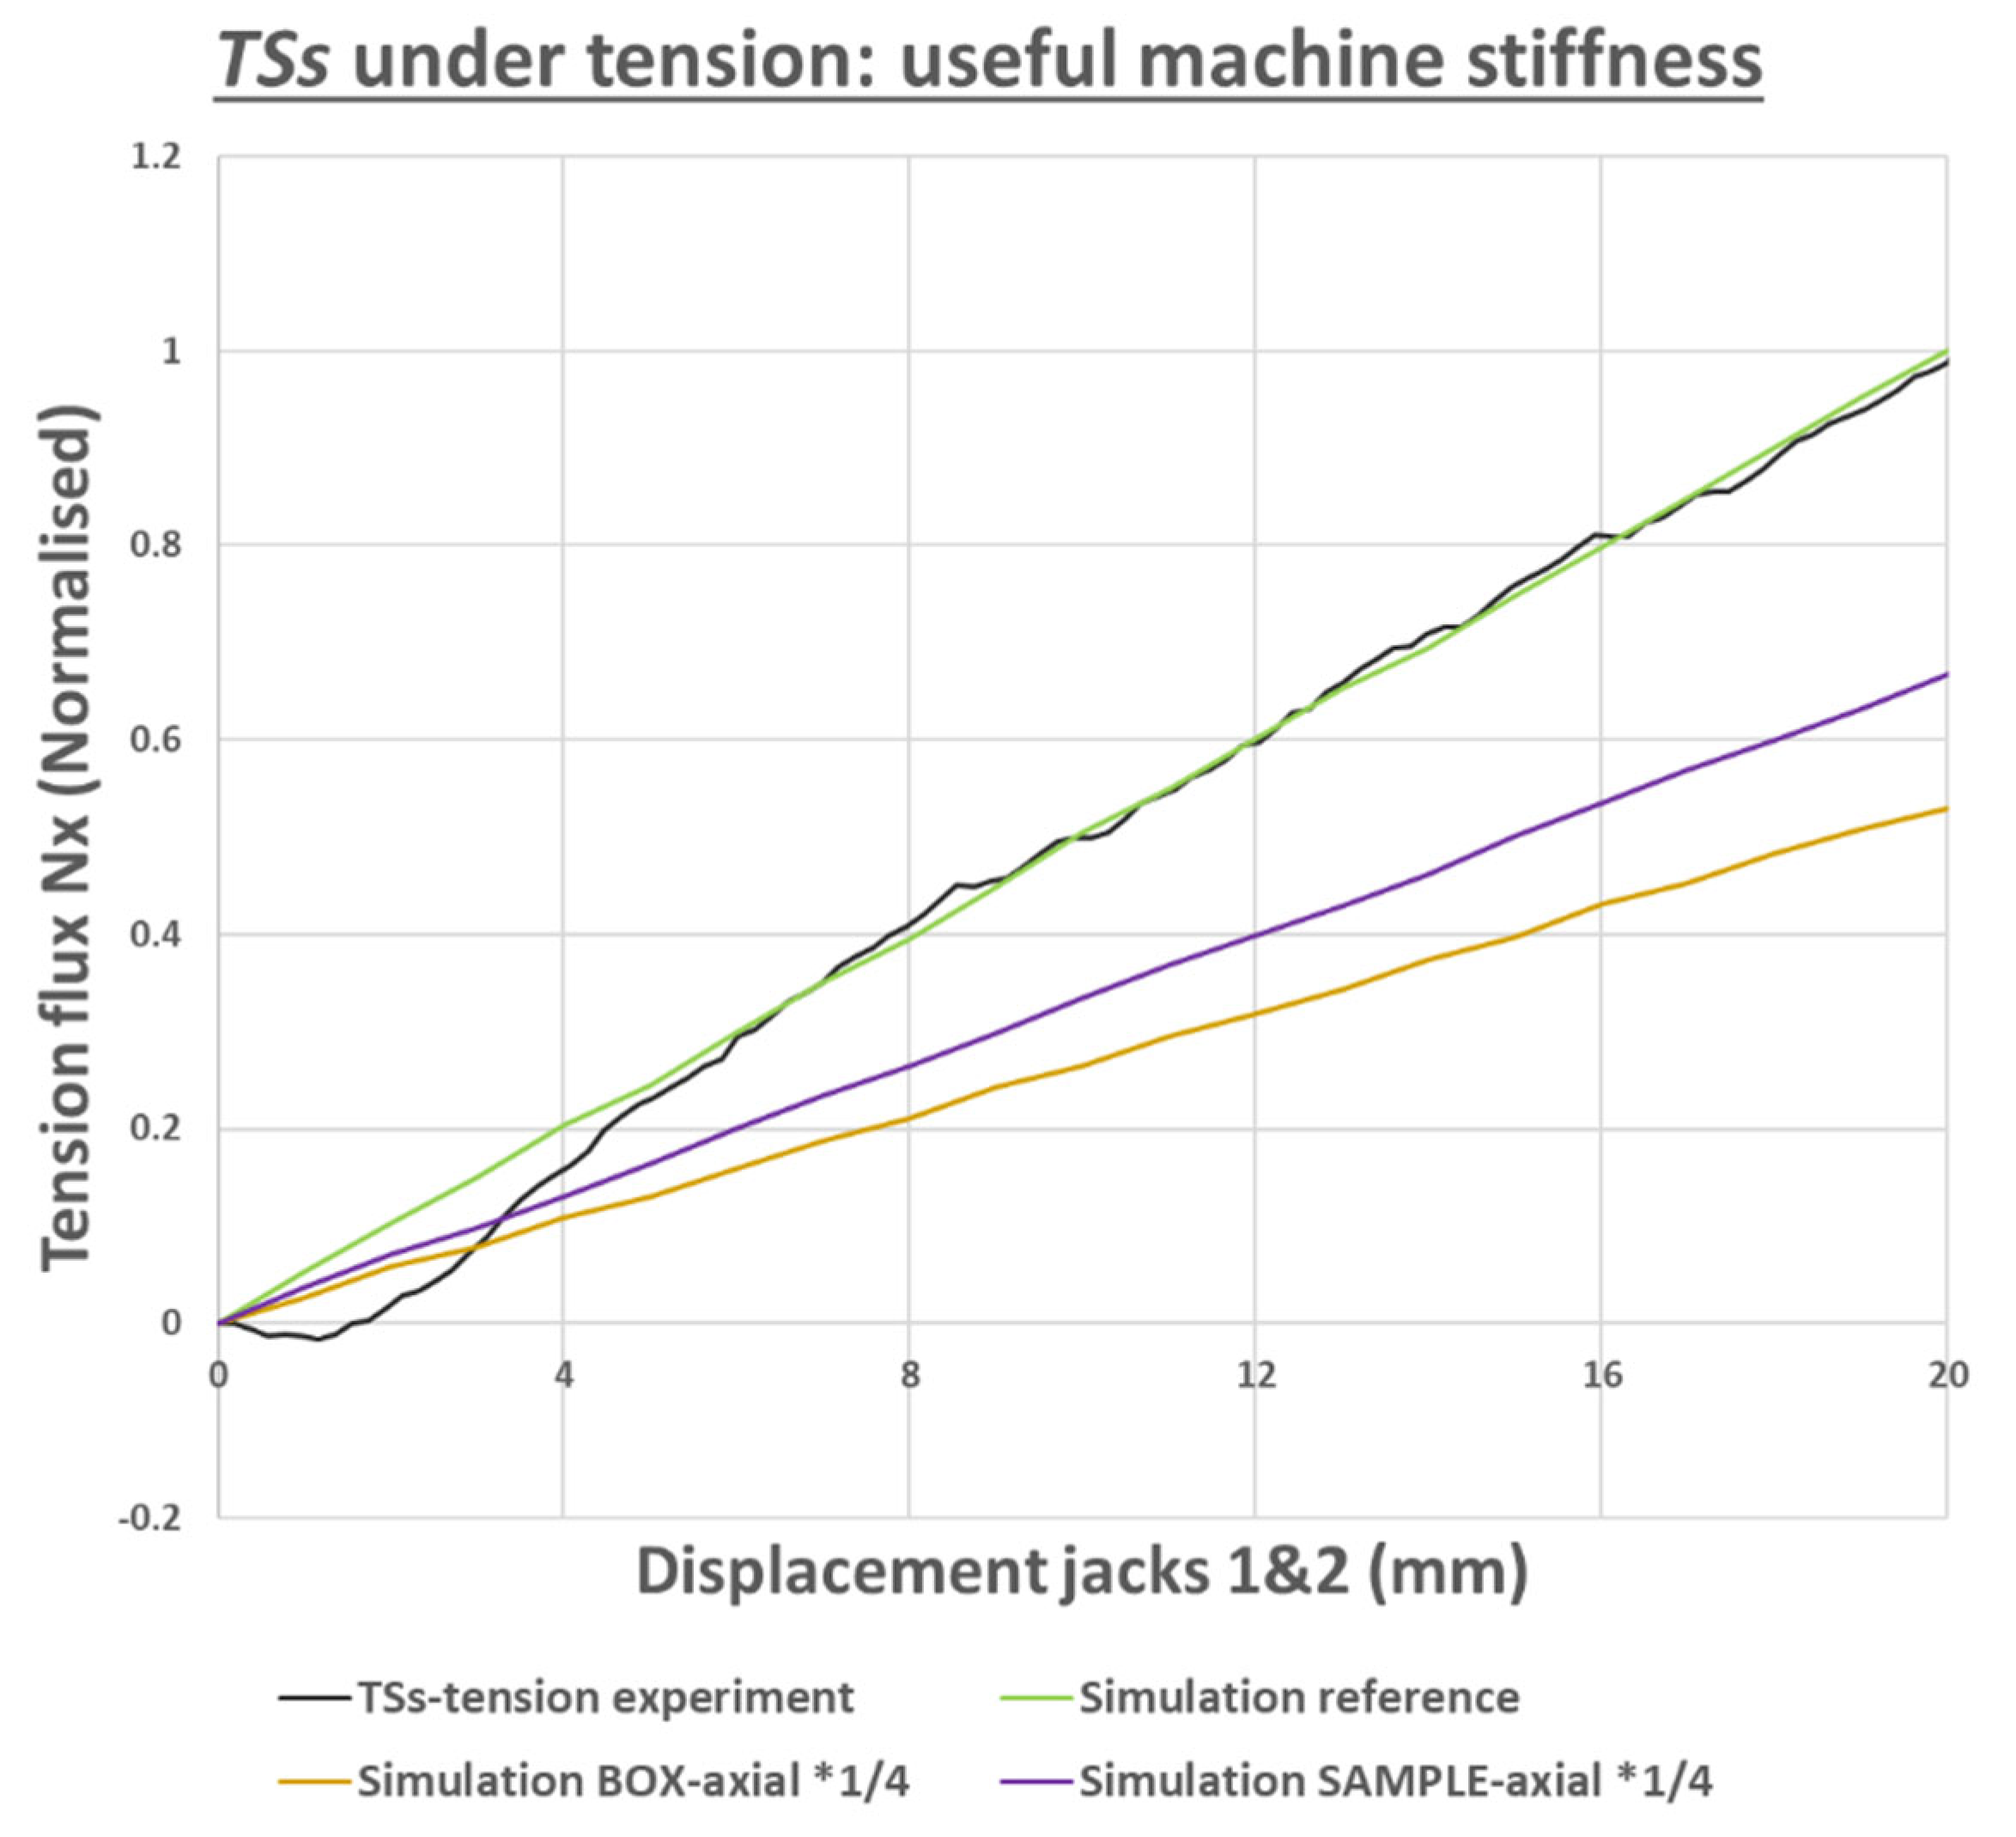
Figure 24.
TSs sample under shear: effect of the variation of a few parameters on the machine tension shear coupling and the useful stiffness - comparison with experiment.
Figure 24.
TSs sample under shear: effect of the variation of a few parameters on the machine tension shear coupling and the useful stiffness - comparison with experiment.
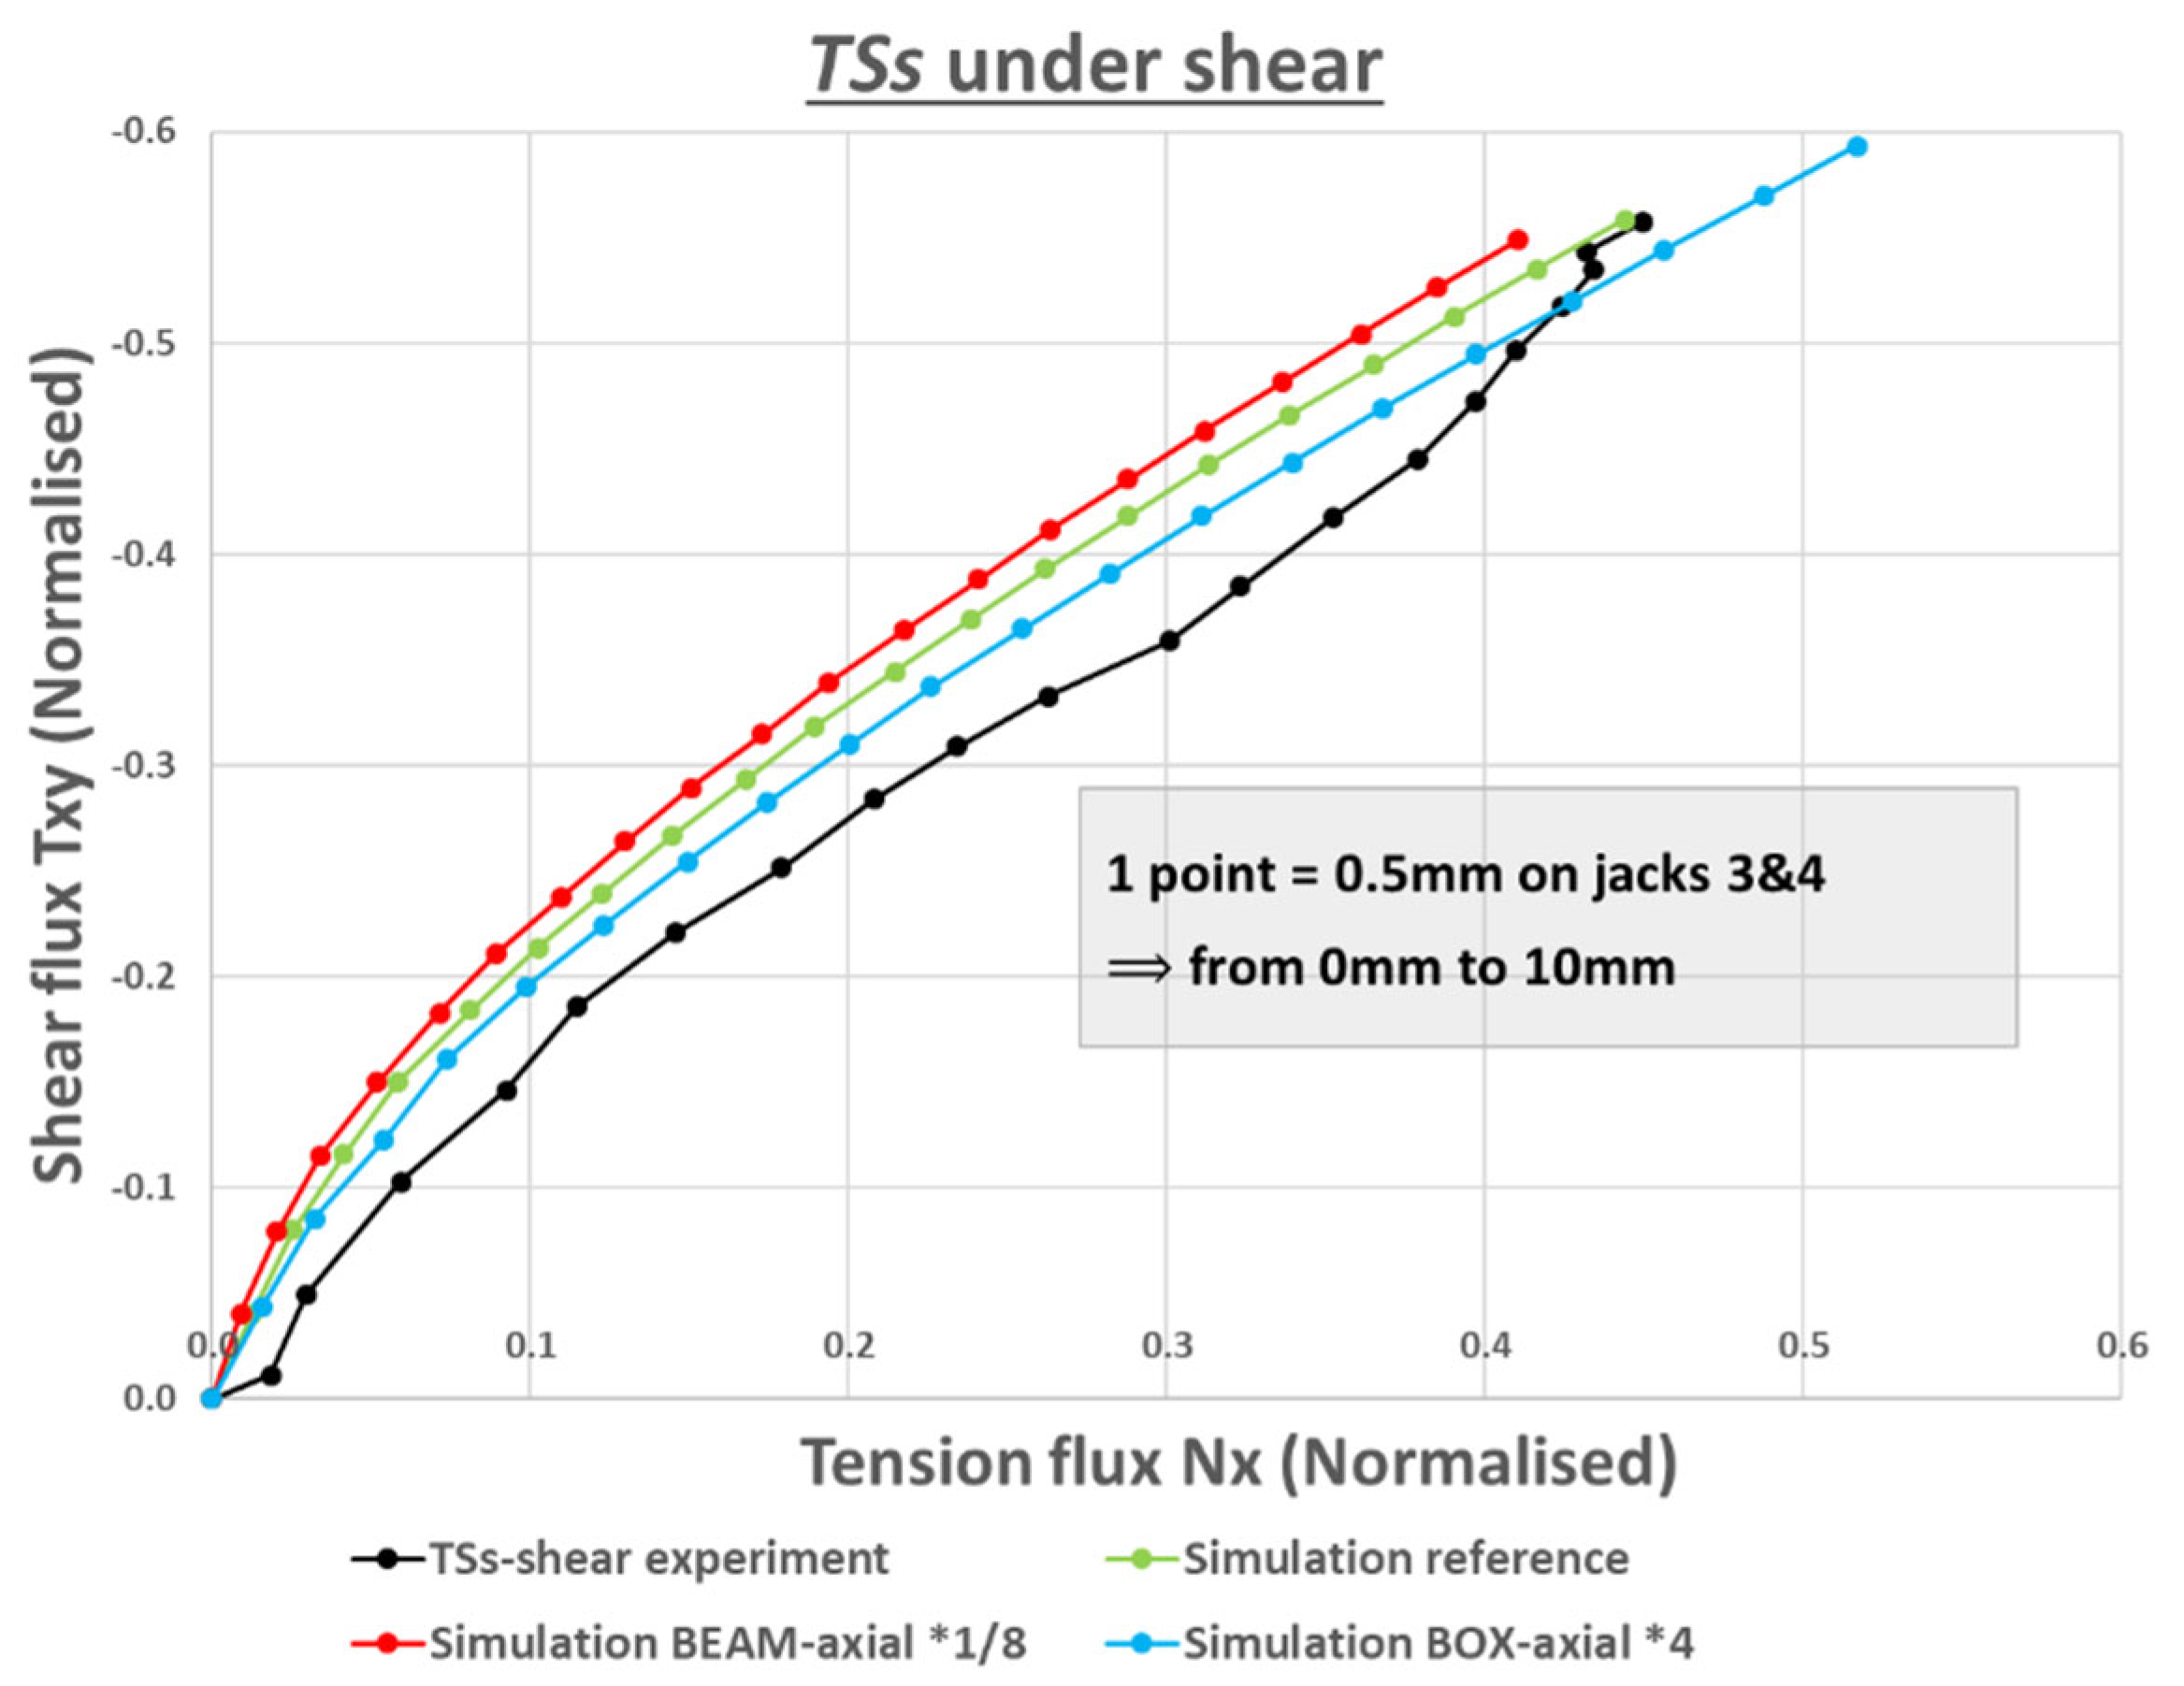
Figure 25.
TSs sample under tension: effect of the variation of a few parameters on the machine jack stiffness and comparison with experiment.
Figure 25.
TSs sample under tension: effect of the variation of a few parameters on the machine jack stiffness and comparison with experiment.
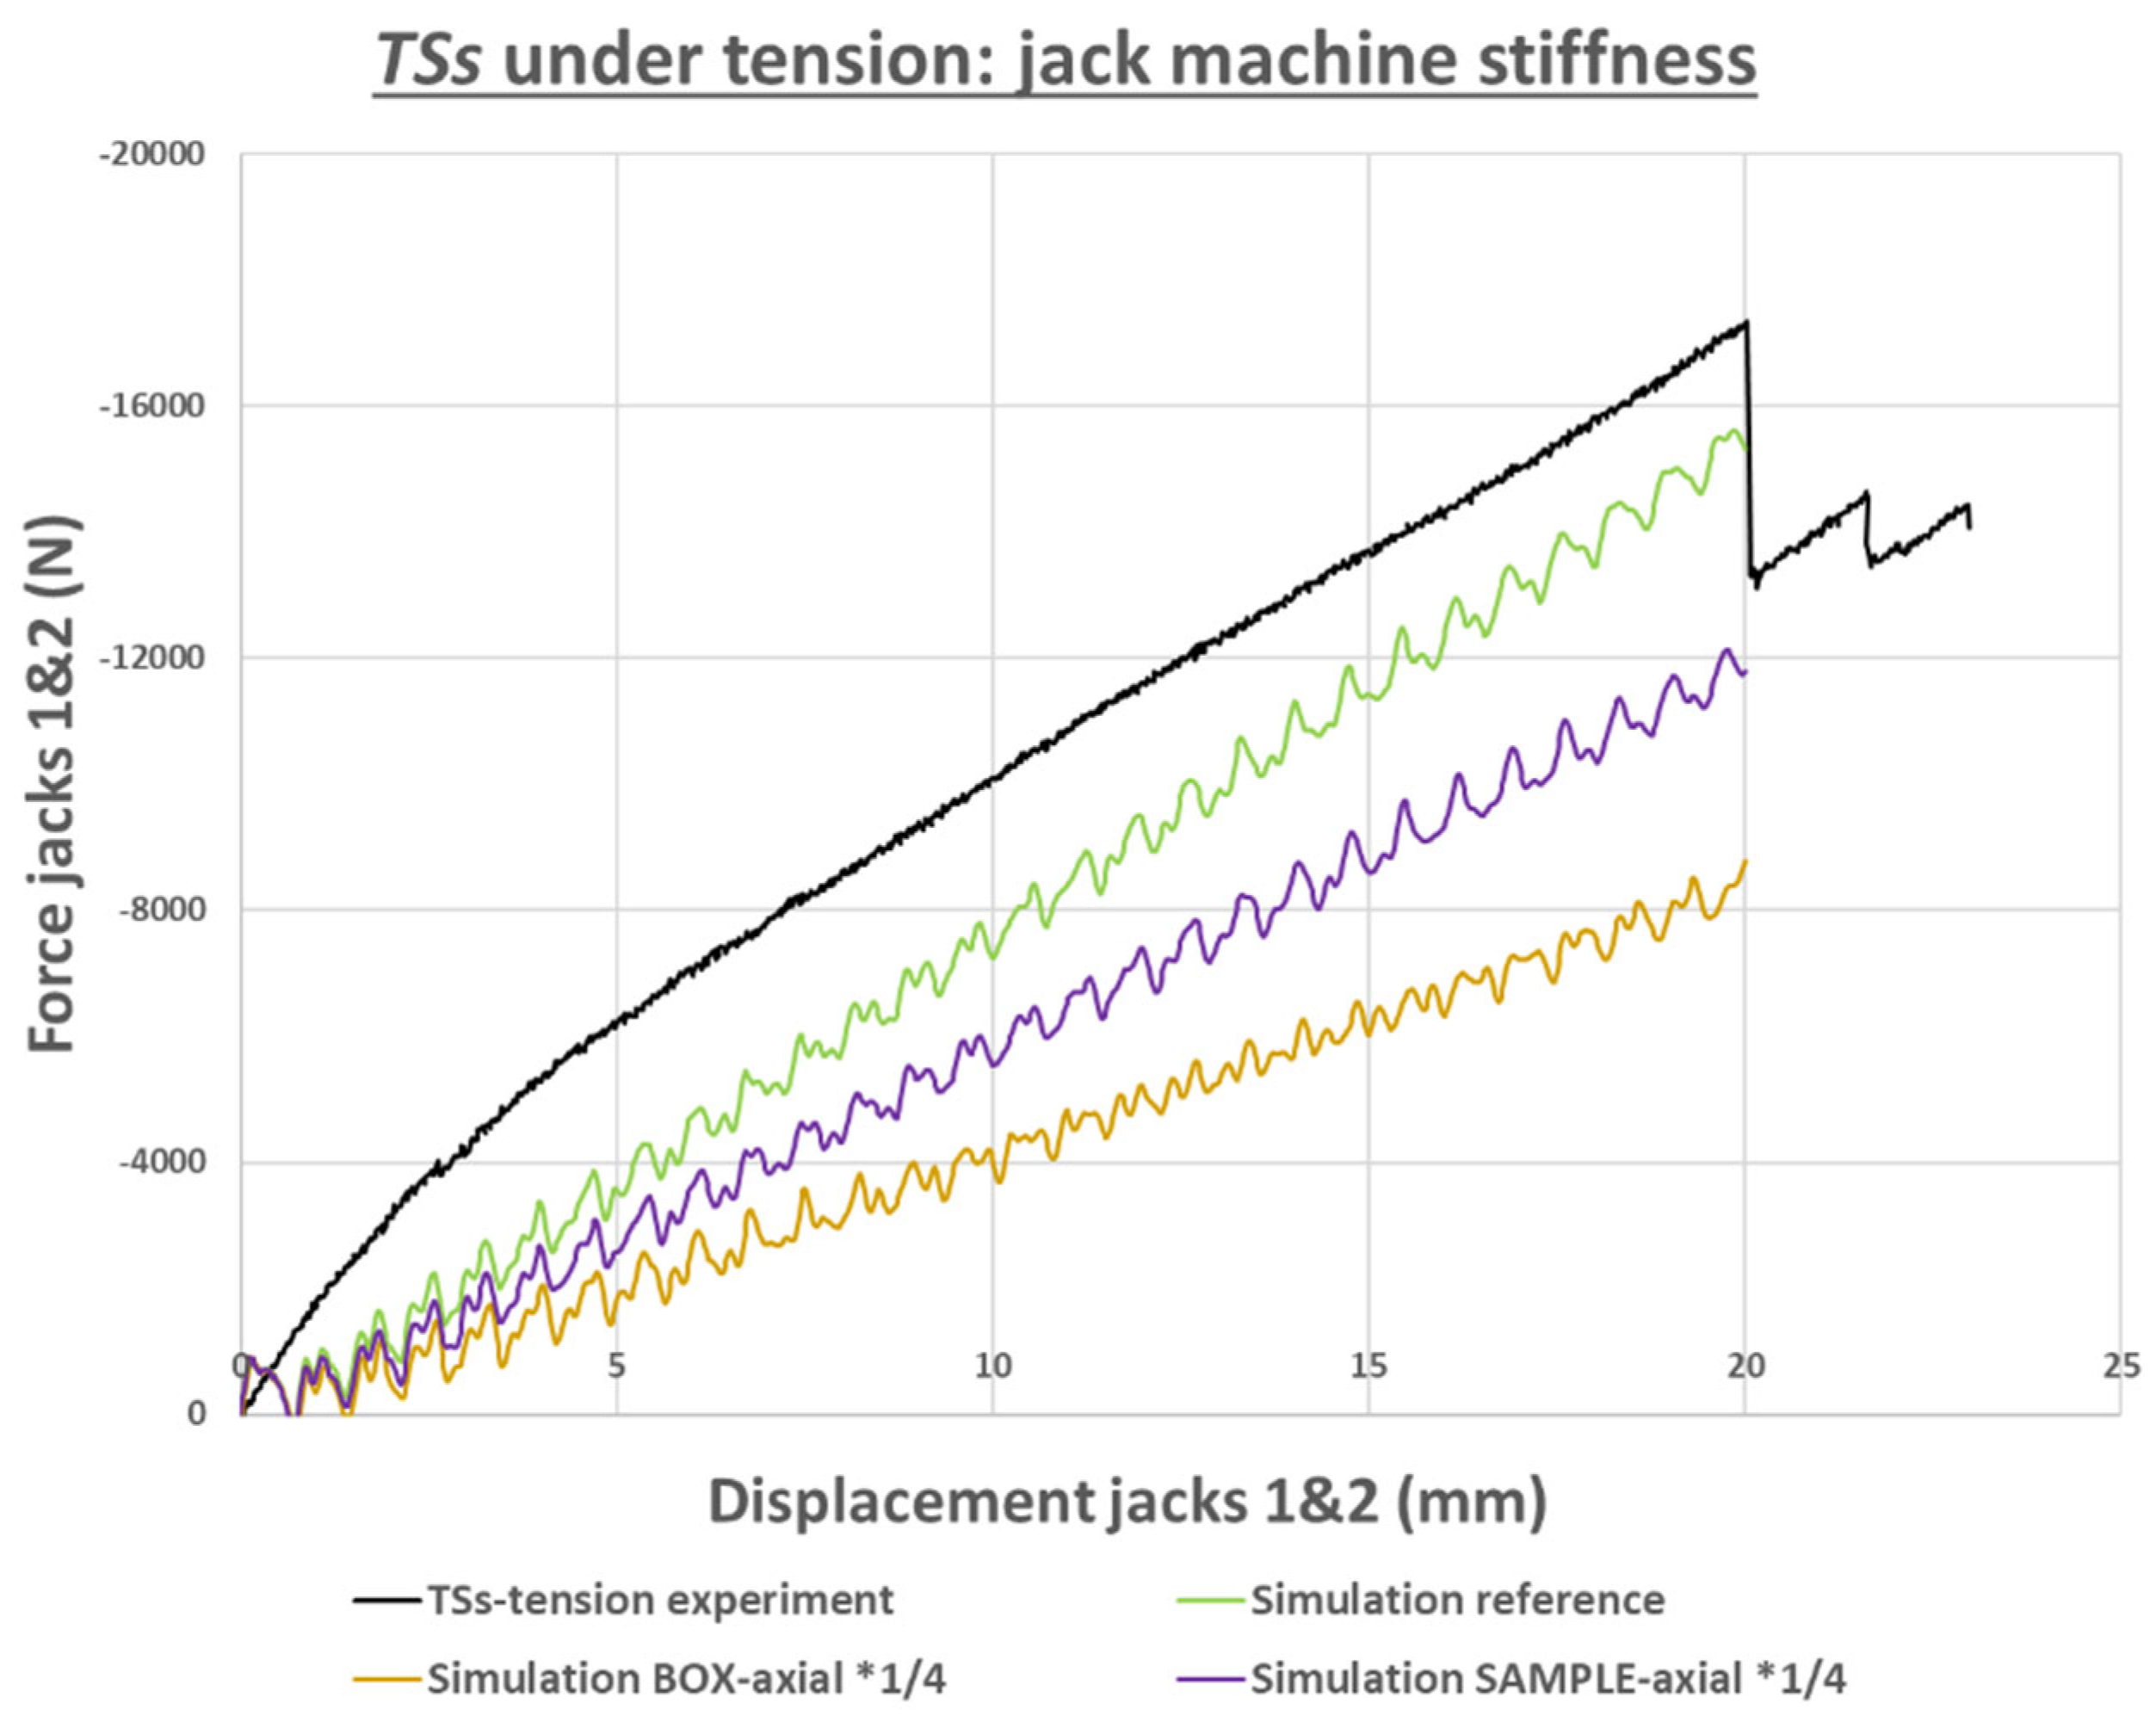
Figure 26.
Weight of influence (illustrated by the thickness of the arrows) of the input parameters on the main output features, obtained thanks to a sensitivity analysis on the VERTEX model with TSs and ALU samples.
Figure 26.
Weight of influence (illustrated by the thickness of the arrows) of the input parameters on the main output features, obtained thanks to a sensitivity analysis on the VERTEX model with TSs and ALU samples.
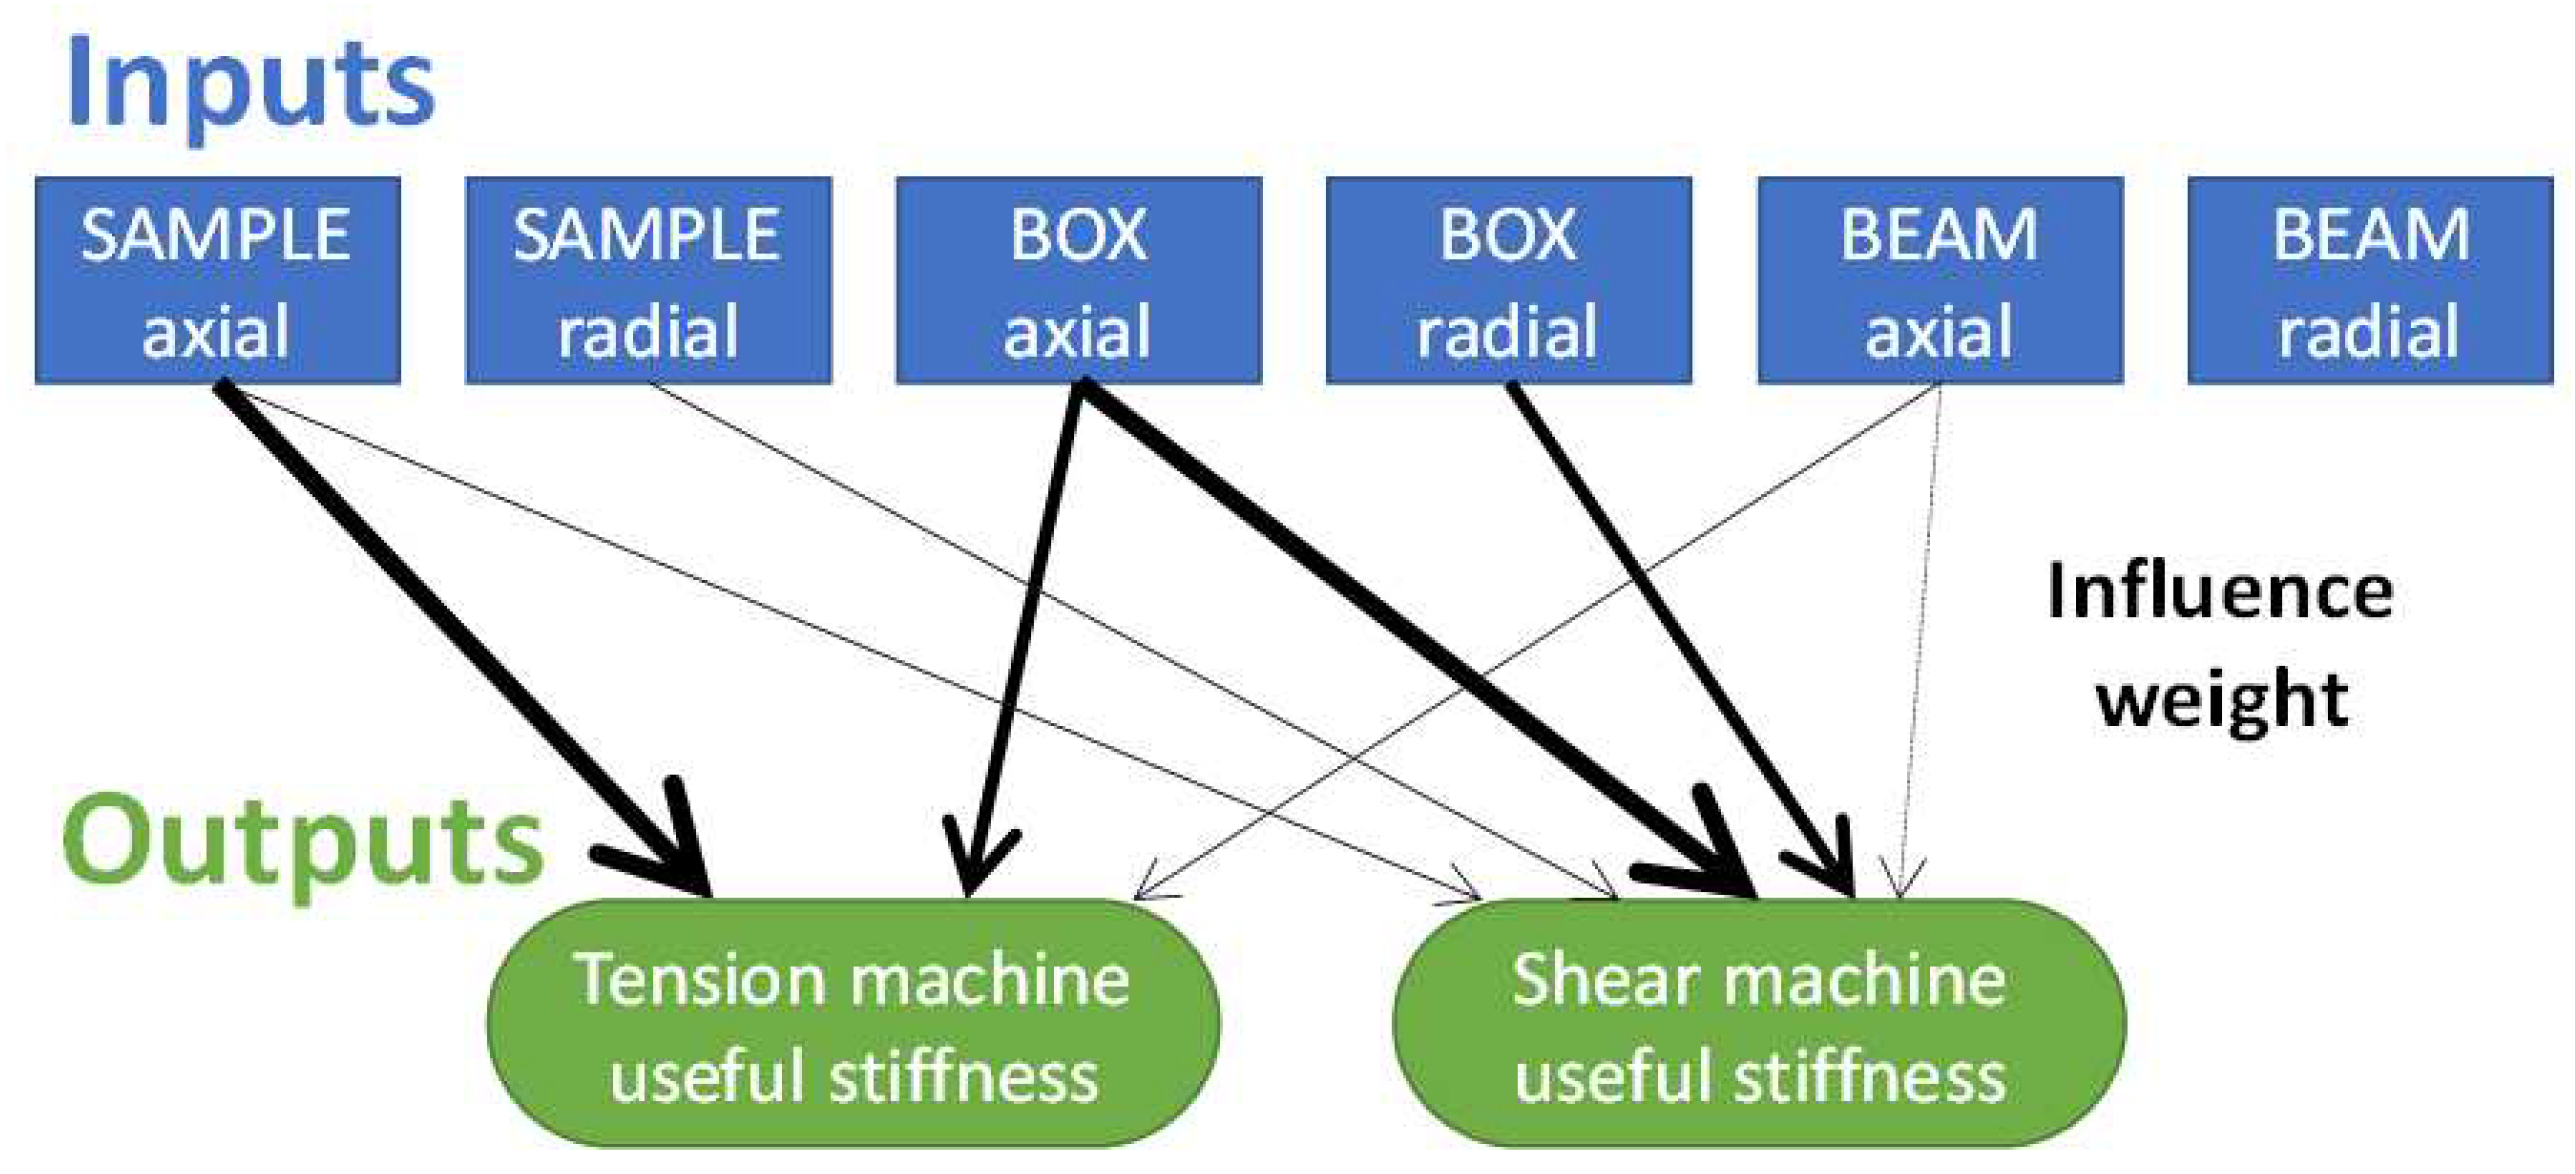
Figure 27.
Numerical prediction of the machine useful stiffness – experiment and simulation of the VERTEX bench loading a TP sample under tension.
Figure 27.
Numerical prediction of the machine useful stiffness – experiment and simulation of the VERTEX bench loading a TP sample under tension.
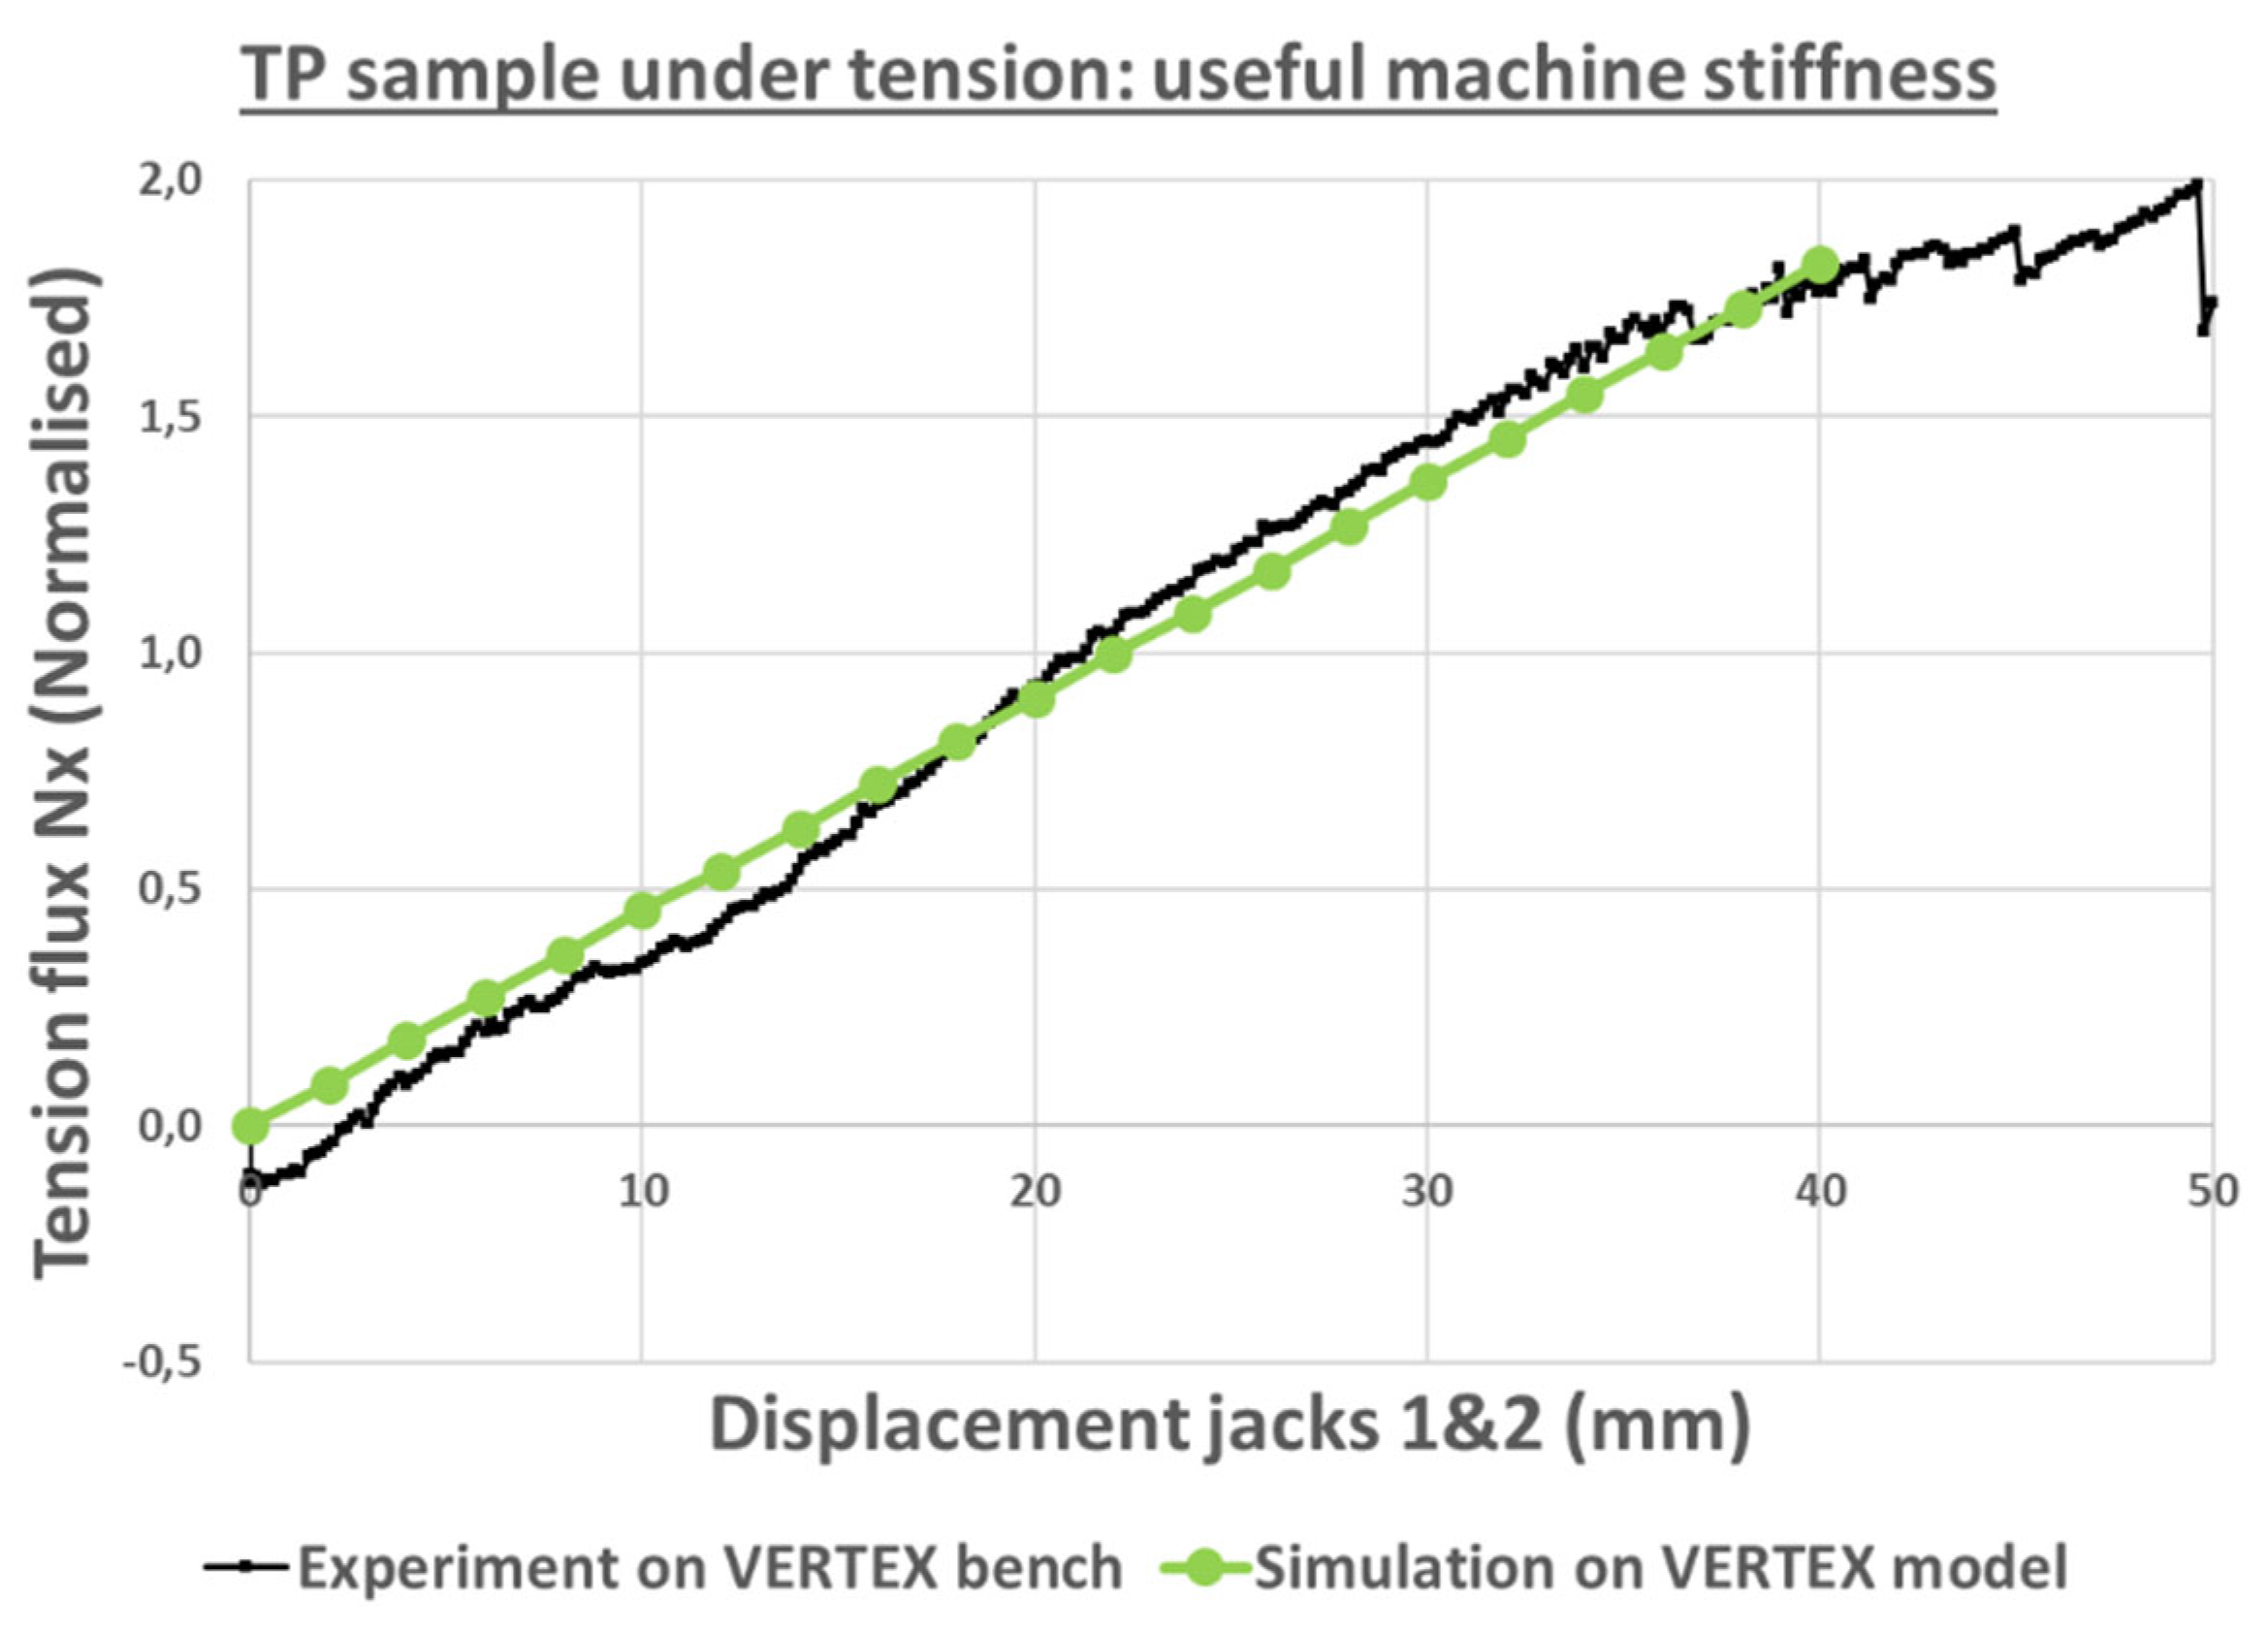
Figure 28.
Displacement fields of the TP sample under tension, before failure for the same Nx flux - (left) experiment with VERTEX test rig, (center) simulation with the VERTEX model, (right) simulation with ideal boundary conditions.
Figure 28.
Displacement fields of the TP sample under tension, before failure for the same Nx flux - (left) experiment with VERTEX test rig, (center) simulation with the VERTEX model, (right) simulation with ideal boundary conditions.
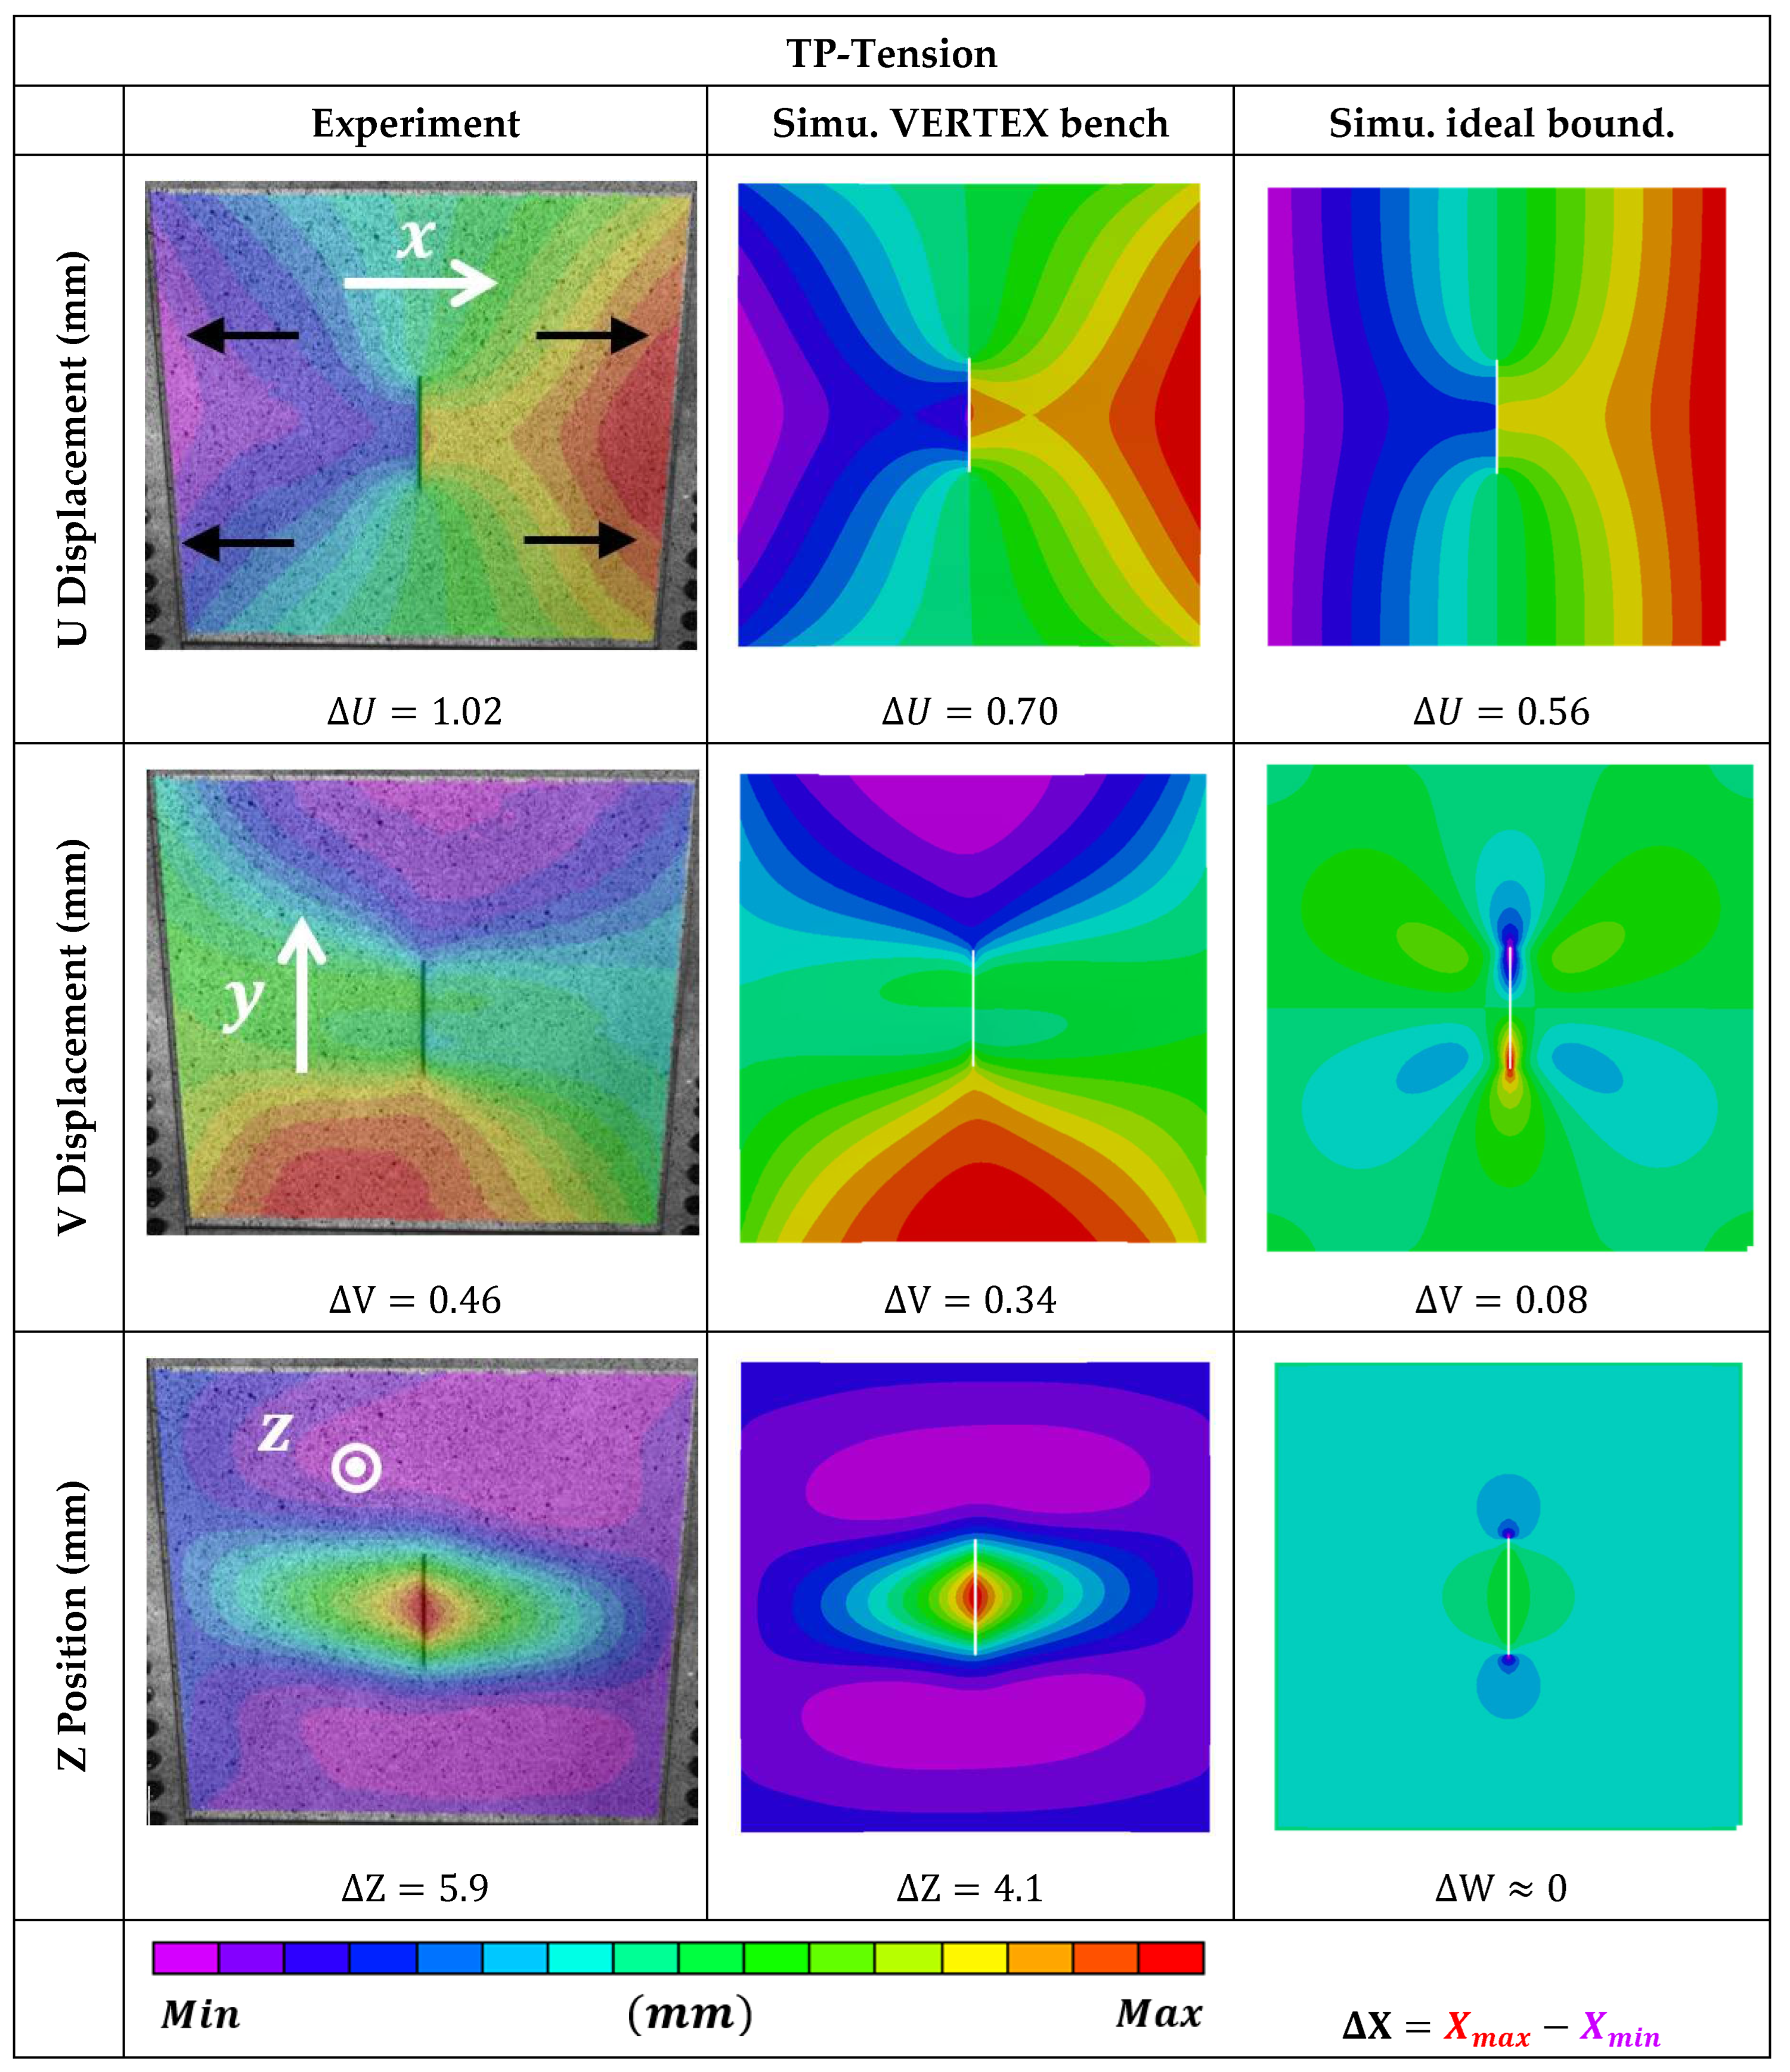
Figure 29.
Displacement fields of the TP sample under shear, before failure for the same Txy flux - (left) experiment with VERTEX test rig, (center) simulation with the VERTEX model, (right) simulation with ideal boundary conditions.
Figure 29.
Displacement fields of the TP sample under shear, before failure for the same Txy flux - (left) experiment with VERTEX test rig, (center) simulation with the VERTEX model, (right) simulation with ideal boundary conditions.
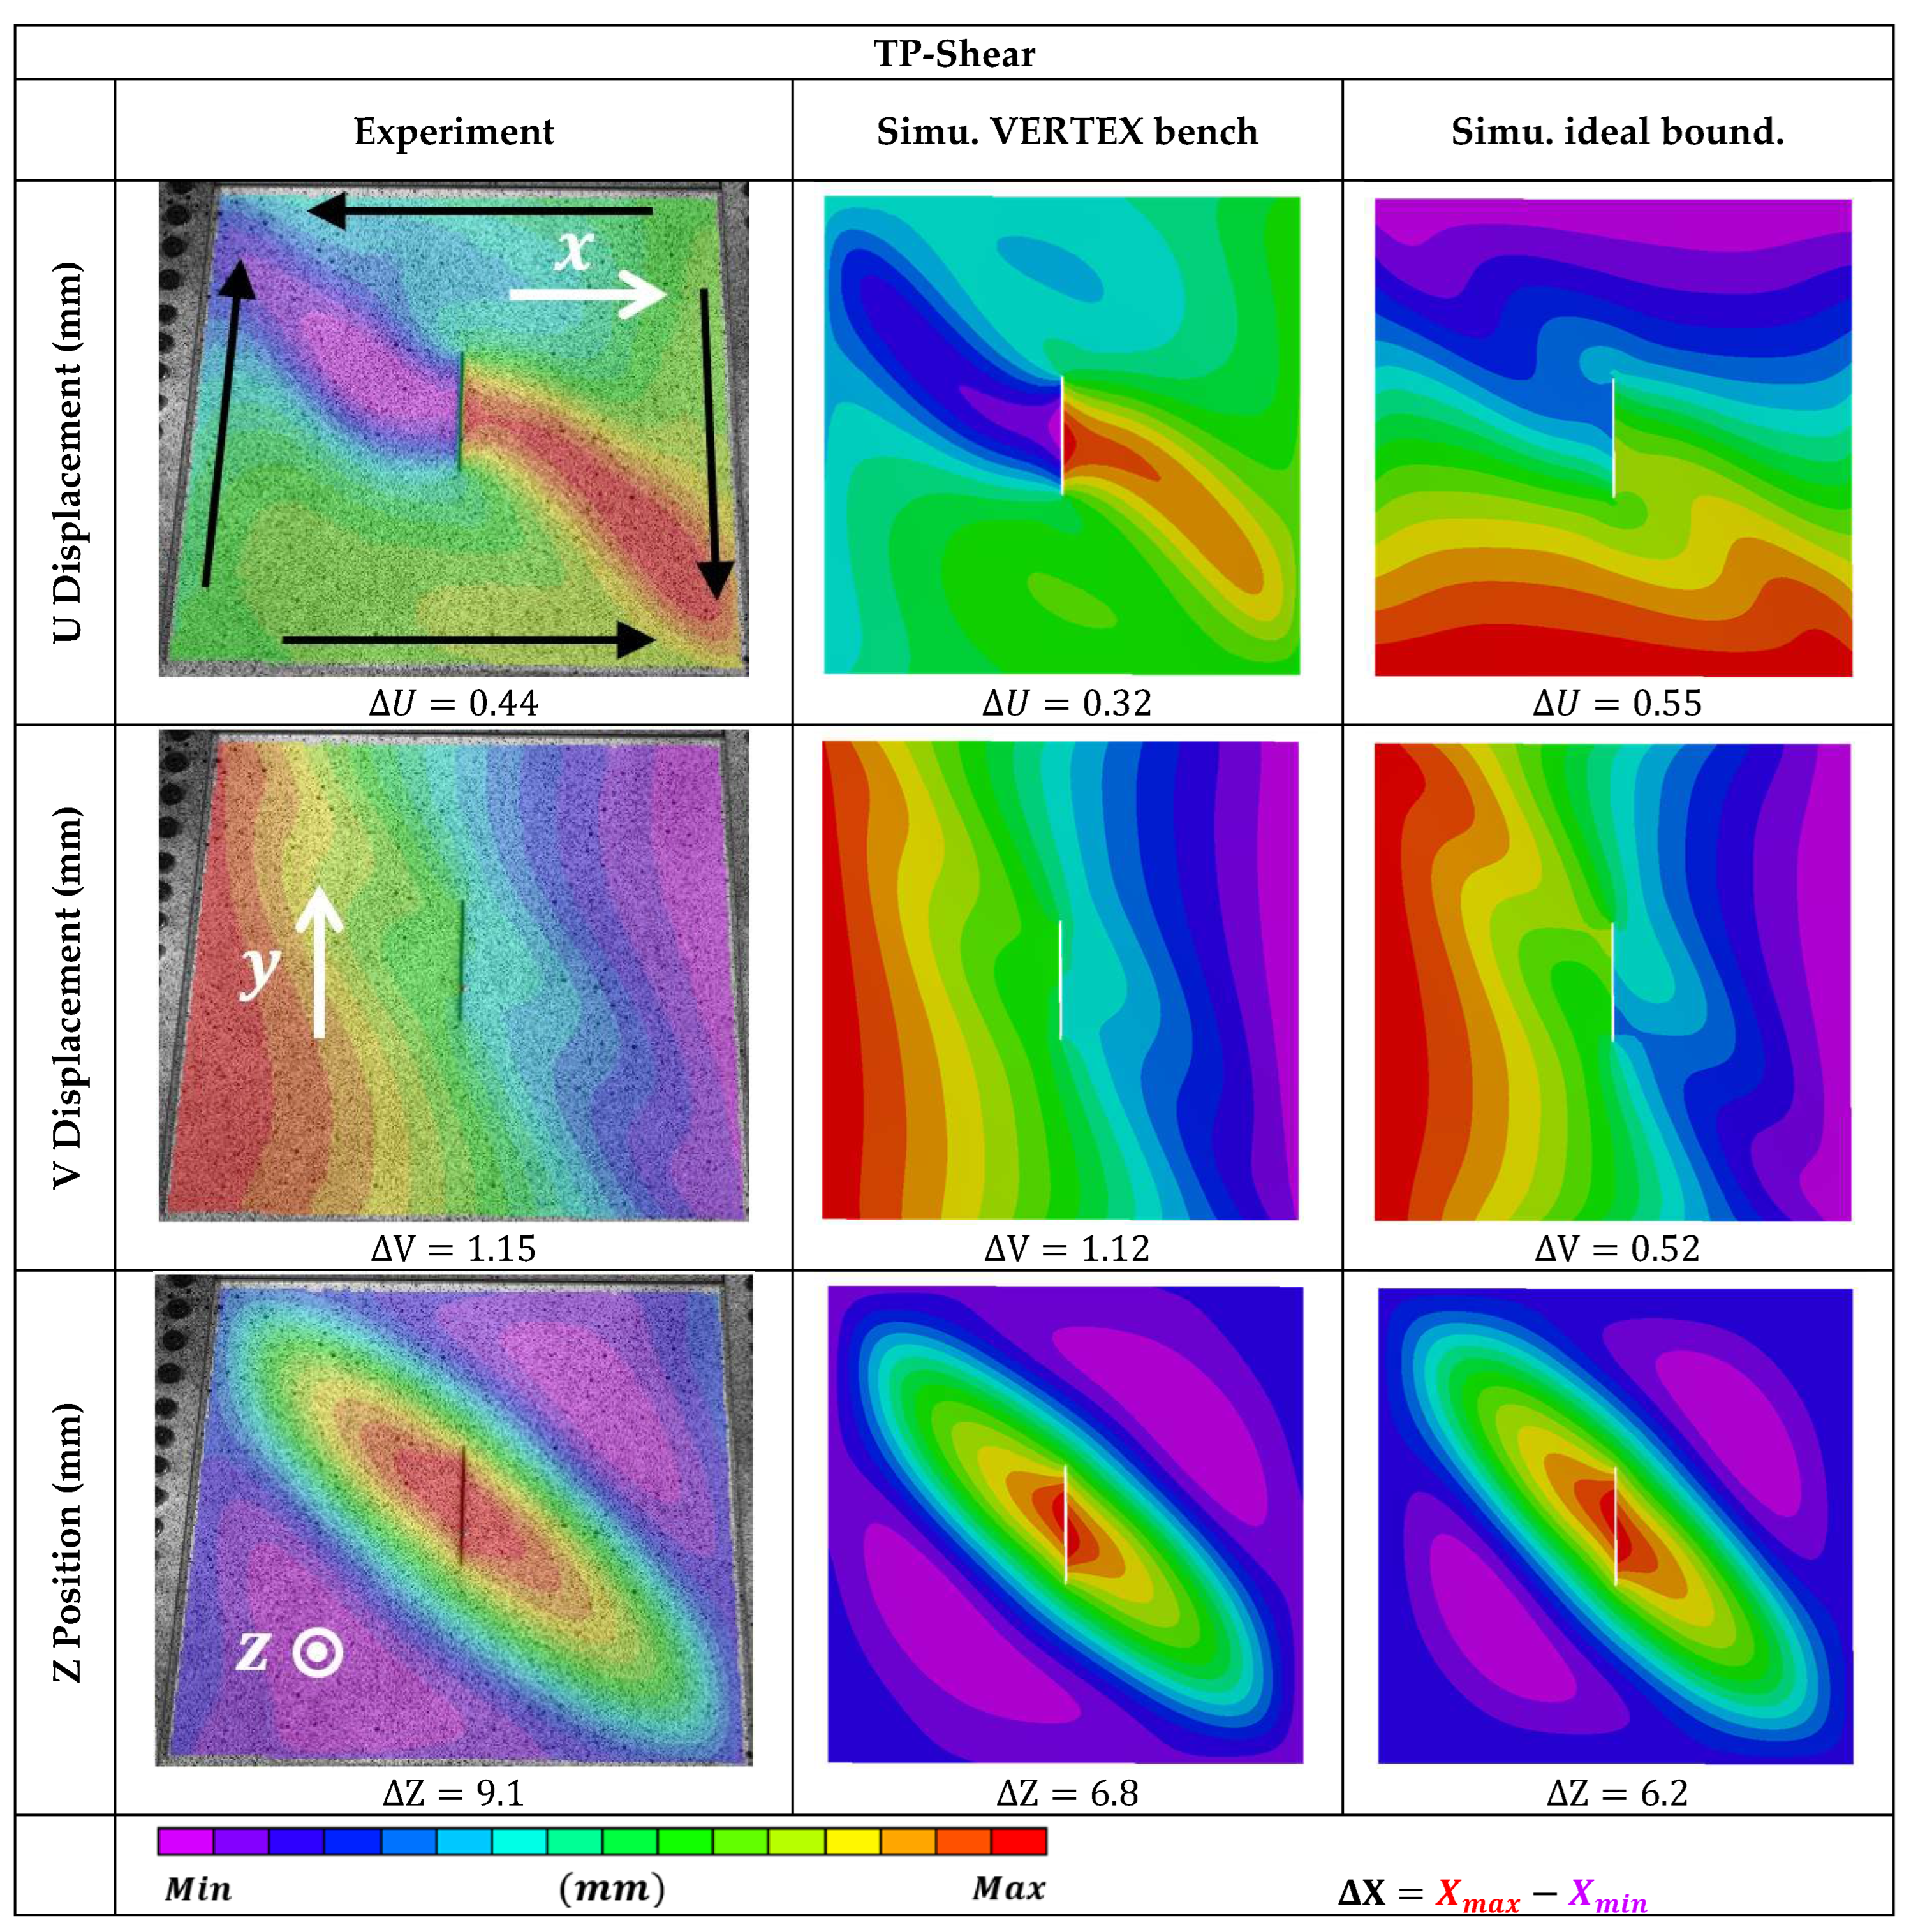
Figure 30.
Longitudinal tension test simulated on the bench model – the sample has been removed from the view and y displacements are highly exaggerated to visualize transverse compression caused by the bending of the bench's flanks towards the center.
Figure 30.
Longitudinal tension test simulated on the bench model – the sample has been removed from the view and y displacements are highly exaggerated to visualize transverse compression caused by the bending of the bench's flanks towards the center.
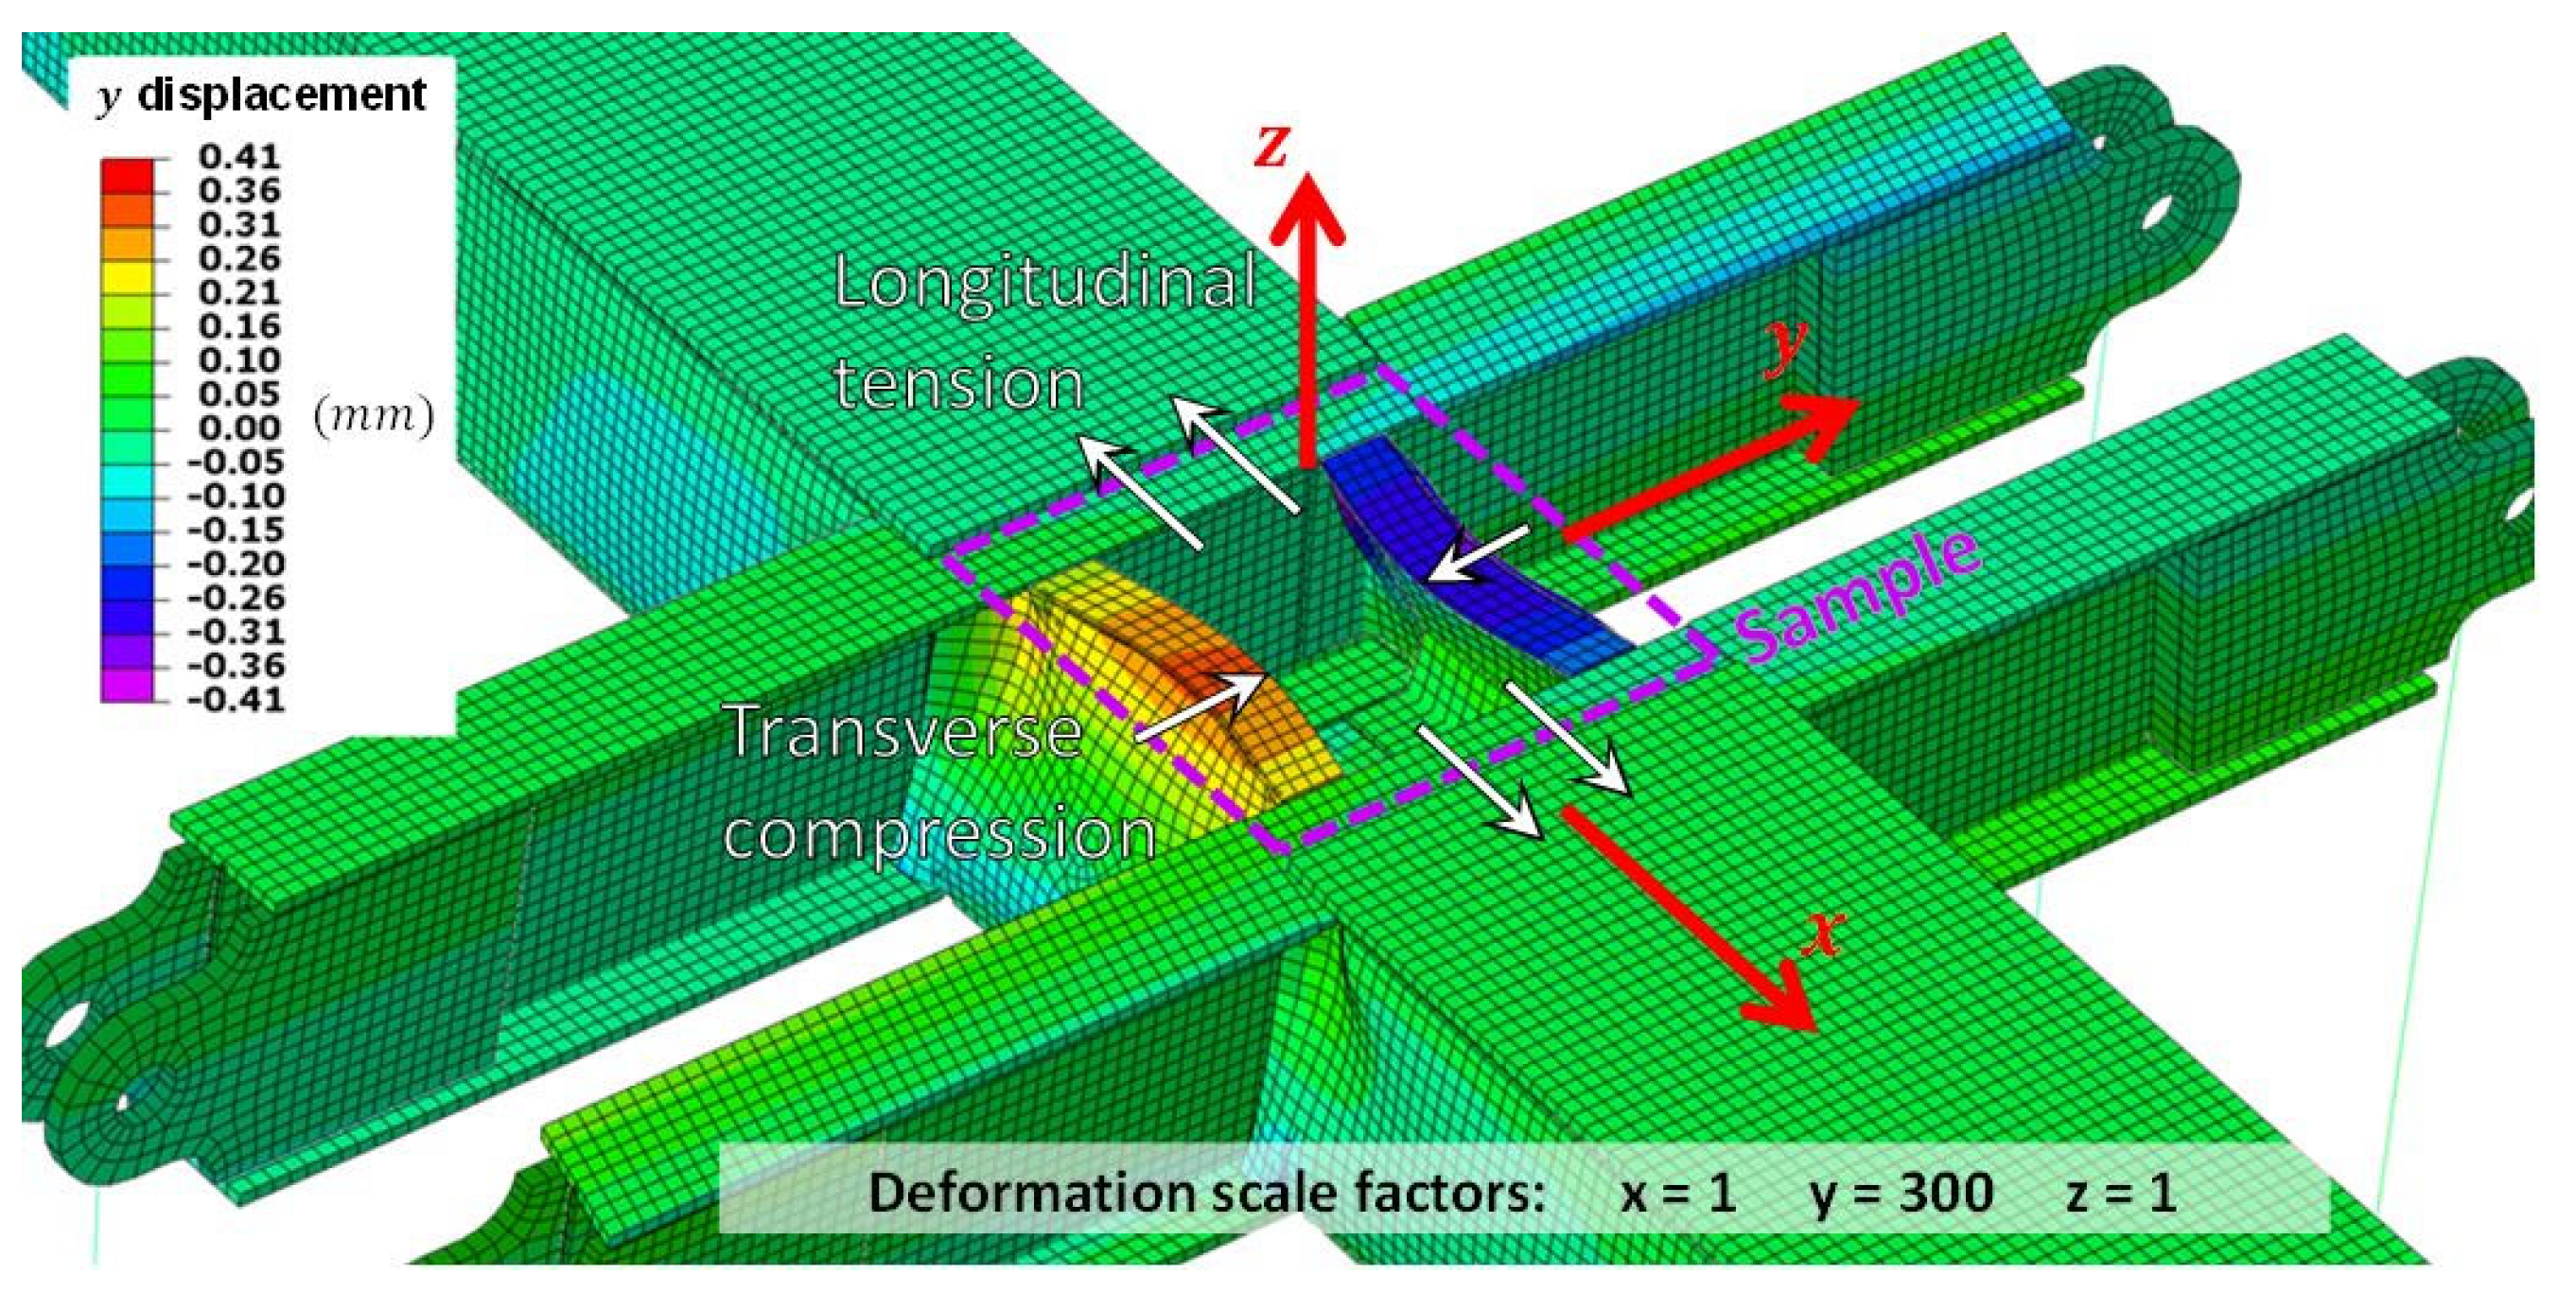
Figure 31.
Tension-shear coupling for numerical simulations of "shear" tests, coming from the Wagner effect and the machine behavior. (Yellow) Shear on a TP sample with the ideal boundary condition model, (red/grey) shear on a TP/ALU sample with the VERTEX bench model.
Figure 31.
Tension-shear coupling for numerical simulations of "shear" tests, coming from the Wagner effect and the machine behavior. (Yellow) Shear on a TP sample with the ideal boundary condition model, (red/grey) shear on a TP/ALU sample with the VERTEX bench model.
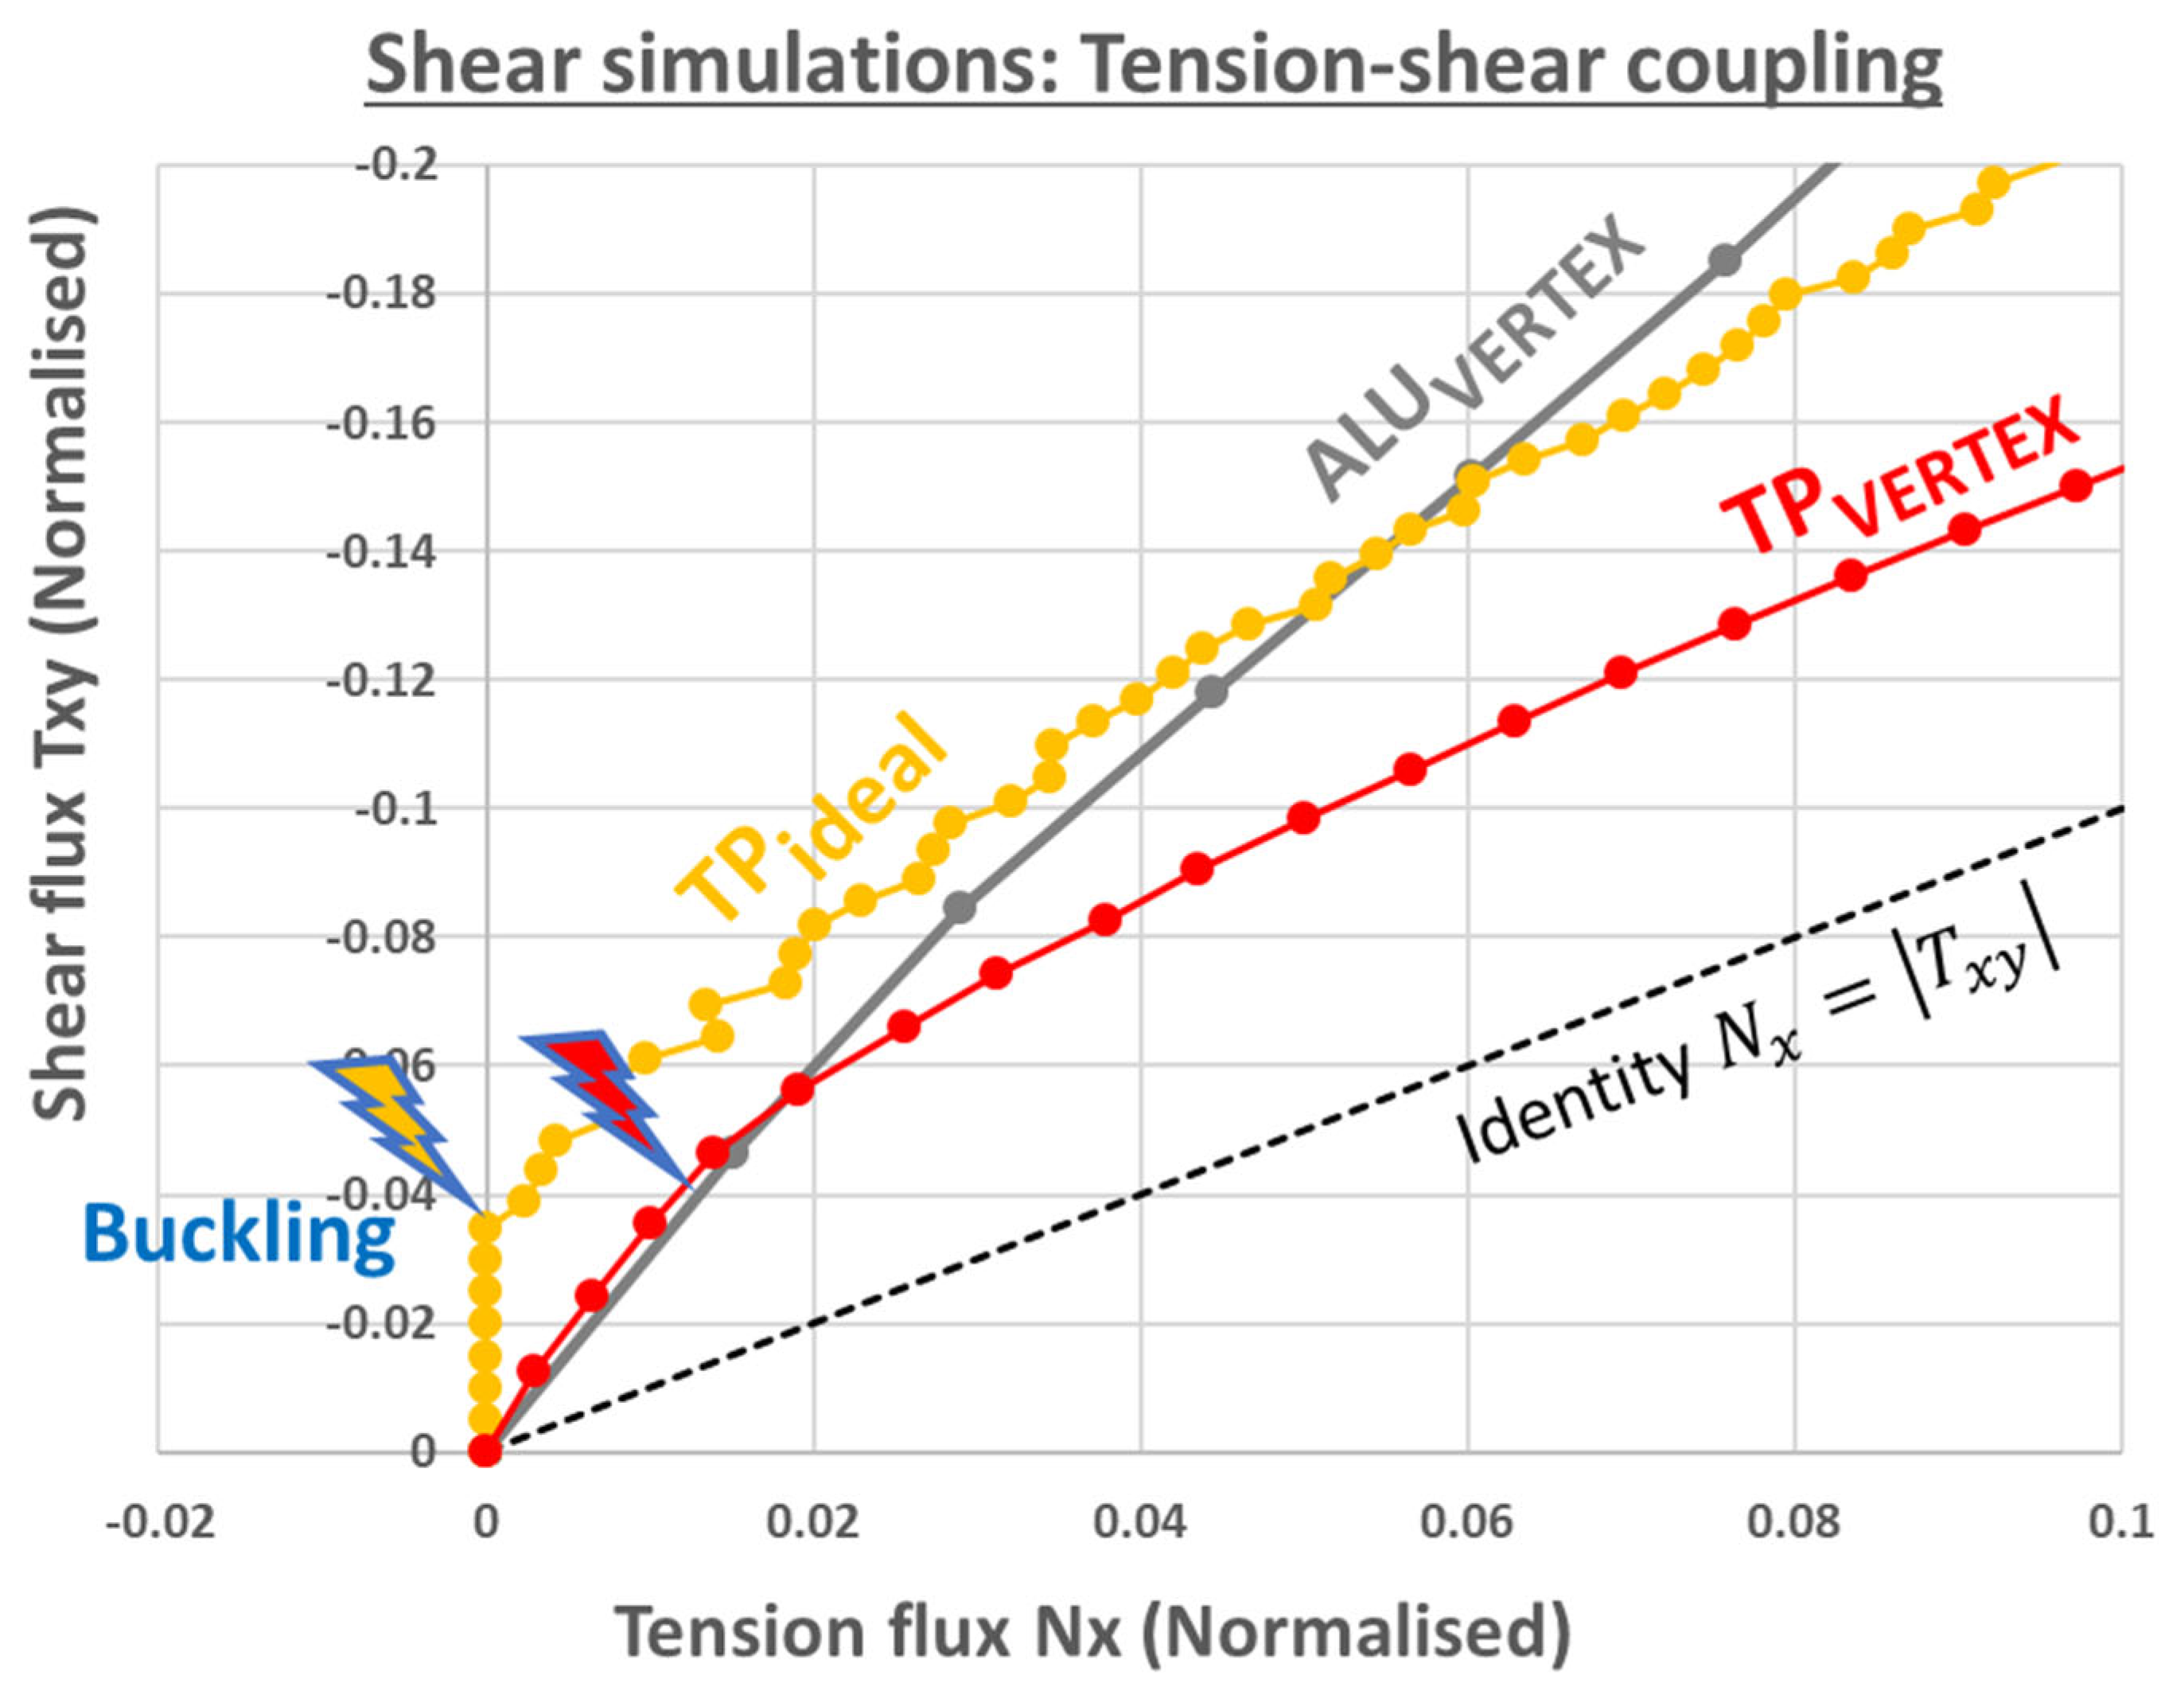
Figure 32.
Bolted joints of the VERTEX bench for a TSs sample under shear: radial force passing through each connector element, indicative of the bearing load of associated bolted joints. See Figure 18 for a picture of the bolts with the same view.
Figure 32.
Bolted joints of the VERTEX bench for a TSs sample under shear: radial force passing through each connector element, indicative of the bearing load of associated bolted joints. See Figure 18 for a picture of the bolts with the same view.
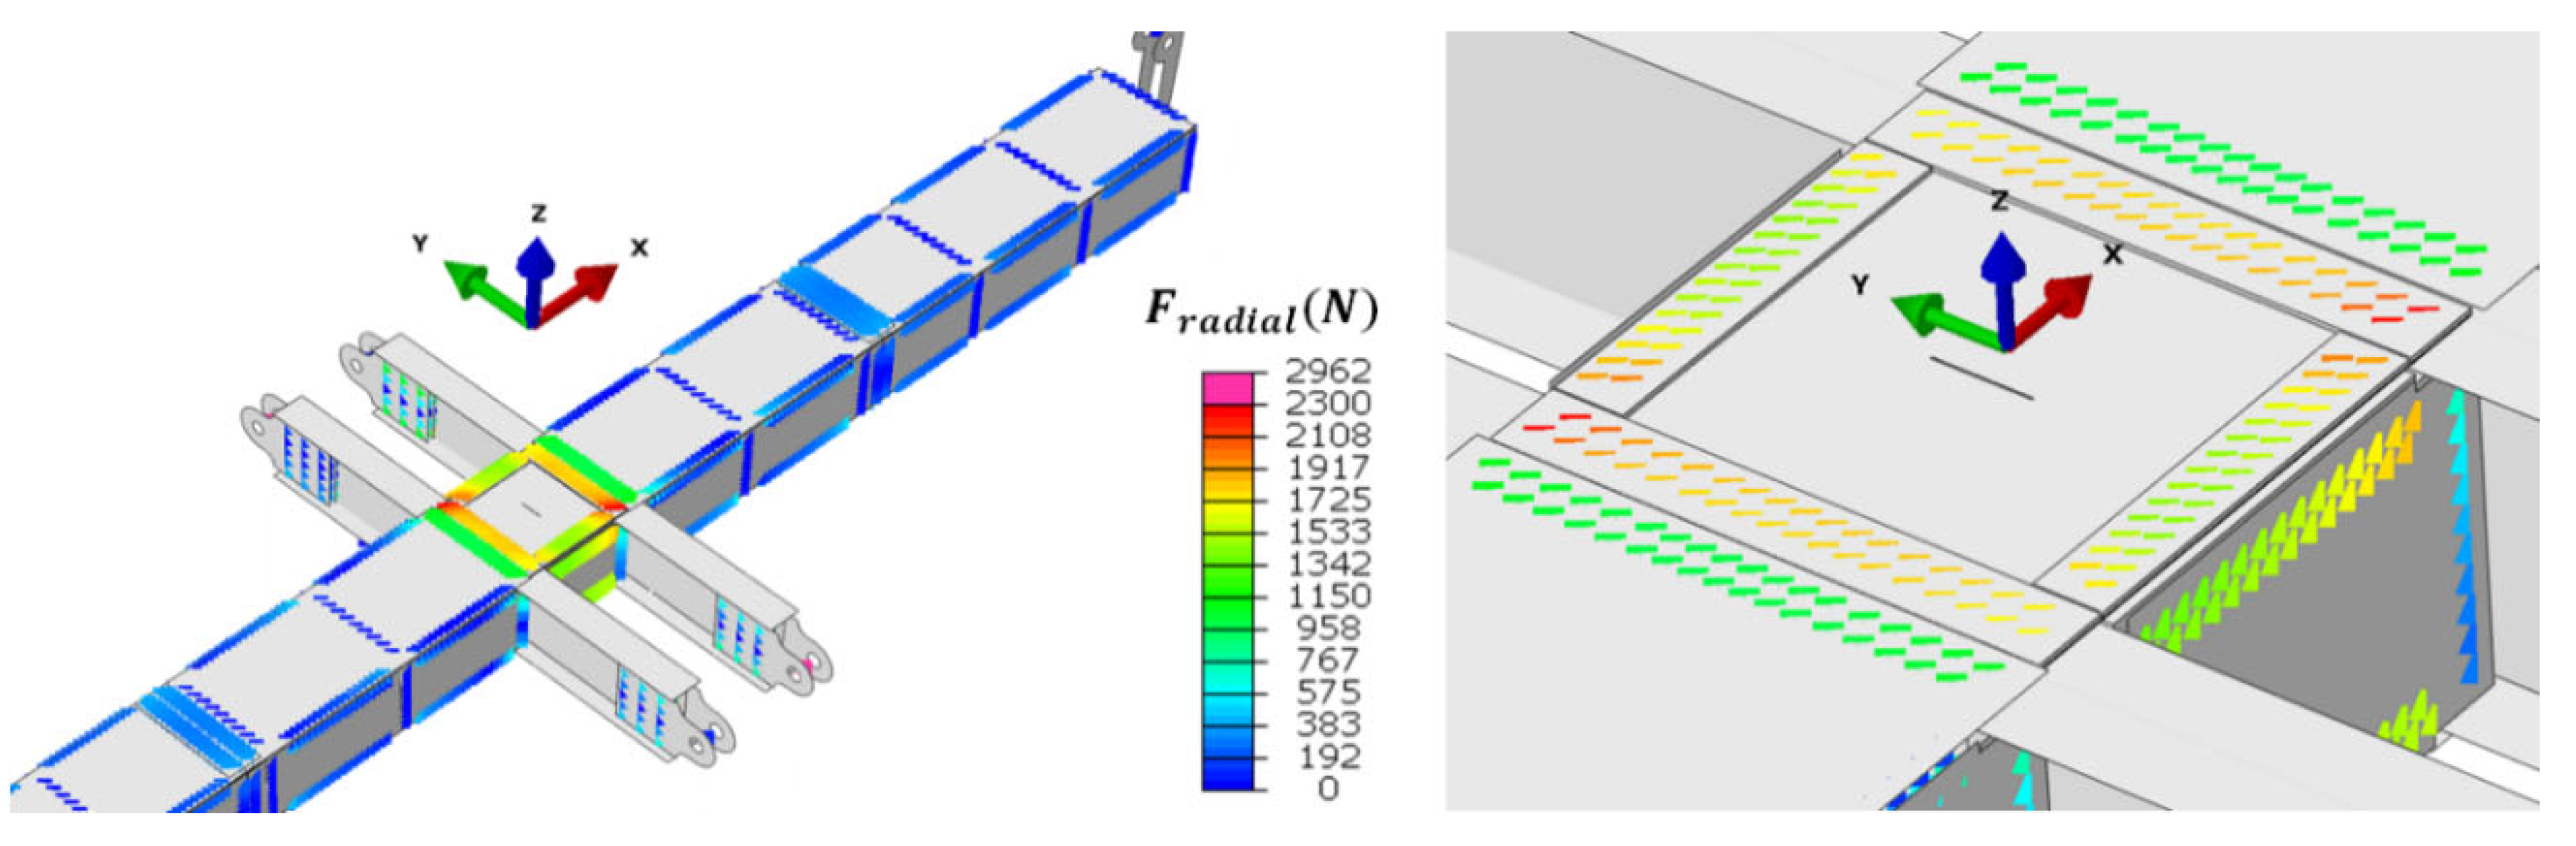
Figure 33.
Development of a corner-filleted sample geometry: investigation of the impact on the load shape, and refined hole meshing to assess conservative bearing loads.
Figure 33.
Development of a corner-filleted sample geometry: investigation of the impact on the load shape, and refined hole meshing to assess conservative bearing loads.
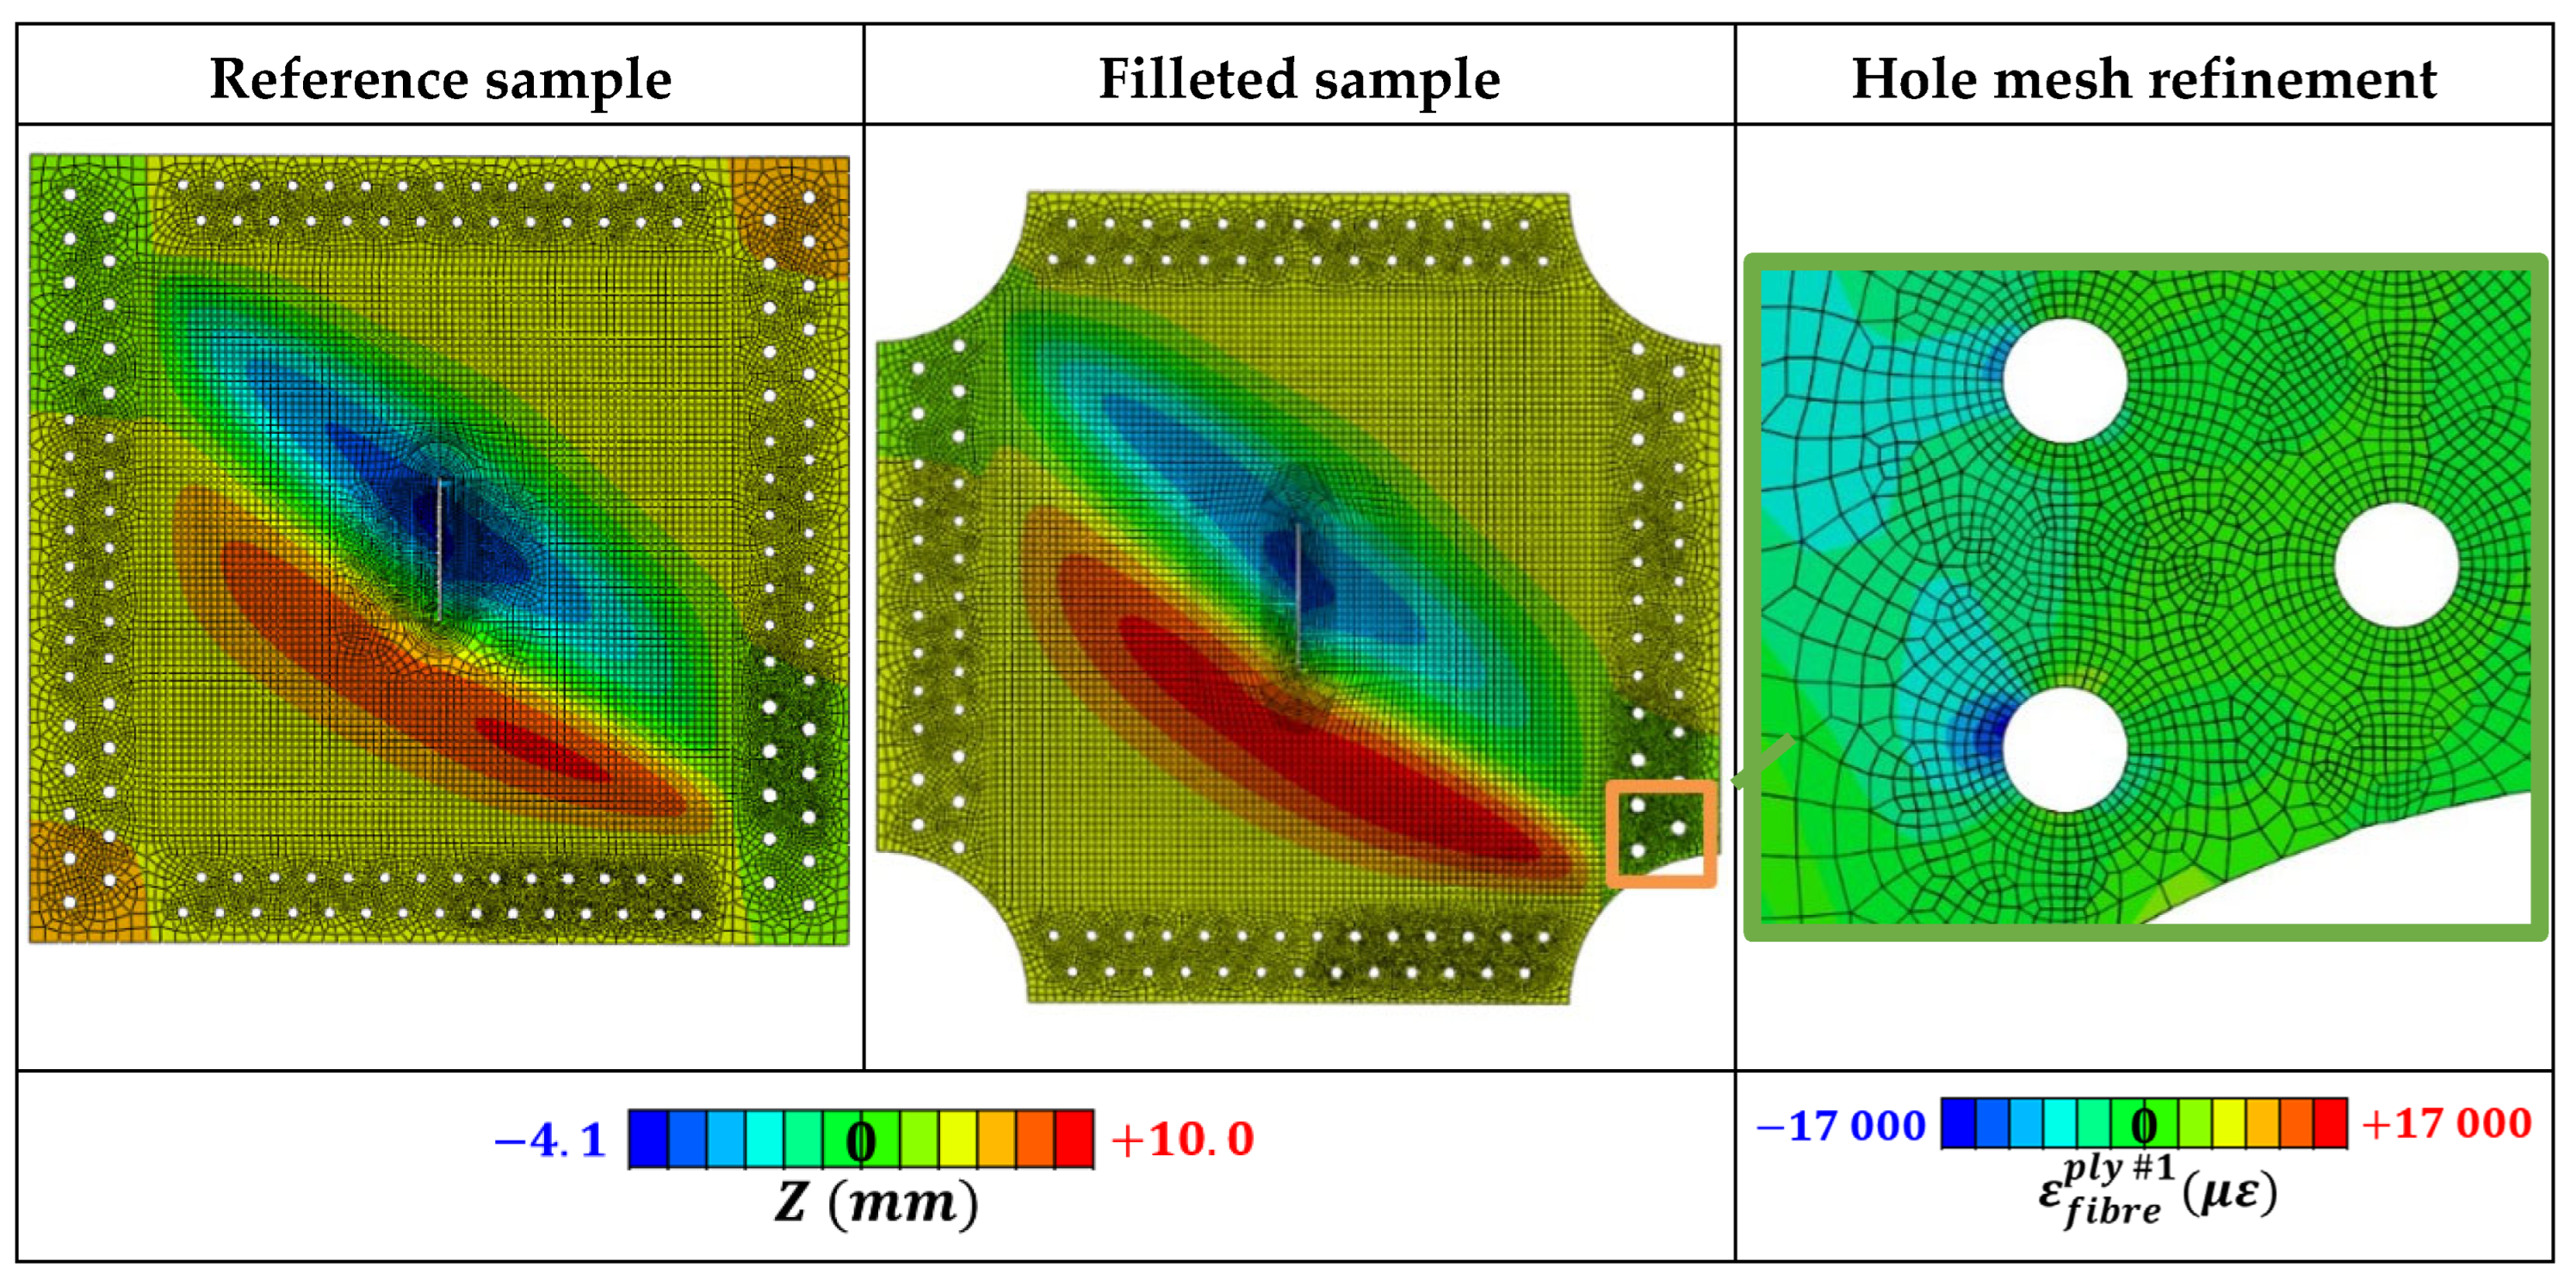
Figure 34.
Notch tip of a TSs sample under shear. Field of strain in the fiber direction of a specific ply: quantification of strain localization on the notch tip to evaluate failure criterion.
Figure 34.
Notch tip of a TSs sample under shear. Field of strain in the fiber direction of a specific ply: quantification of strain localization on the notch tip to evaluate failure criterion.
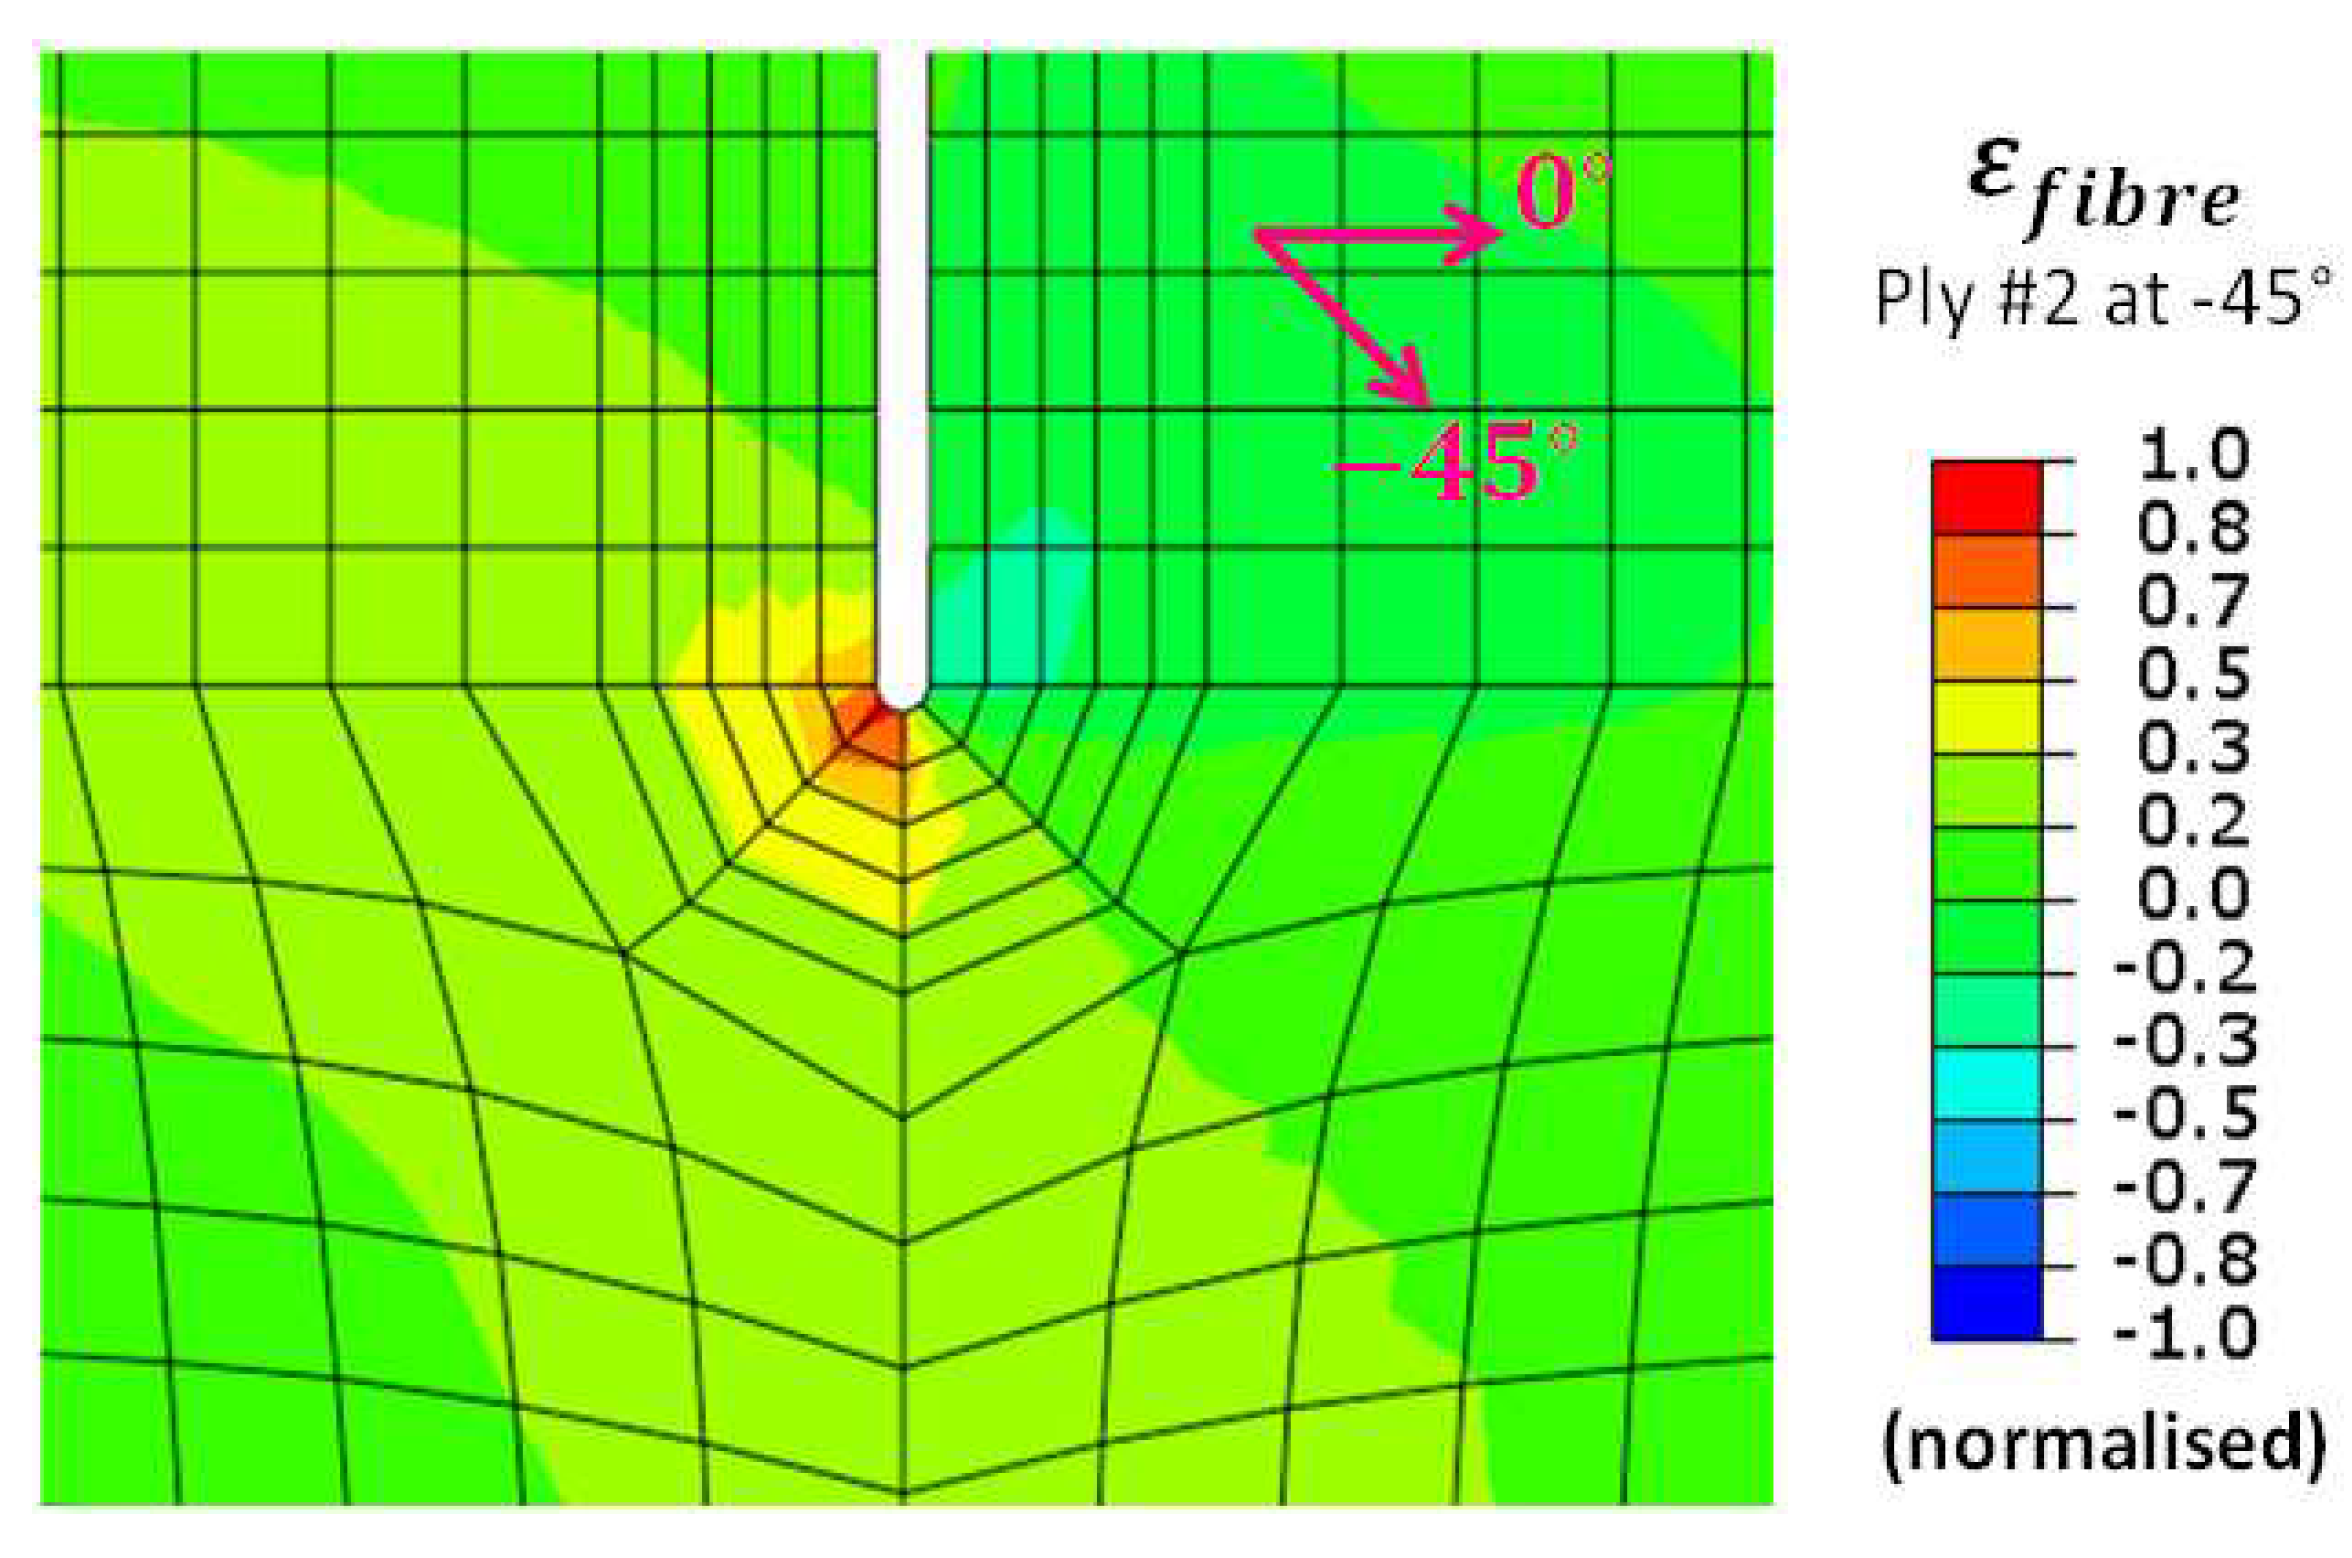
Figure 35.
Load shape severity on a TSs notched panel under tension: comparison of the simulated VERTEX bench and simulated ideal boundaries – maximum fiber strain against equivalent flux.
Figure 35.
Load shape severity on a TSs notched panel under tension: comparison of the simulated VERTEX bench and simulated ideal boundaries – maximum fiber strain against equivalent flux.
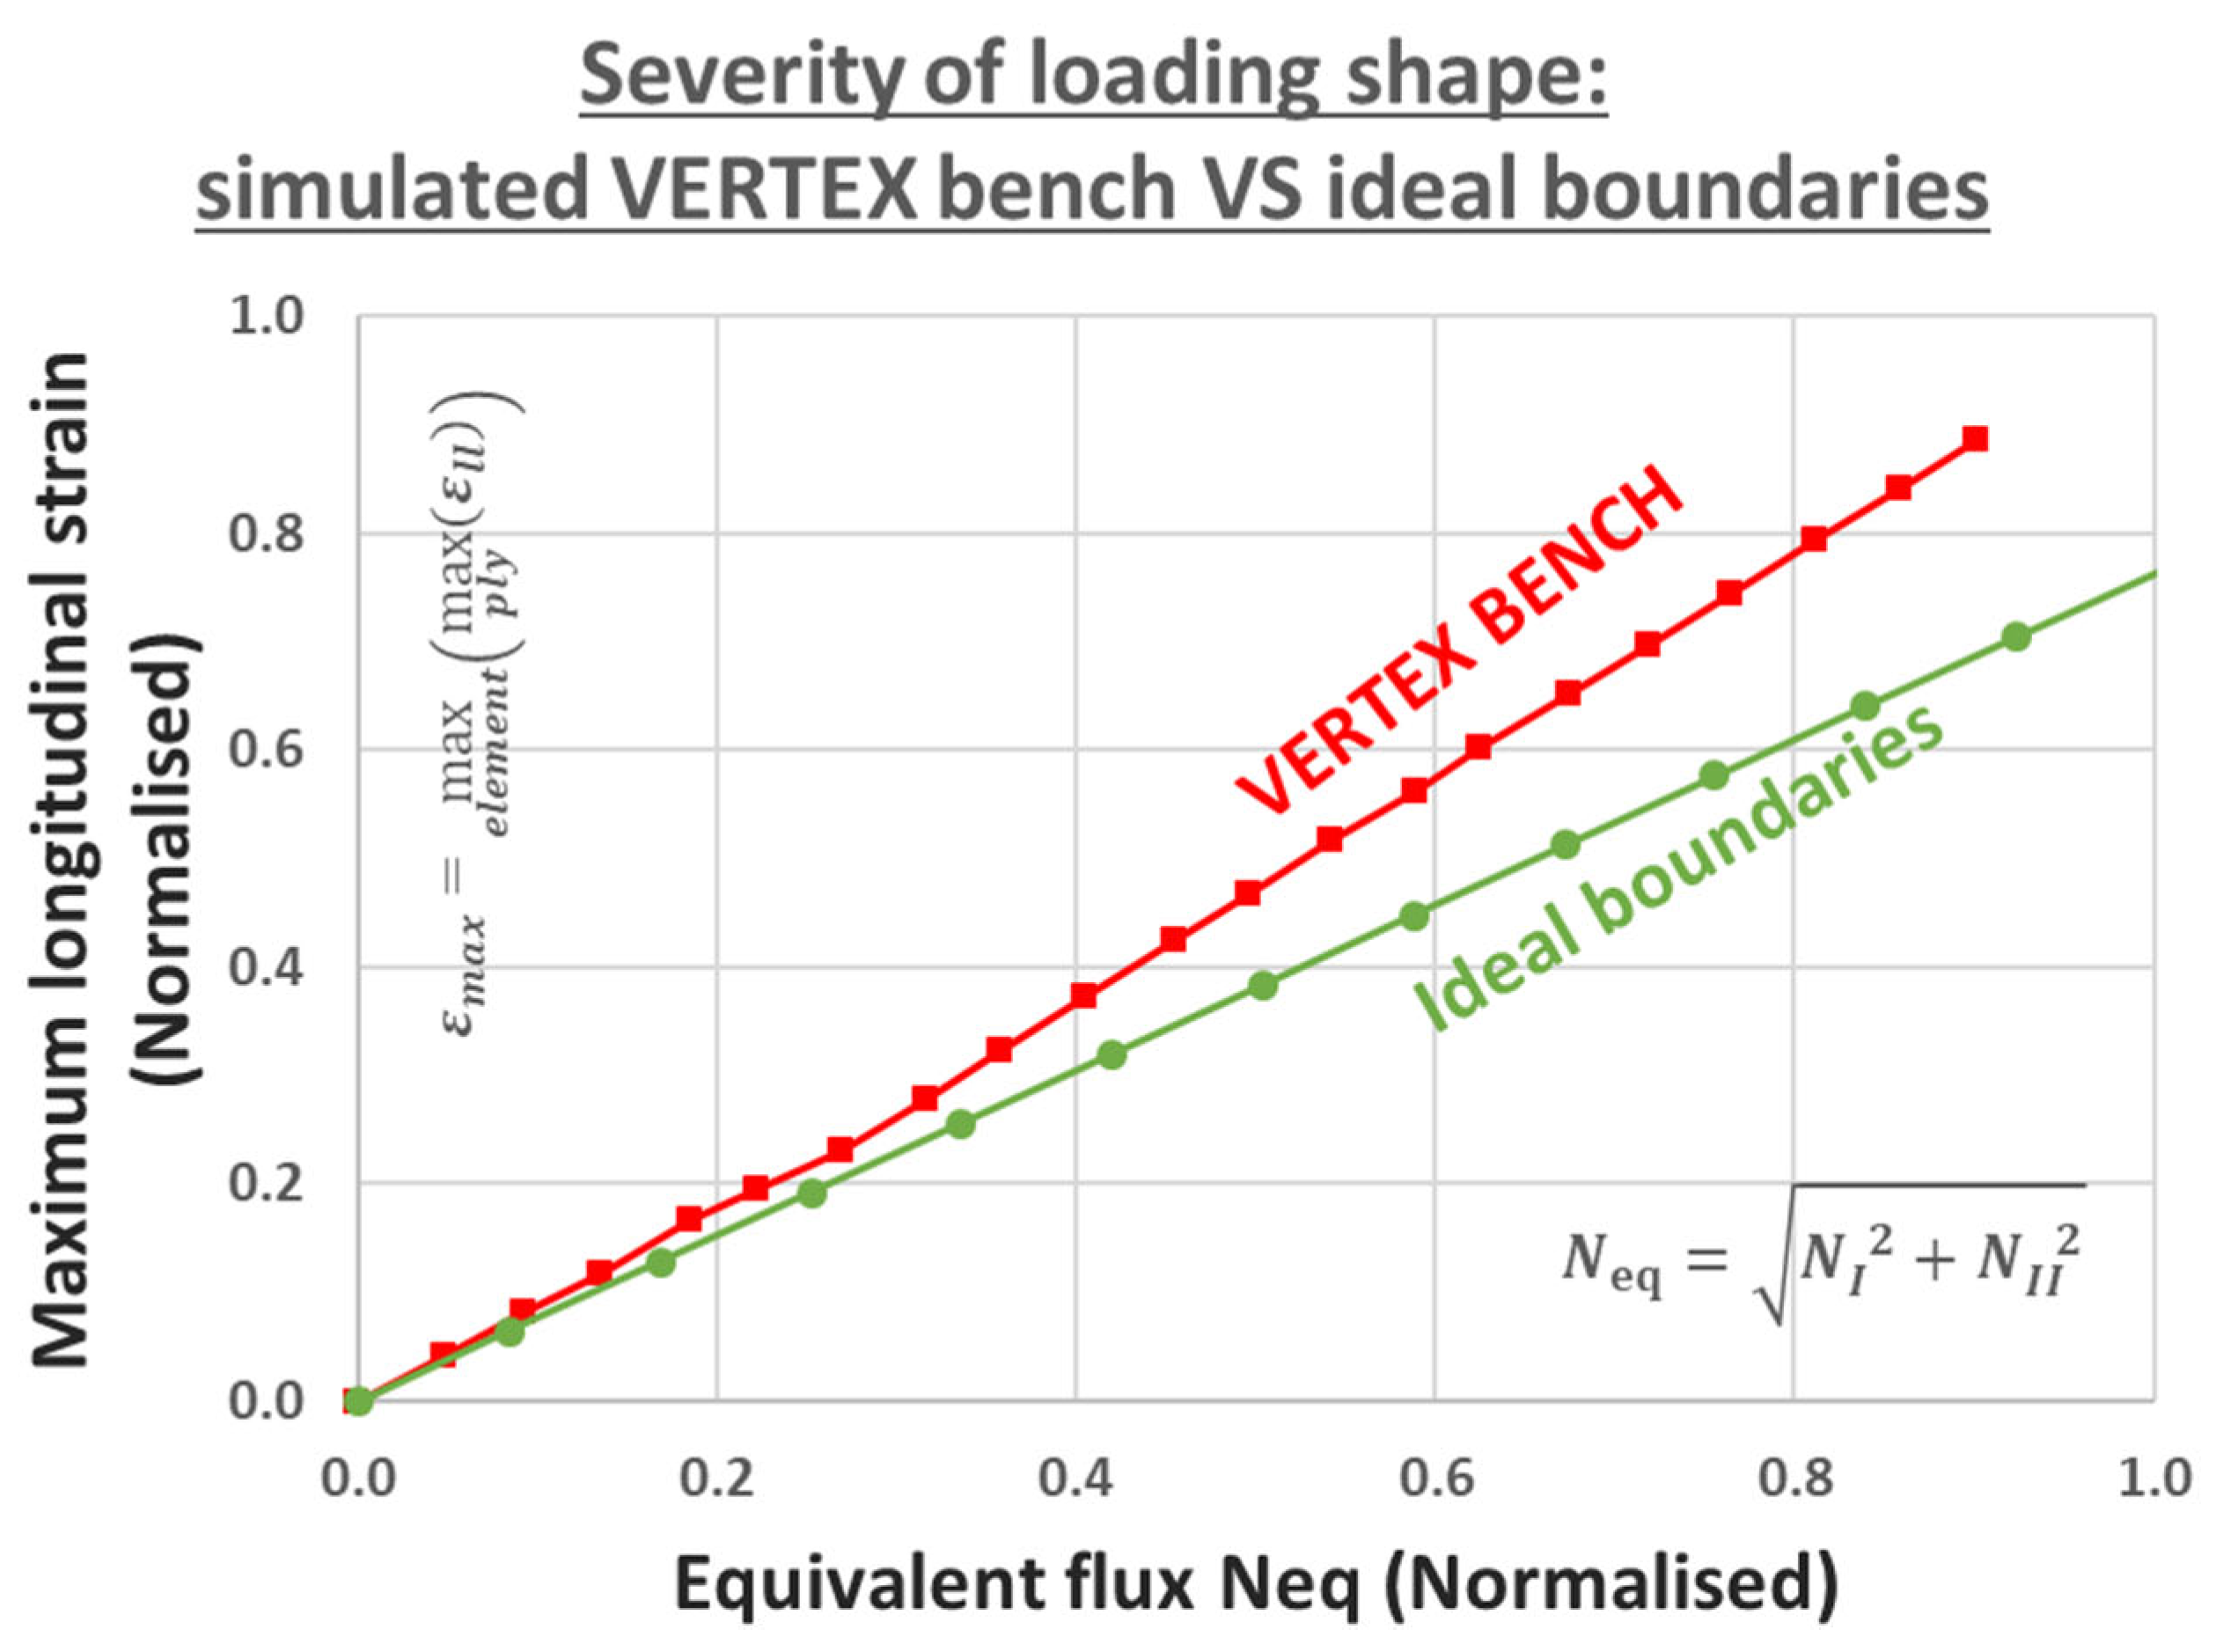
Figure 36.
First buckling modes and associated critical displacements of a TP sample for a VERTEX shear loading, obtained from a linear buckling analysis of the VERTEX model.
Figure 36.
First buckling modes and associated critical displacements of a TP sample for a VERTEX shear loading, obtained from a linear buckling analysis of the VERTEX model.
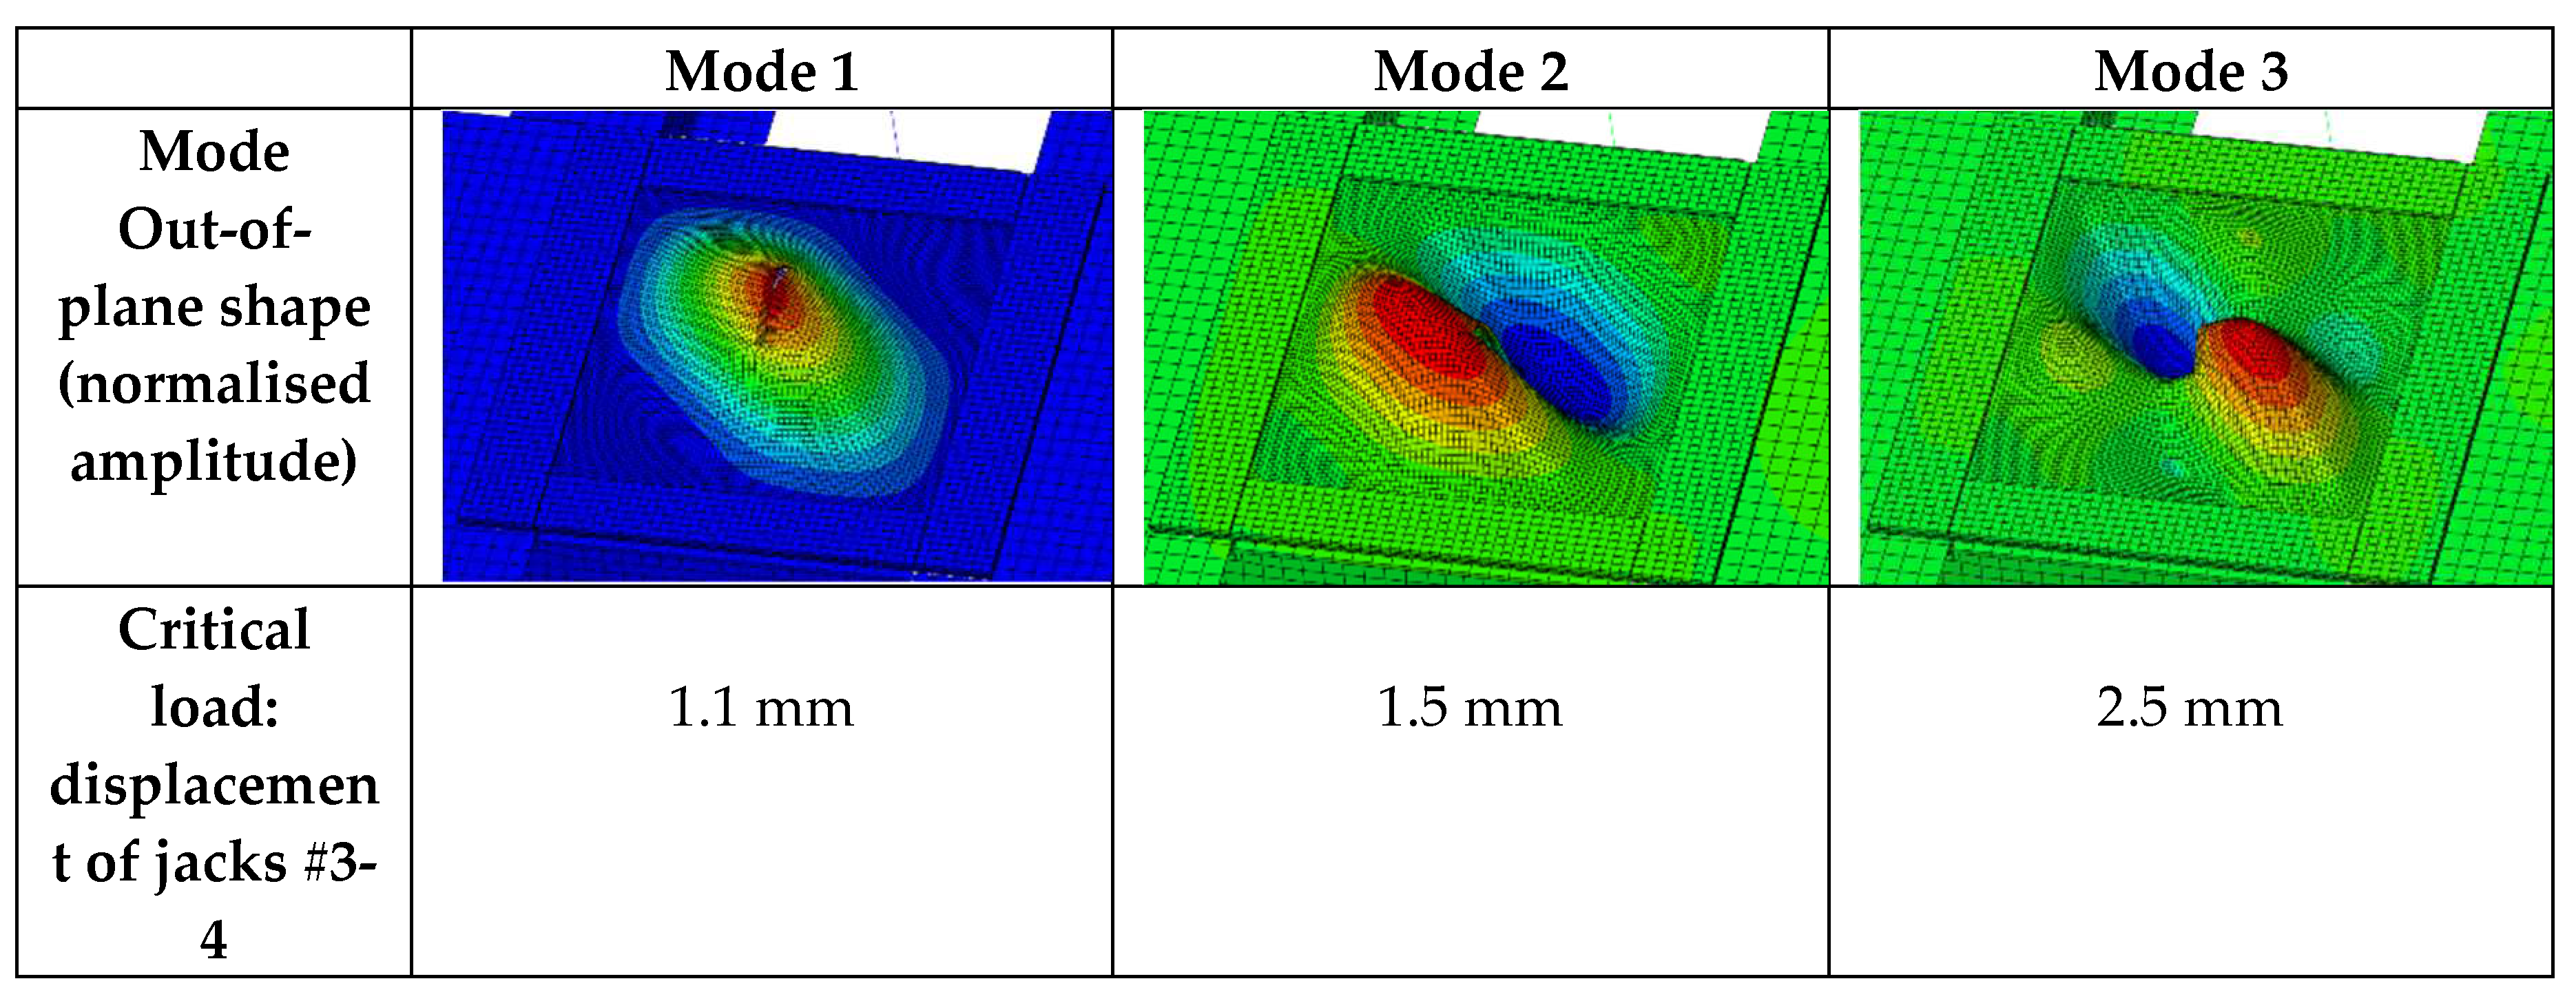

| Sample reference | Material | Central damage | Thickness (mm) |
|---|---|---|---|
| ALU | aluminium AU4G1 | None | 5 mm |
| TSs | unidirectional CFRP tapes, thermoset | 100 mm notch | ~1 mm |
| TSd | Same CFRP tapes as TSs | 100 mm notch | double that of TSs |
| TP | unidirectional CFRP tapes, thermoplastic | 100 mm notch | ~1 mm |
Table 2.
Connector stiffnesses identified for the VERTEX numerical model and behavior sensitivity to each parameter for the TSs test.
Table 2.
Connector stiffnesses identified for the VERTEX numerical model and behavior sensitivity to each parameter for the TSs test.
|
Parameter |
SAMPLE | BOX | BEAM | |||
|---|---|---|---|---|---|---|
| Axial | Radial | Axial | Radial | Axial | Radial | |
| Value (N/mm) | 10 000 | 5 000 | 10 000 | 10 000 | 80 000 | 100 000 |
| Influence on Tension | +++ | --- | +++ | --- | + | --- |
| Influence on Shear | + | + | ++ | ++ | - | -- |
Disclaimer/Publisher’s Note: The statements, opinions and data contained in all publications are solely those of the individual author(s) and contributor(s) and not of MDPI and/or the editor(s). MDPI and/or the editor(s) disclaim responsibility for any injury to people or property resulting from any ideas, methods, instructions or products referred to in the content. |
© 2023 by the authors. Licensee MDPI, Basel, Switzerland. This article is an open access article distributed under the terms and conditions of the Creative Commons Attribution (CC BY) license (http://creativecommons.org/licenses/by/4.0/).
Copyright: This open access article is published under a Creative Commons CC BY 4.0 license, which permit the free download, distribution, and reuse, provided that the author and preprint are cited in any reuse.


