
Submitted:
22 November 2023
Posted:
23 November 2023
You are already at the latest version
Abstract
A La2FeCrO6 (LFCO) double perovskite powders were synthesized by hydrothermal method, which crystallized in an orthorhombic (Pnma) structure and exhibited a spherical morphology with average particle size of 900 nm. Fourier transformation infrared spectroscopy confirmed the octahedral coordination of Fe and Cr ions in the powders. XPS spectra revealed dual oxide states of Fe (Fe2+/Fe3+) and Cr (Cr3+/Cr4+) elements, and oxygen element appeared as lattice oxygen and defect oxygen, respectively. The LFCO powders exhibit ferromagnetic behavior at 5 K with saturation magnetization of 0.31 μB/f.u., coercive field of 8.0 kOe, and Curie temperature of 200 K. Griffiths phase appeared in the powders between 200 K and 223 K. The LFCO ceramics displayed a butterfly-like magnetoresistance (MR)-magnetic field (H) curve at 5 K with MR (5 K, 6 T) value of -4.07%. Temperature dependence of resistivity of the LFCO ceramics demonstrated their semiconducting nature. Electrical transport data were fitted by different conduction models. Strong frequency dispersion dielectric behavior was observed in the LFCO ceramics. A dielectric abnormality observed around 260 K, was ascribed to the jumping of electrons trapped in shallow levels created by oxygen vacancies. The dielectric relaxation behavior exhibited by dielectric loss between 160 K and 260 K, was contributed to the singly-ionized oxygen vacancies.
Keywords:
double-perovskites
; La2FeCrO6 oxides
; hydrothermal process
; magnetic properties
; electrical transport properties
; microstructural characterization
1. Introduction
The The Perovskite transitional-metal (TM) oxides have gained numerous of attention due to their wide spectrum of intriguing properties [1–3], which originate from the interactions among the degrees of freedom of charge, spin, orbital, and lattice in the perovskite TM oxides [4]. Recently, special attention has been given to the double perovskites (DPs) A2B′B″O6 with hybrid 3d, 4d, or 5d TM ions at B-site [5–7], where the TM B′ and B″ ions are alternatively arranged along [111] direction to form a rock-salt type sublattices. In such a system, the interplay between the B′ (with localized 3d electrons) and B″ ions (with delocalized 4d or 5d electrons) provides more compositional flexibility to generate fascinating multifunctionalities [8,9]. Therefore, under the hybrid 3d with 4d or 5d TM ions at B-site, highly spontaneous ordering can be achieved at B-site because of their large differences in chemical valence states and ionic sizes between the B′ and B″ ions. For example, structural ordered SrFeMoO6 [5], Sr2FeReO6 [10], and Sr2CrReO6 [11] bulk DP oxides have been successfully synthesized. However, in the case of the hybrid 3d (B′) and 3d (B″) TM ions, the synthesis of the 3d (B′)−3d (B″) ordered DP oxides is much more difficult because of their similar ionic sizes [12,13].
As a representative 3d-3d DP oxides, La2FeCrO6 (LFCO) has drawn considerable attention, since it provides a model system for testing the propensity for ferromagnetism, given this combination and configuration of Cr3+ and Fe3+ ions, and the general infallibility of the Goodenough–Kanamori rules [14,15]. In the past decade several works have been done in the LFCO oxide system from theoretical and experimental aspects. Ueda et al. [16] first realized the ferromagnetic (FM) ordering in the artificial LaCrO3−LaFeO3 superlattices, which were fabricated by laser molecular beam epitaxy via alternative depositions of Cr3+ and Fe3+ ions on the (111) plane. The magnetic coupling between Cr3+ and Fe3+ ions was confirmed to be FM in terms of superexchange [14,15]. Unfortunately, their measured saturated magnetization, MS (= 3.0 μB/f.u.) was much lower than the theoretical one (MS ~7.0 μB/f.u.). Neutron powder diffraction data have demonstrated that the LFCO compound has an orthorhombic structure with space group of Pbnm, and the Fe and Cr cations are randomly positioned at the B-site, respectively, displaying an antiferromagnetic (AFM) behavior at 265 K [17]. That is in agreement with the AFM coupling as expected from the linear d3(Cr3+)−d3(Cr3+) and d5(Fe3+)−d5(Fe3+) superexchange (SE) interaction [18]. According to the GK rules, a hybrid Fe3+ and Cr3+ ions at the B-site in the LFCO DP oxide with a rock-salt ordering is expected to exhibit an FM coupling due to the SE interaction via the Fe(d5)–O–Cr(d3) magnetic path [14,15]. Recently, theoretical calculations have demonstrated a ferrimagnetic (FiM) ground state in the ordered DP LFCO oxide with Cr3+ and Fe3+ ions coupled antiferromagnetically [19]. This conclusion was experimentally verified in the well-ordered epitaxial LFCO thin films with B-site ordering degree as high as 90% [20]. The MS value of this ordered LFCO film was measured to be 2.0 μB/f.u. at 5 K, which satisfied with the Pickett’s model [21], but broke the KG rules. In the bulk LFCO samples, only the AFM behavior was observed [22]. The disappearance of FM order in bulk LFCO samples is attributed to the existence of random distributions of Fe3+ and Cr3+ ions at B-sites. As described above, different magnetic behaviors have been reported in the LFCO oxide system in the forms of artificial superlattices, thin films, and bulks, which are believed to be closely related to the different couplings of the Fe–O–Fe, Cr–O–Cr, and Fe–O–Cr bonds [16]. Despite the structure and physical properties of the LFCO oxide system have been widely investigated, however, there are still much controversy in their magnetic behaviors because the magnetic properties of DP oxides are very sensitive to the oxygen vacancies () and volatilization of the La during their high-temperature synthesis, which favor for the formation of different oxide states of the Fe and Cr elements. A competition between the AFM and FM interactions via the following possible magnetic paths [23]: Cr2+–O–Fe3+, Cr2+–O–Fe4+, Cr3+–O–Fe3+, Cr3+–O–Fe4+, Cr2+–O–Cr2+, Cr3+–O–Cr3+, Fe3+–O–Fe3+, Fe4+–O–Fe4+, Cr2+–O–Cr3+, and Fe3+–O–Fe4+, leads to different magnetizations in the LFCO oxides. Thus, in order to explore the physical mechanisms behind these anomalous magnetic behaviors of LFCO DP oxides, more systematic researches are highly required. Recently, Sun et al. [24] performed theoretical investigations on the structural and magnetic behaviors of R2CrFeO6 (R = rare earth elements) DP oxides by first-principles calculations. They found that the magnetic moments of Fe and Cr in R2CrFeO6 oxides are anti-parallelly aligned, exhibiting a FiM behavior. Since the FiM state in monoclinic P21/n phase has the lowest energy, it can be termed as the ground state. The energy differences between P21/n and R-3 phases are reduced with increasing the R radius. The magnetic behaviors of R2CrFeO6 DP oxides are not only related to the titling angles but also to the different constituents of the material. An insulating ferrimagnet LFCO with anti-aligned S = 3/2 Cr3+ and S = 5/2 Fe3+ ions, is predicted through various first-principles approaches (e.g., local spin density approximation (LSDA), a correlated band theory LDA+U, and the Tran-Blaha modified Becke-Johnson method) implemented in two all electron full-potential codes [19]. The magnetic orders in (LaFeO3)n–(LaCrO3)n superlattices (denoted as SL(n)) and in the corresponding LaFe0.5Cr0.5O3 bulk, are also studied by Monte Carlo simulations [25]. The simulation results demonstrate that the FM and FiM behaviors can be observed in SL(1) and SL(3), while two different AFM orders are observed in SL(2) and SL(4). The present results not only support the experimental data in the SL(1) but also predict new possible ordered phases in these SLs with other periods. However, up to date, the electrical and magnetic transport properties of the LFCO oxide system are hardly reported.
In view of the above facts, in the present work, the LFCO oxides were synthesized by hydrothermal process, which is characterized as a powerful method for synthesis of perovskite oxide powders with controllable sizes and morphologies that are strongly dependent on the starting precursors, reaction temperature and time, pH, and the type and concentration of mineralizers. The structural, magnetic, dielectric properties of the hydrothermal LFCO DP oxides as well as their transport properties were comprehensively investigated, to provide a better understanding of the relationships between microstructure and physical properties of the LFCO oxides.
2. Materials and Methods
2.1. Synthesis of LFCO powders
In this work, the LFCO powders were synthesized by the hydrothermal process, which was performed in a Teflon-lined stainless steel autoclave with a filling capacity of 80%. First, stoichiometric amounts (molar ratio of La:Fe:Cr = 2:1:1) of La(NO3)3⋅6H2O, Fe(NO3)3⋅9H2O, and Cr(NO3)3⋅9H2O solutions were prepared with 0.5 M concentration. For a typical synthesis of LFCO powders, 2 g KOH were added to 5 mL Cr(NO3)3⋅9H2O and 5 mL Fe(NO3)3⋅9H2O to form a suspension. Then, 10 mL La(NO3)3 and 8 g KOH were added into the above suspension in sequence under vigorous stirring for 30 min at room temperature to form a mixed solution. This mixed solution was transferred into the hydrothermal autoclave and heated at 433 K for 4 h. The resulting product was filtered, washed with deionized water, and dried at 353 K for 12 h in an oven. Finally, the obtained brown powders were post-annealed in air at 1473 K for 12 h.
2.2. Structural and physical characterization
The phase structure of the post-annealed LFCO powders was investigated by powder X-ray diffraction (XRD) at room temperature using a SIEMENS D5000 diffractometer under Cu Kα radiation (λ = 1.54056 Å). The step-scanning mode was used with step size of 0.02o and collecting time of 8 s per step. The collecting angle 2θ varied from 20o to 80o. The experimental XRD data were analysed by the Rietveld refinement using the GSAS software [26]. The Fourier Transformation Infrared (FTIR) spectra were measured in the 400 cm-1 −1600 cm-1 range using PerkinElmer FT-IR 65 spectrometer. The morphology and chemical compositions of the LFCO powders were examined by scanning electron microscope (SEM, FEI QUANTA 650) with an attached energy dispersive X-ray spectroscopy (EDS). The EDS data were recorded in a mapping mode. The valence states of the La, Fe, Cr, and O elements in the LFCO powders were identified by X-ray photoelectron spectroscopy (XPS) spectra using a PHI 5000 spectrometer (Versa Probe, ULVAC-PHI, Japan) under Al Kα radiation at 1486.60 eV as X-ray source. All the collected XPS spectra are calibrated by C1s core-level located at 284.60 eV. Dielectric properties of the LFCO ceramic pellets were characterized by an Agilent 4192 A impedance analyzer (Agilent technologies, Santa Clara, CA, USA) in a frequency range of 102−106 Hz and in the temperature range of 173−373 K monitored by temperature controller (DMS-2000, Partulab Technology, Wuhan, China). The D.C. magnetization (M) data were measured by a SQUID magnetometer (MPMS3, Quantum Design). The M−T curves were recorded using the protocols ZFC (zero-field cooling) and FC (field cooling) under an applied magnetic field of 500 Oe within the temperature range of 2−300 K. The M−H curves were measured at 5 K and 300 K, respectively within the magnetic field of ± 6 T. All the magnetic measurements were performed with the powder samples installed inside a Teflon capsule. The resistivity (ρ) of the LFCO ceramics was measured as a function of temperature from 2 K to 800 K by the standard four-probe method without magnetic field. The magnetic field dependence of ρ for LFCO ceramics was also measured from -6 to 6 T by the standard four-probe method at 5 K and 300 K, respectively. From which the magnetoresistance (MR)-magnetic field (H) curves were deduced.
3. Results and Discussion
3.1. Microstructural characterization
Figure 1 shows the room temperature XRD pattern of the post-annealed LFCO powders. The XRD pattern could be indexed in an orthorhombic perovskite structure (space group Pnma, JCPDS file, No. 89-0478), indicating that the LFCO powders crystallize in an orthorhombic lattice symmetry. The XRD data of the LFCO powders are subjected to Rietveld refinements, and the results along with the allowed Bragg reflections are also demonstrated in Figure 1. During the Rietveld refinements, three fitting reliability parameters (Rp, Rwp, and χ2) are utilized to assess the fitting quality between the experimental data and the theoretical ones. The resolved fitting reliability factors are Rwp = 6.03% and Rp = 5.98%, and the small value of goodness of fitting, χ2 = 2.32 implies an effective fitting of the experimental XRD pattern. The refined structural parameters at room temperature are listed in Table S1. These values match well with that reported in the literatures [27,28]. The Goldschmidt’s tolerance factor (t) of the LFCO powders was also calculated to be 0.961, indicating that an orthorhombic crystal structure was preferred for the present LFCO powder [29]. It is also noticed that any XRD peak representing the B-site cationic ordering does not appear in Figure 1, suggesting that it is difficult to form a superstrucre via the Fe3+ and Cr3+ ionic ordering at the B-site due to their similar ionic sizes and the same valence states [30]. The average crystallite size (D) was determined to be 41 nm by using the Scherrer formula [31]:
where D is the diameter of a crystallite particle; B the width of the (200)/(121) diffraction peak measured at its half-height (in radians), λ is the X-ray wavelength and 2θB is the diffraction angle corresponding to the Bragg maximum.
The typical low-magnification SEM image of the LFCO powders is displayed in Figure 2a, and Figure 2b presents the corresponding histogram of the particle size distribution in the LFCO powders. It is observed that the LFCO particles exhibit spherical morphology and the average particle size of 0.90 μm is deduced from the fitting the particle size distribution. Figure 2c displays an EDS spectrum taken from the LFCO powders under a mapping mode, demonstrating the EDS signals of the constituent elements (La, Fe, Cr, and O), as expected. There are no any other elements in the LFCO powders. The quantitative EDS data gave out the cationic molar ratio of La:Fe:Cr equal to 2:0.94:0.93, which approached to the nominal stoichiometry of the powder samples.
FTIR spectroscopy was used to identify the local symmetry in the hydrothermal LFCO powders. The obtained infrared spectrum is illustrated in Figure 3, where two prominent absorption bands at 437 cm-1 and 603 cm-1 are observed. The weak absorption band at 437 cm-1 is associated with the bending vibrations of the O–Fe–O bonds in the FeO6 octahedron [32] and the O-Cr-O bonds in the CrO6 octahedron [33], while the intense absorption band at 603 cm-1 is resulted from the Cr-O stretching vibration inside the CrO6 octahedra [34]. Thus, the octahedral coordination of Fe and Cr ions in the powders is confirmed by Fourier transformation infrared spectroscopy spectra.
The chemical valence states of La, Fe, Cr and O in the LFCO powders were examined by XPS spectra at room temperature. Figure 4a exhibits the survey scanning XPS spectrum for the LFCO powders in the energy range from 200 to 1000 eV, where the XPS peaks corresponding to La 3d, Fe 2p, Cr 2p and O 1s core-levels are clearly observed. In addition, the C 1s core-level XPS peak also appears at 284.60 eV, which is be attributed to the conductive carbon tape employed in the XPS measurements. High-resolution La 3d, Fe 2p, Cr 2p, and O 1s XPS spectra are demonstrated in Figures 4b-4e, respectively. It is observed in Figure 4b that the La 3d XPS spectrum consists of two doublets located in the 831−840 eV and 850−858 eV regions, respectively. The former doublet corresponds to La 3d5/2 level and later one corresponds to La 3d3/2 level. In addition, the La 3d5/2 and La 3d3/2 XPS peaks have their own satellite peaks, which have the BE values of 838.43 eV and 855.32 eV, respectively. The two satellite peaks are ascribed to the electron transferring from the oxygen valence band to the empty La 4f level [35]. The difference (Δ) in BE value between the La 3d5/2 (834.47 eV) and La 3d3/2 (851.35 eV) XPS peaks, corresponding to the spin-orbit coupling of La element, was measured to be 16.88 eV. This Δ value of La element as well as the BE values of La 3d5/2 and La 3d3/2 XPS peaks, confirm the presence of La3+ ions in the LFCO powder sample [36]. Figure 4c depicts the XPS spectrum of Fe 2p3/2 in the region 706−715 eV, which is deconvoluted into two characteristic peaks located at 710.15 eV and 711.40 eV, and they can be assigned to Fe2+ and Fe3+ ions, respectively [37]. The relative amount molar ratio of Fe2+ to Fe3+ species was extracted from the peak fitting of the Fe 2p3/2 XPS spectrum, which was 18%:82 %. Thus, the effective oxide state of Fe ion was + 2.82. Figure 4d displays the XPS spectrum of Cr 2p3/2 in the region of 574−582 eV. Similarly, the
Cr 2p3/2 XPS peak is also deconvoluted into two maxima. with BE values of 576.25 eV and 578.90 eV, respectively. They are assigned to the Cr3+ and Cr4+ species, respectively [38,39]. The relative amount molar ratio of the Cr3+ to Cr4+ species was calculated as 74%:26 %. Therefore, the effective oxide state of Cr ions was + 3.26. As can be seen in Figure 4e, the O 1s XPS spectrum in the 526–536 eV region exhibits an asymmetric feature, indicating more than one kind of oxygen species in the powder samples. It is reported that three types of oxygen species named as lattice oxygen (denoted as Oα), defect oxygen (represented as Oβ) and surface adsorbed oxygen (designated as Oγ), appear in the regions of 529−530 eV, 530−532 eV, and 533−534 eV, respectively [40,41]. Here, only two types of oxygen species appear in the O 1s XPS spectrum, which are lattice oxygen (Oα) with BE value of 529.42 eV and defect oxygen (Oβ) with BE value of 531.70 eV, respectively. The relative amount molar ratio of Oα to Oβ species was estimated to be 46%:54 %. This result indicates a higher ratio of oxygen defects in the LFCO powders. The species, peak positions and relative amount molar ratios obtained from the peak fittings of the XPS spectra for Fe 2p3/2, Cr 2p3/2 and O 1s are summarized in Table S2, where the effective oxidation states of the Fe and Cr ions are also presented.
3.2. Magnetic properties
Figure 5a displays the field-dependent magnetization curves (M-H) for the LFCO powders recorded at 5 K and 300 K, respectively. It is noticed that at 300 K the M-H curve of the LFCO powders exhibits a linear-like behavior with almost zero remnant magnetization and coercivity, indicating a paramagnetism like behavior. While at 5 K an open hysteresis loop is clearly observed, which is saturated at a particular magnetic field HF = 40 kOe. Beyond 40 kOe a linear increase of magnetization with increasing the magnetic field is observed, indicating an AFM behavior of the samples. The SE interactions of Fe3+–O–Fe3+ and Cr3+–O–Cr3+ magnetic paths are responsible for the AFM character of the samples. Furthermore, the small open hysteresis loop observed in the LFCO powders indicates a weak ferromagnetism, which is attributed to double-exchanges interactions via Fe3+–O–Cr3+, Fe3+–O–Cr4+, Fe2+–O–Cr3+, and Fe2+–O–Cr4+ magnetic paths. The magnetic parameters such as the remanent magnetization (Mr) and coercive field (Hc), were obtained from the M-H hysteresis loop recorded at 5 K, which were Mr = 0.23 emu/g (or 0.02 μB/f.u.) and Hc = 8.0 kOe, respectively. It is noticed that the magnetization increases linearly as increasing the magnetic field above the HF, thus, the measured M-H curve is composed of two parts: one is from the saturated hysteresis loop at HF and another one is from the AFM magnetization following a linear relationship with the magnetic field. Therefore, the M(H) at the high-field can be expressed by Equation (2) [42]:
where χAFH is the contribution from the AFM magnetization and MS is the saturation magnetization of the weak ferromagnetism. The law of approach to saturation is used to calculate the MS value according to the equation (3) [43]:
where A refers to a micro-stress related constant, B denotes a constant that represents the contribution of magneto- crystalline anisotropy. Figure 5b displays the approach to the saturation plot for the investigated sample. The MS of the LFCO powders can be obtained by intercepting the curved line with the magnetization axis as approaching to zero. Thus, the experimental MS for the LFCO powders was extrapolated to be 3.64 emu/g (or 0.31 μB/f.u.) at 5 K. This value was higher than the previously reported MS values for the hydrothermal LaFe0.5Cr0.5O3 powders (MS = 0.21 μB/f.u.) [44], LFCO nanoparticles (MS = 0.046 μB/f.u.) synthesized via the citrate auto-combustion technique [45], and LaFe0.5Cr0.5O3 ceramics (MS = 0.04 μB/f.u.) prepared by solid-state reaction method [17]. However, the present MS value is much smaller than the theoretical value (MS = 4.0 μB/f.u.) predicted for the LaFe0.5Cr0.5O3 compound with atomic order of Fe3+(d5)-O-Cr3+(d3) under high-spin states [46] or the MS = 2.0 μB/f.u. reported for the highly-ordered LFCO thin films (B-site ordering degree as high as ~ 90%) [20]. From the local spin-density calculations, Pickett et al. found that a ferrimagnetic ground state in the LCFO compound with a MS of 2 μB/f.u. was much more stable than the FM ones with MS of ∼7.0 μB/f.u. [21]. It is known that the magnetic properties of the LFCO samples are not only dependent upon how the magnetic coupling between Fe3+ and Cr3+ ions at B-site (e.g., long range FM or AFM order) but also upon the ordering degree of Fe3+ and Cr3+ ions at B-site (e.g., fully ordering, partial ordering or complete disordering) due to their different d-orbitals and occupied states (e.g., t2g or eg orbitals; empty, half-filled, or fully filled orbital states) and different magnetic moments. The present XRD data reveal that Fe3+ and Cr3+ ions are almost fully disordered at the B-sites in the LFCO powders, which destroys the long-range alignments of magnetic moments. Actually, the theoretical MS value of the LFCO powders was evaluated to be 2.14 μB/f.u. based on an intuitive ionic model. The lower experimental MS value is ascribed to the existence of anti-site defects (ASDs) in the LFCO powders, which was determined to be 42.8%, and the corresponding B-site ordering degree (
M(H) = χAFH + MS
) of the LFCO powders was 14.4%. Details are described in the supporting information (Part A). The temperature dependence of the MZFC and MFC curves is shown in Figure 5c. The two M-T curves demonstrate a typical ferrimagnetic (FiM) transition around 200 K, which is a field independent magnetic phase transition at TC = 200 K, as confirmed by the derivative dM/dT curves for both the MZFC and MFC and plotted in the inset of the Figure 5c. Such a transition temperature is smaller than that reported for the bulk samples (TC = 265 K)[17]. The difference (ΔTc = 65 K) can be ascribed to the finite size and/or surface strain effect of nanopowders [47]. Upon cooling, the MZFC curve varied very smoothly, and the paramagnetic (PM)-to-FiM transition behavior was very weak, and a much wide phase transition peak appeared. The blocking temperature (TB) associated this wide phase transition can be determined to be 113 K from the minimum of the first derivative dMZFC/dT curve (see inset in Figure 5c). The low temperature phase transition from FiM to AFM phases appears around TN = 10 K. A large irreversibility between the ZFC and FC curves (ΔM = (MFC – MZFC)/MFC ~ 71% at 50 K) was observed, which was ascribed to the predominant alignments of the spin orientations increasing fast under the applied magnetic field of 500 Oe. It is noticed that the MZFC and MFC curves do not merge at TC, which is ascribed to the magnetic frustration and/or magnetic disorder of the B-site octahedral sublattice [37]. The irreversibility was maintained well above TC, which indicated the true paramagnetic behavior was not reached immediately above TC. It is noticed that the magnetic moments (M) of LFCO powders were much small (in the range of 0.01−0.05 emu/g) within the measured temperature range (2–300 K), which is attributed to the almost random distribution of Fe3+ and Cr3+ ions at B-site site and/or oxygen vacancies (). Figure 5d shows the temperature dependence of inverse of the susceptibility (χ-1), where χ-1 exhibits a linear relationship in the temperature range of 225−280 K, indicating a PM behavior. The χ-1(T) follows the Curie–Weiss (CW) law, as expressed by Equation (4)
where C is the CW parameter and θP is the PM Curie temperature, which are tabulated in Table S1. The negative θP (θP = - 441 K) suggests the predominant AFM interaction in the LFCO powders, which is consistent with the AFM behavior reflected by the M-H loops at 5 K. As further decreasing the temperature below 223 K, χ−1 decreases smoothly in a quasi-linear manner at an extended temperature range. By using the CW parameter C the effective magnetic moments (μeff) in the PM phase can be calculated as 6.64 μB/f.u. (@ 500 Oe), and the theoretical magnetic moment, μcal (per formula unit) of the La2O6 can be determined as 6.80 μB/f.u. Details of μeff and μcal calculations are described in the supporting information (Part B). It is noticed that the μcal of the LFCO powders is slightly larger than the μeff under external magnetic field of 500 Oe. This is attributed to the weakness of the magnetic coupling between the Fe and Cr ions due to the existence of high ASD content (= 42.8%) in the LFCO powders. The calculated μeff and μcal for the LFCO powders are tabulated in Table S1. It is also noticed that in Figure 5(d) the χ-1- T curve exhibits a severe downturn divergence from the CW law as the temperature is below 223 K (denoted as Griffiths temperature, ), indicating the appearance of Griffiths phase (GP) phase in the LFCO powders. The GP phase lies between the completely disordered paramagnetic high-temperature regime and the magnetically ordered state [48]. In the GP region, χ-1 - T follows a power law described in Equation (5) [49, 50]:
where γ is an exponent of magnetic susceptibility between zero and one, representing the strength of GP, and is a random critical temperature, which is obtained from γ = 0 in the CW regime [51] and equivalent of the θP. Thus, γ = 0 corresponds to the PM state and γ = 1 corresponds to a GP phase. A nonlinear fitting curve of the deviated region of χ-1 in the temperature range between TC and TG is presented in Figure 5(d), from which the γ value is obtained as 0.268 and the corresponding values of is 146.2 K. The small γ value indicates that the Griffiths singularity is weak in the LFCO powders.
χ-1(T) = (T-θp)/C
to obtain the MS value of the powders. (c) Magnetizations (M) of the LFCO powders with respect to the temperature measured under ZFC and FC modes, and (d) magnetic inverse susceptibilities (χ-1) with respect to the temperature under the applied field of 500 Oe. Inset in Figure (c) is the plot of dMZFC/dT vs T.
3.3. Dielectric properties
Figure 6a shows the frequency dependent dielectric properties of the LFCO ceramics measured at room temperature. It is observed that both dielectric constant (εr) and dielectric loss (tanδ) fall continuously as increasing the frequency, and they display a strong frequency dispersion dielectric behavior. A fast reduction in εr and tanδ at low frequencies can be contributed to the onset of several of polarization mechanisms such as space charge, dipolar, ionic, and electronic polarizations. Under the applied the electric field, electrons can hop across the grains and grain boundaries. In the LFCO ceramics, their grain boundaries possess higher resistance, thus, charge carriers accumulate at there, leading to a space charge polarization [51]. The dipolar polarization and interfacial polarization make significant contributions to the higher value of εr at low frequencies. In order to move these charge carriers along grain boundaries, a large amount of energy is required, resulting in a high tanδ value. At higher frequencies, only the electronic and ionic polarization mechanisms are capable of responding to the imposed electric field, leading to the smaller values of both εr and tanδ. In addition, charge carriers gathered at the grain boundaries are also reduced at higher frequencies. Thus, these confined charge carriers are scattered, resulting in smaller εr and tanδ values. Such dielectric dispersion can be well explained based on the Maxwell-Wagner relaxation model [52].
The εr and tanδ values of the LFCO ceramics are measured with respect to temperature under a series of frequencies, and the results are displayed in Figure 6b and Figure 6c, respectively. It is noticed that in Figure 6b the εr increases very slowly in the low temperature below 200 K, whereas beyond 200 K the εr increases fast and reaches a maximum peak at temperature around 260 K, and then decays following the CW law. In addition, the peak value of the εr exhibits a collapse with increasing the frequency but the peak positions do not shift towards high temperature direction. That is much clearly observed in the εr -T curves measured at low frequencies (1kHz−40 kHz). This dielectric abnormality can be ascribed to the jumping of electrons trapped in a shallower level created by . The trapped electrons can be excited to the conduction band of the LFCO ceramics via thermal excitation at approximately 260 K (thermal energy kBT = 0.0224 eV at 260 K). The activation energy (Ea) for the jumping of electrons was estimated to be 0.02 eV. As the applied electric field frequency increases, the jumping electrons trapped in the shallower level fail to catch up with the field, and their contributions to the εr decrease, leading to the collapse of εr value with increasing the frequency, as shown in Figure 6b. However, at higher frequencies (e.g., 400, 800, and 1000 kHz), the maximum peak of εr around 260 K disappeared, instead a diffused phase transition occurred mainly due to the almost fully disordered distributions of Fe and Cr cations at B-site in the LFCO ceramics with high content of ASDs. The compositional fluctuations at B-site result in the microscopic heterogeneity in the LFCO compound, leading to a statistics of local Curie points around the average one. In addition, at higher frequencies the contributions to the εr peak from the dipolar and interfacial polarizations become much less significant because the two polarization mechanisms are no longer operative to follow the applied electric field. In Figure 6c, the tanδ has much smaller value in the low temperature range below 260 K, and beyond 260 K a fast increase of tanδ appears, especially for those measured at low frequencies. The inset in Figure 6(c) shows the tanδ−T curves in temperature range of 180−260 K, where the relaxation peak for tanδ moves towards higher temperature as increasing the frequency from 1 kHz to 10 kHz and the peak value collapses simultaneously. This dielectric anomaly exhibiting the typical characteristics of dielectrics are associated with the oxygen vacancies () and the related defect dipoles [53]. In the LFCO compound with high content of ASDs, the ASDs can be generated in the forms of Fe-on-Cr site (FeCr) or Cr- on-Fe site (CrFe), respectively. Due to their different chemical oxide states, (Fe2+ on Cr3+ site or Fe3+on Cr4+site) and (Fe2+ on Cr4+ site) defects are readily formed at B-sites. The and defects can attract the to form defect dipoles, namely or These defect dipoles can change their orientations with respect to the jumping of O2- into vacant oxygen site of oxygen octahedron or due to the hopping of electrons (among Fe2+/Fe3+ or Cr3+/Cr4+ ions) that are weakly bound to . At low temperature below 200 K, the defects, or defect dipoles as well the free electrons hopping between Fe2+/Fe3+ and/or Cr3+/Cr4+ ions, are closely bound to their respective defect sites in the crystal lattice. Thus, they exhibit a weak dielectric response, leading to much smaller values of εr and tanδ at low temperatures [54]. However, a fast increase of the εr appeared around 260 K, which was attributed to that the defects in the LFCO ceramics were no longer bound to their respective lattice sites within a unit cell, instead, they could move throughout the whole sample, resulting in space charge, interfacial and/or defect dipolar polarizations and affecting the dielectric relaxation behaviour of the entire system [56]. Beyond 260 K, the εr decays following the CW law. As shown in Figure 6c, the sharp increase of tanδ at temperatures beyond 260 K can be attributed to the fast increase of the electrical conduction owing to the thermal activations of the and the electrons hopping between Fe2+/Fe3+ and/or Cr3+/Cr4+ pairs. To determine the activation energy (Ea) involved in the dielectric relaxation behaviour exhibited by tanδ in the temperature range of 160−260 K, a plot of Lnω versus 1000/T is used, as described by Equation (6):
where ω is the angular frequency corresponding to the tanδ peak value, ω∞ is the characteristic relaxation angular frequency at infinite temperature, Ea, kB and T have their normal meanings. Fitting the Lnω vs 1000/T curve with the Arrhenius law, a linear relation between Lnω and 1/T is observed shown as Figure 6d, which indicates that the dielectric relaxation process can be well described the by the Arrhenius relationship, and the relaxation activation energy Ea was estimated to be 0.586 eV. It is reported that the Ea value for the singly ionized in perovskite oxides is about 0.3–0.5 eV, while for the doubly ionized the Ea value is about 1.0 eV [55]. The present Ea value was 0.586 eV, close to that reported for the implying that this dielectric relaxation is associated with the movement of singly ionized .
3.4. Electrical transport properties
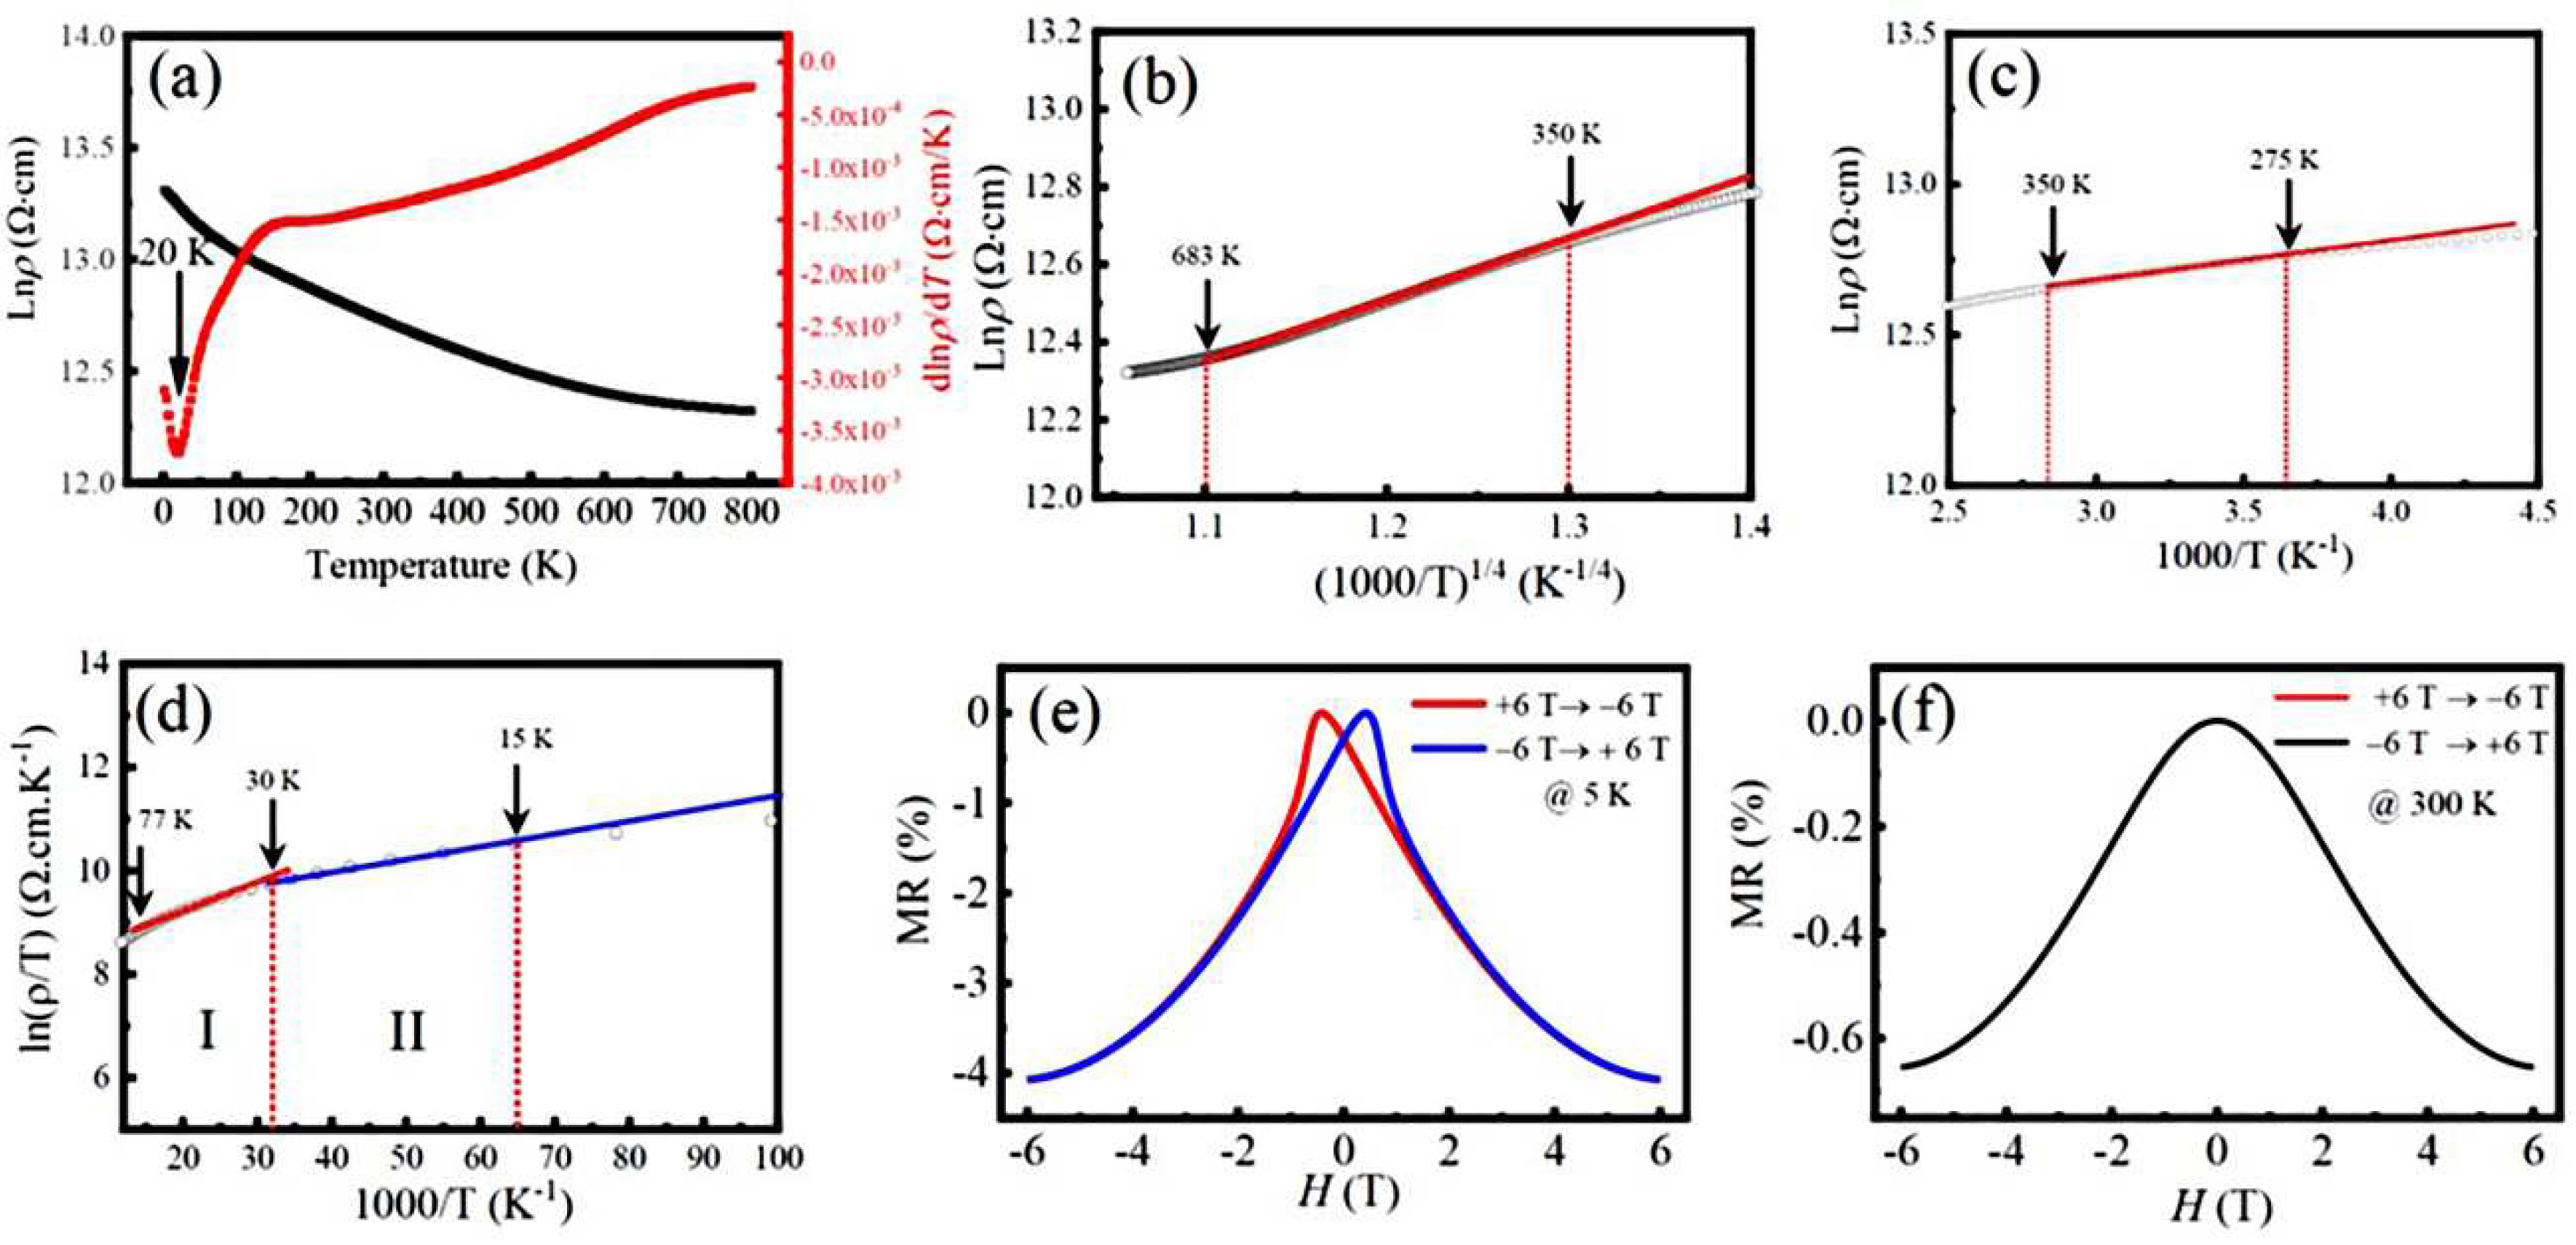
The temperature dependent resistivity Lnρ(T) of the LFCO ceramics is shown in Figure 7a, which displays a continuous decrease as increasing the temperature from 2 K to 800 K, as verified by the negative value of within the measured temperature range. That confirmed this type of ρ-T behavior was quite similar to that of a semiconductor. Notably, around the temperature of 20 K, the plot of dLnρ/dT against T exhibits a valley, indicating a steep reduction in the resistivity Lnρ(T) taken place around 20 K. This phenomenon could be ascribed to the phase transition undergone from antiferromagnetic to ferrimagnetic phases as increasing the temperature. Such a phase transition could lead to the fluctuation of the spin states around 20 K, resulting in a sharp rise in the charge carrier concentrations. Correspondingly, a steep reduction in the resistivity Lnρ(T) appears. To clarify the conduction mechanisms of the LFCO ceramic samples over the wide temperature range of 2−800 K, three different conduction models, namely Mott’s variable range hopping (VRH) model [56], thermal activation model [57], and small polaron hopping (SPH) model [58], are utilized. In the high temperature region of 350−683 K, the resistivity data are well fitted by VRH model, which is described by Equation (7) [56]:
where ρo is a resistivity pre-factor, and To = 18/kBN(EF)η3, denoting the Mott characteristic temperature. Here kB, N(EF) and η stand for the Boltzmann’s constant, the density of electronic states at Fermi level and the electron localization length, respectively. Figure 7b shows the well linear fitting of the plot of ln(ρ) vs (1000/T)1/4 curve in the temperature region of 350−683 K, which indicates the electrical transport of the LFCO ceramics is governed by Mott’s VRH mechanism. From the slope of the linear fitting, To is determined as 5989.7 K, and the corresponding N(EF) value is calculated to be 4.42×1024 eV−1 cm−3, where the η value was chosen as the scale of about the <Fe-O> bond length or the <Cr-O> bond length (∼ 1.99 Å) for the small polarons. The VRH transport is typically observed in a system with a random potential. Such random potential is produced by random distribution of Fe and Cr ions in the present samples, as confirmed by the above XRD patterns and magnetic data. A slight deviation from linear curve below 350 K in Figure 7b may be related to the magnetic scattering from the localized moments of Fe/Cr ions. In the temperature range of 275−350 K the plot of Lnρ versus inverse temperature (1000/T) is shown in Figure 7(c), which exhibits almost perfect linear fitting. Such kind of T-dependent resistivity is usually observed in semiconductors due to the thermally activated electrical transport, which is described as by Equation (8) [57]:
where Ea is the activation energy. The linear fitting gives out the Ea value of 11.43 meV. The small value of Ea is comparable to those of dopant levels in conventional semiconductors. In the temperature region below 275 K, the lnρ vs 1000/T plot is no longer linear, instead two good linear fittings can be obtained for lnρ/T vs (1000/T) from 15 K to 77 K, as displayed in Figure 7d. That indicates the electrical conduction is governed by the SPH mechanism in this temperature range, as described by Equation (9) [58]:
From the linear dependence of ln(ρ/T) vs (1000/T) shown in Figure 7d, the Ea values for the small polarons hopping are determined be to 4.85 meV and 2.20 meV in the two temperature regions I (30−77 K) and II (15−30 K), respectively.
The isothermal MR curves of the LFCO ceramics was measured at 5 K and 300 K, as demonstrated in Figure 7e and Figure 7f, respectively. A negative MR behavior was observed at 5 K, which was defined by Equation (10) [59]:
where Hpeak is the magnetic field at which the resistivity ρ reaches the maximum value. It was noticed that in Figure 7e the MR-H plot at 5 K exhibited a typical butterfly-like form, and the MR (5 K, 6 T) was determined to be -4.07%. Such MR value is higher than that reported for the semiconducting DP oxides such as Sr2CrReO6 ceramics (MR (4.2 K, 7 T) =−3.0%) [60], Sr2CrHfO6 ceramics ((2 K, 7 T) = −2.73%) [61], and Sr2Fe0.5Hf1.5O6-δ ((2 K, 7 T) = −2.05%) ceramics [62]. However, the butterfly-like form disappeared in MR-H plot at 300 K (Figure 7f), which was attributed to the absence of M-H hysteresis during the magnetic domain rotation under external magnetic field. It was also noticed that the MR value changed fast in a low magnetic field region whereas slowly under high magnetic field, exhibiting a good match with the steep magnetization process. That means the negative MR behavior originates from the magneto-tunneling effect in the LFCO ceramics.
4. Conclusions
In summary, LFCO DP powders were successfully synthesized by hydrothermal method, which crystallized in an orthorhombic distorted perovskite structure with space group of Pnma. SEM images reveal the spherical morphology of the LFCO powders with average particle size of 0.90 μm. EDS spectrum confirms the presence of all the constituent elements with atomic ratio of La:Fe:Cr = 2:0.94:0.93. XPS spectra confirm the existence of Fe2+/Fe3+ and Cr3+/Cr4+ species as well as two types of oxygen species (lattice oxygen and defect oxygen). The LFCO powders exhibit a weak ferromagnetic behavior at 5 K with MS of 0.31 μB/f.u. and Hc of 8.0 kOe, respectively. Such weak ferromagnetism is attributed to the existence of random network of Cr–O–Cr, Fe–O–Fe, and Cr–O–Fe linkages in the crystal lattices. The magnetic Curie temperature TC was 200 K and a strong irreversibility between the MZFC and MFC curves appeared around 295 K, which was attributed to the fast increase of the predominant alignments of the magnetic clusters under external magnetic field. Griffiths phase was observed in the LFCO powders within the temperature range of 200−223 K. A butterfly-like MR-H curve was observed in the LFCO ceramics at 5 K, and the MR (5 K, 6 T) value was -4.07% due to the magneto-tunneling effect. The temperature dependent resistivity data for the LFCO ceramics exhibit a semiconducting behavior, and the resistivity data are fitted by different conduction models within different temperature regions. The high-temperature region resistivity data follow the Mott’s VRH model and the low-temperature region resistivity data are well fitted by the SPH model. The middle temperature region resistivity data satisfy the thermally activated semiconductor conductivity model. A strong frequency dispersion dielectric behavior was observed in the LFCO ceramics, which is interpreted by the Maxwell-Wagner relaxation model. A dielectric abnormality was observed around 260 K, which was attributed to the jumping of electrons trapped in a shallower level created by oxygen vacancies. The activation energy associated with this dielectric relaxation behavior displayed by dielectric loss between 160 K and 260 K, was determined to be 0.586 eV, which approached to the data (0.30 - 0.50 eV) reported for singly ionized . Thus, the movement of singly ionized is responsible to this dielectric relaxation behavior.
Supplementary Materials
The following supporting information can be downloaded at the website of this paper posted on Preprints.org. Part A: Determination of the theoretical MS value of the LFCO powders and their ASD content; Part B: Determination of the effective magnetic moments (μeff) and theoretical magnetic moment (μcal); Table S1: The Refined crystal structural parameters (space group, unit cell parameters, average bond lengths and bond angles), structural tolerance factor (t), reliability factors, and average crystallite size as well as the magnetic data (MS, Mr, HC, TN, irreversibility temperature Tirr, Curie-Weiss constant C and paramagnetic Curie-Weiss temperature θp, effective paramagnetic moment, μeff calculated from Curie-Weiss constant C, and theoretical magnetic moment, μcal of the hydrothermal LFCO oxides; Table S2: Species, peak positions and relative amount molar ratios obtained from the peak fittings of Fe 2p3/2, Cr 2p3/2and O 1s XPS spectra of the hydrothermal LFCO powders and the effective oxidation states of the Fe and Cr elements.
Author Contributions
K. Yi: Methodology, Synthesis, Software, Investigation, Data analyses, Writing – original draft. Z.W. Wu: Validation, Software, Visualization. Q.K. Tang: Data Analyses, Visualization. J.Y. Gu: Software, Investigation, Data Analyses. J. Ding: Formal analysis. L.D. Chen: Formal analysis. X.H. Zhu: Conceptualization, Design, Resources, Writing – review & editing, Supervision, Project administration. All authors read and approved the final manuscript.
Funding
This work is supported by the National Natural Science Foundation of China (granted Nos. 11974170) and the Postgraduate Research & Practice Innovation Program of Jiangsu Province, China (granted Nos. KYCX22_0088, KYCX22_0091, and KYCX22_0093).
Data Availability Statement
Data will be made available on request to the corresponding author.
Conflicts of Interest
The authors declare that they have no competing interests.
References
- Tokura, Y.; Kawasaki, M.; Nagaosa, N. Emergent functions of quantum materials. Nat. Phys. 13, 1056 (2017).
- Ramirez, P. Colossal Magnetoresistance. J. Phys. Condens Matter. 200, 1 (1999).
- Park, J.H.; Vescovo, E.; Kim, H.J.; Kwon, C.; Ramesh, R.; Venkatesan, T. Direct evidence for a half-metallic ferromagnet. Nature 292, 794 (1998).
- Tokura, Y. Critical features of colossal magnetoresistive manganites. Rep. Prog. Phys. 69, 797 (2006).
- Kobayashi, K.L.; Kimura, T.; Sawada, H.; Terakura, K.; Tokura, Y. Room-temperature magnetoresistance in an oxide material with an ordered double-perovskite structure. Nature 395, 677 (1998).
- Huang, Y.H.; Dass, R.I.; Xing, Z.L.; Goodenough, J.B. Double perovskites as anode materials for solid-oxide fuel cells. Science 312, 254 (2006).
- Tang, Q.K.; Zhu, X.H. Half-metallic double perovskite oxides: recent developments and future perspectives. J. Mater. Chem. C 10, 15301 (2022).
- Vasal, S.; Karppinen, M. A2BBO6 perovskites: A review. Prog. Solid State Chem. 43, 1 (2015).
- Anderson, M.T.; Greenwood, K.B.; Taylor, G.A.; Poeppelmeier, K.R. B-cation arrangements in double perovskites. Prog. Solid State Chem. 22, 197 (1993).
- Leng, K.; Tang, Q.K.; Wu, Z.W.; Yi, K.; Zhu, X.H.; Sr, D.P. Double perovskite Sr2FeReO6 oxides: structural, dielectric, magnetic, electrical, and optical properties. J. Am. Ceram. Soc. 105, 4097 (2022).
- Kato, H.; Okuda, T.; Okimoto, Y.; Tomioka, Y.; Takenoya, Y.; Ohkubo, A.; Kawasaki, M.; Tokura, Y. Metallic ordered double-perovskite Sr2CrReO6 with maximal Curie temperature of 635 K. Appl. Phys. Lett. 81, 328 (2002).
- Ksoll, P.; Meyer, C.; Schueler, L.; Roddatis, V.; Moshnyaga, V. B-Site cation ordering in films, superlattices, and layer-by-layer-grown double perovskites. Crystals 11, 734 (2021).
- Wang, Z.W.; Tang, Q.K.; Wu, Z.W.; Yi, K.; Gu, J.Y.; Zhu, X.H. B-site Fe/Re cation-ordering control and its influence on the magnetic properties of Sr2FeReO6 oxide powders. Nanomaterials 12, 3640 (2022).
- Kanamori, J. Superexchange interaction and symmetry properties of electron orbitals. J. Phys. Chem. Solids 10, 87 (1959).
- Goodenough, J.B. Theory of the role of covalence in the perovskite-type manganites [La, M(II)]MnO3. Phys. Rev. 100, 564 (1955).
- Ueda, K.; Tabata, H.; Kawai, T.; LaFeO, F.I. Ferromagnetism in LaFeO3-LaCrO3 superlattices. Science 280, 1064 (1998).
- Azad, A.K.; Mellergard, A.; Eriksson, S.G.; Ivanov, S.A.; Yunus, S.M.; Lindberg, F.; Svensson, G.; Mathieu, R. Structural and magnetic properties of LaFe0.5Cr0.5O3 studied by neutron diffraction, electron diffraction and magnetometry. Mater. Res. Bull. 40, 1633 (2005).
- Weiss, A.; Goodenough, J.B. Magnetism and the Chemical Bond, New York, 1963.
- Lee, K.W.; Ahn, K.H. Evaluation of half-metallic antiferromagnetism in A2CrFeO6 (A = La, Sr). Phys. Rev. B 85, 224404 (2012).
- Chakraverty, S.; Ohtomo, A.; Okuyama, D.; Saito, M.; Okude, M.; Kumai, R.; Arima, T.; Tokura, Y.; Tsukimoto, S.; Ikuhara, Y.; Kawasaki, M. Ferrimagnetism and spontaneous ordering of transition metals in double perovskite La2CrFeO6 films. Phys. Rev. B 84, 064436 (2011).
- Pickett, W.E. Spin-density-functional-based search for half-metallic antiferromagnets. Phy Rev. B 57, 10613 (1998).
- Belayachi, A.; Nogues, M.; Dormann, J.L.; Taibi, M. Magnetic properties of LaFe1-xCrxO3 perovskites. Eur. J. Solid State Inorg. Chem. 33, 1039 (1996).
- Coutinho, P.V.; Barrozo, P. Influence of the heat treatment on magnetization reversal of orthorhombic perovskites LaFe0.5Cr0.5O3. Appl. Phys. A 124, 668 (2018).
- Sun, M.; Xuan, Y.; Liu, G.Y.; Liu, Y.L.; Zhang, F.; Ren, J.F.; Chen, M.N. Anomalous magnetic behaviors of double perovskite R2CrFeO6 (R = rare earth elements) predicted by first-principles calculations. J. Magn. Magn. Mater. 504, 166670 (2020).
- Zhu, Y.Y.; Dong, S.; Zhang, Q.F.; Yunoki, S.; Wang, Y.G.; Liu, J.M. Tailoring magnetic orders in (LaFeO3)n–(LaCrO3)n superlattices model. J. Appl. Phys. 110, 053916 (2011).
- Larson, A.C.; Von Dreele, R.B. General structure analysis system (GSAS). Los Alamos National Laboratory Report LAUR, 2004, 86–748.
- Boudad, L.; Taibi, M.; Belayachi, A.; Abd-lefdil, M. Elaboration; characterization, and giant dielectric permittivity in solid state synthesized Fe half-doped LaCrO3 perovskite. Mater. Today: Proc. 58, 1108 (2022).
- Bindu, G.H.; Kammara, V.; Prilekha, S.; Swetha, K.; Laxmi, Y.K.; Veerasomaiah, P.; Vithal, M. Preparation, characterization and photocatalytic studies of LaAl0.5Fe0.5O3, LaAl0.5Cr0.5O3 and LaCr0.5Fe0.5O3. J. Mol. Struct. 1273, 134220 (2023).
- Lufaso, M.; Woodward, P. Prediction of the crystal structures of perovskites using the software program SPuDS. Acta Crystallogr. B 57, 725 (2002).
- Coey, J.M.D.; Viret, M.; von Molnár, S. Mixed-Valence Manganite. Adv. Phys. 48, 167 (1999).
- Klug, H.P.; Aleksander, L.E. X-ray Diffraction Procedures for Polycrystalline and Amorphous Materials, Willey, New York, 1974.
- Lakshmi, R.; Bera, P.; Hiremath, M.; Dubey, V.; Kundu, A.K.; Barshilia, H.C. Structural; magnetic, and dielectric properties of solution combustion synthesized LaFeO3, LaFe0.9Mn0.1O3, and LaMnO3 perovskites. Phys. Chem. Chem. Phys. 24, 5462 (2022).
- Kumar, R.; Singh, K.D.; Kumar, R. Effect of Sr substitution on structural properties of LaCrO3 perovskite. J. Mater. Sci.: Mater. Electron. 33, 12039 (2022).
- Zarrin, N.; Husain, S.; Khan, W.; Manzoor, S. Sol-gel derived cobalt doped LaCrO3: structure and physical properties. J. Alloy Compd. 784, 541 (2019).
- Lam, D.J.; Veal, B.W.; Ellis, D.E. Electronic structure of lanthanum perovskites with 3d transition elements. Phys. Rev. B 22, 5730 (1980).
- Moulder, J.F.; Stickle, W.F.; Sobol, P.E.; Bomben, K.D. In Handbook of X-Ray Photoelectron Spectroscopy: A Reference Book of Standard Spectra for Identification and Interpretation of XPS Data, ed. By J. Chastain (Physical Electronics Division, Perkin-Elmer Corporation, Minnesota, 1992), p. 140.
- Coutinho, P.V.; Moreno, N.O.; Ochoa, E.A.; da Costa, M.E.H.M.; Barrozo, P. Magnetization reversal in orthorhombic Sr-doped LaFe0.5Cr0.5O3-δ. J. Phys.: Condens. Matter. 30, 235804 (2018).
- Rida, K.; Benabbas, A.; Bouremmad, F.; Peña, M.A.; Sastre, E.; Martínez-Arias, A. Magnetization reversal in orthorhombic Sr-doped LaFe0.5Cr0.5O3-δ. Appl. Catal. A: General. 327, 173 (2007).
- Zhang, B.; Zhao, Q.; Chang, A.; Li, Y.; Liu, Y.; Wu, Y. Electrical conductivity anomaly and X-ray photoelectron spectroscopy investigation of YCr1-xMnxO3 negative temperature coefficient ceramics. Appl. Phys. Lett. 104, 102109 (2014).
- He, H.; Lin, X.; Li, S.; Wu, Z.; Gao, J.; Wu, J.; Wen, W.; Ye, D.; Fu, M. The key surface species and oxygen vacancies in MnOx(0.4)-CeO2 toward repeated soot oxidation. Appl. Catal. B Environ. 223, 134 (2018).
- Ji, D.X.; Fan, L.; Tao, L.; Sun, Y.J.; Li, M.G.; Yang, G.R.; Tran, T.Q.; Ramakrishna, S.; Guo, S.J. The Kirkendall effect for engineering oxygen vacancy of hollow Co3O4 nanoparticles toward high performance portable zinc-air batteries. Angew. Chem. Int. Ed. 131, 13978 (2019).
- Doi, Y.; Hinatsu, Y. Crystal structures and magnetic properties of ordered perovskites Sr2LnRuO6 (Ln = Eu-Lu). J. Phys. Condens. Matter. 11, 4813 (1999).
- Cullity, B.D.; Graham, C.D. Introduction to Magnetic Materials, 2nd edn. (IEEE Press, New Jersey, 2009), pp. 325-326.
- Hu, W.W.; Chen, Y.; Yuan, H.M.; Zhang, G.H.; Li, G.H.; Pang, G.S.; Feng, S.H. Hydrothermal synthesis, characterization and composition-dependent magnetic properties of LaFe1-xCrxO3 system (0≤x≤1). J. Solid State Chem. 183, 1582 (2010).
- Ateia, E.E.; Gawad, D.; Mosry, M.; Arman, M.M. Synthesis and functional properties of La2FeCrO6 based nanostructures. J. Inorg Organomet. Polym. Mater. 33, 2698–2709 (2023).
- Ederer, C.; Spaldin, N.A. Weak ferromagnetism and magnetoelectric coupling in bismuth ferrite. Phys. Rev. B 71, 060401 (2005).
- Mao, Y.B.; Parsons, J.; McCloy, J.S. Magnetic properties of double perovskite La2BMnO6 (B = Ni or Co) nanoparticles. Nanoscale 5, 4720 (2013).
- Griffiths, R.B. Nonanalytic behavior above the critical point in a random Ising ferromagnet. Phys. Rev. Lett. 23, 17 (1969).
- Bray, A.J. Nature of the Griffiths phase. Phys. Rev. Lett. 59, 586 (1987).
- Neto, A.H.C.; Castilla, G.; Jones, B.A. Non-fermi liquid behavior and Griffiths phase in f-electron compounds. Phys. Rev. Lett. 81, 3531(1998).
- Boudad, L.; Taibi, M.; Belayachi, W.; Sajieddine, M.; Abd-Lefdi, M. High temperature dielectric investigation, optical and conduction properties of GdFe0.5Cr0.5O3 perovskite. J. Appl. Phys. 127, 174103 (2020).
- Castro-Couceiro, A.; Yáñez-Vilar, S.; Sánchez-Andújar, M.; Rivas-Murias, B.; Rivas, J.; Señarís-Rodríguez, M.A. Maxwell-Wagner relaxation in the CaMn7O12 perovskite. Prog. Solid State Chem. 35, 379 (2007).
- Guiffard, B.; Boucher, E.; Eyraud, L.; Lebrun, L.; Guyomar, D. Influence of donor co-doping by niobium or fluorine on the conductivity of Mn doped and Mg doped PZT ceramics. J. Eur. Ceram. Soc. 25, 2487 (2005).
- Pei, Z.P.; Leng, K.; Xia, W.R.; Lu, Y.; Wu, H.; Zhu, X.H. Structural characterization; dielectric; magnetic, and optical properties of double perovskite Bi2FeMnO6 ceramics. J. Magn. Magn. Mater. 508, 166891 (2020).
- Huang, X.X.; Tang, X.G.; Xiong, X.M.; Jiang, Y.P.; Liu, Q.X.; Zhang, T.F. The dielectric anomaly and pyroelectric properties of sol-gel derived (Pb,Cd,La)TiO3 ceramics. J. Mater. Sci.: Mater. Electron. 26, 3174 (2015).
- Viret, M.; Ranno, L.; Coey, J. Colossal magnetoresistance of the variable range hopping regime in the manganites. J. Appl. Phys. 81, 4964 (1997).
- Qadir, I.; Sharma, S.; Manhas, U.; Atri, A.K.; Singh, S.; Singh, D. A new Ruddlesden-Popper oxide LaSr3Mn1.5Fe1.5O9.71 as photocatalyst for degrading highly toxic dyes in waste water: Structural, magnetic and transport properties. J. Solid State Chem. 2317, 123675 (2023).
- Emin, D.; Holstein, T. Studies of small-polaron motion IV. Adiabatic theory of the Hall effect. Ann. Phys. 53, 439 (1969).
- Kobayashi, K.I.; Kimura, T.; Tomioka, Y.; Sawada, H.; Terakura, K.; Tokura, Y. Intergrain tunneling magnetoresistance in polycrystals of the ordered double perovskite Sr2FeReO6. Phys. Rev. B 59, 11159 (1999).
Figure 1.
Room temperature XRD pattern of the LFCO powders and its Rietveld refined profile. The cross marks represent the experimental data, red solid line denotes the Rietveld refined profile. Vertical sticks mark the positions.
Figure 1.
Room temperature XRD pattern of the LFCO powders and its Rietveld refined profile. The cross marks represent the experimental data, red solid line denotes the Rietveld refined profile. Vertical sticks mark the positions.
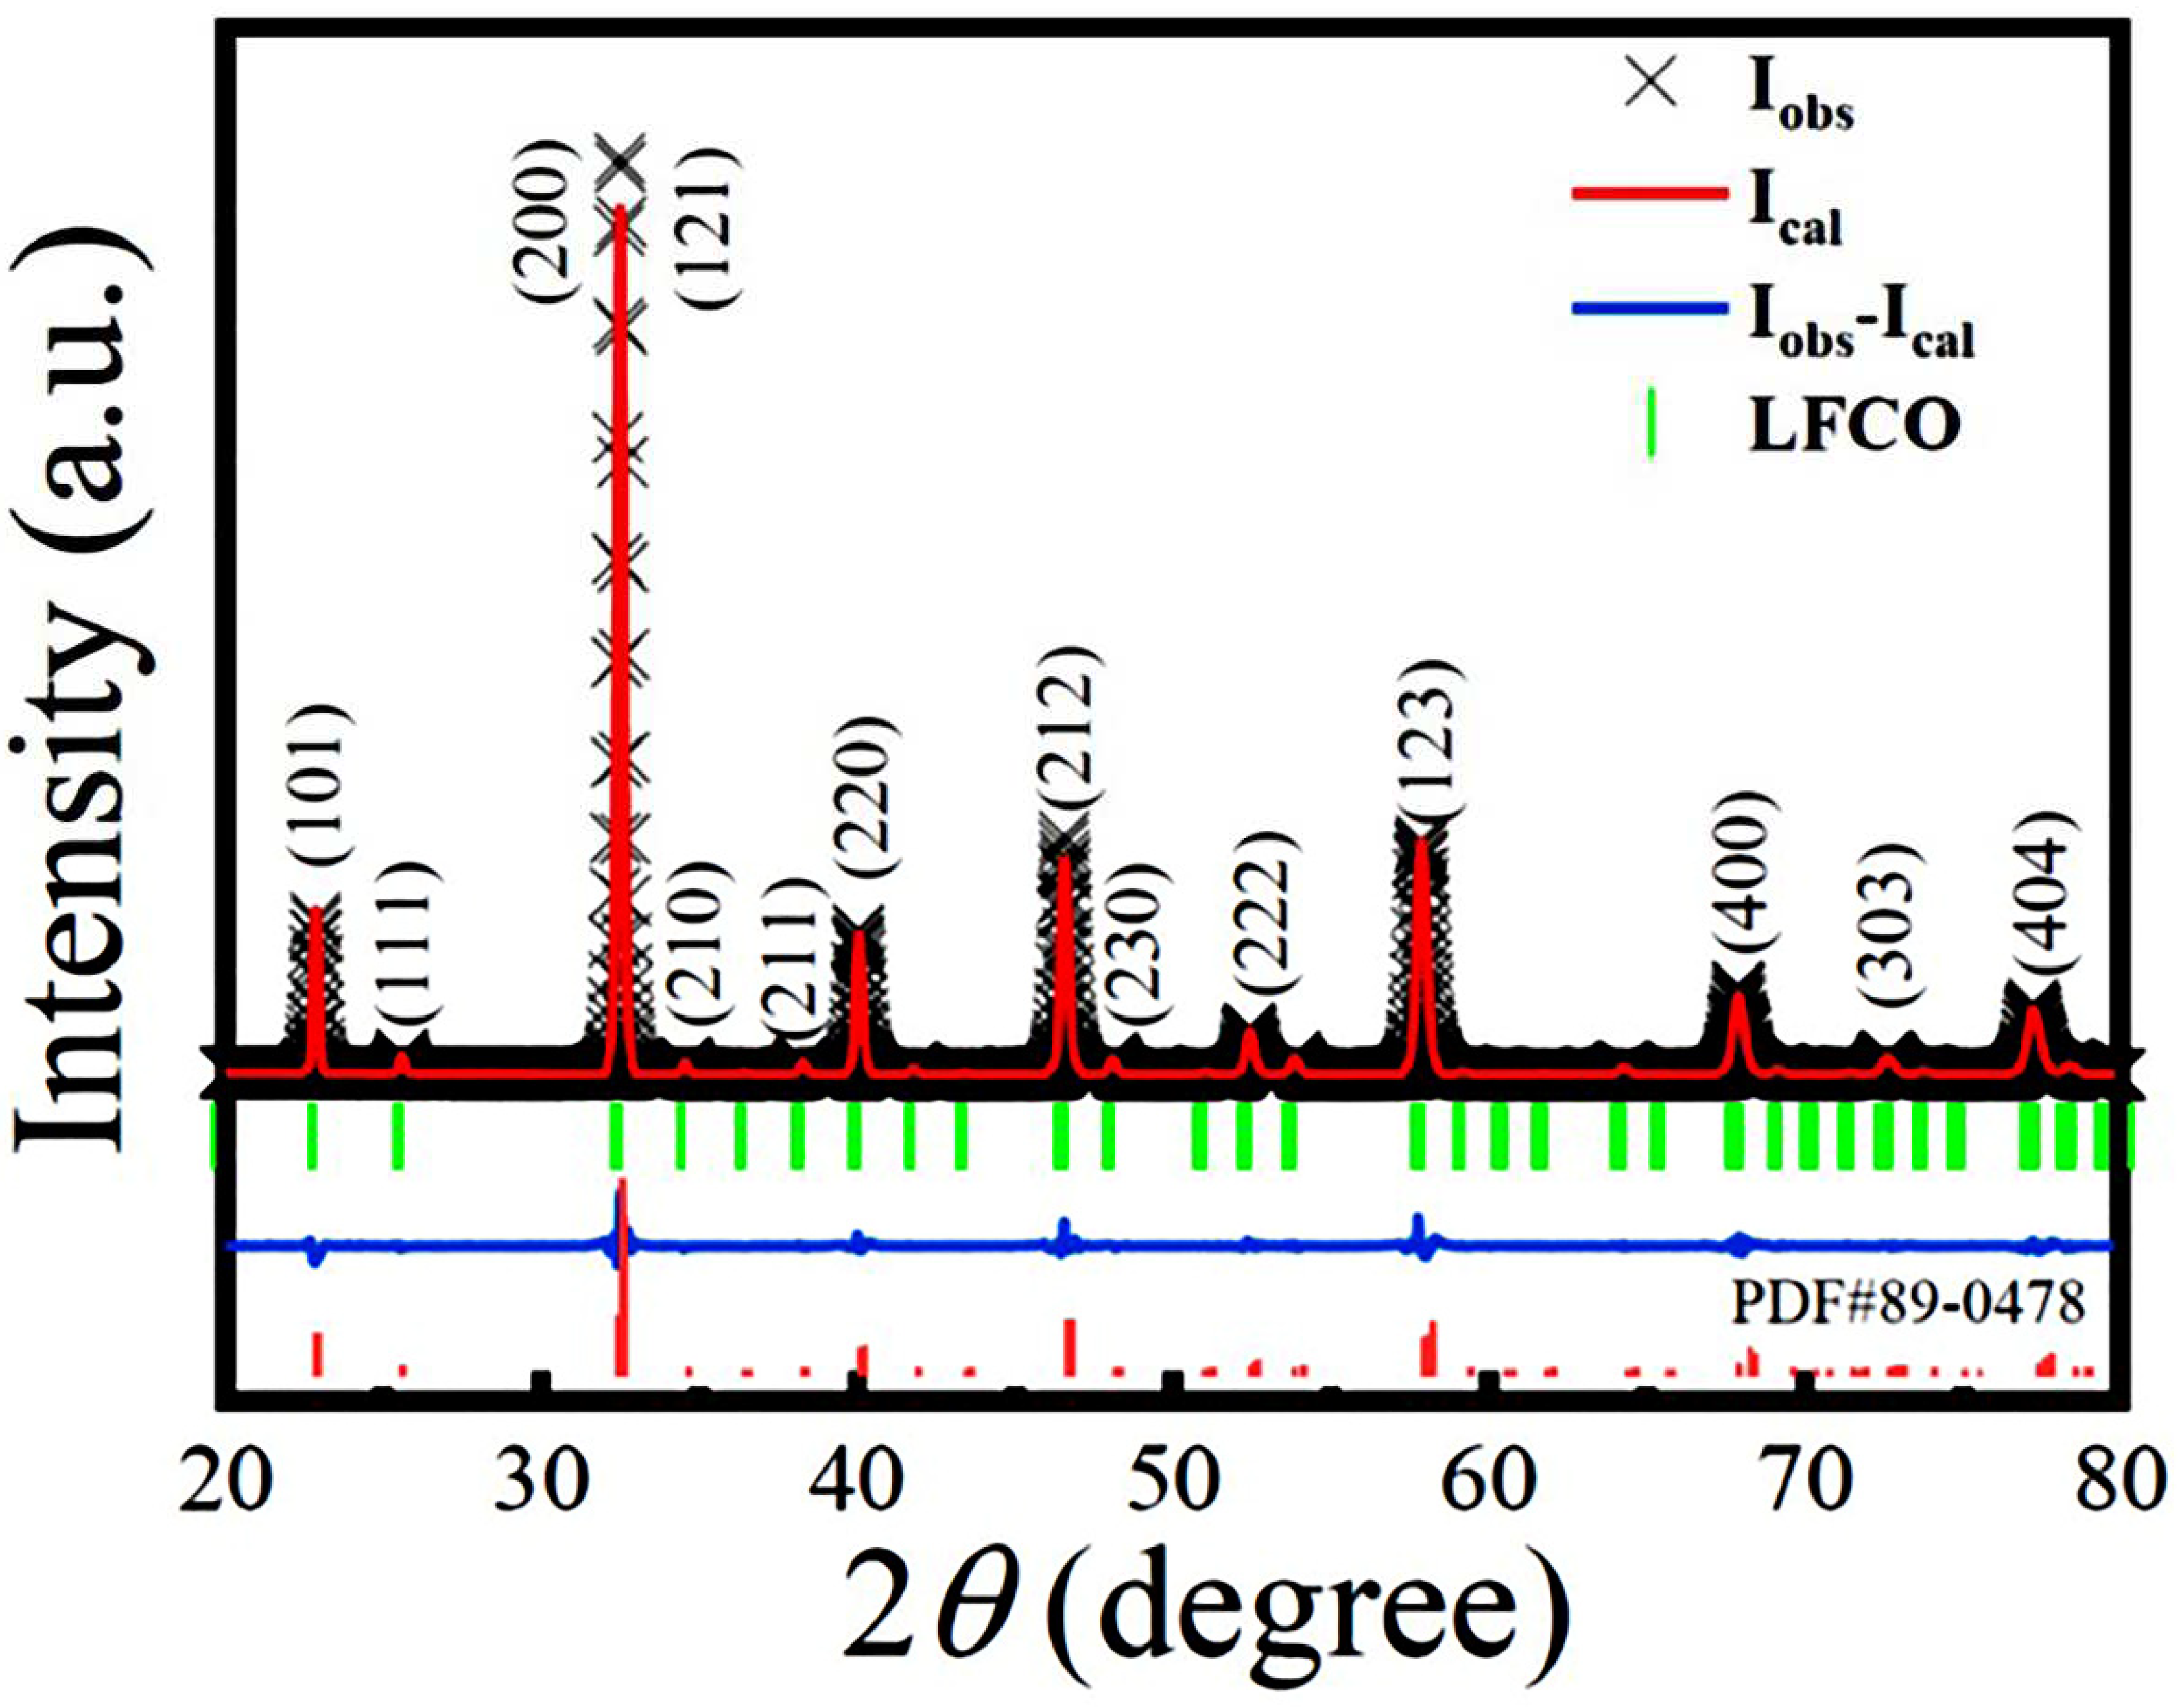
Figure 2.
(a) SEM image of the LFCO powders in a low-magnification. Inset is an enlarged SEM image. (b) Corresponding histogram of the particle size distribution of the powders. (c) EDS spectrum collected from the LFCO powders in a mapping mode.
Figure 2.
(a) SEM image of the LFCO powders in a low-magnification. Inset is an enlarged SEM image. (b) Corresponding histogram of the particle size distribution of the powders. (c) EDS spectrum collected from the LFCO powders in a mapping mode.
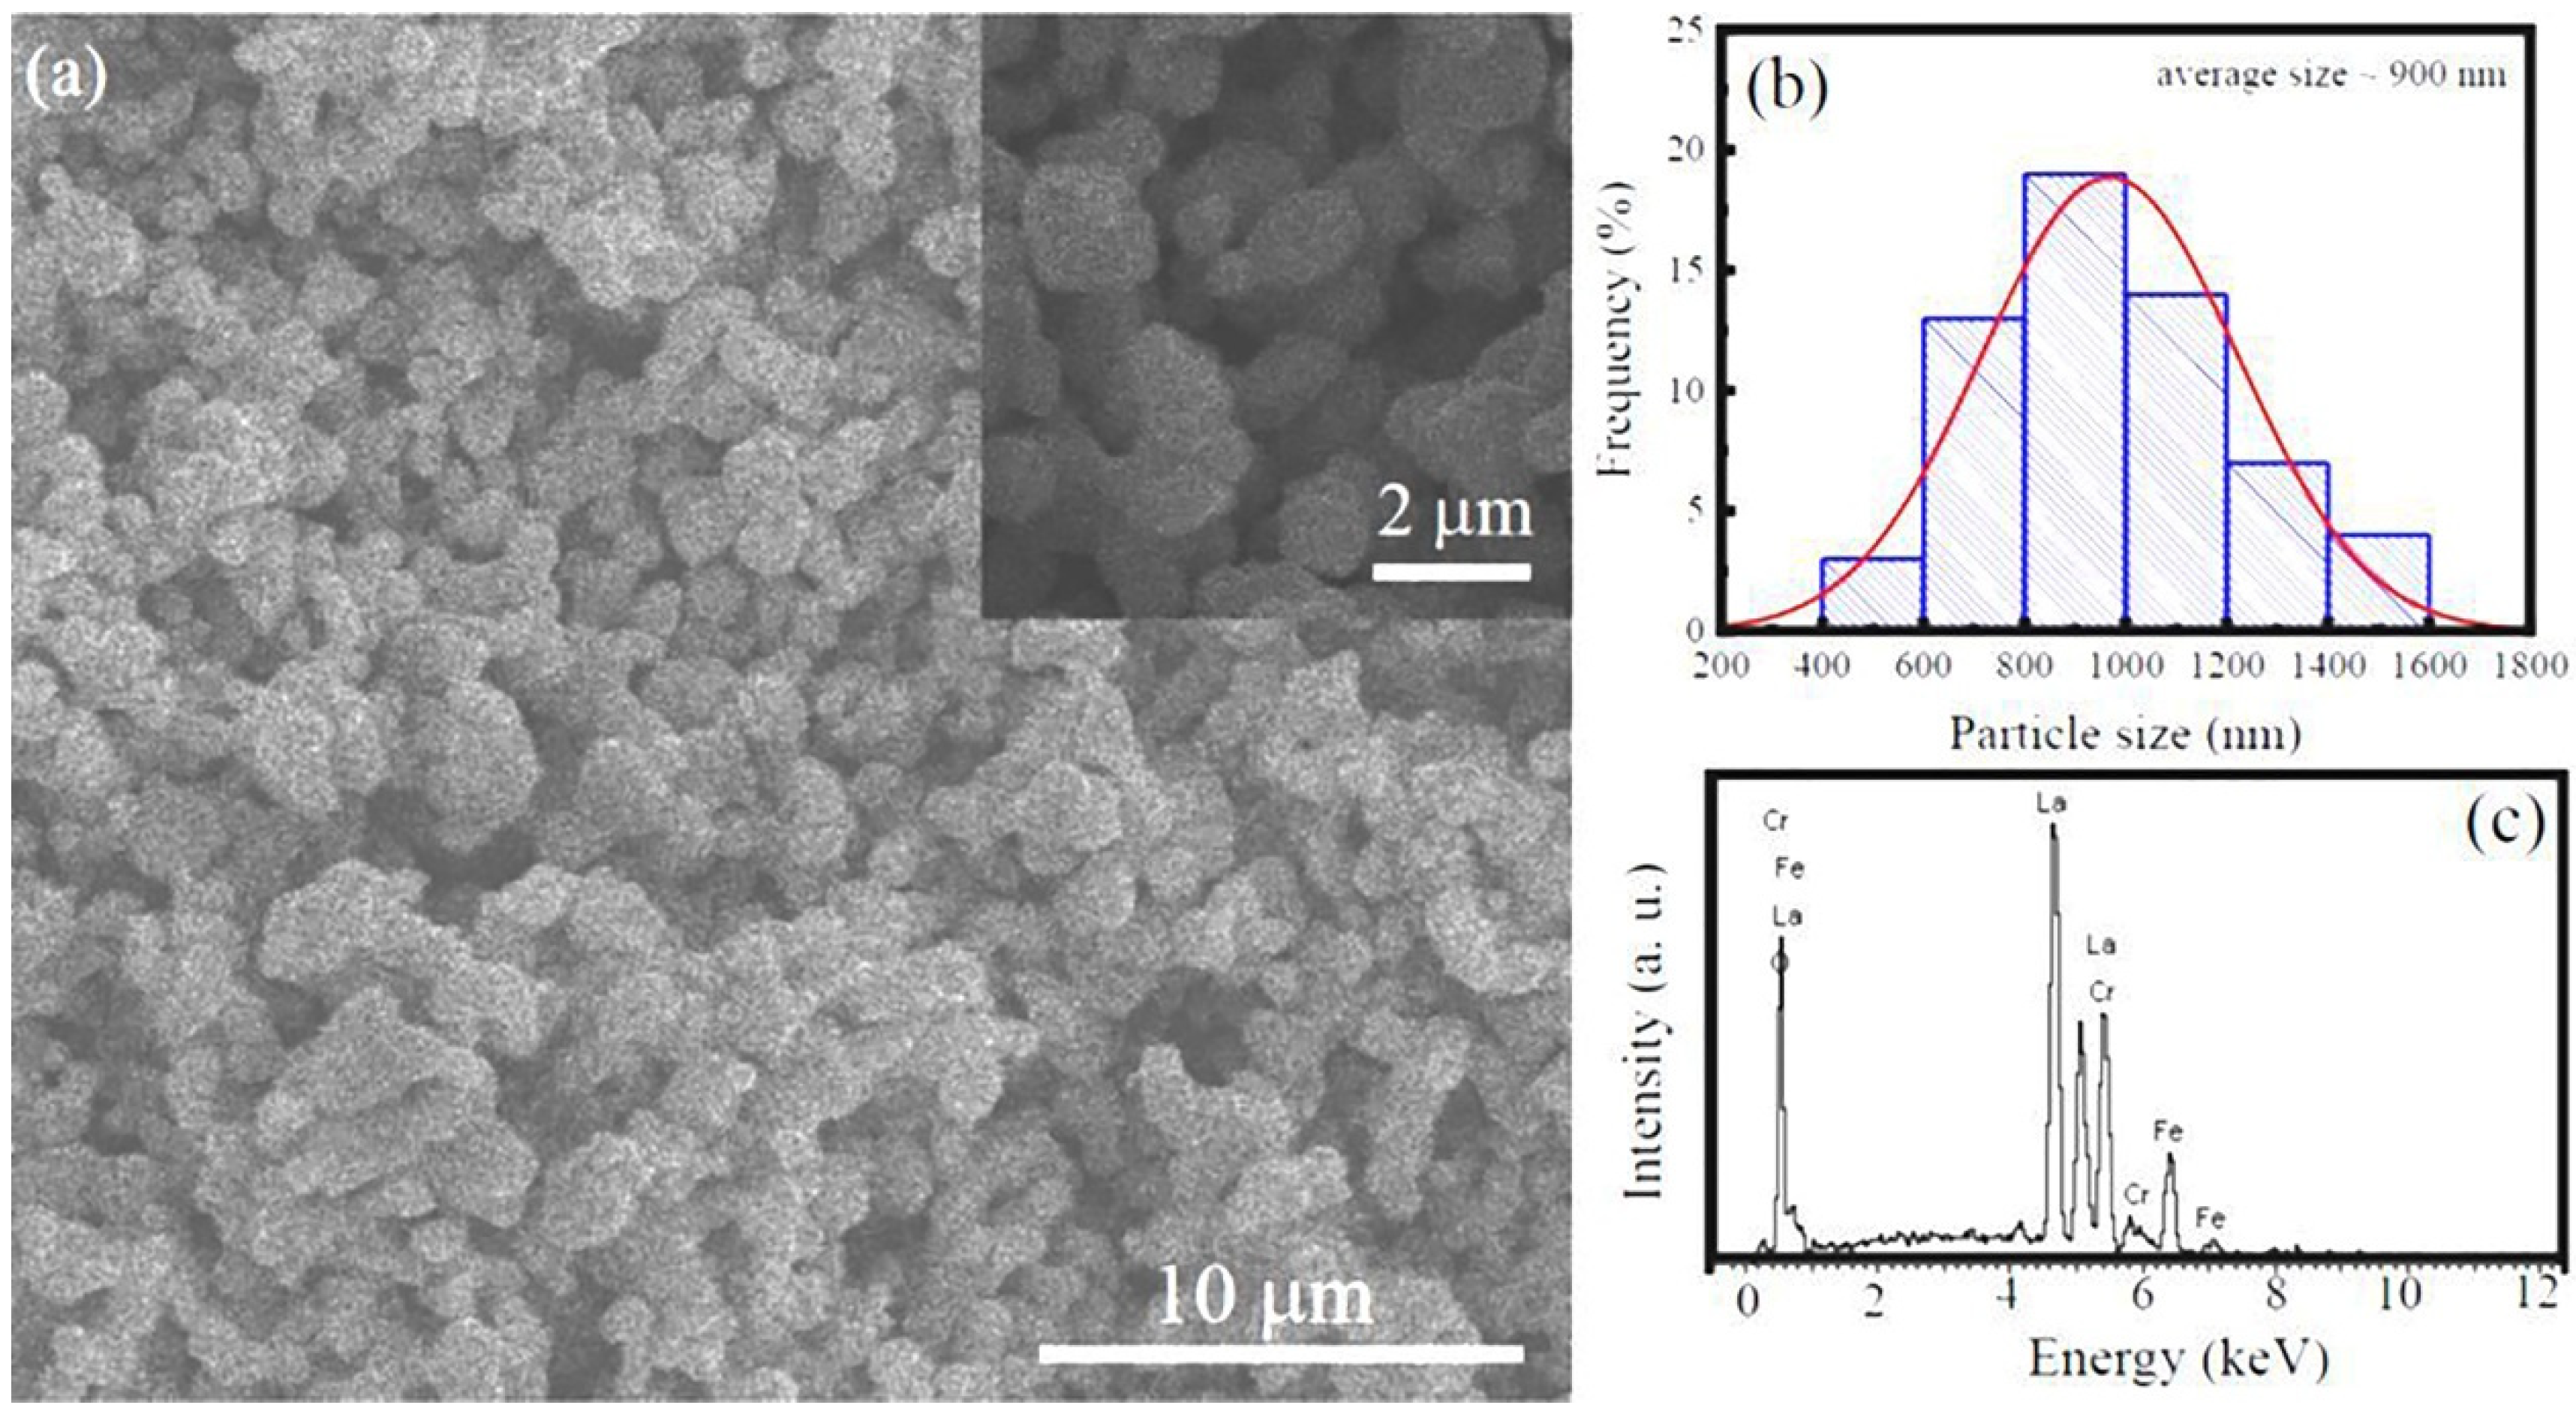
Figure 3.
FTIR spectrum of the LFCO powders.
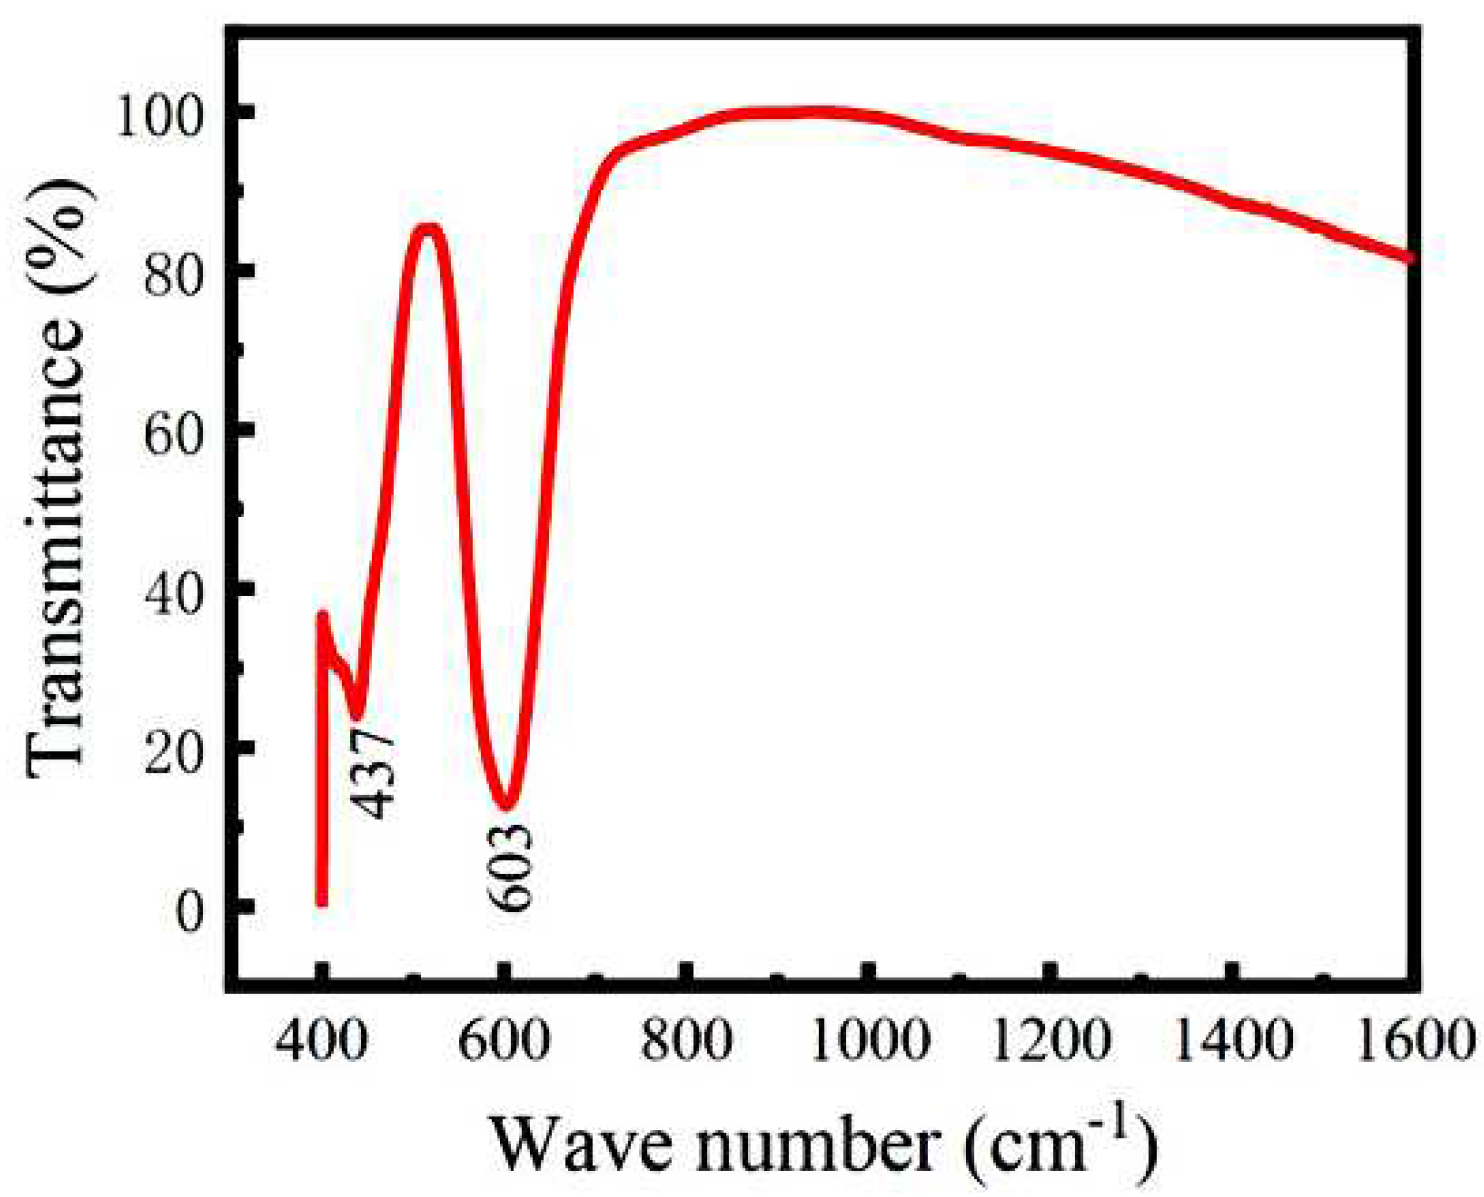
Figure 4.
XPS spectra of (a) survey scan, and (b)-(e) high-resolution scan of La 3d, Fe 2p3/2, Cr 2p3/2, and O 1s for the LFCO powders.
Figure 4.
XPS spectra of (a) survey scan, and (b)-(e) high-resolution scan of La 3d, Fe 2p3/2, Cr 2p3/2, and O 1s for the LFCO powders.
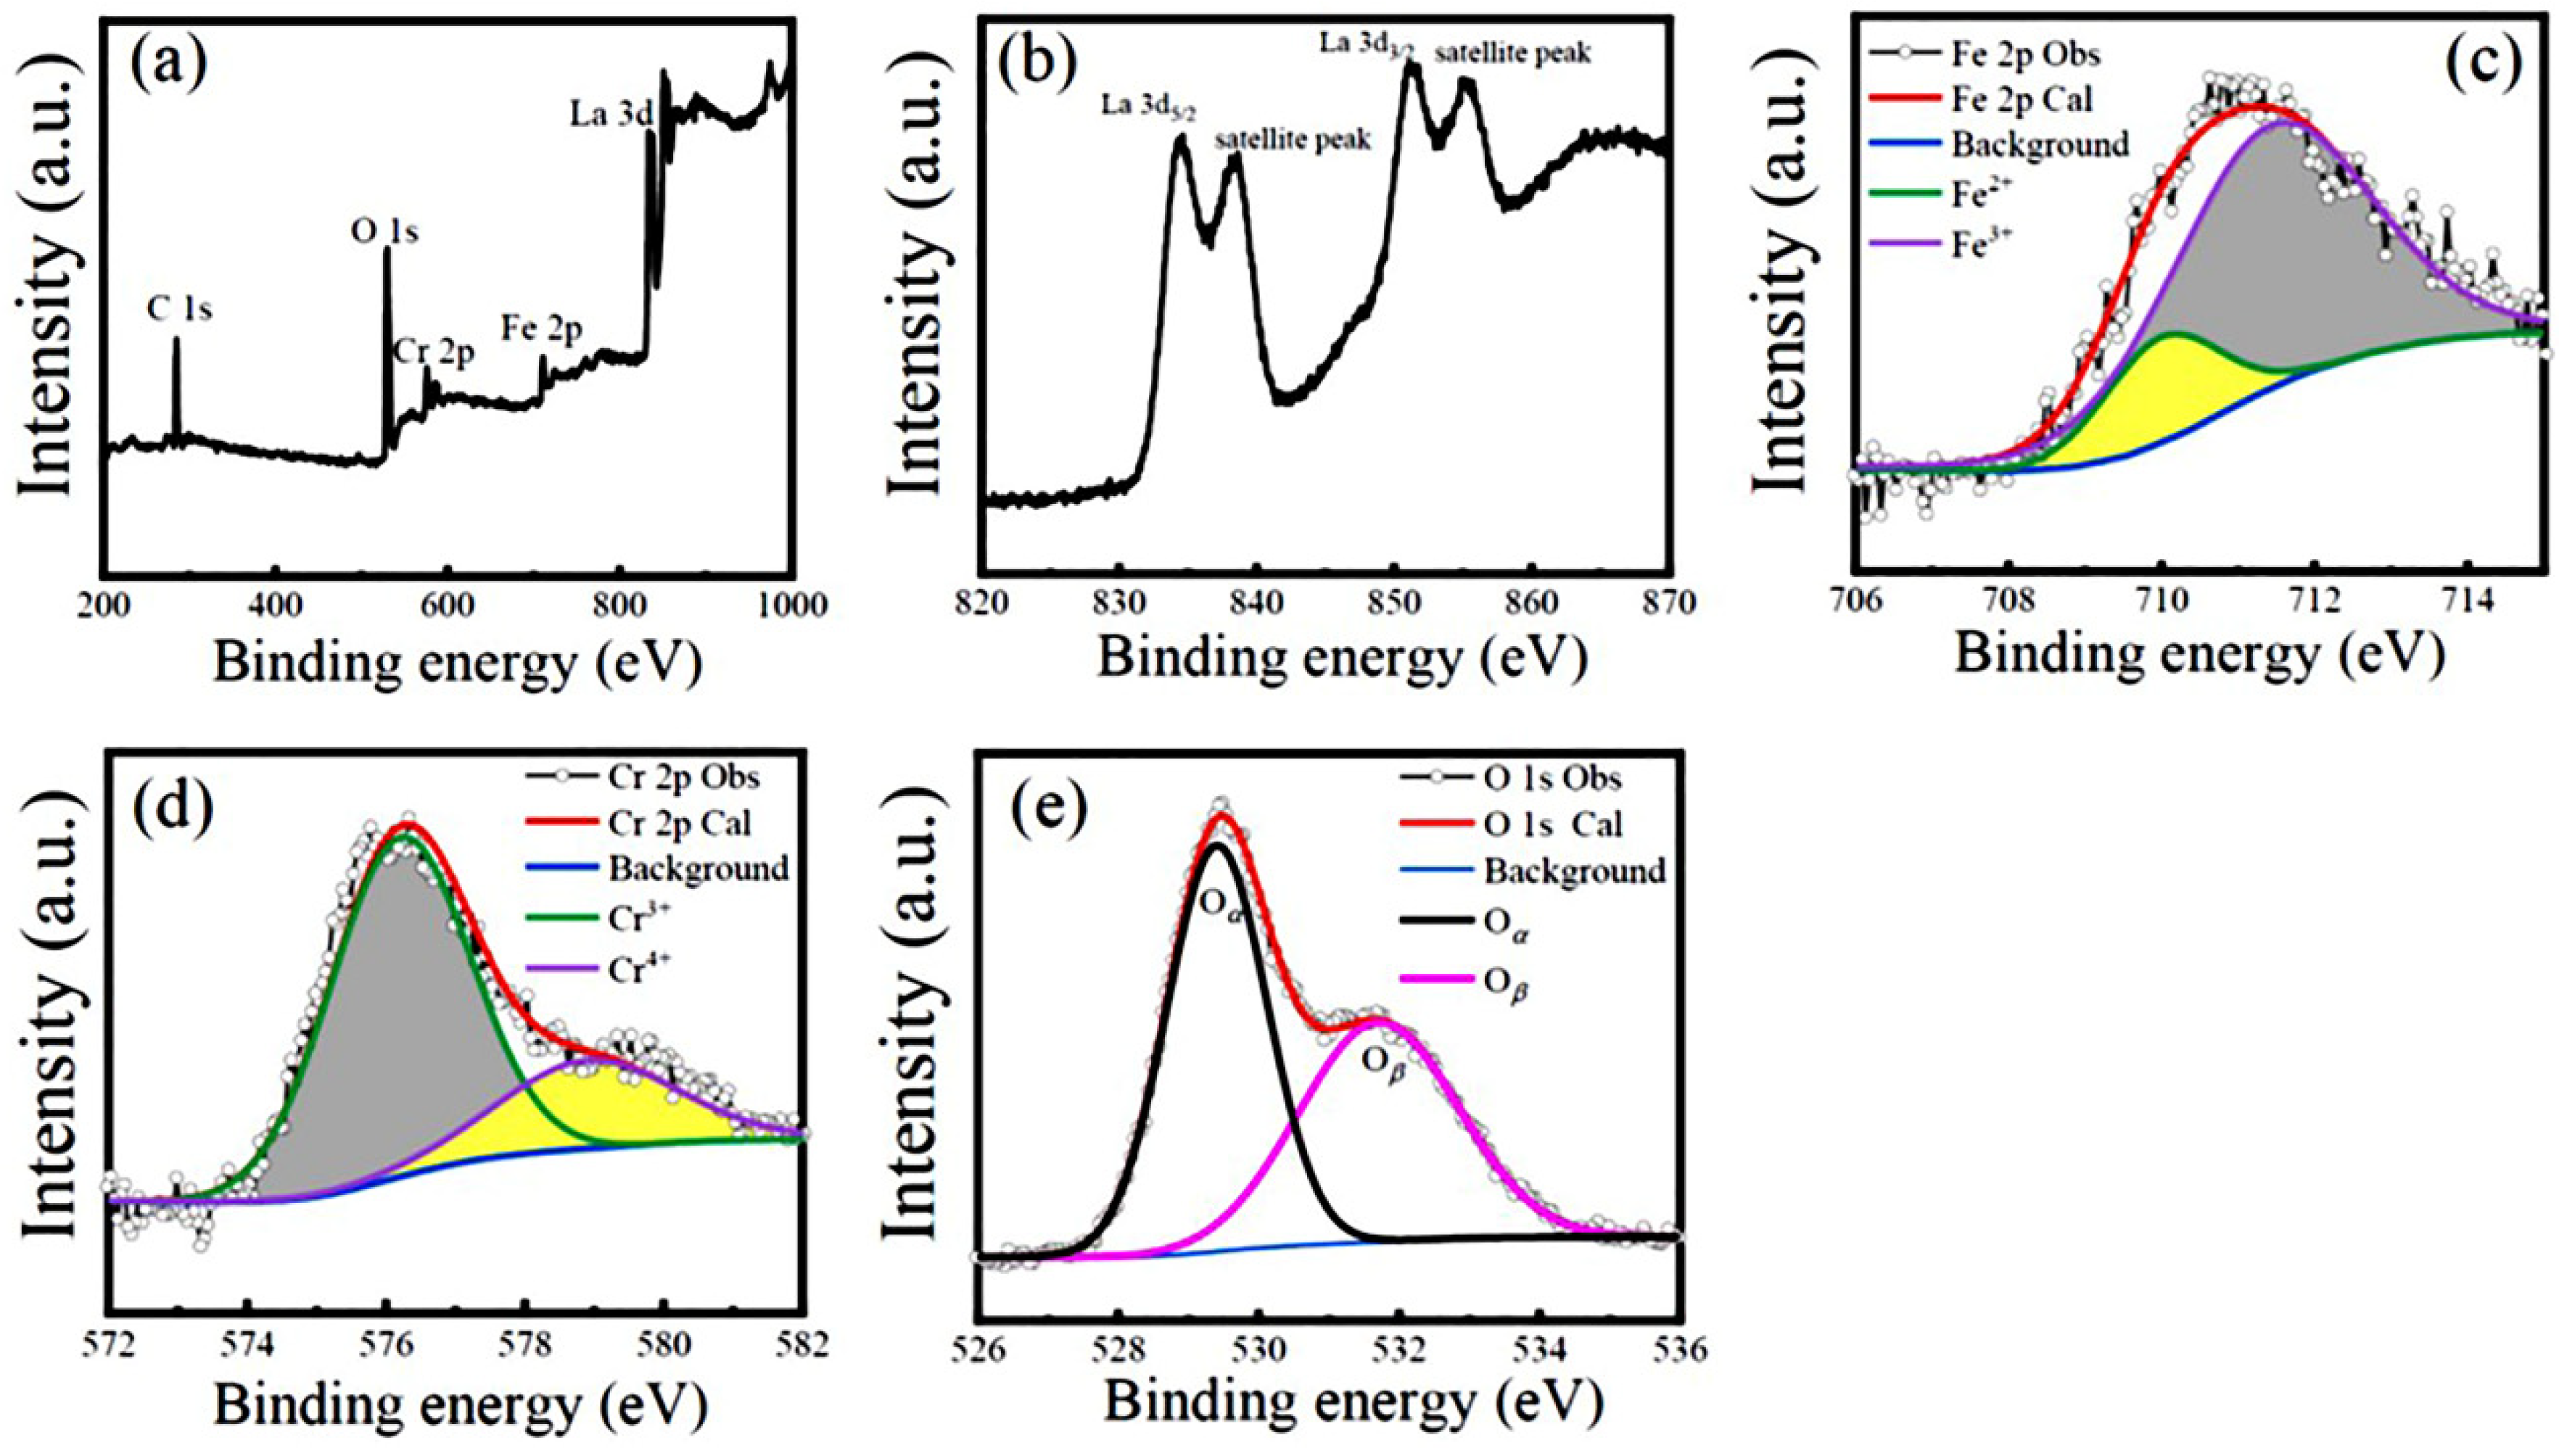
Figure 5.
(a) M-H hysteresis loops measured at 5 K and 300 K for the LFCO powders, respectively. Inset is local M-H hysteresis loop of the powders at 5 K. (b) Plot of M(H) versus 1/
Figure 5.
(a) M-H hysteresis loops measured at 5 K and 300 K for the LFCO powders, respectively. Inset is local M-H hysteresis loop of the powders at 5 K. (b) Plot of M(H) versus 1/
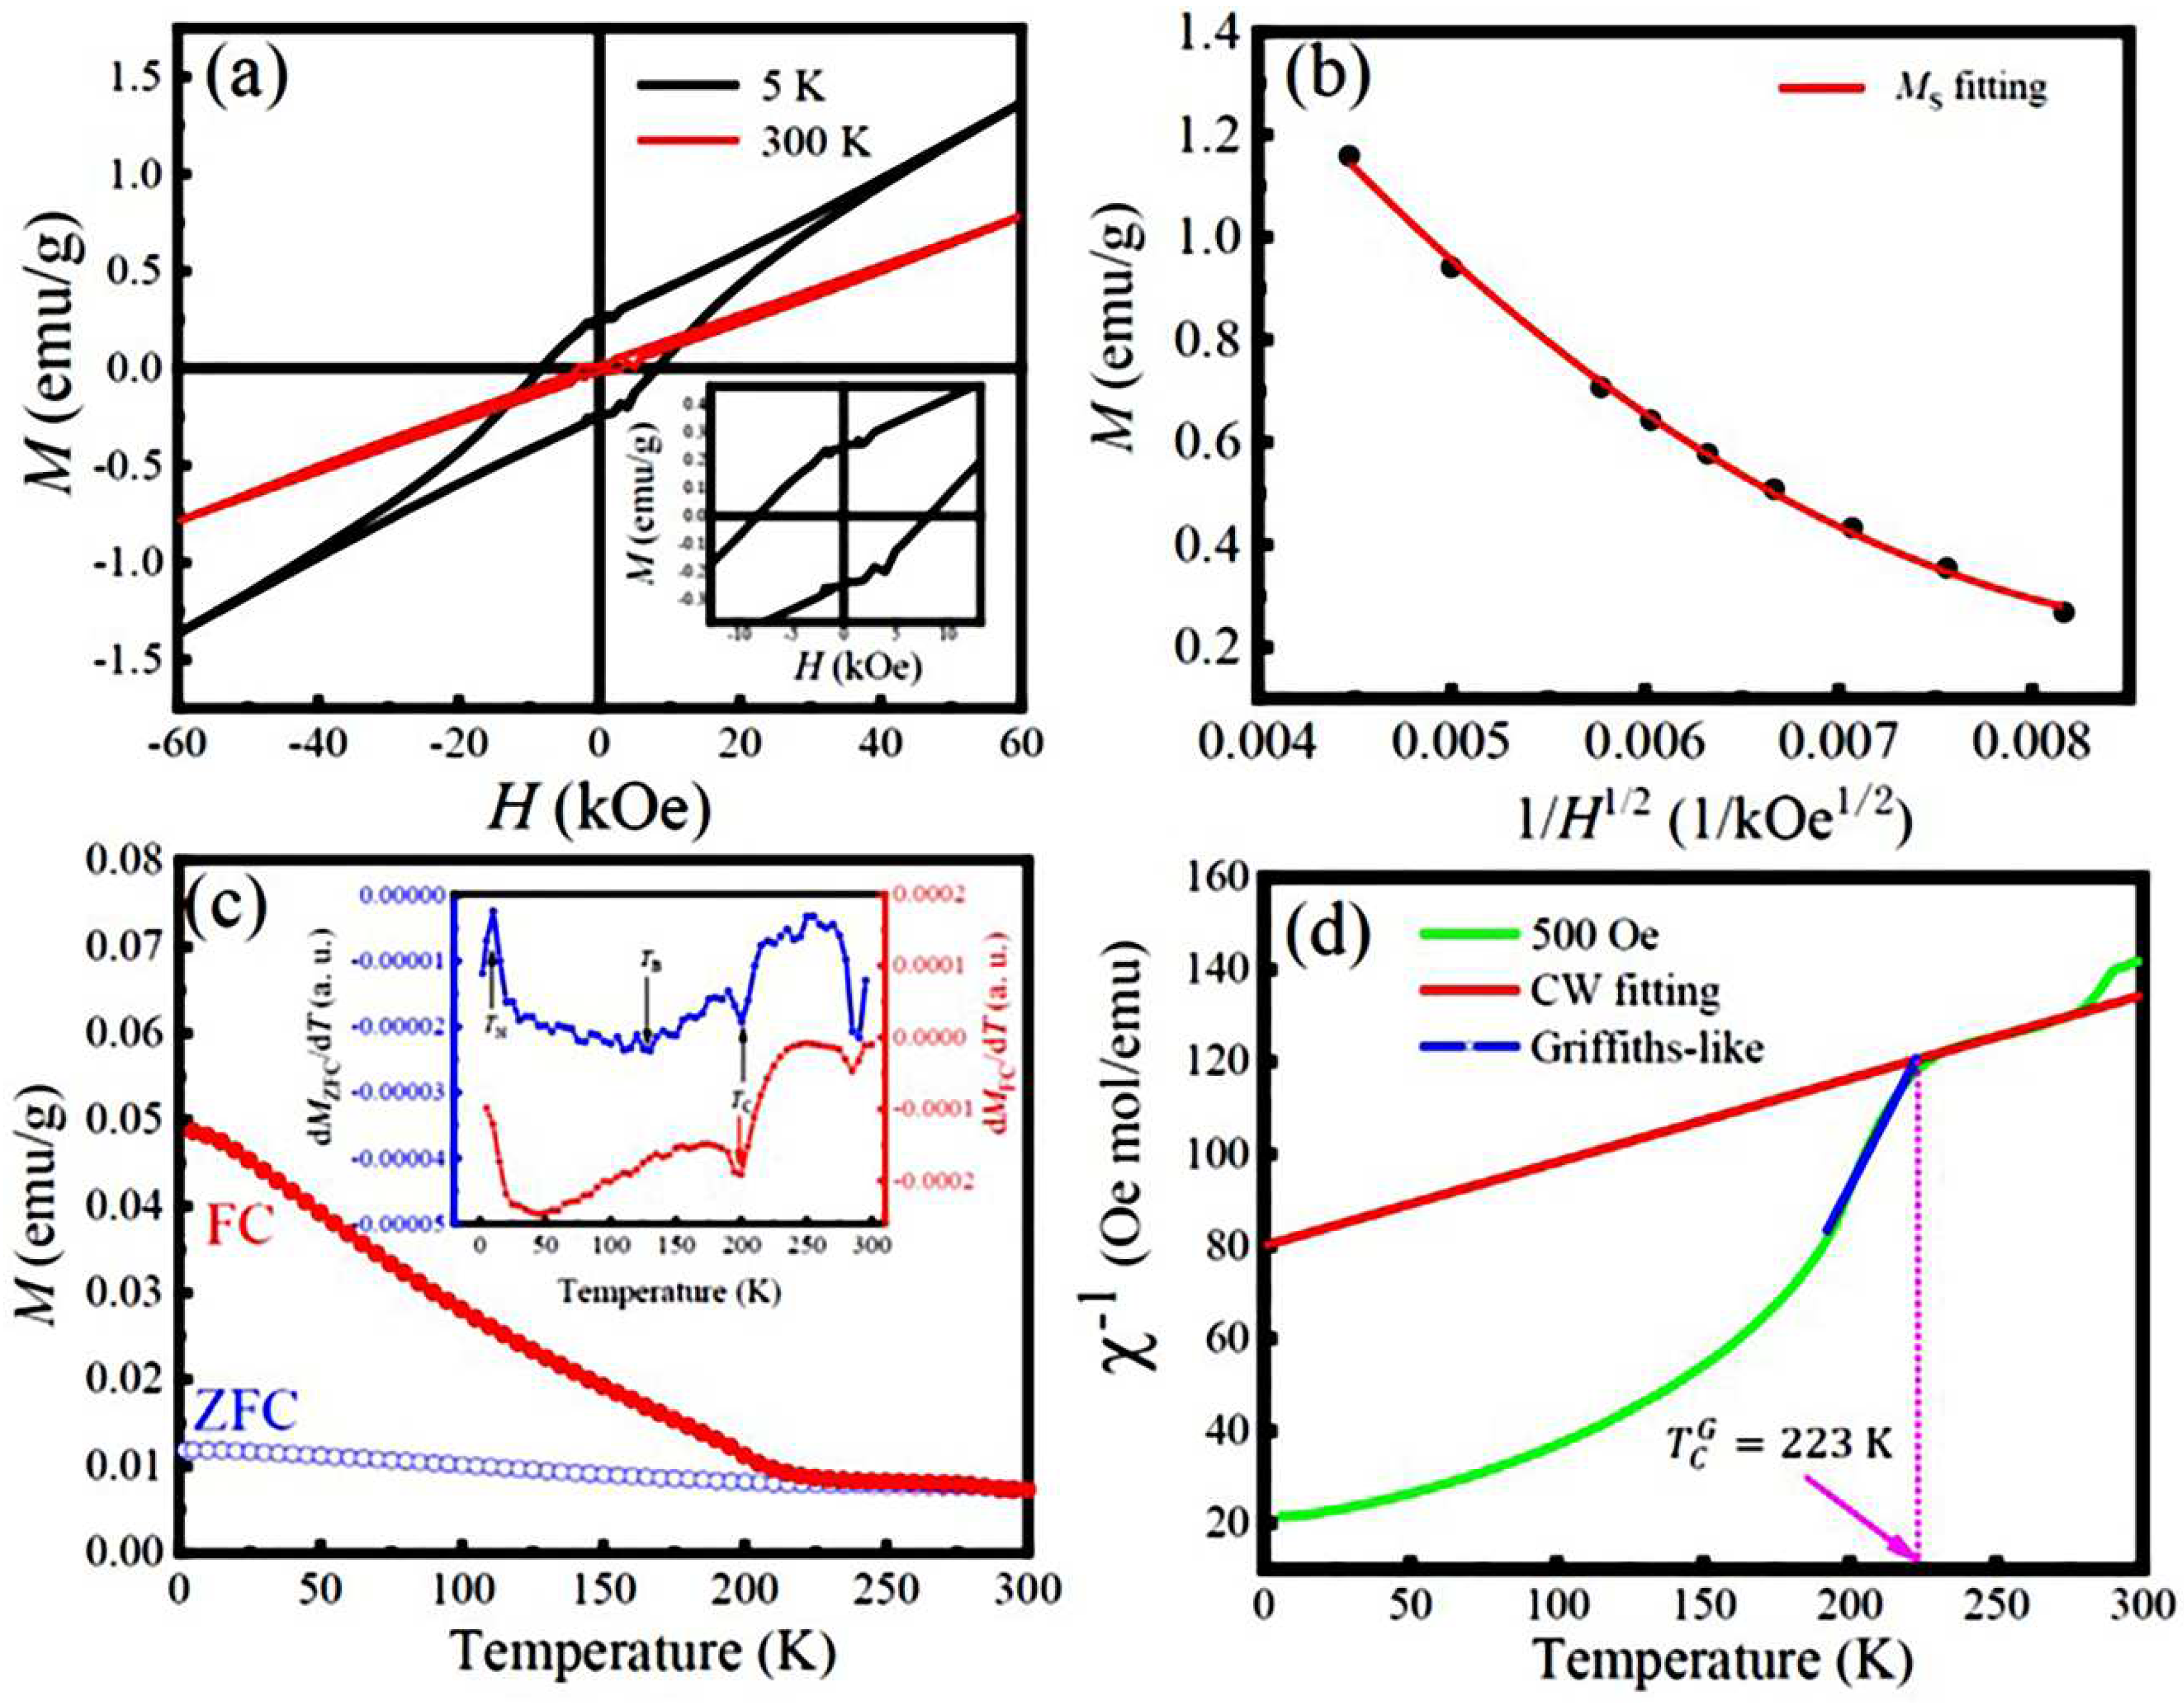
Figure 6.
(a) Frequency dependent dielectric constant (εr) and dielectric loss (tanδ) of the LFCO ceramics measured at room temperature. (b)-(c) Temperature dependent the εr and tanδ of the LFCO ceramics measured a series of frequencies. The arrows in Figs. (b)-(c) indicate the increasing direction of the frequency. Inset in Figure (c) is the plot tanδ−T curves in the temperature range of 180-280 K. (d) Plot of Lnω vs 1000/T for the LFCO ceramics at low temperature region.
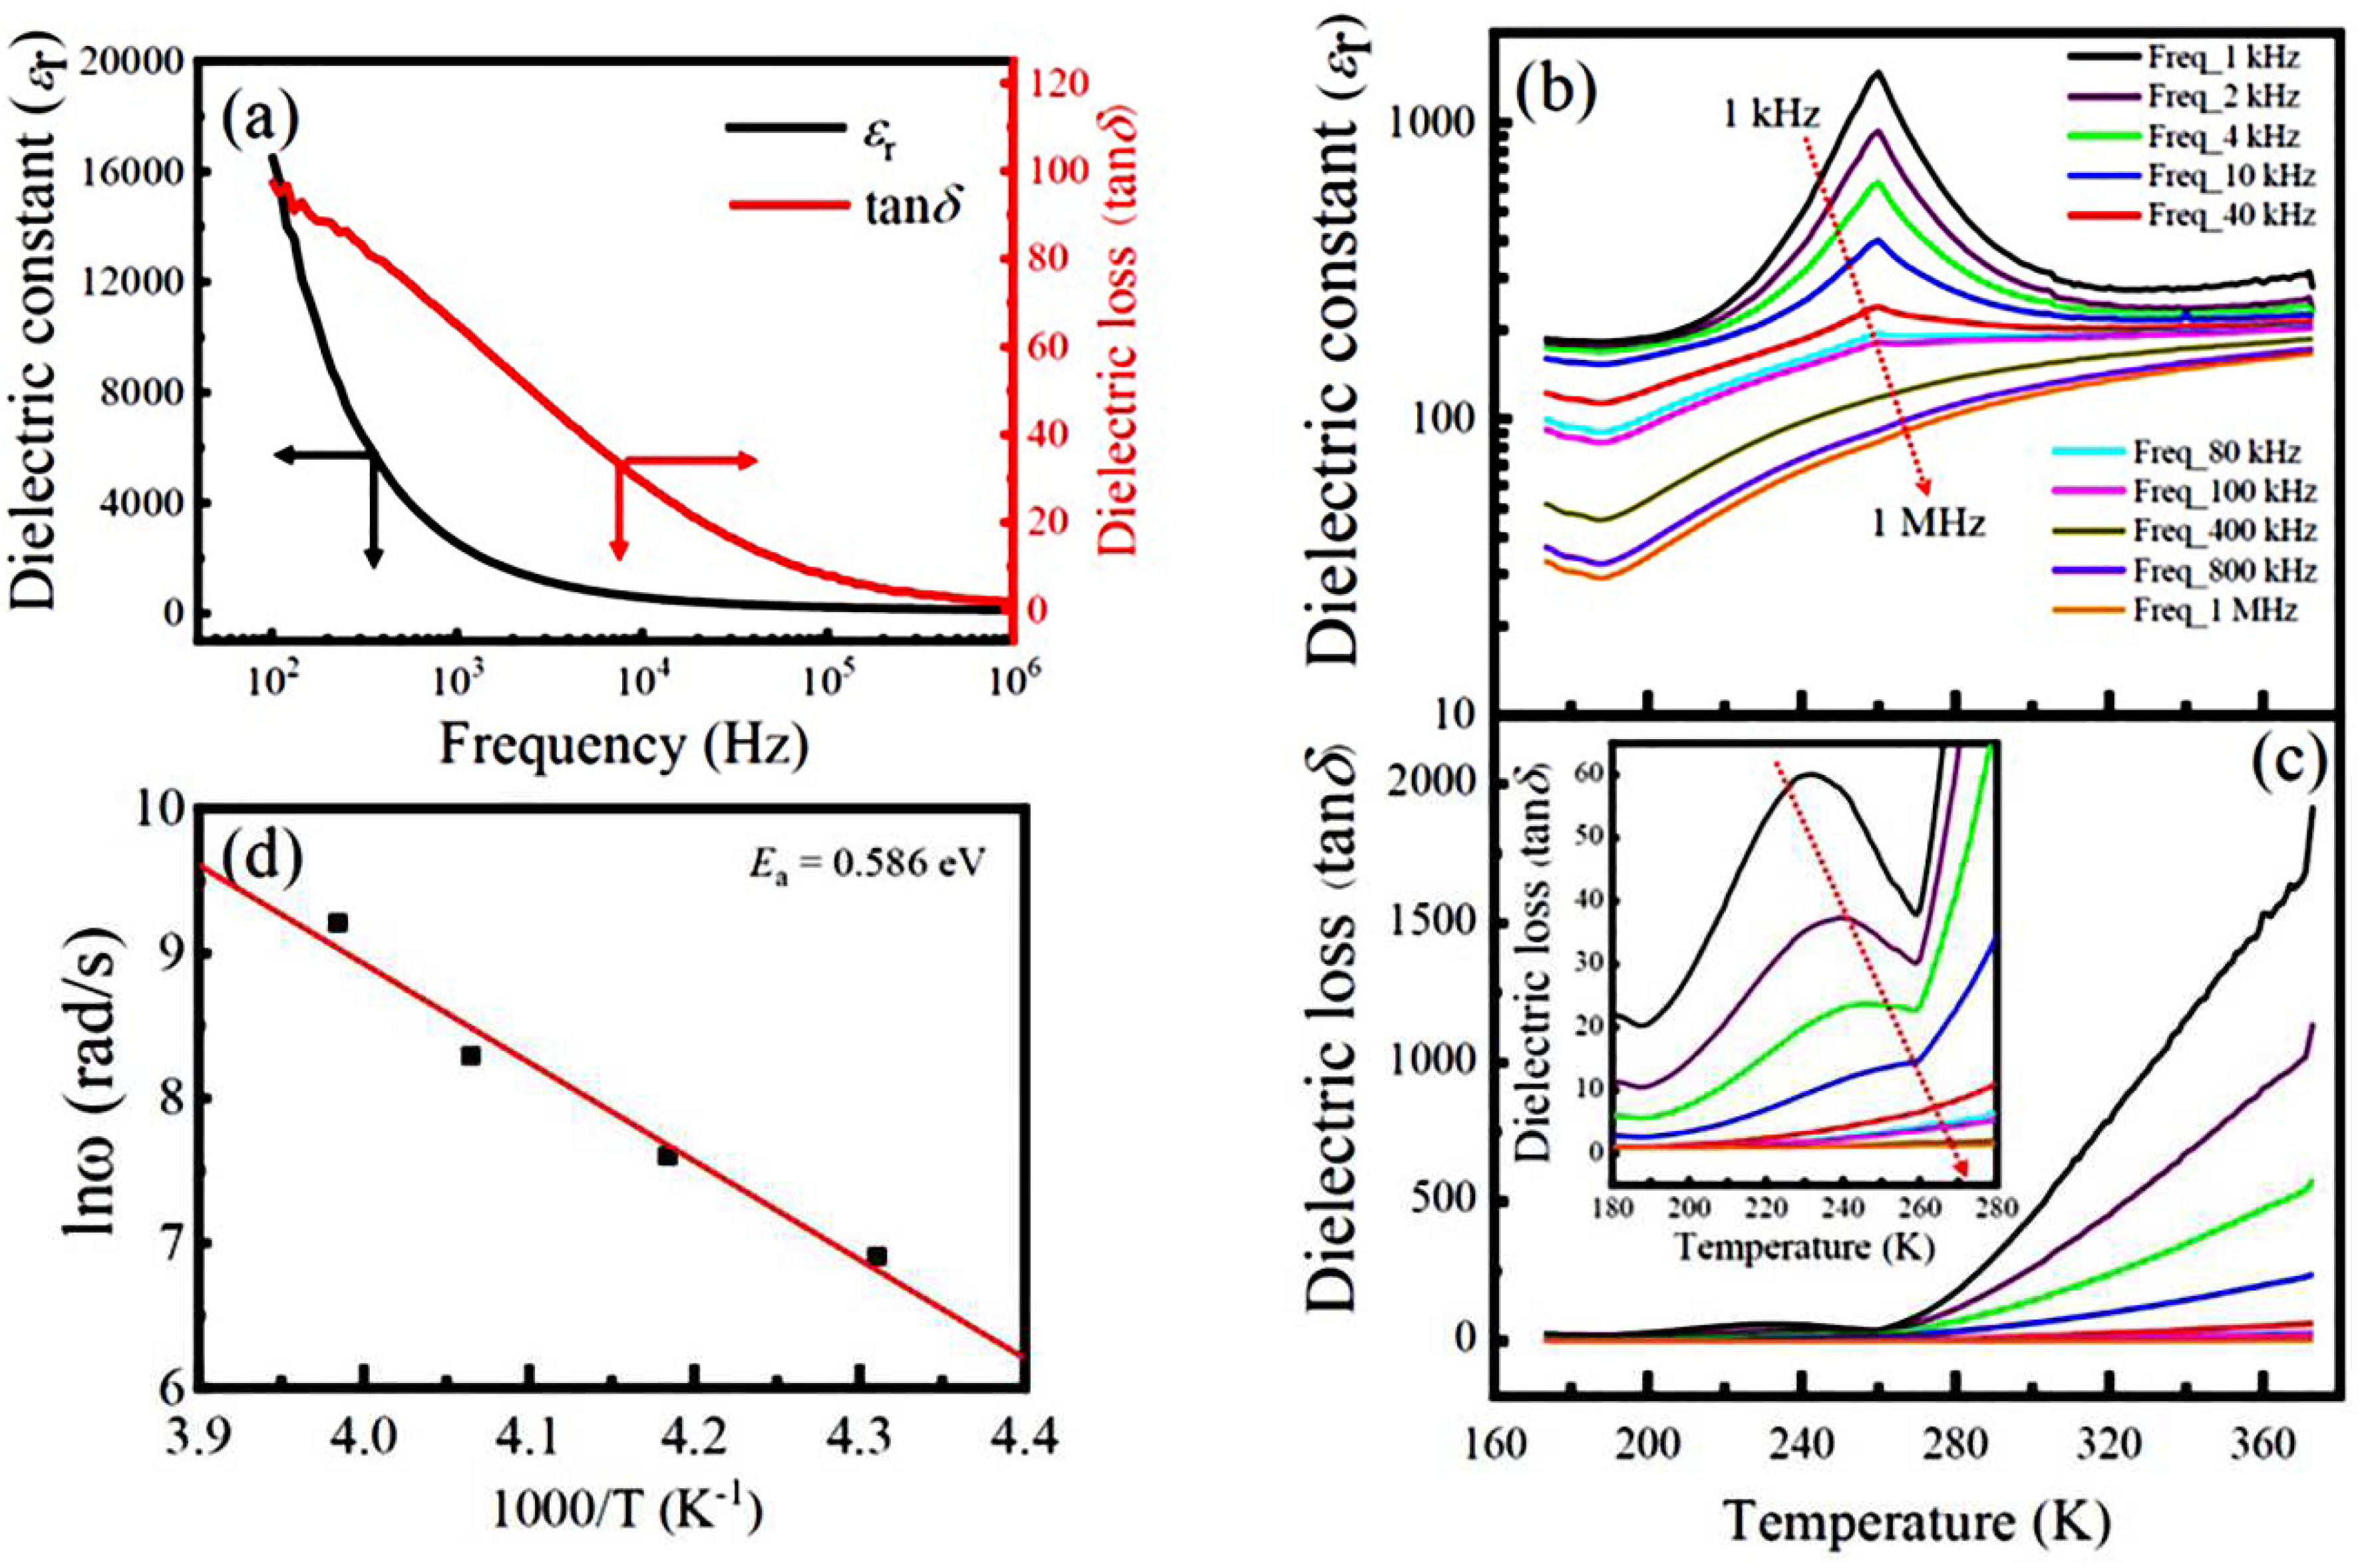
Figure 7.
(a) Temperature dependence of the resistivity ρ(T) for the LFCO ceramics measured from 2 K to 800 K without applying magnetic field and the plot of dρ/dT as a function of the temperature. (b) Plot of ln(ρ) as a function of (1000/T)1/4 in the temperature range of 350−683 K, exhibits a linear fitting. (c) Plot of ln(ρ) as a function of 1000/T in the temperature range of 275−350 K, displays a linear fitting in this temperature range, giving out the Ea value of 11.43 meV. (d) Plot of ln(ρ/T) as a function of 1000/T in the temperature range of 15−77 K, displaying two linear fitting regions I (30−77 K) and II (15−30 K) with Ea values of 4.85 meV and 2.20 meV, respectively. The solid lines represent the linear fittings to the experimental data. (e)-(f) MR-H plots of the LFCO ceramics measured at 5 K and 300 K, respectively.
Disclaimer/Publisher’s Note: The statements, opinions and data contained in all publications are solely those of the individual author(s) and contributor(s) and not of MDPI and/or the editor(s). MDPI and/or the editor(s) disclaim responsibility for any injury to people or property resulting from any ideas, methods, instructions or products referred to in the content. |
© 2023 by the authors. Licensee MDPI, Basel, Switzerland. This article is an open access article distributed under the terms and conditions of the Creative Commons Attribution (CC BY) license (http://creativecommons.org/licenses/by/4.0/).
Copyright: This open access article is published under a Creative Commons CC BY 4.0 license, which permit the free download, distribution, and reuse, provided that the author and preprint are cited in any reuse.


