
Submitted:
22 November 2023
Posted:
22 November 2023
You are already at the latest version
Abstract
Pretilachlor is a chloroacetamide herbicide, mainly used for the control of weeds and broadleaf weeds in rice, and widely used in China. For the detection of residues of pretilachlor in the en-vironment and food, a highly sensitive and specific monoclonal antibody against pretilachlor was prepared, and the half maximum inhibitory concentration (IC50) of the monoclonal antibody was validated to be 31.47±2.35 μg/L. An indirect competitive ELISA (ic-ELISA) based on the antibody with a linear range of 6.25~100 μg/L was developed for the detection of pretilachlor residues in the environment and food crops. The specificity of the antibody was explained by computer simula-tions and experimental validation. No cross-reactivity of this monoclonal antibody to alachlor, acetochlor and metalaxyl, and it cross-reacted less than 3.0% to both butachlor and propisochlor. The limits of detection (LOD) for pretilachlor in lake, rice, and soil samples were 4.83~5.23 μg/L. The recoveries of all samples were 78.3%~91.3%. The ic-ELISA method was validated by high-performance liquid chromatography, thus, it can be used for residue detection of pretilachlor in the environment and grains.
Keywords:
residue detection
; pretilachlor
; monoclonal antibody
; ic-ELISA
1. Introduction
In recent years, chloroacetamide herbicides have developed rapidly, with annual production, application range, and area of use second only to organophosphorus herbicides[1,2]. Pretilachlor (PR) is a highly effective, low-toxicity, broad-spectrum, post-sowing, pre-seedling selective chloroacetamide herbicide with high water solubility and ease of penetration, which makes it able to kill weeds in large numbers and improve crop yields and is widely used in transplanting rice fields and mainly used for weed control in rice[3]. But its overuse has potential problems, such as increased weed resistance and contamination of the surrounding environment, in addition, its enrichment in the food chain ultimately harms human beings[4,5]. PR was listed as a compound that may cause cancer in humans, the toxic effects include the emergence of neurotoxicity, genotoxicity, and carcinogenicity[6]. In addition, PR has shown toxic effects on fish[2,7,8,9,10], and algae[11,12]. To control its contamination of the environment and food, clear residue limits for pretilachlor have been established in various countries. In China, the maximum residue limit (MRL) for rice is 0.1 mg/kg, and for wheat 0.05 mg/kg[13].
The main methods for residue analysis of PR in domestic and overseas are gas chromatography and liquid chromatography, the detection limits were 0.01~10 μg/L[14,15] and 0.2~20 μg/L[16], respectively. Despite these instrument detection methods having the advantages of high sensitivity and accuracy, they suffer from the disadvantages of complicated operation, long time consumption, high detection cost, high use of organic solvents, and high requirements for instruments and operators. Immunoassay techniques are characterized by high sensitivity, high selectivity, and simplicity and are widely used in small molecule compound residue detection, and the antibody is the core recognition element of immunoassay, which determines the specificity and sensitivity of the method. Currently, there are few studies on immunoassays for PR, and no commercially available enzyme-linked immunosorbent assay (ELISA) kits. In the existing reports, only Liu et al. obtained specific polyclonal antibodies against PR by immunizing New Zealand White rabbits[17]; The polyclonal antibodies recognized multiple antigenic epitopes[18], which made them susceptible to interference and poorly reproducible. The accuracy and reproducibility of monoclonal antibodies have led to their use in a wide range of medical and testing applications[19]. Therefore, the development of monoclonal antibodies specific to anti-pretilachlor is essential.
The specificity of an antibody determines how widely it can be used in practice. Highly specific monoclonal antibodies are the basis for avoiding false-positive test results[20]. Chloroacetamide herbicide analogs have extremely similar chemical antistructures, which may result in a high cross-reactivity rate of monoclonal antibodies against chloroacetamide drugs, so finding and adequately exposing drug-specific sites is important in hapten design. This study aims at the shortcomings of the existing rapid PR detection technology, 3-mercaptopropionic acid was used as a linker arm that coupled PR to bovine serum albumin for the preparation of a more sensitive and specific monoclonal antibody to PR. Based on this antibody, an ELISA method for the detection of PR residues in lake water, soil, and rice. At the same time, computer simulation to explain and experimentally validate the specific antigenic recognition sites of chloroacetamides and proposed a scheme to enhance the sensitivity of the anti-pretilachlor monoclonal antibody, which will be used to provide a reference for the preparation of a highly sensitive and specific monoclonal antibody.
2. Materials and Methods
2.1. Chemicals and Materials
Alachlor and 3-mercaptopropionic acid were purchased from Macklin (Shanghai, China). Pretilachlor, propisochlor, acetochlor, metalaxyl were provided from Tmrm (Beijing, China) and butachlor were purchased from Aladdin (Shanghai, China). PEG1450, Freund’s complete adjuvant (FCA), hypoxanthine-aminopterin-thymidine (HAT), Freund’s incomplete adjuvant (FIA), Ovalbumin (OVA), Bovine serum albumin (BSA), Peroxidase labeled goat anti-mouse immunoglobulin (HRP-IgG), and 1-Ethyl-3(3-dimethylaminopropyl) Carbodiimide (EDC) were obtained from Sigma (St. Louis, MO, USA), fetal bovine serum were provided from ExCell Bio (Beijing, China). Cell culture plates obtained from NEST Biotechnology Co. LTD (Wuxi, China), N-hydroxysuccinimide (NHS), and other organic chemical reagents were provided from Sinopharm (Shanghai, China).
UV spectrophotometer (UV2600) and high-performance liquid chromatography (LC-20AD) from Shimadzu, Japan. The multifunctional enzyme labeling instrument was from PerkinElmer, USA.
All experimental animals used in this study were approved by the Animal Ethics Committee. Female Balb/C mice (6-8 weeks old) were provided by the Laboratory Animal Center of Huazhong Agricultural University.
2.2. Synthesis and Computer Simulation of the Hapten PR-SC
The structure of the haptens was plotted by Gauss View 5.0 and then the lowest energy conformation was calculated in Gaussian 09W using density function (DFT), and finally the Electrostatic Potential (ESP) prediction maps were plotted by Gauss View 5.0.
The Hapten PR-SC was synthesized by optimized previous methods[17]. Add 2 g 3-mercaptopropionic acid and 15 mL ethanol to a flask, then add 3 g PR and 0.5 g potassium hydroxide and stir at 70-75 ℃ with reflux for 6 h. The reaction solution was concentrated under reduced pressure to pale yellow liquid. The liquid was mixed with 20 mL deionized water and prepared with sodium hydroxide at pH=11, then centrifuged at 8000 r/min for 5 min and the supernatant was collected. The supernatant was adjusted to pH=3.0 by 1 mol/L hydrochloric acid and extracted with ethyl acetate, and the organic solvents were combined and concentrated under reduced pressure to obtain the PR hapten (PR-SC) and the molecular weight was identified by IT-TOF. The synthetic route is shown in Figure 1A.
2.3. Preparation of Complete Antigen
Hapten-Protein conjugations were prepared by the activated ester method (Figure 1B). Solution A: 80 mg PR-SC were dissolved by 0.3 mL N, N-dimethylformamide in a brown bottle, then 60 mg EDC and 36 mg N-hydroxysuccinimide were added in turn, mixed and stirred at room temperature avoiding light for 12 h. Solution B: 52 mg BSA was dissolved in 5 mL PBS. Solution A was slowly added to solution B in an ice bath, stirred for 12h at room temperature, and then packed into dialysis bags and dialyzed in PBS for 4 days at 4°C, and the immunogen (PR-SC-BSA) was obtained. The dialysate was changed three times a day. After dialysis, the reaction solution was centrifuged at 10,000 r/min for 10 min, the precipitate was discarded and the supernatant was stored at -20°C. The above BSA was converted to OVA to obtain a coating antigen (PR-SC-OVA). The UV absorption wavelength change at 200 nm~400 nm was monitored to identify whether the hapten was successfully coupled to the protein.
2.4. Production of the Monoclonal Antibody (mAb)
Complete antigen PR-SC-BSA emulsified with an equal amount of Freund's adjuvant was used to immunize female Balb/C mice (6~8 weeks old) through multiple subcutaneous injections into the back and neck. FCA was used in the first immunization, and FIA was used in subsequent booster immunizations. A booster vaccination was administered every two weeks for 21 days after the initial immunization, and blood was collected from mice 6-8 days after the final immunization. indirect competitive enzyme-linked immunosorbent assay (ic-ELISA) was used to determine antibody titers and the specificity of the competing PR in mouse serum. Cell fusion and ascites production were performed using the methods previously described[21]. Simply, Those mice with the serum showing the best titers were euthanized and SP2/0 myeloma cells were mixed with splenocytes in 50% polyethylene glycol 1450 for 1 min, left to stand for 1 min, and terminated by 40 ml of PBS.
Seven days after cell fusion, positive hybridoma cells were screened by ic-ELISA and subcloned with limited dilution five times to obtain a monoclonal cell line capable of stably secreting antibodies. Selected hybridoma cells were injected into the peritoneal cavity of mice. After 10 days, the mice were euthanized and ascites were collected. The ascites supernatant was stored at -20℃.
2.5. Ic-ELISA Procedure
The ic-ELISA procedure was performed and modified as previously described [22]. Microtiter plates were coated with PR-SC-OVA (100 μL, 0.25 μg/mL) overnight at 4°C. After being washed by PBST (PBS containing 0.05% Tween 20, pH=7.4), 1% OVA dissolved in PBS was added to the microtiter plates (200 μL/well) and incubated at 37°C for 1.5 h. Washed again by PBST, 50 μL of PBS or sample solution was added to each microtiter plate, and 8000-fold diluted ascites were added to the microtiter plate in a volume of 50 μL per well, and the reaction was carried out at 37°C for 40 min. Washed again, HRP-IgG diluted 10,000-fold was added to each microplate in a volume of 100 μL, and the reaction was carried out at 37°C for 40 min, protected from light. After being washed three times, TMB substrate solution (100 μL/well) was added and incubated for 15 min at 37°C away from light. 50 μL H2SO4 (1mol/L) was used to terminate the reaction. Finally, the OD450 value was measured by PerkinElmer.
2.6. Optimization of ic-ELISA
The ic-ELISA was optimized as described previously [21]. PR was optimized as a competitor. To improve the sensitivity of reaction, the effects of pH and dilution of PR on the ic-ELISA method were investigated. PBS of different pH (pH=9.6, 7.4, 5.0) as reaction conditions were used to explore the effect on sensitivity. The PR standard was diluted with methanol to the appropriate concentration (100 μg/mL). In addition, PBS with 5, 10%, and 20% methanol were used to check the effect on the sample reconstituted solution as dilutions of PR. The inhibition rate B/B0 (OD of competitor-inhibited wells/OD of zero wells) or the corresponding competitor concentration at 50% inhibition (IC50) was used as the assessment of the optimization conditions.
2.7. Standard Curve and Cross-Reactivity of ic-ELISA
PR standard (1 mg/mL in methanol) was diluted to 100, 50, 25, 12.5, 6.25, and 0 μg/L by PBS, and the standard curve was plotted under optimized conditions. To ensure the precision of the standard curve, each set of standard curves was made five times in parallel and repeated for five sets, and the coefficient of variation was used to evaluate the precision of the standard curve. Cross-reactivity (CR) was performed to determine the specificity of mAb. Five structurally similar pesticides, including Alachlor, Acetochlor, Butachlor, Propisochlor, and Metalaxyl, were determined by ic-ELISA. CR = (IC50 of PR)/(IC50 of analyte)×100%.
2.8. Sample Preparation
The rice, lake water, and soil were obtained from local farmers' markets, lake, and fields, respectively. Take 20 mL of lake water in a 50 mL centrifuge tube, centrifuge for 10 min at 8000 r/min, take 10 mL of the supernatant in a 50 mL centrifuge tube, add 10 mL of sample dilution (PBS containing 5% methanol), mix well and assay.
Rice and soil: 1g of sample was weighed in a 50mL centrifuge tube, 10mL of PBS solution containing 5% methanol was added, shaken for 5 minutes, left to stand for 20 minutes, centrifuged at 8000r/min for 10 minutes, and the supernatant was taken for determination.
2.9. Validation of the Ic-ELISA
The ic-ELISA validation was performed as previously reported[23]. Twenty different blank samples (PR was not detected by HPLC) were spiked with different concentrations of PR standard solution, and these samples were subjected to ic ELISA according to the following sample pretreatment method. The limit of detection (LOD) and limit of quantification (LOQ) were calculated by the average drug concentration detected in the samples (C) and the standard deviation (SD) of the measured drug concentration. The formula was calculated as follows; LOD=C+3×SD, LOQ=C+10×SD.
The accuracy and precision of the ic-ELISA method was determined by analyzing the spiked recoveries of the samples. Three different concentrations of PR (10, 20 and 40 μg/kg) were spiked into blank lake water, soil, and rice samples, and the recoveries were calculated by the following formula: Recovery (%) = Sample Detection Concentration / Actual Spiked Concentration × 100%.
Lake water was used as an analyte to validate the reliability of ic-ELISA by HPLC. Lake water samples were spiked with PR solutions at concentrations of 50, 100, 200, 400, and 800μg/L, each divided into two parts, and processed as follows: 100 mL of lake water samples were measured accurately and placed in a 250 mL dispensing funnel. 10 g of sodium chloride and 3 drops of glacial acetic acid were added and the solids were shaken to dissolve. The sample was extracted three times with 30 mL, 30 mL, and 20 mL of dichloromethane, and the combined organic solvents were dried and concentrated on a rotary evaporator. The concentrated samples were re-dissolved and assayed by ic-ELISA and HPLC, respectively.
Chromatographic column: C18 (250 mm × 4.6 mm × 5.0 μm); Mobile phase: methanol-water (75:25, v/v); Flow rate: 1 mL/min; Detection wavelength: 220 nm; Column temperature: 40 ℃; Injection volume: 20 μL.
3. Results
3.1. Identification of Hapten
Haptens should be designed to mimic the target molecule as closely as possible in terms of morphology, structure, and electron distribution, in this way, the preparation of monoclonal antibodies with high sensitivity and specificity can be facilitated. PR is a chloroacetamide herbicide whose structure consists of three groups: a benzene ring, an N-chloroacetamido group, and a hydrocarbon-oxygen chain. The hydrocarbon-oxygen branched chain is the main group that distinguishes amide herbicides, therefore the modification of the hapten should be carried out from the benzene ring and the N-chloroacetamide group. Modification of the benzene ring requires addressing two issues: protection of the benzene ring branched chain and the immunogenicity of the hapten. The addition of branched chains to the benzene ring can damage the characterization of other branched chains, which greatly limits the modification of the benzene ring. The benzene ring has been reported to affect the immunogenicity of antigen[24] and therefore modifications to benzene rings should be avoided. The N-chloroacetamide moiety was chosen for the synthesis of PR hapten (PR-SC), which allows adequate exposure of the benzene ring and hydrocarbon-oxygen branched chain, thereby improving the immunogenicity and specificity of the hapten and minimizing cross-reactivity with similar herbicides.
The Mulliken charges of PR and hapten PR-SC from 1C-21C were calculated and analyzed. As shown in Figure 2, the Mulliken charges of the remaining backbone atoms of hapten PR-SC and PR maintain a high degree of consistency with each other compared to those of PR, except for the change of charge after the substitution of 13Cl by S. Particularly, the Mulliken charges of 14C, 15C, 16O, 17C, 20C, and 21C constituting the hydrocarbon-oxygen branched chain maintain perfect consistency. This allows the specificity of the antibody for PR to be fully assured.
The molecular formula of PR is C17H26ClNO2, and the molecular formula of PR-SC is C20H31NO4S. The PR-SC was prepared by introducing a chlorine substitution to the carboxyl group of PR, which was then linked to the carrier protein via the carboxyl group. As shown in Figure S1, PR-SC was successfully synthesized with IT-TOF verification, the theoretical value of [M+Na]+ for PR-SC was 404.1866 and the measured value was 404.1868; The theoretical value of [M+H]+ for PR-SC was 382.2047 and the measured value 382.2082. The actual and theoretical values of [M+Na]+ and [M+H]+ for PR-SC were similar, indicating that the molecular weight of PR-SC was correct and the synthesis of PR-SC was successful.
3.2. Identification of Complete Antigens
As shown in Figure 3, the UV maximum absorption peaks of the half-antigen PR-SC were 228 nm, and those of BSA and OVA were 279 nm, while the UV maximum absorption peaks of the conjugates PR-SC-BSA and PR-SC-OVA were significantly shifted from those of PR-SC, BSA, and OVA, which proved the success of the complete antigen synthesis. PR-SC was successfully coupled with vector protein, the coupling ratios were 15.4:1(PR-SC-BSA) and 10.2:1(PR-SC-OVA).
3.3. Production and Identification of the mAb
As shown in Table S1, mouse PRA2 was selected for cell fusion based on the antiserum results of the four mice immunized, the PR-114 cell line was screened from the fused cells by subcloning and ic-ELISA (PR concentration: 50 μg/L, inhibition rate: 42%, Table S2), the antibody ascites was prepared by PR/114, the subtype of this monoclonal antibody was identified as IgG1 by kit analysis, and the ascites concentration was 30.3 mg/mL.
3.4. Optimization of ic-ELISA Conditions
3.4.1. Optimization of Dilution of mAb and Coating Antigen
MAb and coating antigen at optimal dilution concentration, OD value at 450 nm was 2.0. As shown in Table S3, there were three combinations of coating antigen dilutions and mAb: (0.25 μg/mL, 0.5 μg/mL), (0.125 μg/mL, 0.5 μg/mL), and (0.0625 μg/mL, 1 μg/mL). The IC50 values of the three combinations were calculated by ic-ELISA which were 47.06 μg/L, 35.41 μg/L, and 31.47 μg/L, respectively (Table S4), which led to the conclusion that the third combination was the optimal dilution concentration.
3.4.2. Optimization of Drug Dilution Conditions
The ic-ELISA was carried out at different pH to investigate the effect of pH on the sensitivity of mAb. The results were shown in Figure 4A, with IC50 minimized at pH = 7.4, thus PBS at pH=7.4 was chosen as the most diluting solution for the antibody and drug.
The PR standard master mix was prepared in methanol and it was necessary to investigate whether methanol affected the antibody. Ic-ELISA was performed with PBS solutions containing 0%, 5%, 10%, and 20% methanol as dilutions of PR standards. The results are shown in Figure 4B. The IC50 was minimized when 5% methanol PBS solution was used as the drug diluent, so 5% methanol PBS solution was chosen as the standard diluent. PR is soluble in methanol and has a low solubility in water. The addition of an appropriate amount of methanol to the diluent improves the solubility of PR, which increases the probability that the antibody will bind to the drug, which could explain the ability of methanol to improve the recognition of PR by the PR/114 antibody.
3.5. Evaluation of the Optimized Ic-ELISA
3.5.1. Ic-ELISA Calibration Curve
The standard solution was diluted to 6.25μg/L, 12.5μg/L, 25μg/L, 50 μg/L and 100 μg/L. The PR standard curve was established according to the optimized ic-ELISA conditions. Using the logarithm of PR concentration as the X-axis and B/B0 as the Y-axis, the regression equation of PR/114 antibody ic-ELISA was Y=1.08288-0.387X, R2=0.9915, and the IC50 value was 31.47±2.35 μg/L with a linear range of 6.25~100 μg/L (Figure 5). In Table S5, it can be found that the intra-plate coefficient of variation of the established standard curve was less than 15.72% and the inter-plate coefficient of variation was less than 7.79%, indicated that the precision of the standard curve is favorable and the antibody obtained in this study were more sensitive than those obtained by Liu et al. (IC50= 35.9μg/L)[25].
3.5.2. Cross-Reactivity
The five chloroacetamide herbicides, alachlor, acetochlor, butachlor, propisochlor, and metalaxyl were formulated at appropriate concentrations. The standard curves of these drugs were established and the IC50 was calculated separately according to the optimized ic-ELISA conditions, and the IC50 values of the PR were used as the standard to compare and calculate the cross-reactivity rates of other compounds. The results are shown in Table 1. The cross-reactivity rates of the antibody against these five chloroacetamide herbicides were all less than 3.0%.
The cross-reactivity of the PR/114 antibody with alachlor, acetochlor, metalaxyl, butachlor, and propisochlor were all less than 3.0%. As shown in Table 4, alachlor, acetochlor, butachlor, and propisochlor have different hydrocarbon-oxygen branched chains: Alachlor and acetochlor lacked a methyl group compared to PR; Butachlor had one more methyl group than PR and propisochlor differed in the way linked to the propyl group of PR. The difference in hydrocarbon-oxygen branched chains has a strong influence on the recognition ability, which leads to the assumption that the hydrocarbon-oxygen branched chain is the main antigenic target site.
Computer simulations of five structurally similar drug structures were performed as described previously to obtain minimum energy conformations, ESP values, and Mulliken charges data to analyze the cross-reactivity of the antibodies. The lowest energy conformational maps and ESP distributions of PR and five structurally similar drugs based on Gaussian 09W calculations and rendered by GaussView 5.0 were shown in Figure 6A. The ESPs of the benzene ring and the N-chloroacetamido group of PR were roughly the same as those of the other five drugs, but there was a different degree of ESP distribution in the hydrocarbon-oxygen branched chain. The Mulliken charges of PR and the five analogs based on the lowest energy conformation were also calculated for analysis as shown in Figure 6B. For simplified processing, 1C-9C were ignored due to the close Mulliken charges values. The significant differences in the Mulliken charges of the hydrocarbonyloxy branched chains at 17C, 20C, and 21C also indicate that the hydrocarbonyloxy branched chains are the most important specificity determinants, which correlates with the ESP distributions and the experimental results consistent with the ESP distribution and experimental results.
The difference between the coating antigen and target molecules and immunogens is one of the factors to improve antibody sensitivity[26]. Based on the above simulation results, the hydrocarbon-oxygen branch of chloroacetamides has been shown to be a site of specificity for the target molecule, thus, it is hypothesized that the use of other chloroacetamide herbicides similar to PR as heterologous coating antigens may significantly increase antibody sensitivity by increasing the competitiveness of the antibody against the PR molecule. This conclusion is subject to further experimental verification.
3.6. Validation of ic-ELISA Method
3.6.1. Optimization of Sample Pre-Treatment
For the pre-treatment of the lake water sample, a dilution method was used, which was simple and less time-consuming. Considering the more complex water environment that may be encountered in practical application, at least 1-fold dilution is required when processing lake water samples. PR boiling point was 135℃, and the recovery of PR in the sample was found to be low when extracted with organic solvent and concentrated, which was inferred to volatilize PR when organic solvent evaporated. Therefore, the extraction method for PR in soil and rice should be diluted in PBS containing 5% methanol for extraction.
The OD values of 20 blank samples were measured for lake water, rice, and soil, respectively, and the concentration of PR in the blank samples was calculated based on the standard curve of the PR/114 antibody ic-ELISA to calculate the LOD and LOQ for each sample. The results are shown in Table 2. The limits of detection for PR in lake water, rice, and soil were 2.37~4.83 μg/L and the limits of quantification were 4.46~10.13 μg/L. The average recoveries in the lake water samples were 78.3%~91.3% and the coefficients of variation were less than 9.5%.
3.6.2. Comparison of ic-ELISA
The results of the ic-ELISA and HPLC assays are detailed in Table 3, with recoveries ranging from 81.0% to 96.2% for both methods. As shown in Figure 7, the correlation between ic-ELISA and HPLC was good and the linear correlation coefficient was R2 = 0.9913. The results indicated that the ic-ELISA method established in this study can be used as a reliable tool for the detection of PR in real samples.
4. Conclusions
In this study, a monoclonal antibody with higher sensitivity and specificity against PR was prepared with an IC50 of 31.47 μg/L and no cross-reactivity to any other chloroacetamide herbicides. An ic-ELISA method was developed for the detection of PR residues in the environment and cereals, with a linear range of 6.25~100 μg/L. The LOD of PR in lake water, rice, and soil samples were 2.37~4.83 μg/L and the LOQ were 4.46~10.13 μg/L, the recoveries were 78.3%~91.3% with the coefficients of variation less than 9.5%. The method was validated by HPLC, confirming the reliability of the ic-ELISA was reliable. We provided a more sensitive method of detecting PR in the environment, and a new way of monitoring environmental safety that was scientifically important and market value.
Author Contributions
Conceptualization, Dapeng Peng.; methodology, Linwei Zhang and Xiaoyang Yin.; software, Linwei Zhang and Xiaoyang Yin.; validation, Linwei Zhang, Xiaoyang Yin, Hongfei Yang, Hao Wen, Shiyun Han, Xiaoming Pan, Huaming Li, Liangni Qin, Jiaxu Xiao, Long Li, Yu Si, and Jixiang Liang; formal analysis, Linwei Zhang and Xiaoyang Yin.; investigation, Linwei Zhang, Xiaoyang Yin, Hongfei Yang, Hao Wen, Shiyun Han, Xiaoming Pan, Huaming Li, Liangni Qin.; resources, Dapeng Peng.; data curation, Linwei Zhang and Xiaoyang Yin.; writing—original draft preparation, Linwei Zhang and Xiaoyang Yin.; writing—review and editing, Dapeng Peng.; visualization, Linwei Zhang and Xiaoyang Yin.; supervision, Dapeng Peng.; project administration, Dapeng Peng.; funding acquisition, Dapeng Peng. All authors have read and agreed to the published version of the manuscript.
Funding
This research was funded by the National Natural Science Foundation of China (32072920), Fundamental Research Funds for the Central Universities (2662022DKPY007), and HZAU-AGIS Cooperation Fund (SZYJY2022024).
Acknowledgments
The authors are grateful to the National Natural Science Foundation of China (32072920), Fundamental Research Funds for the Central Universities (2662022DKPY007), and HZAU-AGIS Cooperation Fund (SZYJY2022024) for their financial support.
Data Availability Statement
The data presented in this study are available on request from the corresponding author.
Conflicts of Interest
The authors declare that they have no known competing financial interest or personal relationships that could have appeared to influence the work reported in this paper.
References
- Wu, C.; Lou, X.; Xu, X.; Huang, A.; Zhang, M.; Ma, L. Thermodynamics and Kinetics of Pretilachlor Adsorption on Organobentonites for Controlled Release. ACS Omega 2020, 5, 4191–4199. [Google Scholar] [CrossRef] [PubMed]
- Lee, H.; Kim, D.U.; Park, S.; Yoon, J.H.; Ka, J.O. Massilia chloroacetimidivorans sp. nov., a chloroacetamide herbicide-degrading bacterium isolated from soil. Antonie Van Leeuwenhoek 2017, 110, 751–758. [Google Scholar] [CrossRef] [PubMed]
- Han, S.; Hatzios, K.K. Uptake, translocation, and metabolism of [c-14] pretilachlor in fenclorim-safened and unsafened rice seedlings. Pestic. Biochem. Physiol. 1991, 39, 281–290. [Google Scholar] [CrossRef]
- Ke, W.; Xiao-Chen, H.; Ling-Zhi, Z.; Kun, L.; Zhong-Xia, H.; Li-Li, Y. Research progress on detection technology of amide herbicide residues. J. Food Saf. Qual. 2019, 10, 5590–5596. [Google Scholar]
- Coleman, S.; Linderman, R.; Hodgson, E.; Rose, R.L. Comparative metabolism of chloroacetamide herbicides and selected metabolites in human and rat liver microsomes. Environ. Health Perspect. 2000, 108, 1151–1157. [Google Scholar] [PubMed]
- El-Baz, M.A.; ElDeek, S.M.; Amin, A.F.; Nassar, A.Y.; Aboelmaali, N.T. Prenatal pesticide exposure: Meconium as a biomarker and impact on neonatal weight. Fertil. Steril. 2013, 100, S421. [Google Scholar] [CrossRef]
- Jiang, J.; Chen, Y.; Yu, R.; Zhao, X.; Wang, Q.; Cai, L. Pretilachlor has the potential to induce endocrine disruption, oxidative stress, apoptosis and immunotoxicity during zebrafish embryo development. Environ. Toxicol. Pharmacol. 2016, 42, 125–134. [Google Scholar] [CrossRef] [PubMed]
- Kumar, J.; Patel, A.; Tiwari, S.; Tiwari, S.; Srivastava, P.K.; Prasad, S.M. Pretilachlor toxicity is decided by discrete photo-acclimatizing conditions: Physiological and biochemical evidence from Anabaena sp. and Nostoc muscorum. Ecotoxicol. Environ. Saf. 2018, 156, 344–353. [Google Scholar] [CrossRef] [PubMed]
- Soni, R.; Verma, S.K. Impact of herbicide pretilachlor on reproductive physiology of walking catfish, Clarias batrachus (Linnaeus). Fish Physiol. Biochem. 2020, 46, 2065–2072. [Google Scholar] [CrossRef]
- Cheng, Y.; Ge, J.; Hu, G.; Cai, L.; Chen, L.; Jiang, J. Acute Toxicity Effects of Three Amide Herbicides to Different Life Stages of Zebrafish (Danio rerio). Asian J. Ecotoxicol. 2017, 12, 171–178. [Google Scholar]
- Han, S.; Hatzios, K.K. Physiological interactions between the herbicide pretilachlor and the safener fenclorim on rice. Pestic. Biochem. Physiol. 1991, 39, 270–280. [Google Scholar] [CrossRef]
- Swatch, G.K.; Singh, D.P.; Khattar, J.S.; Mohapatra, P.K. Interaction of pretilachlor with PS-II activity of the cyanobacterium Desmonostoc muscorum PUPCCC 405.10. J. Basic Microbiol. 2020, 60, 532–542. [Google Scholar] [CrossRef] [PubMed]
- China, N.S. o. t. P. s. R. o. National Food Safety Standards - Maximum Residue Limits for Pesticides in Food. http://nyncj.panzhihua.gov.cn/zfxxgk/fdzdgknr_2/lzyj/zcwj/4278727.shtml 2021.
- Bai, S.-S.; Zhi, L.; Zang, X.-H.; Wang, C.; Wang, Z. Graphene-based Magnetic Solid Phase Extraction Dispersive Liquid-Liquid Microextraction Combined with Gas Chromatographic Method for Determination of Five Acetanilide Herbicides in Water and Green Tea Samples. Chin. J. Anal. Chem. 2013, 41, 1177–1182. [Google Scholar] [CrossRef]
- Chau, N.D.G.; Hop, N.; Long, H.; Duyen, N.; Raber, G. Multi-residue analytical method for trace detection of new-generation pesticides in vegetables using gas chromatography–tandem mass spectrometry. J. Environ. Sci. Health Part B 2019, 55, 1–11. [Google Scholar] [CrossRef]
- Gao, Y.; Li, H.; Shi, Y. An effective and sensitive environmental pollutant sensor for pymetrozine. J. Aoac Int. 2020, 106, 1190–1196. [Google Scholar] [CrossRef]
- Liu, Z.J.; Yu, P.M.; Fang, S.; Fan, J.Q.; Wang, M.H. Development of an enzyme-linked immunosorbent assay for determination of pretilachlor in water and soil. Ecotoxicol. Environ. Saf. 2011, 74, 1595–1599. [Google Scholar] [CrossRef]
- Ascoli, C.A.; Aggeler, B. Overlooked benefits of using polyclonal antibodies. BioTechniques 2018, 65, 127–136. [Google Scholar] [CrossRef] [PubMed]
- Nelson, P.N.; Reynolds, G.M.; Waldron, E.E.; Ward, E.; Giannopoulos, K.; Murray, P.G. Monoclonal antibodies. Mol. Pathol. MP 2000, 53, 111–117. [Google Scholar] [CrossRef] [PubMed]
- Jain, D.; Salunke, D.M. Antibody specificity and promiscuity. Biochem. J. 2019, 476, 433–447. [Google Scholar] [CrossRef]
- Yin, X.; Li, H.; Wu, S.; Lu, Y.; Yang, Y.; Qin, L.; Li, L.; Xiao, J.; Liang, J.; Si, Y.; et al. A sensitive and specific enzyme-linked immunosorbent assay for the detection of pymetrozine in vegetable, cereal, and meat. Food Chem. 2023, 418, 135949. [Google Scholar] [CrossRef]
- Wu, S.; Li, H.; Yin, X.; Si, Y.; Qin, L.; Yang, H.; Xiao, J.; Peng, D. Preparation of Monoclonal Antibody against Pyrene and Benzo [a]pyrene and Development of Enzyme-Linked Immunosorbent Assay for Fish, Shrimp and Crab Samples. Foods 2022, 11. [Google Scholar] [CrossRef] [PubMed]
- Bao, N.; Meng, X.; Wu, Y.; Hu, J.; Dong, J.; Zhang, H.; Zhang, L. Determination of Pretilachlor TC by HPLC. Agrochemicals 2020, 59, 105–106. [Google Scholar]
- Chen, Z.J.; Liu, X.X.; Xiao, Z.L.; Fu, H.J.; Huang, Y.P.; Huang, S.Y.; Shen, Y.D.; He, F.; Yang, X.X.; Hammock, B.; et al. Production of a specific monoclonal antibody for 1-naphthol based on novel hapten strategy and development of an easy-to-use ELISA in urine samples. Ecotoxicol Env. Saf 2020, 196, 110533. [Google Scholar] [CrossRef] [PubMed]
- Liu, Z.-J.; Yu, P.-M.; Fang, S.; Fan, J.-q.; Wang, M.-H. Development of an enzyme-linked immunosorbent assay for determination of pretilachlor in water and soil. Ecotoxicol. Environ. Saf. 2011, 74, 1595–1599. [Google Scholar] [CrossRef] [PubMed]
- Zhang, X.; Bai, Y.; Tang, Q.; Liu, M.; Nan, L.; Wen, K.; Yu, X.; Yu, W.; Shen, J.; Wang, Z. Development of epitopephore-based rational hapten design strategy: A combination of theoretical evidence and experimental validation. J. Hazard. Mater. 2023, 445, 130615. [Google Scholar] [CrossRef]
Figure 1.
(A): Synthesis route of PR hapten (PR-SC) (B): Synthesis of antigens of PR-SC-BSA/OVA.
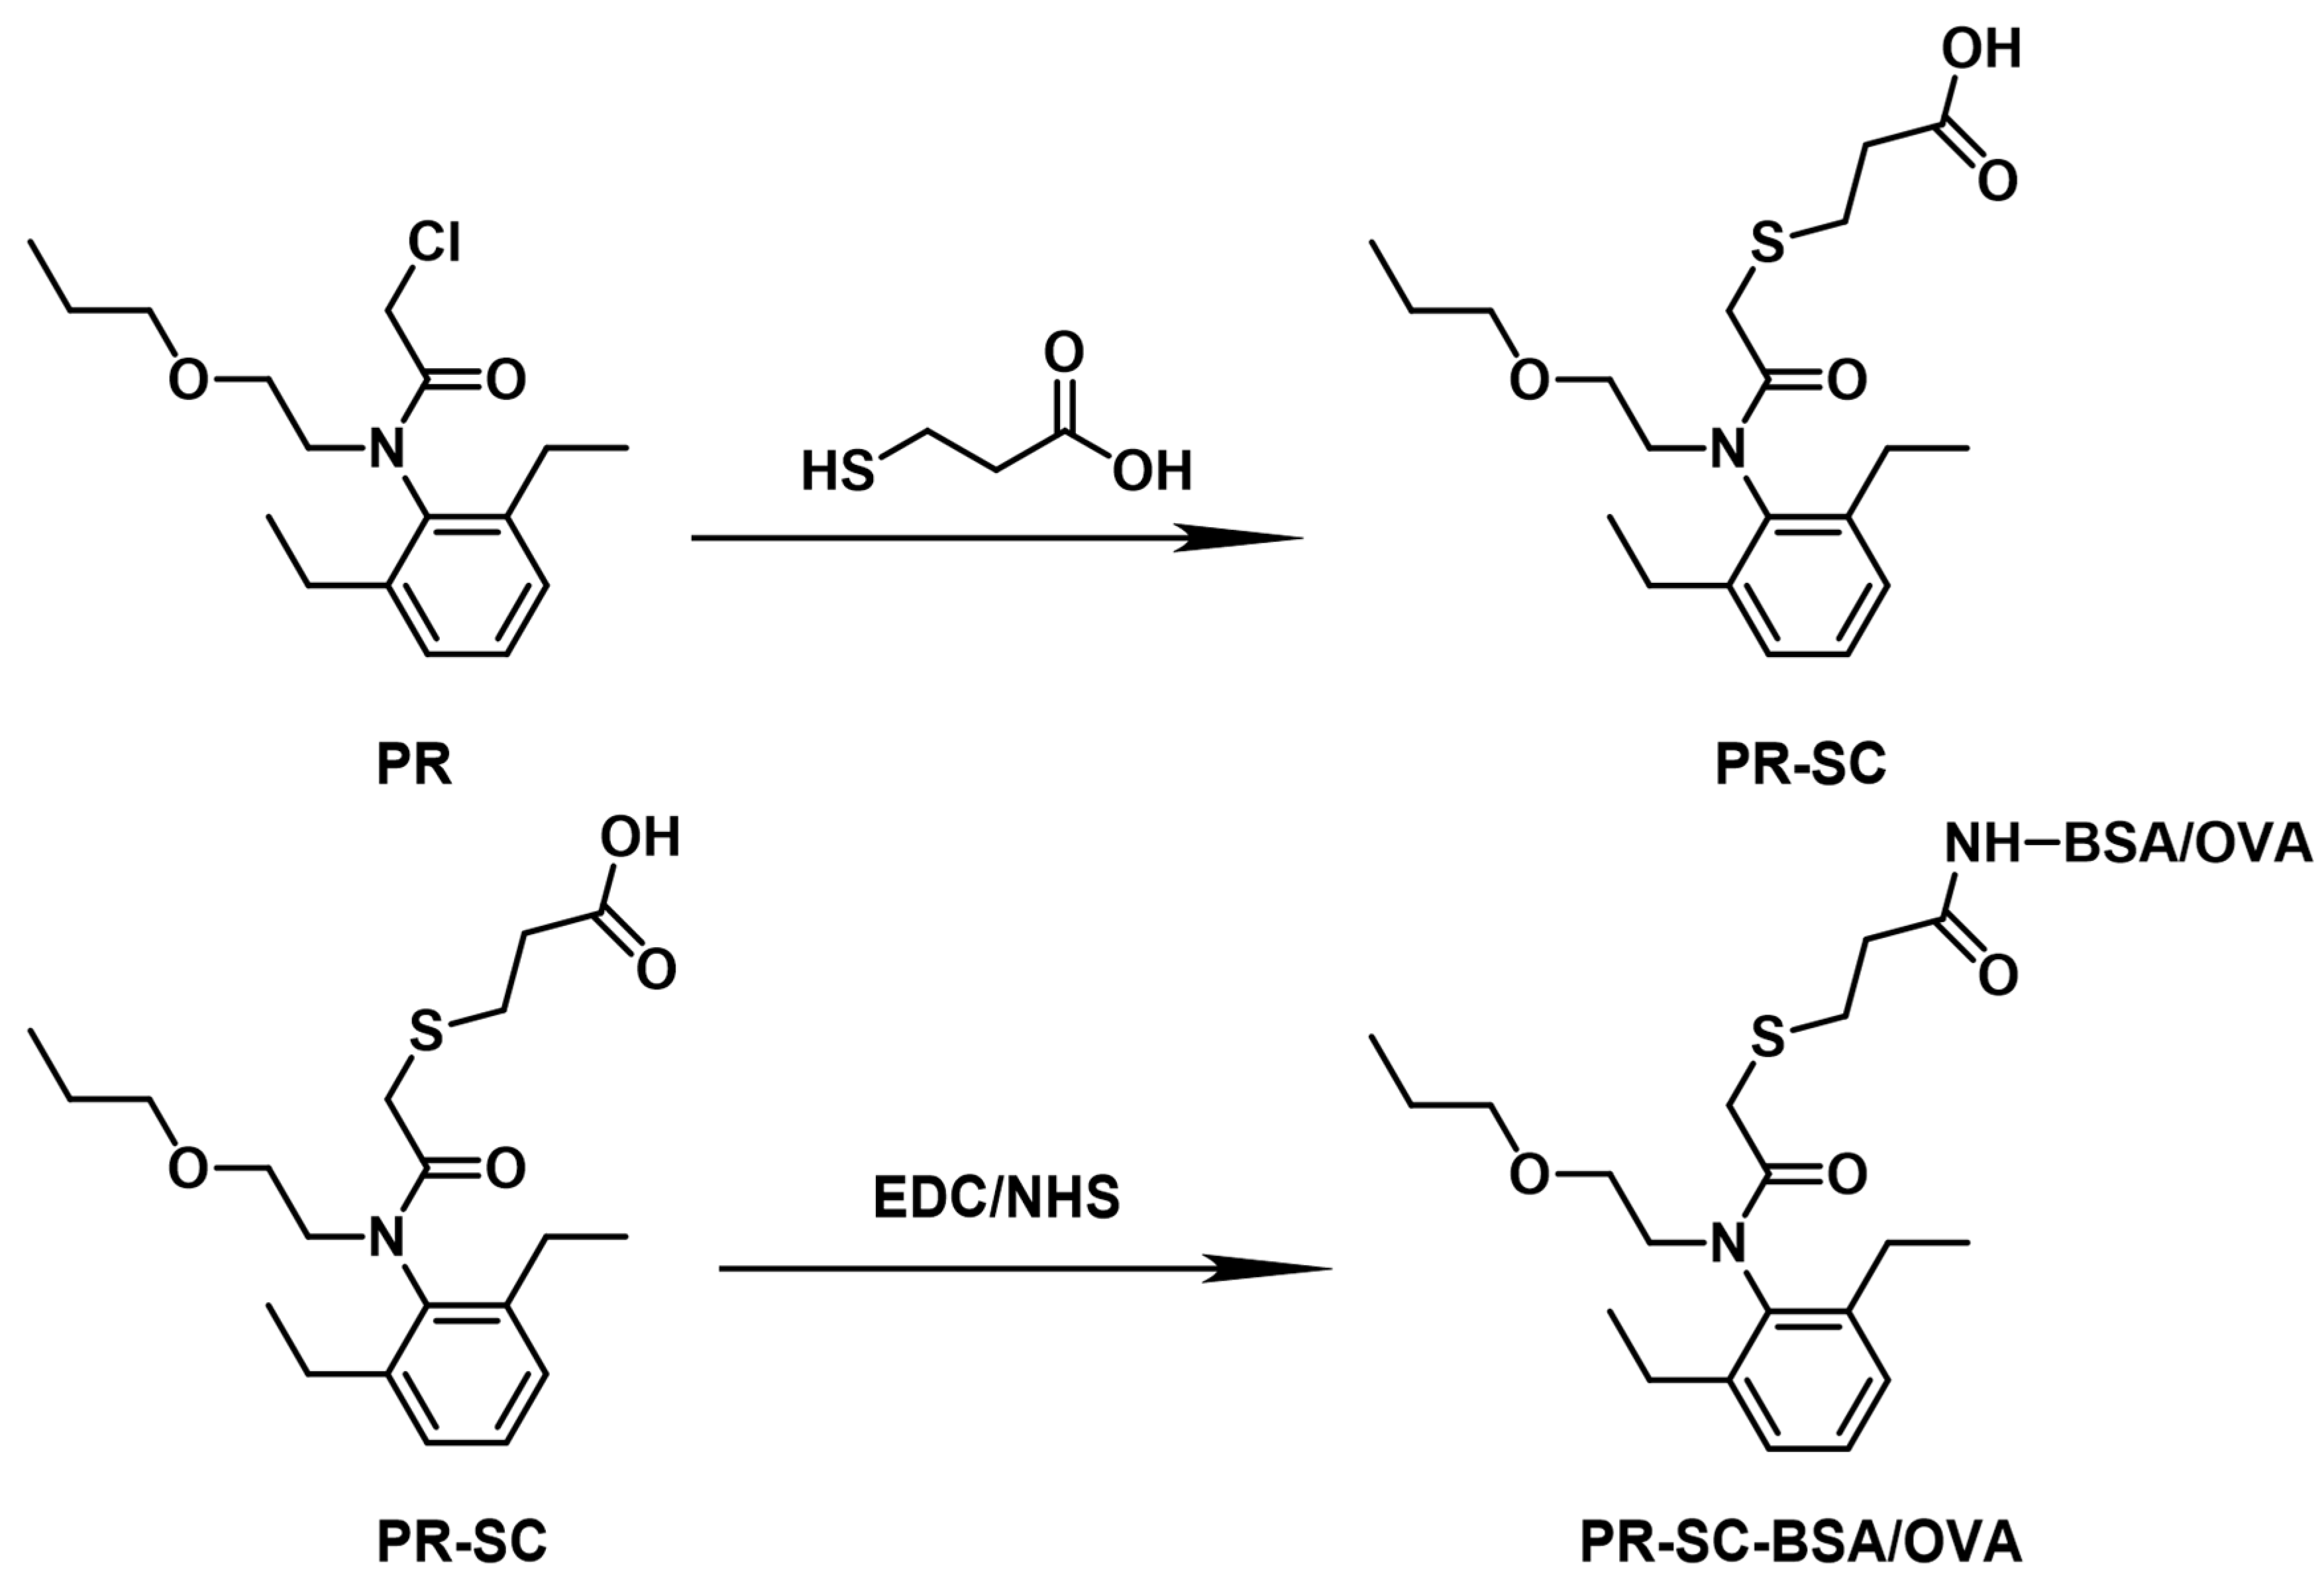
Figure 2.
Mulliken charges of PR and hapten PR-SC.
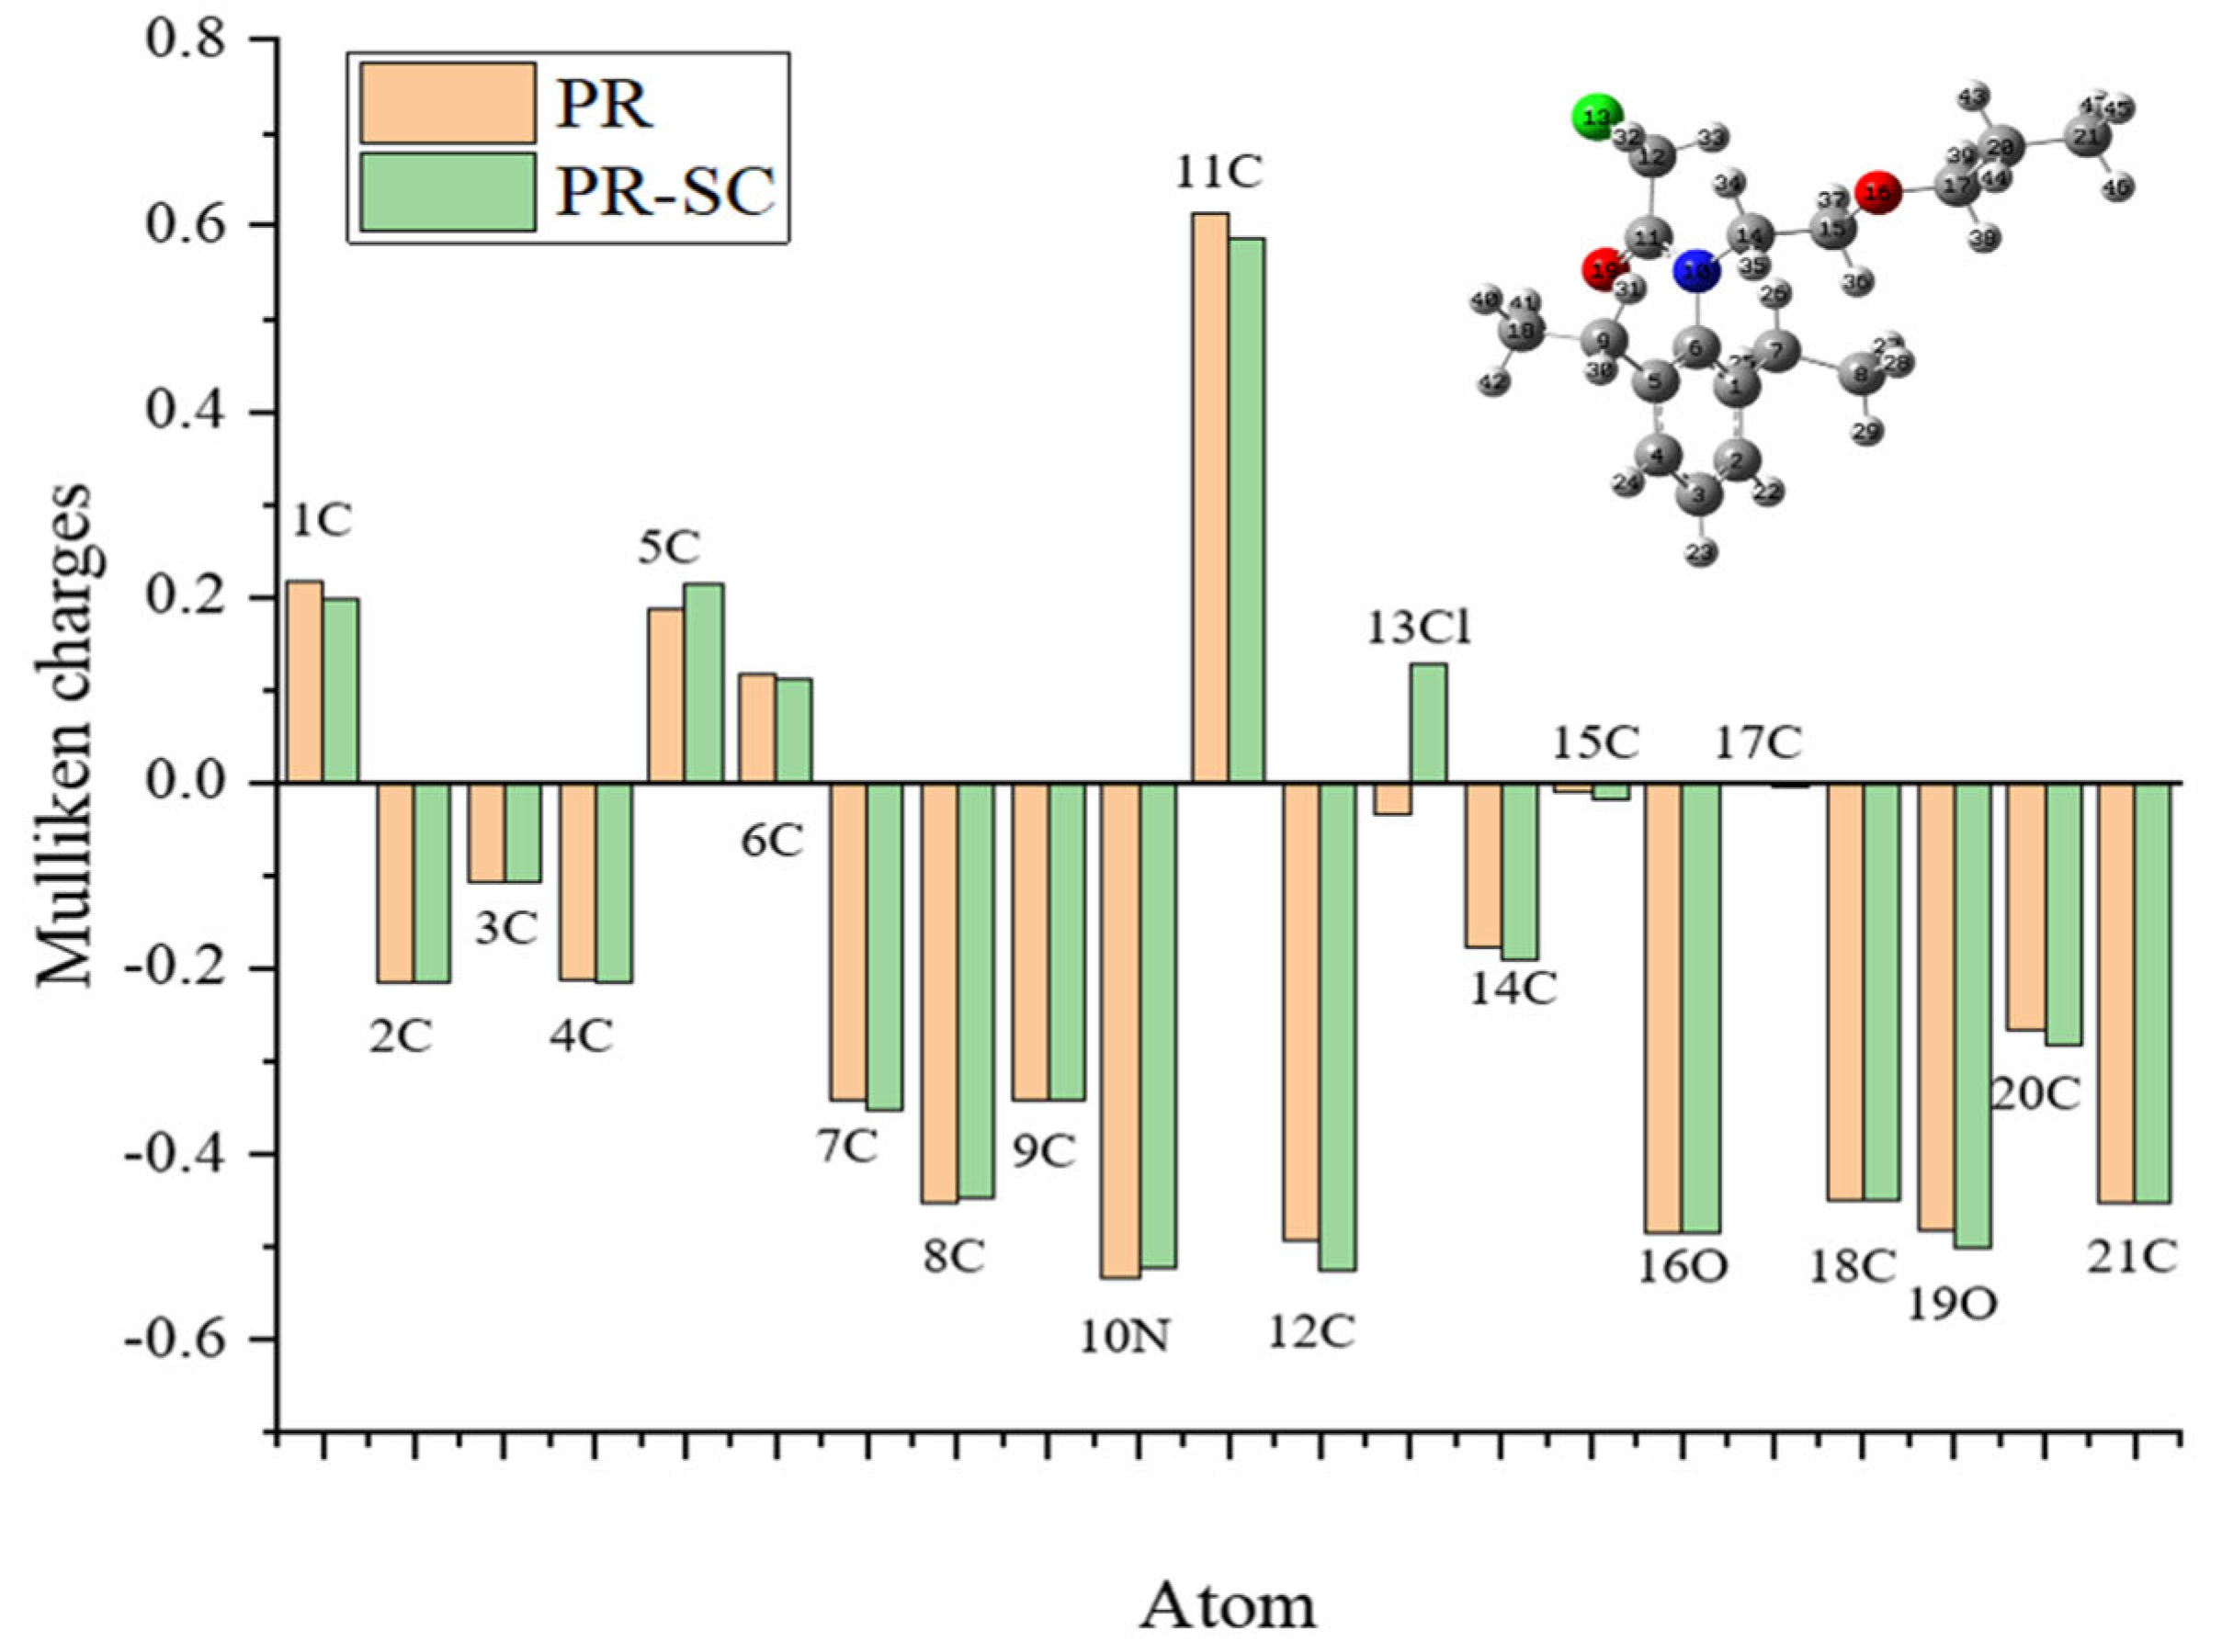
Figure 3.
Analysis of PR-SC-BSA (A) and PR-SC-OVA (B) conjugations by UV–visible spectroscopy.
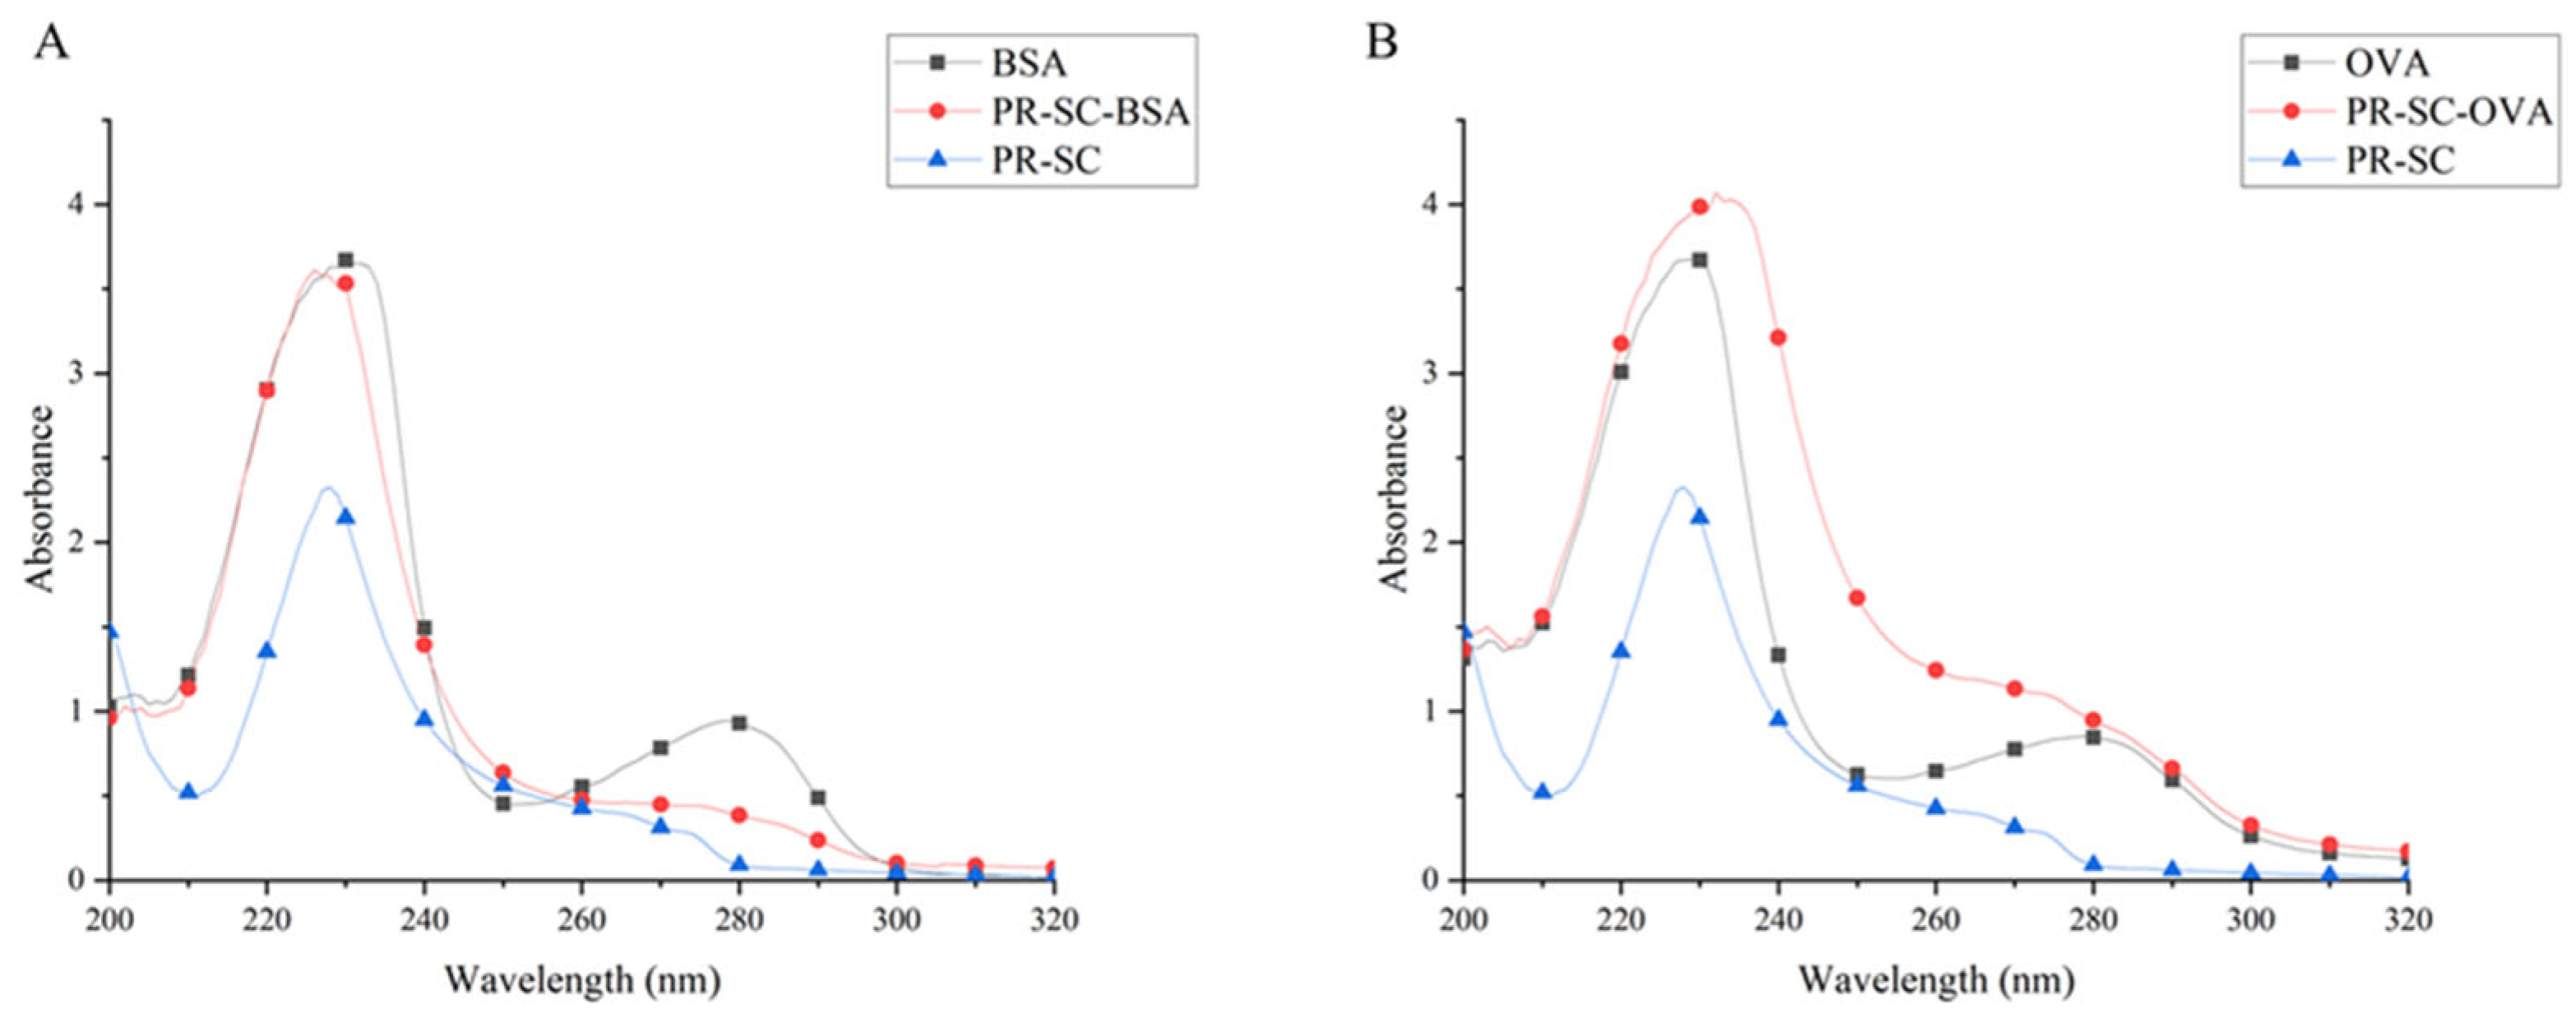
Figure 4.
A): Inhibition rate-PR concentration curve at pH=9.6, 7.4, 5.0 in PBS. (B): Inhibition rate-PR concentration curve of PBS containing 0%, 5%, 10%, and 20% Methanol as a drug diluent.
Figure 4.
A): Inhibition rate-PR concentration curve at pH=9.6, 7.4, 5.0 in PBS. (B): Inhibition rate-PR concentration curve of PBS containing 0%, 5%, 10%, and 20% Methanol as a drug diluent.
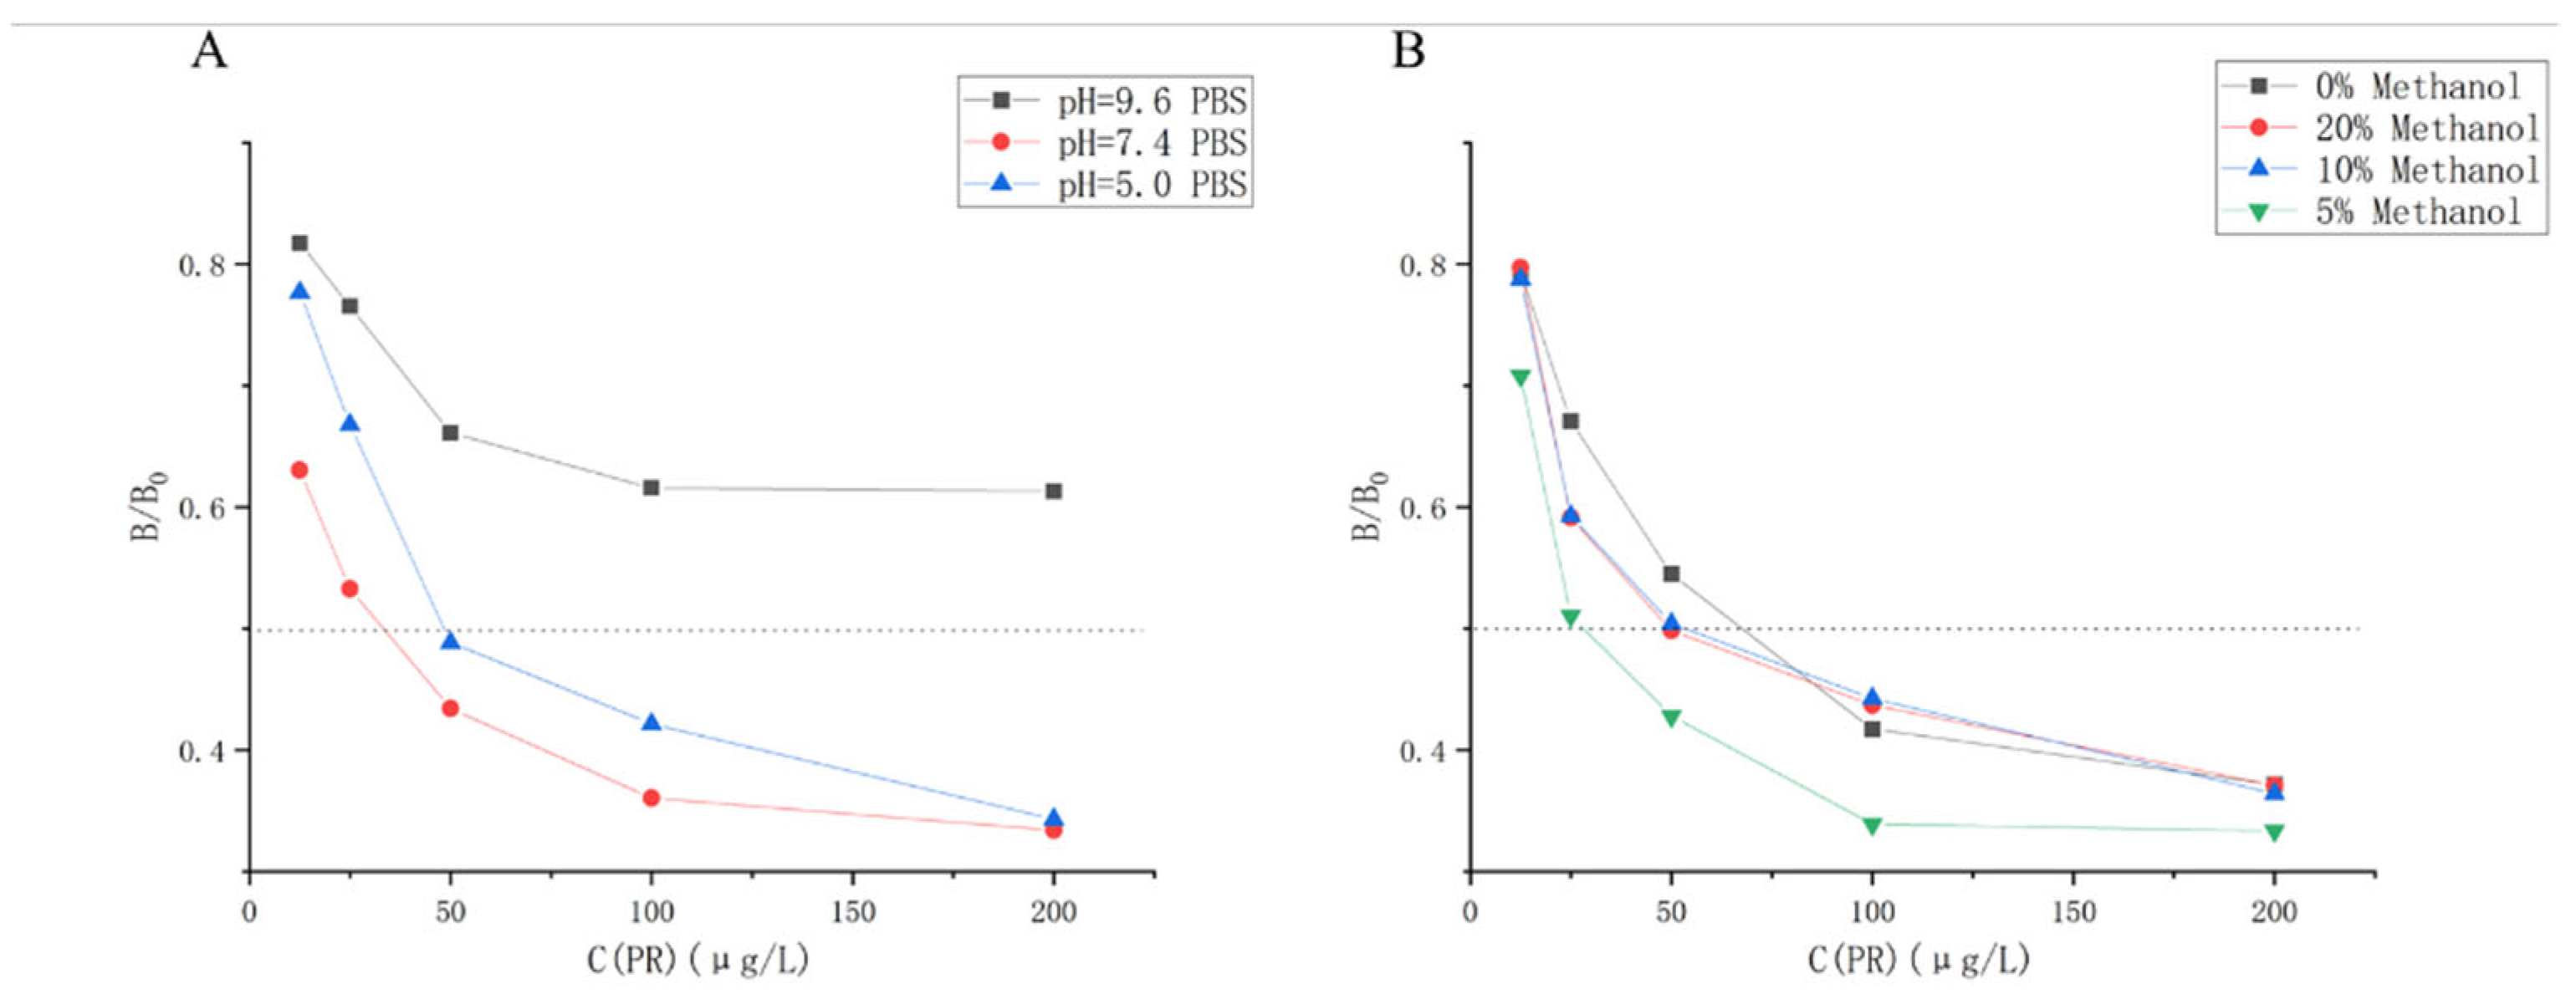
Figure 5.
Standard curve of ic-ELISA for PR/114 antibody.
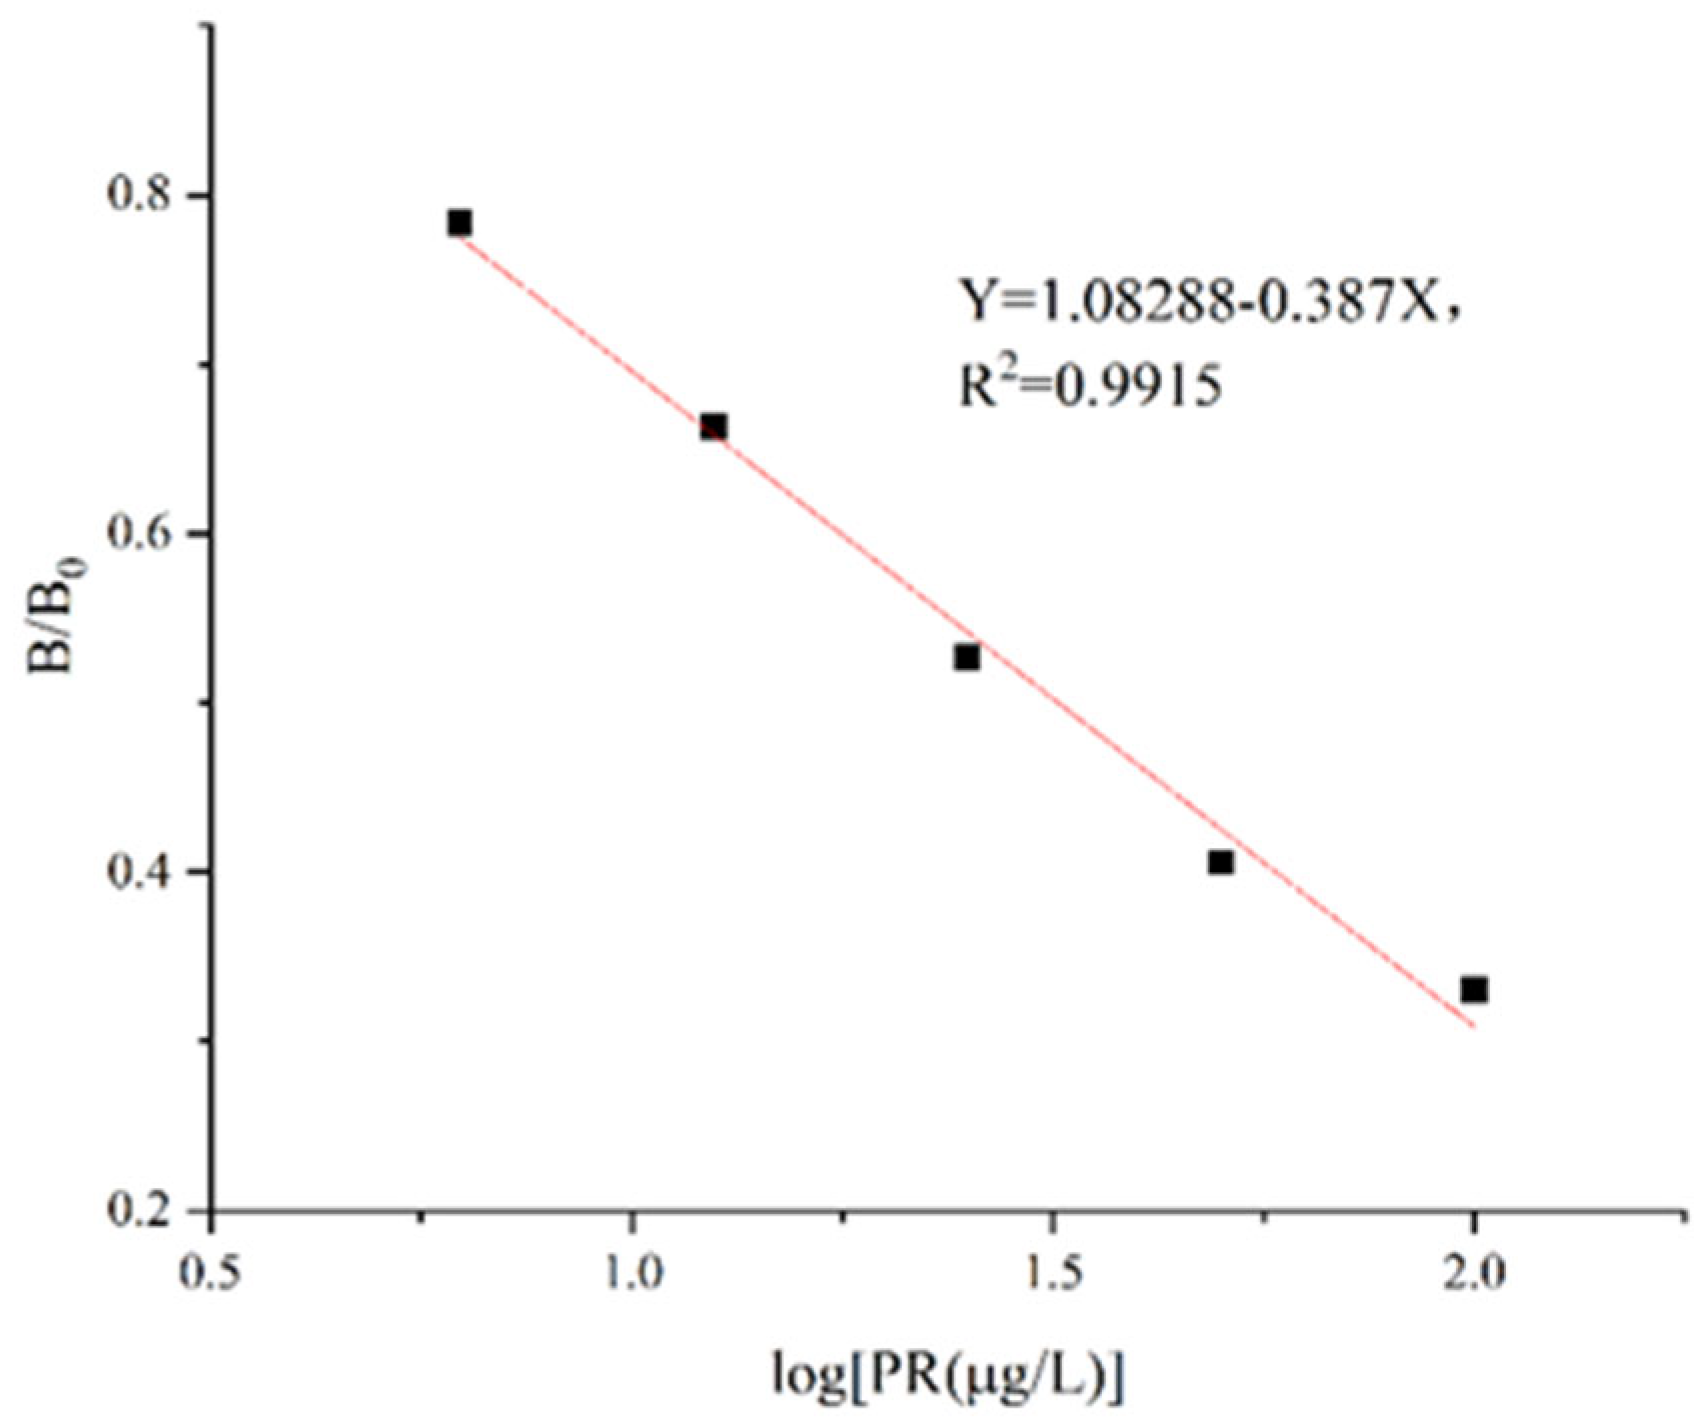
Figure 6.
(A): Surface ESP distribution of PR and its analogs. (B): Mulliken charges of PR and its analogs.
Figure 6.
(A): Surface ESP distribution of PR and its analogs. (B): Mulliken charges of PR and its analogs.
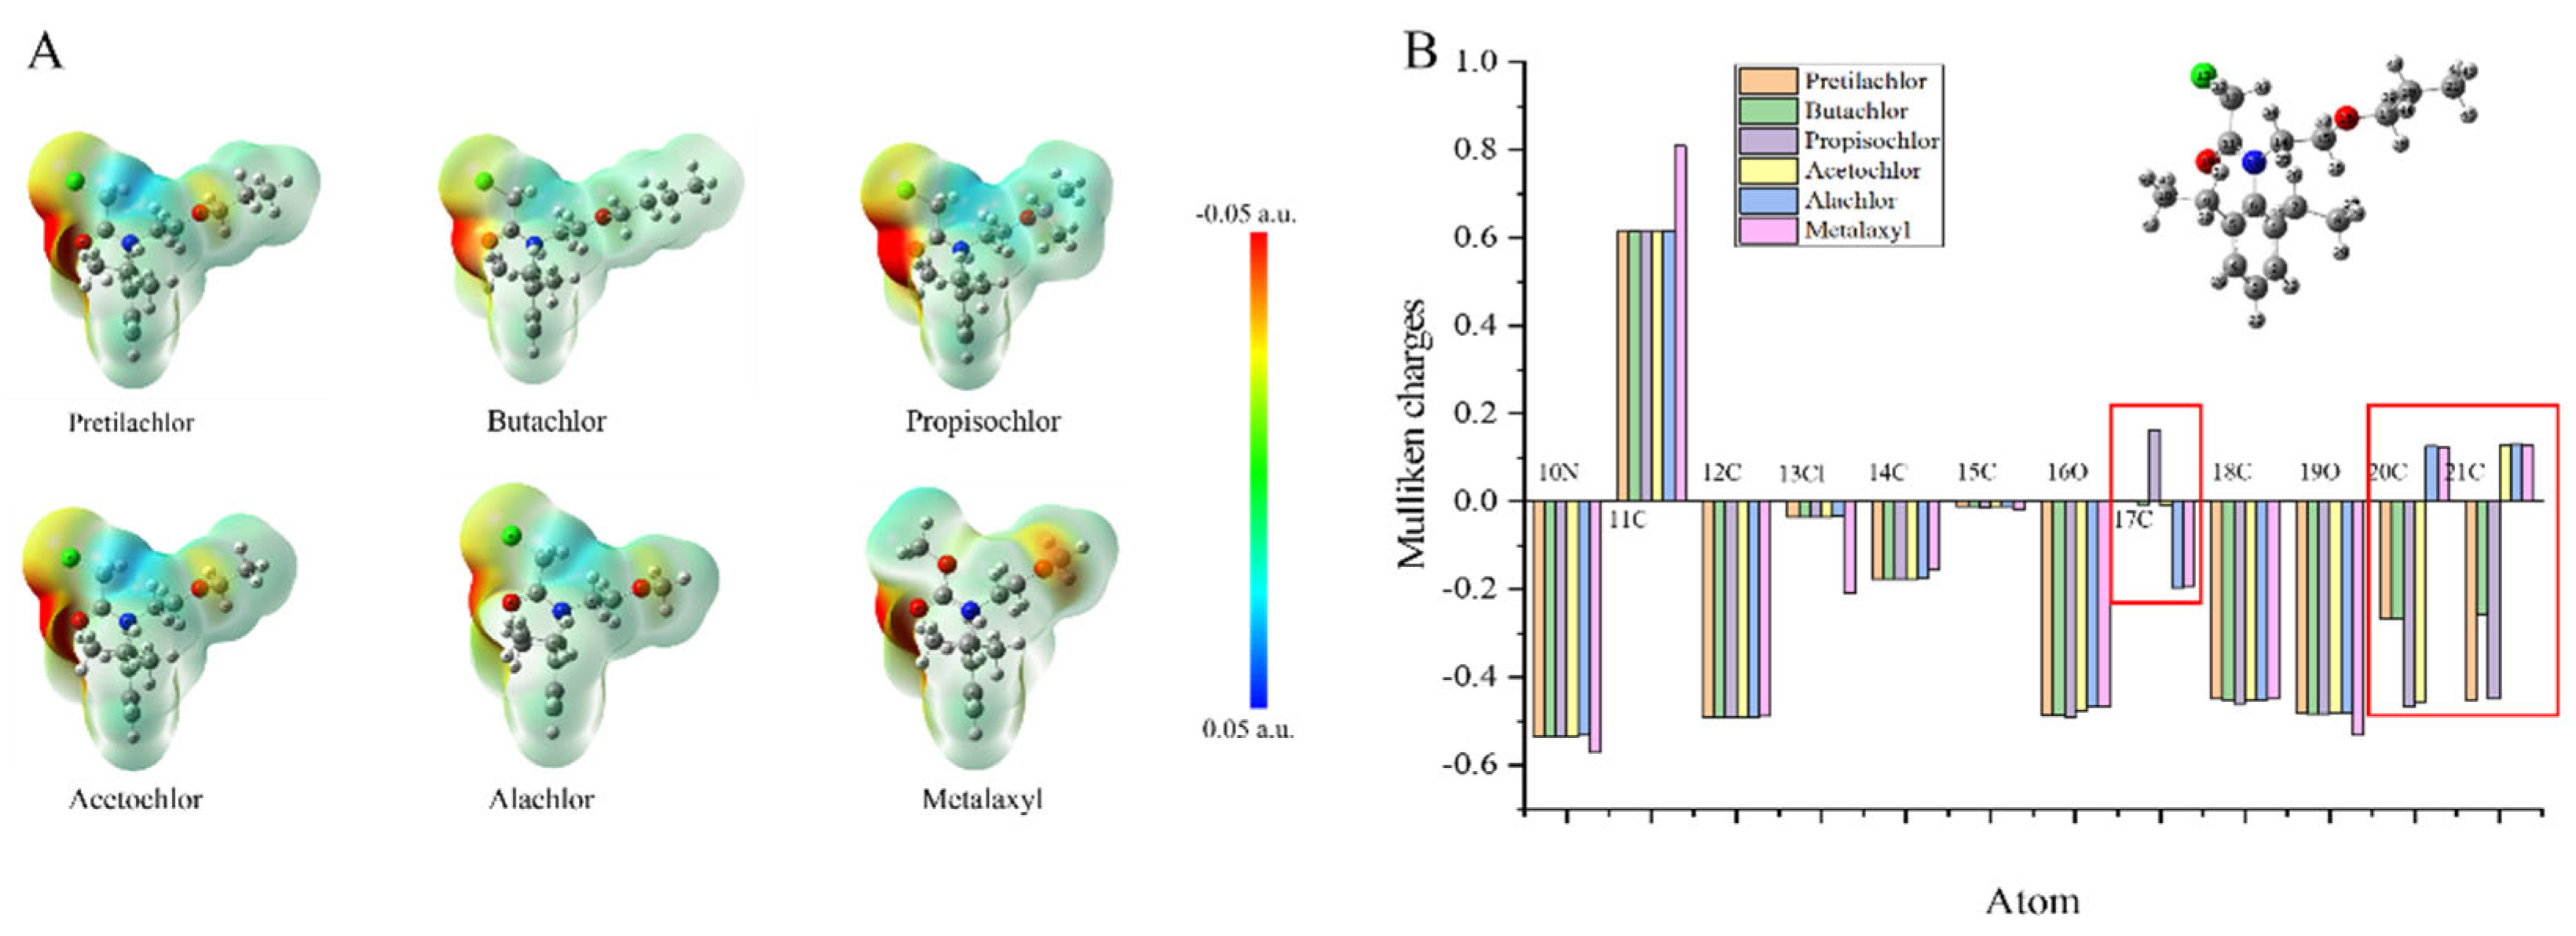
Figure 7.
Comparison of ic-ELISA and HPLC for the detection of PR (Lake water).
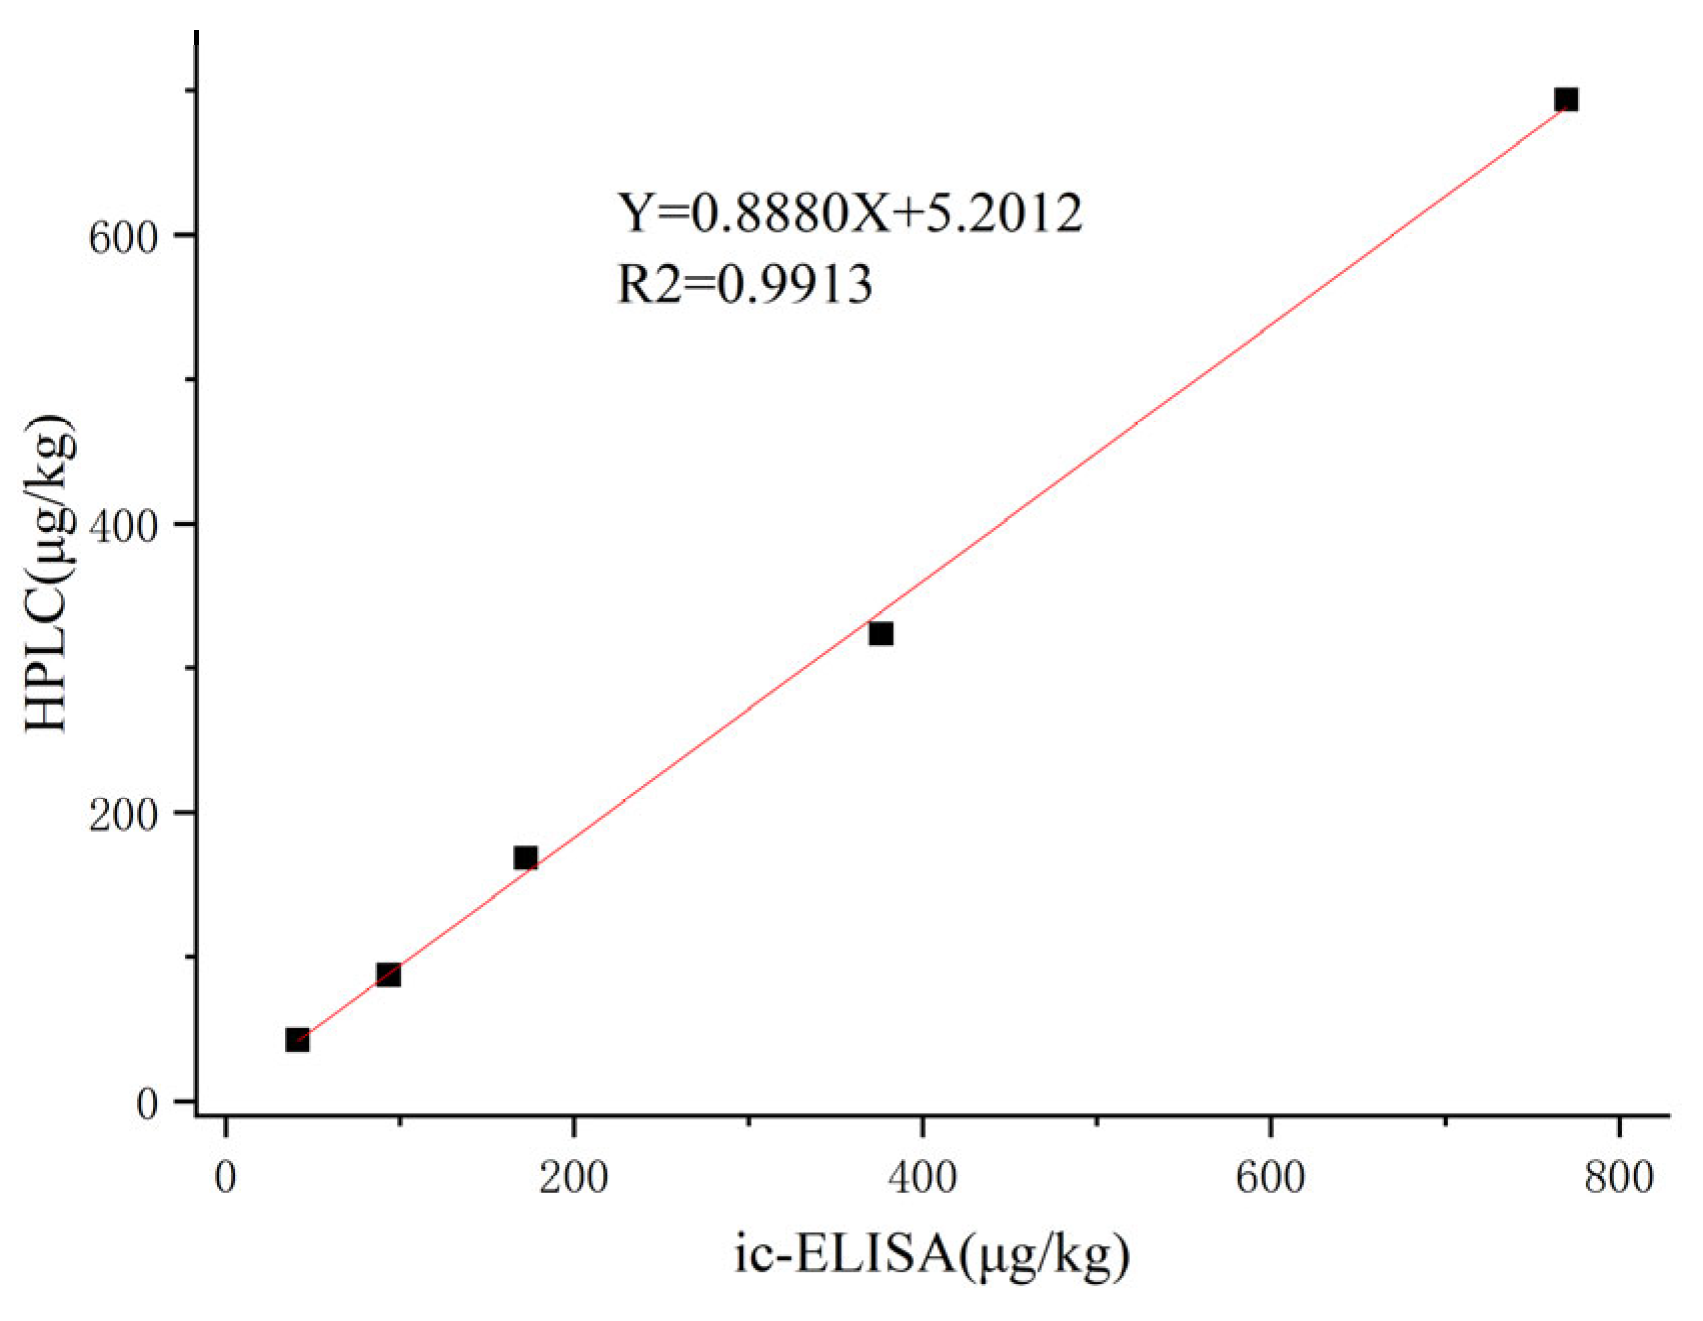

Table 1.
Cross-reactivity of PR/114 antibody to chloroacetamide herbicides.
| Chloroacetamide herbicides | Structure | IC50(μg/L) | Cross-reactivity(%) |
|---|---|---|---|
| PR | 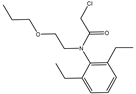 |
31.47 | 100 |
| Alachlor | 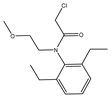 |
>3000 | <1 |
| Acetochlor | 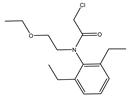 |
>3000 | <1 |
| Propisochlor | 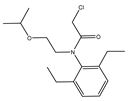 |
1541 | 2.0 |
| Butachlor | 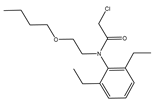 |
>3000 | <1 |
| Metalaxyl | 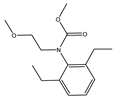 |
1927 | 1.6 |
Table 2.
The recovery rate of PR in 3 samples.
| Samples | LOD (μg/L) | LOQ (μg/ L) |
Spiked (µg/L) | Recovery (C± SD, %, n=15) | Coefficient of Variation (CV) (%, n=15) |
|---|---|---|---|---|---|
| Lake water | 4.83 | 10.13 | 10.00 | 89.7±8.3 | 9.3 |
| 20.00 | 85.9±7.0 | 8.1 | |||
| 40.00 | 83.9±8.0 | 9.5 | |||
| Rice | 3.04 | 5.68 | 10.00 | 81.3±2.5 | 3.1 |
| 20.00 | 91.3±3.0 | 3.3 | |||
| 40.00 | 78.3±2.3 | 2.9 | |||
| Soil | 2.37 | 4.46 | 10.00 | 86.5±4.2 | 4.8 |
| 20.00 | 84.4±2.3 | 2.7 | |||
| 40.00 | 86.6±4.3 | 5.0 |
Table 3.
Results of ic-ELISA and LC-MS/MS assay (Lake water).
| Spiked(μg/kg) | ic-ELISA (n=5,μg/kg) |
ic-ELISA Recovery (%) | LC-MS/MS (n=5,μg/kg) |
LC-MS/MS Recovery (%) |
|---|---|---|---|---|
| 50 | 41.22 | 82.4 | 42.39 | 84.8 |
| 100 | 93.45 | 93.5 | 87.48 | 87.5 |
| 200 | 172.33 | 86.2 | 168.43 | 84.2 |
| 400 | 376.22 | 94.1 | 323.92 | 81.0 |
| 800 | 769.53 | 96.2 | 693.82 | 86.7 |
Disclaimer/Publisher’s Note: The statements, opinions and data contained in all publications are solely those of the individual author(s) and contributor(s) and not of MDPI and/or the editor(s). MDPI and/or the editor(s) disclaim responsibility for any injury to people or property resulting from any ideas, methods, instructions or products referred to in the content. |
© 2023 by the authors. Licensee MDPI, Basel, Switzerland. This article is an open access article distributed under the terms and conditions of the Creative Commons Attribution (CC BY) license (http://creativecommons.org/licenses/by/4.0/).
Copyright: This open access article is published under a Creative Commons CC BY 4.0 license, which permit the free download, distribution, and reuse, provided that the author and preprint are cited in any reuse.


