Submitted:
20 November 2023
Posted:
22 November 2023
You are already at the latest version
Abstract
It remains unclear in the literature what is the cause of the so-called alkali-carbonate reaction (ACR) damage to concrete yet, a consensus is reached when considering dedolimitization as non-expansive. However, expansion and cracks as distress features are often attributed to alkali-silica reaction (ASR) when evidence of a reactive mineral is found in the aggregate. Evidently, different types of aggregates may produce different types and degrees of damage. Therefore, this work aims to assess the damage to concrete generated and propagated by the so-called ACR susceptible reactive Kingston coarse aggregate through mechanical testing (i.e., direct shear test), microscopy (the damage rating index – DRI), and other techniques. Distinct induced expansion levels (i.e., 0%, 0.05%, 0.12%, and 0.20%) were selected to compare the distress caused by ACR to concrete affected by ASR. Result show that the behaviour of ACR, namely as captured through the DRI, is inconsistent with that of ASR thus attesting to ACR being a distinct distress mechanism.
Keywords:
alkali-aggregate reaction
; alkali-carbonate reaction
; internal swelling reaction
; multi-level assessment
; damage rating index
; semi-quantitative microscopy
Introduction
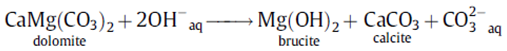
Alkali-aggregate reaction (AAR) is a harmful distress mechanism in concrete resulting in the reduction of its performance leading towards a shortened service life. AAR can be divided into two main types of mechanisms such as alkali-silica reaction (ASR) and the so-called alkali-carbonate reaction (ACR), the former of which is more widely spread and understood. However, ACR in concrete presents many challenges since the mechanism of expansion and deterioration is not yet fully understood. In ASR-affected concrete, cracks begin within the aggregate and extend into the cement paste as the expansion increases [1]. On the other hand, ACR-affected concrete is subjected to dedolomitization which turns the dolomite into brucite and calcite (equation 1). ACR was therefore be characterized by dark rims on the aggregate’s boundary (also visible in ASR-affected concrete) and a white carbonate halo around the aggregate in the cement paste (Figure 1a). However, these features are said to not cause expansion nor expansion related cracks [2] while it is believed that the mechanism causing cracks in such concrete is the presence of ASR gel [2,3]. Dedolomitization (Figure 1b) is considered as a harmless process by some researchers [2,4] although the so-called ACR can cause expansion [5]. Nevertheless, the reactivity and type of distress differs per aggregate type and even among rock beds.
In a previous study by Sanchez et al. [7] evaluating the use of the multi-level assessment in which the mechanical property losses along with the microscopic description of the damage is combined towards the overall determination of the cause and extent of the damage. As such, the damage rating index (DRI) for various types of AAR-reactive aggregates, it was found that the so-called ACR susceptible reactive aggregate from Kingston, Ontario produced a completely different cracking behaviour and pattern when compared to ASR-reactive aggregate. Therefore, it is unclear whether ASR is the only mechanism responsible for such behaviour. Yet, it was found that some mechanical property losses in the so-called ACR-affected concrete are in accordance with losses observed in ASR-affected concrete which will be presented in the results section. Nevertheless, the DRI is semi-quantitative microscopy tool that uses a stereomicroscope at 15-16x magnification while the petrographer/operator counts petrographic/distress features in the field of view of 1 cm by 1 cm on the surface of a polished/reflective concrete section (Figure 2). The DRI was developed to establish areas of relative damage in a structure (i.e., a dam affected by ASR) based on the counted features thus producing a semi-quantitative evaluation of the damage [8]. Each feature count is multiplied by a weighting factor that represents the importance of the petrographic/distress feature towards the overall observable/measurable damage. The sum of all counts is normalized to 100 cm2 for comparative purposes and account for differences in core/specimen sizes. Due to the various types of feature counts, bar charts can be generated to visualize the importance of certain features. The original method was used namely as a petrographic tool [8,9,10,11] however, further developments attest to the DRI’s engineering capabilities by relating mechanical properties to the observed counts when using the weighting factors that provide the least variability [7,12,13,14,15].
This work therefore aims to compare the distress mechanism of concrete made with Kingston coarse aggregate to ASR-affected concrete through the crack generation and propagation to better understand the so-called ACR affected concrete and its influence on the mechanical property losses.
Scope of the Work
This work aims to provide preliminary results of a study on the damage generation of AAR affected concrete made with the Kingston, Ontario reactive aggregate. In the current literature, it is not yet well understood whether expansion and damage in concrete affected by the so-called ACR is a result of ASR or other mechanism related to the dedolomitization. Therefore, in this study, concrete made with the Kingston reactive coarse aggregate will be evaluated mechanically, microscopically and through other techniques at distinct expansion levels (i.e., 0%, 0.05%, 0.12%, and 0.20%) to understand the damage generated as a function of the expansion level when compared to ASR-affected concrete.
Materials and Methods
3.Concrete specimen manufacturing and monitoring
A total of sixty cylindrical (i.e., 10 cm in diameter by 20 cm in length) concrete specimens were manufactured in a laboratory using ACR reactive coarse aggregate from Kingston, Ontario combined with a local non-reactive fine aggregate (Table 1). The mixture proportions followed those of the concrete prism test (CPT) as per ASTM C1293 using a Type 1 GU cement (i.e., 0.86% Na2Oeq) at 420 kg/m3 and a water to cement ratio of 0.45 (Table 2). The total alkali content of the concrete mixture was raised to 5.25 kg/m3 and 1.25% Na2Oeq. by cement mass using reagent grade NaOH to accelerate the reaction. After fabrication, the concrete specimens were left to moist cure for 24h (i.e., 100% RH and 20°C) after which the specimens were demoulded. Stainless steel studs were then installed in both ends of the specimens where holes (i.e., 8.5 mm in diameter and 19 mm in length) were drilled using a press drill equipped with a masonry drill bit. The studs were fastened using a quick-setting cement paste slurry and the concrete specimens were left to cure for an additional 24h in the same aforementioned conditions. The initial zero readings were then taken using a digital micrometer and specimens stored in conditions enabling the reaction (i.e., 100% RH and 38°C). Length change measurements were taken periodically to monitor the expansion over time.
3.Mechanical testing: Direct shear resistance test
The direct shear resistance of the concrete specimens was captured using the set-up proposed by [18] and more recently adapted to evaluate the effect of AAR with respect to the expansion level achieved [19,20]. Specimens were circumferentially cut at a depth of 21 mm [18] using a masonry saw equipped with a notched diamond blade resulting in a notch width equal to the blade’s width of 5 mm which ensures the maximum resistance hence, a wider notch results in a lower resistance. The applied loading rate was selected to be 100 N/s since rates lower than this value does not influence the shear resistance whereas faster loading rates resulted in an increase in the shear strength. The apparatus used is shown in Figure 3 and the maximum force at which the concrete specimen fails is converted into shear resistance using equation 2, as follows:
where P is the failure load (N), is the diameter of the cylinder (mm), and a is the depth of the notch (mm).
3.Microscopy: The damage rating index (DRI)
The DRI was performed on the affected concrete specimens which were cut in half longitudinally in one motion using a masonry saw equipped with a notched diamond blade to reduce the amount heat generated and water used as a coolant. The flat surfaces were ground and polished using a mechanically rotating polishing table and magnetic laps from coarse to fine grits of 30, 60, 140, 280 (80–100 μm), 600 (20–40 μm), 1200 (10–20 μm) and 3000 (4–8 μm). Between each lap, the specimens were cleaned from loose debris then dried with compressed air to remove loose particles from the surface and avoid excessive scratching of the reflective surface. A 3D printed grid with squares of 1 cm by 1 cm was placed on the reflective surface and each square was evaluated using a stereomicroscope at 16x magnification (i.e., field of view of the 1cm2) by counting the observed distress features in the form of cracks. Weighting factors were then applied to the types of distress features encountered (Table 3) which were selected based on their influence on the concrete’s properties where cracks in the cement paste have a higher weighting factor due to the severity of such distress. A lower weighting factor is attributed to features that least represent damage meanwhile higher weighting factors represent more advanced stages of damage and significant losses in mechanical responses. The sum of all weighted counts is then normalized to 100 cm2 providing the DRI number (equation 3). More than 100 cm2 per specimen was evaluated to ensure that the DRI result is statistically significant which will be graphically illustrated with the results.
3.Other techniques: Apparent posority
The apparent porosity can be described as the open capillary voids/pores within the concrete in which a liquid can intrude while under pressure. The apparent porosity was determined using the Archimedes immersion method as described by De Grazia et al. [22] and calculated using equation 3.
First, the concrete specimens are cut into three equal disks using a masonry saw equipped with a notched diamond blade and washed to remove any remaining debris. The initial mass of the disks is recorded, and the disks are placed in an oven at 60°C until they are dried at a constant mass, mD. The disks are immersed into a water bath equipped with a vacuum pump and the lid sealed to ensure the pressure remains constant. The pump is turned on for 3 minutes or until all air has been removed from the concrete disks (bubbling has ceased) and left to submerge into the vacuum sealed water bath for 24h. The mass in SSD condition, mSSD, is achieved by removing the concrete disks from the water bath and drying the surface with a dry cloth after which the disks are placed in the submerged balance to record the submerged mass, mSub.
Results
4.AAR expansion over time
The average expansion as a function of time is shown in Figure 4 where an increase in the expansion is observed overall. The data range bars represent the minimum and maximum achieved values at a given time and the standard deviation for all measurements ranges from 0.021% to 0.035%. An expansion level of 0.05% is achieved at 27 days while 43 days is observed to produce an expansion level of 0.12%. Interestingly, a plateau is reached between 217 and 328 days at 0.23% of expansion after which an increase is followed reaching 0.27% after 546 days.
4.Shear resistance loss
The direct shear resistance is shown in Figure 5 where a slight loss of shear resistance is observed at 0.05% of expansion from initially 5.35 MPa to 4.18 MPa after which the shear resistance increases at a constant linear rate up to 4.53 MPa at 0.20% of expansion. However, by visual comparison of the data range bars, the difference between the tests for each expansion level is not evident (extremities overlapping). This is further verified in a one-way ANOVA which shows that there isn’t a significant difference between the expansion levels (Table 4).
4.The damage rating index (DRI)
The damage rating index (DRI) was selected as a tool to quantify the damage features observed at a scale representative of the affected material. Figure 6a,b illustrates the comparison in the DRI numbers and weighted proportions while Figure 6c,d shows the extended version of the DRI as per [1,7]obtained in this study. For simplicity, the legend for the bar chart (Figure 6a) only shows the features that were observed in this study (CCA, OCA, and CCP). Traces (less than 1%) of products were observed however, the distinction between polishing residue and a reaction product couldn’t be made. Two specimens were evaluated per expansion levels however, the second specimen (labeled as “_2”) was evaluated only after the first specimens (labeled as “_1”). The decision to test a second specimen was made upon observing inconsistencies in the crack generation and propagation with reference to the expansion level. As such, the second specimens were stored for a longer period of time (i.e., 12℃) which is considered as efficiently capable of mitigating ASR damage [7]. Indeed, this mitigation was not effective for concrete affected by ACR which can be further observed in [7] where a non-negligeable DRI number is observed for specimens considered as sound made with the Kingston reactive aggregate.
At 0.05% of expansion (DRI numbers of 316 and 779) , sharp cracks are present within the aggregate as both closed and opened, which is in accordance with [1]. A large portion of cracks in the cement paste (CCP) however are observed which is considered as abnormal for a concrete affected by ASR (from 58-78%). However, at 0.05% of expansion, the cracks in the cement paste and the cracks in the aggregate are not necessarily linked to one another indicating that two mechanisms may be occurring and merits further analysis. At 0.12% of expansion (DRI numbers of 478 and 634), an increase is observed namely for the cracks in the cement paste whereas open cracks in the aggregates remain similar (from 13-17% of the total contributions towards the DRI calculation). At 0.20% of expansion (DRI numbers of 336 and 708), no significant increase in the open cracks in the aggregate is observed (from 17-25%) with the greater portion of cracks being in the cement paste.
Another approach to visualizing the crack counts by adopting the concept of the extended version of the DRI as proposed by [1,7] is illustrated in Figure 7 in which the bars represent the features’ counts. Uncertainty bars of ±10% are further added to these counts to consider operator variability and further differentiate the results. In both cases for the 0.05% expansion level, the closed cracks in the aggregates (CCA) are similar (207 and 205 counts/100 cm2) as observed by the overlapping means. However, these counts decrease for the two other expansion levels. Interestingly, the counts of the cracks in the cement paste (CCP) are very similar for each of the specimens labeled as “2”, which is the specimen that was conserved and later tested (i.e., 198, 174, 183 counts/100 cm2 for expansions of 0.05%, 0.12% and 0.20%, respectively).
4.Apparent porosity
Figure 8a and b show the apparent porosity and absorption, respectively, of the affected concrete with respect to the expansion level achieved. Interestingly, both decrease as a function of expansion where the apparent porosity for a sound concrete (assuming that AAR was inhibited when stored at 12°C for 47 days) is 9% and linearly decreases to 6.3% at 0.20% of expansion. The same trend is indeed observed for the absorption where the absorption decreases as a function of expansion.
Through a one-way ANOVA, it is determined that there is a significant difference between the expansion levels while using the porosity measurements to compare the results (Table 5).
Discussion
5.What does the multi-level assessment reveal about damage due to ACR?
A summary from [7] is shown in Table 6 and Figure 9 illustrates those results to depict ACR-affected concrete in comparison to ASR-affected concrete as captured through the multi-level assessment. In general, the ACR-affected concrete shows a similar mechanical behaviour to ASR-affected concrete as for each case, (Figure 9a–e) the results from the concrete made with the reactive Kingston aggregate falls within the range of expected values per expansion level. However, the DRI number as a function of expansion (Figure 9f) shows that the Kingston aggregate concrete is above the range thus, highlighting its abnormality when compared to ASR-affected concrete.
Figure 9a,b shows the compressive and tensile strength reductions as a function of expansion, respectively. The compressive strength reduces at a relatively constant rate up to 35% at 0.30% of expansion while the tensile strength is mostly lost at the beginning of the expansion where a drop of 45% is observed at 0.05% of expansion. Noticeably, the loss in tensile strength is greatest at 0.20% of expansion yet, the largest difference is between 0% and 0.05% of expansion.
Figure 9c, d and e show the SDT outputs as modulus of elasticity reductions, SDI, and PDI as a function of expansion, respectively. The SDI values increase with expansion in a concave shape where values between 0.13 and 0.25 are obtained from 0% to 0.30% of expansion. The PDI values are somewhat more linear as a function of expansion with the exception of the PDI at 0.05% of expansion being close to that at 0.12% of expansion (i.e., 0.15 and 0.17, respectively). Moreover, the greatest loss in modulus of elasticity is observed at 0.20% at 43% reduction.
The DRI values for the Kingston aggregate concrete per expansion level (i.e., 0%, 0.05%, 0.12%, and 0.20%) is above the range of values obtained for concrete affected by ASR, even at 0% of expansion (i.e., DRI of 350). When observing the results from [7], one notices that at 0% of expansion, a large portion of cracks in the cement paste has been generated, indicating that there is a mechanism affecting the concrete while being stored at 12°C (previously verified to inhibit ASR damage [7]. The difference therefore observed in this current study and that of [7] are likely due to the storage conditions unable to supress ACR damage since time intervals between original storage conditions (i.e., 38℃ and 100 % relative humidity) and with the storage at 12°C until testing occurred could have significantly varied. Both studies used the same aggregate (from the same storage) and proportions of mixtures. Nevertheless, it is recommended that a time-based approach is used when assessing concrete affected by ACR due to these differences in results.
In a previous study evaluating the ability of the direct shear test in capturing damage due to AAR, a range of values for the shear strength reduction was determined per expansion level [19]. Figure 10 illustrates that the Kingston reactive coarse aggregate continues to present a distinct behaviour. As aforementioned, the direct shear test did not highlight significant differences between the expansion levels in this study. The direct shear test however, measures the concrete’s ability to resist to a sliding action between two surfaces. For ASR-affected concrete, the aggregate interlock is diminished since ASR propagates from within the aggregates. Based on the results from the DRI, ACR-affected concrete produces a larger portion of cracks in the cement paste which does not necessarily affect the aggregate interlock of the concrete.
5.Common ACR features and physical property
An abundance of micrographs and images depicting alkali-silica reaction (ASR), the most commonly studied and encountered form of AAR, has been shown in the literature however, since ACR is a less understood mechanism, its appearance under a stereomicroscope at 15-16x magnification can likely help to distinguish ACR features from others should they be present in concrete under analysis through the DRI. This section therefore aims to present some of the frequently observed features that may indicate damage due to ACR. It is important to note that the analysis used to collect the data towards the DRI calculation allows the operator to visualize the spread of the damage at a scale most representative of the affected material when an internal swelling reaction occurs.
At 0.05% of expansion, evidence of ACR was observed through carbonate halos where a white deposit was seen at the aggregate boundary (Figure 11a). Likewise, the ACR signatures became more prominent at 0.12% of expansion (Figure 11b) with more frequent carbonate halo observations and cracks in the aggregate-paste interface linking open cracks in the aggregates to each other through the cement paste. Figure 11c shows a crack in the aggregate-paste interface where a halo is also observed while to association to cracks in the aggregate are observed. At 0.20% of expansion (Figure 11d), cracks in the aggregate are propagating from the aggregate to the cement paste with a white discolouration at the sides of the cracks which was observed in Locati et al. [24]. Interestingly, the cracks in the cement paste also showing the white edges along the crack with some slight white discolouration in the open crack. Cracks in the aggregate-paste interface are more often observed as well as in the bulk cement paste with and without association to the cracks in the aggregate (Figure 11e,f). Moreover, cracks appear wider as the expansion increases. Cracks generated in the aggregate appear empty from any residue indicating expansion from such cracks.
The apparent porosity presented an interesting behaviour when compared to the porosity taken from an ASR-reactive coarse aggregate (i.e., Springhill – Greywacke) where the porosity tends to increase with expansion for ASR-affected concrete [23] while a decrease is observed for the Kingston aggregate concrete. It is possible that the carbonate halo decreases the apparent porosity of the concrete, which is observed when concrete is subjected to carbonation by calcite filling the pores, yet, due to calcite’s increase in volume of 12% [25] and may further explain why cracks are observed in the interfacial transition zone (ITZ), which is known to be the weakest point of the concrete, resulting in the observed expansions and detachment. Further research however is necessary to confirm such phenomenon.
5.Sample size used for microscopy evaluation
Due to the reservations towards the use of the DRI as an objective method to measure damage, a plot illustrating the cumulative DRI as a function of the sample size (number of analyzed squares) is presented in Figure 12. This plot helps to establish the required surface area to be analyzed to obtain a representative sample. Generally, one may identify a sample as the number of physical specimens or cores tested. However, for an analysis in which features are counted, weighted and their relative proportions are compared, the area of analysis used to represent the overall captured damage must be established. The DRI therefore converges towards a mean after a certain number of squares analyzed. It is to be noted that this convergence refers to the “law of large numbers” and the sample size (n) at which the DRI converges differs for each test. Nevertheless, this plot serves as a starting point to objectify the DRI as a damage evaluation tool and provides some transparency in the results presentation.
Conclusions
This study showed that the Kingston aggregate concrete does not behave as purely an ASR-affected concrete when observing the cracking behaviour of the affected concrete and comparing the features as described at 16x magnification. It is evident that the influence of the so-called ACR is present in the concrete and differs from that of ASR since cracks are observed in the cement paste even before the concrete has begun to expand and are well abundant in low and moderate expansion levels which normally is not the case for ASR-affected concrete. The following highlights from this study are thus presented:
- The mechanical responses using the multi-level assessment conducted by [7] shows that the damage due to ACR is similar to that of ASR however, the DRI numbers as a function of expansion was found to be above the range of expected values.
- The direct shear test presented interesting results in which a loss was not captured throughout the expansion levels. This is likely due to the crack propagation being within the cement paste as opposed to within the aggregate therefore, less likely to affect the aggregate interlock when compared to ASR where cracks are generated and propagated from the aggregates.
- The apparent porosity showed a decrease with expansion which can be attributed to the carbonate halos further reducing the porosity in the aggregate-paste interface. These haloes were frequently observed through the stereomicroscope at 16x magnification along with cracking of the interface. A study is currently being conducted to better understand the role of the halos with respect to concrete deterioration.
- The direct shear test did not reveal differences between the expansion levels as confirmed with a one-way ANOVA while the porosity showed that the expansion levels were difference. This further highlights the complexity of ACR as a physical and chemical event. Moreover, the inability of the storage conditions normally used to mitigate ASR when applied to ACR requires further investigation.
- In an attempt to reduce subjectivity of the DRI analysis, the cumulative DRI graph helps to show transparency in a microscopy test when results are use in a quantitative purpose. This therefore allows the operator to achieve a converging result that can be considered as a representative sample.
Concrete affected by ACR is less widespread than that affected by ASR however, with the rise of new efficient and sustainable materials along with the unprecedented demand to build concrete infrastructure, it is imperative to provide practitioners with micrographs of concrete affected by ACR while using a readily available, practical, and accessible (low initial and operation cost) evaluation tool.
Author Contributions
Conceptualization, C.T. and L.F.M.S.; methodology, C.T.; validation, C.T. and L.F.M.S.; formal analysis, C.T.; investigation, C.T.; resources, L.F.M.S.; data curation, C.T.; writing—original draft preparation, C.T.; writing—review and editing, C.T. and L.F.M.S..; visualization, C.T.; supervision, L.F.M.S. All authors have read and agreed to the published version of the manuscript.
Funding
The authors acknowledge the financial support the prestigious Vanier scholarship funded by NSERC (Natural Sciences and Engineering Research Council of Canada) from which C. Trottier benefitted.
Acknowledgments
The authors would like to thank the graduate students from the µStructure Research Group at The University of Ottawa for the help on casting day, namely Olusola David Olajide.
Conflicts of Interest
The authors declare no conflict of interest.
References
- Sanchez, L.F.M.; Fournier, B.; Jolin, M.; Duchesne, J. Reliable Quantification of AAR Damage through Assessment of the Damage Rating Index (DRI). Cement and Concrete Research 2015, 67, 74–92. [CrossRef]
- Katayama, T. The So-Called Alkali-Carbonate Reaction (ACR) - Its Mineralogical and Geochemical Details, with Special Reference to ASR. Cement and Concrete Research 2010, 40, 643–675. [CrossRef]
- Grattan-Bellew, P.E.; Mitchell, L.D.; Margeson, J.; Min, D. Is Alkali-Carbonate Reaction Just a Variant of Alkali-Silica Reaction ACR = ASR? Cement and Concrete Research 2010, 40, 556–562. [CrossRef]
- Beyene, M.; Snyder, A.; Lee, R.J.; Blaszkiewicz, M. Alkali Silica Reaction (ASR) as a Root Cause of Distress in a Concrete Made from Alkali Carbonate Reaction (ACR) Potentially Susceptible Aggregates. Cement and Concrete Research 2013, 51, 85–95. [CrossRef]
- Chen, X.; Yang, B.; Mao, Z.; Deng, M. The Expansion Cracks of Dolomitic Aggregates Cured in TMAH Solution Caused by Alkali-Carbonate Reaction. Materials 2019, 12, 1–11. [CrossRef]
- Štukovnik, P.; Bosiljkov, V.B.; Marinšek, M. Detailed Investigation of ACR in Concrete with Silica-Free Dolomite Aggregate. Construction and Building Materials 2019, 216, 325–336. [CrossRef]
- Sanchez, L.F.M.; Fournier, B.; Jolin, M.; Mitchell, D.; Bastien, J. Overall Assessment of Alkali-Aggregate Reaction (AAR) in Concretes Presenting Different Strengths and Incorporating a Wide Range of Reactive Aggregate Types and Natures. Cement and Concrete Research 2017, 93, 17–31. [CrossRef]
- Grattan-Bellew, P.E.; Danay, A. Comparison of Laboratory and Field Evaluation of Alkali- Silica Reaction in Large Dams.; Collection / Collection : NRC Publications Archive / Archives des publications du CNRC, 1992; pp. 1–25.
- Sims, I.R.; Hunt, B.; Miglio, B. Quantifying Microscopical Examinations of Concrete for Alkali Aggregate Reactions (AAR) and Other Durability Aspects. In Proceedings of the Curability of Concrete; Toronto, Canada, 1992.
- Grattan-Bellew, P.E. Laboratory Evaluation of Alkali-Silica Reaction in Concrete from Saunders Generating Station. MJ 1995, 92. [CrossRef]
- Dunbar, P.A.; Grattan-Bellew, P.E. Results of Damage Rating Evaluation of Condition of Concrete from a Number of Structures Affected by AAR. In Proceedings of the CANMET/ACI International Workshop on Alkali-Aggregate Reactions in Concrete; 1995; pp. 257–265.
- Villeneuve, V. Détermination de l’endommagement du béton par méthode pétrographique quantitative. Master’s Thesis., Université Laval: Québec, QC, 2011.
- Sanchez, L.F.M.; Drimalas, T.; Fournier, B.; Mitchell, D.; Bastien, J. Comprehensive Damage Assessment in Concrete Affected by Different Internal Swelling Reaction (ISR) Mechanisms. Cement and Concrete Research 2018, 107, 284–303. [CrossRef]
- Sanchez, L.F.M.; Drimalas, T.; Fournier, B. Assessing Condition of Concrete Affected by Internal Swelling Reactions (ISR) through the Damage Rating Index (DRI). Cement 2020, 1–2, 100001. [CrossRef]
- Martin, R.-P.; Sanchez, L.; Fournier, B.; Toutlemonde, F. Evaluation of Different Techniques for the Diagnosis & Prognosis of Internal Swelling Reaction (ISR) Mechanisms in Concrete. Construction and Building Materials 2017, 156, 956–964. [CrossRef]
- Lu, D.; Fournier, B.; Grattan-Bellew, P.E.; Lu, Y.; Xu, Z.; Tang, M. Expansion Behaviour of Spratt and Pittsburg Limestones in Different Test Procedures. In Proceedings of the 13th International Conference on Alkali-Aggregate Reaction; Trondheim, Norway, 2008.
- Villeneuve, V.; Fournier, B. Determination of the Damage in Concrete Affected by ASR – the Damage Rating Index (DRI). In Proceedings of the 14th International Conference on Alkali-Aggregate Reaction; Texas, USA, 2012.
- Barr, B.; Hasso, E.B.D. Development of a Compact Cylindrical Shear Test Specimen. Journal of Materials Science Letters 1986, 5, 1305–1308. [CrossRef]
- De Souza, D.J.; Sanchez, L.F.M.; De Grazia, M.T. Evaluation of a Direct Shear Test Setup to Quantify AAR-Induced Expansion and Damage in Concrete. Construction and Building Materials 2019, 229, 116806. [CrossRef]
- Ziapour, R.; Trottier, C.; Zahedi, A.; Sanchez, L.F.M. Assessment of Effects of ASR-Induced Cracking on Direct Shear Strength of Recycled Concrete. materconstrucc 2022, 72, e280. [CrossRef]
- Villeneuve, V.; Fournier, B.; Duchesne, J. Determination of the Damage in Concrete Affected by ASR—the Damage Rating Index (DRI). In Proceedings of the Proceedings of the 14th International Conference on Alkali-Aggregate Reaction in Concrete (ICAAR); Austin, TX, 2012.
- T. de Grazia, M.; F. M. Sanchez, L.; C. O. Romano, R.; G. Pileggi, R. Investigation of the Use of Continuous Particle Packing Models (PPMs) on the Fresh and Hardened Properties of Low-Cement Concrete (LCC) Systems. Construction and Building Materials 2019, 195, 524–536. [CrossRef]
- de Grazia, M.T. Short and Long-Term Performance of Eco-Efficient Concrete Mixtures. Doctorate, University of Ottawa, 2022.
- Locati et al. 2014 - Dedolomitization and ASR in Low Expansive Marbles from the Province of Cordoba Argentina A Microstructural and Chemical Study.PDF.
- Houst, Y.F. Microstructural Changes of Hydrated Cement Paste Due to Carbonation. In Mechanisms of chemical degradation of cement-based systems; Scrivener, K.L., Young, J.F., Eds.; Taylor & Francis: London, 1997.
Figure 1.
The so-called ACR in concrete as represented by a) Katayama [2] with the inclusion of ASR and b) Štukovnik et al. [6] without ASR.
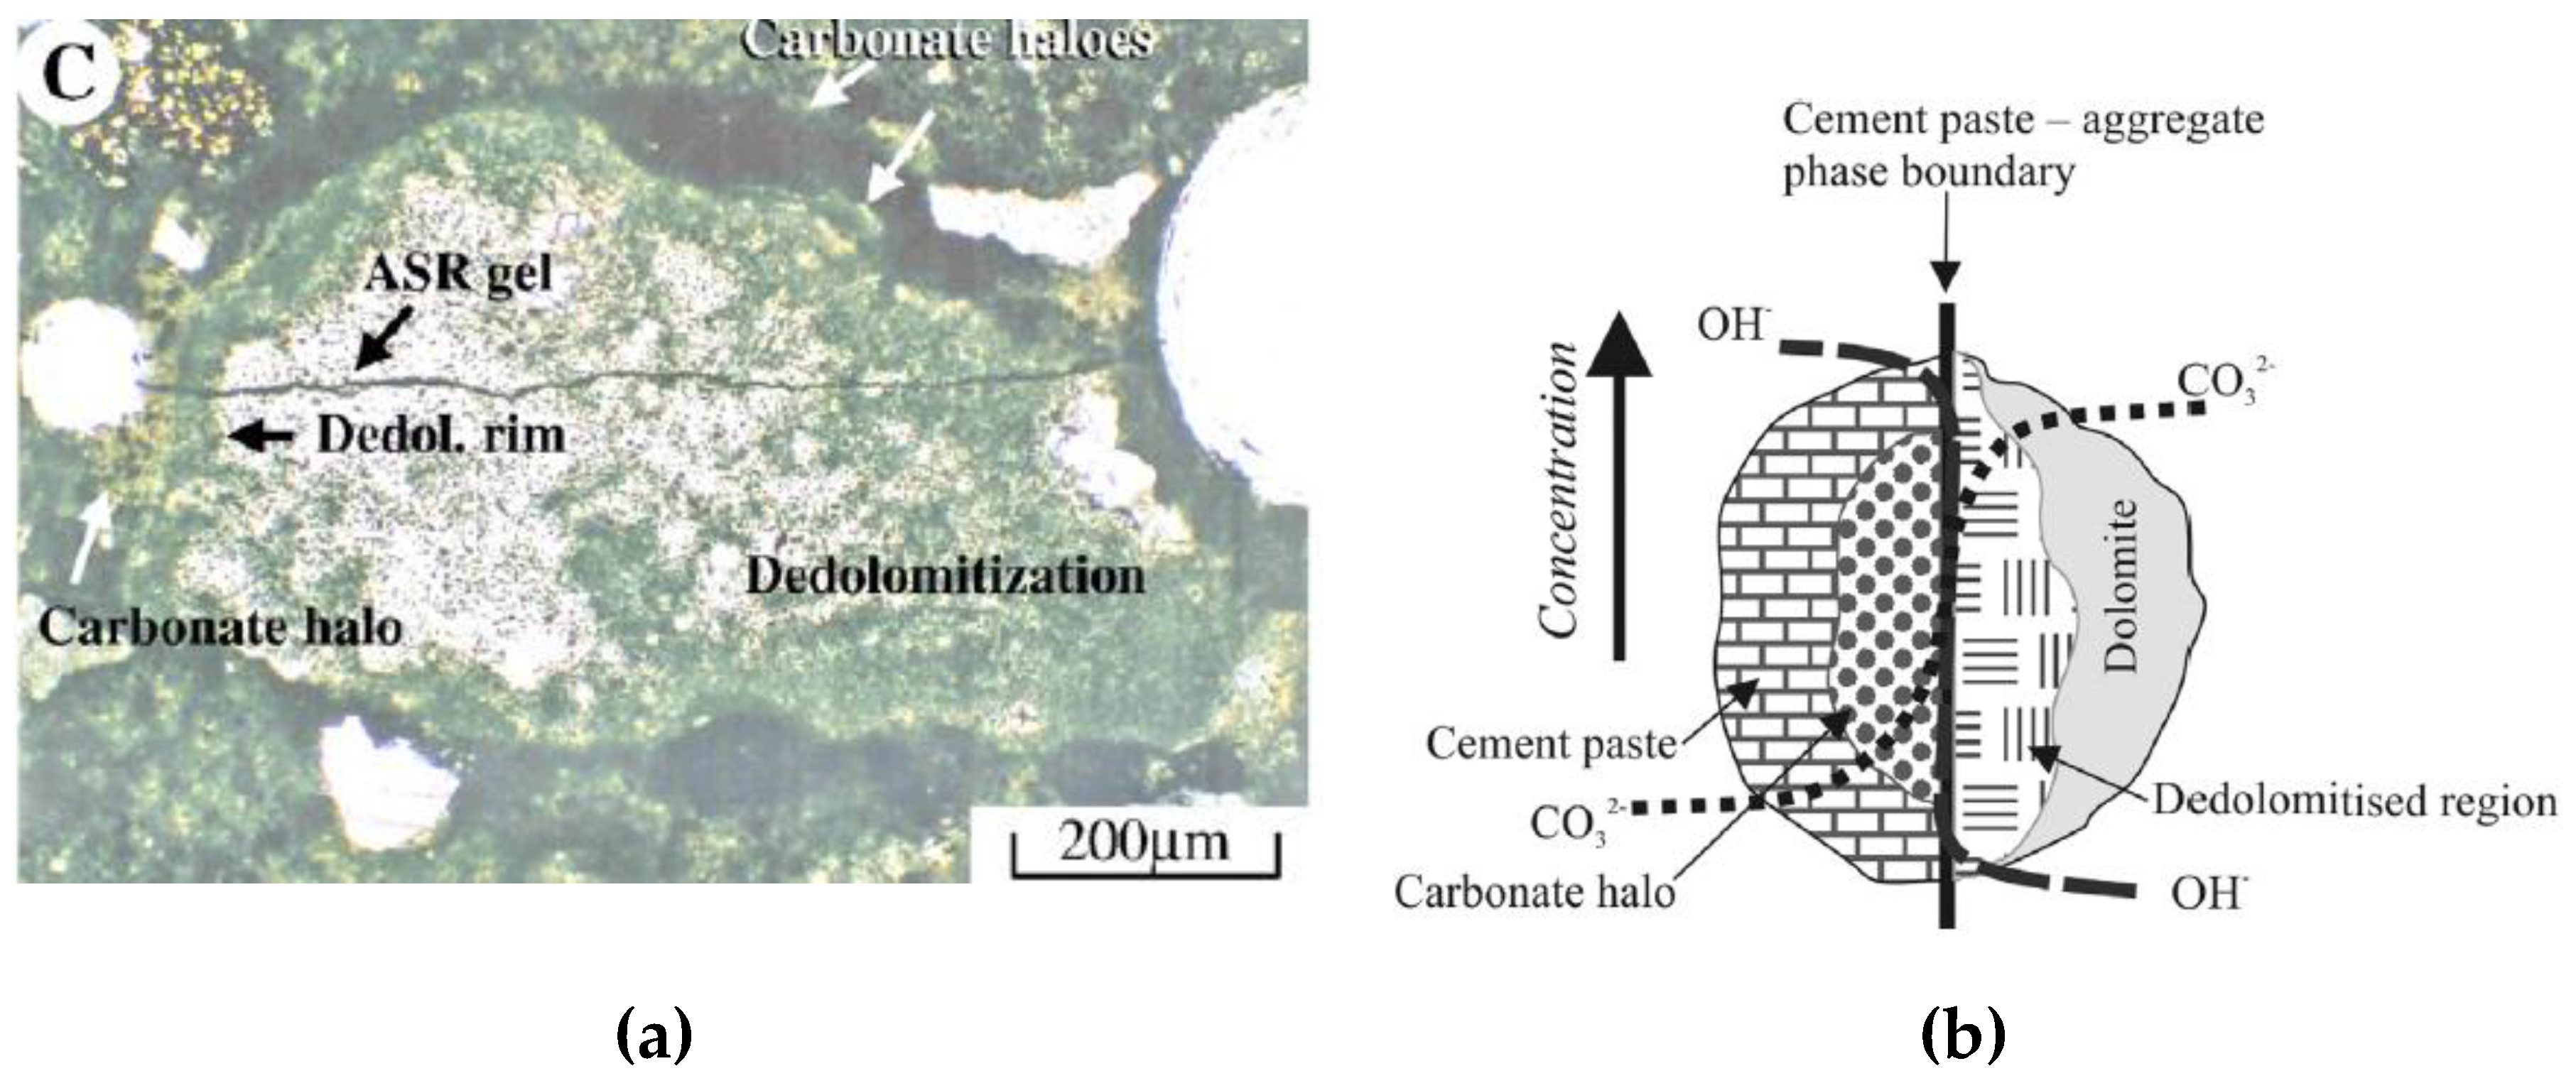
Figure 2.
Surface preparation for DRI analysis.
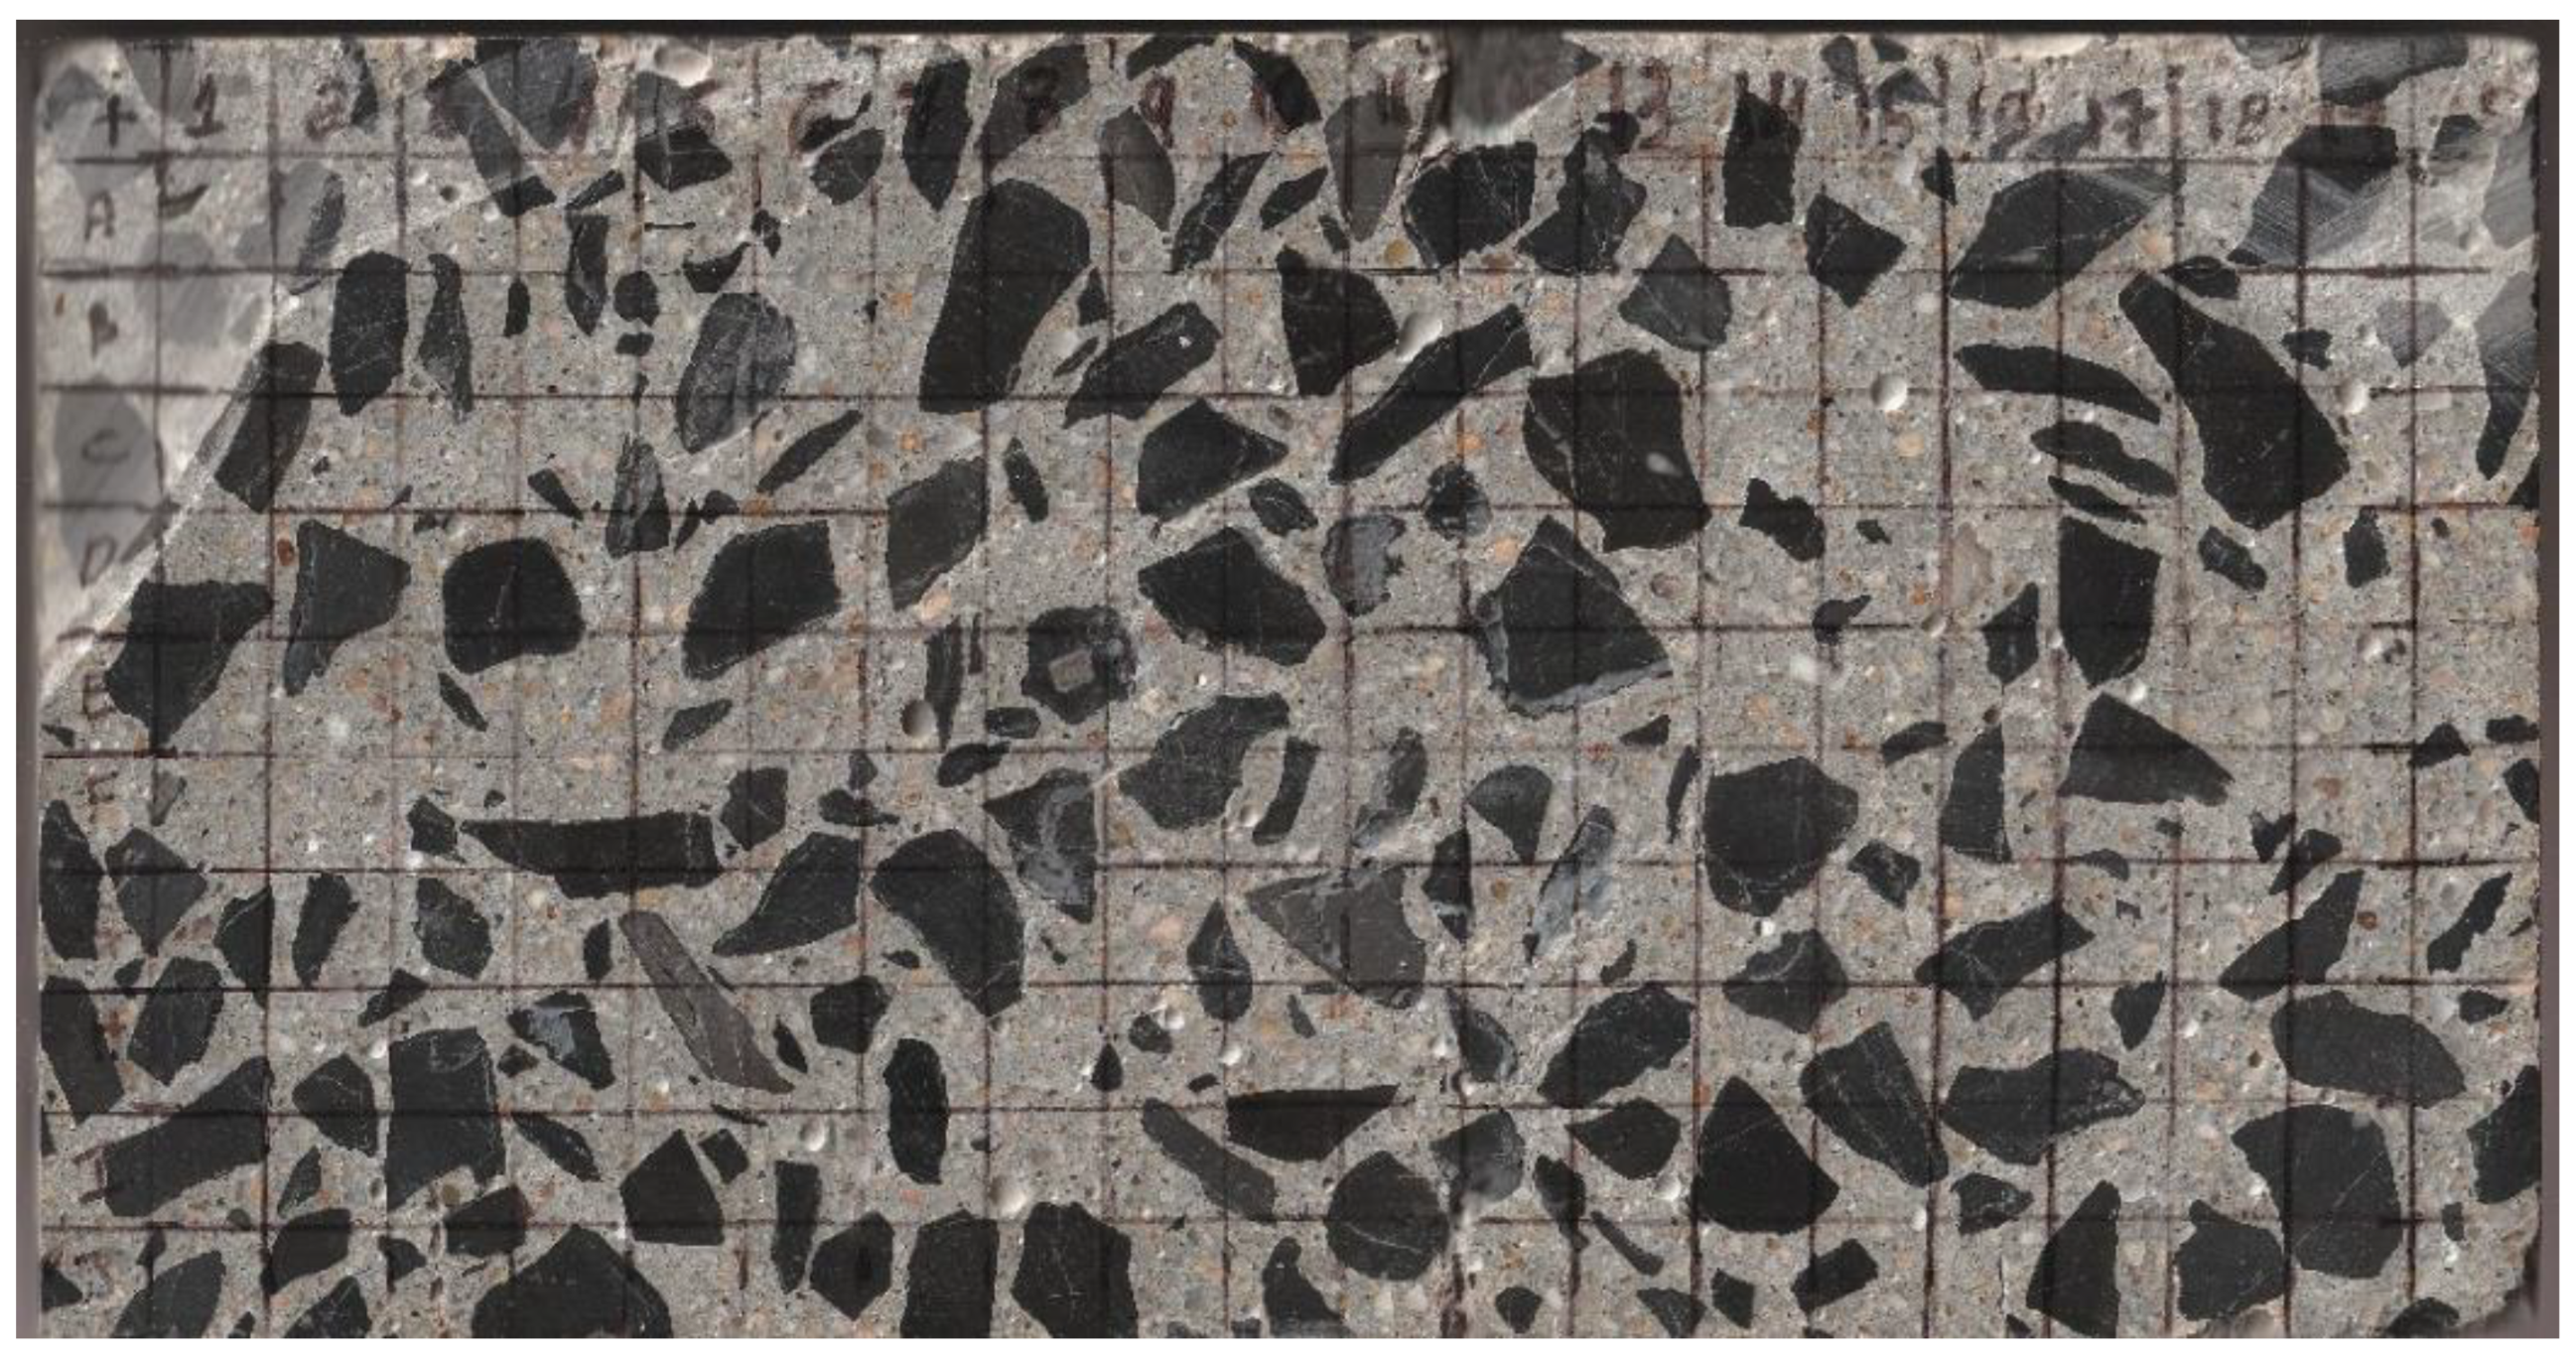
Figure 3.
Direct shear set-up.
Figure 4.
Expansion as a function of time.
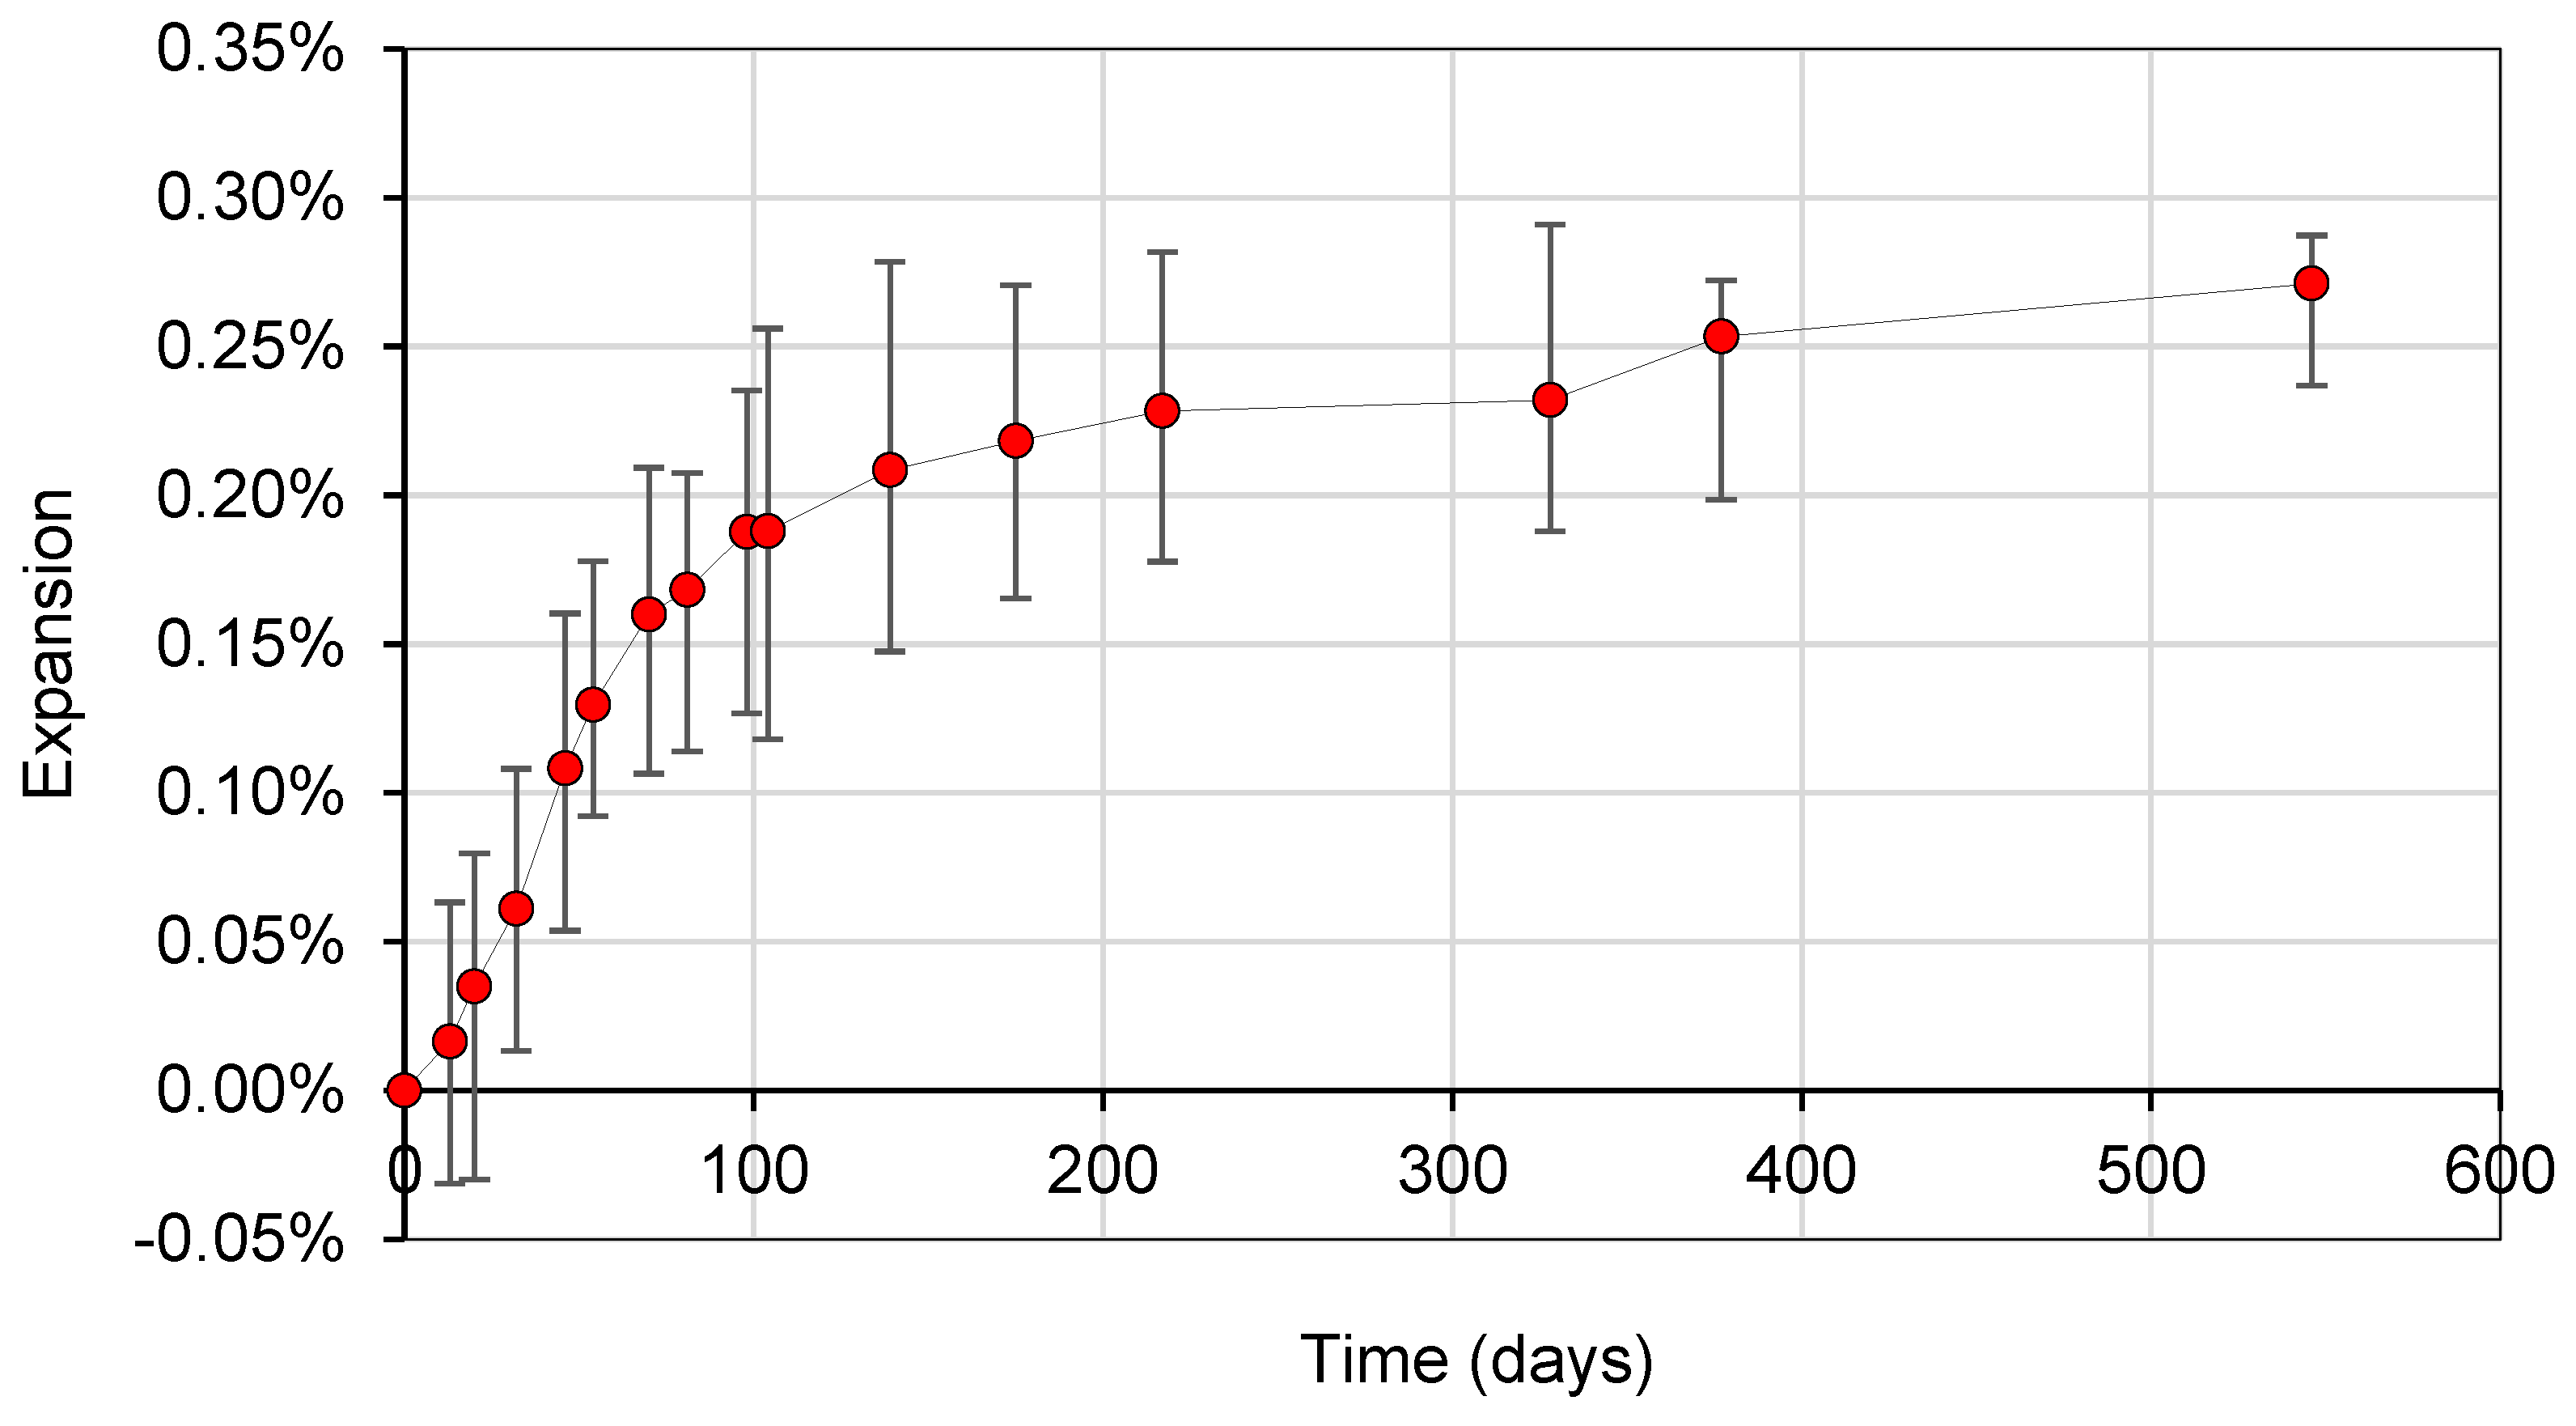
Figure 5.
Shear resistance per expansion level.
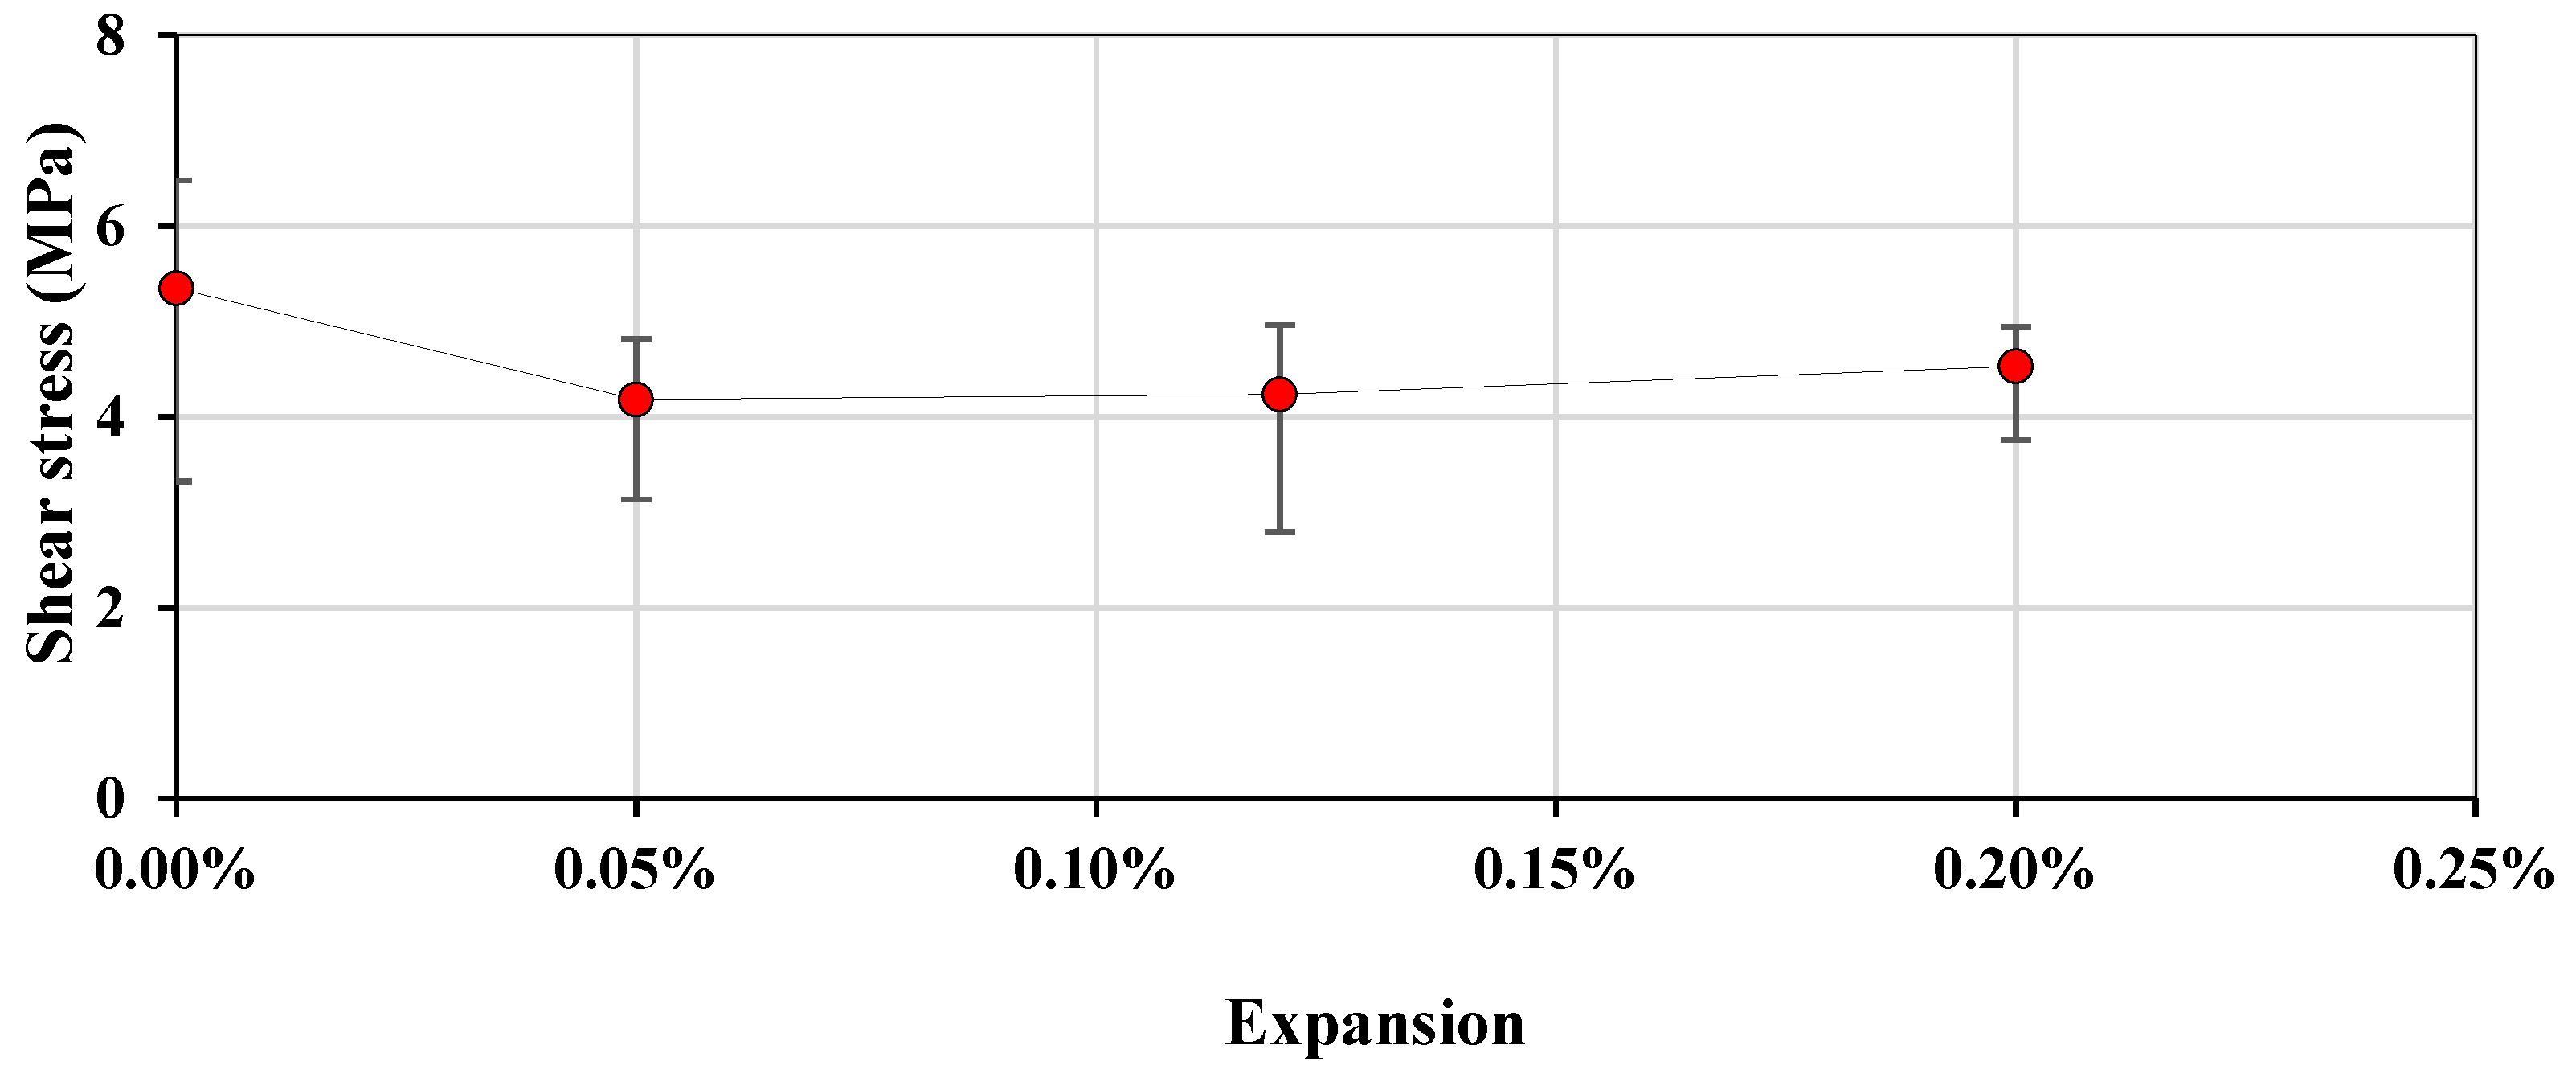
Figure 6.
DRI results presented as: (a) bar chart, (b) unweighted counts/100 cm2 and (c) unweighted counts as proportions.
Figure 6.
DRI results presented as: (a) bar chart, (b) unweighted counts/100 cm2 and (c) unweighted counts as proportions.
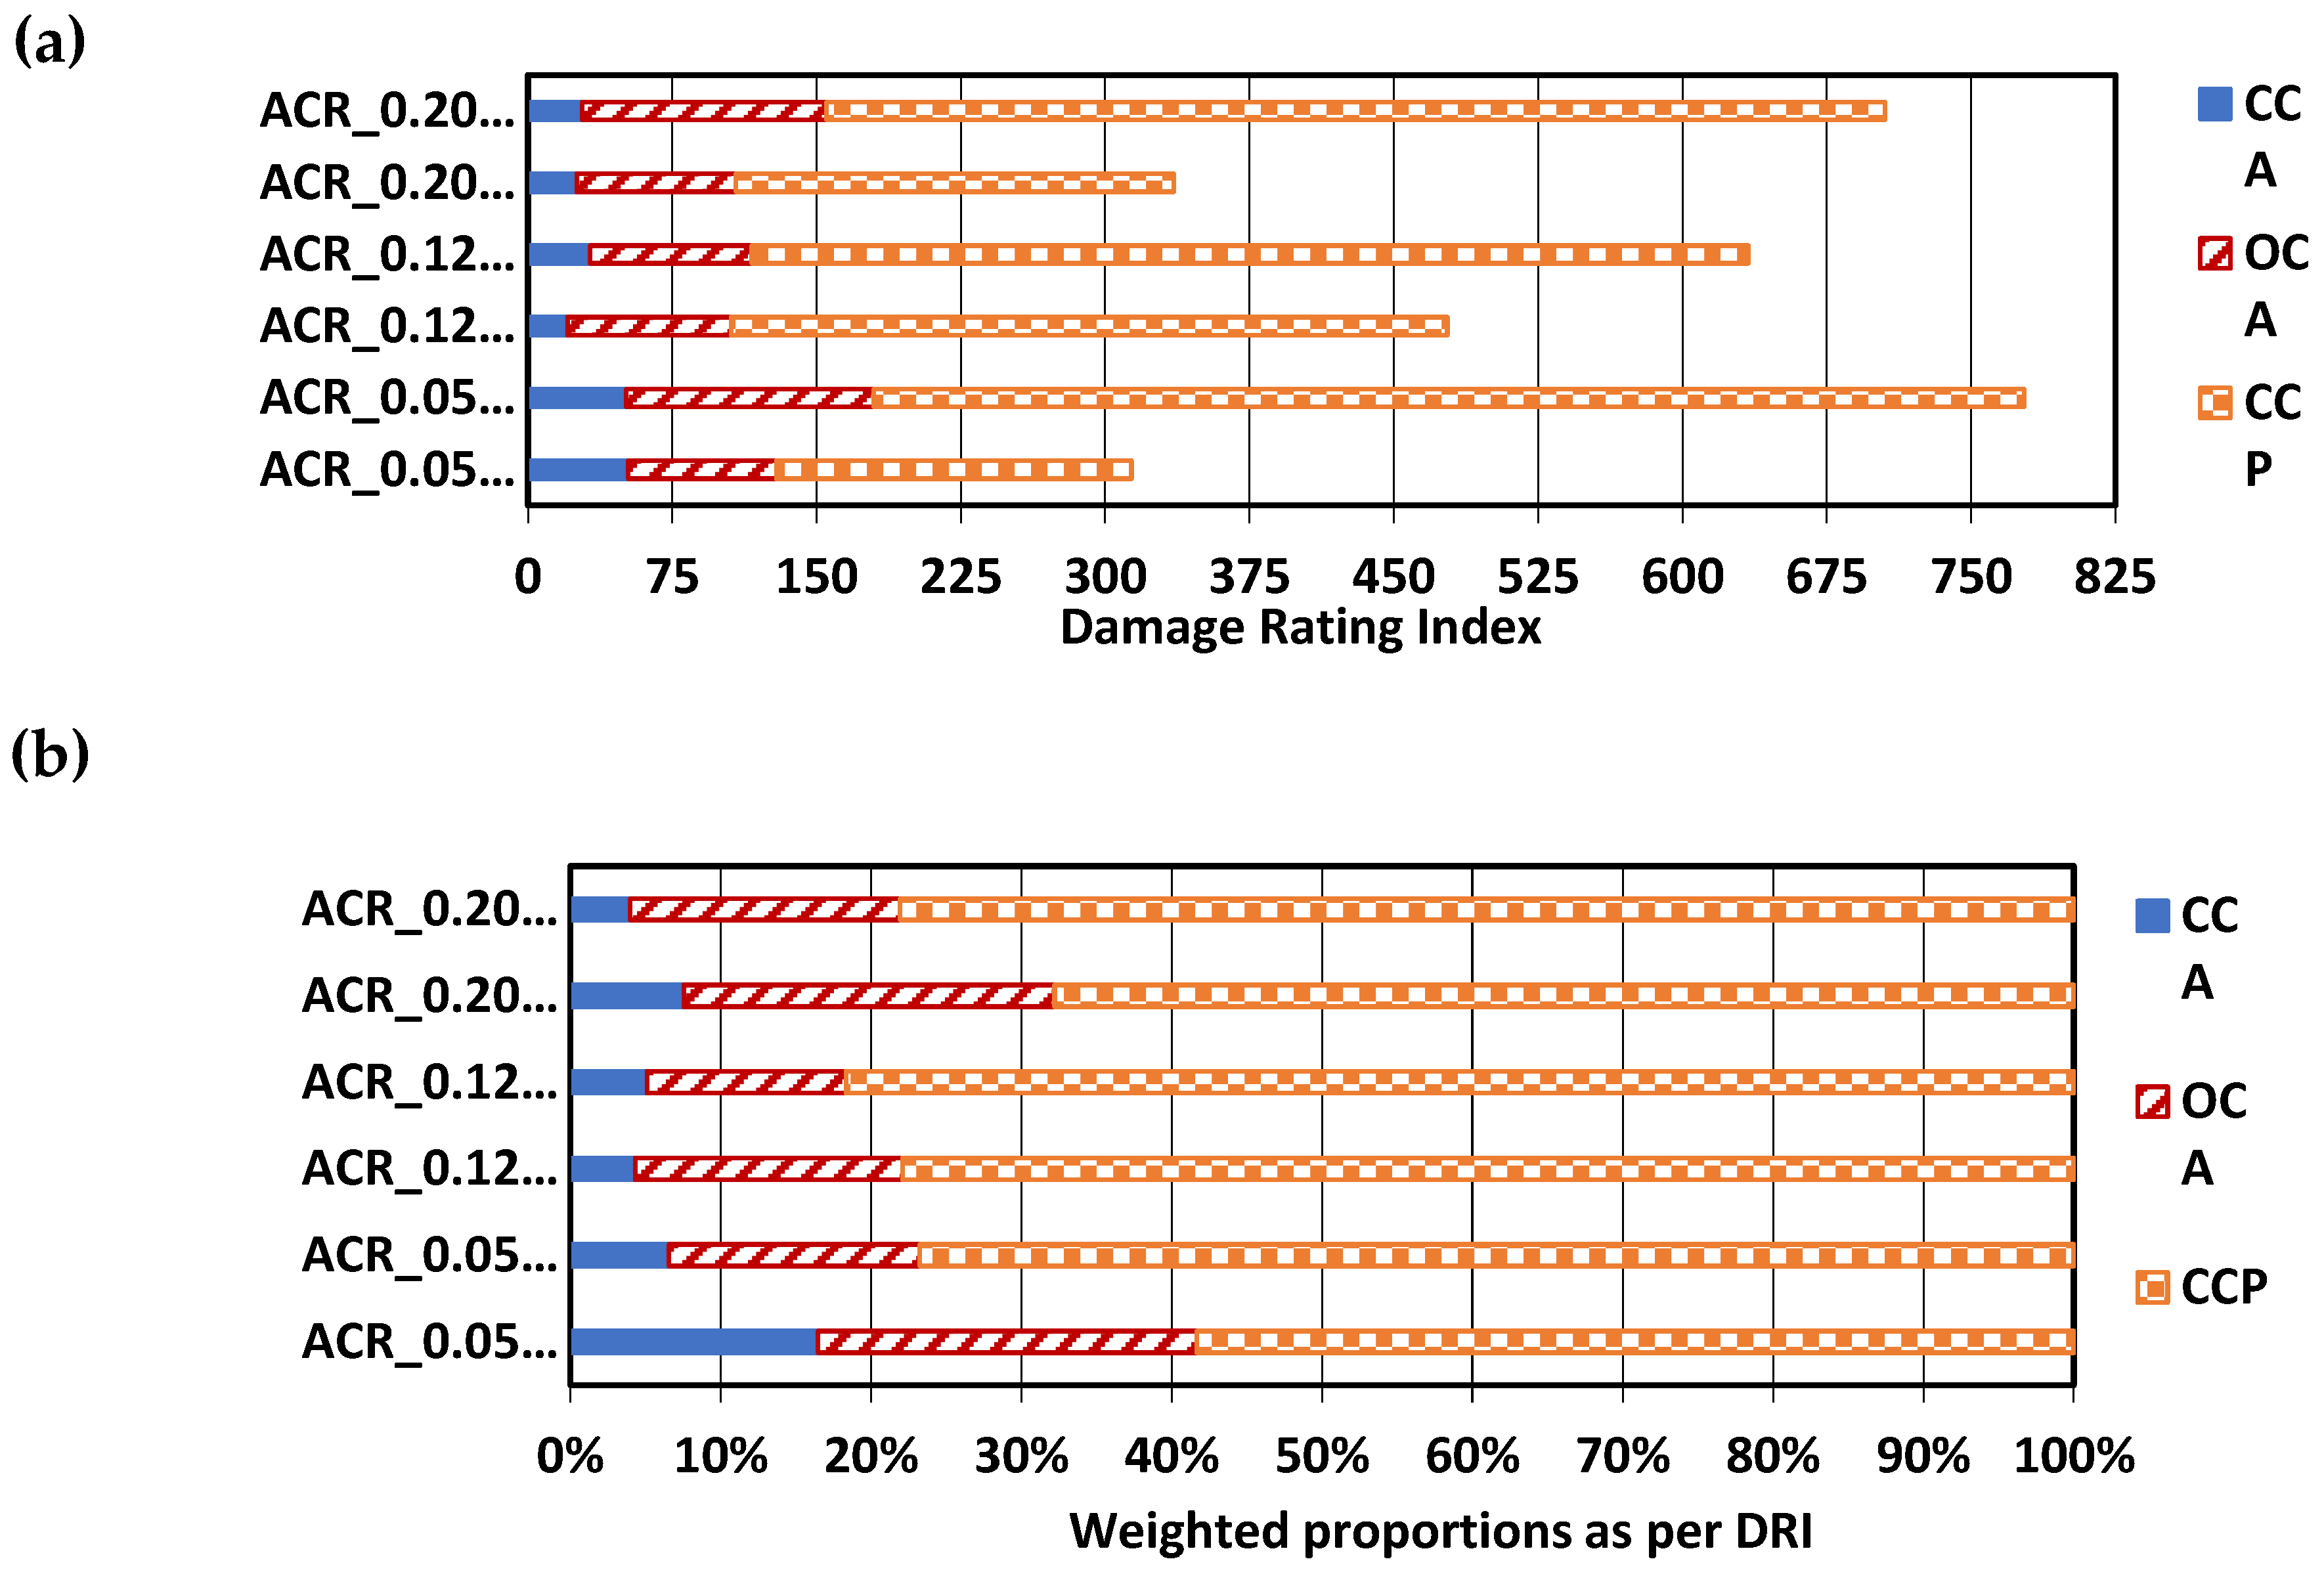
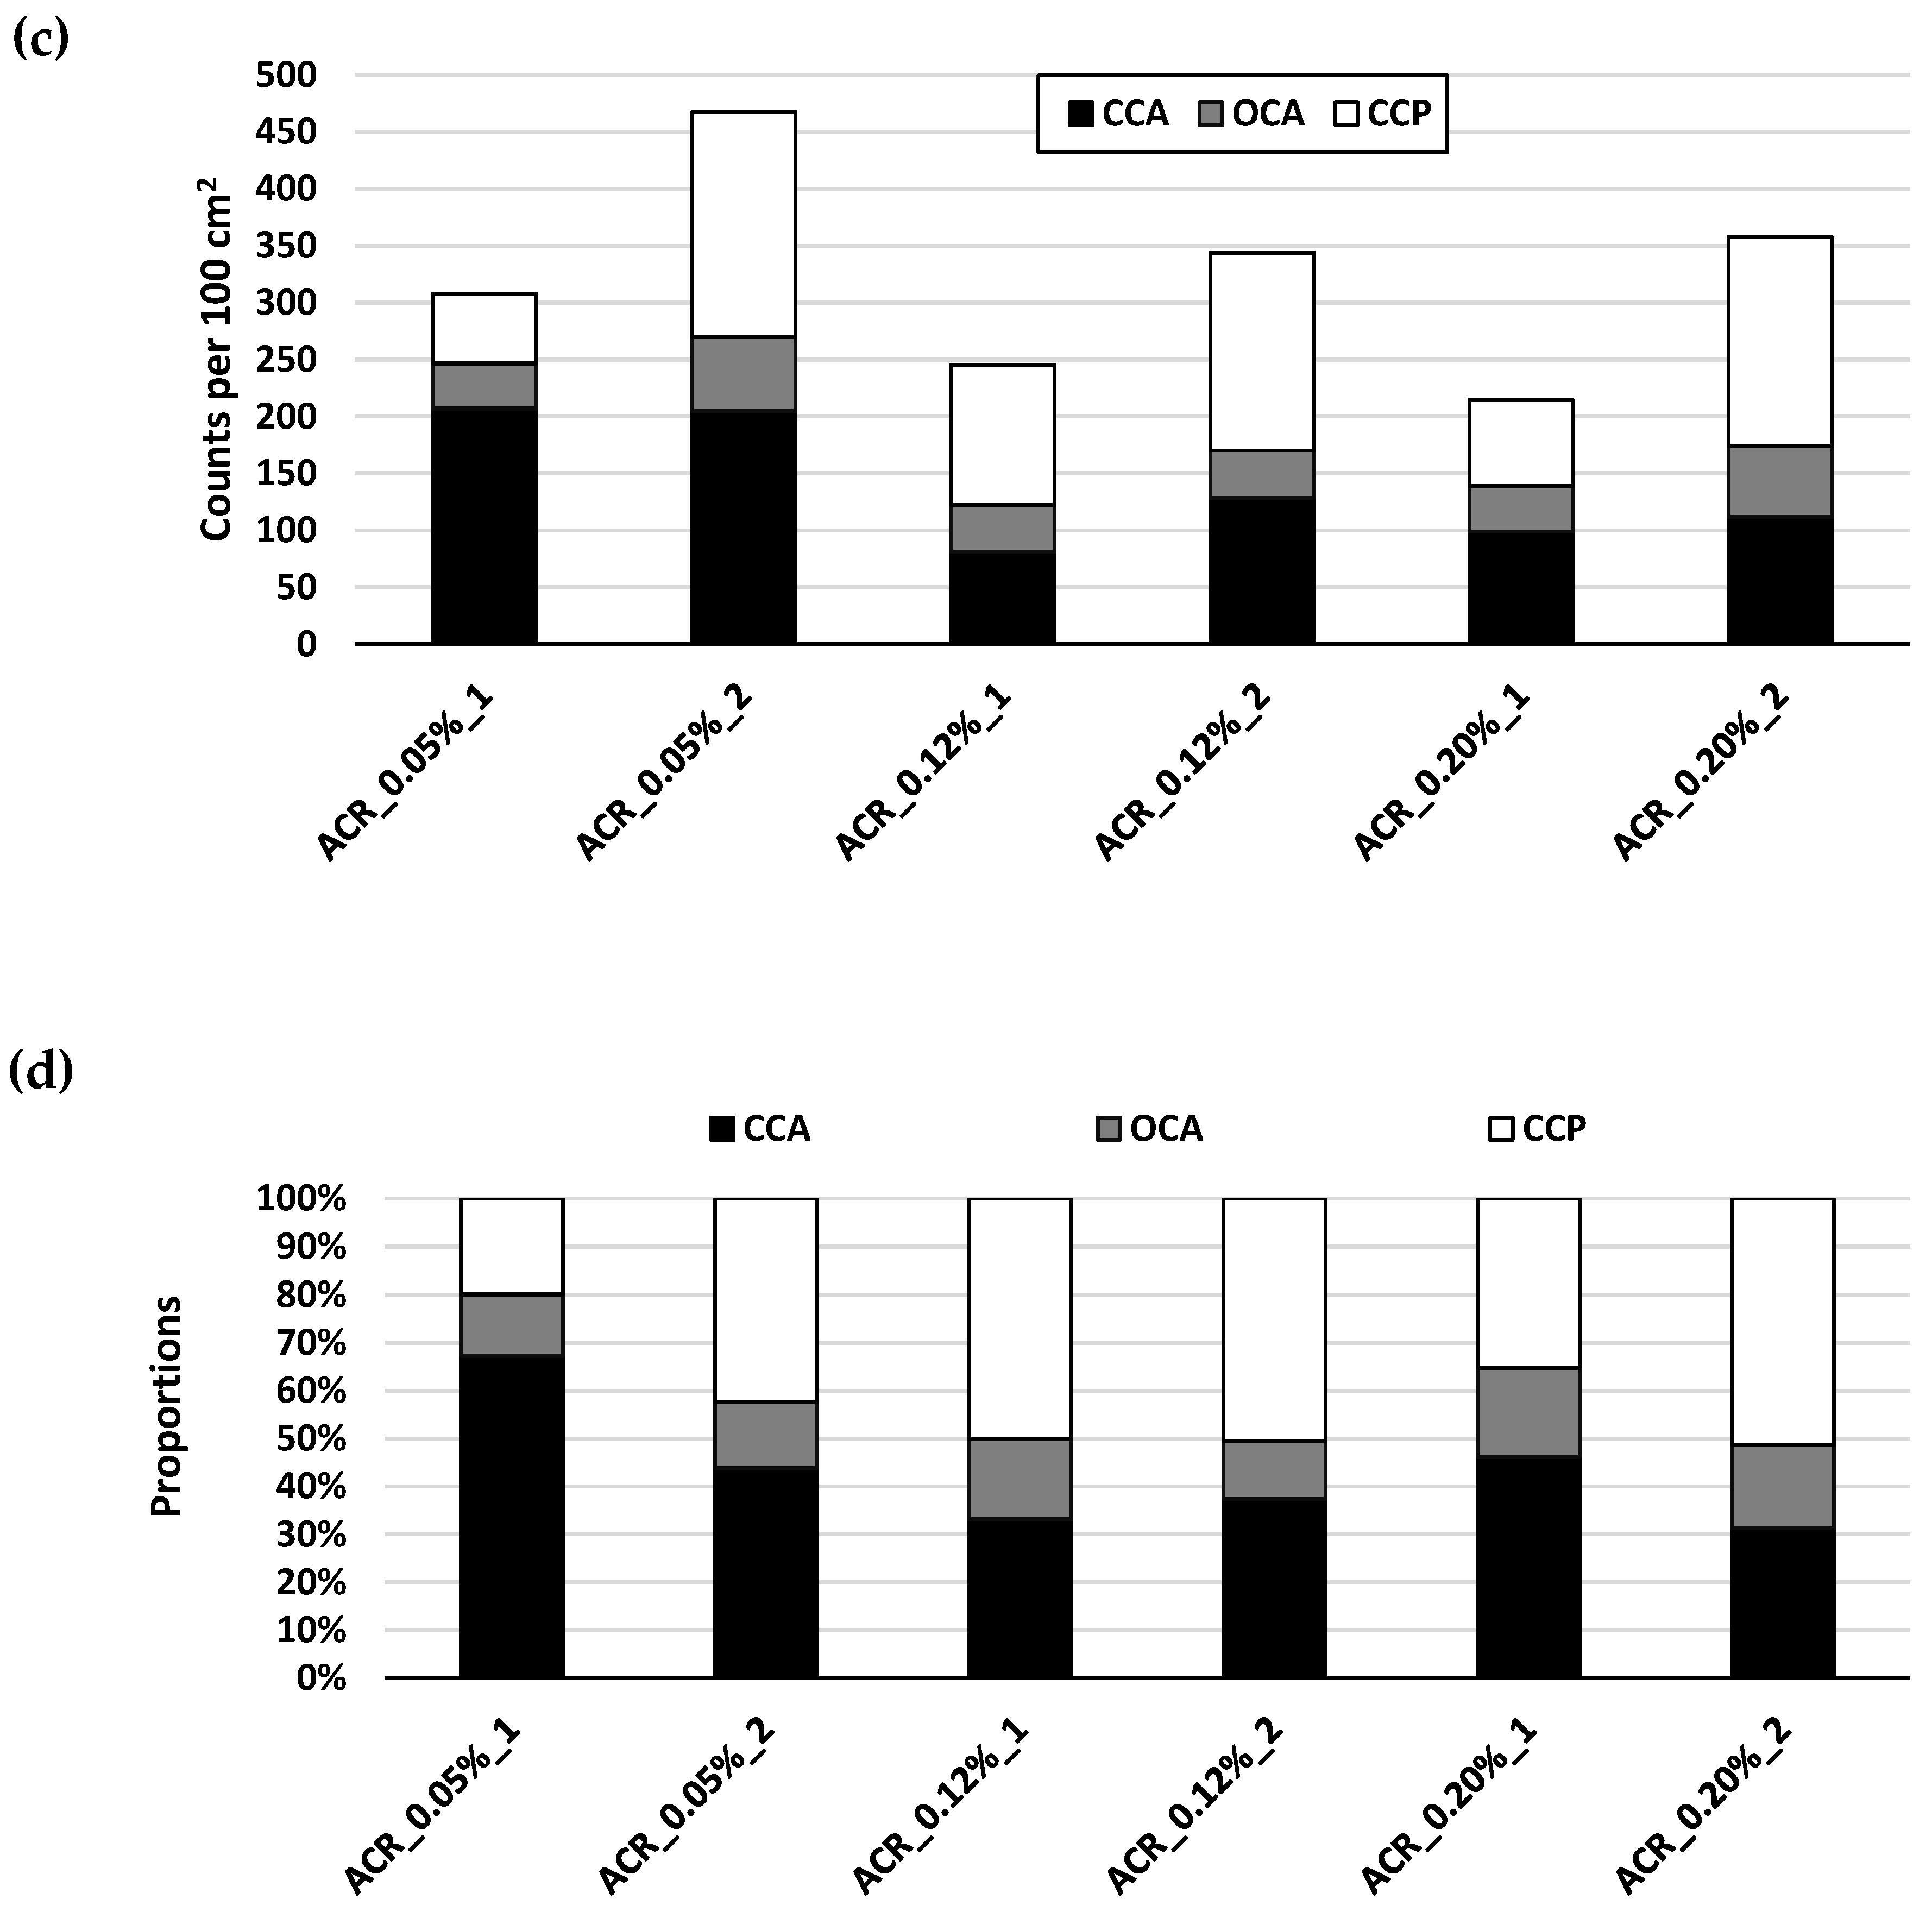
Figure 7.
Another approach to the extended version of the DRI as (a) counts/ 100 cm2 and (b) proportions.
Figure 7.
Another approach to the extended version of the DRI as (a) counts/ 100 cm2 and (b) proportions.
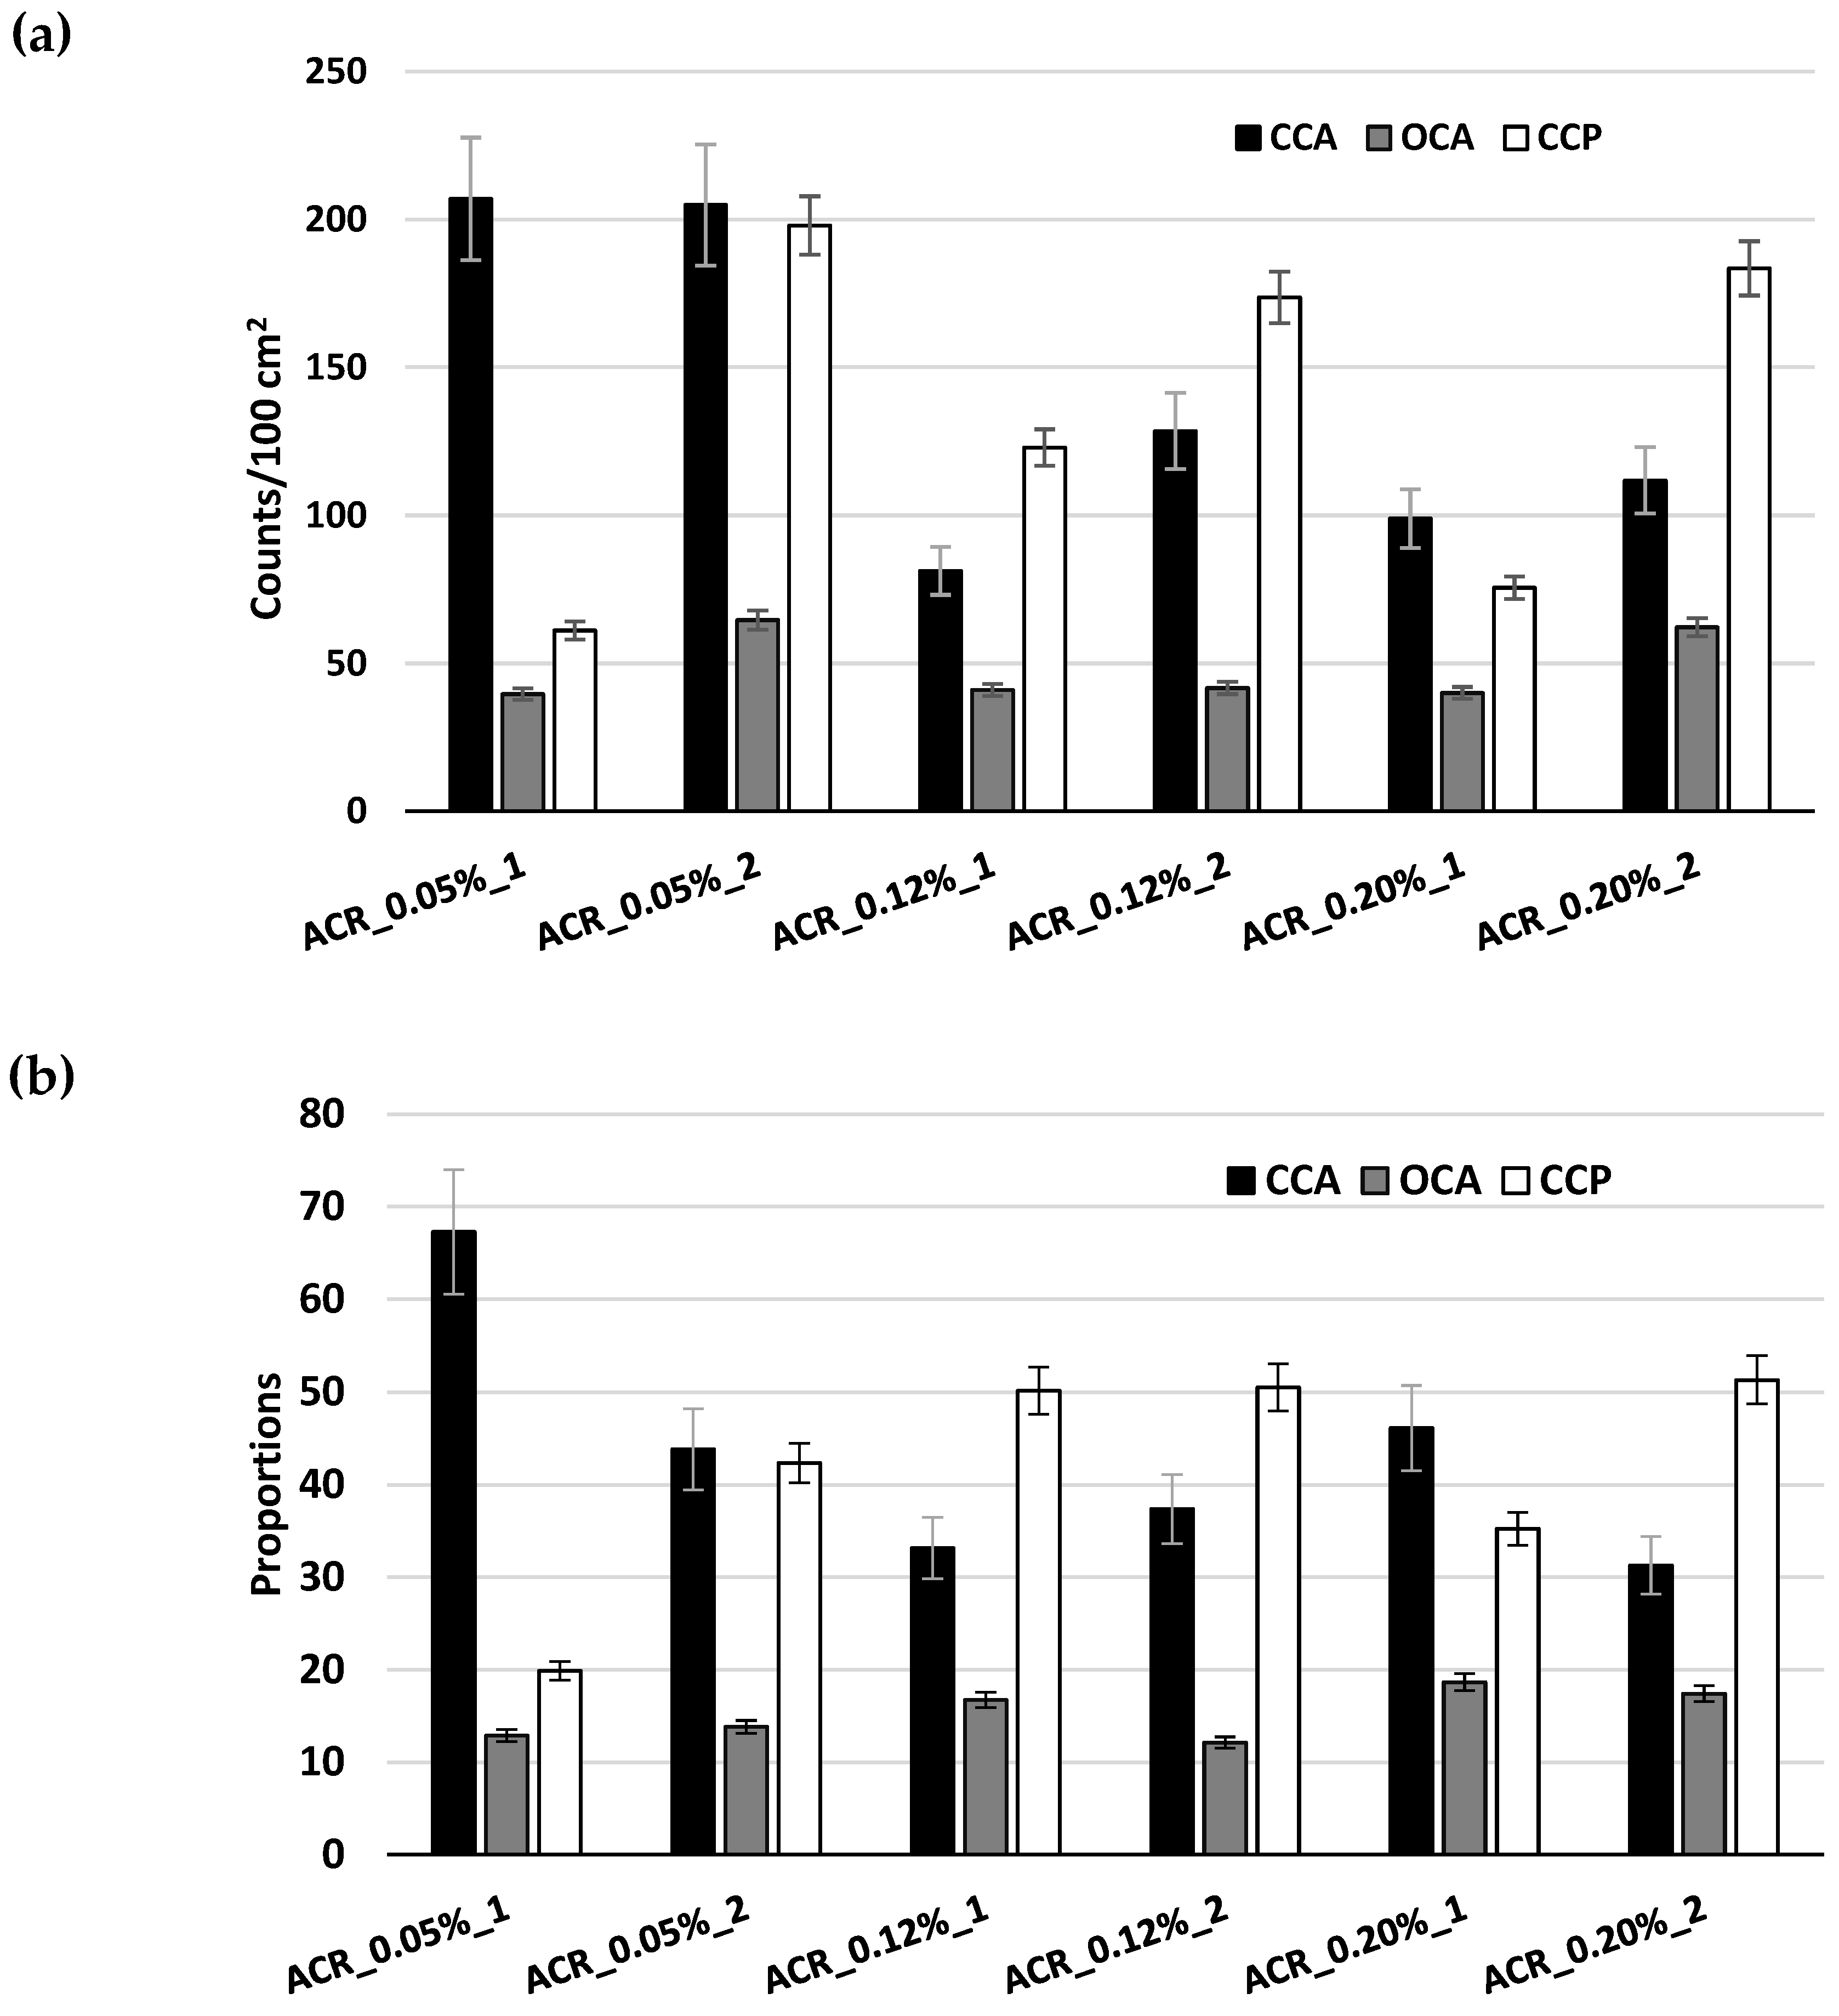
Figure 8.
a) Porosity and b) Absorption of concrete affected by AAR.
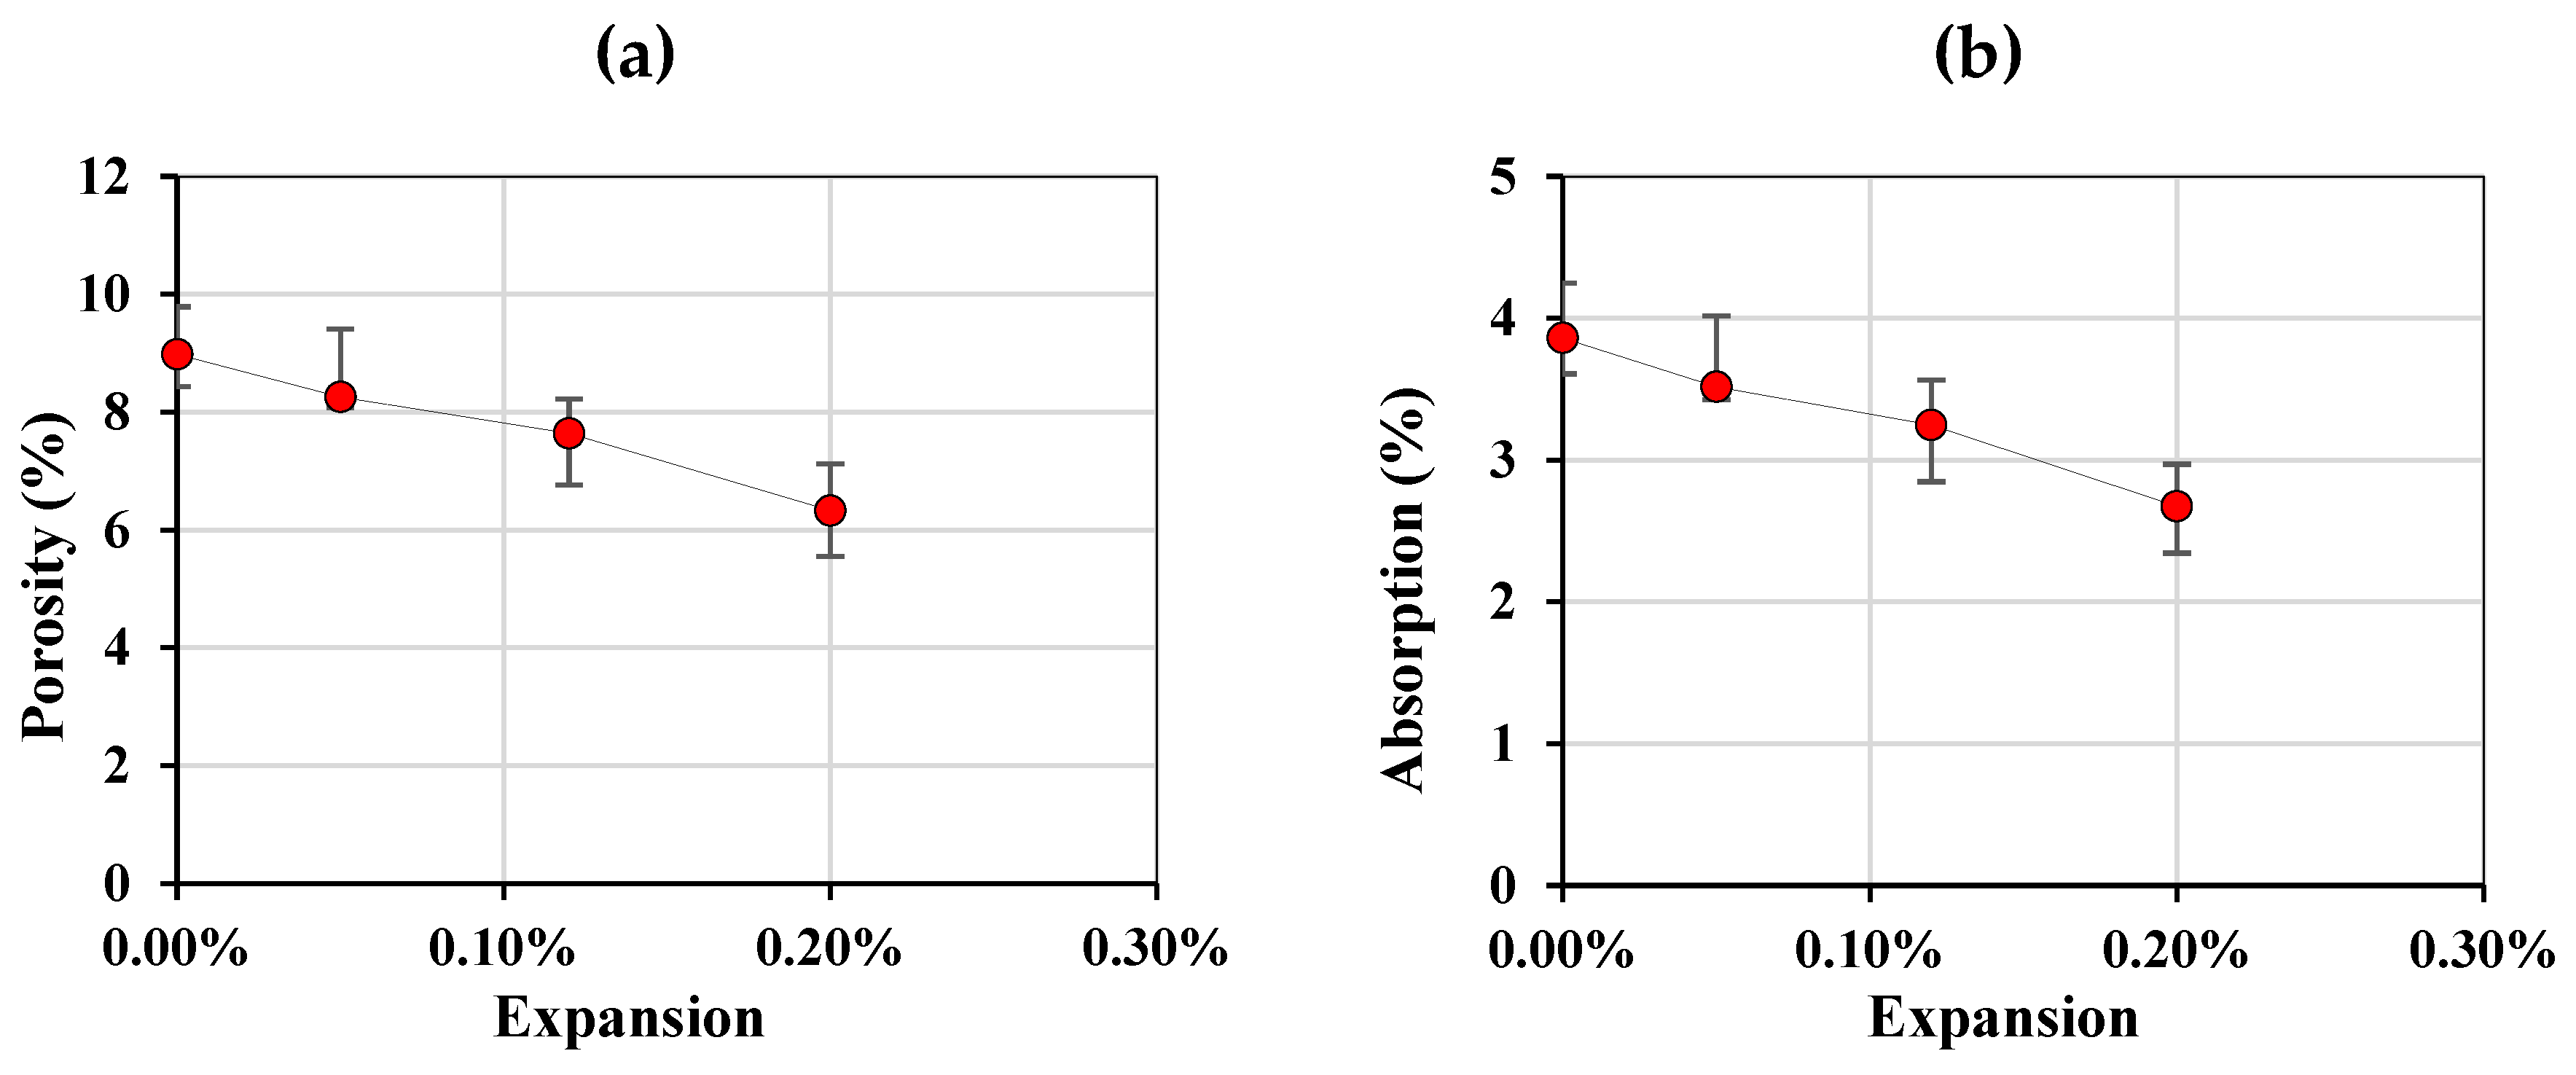
Figure 9.
Results from the multi-level assessment as per Sanchez et al. [7] (a) compressive strength loss, (b) elastic modulus loss, (c) tensile strength loss, (d) SDI, (e) PDI, and (f) DRI.
Figure 9.
Results from the multi-level assessment as per Sanchez et al. [7] (a) compressive strength loss, (b) elastic modulus loss, (c) tensile strength loss, (d) SDI, (e) PDI, and (f) DRI.
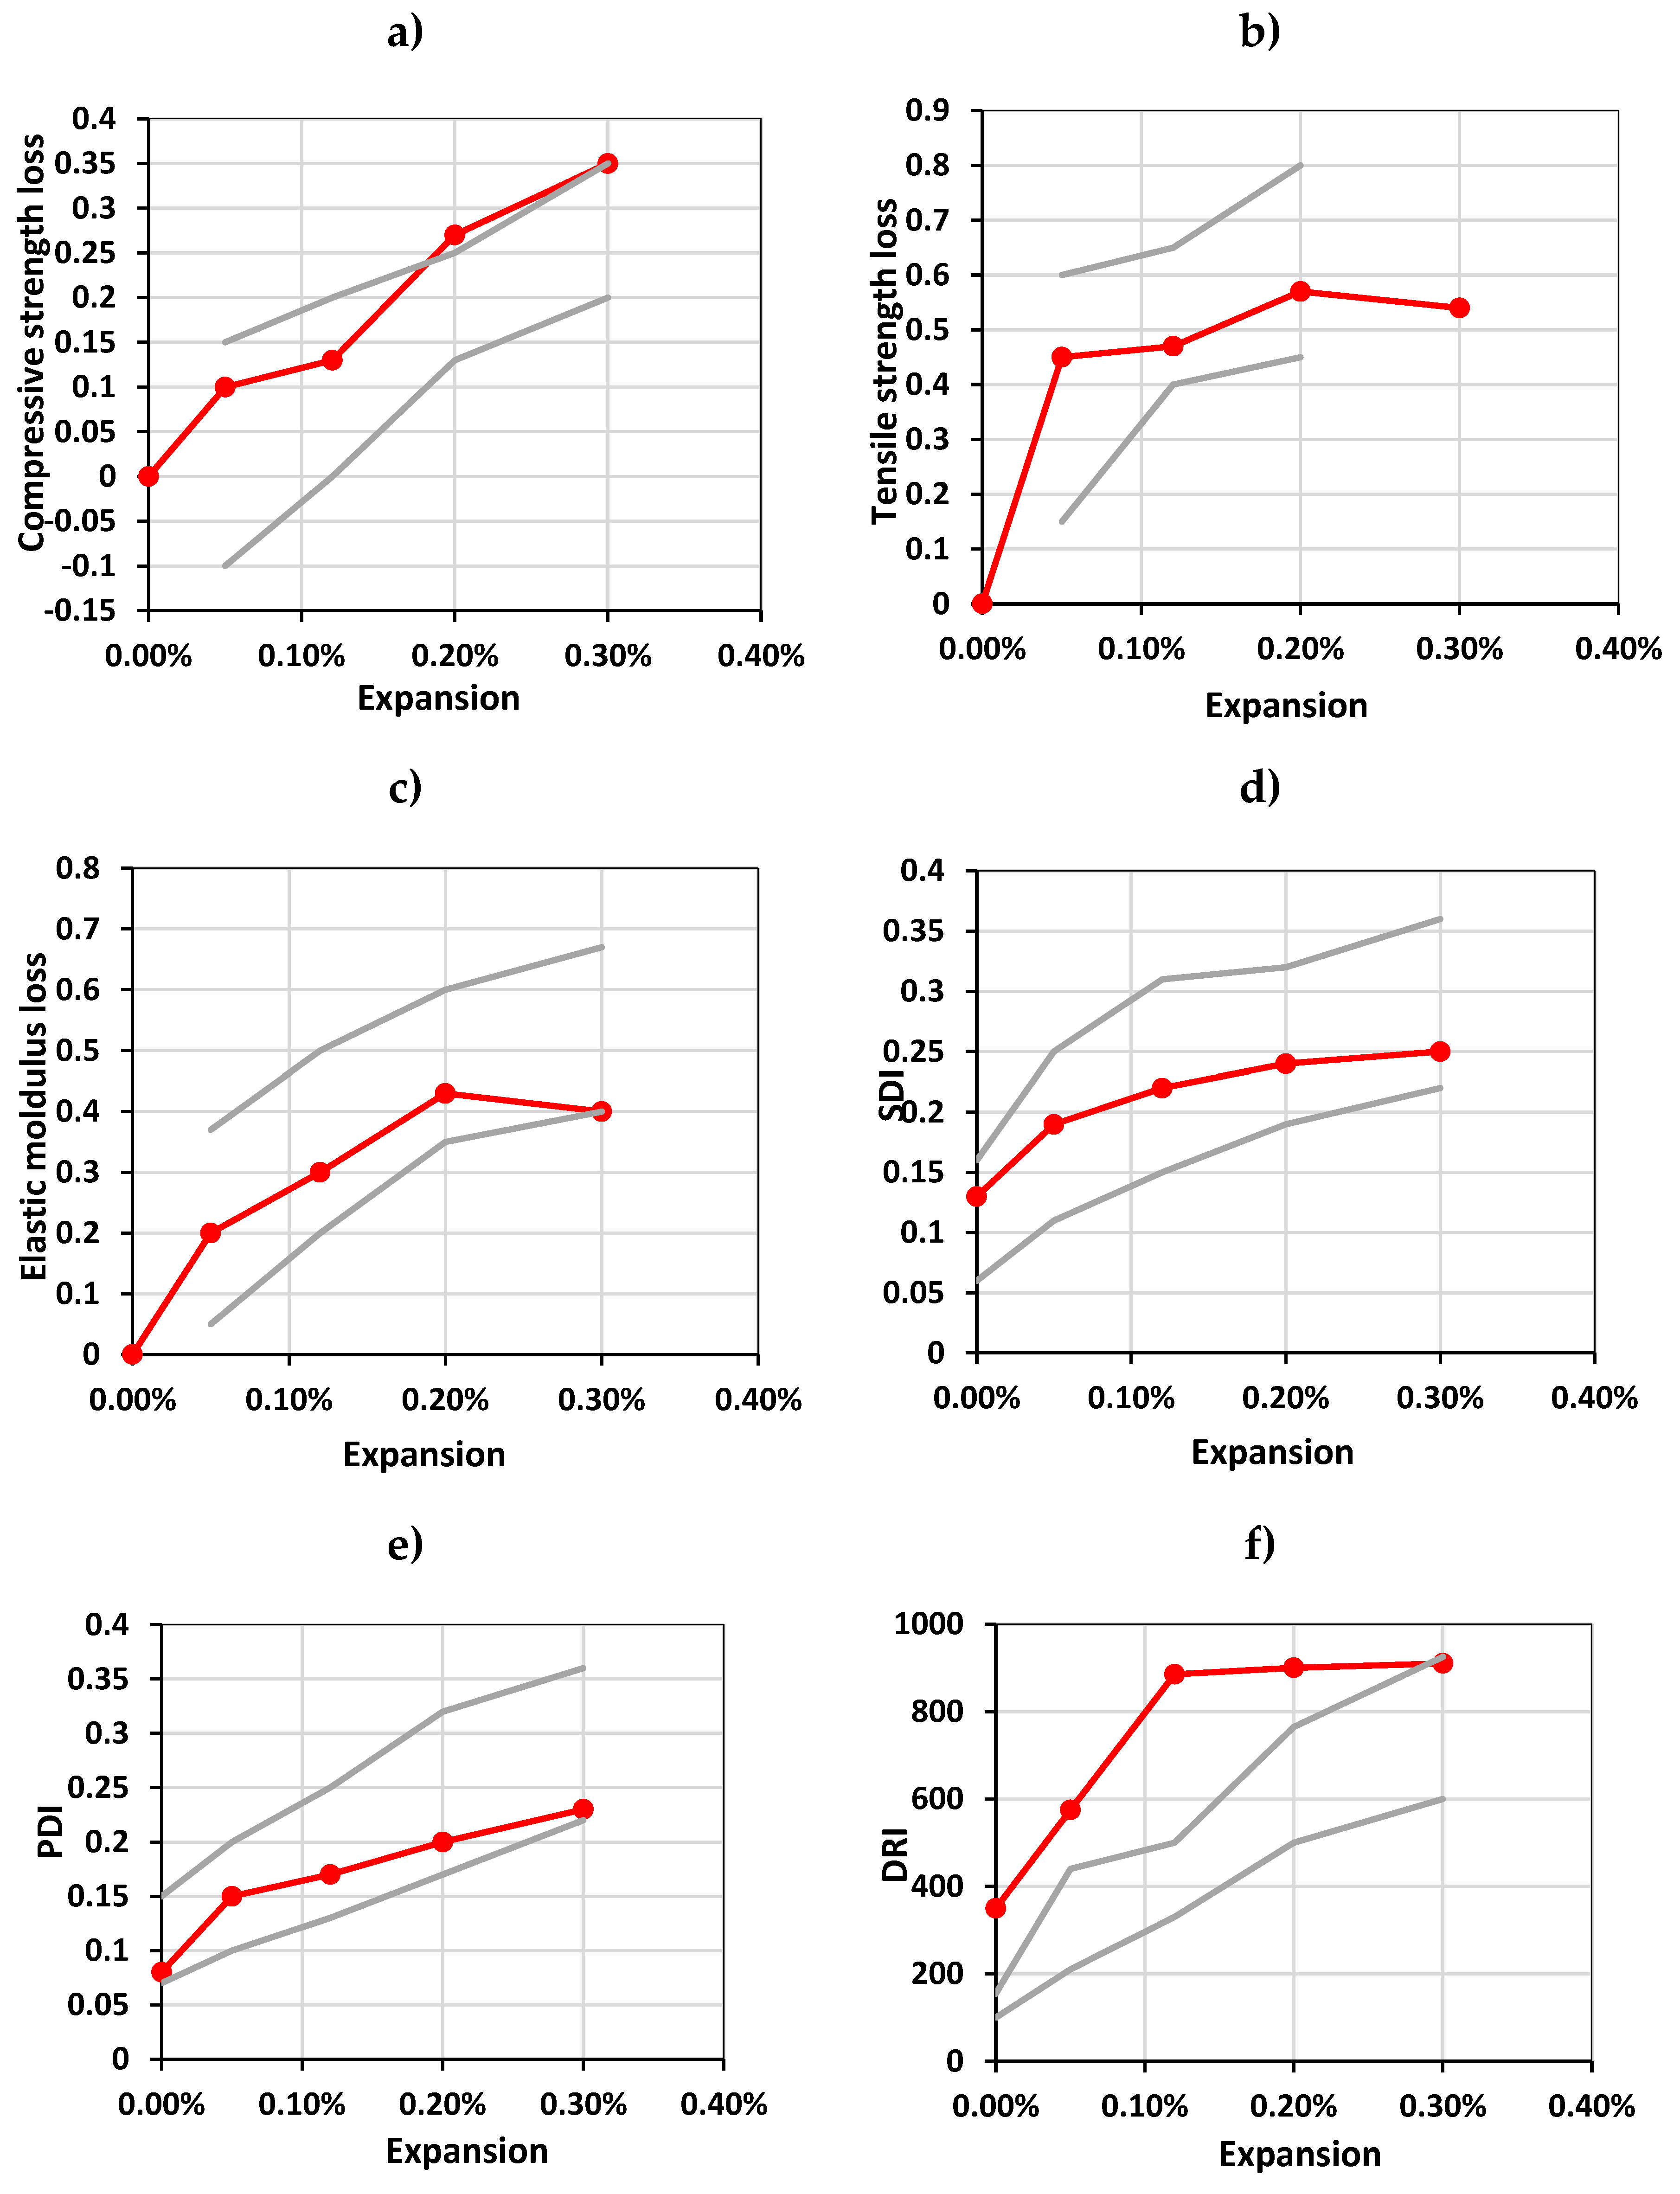
Figure 10.
Comparison of shear strength loss from [19] with the results of this current study.
Figure 10.
Comparison of shear strength loss from [19] with the results of this current study.
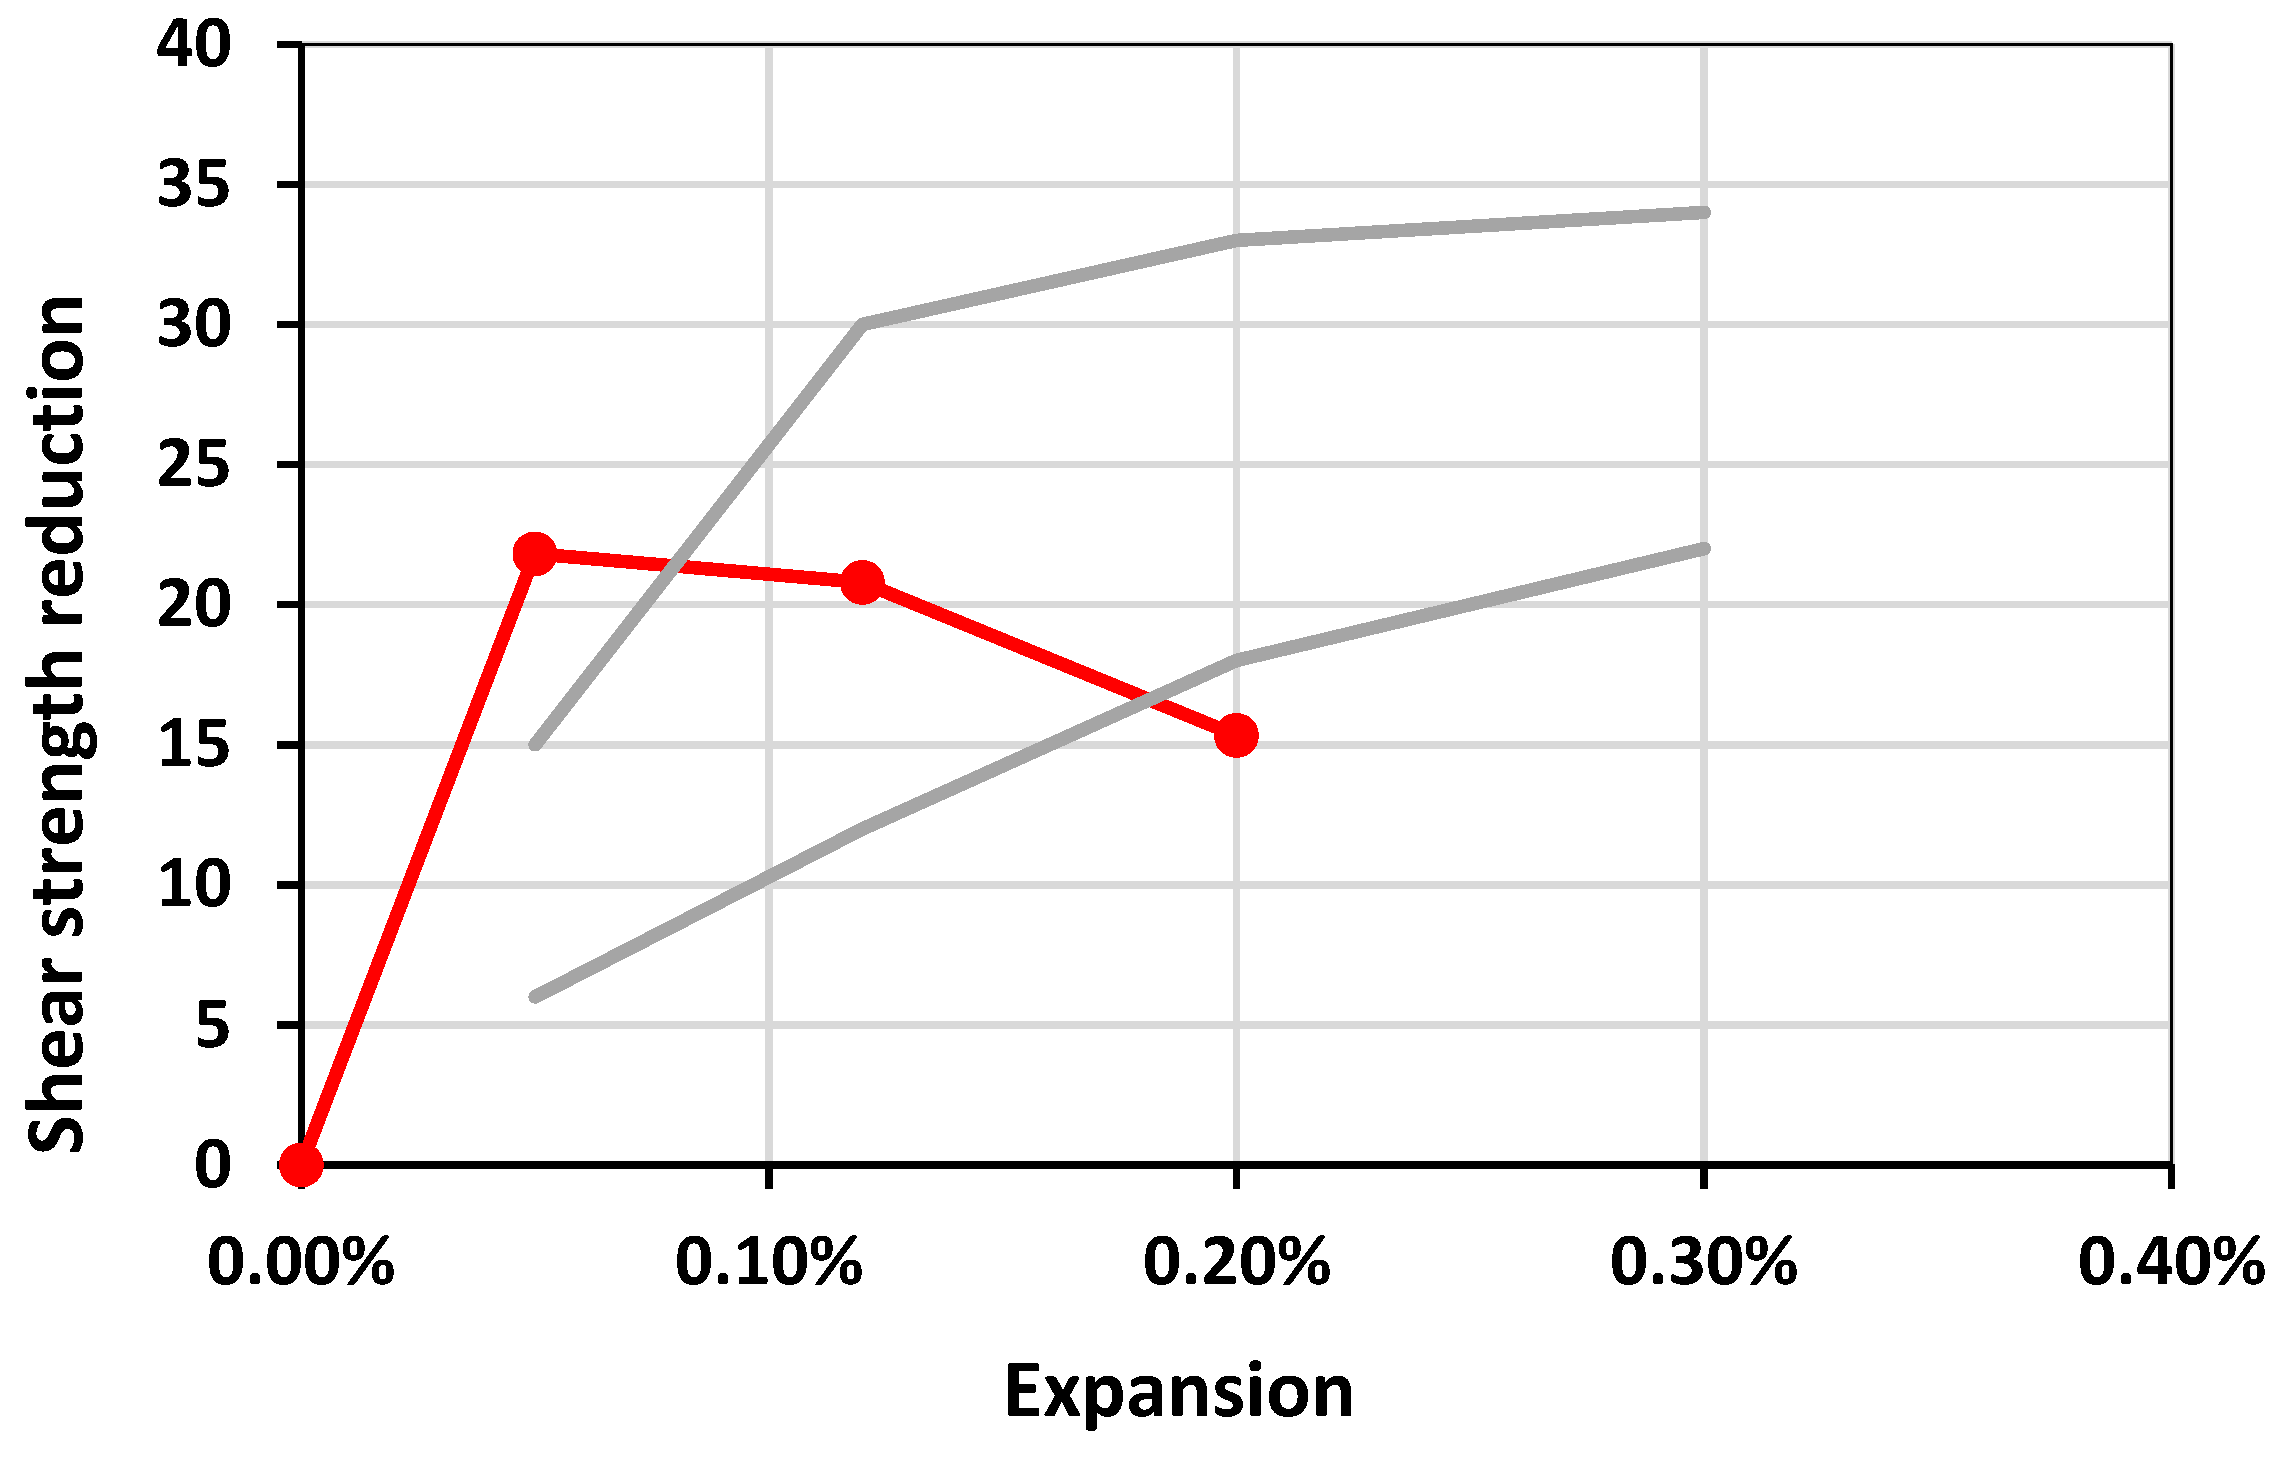
Figure 11.
Micrographs of Kingston aggregate concrete at various expansion levels. The field of view represents 1 cm2.
Figure 11.
Micrographs of Kingston aggregate concrete at various expansion levels. The field of view represents 1 cm2.
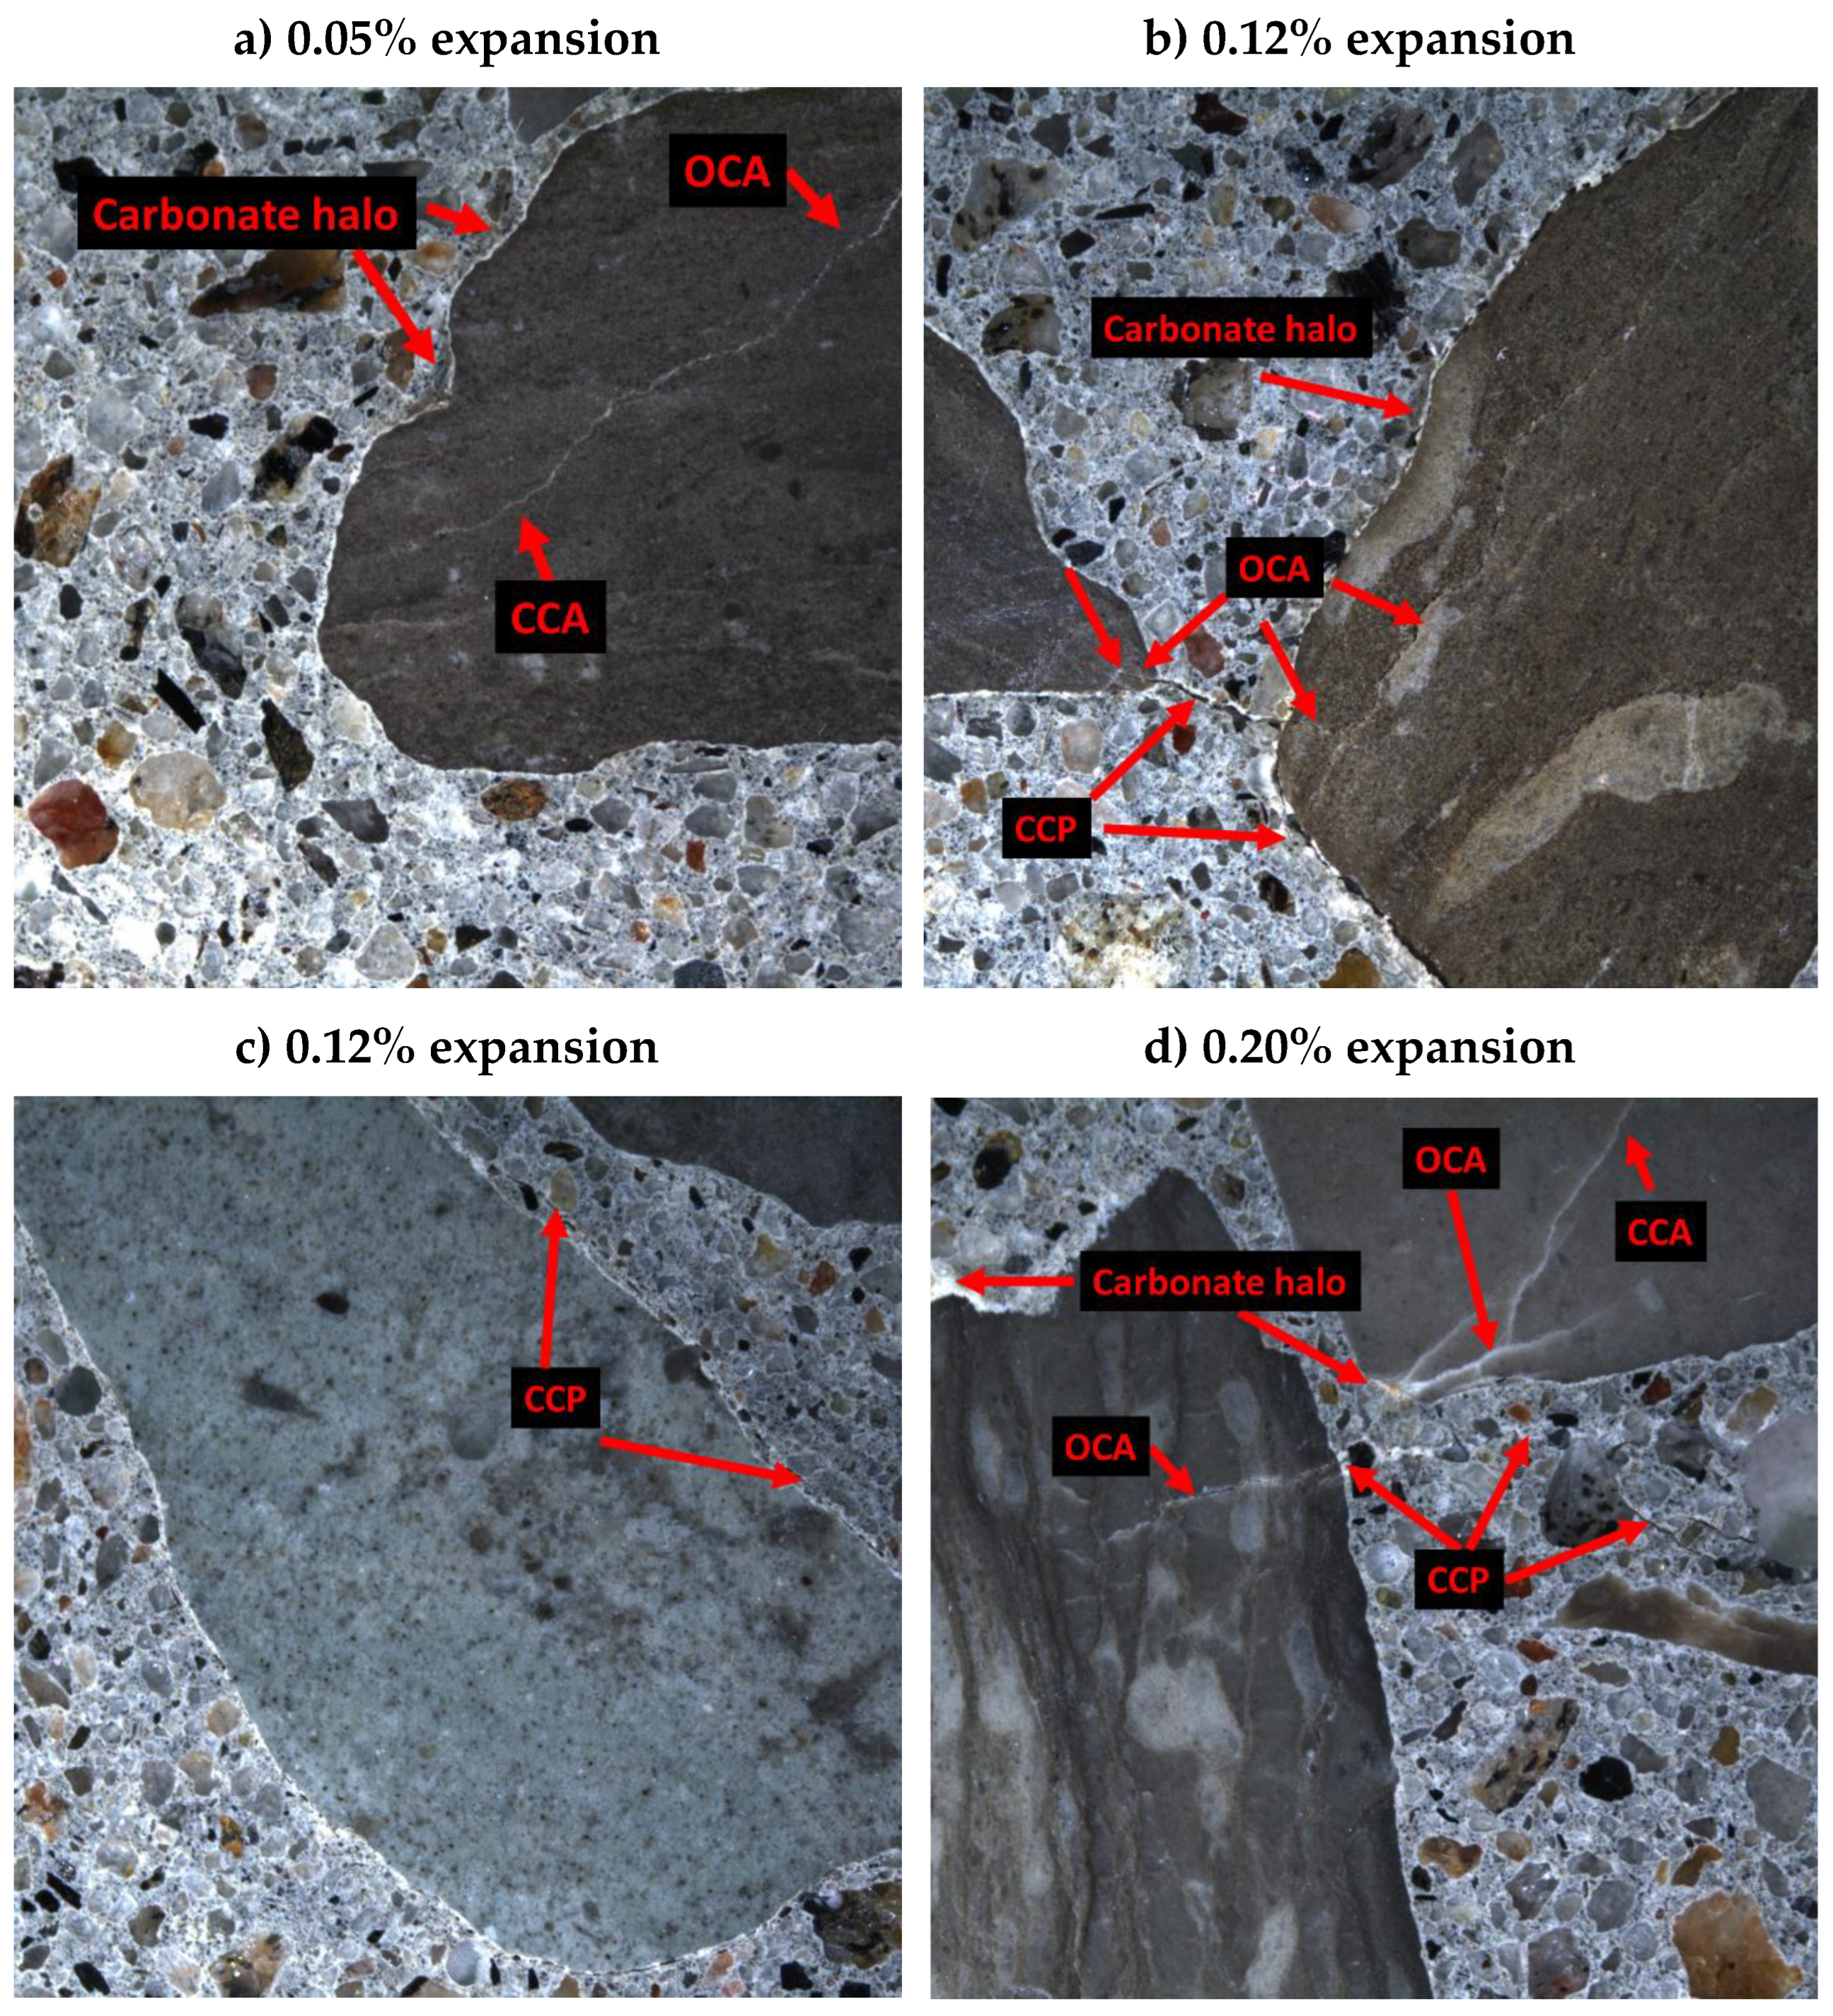
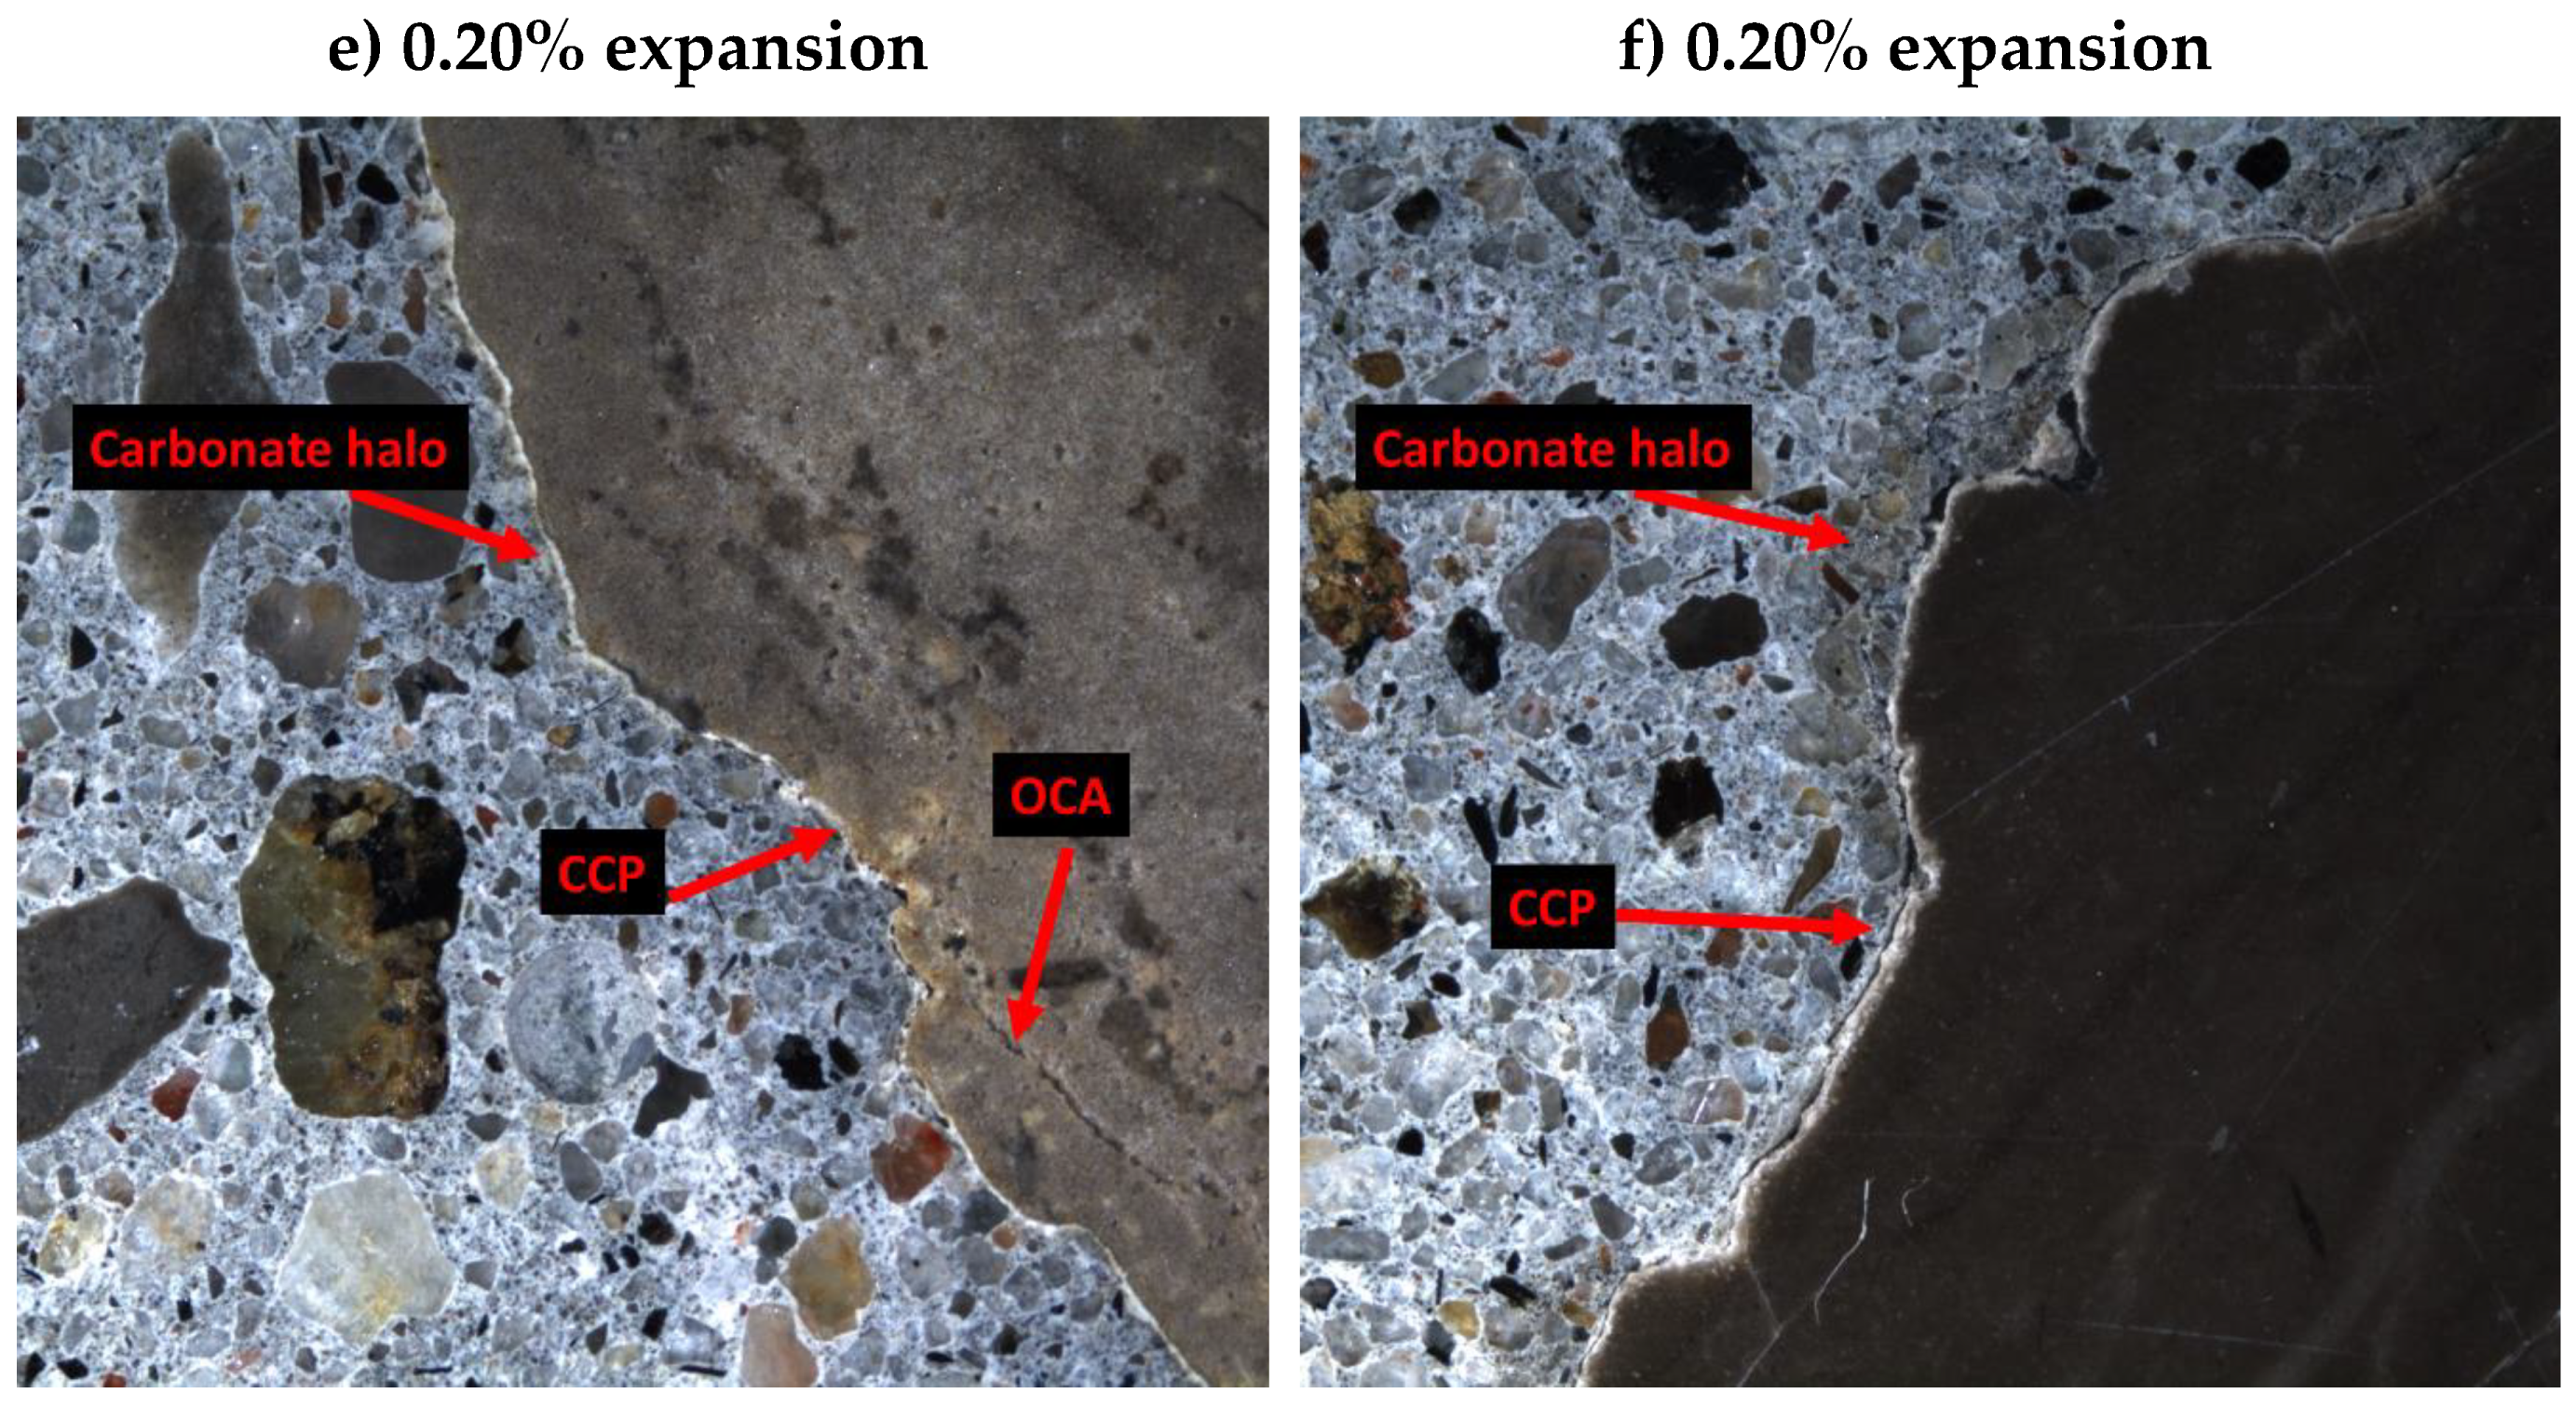
Figure 12.
Cumulative DRI vs sample size.
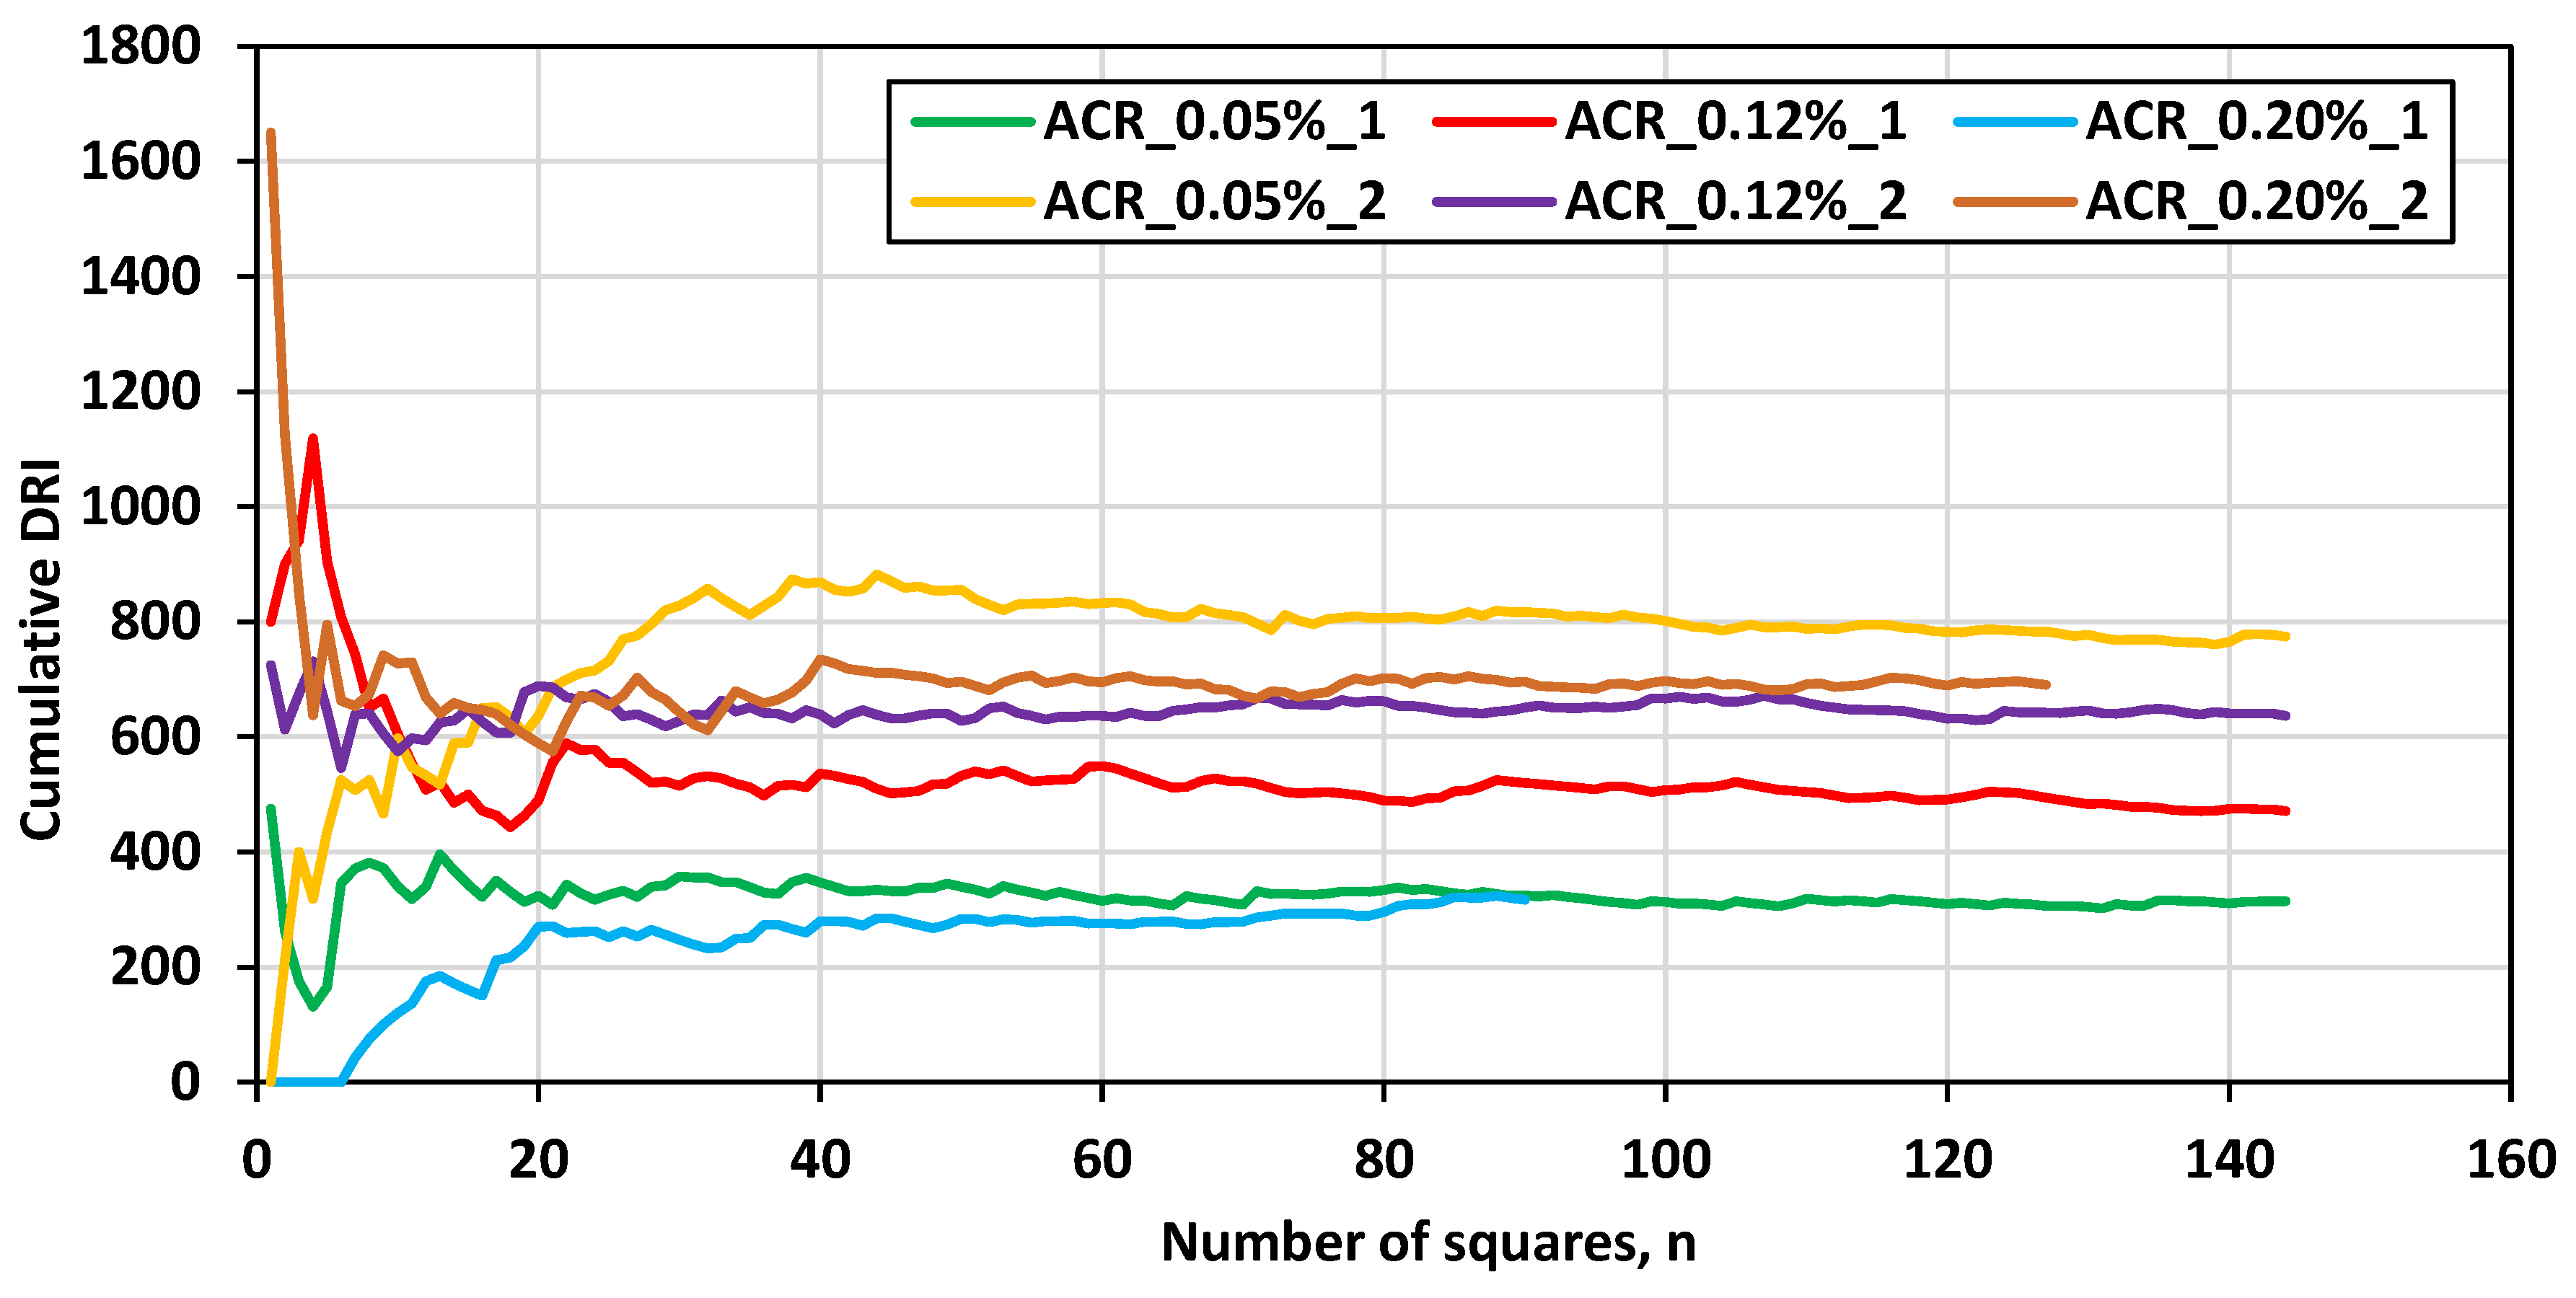

Table 1.
Aggregate characterization.
| Material | Location | Rock type | Specific gravity (g/cm3) | Absorption (%) | CPT- 365 days, expansion (%) |
AMBT – 14 days, expansion (%) |
|---|---|---|---|---|---|---|
| Non-reactive fine aggregate | Bracebridge, Ontario (Canada) | Orthoclase, Quartz, Cristoballite, Albite, Bytowmite, Cordierite, Illite, Muscovite, Larnite | 2.73 | 0.37 | 0.018 | 0.027 |
| Reactive coarse aggregate | Kingston, Ontario (Canada) | Dolomitic argillaceous limestone | 2.61 | 0.63 | 0.232 [16] |
0.110 [17] |
Table 2.
Mix-design.
| Cement | Water | Non-reactive natural sand | Reactive coarse aggregate | ||
|---|---|---|---|---|---|
| 4.75-9.5 mm | 9.5-12.5 mm | 12.5-19 mm | |||
| kg/m3 | |||||
| 420.00 | 180.00 | 766.10 | 326.78 | 326.78 | 336.68 |
Table 3.
DRI distress features and weighting factors.
| Distress feature | Weighting factor [21] |
|---|---|
| Closed cracks in the aggregate, CCA | 0.25 |
| Open cracks in the aggregate without or with reaction product, OCA/OCA_RP | 2 |
| Disaggregated/corroded particle, DAP | 2 |
| Cracks in the cement paste without or with reaction product, CCP/CCP_RP | 3 |
| De-bonded aggregate, CAD | 3 |
Table 4.
One-way ANOVA for the direct shear test.
| Source of Variation | SS | df | MS | F | P-value | F critic | F > F critic? | 0.05? |
| Between Groups | 2.61 | 3 | 0.87 | 0.59 | 0.64 | 4.07 | no | no |
| Within Groups | 11.86 | 8 | 1.48 | |||||
| Total | 14.47 | 11 |
Table 5.
One-way ANOVA for the porosity measurements.
| Source of Variation | SS | df | MS | F | P-value | F critic | F > F critic? | 0.05? |
| Between Groups | 34.20 | 3 | 11.40 | 49.77 | 3.74E-12 | 2.90 | yes | yes |
| Within Groups | 7.33 | 32 | 0.23 | |||||
| Total | 41.53 | 35 |
Table 6.
Summary of results in comparison with ASR.
| Reference expansion level (%) | Compressive strength loss | Tensile strength loss | SDI | Stiffness loss | Shear strength loss | Apparent porosity (%) [23] |
DRI |
|---|---|---|---|---|---|---|---|
| ASR | |||||||
| 0.00 – 0.03 | - | - | 0.06-0.16 | - | - | 100-155 | |
| 0.04 ± 0.01 | -10 to 15% | 15 to 60% | 0.11-0.25 | 5 to 37% | 6 to 15% | 5.2 | 210-440 |
| 0.11 ± 0.01 | 0 to 20% | 40 to 65% | 0.15-0.31 | 20 to 50% | 12 to 30% | - | 330-500 |
| 0.20 ± 0.01 | 13 to 25% | 45 to 80% | 0.19-0.32 | 35 to 60% | 18 to 33% | 6.72 | 500-765 |
| 0.30 ± 0.01 | 20 to 35% | 0.22-0.36 | 40 to 67% | 22 to 34% | - | 600-925 | |
| Kingston aggregate (ACR) | |||||||
| 0.00 – 0.03 | - | - | 0.13 | - | - | 8.98 | 350 |
| 0.04 ± 0.01 | 10% | 45% | 0.19 | 20% | 22% | 8.25 | 575 |
| 0.11 ± 0.01 | 13% | 47% | 0.22 | 30% | 21% | 7.64 | 885 |
| 0.20 ± 0.01 | 27% | 57% | 0.24 | 43% | 15% | 6.33 | 900 |
| 0.30 ± 0.01 | 35% | 54% | 0.25 | 40% | 910 | ||
Disclaimer/Publisher’s Note: The statements, opinions and data contained in all publications are solely those of the individual author(s) and contributor(s) and not of MDPI and/or the editor(s). MDPI and/or the editor(s) disclaim responsibility for any injury to people or property resulting from any ideas, methods, instructions or products referred to in the content. |
© 2023 by the authors. Licensee MDPI, Basel, Switzerland. This article is an open access article distributed under the terms and conditions of the Creative Commons Attribution (CC BY) license (http://creativecommons.org/licenses/by/4.0/).
Copyright: This open access article is published under a Creative Commons CC BY 4.0 license, which permit the free download, distribution, and reuse, provided that the author and preprint are cited in any reuse.


