
Submitted:
18 November 2023
Posted:
21 November 2023
You are already at the latest version
Abstract
The research investigated the relationship between burnout syndrome and the variables of mental resilience and quality and enjoyment of life, in Greek private and public sector workers (N=112), with demographic differences. Data were collected through a structured questionnaire which was distributed in the form of an electronic Microsoft forms. The questionnaire contained demographic questions, the psychometric tool Burnout Assessment Tool version 2.0 (Schaufeli et al., 2019), the psychometric tool Brief Resilience Scale (BRS) (Smith et al., 2008), and the psychometric tool Quality of Life Enjoyment and Satisfaction Questionnaire (Q-LES-Q) (Endicott et al., 1993) which were used to measure the three variables examined by the research. For statistical analysis, Pearson and Spearman correlation coefficients were used to test the relationship between two quantitative variables, while linear regression analysis was used to find independent factors. The main research hypothesis was verified, finding a negative correlation between burnout and the variables of mental resilience and quality of life, while it was identified that employees experienced greater exhaustion and spiritual withdrawal compared to freelancers. Hypotheses regarding age, educational level, and public-private job data were not verified as there were no statistically significant differences in demographic results.
Keywords:
burnout
; mental resilience
; quality of Life
; public and private sector
Introduction
In the initial stages, burnout takes on a self-protective character in order to secure feelings. Conversely, at an advanced stage, disengagement from work can turn into a feeling of dehumanization. People with a lack of sense of achievement experience low emotional competence as well as reduced productivity at work. They are described as employees with an increased sense of inadequacy regarding their work performance, leading to a self-imposed failure [1]. Important unquantifiable factors that contribute to the creation of burnout are those of the environment, culture, and interpersonal relationships at work. More specifically, the phenomenon of burnout does not seem to be studied as a separate individual dysfunction but as a problem interrelated with the work environment and the interpersonal connections and interactions of each individual. The main core of these interactions in a person are the motivations, emotions and values he adopts [1]. Numerous studies support that although the phenomenon of burnout is multifactorial (depending on both environmental and personal factors), there is strong evidence that the characteristics of the workplace have a higher correlation with the occurrence of burnout than personal factors (demographic characteristics, personality factors) [2]. More specifically, much qualitative research seems to agree with the importance of job characteristics, as elements of conflict and role ambiguity in the workplace, such as conflicting job demands and lack of important job type information, show moderate to high correlations with burnout [3].
According to researchers, the psychological and environmental factors of creating the burnout phenomenon stem from the developmental model of job demands and resources (JD-R), and from the conservation of resources model (COR). The first model argues that the continuous work demands and the simultaneous inadequacy of personal resources to immediately deal with and reduce these difficulties constitute the cause of burnout. The COR model, on the other hand, based on motivation theory, argues that burnout is the result of threats to the individual's existing personal resources [1]. In terms of interpersonal relationships, work characteristics related to problems involving employees, customers, colleagues in the work environment, seem to show a higher correlation with the manifestation of the burnout phenomenon, while the same is observed with regard to problems related to the low degree of support from responsible, as well as the increased workload. At the same time, the employee's lack of job satisfaction is felt [4]. The resulting adverse and dysfunctional relationships within workplaces can create negatively charged feelings of conflict, distress and frustration, greatly affecting the employee's mental health and performance. Based on the previous ones, it is necessary to refer to all six main areas of the individual's working life that according to Maslach & Leiter [1] are related to high risk factors for burnout. It is about workload, control, reward, society, fairness and values. In terms of workload, it is quite expected that in overloaded work environment mental resources are exhausted very easily, making employees prone to burnout. Lack of control, as has been said, has been associated with high rates of stress and burnout. In the context of reward, we find that employees who receive reduced recognition in areas of institutional and economic issues are also more prone to this phenomenon, while in the part of society, we refer to employees' relationships with other people. Specifically, if these relationships do not work properly, creating a lack of trust and support, then there is a greater risk of burnout. Justice refers to decision making in the workplace. In this part, elements that make up burnout, such as cynicism, anger and hostility, increase when the employee feels that he is not treated with the corresponding respect. Finally, when there is a conflict of values, that is, when there is a gap between individual and organizational values, then there is a compromise between the work they want to do and the work they are forced to do, which can lead to higher burnout rates [1].
There are many individual factors associated with the occurrence of burnout, including various demographic characteristics such as age, gender, marital status, as well as education level. In terms of gender, research reports show higher rates of burnout in female professionals and more specifically in doctors. This happens because of the multiple responsibilities that the female gender undertakes, such as child care, schooling, as well as housework, in contrast to the male gender where the percentages employment rates in these fields are lower [5], while they seem to have higher rates of cynicism at work [1]. Despite the many articles reporting gender differences in burnout, older research seems to disagree, judging gender difference as a weak predictor of burnout and attributing mixed and unclear gender differences to stereotypes and social roles [3]. Many researchers report that the phenomenon of burnout is more likely to be detected in younger age groups, which is of course also related to work experience. More specifically, burnout is more common in the early stages of an individual's career, while single professionals appear to experience higher levels of burnout than those with families and partners. Also, people with a higher level of education experience burnout to a greater extent, which may stem from high levels of responsibility and stress [6]. Other individual characteristics associated with high rates of burnout are the individual's need for external control, low levels of resilience, low self-esteem, and avoidance and coping mechanisms and patterns [6]. At personality levels, it also seems that less personality-resistant people, as well as found people "neurotics" according to the five-factor model of personality, experience more signs of burnout [1]. Equally important is the reference to the correlation of suicidality and suicidal ideation with professional burnout, since related research that studied suicidal ideation and burnout in practicing psychiatrists in Japan showed that medical trainees with suicidal ideation had higher rates of burnout compared to those without suicidal ideation [1].
In terms of personal resilience factors, personality traits (extroversion, agreeable demeanor), internal locus of control, mastery, efficacy, optimism and cognitive appraisal appear to contribute to resilience. Other personal characteristics such as mental functioning, cognitive well-being, social attachment, emotional regulation, adaptability, spirituality, active coping, and positive perceptions are associated with resilience. Demographic data on resilience are gaining ground. More specifically, characteristics such as those of age, race, ethnicity and social relationships are related to resilience, while other factors that increase this phenomenon may affect a specific life stage or the entire life span of an individual [7]. It is also noteworthy that people with a resilient personality profile have a high score on all factors of the Big Five model [8]. The biological factors in combination with the genetic factors present, it has been shown, from related research, that they can significantly affect mental resilience, and in particular that the harsh early environment can affect the brain function, structure and neurobiological systems of the brain. This is also evidenced by research dealing with studies of healthy individuals who have experienced abuse, and which identify biological variables associated with resilience [7]. As a result of brain dysfunctions, brain functions may deteriorate as well as greatly affect vulnerability (vulnerability) to future mental issues [9]. Additionally, the environment, as a fairly strong predictor of mental resilience, acts in a variety of ways. Elements such as family, relationships and social support are related to resilience. In the part of interaction and relationships, it seems that secure attachment with the mother, family stability and tranquility, the lack of a violent parent as well as the absence of substance use and maternal depression, are related to good psychological stability in abused children and to fewer behavioral problems. Pleasant relationships with family, with adults, with peers and with teachers are factors that promote the effectiveness of social support, defining it as a positive sign of mental resilience [7]. At the same time collective systems and social factors such as school, sports teams, spirituality as well as religion influence resilience, although according to research, no sound social policy seems to be used properly to promote resilience in real populations [7]. A representative example of an employee with high mental resilience includes the ability to manage resources, cope with workloads, move and act flexibly in critical incidents and moments of wrongdoing, recognizing them as an opportunity for internal growth. Studies support the importance of mental resilience, as mental difficulties such as feelings of wear and tear, psychological stress and burnout are reduced in people with high mental resilience [10]. It appears that, in this way, employees use their work and personal resources in order to manage and respond productively to uncertainty and work change [11].
The purpose of this research is to study the relationship between burnout syndrome and the variables of mental resilience and quality and enjoyment of life, in a sample with demographic differences in age, gender, work hierarchy, educational level and mental toughness. The contribution and originality of the present research is found in the enrichment of the existing literature on the burnout syndrome with the aim of preventing and dealing with the phenomenon, as well as raising awareness and mobilizing the competent bodies. Regarding the hypotheses, it is expected to find that younger workers, women, workers with a higher level of education and those occupying higher positions in the work hierarchy exhibit higher rates of burnout. Moreover, it is expected that there is a negative correlation of burnout with quality of life and resilience.
Method
Participants and Sample
The sampling technique is convenience sampling, and more specifically, the sample comes from public and private agencies available for this purpose and consists of educators (educators, social educators, social workers) of the public sector, as well as administrative staff of private sector. The choice of the specific frameworks of public and private bodies was random and opportunistic. The participants voluntarily took part in the survey and filling out the form. The sample amounts to 112 participants, of which seventy are women, forty are men, while one participant was found to belong to the non-binary gender category.
Materials and Tools
The questionnaire used consists of a short demographic questionnaire, which contains detailed questions about demographic information such as age, gender, occupation, and educational and academic status of the individual. It was necessary to use the standardized scientific tool Burnout Assessment Tool version 2.0 [12] with 30 items and multiple-choice questions that are measured and give answers from 1-5 (1 never, 5 always). As a formal instrument, it measures main symptoms of burnout such as exhaustion, mental distance and cognitive and emotional impairment, as well as secondary symptoms, the main ones being psychological distress and psychosomatic observations. At the same time, the tool is officially translated and weighted by the researchers in Greek.
Also, the Brief Resilience Scale (BRS) [13] was administered to measure mental resilience. It has 6 items, and no license is required. The score range is between 6 and 30, with "agree"/"disagree" type questions.
Finally, the Quality-of-Life Enjoyment and Satisfaction Questionnaire (Q-LES-Q) tool created in 1993 by Jean Endicott was distributed. It contains 16 items, is weighted, and does not require a license. It measures the level and degree of satisfaction that individuals experience in various areas of their lives [14].
Research Process
Participants were asked to answer a 62-question questionnaire, via the Internet and Microsoft forms hyperlink notification, having previously completed the online written consent and having received an identification number for eventual data withdrawal. During the procedure there was no threat to the safety, physical integrity, mental health or well-being of the participants. The questionnaires that the participants were asked to answer in turn were the short demographic questionnaire, the standardized scientific tool Burnout Assessment Tool [12] with 30 items, officially translated and weighted by the researchers in Greek, the Brief Resilience Scale (BRS) [13] with 6 items, weighted, license-free and the Quality-of-Life Enjoyment and Satisfaction Questionnaire (Q-LES-Q) [14] with 16 items, weighted, also without license required. After completing the questionnaire, the participants received the de-information form containing the data withdrawal process and the appropriate thank you message.
Statistical analysis
By using the Kolmogorov-Smirnov test, the distributions of the quantitative variables were tested for normality. For those that were normally distributed, mean values and standard deviations (Standard Deviation = SD) were used to describe them, while for those that were not normally distributed, medians and interquartile ranges were additionally used. Absolute (N) and relative (%) frequencies were used to describe qualitative variables. Linear regression analysis was used to find independent factors related to the quality-of-life scale and dimensions of the burnout scale from which dependence coefficients (β) and their standard errors (standard errors = SE) were derived. When the distribution of the dependent variable was not normal, its logarithm was used in the linear regression. Significance levels are two-sided and statistical significance was set at 0.05. The statistical program SPSS 26.0 was used for the analysis.
Results
The sample consists of 112 participants, the majority of whom, at a rate of 50.0%, belonged to the age group of 40-64 years. Table 1 shows the demographic and occupational data of the participants. 62.5% of the sample were women. 60.7% were single and 33.9% had postgraduate studies. Also, 75.0% worked in the private sector and specifically 57.1% worked as employees.
Then Graph 1 is given regarding the educational level of the participants.
Based on the burnout dimension, 5.4% of participants felt very high burnout. Based on the dimension of spiritual withdrawal the corresponding percentage was 7.1%, for mental dysfunction and emotional withdrawal it was also 7.1%. Regarding secondary symptoms, burnout based on psychological problems was very high for 6.3% of participants and based on psychosomatics for 5.4%.

Table 2.
Burnout levels.
| Ν | % | ||
|---|---|---|---|
| Exhaustion | Low | 25 | 22,3 |
| Moderate | 52 | 46,4 | |
| High | 29 | 25,9 | |
| Very high | 6 | 5,4 | |
| Spiritual removal | Low | 18 | 16,1 |
| Moderate | 60 | 53,6 | |
| High | 26 | 23,2 | |
| Very high | 8 | 7,1 | |
| Cognitive impairment | Low | 20 | 17,9 |
| Moderate | 63 | 56,3 | |
| High | 21 | 18,8 | |
| Very high | 8 | 7,1 | |
| Emotional detachment | Low | 19 | 17,0 |
| Moderate | 65 | 58,0 | |
| High | 20 | 17,9 | |
| Very high | 8 | 7,1 | |
| Psychological problems | Low | 20 | 17,9 |
| Moderate | 57 | 50,9 | |
| High | 28 | 25,0 | |
| Very high | 7 | 6,3 | |
| Psychosomatic problems | Low | 21 | 18,8 |
| Moderate | 60 | 53,6 | |
| High | 25 | 22,3 | |
| Very high | 6 | 5,4 |
The mental resilience scale ranged, in the specific sample, from 1.0 to 4.8 points with the mean value being 3.2 points (SD = 0.7 points). The scale for quality of life ranged, in this sample, from 1.0 to 4.8 points with a mean value of 3.2 points (SD = 0.7 points).
In order to find the factors independently related to the quality-of-life scale, a multivariate linear regression was performed with the score on this scale as the dependent variable and the demographics, financial data of the participants, burnout dimensions and mental resilience as independent variables. The results of the analysis, with the Enter method, are given in Table 3.
The predictive model was statistically significant F(15,95) = 4.27, p<0.001, and it was found that the 13 predictor variables together explained 40.0% of the variability in the quality of life scale. The most significant predictor appeared to be the exhaustion dimension (β = -0.358, t = -2.78, p = 0.007), followed by the resilience scale (β = 0.215, t = 2.12, p = 0.037). Specifically: • Increased exhaustion was associated with worse quality of life. • Increased mental resilience was associated with better quality of life.
To find the factors independently related to the exhaustion dimension, a multivariate linear regression was performed with the score on this dimension as the dependent variable and the participants' demographic and work data and the mental resilience scale as independent variables. The results of the analysis, with the Enter method, are given in Table 4.
The predictive model was statistically significant F(9,101) = 2.86, p = 0.005, and it was found that the 7 predictor variables together explained 20.0% of the variability in the burnout dimension. The most significant predictor appeared to be the mental resilience scale (β = -0.389, t = -4.29, p< 0.001), followed by work status among those working as employees compared to the self-employed (β = 0.287, t = 2.19, p = 0.037). Specifically: • Increased resilience was associated with reduced burnout. • Employees had more burnout compared to freelancers.
In order to find the factors independently related to the dimension of spiritual detachment, a multivariate linear regression was performed with the score on this dimension as the dependent variable and the demographic and work data of the participants and the mental resilience scale as independent variables. The results of the analysis, with the Enter method, are given in Table 5.
The prediction model was statistically significant F(9,101) = 2.01, p = 0.059, and it was found that the 7 predictor variables together explained 15.0% of the variability in the spiritual withdrawal dimension. The most significant predictor appeared to be the mental resilience scale (β = -0.22, t = -2.36, p = 0.020), followed by employment status among those employed as compared to the self-employed (β = 0.314, t = 2.31, p = 0.023). Specifically: • Increased mental resilience was associated with decreased mental detachment. • Employees had greater mental distance compared to freelancers.
In order to find the factors independently related to the dimension of mental dysfunction, a multivariate linear regression was performed with the score on this dimension as the dependent variable and the demographic and work data of the participants and the mental resilience scale as independent variables. The results of the analysis, with the Enter method, are given in Table 6.
The prediction model was statistically significant F(9,101) = 3.30, p = 0.001, and it was found that the 7 predictor variables together explained 23.0% of the variability in the cognitive dysfunction dimension. The most significant predictor appeared to be the mental resilience scale (β = -0.428, t = -4.79, p<0.001). Specifically, increased mental resilience was associated with decreased cognitive dysfunction.
In order to find the factors independently related to the dimension of emotional withdrawal, a multivariate linear regression was performed with the score on this dimension as the dependent variable and the demographic and work data of the participants and the mental resilience scale as independent variables. The results of the analysis, with the Enter method, are given in Table 7.
The predictive model was statistically significant F(9,101) = 2.39, p = 0.017, and it was found that the 7 predictor variables together explained 18.0% of the variability in the emotional withdrawal dimension. The most significant predictor appeared to be the mental resilience scale (β = -0.358, t = -3.88, p<0.001). Specifically, increased resilience was associated with decreased emotional withdrawal.
In order to find the factors independently related to the dimension of secondary symptoms of exhaustion (psychological and psychosomatic), a multivariate linear regression was performed with the score on this dimension as the dependent variable and the demographic and work data of the participants and the mental resilience scale as independent variables. The results of the analysis, with the Enter method, are given in Table 8.
The prediction model was statistically significant F(9,101) = 3.19, p = 0.002, and it was found that the 7 predictor variables together explained 22.0% of the variability in the dimension of secondary burnout symptoms (psychological and psychosomatic). The most significant predictor appeared to be the mental resilience scale (β = -0.439, t = -4.88, p<0.001). Specifically, increased mental resilience was associated with reduced psychological and psychosomatic burnout symptoms.
Discussion
The purpose of this research is to study the relationship between burnout syndrome and the variables of mental resilience and quality and enjoyment of life, in a sample with demographic differences in age, gender, work hierarchy, educational level and mental toughness.
The results of the data seem to agree with the research hypothesis that there is a negative correlation of burnout with quality of life and mental resilience. More specifically, through the analysis it was seen that the higher the mental resilience, the higher the percentages of quality of life are found and vice versa, revealing the positive correlation of these two variables. On the contrary, it was found that the higher the professional burnout and the dimensions that make it up (exhaustion, mental withdrawal, emotional withdrawal, psychological problems, psychosomatic problems, mental dysfunction) the lower levels of quality of life and mental resilience occur and vice versa, emphasizing the negative correlation between these two variables with that of burnout. These results were expected and are supported by the existing literature [15]. No significant differences appeared to be found according to the demographics of gender, education, private-public nature of the work, and the situation at the level of interpersonal relationships, a fact that may be due to randomness or the relatively limited sample.
However, the statistically significant findings related to the position and type of work are noteworthy. Through the analyses, it appeared that the employees experienced greater exhaustion and spiritual detachment compared to the freelancers. This possibly stems from the nature of the work, from the difficulty of flexibility of the employee, in contrast to the freelancer, from the different demands of the work and from the different type of communication with colleagues. The very nature of the free profession, where the worker is not necessarily subject to a work hierarchy regime, since he is used to making his own decisions and moving more autonomously in his work context. Such cases have also been found in older bibliographic reports, where the positive elements of freelancing are emphasized [16]. At the same time, the sense of high external control that a freelancer may have, due to the autonomous nature of the work, may reduce the likelihood of experiencing burnout, and this is consistent with findings identified in the general population regarding the association of external control and burnout [6]. Such results encourage the development of studies in the future in order to investigate specific parameters in order to highlight the relationship of work hierarchy with the occurrence of burnout in specific populations, especially in reference to the exploitation of employees by hierarchical superiors/supervisors. The arguments of the literature review and the results of the study can be useful to the community, to the private sector executives and to the wider society. A trigger is given to better understand the issues related to occupational burnout and the consequences of the syndrome, while the necessity of preventive measures is highlighted. They can direct the interest of public health and policy makers to take appropriate action to support workers. Further analysis of workers' experience of burnout could help communities develop accurate and timely educational and support campaigns to intervene and address the phenomenon.
References
- Maslach, C., & Leiter, M. P. (2016). Burnout. In Stress: Concepts, cognition, emotion, and behavior (pp. 351-357). Academic Press.
- Burke, R. J., Shearer, J. and Deszca, G. (1984). ‘Burnout among men and women in police work: An examination of the Cherniss model’, Journal of Health and Human Resources Administration, 7, 162-188.
- Maslach, C., Schaufeli, W. B., & Leiter, M. P. (2001). Job burnout. Annual review of psychology, 52(1), 397-422. [CrossRef]
- Maslach, C. & Leiter, M. P. (1997). The truth about burnout. San Francisco: Jossey Bass.
- Templeton, K., Bernstein, C. A., Sukhera, J., Nora, L. M., Newman, C., Burstin, H., & Busis, N. (2019). Gender-based differences in burnout: Issues faced by women physicians. NAM perspectives. [CrossRef]
- Leiter, M. P., Maslach, C., & Frame, K. (2015). Burnout. The Encyclopedia of Clinical Psychology, 1–7.
- Herrman, H., Stewart, D. E., Diaz-Granados, N., Berger, E. L., Jackson, B., & Yuen, T. (2011). What is resilience? The Canadian Journal of Psychiatry, 56(5), 258-265. [CrossRef]
- Friborg, O., Barlaug, D., Martinussen, M., Rosenvinge, J. H., & Hjemdal, O. (2005). Resilience in relation to personality and intelligence. International journal of methods in psychiatric research, 14(1), 29-42. [CrossRef]
- Cicchetti D, Curtis WJ. (2006) The developing brain and neural plasticity: implications for normality, psychopathology, and resilience. In: Cicchetti D, Cohen D, editors. Developmental psychopathology. Vol 2: developmental neuroscience. 2nd ed. New York (NY): Wiley & Sons, Ltd.; 2006. p 1–64.
- Salmela-Aro, K., & Upadyaya, K. (2018). Role of demands-resources in work engagement and burnout in different career stages. Journal of Vocational Behavior, 108, 190-200. [CrossRef]
- Ojo, A. O., Fawehinmi, O., & Yusliza, M. Y. (2021). Examining the predictors of resilience and work engagement during the COVID-19 pandemic. Sustainability, 13(5), 2902. [CrossRef]
- Schaufeli, W.B., De Witte, H. & Desart, S. (2019). Burnout Assessment Tool (BAT) Test Manual. KU Leuven, Belgium: Internal Report.
- Smith, B. W., Dalen, J., Wiggins, K., Tooley, E., Christopher, P., & Bernard, J. (2008). The brief resilience scale: assessing the ability to bounce back. International journal of behavioral medicine, 15(3), 194-200. [CrossRef]
- Endicott, J., Nee, J., Harrison, W., & Blumenthal, R. (1993). Quality of Life Enjoyment and Satisfaction Questionnaire: a new measure. Psychopharmacology bulletin.
- Anand, M., & Arora, D. (2009). Burnout, life satisfaction and quality of life among executives of multinational companies. Journal of the Indian Academy of applied Psychology, 35(1), 159-164.
- Jamal, M. (2007). Burnout and self-employment: a cross-cultural empirical study. Stress and Health: Journal of the International Society for the Investigation of Stress, 23(4), 249-256. [CrossRef]
Graph 1.
Educational level of participants
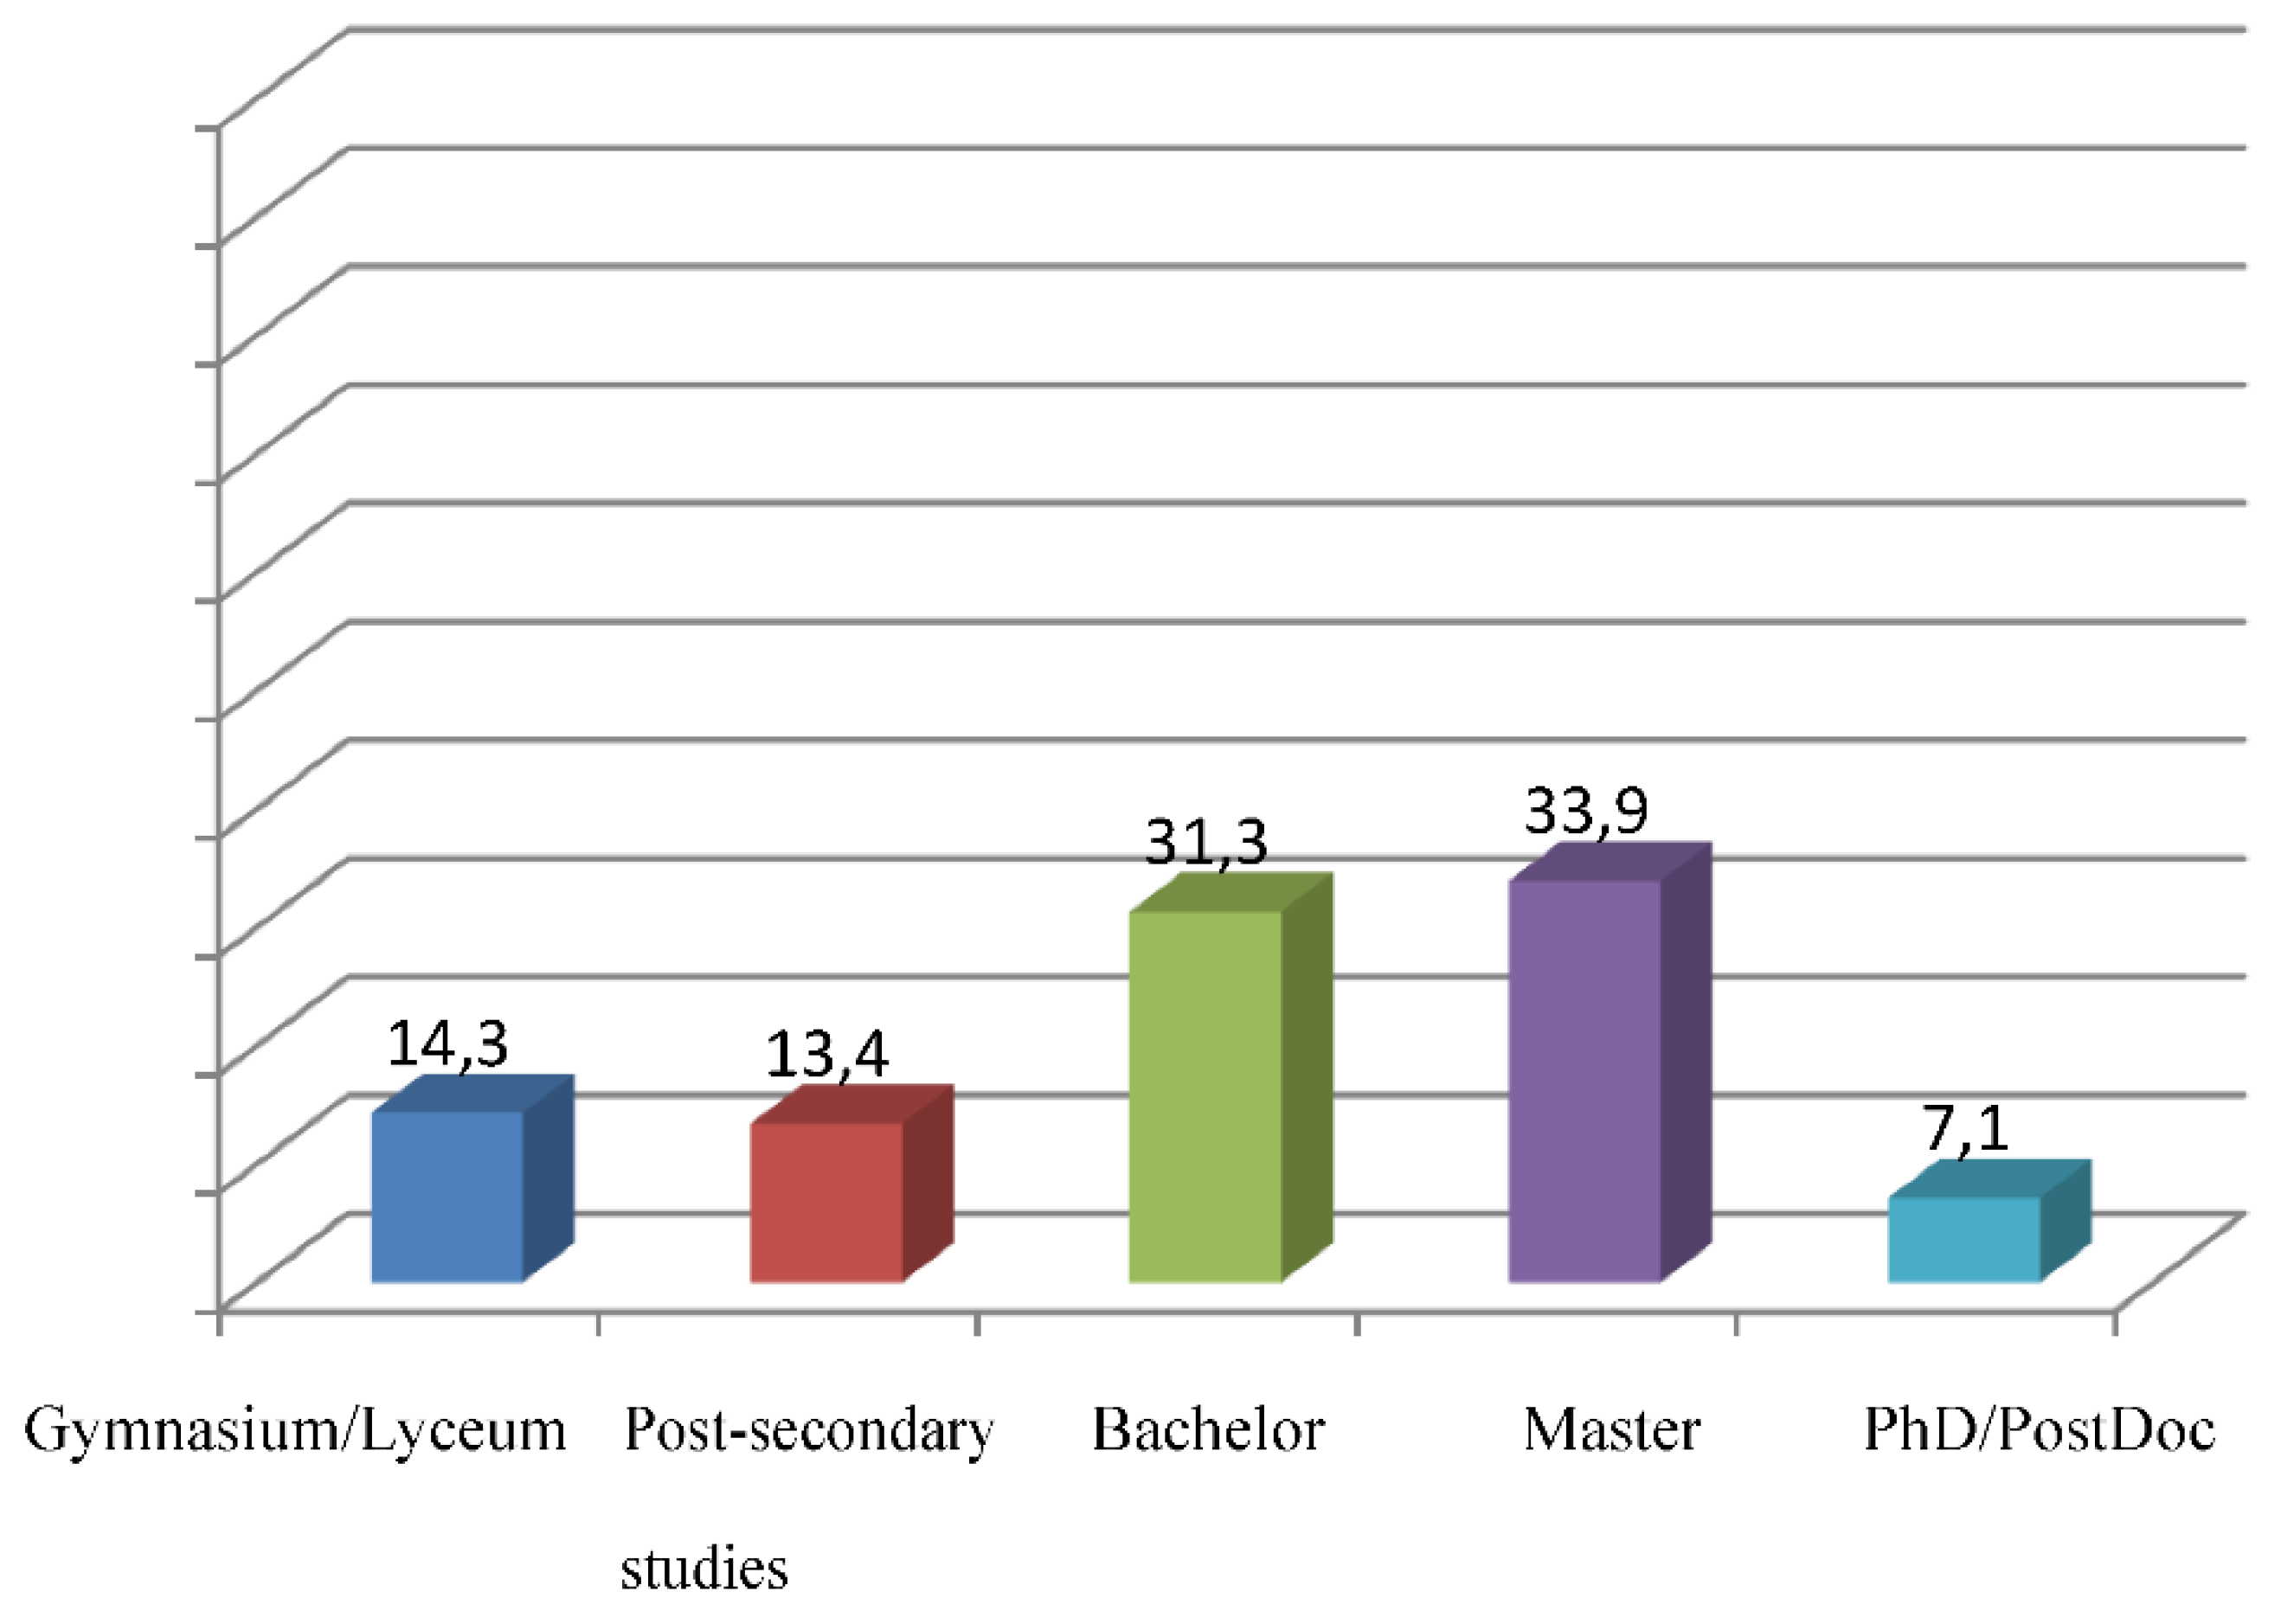
Table 1.
Demographics and employment data.
| Ν | % | ||
|---|---|---|---|
| What gender do you identify with? | Male | 41 | 36,6 |
| Female | 70 | 62,5 | |
| Non binary | 1 | 0,9 | |
| What is your age? | 18-39 | 54 | 48,2 |
| 40-64 | 56 | 50,0 | |
| 65+ | 2 | 1,8 | |
| What is your marital status? | Single | 68 | 60,7 |
| Married | 44 | 39,3 | |
| What is the educational level that you have successfully completed? | Gymnasium/Lyceum | 16 | 14,3 |
| Post-secondary studies | 15 | 13,4 | |
| Bachelor | 35 | 31,3 | |
| Master | 38 | 33,9 | |
| PhD/PostDoc | 8 | 7,1 | |
| What is your current employment situation? | Freelancer | 19 | 17,0 |
| Executive/Employee in a Position of Responsibility | 29 | 25,9 | |
| Employee | 64 | 57,1 | |
| What field do you work in? | Public Sector | 28 | 25,0 |
| Private Sector | 84 | 75,0 |
Table 3.
Multiple linear regression results with dependent variable scale quality of life.
| Model | Independent variables | β + | SE ++ | b‡ | t |
|---|---|---|---|---|---|
| F(15,95) = 4,27, p < 0,001, R2 = 0,40 |
What is your marital status? (Married vs. Single) |
1,602 | 3,719 | 0,042 | 0,43 |
| What field do you work in? (Private vs. Public) | -5,904 | 4,030 | -0,137 | -1,47 | |
| Sex (Female vs. Male) |
2,870 | 3,489 | 0,074 | 0,82 | |
| Age (40+ vs. 18-39) |
4,237 | 3,666 | 0,113 | 1,16 | |
| Higher education level | |||||
| Up to Post-secondary Studies vs. Postgraduate or higher studies | 1,029 | 4,358 | ,024 | 0,24 | |
| Undergraduate Studies vs. Postgraduate or Higher Studies | -5,498 | 4,215 | -,136 | -1,30 | |
| Current employment situation | |||||
| Executive/Employee in a Position of Responsibility vs. Freelance professional | -1,611 | 5,283 | -0,037 | -0,31 | |
| Employee vs. Freelancer professional | -3,953 | 4,697 | -0,104 | -0,84 | |
| Exhaustion | -9,097 | 3,270 | -0,358 | -2,78 ** | |
| Spiritual removal | 1,570 | 2,556 | 0,075 | 0,61 | |
| Cognitive impairment | ,795 | 2,503 | 0,036 | 0,32 | |
| Emotional detachment | -2,219 | 2,486 | -0,090 | -0,89 | |
| Psychological problems | -2,035 | 2,902 | -0,092 | -0,70 | |
| Psychosomatic problems | -,504 | 2,450 | -0,022 | -0,21 | |
| Mental Resilience Scale | 5,400 | 2,553 | 0,215 | 2,12 * |
+ Dependency coefficient. ++ Standard error ‡Standard coefficient. * p<,05, ** p<,01, *** p<,001.
Table 4.
Results of multiple linear regression with dependent variable dimension Exhaustion.
| Model | Independent variables | β + | SE ++ | b ‡ | t |
|---|---|---|---|---|---|
| F(9,101) = 2,86, p = 0,005, R2 = 0,20 |
What is your marital status? (Married vs. Single) |
-0,016 | 0,023 | -0,073 | -0,68 |
| What field do you work in? (Private vs. Public) |
0,029 | 0,025 | 0,117 | 1,15 | |
| Sex (Female vs. Male) |
0,012 | 0,021 | 0,056 | 0,59 | |
| Age (40+ vs. 18-39) |
0,004 | 0,023 | 0,018 | 0,17 | |
| Higher education level | |||||
| Up to Post-secondary studies vs. Postgraduate or higher studies | -0,018 | 0,027 | -0,075 | -0,66 | |
| Undergraduate Studies vs. Postgraduate or Higher Studies | -0,030 | 0,026 | -0,130 | -1,16 | |
| Current employment situation | |||||
| Executive/Employee in a Position of Responsibility vs. Freelance professional | 0,059 | 0,032 | 0,241 | 1,82 | |
| Employee vs. Freelancer professional | 0,062 | 0,028 | 0,287 | 2,19 * | |
| Mental Resilience Scale | -0,055 | 0,013 | -0,389 | -4,29 *** |
Note. The analysis was done with logarithmic transformations. + dependency coefficient. ++ standard error ‡standard coefficient. * p<,05, ** p<,01, *** p<,001.
Table 5.
Results of multiple linear regression with dependent variable dimension spiritual removal.
| Model | Independent variables | β + | SE ++ | b ‡ | t |
|---|---|---|---|---|---|
| F(9,101) = 2,01, p = 0,049, R2 = 0,15 |
What is your marital status? (Married vs. Single) |
-0,036 | 0,038 | -0,104 | -0,93 |
| What field do you work in? (Private vs. Public) |
0,083 | 0,041 | ,215 | 2,03 | |
| Sex (Female vs. Male) |
-0,033 | 0,034 | -0,095 | -0,970 | |
| Age (40+ vs. 18-39) |
0,001 | 0,038 | <0,001 | 0,001 | |
| Higher education level | |||||
| Up to Post-secondary Studies/vs Postgraduate or higher studies | -0,017 | 0,044 | 0-,045 | 0-,38 | |
| Undergraduate Studies vs. Postgraduate or higher studies | 0,012 | 0,042 | 0,034 | 0,29 | |
| Current employment situation | |||||
| Executive/Employee in a Position Liability vs. Freelancer | 0,092 | 0,053 | 0,239 | 1,74 | |
| Employee vs. Freelancer professional | 0,106 | 0,046 | 0,314 | 2,31* | |
| Mental Resilience Scale | -0,050 | 0,021 | -0,222 | -2,36* |
Note. The analysis was done with logarithmic transformations. + dependency coefficient. ++ standard error. ‡ standard coefficient. * p<,05, ** p<,01, *** p<,001.
Table 6.
Results of multiple linear regression with dependent variable dimension cognitive impairment.
Table 6.
Results of multiple linear regression with dependent variable dimension cognitive impairment.
| Model | Independent variables | β + | SE ++ | b ‡ | t |
|---|---|---|---|---|---|
| F(9,101) = 3,30, p = 0,001, R2 = 0,23 |
What is your marital status? (Married vs. Single) |
-0,011 | 0,035 | -0,032 | -0,30 |
| What field do you work in? (Private vs. Public) |
0,022 | 0,037 | 0,059 | 0,58 | |
| Sex (Female vs. Male) |
-0,061 | 0,031 | -0,182 | -1,96 | |
| Age (40+ vs. 18-39) |
-0,012 | 0,034 | -0,039 | -0,36 | |
| Higher education level | |||||
| Up to Post-secondary Studies vs. Postgraduate or higher studies | -0,009 | 0,040 | -0,025 | -0,23 | |
| Undergraduate Studies vs. Postgraduate or Higher Studies | 0,031 | 0,038 | 0,091 | 0,82 | |
| Current employment situation | |||||
| Executive/Employee in a Position Liability vs. Freelancer | 0,023 | 0,048 | 0,062 | 0,47 | |
| Employee vs. Freelancer professional | 0,029 | 0,042 | 0,091 | 0,70 | |
| Mental Resilience Scale | -0,092 | 0,019 | -0,428 | -4,79 *** |
Note. The analysis was done with logarithmic transformations. + dependency coefficient. ++ standard error. ‡ standard coefficient. * p<,05, ** p<,01, *** p<,001.
Table 7.
Results of multiple linear regression with dependent variable dimension emotional distancing.
Table 7.
Results of multiple linear regression with dependent variable dimension emotional distancing.
| Model | Independent variables | β + | SE ++ | b ‡ | t |
|---|---|---|---|---|---|
| F(9,101) = 2,39, p = 0,017, R2 = 0,18 |
What is your marital status? (Married vs. Single) |
-0,023 | 0,034 | -0,073 | -0,67 |
| What field do you work in? (Private vs. Public) |
0,012 | 0,036 | 0,035 | 0,34 | |
| Sex (Female vs. Male) |
-0,032 | 0,030 | -0,102 | -1,062 | |
| Age (40+ vs. 18-39) |
0-,004 | 0,034 | -0,013 | -0,12 | |
| Higher education level | |||||
| Up to Post-secondary Studies/IEK vs. Postgraduate or higher studies | 0,042 | 0,040 | 0,121 | 1,05 | |
| Undergraduate Studies vs. Postgraduate or Higher Studies | 0,038 | 0,038 | 0,115 | 1,01 | |
| Current employment situation | |||||
| Executive/Employee in a Position Liability vs. Freelancer | 0,072 | 0,047 | 0,205 | 1,52 | |
| Employee vs. Freelancer professional | 0,043 | 0,041 | 0,139 | 1,04 | |
| Mental Resilience Scale | -0,073 | 0,019 | -0,358 | -3,88*** |
Note. The analysis was done with logarithmic transformations. + dependency coefficient. ++ standard error. ‡ standard coefficient. * p<,05, ** p<,01, *** p<,001.
Table 8.
Results of multiple linear regression with dependent variable dimension secondary symptoms of burnout.
Table 8.
Results of multiple linear regression with dependent variable dimension secondary symptoms of burnout.
| Model | Independent variables | β + | SE ++ | b ‡ | t |
|---|---|---|---|---|---|
| F(9,101) = 3,19, p = 0,002, R2 = 0,22 |
What is your marital status? (Married vs. Single) |
-0,021 | 0,027 | -0,080 | -0,75 |
| What field do you work in? (Private vs. Public) | 0,013 | 0,029 | 0,044 | 0,44 | |
| Sex (Female vs. Male) |
0,010 | 0,024 | 0,037 | 0,40 | |
| Age (40+ vs. 18-39) |
-0,023 | 0,027 | -0,091 | -0,84 | |
| Higher education level | |||||
| Up to Post-secondary Studies/IEK vs. Postgraduate or higher studies |
-0,007 | 0,032 | -0,024 | -0,22 | |
| Undergraduate Studies vs. Postgraduate or Higher Studies | -0,004 | 0,030 | -0,013 | -0,12 | |
| Current employment situation | |||||
| Executive/Employee in a Position Liability vs. Freelancer |
0,001 | 0,038 | -0,002 | -0,012 | |
| Employee vs. Freelancer professional |
-0,004 | 0,033 | -0,017 | -0,134 | |
| Mental Resilience Scale | -0,074 | 0,015 | -0,439 | -4,88*** |
Note. The analysis was done with logarithmic transformations. + dependency coefficient. ++ standard error. ‡ standard coefficient. * p<,05, ** p<,01, *** p<,001.
Disclaimer/Publisher’s Note: The statements, opinions and data contained in all publications are solely those of the individual author(s) and contributor(s) and not of MDPI and/or the editor(s). MDPI and/or the editor(s) disclaim responsibility for any injury to people or property resulting from any ideas, methods, instructions or products referred to in the content. |
© 2023 by the authors. Licensee MDPI, Basel, Switzerland. This article is an open access article distributed under the terms and conditions of the Creative Commons Attribution (CC BY) license (http://creativecommons.org/licenses/by/4.0/).
Copyright: This open access article is published under a Creative Commons CC BY 4.0 license, which permit the free download, distribution, and reuse, provided that the author and preprint are cited in any reuse.


