
Submitted:
16 November 2023
Posted:
17 November 2023
You are already at the latest version
Abstract
Chitosan nanoparticle delivery systems have potential for enhancing bone healing and addressing osteomyelitis. The objective was to deliver antimicrobial agents capable of preventing or treating osteomyelitis. Each formulation was optimized to achieve desired characteristics in terms of size (ranging from 100 to 400 nm), PDI (less than 0.5), zeta potential (typically negative), and in vitro release profiles for gentamicin. Entrapment percentages varied with gentamicin ranging from 10% to 65%. The chitosan nanoparticles exhibited substantial antimicrobial efficacy, particularly against both P. aeruginosa and MRSA, with zones of inhibition ranging from 13 to 24 mm and complete reduction in colony forming units observed between 3 to 24 hours. These chitosan nanoparticle formulations loaded with antimicrobials hold promise for addressing orthopedic complications.
Keywords:
Nanoparticles
; chitosan
; osteomyelitis
; drug delivery
; antimicrobials
; gentamicin.
1. Introduction
Naturally occurring polymers have garnered significant attention in medical science due to their biocompatibility with humans, versatile chemical structures, and environmentally friendly production processes [1]. Among these polymers, chitosan has been extensively investigated due to its ready availability in nature, derived from sources like shellfish, insects, and fungi, and its demonstrated biocompatibility with minimal adverse effects in humans [2,3,4]. Chitosan, the second most abundant organic polymer after cellulose, has found diverse applications in medical research, including wound dressings, tissue engineering, antimicrobial properties, and drug delivery [5,6,7,8,9,10,11].
Chitosan's unique properties have led to its exploration as a potential carrier for drugs and structural implants to enhance bone healing. Structurally akin to glycosaminoglycan, a vital component in collagen formation and bone matrix development, chitosan offers unique advantages in bone tissue applications [12,13]. It has demonstrated osteoinductive properties, attracting bone components like hydroxyapatite and initiating bone regeneration [14]. While most experiments have been conducted in animal models, such as rats, mice, rabbits, and pigs, they hold promise for human applications.
Historically, bone grafts involved harvesting bone tissue either from the patient or a donor (autografts or allografts) for transplantation. Materials like chitosan, owing to their structural resemblance to glycosaminoglycan, porosity facilitating nutrient transport, and vascularization, make them ideal candidates for synthetic bone grafts [12,13,15]. These scaffolds offer structural support for bone tissue and reduce the need for pre-surgery scrapings, lowering the risk of complications such as infection. Moreover, these scaffolds can be enriched with growth factors like BMP 2, 4, and 7 to enhance bone healing [15].
Chitosan-based hydrogels have also been employed as bone implants, releasing beneficial agents for bone healing and acting as carriers for drug delivery while providing structural support [16,17,18]. These hydrogels exhibit malleable properties in terms of shape, size, density, and drug-carrying capabilities. Recent research showcased a chitosan-based hydrogel's ability to serve as a vehicle for bone mesenchymal cell transplantation, resulting in reduced inflammation, enhanced vascularization, and tissue knitting in a rat model [18].
Chitosan nanoparticles have been harnessed to promote bone healing by delivering growth factors and other therapeutic agents [19]. Chitosan's ability to encapsulate and release a wide range of payloads, including antimicrobials, makes it a valuable candidate for bone infections such as osteomyelitis [20,21,22,23,24,25,26,27]. Its inherent antimicrobial properties and reputation as a reliable drug carrier further support its role as a vector for osteomyelitis treatment [28]. In vivo studies using rabbit models have demonstrated that chitosan nanoparticles loaded with vancomycin, when incorporated into chitosan hydrogels, promote bone regeneration and exert antimicrobial effects, offering potential solutions for osteomyelitis treatment [19,29].
The primary objective of this research was to develop an effective method for delivering gentamicin using a chitosan-based nanoparticle delivery system.
2. Results
2.1. Formulation Optimization
A spectrum of formulations was prepared utilizing varying concentrations of chitosan (ranging from 0.5% w/v to 2% w/v) and Tripolyphosphate -TPP (ranging from 0.1% w/v to 4% w/v). Following the preliminary optimization, which considered parameters such as size, polydispersity index (PDI), and zeta potential, three formulations were identified (detailed in Table 1). These chosen formulations then underwent a subsequent round of scrutiny involving adjustments to both chitosan and TPP concentrations, with a deliberate focus on concentrations below 1% w/v. The objective was to ascertain if such alterations could yield a more optimal formulation in terms of the aforementioned parameters.
When the chitosan concentrations were systematically altered while holding TPP concentration constant at 1% w/v, an intriguing outcome emerged. All formulations exhibited dimensions falling within the range of 200-391 nm, a range generally regarded as acceptable. However, no discernible pattern or trend could be deduced from this variation. The formulation that exhibited the most promising attributes within this supplementary investigation featured 0.8% w/v chitosan (with dimensions of 234.20 ± 21.28 nm, PDI of 0.296 ± 0.02, and zeta potential of 0.0338 ± 0.14). Nevertheless, it failed to surpass the performance of formulation C6, which consisted of a 1% chitosan to 1% TPP ratio. Consequently, it was deduced that the 1% chitosan: 1% TPP formulation (C6) would be the preferred choice for loading antimicrobial agents.
2.2. Effect of drug loading on size, PDI and zeta potential
2.3. Entrapment of gentamicin in the formulation.
Entrapment was determined by two methods, indirect entrapment, and direct entrapment. Both methods of determining entrapment are valid, but it was decided to examine both to facilitate greater accuracy and allow for adjustment if any inconsistencies were reported (Figure 2).
2.4. In vitro Release studies from loaded nanoparticles
The purpose of in vitro testing was to demonstrate the ability of the nanoparticles to release any entrapped agent into a pH neutral medium (pH 7.4 Phosphate buffer saline -PBS), as pH 7-7.4 is the optimum pH for bone resorption and remodeling to occur within the body [30]. Slow controlled release over the course of the full week was ideal, whereas burst release from which is a well-documented issue with chitosan formulations was considered undesirable [31]. In all cases sink conditions were maintained and cumulative release calculated. Figure 3 shows the cumulative percentage release of gentamicin from the loaded formulations.
2.4.1. In vitro Release Kinetics from chitosan nanoparticles
An analysis of the release profiles was conducted to elucidate the specific release kinetics exhibited by each formulation. The particles were scrutinized to discern whether they conformed to zero-order, first-order, or Higuchi release kinetics. The R2 values presented in Table 2 were computed based on the release studies conducted for each loaded formulation. Among the formulations generated, the majority exhibited the most congruence with the Higuchi model of release kinetics. Two out of the three formulations demonstrated the Higuchi model as the best-fitting representation for their release profiles, indicative of controlled release from the nanoparticles. One of the formulations displayed first-order release kinetics (CG0.5), signifying that the release was contingent upon both internal and external drug concentrations.
2.5. Antimicrobial effects of gentamicin leaded chitosan nanoparticles
The antimicrobial efficacy of the CG formulations was evaluated against relevant bacterial strains to assess their competence in delivering antimicrobial payloads effectively. Assessment was conducted through both a zone of inhibition assay and a broth dilution assay.
2.5.1. Zones of inhibition produced from gentamicin loaded chitosan nanoparticles by well diffusion assay.
The loaded nanoparticles exhibited zones of inhibition in which the diameters increased with higher concentrations of loaded gentamicin, as depicted in Figure 4a and 4b (P < 0.001). In contrast, the unloaded C6 nanoparticles failed to produce any inhibition zone against Pseudomonas aeruginosa (DSM50071) and Methicillin Resistant Staphylococcus Aureus (ATCC43300), indicating that the chitosan bound within the nanoparticle matrix did not possess inherent antimicrobial effects against both organisms. This observation suggests that any observed inhibition zones were attributed to the drug released from the nanoparticles. The inhibition zones generated by various nanoparticle formulations against P. aeruginosa are presented in Figure 4a, while those against MRSA can be observed in Figure 4b.
2.5.2. Broth Dilution Assay
The broth dilution assays conducted for each formulation aimed to illustrate that the suspended nanoparticles could release their antimicrobial payload into a PBS medium over a 24-hour period. Similar to the well diffusion assay, the reduction in colony forming units (CFU) was reliant on both the nanoparticles' capacity to effectively release an adequate amount of antimicrobial and the susceptibility of the bacterial strain to the specific antimicrobial under consideration. The decline in colony forming units (CFU) of various bacterial strains over time following treatment with gentamicin-loaded formulations is depicted in Figure 5.
3. Discussion
Chitosan:TPP nanoparticles were formulated by adding TPP to a chitosan solution, inducing crosslinking and nanoparticle formation through stirring. This process incorporates agents into the chitosan:TPP matrix. These nanoparticles offer advantages in drug delivery and bone healing. Chitosan is biocompatible, biodegradable, and promotes osseointegration, and can deliver drugs to bone tissue. While used in bone applications, limited data exists on free nanoparticles in bone tissue. Desired loaded nanoparticle parameters include size 100-400 nm, PDI <0.5, and negative zeta potential (-20 to -40 mV). Unloaded particles should meet these criteria but be closer to 100 nm in size due to agent entrapment [31,32,33].
Variations in TPP and chitosan concentrations significantly impact the size and stability of the resulting particles. This influence extends beyond the particle composition and extends to the rate of the crosslinking reaction, a factor that has been shown to substantially modify particle properties [34]. Formulations created with 0.5% and 1% w/v chitosan (C1-C8) exhibited sizes below 600 nm (ranging from 120 to 560 nm) and maintained acceptable PDI values (ranging from 0.2 to 0.46), consistent with prior research findings [35]. However, formulations stemming from 1.5% and 2% w/v chitosan (C9-16) displayed considerable fluctuations in both size and PDI values. Previous studies have underscored the strong influence of chitosan concentration on these parameters [35,36], emphasizing that extreme concentrations of both chitosan and TPP can yield variable outcomes [36,37].
Most zeta potentials were positive but are so close to zero they could be considered neutral and this is also true in the case of the negative zeta potentials. It would normally be expected that with variation of TPP and chitosan that the zeta potential would become more positive or negative depending on which agent took predominance on the surface of the particle as has been demonstrated in various other studies [37,38].
Unloaded nanoparticles were comprised of chitosan polymer and TPP crosslinker in varying ratios to one another. As has been demonstrated varying these ratios will lead to varying effects on the particles size, PDI and zeta potential. When loaded with an active or model agent, those agents will influence the characteristics of the particles. Size is the characteristic with the most predictable change that occurs after entrapment [39]. Typically, when a drug is loaded, sterically it will be contained within the matrix, and it will cause the diameter of the particle to expand. Changes to zeta potential can also be predicted based on the charge held by the agent being loaded i.e., a negatively charged agent will lead to a more negative zeta potential [40]. PDI is more difficult to predict as there are various factors that can affect PDI such as, surface area, free energy within the system and forces of attraction/repulsion between particles.
Gentamicin loading was anticipated to increase particle size as the drug's incorporation into the chitosan : TPP matrix displaces space and causes swelling, resulting in larger particles than their unloaded counterparts. It is reasonable to expect a more significant size increase with higher drug loading. The effect on polydispersity index (PDI) depends on the interaction between the entrapped drug and nanoparticle matrix, making it challenging to predict. Zeta potential was expected to correlate with the charge of the entrapped drug, affecting surface charge. An increase in loading concentration led to more drug within the particles. Gentamicin presence was expected to generate a positive zeta potential, and there was indeed a significant increase in size with increasing gentamicin loading (P < 0.001). PDI values met the predetermined criteria, staying below 0.5.
Figure 2 illustrates that gentamicin resulted in lower zeta potentials than the unloaded nanoparticles. This contradicts the expected outcome, where gentamicin would increase zeta potentials due to its positive charge and presence within the nanoparticle matrix, as demonstrated in previous work [31,41]. This discrepancy could be attributed to interactions between gentamicin and TPP, neutralizing surface charge as the polycationic gentamicin may attract more anionic TPP. There was no significant difference in zeta potential with increasing gentamicin concentration.
As the added drug amount increases, drug content within nanoparticles generally rises, while entrapment efficiency tends to decrease or stabilize [9]. Each formulation has an optimal drug capacity, and exceeding it hinders further drug incorporation, reducing entrapment efficiency [42]. Indirect entrapment values were chosen for future percentage release calculations, and direct entrapment was examined for validation. Nevertheless, the particles seem to have incorporated sufficient drug to exhibit antimicrobial effects [43]. It was expected that the formulations with the highest drug loading will release the most drug, as these formulations would have more drug present within their structure. Due to this, these formulations should be capable of maintaining a concentration gradient in sink conditions for longer, as the depot of drug within the particle will take longer to deplete.
Percentage release from the particles is displayed in Figure 3. In vitro cumulative release from gentamicin-loaded formulations aligns with expectations: that cumulative drug amount released over seven days significantly increases with loading concentration for CG0.5, 1, and 2 (P < 0.0001). Gentamicin release profiles exhibit rapid initial increases in concentration over the first day (Figure 3), followed by continuous gradual release over the subsequent seven days. In CG2 loaded particles, competition for drug exit via any developing pores may explain the release pattern. CG1 and CG2 exhibit a higher gentamicin percentage release than CG0.5. CG0.5 and CG1 release around 90% of their payload over seven days, while CG2 releases 57.44 ± 2.72%. Previous studies attempting to control gentamicin release achieved 70% release over 8 hours with complete release by 24 hours [44].
Ji et al. (2011) found chitosan:TPP nanoparticles loaded with salicylic acid and gentamicin released 45-85% of gentamicin in the first 10 hours, followed by an additional 10% release up to 70 hours, with maximum release of 55-90%. These release levels are comparable to the CG formulations, showing similar release after 24 hours [41].
Disk diffusion assays use small disks (5-10 mm) loaded with antimicrobials to demonstrate the ability of an agent to diffuse into the surrounding agar tissue and prevent growth of an inoculated microbe around the disk. The current study was carried out by adding the formulation to a well in the agar (10mm) [45]. The zones produced from the different nanoparticle formulations against P. aeruginosa are displayed in Figure 4a. Each loading concentration produced a sequentially larger zone (G0.5: 18 ± 0.82 mm, CG1: 21 ± 1.41 mm and CG2: 24 ± 0.82mm) and were demonstrated to be significantly different from one another (P< 0.005 ). These were comparable to a concentration of free gentamicin solution (0.5 mg/mL: 16.33 ± 0.47 mm, and 1 mg/mL: 20.33 ± 0.47mm). These results show that over the 24 hour incubation period the particles released enough gentamicin to cause antimicrobial effects and also based on other studies, they suggest that the strain is susceptible to gentamicin [46]. The zones generated against MRSA can be seen in Figure 4b. Against MRSA zones for both nanoparticles and standards were smaller than those generated against P. aeruginosa with an increase in loading concentration, the zone of inhibition increased in diameter (CG0.5: 13.17 ± 0.47 mm, CG1: 17.33 ± 0.94 mm and CG2: 18.17 ± 0.85 mm). In this instance the CG0.5 loaded particles were more comparable to the 0.25 mg/mL standard (14 ± 0.82 mm) and when error is considered both the CG1 and CG2 formulations are comparable to the 1 mg/mL gentamicin standard (17.33 ± 0.24 mm). These results show that the MRSA is more resistant to gentamicin that P. aeruginosa and is comparable to results demonstrated in previous work [47].
Based on the results from the release study and zone of inhibition assay generated from the gentamicin loaded particles, it was expected the results of the broth dilution assay to resemble similar trends that with increasing concentration of gentamicin loading, there would be a more rapid reduction in colony forming units over time. P. aeruginosa and S. aureus are both known to be susceptible to gentamicin. P. aeruginosa DSM50071 is susceptible to gentamicin, however MRSA ATC43300 has been demonstrated to be resistant to gentamicin at lower concentrations. Because of these differences in the strains, it was expected that MRSA would take longer to show an antimicrobial effect (if any at all) for each formulation when compared to the P. aeruginosa.
There was no observed reduction in microbial growth in the control sample. The results for the P. aeruginosa (as displayed in Figure 5a) were as expected, the CG2 formulation caused total reduction in CFU by 3 hours, followed by the CG1 formulation at 4 hours with the CG0.5 formulation taking up to eight hours to show total reduction in growth. The results concur with what was initially predicted as well as corroborating both the release and zone of inhibition results, that increasing loading concentration will lead to an increase in observed activity against P. aeruginosa. Other strains of pseudomonas have shown similar times taken to show complete reduction of CFU, taking between 3-24 hours to show complete eradication [48]. As with the previous bacterial strains, no reduction in bacterial growth was observed in the control samples. As predicted the MRSA required more gentamicin to be released from the particles to illicit the same response as seen in P. aeruginosa. As the results in Figure 5b show, the full 24 hours was required to reduce microbial growth to zero for all formulations. However, it can also be seen that there is a reduction in CFU starting in all formulations beginning from the 3-hour time point, with each formulation showing a gradual reduction in CFU until each formulation showed no growth at 24 hours. These results are similar to what was observed in a paper examining the pharmacodynamics of gentamicin against S. aureus using different concentrations of gentamicin, in which it was observed that there was a gradual reduction in Log CFU/mL over 24 hours, however they did not observe complete reduction in Log CFU/mL [49].
4. Materials and Methods
4.1. Materials
Medium molecular weight chitosan (99%), trifluroacetic acid (99%), methanol (99%), gentamicin sulphate (99%), acetic acid, KCl (99%), HCl (99.9%), dialysis tubing with a molecular weight cut off of 14,000 Da, tryptic soy broth and agar, and PBS tablets were all purchased from sigma Aldrich. All bacterial strains were grown from lawns already kept by the microbiology department. The strains used were P. aeruginosa DSM50071, and MRSA ATC43300.
4.2. Methods
4.2.1. Synthesis of Chitosan Nanoparticles.
1% w/v chitosan was dissolved in 5 %w/v acetic acid at 50 °C with continuous stirring until a homogenous solution was obtained. The crosslinker TPP was dissolved in deionised water (dH20) to get a concentration of 1%w/v. If a drug was to be loaded, an amount of powder was added into the chitosan solution to achieve a loading concentration (Table 3) under continuous stirring with a magnetic stirrer until the powder was dissolved. TPP solution was added dropwise into corresponding chitosan solutions with continuous stirring. The solution was stirred for an hour to ensure that the crosslinking reaction has completed before being centrifuged at 8000 rpm at room temperature for an hour. Any pellets formed were washed with dH20 and the centrifugation process was repeated. Pellets (and supernatants if drugs were being loaded) were collected for analysis.
4.2.2. In-vitro detection of Gentamicin
Release of gentamicin from chitosan nanoparticles was performed using a dialysis method. Briefly the pellet was resuspended in 10 mL PBS and 1 mL of this was placed in a cellulose dialysis membrane. This membrane was then immersed in 9 mL of PBS and placed into a shaking incubator at a temperature of 37 °C and a speed of 100 rpm. 1mL samples were then taken at pre-determined time intervals for analysis. Sink conditions were maintained by replacing samples taken with an equal volume of PBS. The samples were analysed using HPLC.
Detection of gentamicin was assessed by reversed phase HPLC using a Waters-Breeze system with a UV detector set to 254 nm. Reverse phase HPLC was utilised using a Phenomenex Luna C18 column 100A (150 x 4.6 mm) with a 5 μm particle size at room temperature, as a stationary phase and a 10:90 methanol: 0.1 % v/v Tetrafluroacetic acid (TFA) in dH20 as a mobile phase with a flow rate of 1 mL/min. The injection volume was 150 μL. Standards were injected before and after each set of samples consisting of 0.2, 0.4, 0.6, 0.8, and 1 mg/mL Gentamicin to demonstrate consistency of readings.
4.2.3. Chitosan nanoparticle Entrapment
Pellets and supernatants were both analysed to determine direct and indirect entrapment respectively.
4.2.3.1. Indirect entrapment
Supernatants were analysed using an appropriate method for the drug being examined. When examining nanoparticles containing gentamicin, HPLC was used as described in section 4.2.2 to determine the concentration in the supernatant. This was then extrapolated to determine the amount of drug present in the supernatant. The amount of drug present in the supernatant was subtracted from the total amount of drug added initially: this indicated how much drug was left in the pellet and from this value an entrapment efficiency was calculated using equation 1.
4.2.3.2. Direct entrapment
Before analysis of a pellet could be performed it was destroyed by placing the pellet in a solution of 0.1 M HCL under continuous stirring for 24 hours at room temperature. The resulting solution was then centrifuged at 8000 rpm and the supernatant collected for analysis using the methods described previously for each drug. The entrapment efficiency was calculated using equation 2.
4.2.4. Antimicrobial studies
4.2.4.1. Plating of media
Tryptic Soy Agar (TSA) was used to culture the two aerobic strains P. aeruginosa and Methicillin resistant S. aureus. Media was prepared according to the manufacturers guidelines by dissolving in the appropriate solvent and then autoclaving to ensure that the media was sterile. Approximately 20 mL of TSA was transferred aseptically to an agar plate and allowed to cool and solidify. The plates were then placed in a cold room until required.
4.2.4.2. Growth of bacterial cultures
Aerobic bacteria (P. aeruginosa and Methicillin resistant S. aureus) were grown in Tryptic Soy Broth (TSB) overnight in an incubator at 37 ºC to a 0.5 McFarland standard. They were then streaked onto TSA plates using sterile swabs and incubated overnight and stored in a cold room until they were required for analysis.
4.2.4.3. Zone of Inhibition control Assay
As previously described a broth was produced and inoculated with a strain of bacteria at 0.5 McFarland standard. 100 μL of the broth was then placed onto an agar plate and using an L-shaped spreader was evenly distributed across the surface of the agar. Using a sterile 1 mL pipette tip, wells were dug into the agar in a pattern displayed in Figure 6. In each well 50 μL of sample was placed, allowing each plate to hold triplicates for each sample set being investigated. A range of standards listed in Table 4 were plated depending on which strain was being investigated. Control plates containing unloaded nanoparticles and empty wells were also plated. Plates were incubated in a manner appropriate to the strain being investigated overnight. After incubation a ruler was used to measure any observed zone of inhibition. In the case of an irregular shaped zone the most representative diameter was taken.
4.2.4.4. Determination of antimicrobial activity of antimicrobial loaded nanoparticles
Antimicrobial activity of nanoparticles loaded with gentamicin was evaluated using a broth dilution method. A strain of bacteria was grown as previously outlined to a McFarland standard of 0.5 in an appropriate broth. This resulting solution was then diluted 1:100 with sterile PBS. 9 mL of this resulting suspension was then transferred aseptically to a bijou vial. The chitosan nanoparticle pellet being examined was resuspended in 10 mL of PBS and 1 mL of this was transferred to the bijou vial. A bijou vial was prepared in this manner for each nanoparticle formulation being examined, for controls and an additional setup is prepared for each sample at 24 hours. The vials were placed in an appropriate incubator and incubated at 37°C. 100 μL samples were taken at hourly intervals for the first eight hours and then an additional time point at 24 hours. Sample volume replacement was not required, as the volume being removed was too small to effect growth as previous work has demonstrated. Each sample taken was further serially diluted from a range of 10-1 to 10-6 and plated as displayed in Figure 2.4 and incubated overnight at 37 °C. Any colonies present on the plates were counted and using Equation (3), colony forming units (CFU) were determined.
5. Conclusions
Demonstrating that particles of an appropriate size and stability can be formed using chitosan and TPP and that those particles can be formulated to include and release several different agents. The safety of the particles and their loading agents were also demonstrated in an appropriate cell line. Of those agents it was also demonstrated that the antimicrobials were able to be released in sufficient amounts to exert their effects against several bacterial strains. The results shown through this paper have demonstrated efficacy when compared with various other formulations. As such it suggests these particles could be examined for loading into a scaffold or hydrogel to enhance bone healing and prevent/treat infection. The particles also show promise as a standalone treatment for these conditions as well, via direct injection to a particular bone injury. However further research would be required to determine in vivo efficacy.
Author Contributions
Conceptualization, methodology, Elliot Simpson and Deborah Lowry; formal analysis, and investigation, resources, data curation, Elliot Simpson; writing—original draft preparation, Humera Sarwar and Elliot Simpson.; writing—review and editing, visualization, supervision and review and editing, Deborah Lowry. All authors have read and agreed to the published version of the manuscript.
Funding
This research received no external funding.
Institutional Review Board Statement
Not applicable.
Data Availability Statement
The authors confirm that the data supporting the findings of this study are available within the article.
Conflicts of Interest
The authors declare no conflict of interest.
References
- Puiggalí, J.; Katsarava, R. Chapter 7—Bionanocomposites. In Clay-Polymer Nanocomposites; Jlassi, K., Chehimi, M.M., Thomas, S., Eds.; Elsevier: Amsterdam, The Netherlands, 2017; pp. 239–272. [Google Scholar] [CrossRef]
- Gupta, B.S. 1—Manufacture, types and properties of biotextiles for medical applications. In Biotextiles as Medical Implants; King, M.W., Gupta, B.S., Guidoin, R., Eds.; Woodhead Publishing: Sawston, UK, 2013; pp. 3–47. [Google Scholar] [CrossRef]
- Smirnova, N.V.; Kolbe, K.A.; Dresvyanina, E.N.; Grebennikov, S.F.; Dobrovolskaya, I.P.; Yudin, V.E.; Luxbacher, T.; Morganti, P. Effect of Chitin Nanofibrils on Biocompatibility and Bioactivity of the Chitosan-Based Composite Film Matrix Intended for Tissue Engineering. Materials 2019, 12, 1874. [Google Scholar] [CrossRef] [PubMed]
- Cheung, R.C.; Ng, T.B.; Wong, J.H.; Chan, W.Y. Chitosan: An Update on Potential Biomedical and Pharmaceutical Applications. Mar. Drugs 2015, 13, 5156–5186. [Google Scholar] [CrossRef] [PubMed]
- Hejazi, R.; Amiji, M. Chitosan-based gastrointestinal delivery systems. J. Control Release 2003, 89, 151–165. [Google Scholar] [CrossRef] [PubMed]
- Dai, T.; Tanaka, M.; Huang, Y.-Y.; Hamblin, M.R. Chitosan preparations for wounds and burns: Antimicrobial and wound-healing effects. Expert Rev. Anti-Infect. Ther. 2011, 9, 857–879. [Google Scholar] [CrossRef] [PubMed]
- Rodríguez-Vázquez, M.; Vega-Ruiz, B.; Ramos-Zúñiga, R.; Saldaña-Koppel, D.A.; Quiñones-Olvera, L.F. Chitosan and Its Potential Use as a Scaffold for Tissue Engineering in Regenerative Medicine. Biomed. Res. Int. 2015, 2015, 821279. [Google Scholar] [CrossRef] [PubMed]
- Kong, M.; Chen, X.G.; Xing, K.; Park, H.J. Antimicrobial properties of chitosan and mode of action: A state of the art review. Int. J. Food Microbiol. 2010, 144, 51–63. [Google Scholar] [CrossRef] [PubMed]
- Mohammed, M.A.; Syeda, J.T.M.; Wasan, K.M.; Wasan, E.K. An Overview of Chitosan Nanoparticles and Its Application in Non-Parenteral Drug Delivery. Pharmaceutics 2017, 9, 53. [Google Scholar] [CrossRef] [PubMed]
- Poth, N.; Seiffart, V.; Gross, G.; Menzel, H.; Dempwolf, W. Biodegradable chitosan nanoparticle coatings on titanium for the delivery of BMP-2. Biomolecules 2015, 5, 3–19. [Google Scholar] [CrossRef]
- Masarudin, M.J.; Cutts, S.M.; Evison, B.J.; Phillips, D.R.; Pigram, P.J. Factors determining the stability, size distribution, and cellular accumulation of small, monodisperse chitosan nanoparticles as candidate vectors for anticancer drug delivery: Application to the passive encapsulation of [(14)C]-doxorubicin. Nanotechnol. Sci. Appl. 2015, 8, 67–80. [Google Scholar] [CrossRef]
- Ershov, K.I.; Rusova, T.V.; Falameeva, O.V.; Sadovoy, M.A.; Aizman, R.I.; Kolosova, N.G. Bone matrix glycosaminoglycans and osteoporosis development in early aging OXYS rats. Adv. Gerontol. 2011, 1, 57–62. [Google Scholar] [CrossRef]
- Sultankulov, B.; Berillo, D.; Sultankulova, K.; Tokay, T.; Saparov, A. Progress in the Development of Chitosan-Based Biomaterials for Tissue Engineering and Regenerative Medicine. Biomolecules 2019, 9, 470. [Google Scholar] [CrossRef] [PubMed]
- Elkholy, S.; Yahia, S.; Awad, M.; Elmessiery, M. In vivo evaluation of β-CS/n-HA with different physical properties as a new bone graft material. Clin. Implant Dent. Relat. Res. 2018, 20, 416–423. [Google Scholar] [CrossRef] [PubMed]
- Levengood, S.K.L.; Zhang, M. Chitosan-based scaffolds for bone tissue engineering. J. Mater. Chem. B 2014, 2, 3161–3184. [Google Scholar] [CrossRef] [PubMed]
- Mahanta, A.K.; Senapati, S.; Paliwal, P.; Krishnamurthy, S.; Hemalatha, S.; Maiti, P. Nanoparticle-Induced Controlled Drug Delivery Using Chitosan-Based Hydrogel and Scaffold: Application to Bone Regeneration. Mol. Pharm. 2019, 16, 327–338. [Google Scholar] [CrossRef] [PubMed]
- Pellá, M.C.G.; Lima-Tenório, M.K.; Tenório-Neto, E.T.; Guilherme, M.R.; Muniz, E.C.; Rubira, A.F. Chitosan-based hydrogels: From preparation to biomedical applications. Carbohydr. Polym. 2018, 196, 233–245. [Google Scholar] [CrossRef] [PubMed]
- Viezzer, C.; Mazzuca, R.; Machado, D.C.; de Camargo Forte, M.M.; Gómez Ribelles, J.L. A new waterborne chitosan-based polyurethane hydrogel as a vehicle to transplant bone marrow mesenchymal cells improved wound healing of ulcers in a diabetic rat model. Carbohydr. Polym. 2020, 231, 115734. [Google Scholar] [CrossRef]
- Tao, F.; Cheng, Y.; Shi, X.; Zheng, H.; Du, Y.; Xiang, W.; Deng, H. Applications of chitin and chitosan nanofibers in bone regenerative engineering. Carbohydr. Polym. 2020, 230, 115658. [Google Scholar] [CrossRef]
- Jamil, B.; Habib, H.; Abbasi, S.A.; Ihsan, A.; Nasir, H.; Imran, M. Development of Cefotaxime Impregnated Chitosan as Nano-antibiotics: De Novo Strategy to Combat Biofilm Forming Multi-drug Resistant Pathogens. Front. Microbiol. 2016, 7, 179982. [Google Scholar] [CrossRef]
- Zaki, N.M.; Hafez, M.M. Enhanced antibacterial effect of ceftriaxone sodium-loaded chitosan nanoparticles against intracellular Salmonella typhimurium. AAPS PharmSciTech 2012, 13, 411–421. [Google Scholar] [CrossRef]
- Hasan, N.; Cao, J.; Lee, J.; Hlaing, S.P.; Oshi, M.A.; Naeem, M.; Ki, M.H.; Lee, B.L.; Jung, Y.; Yoo, J.W. Bacteria-Targeted Clindamycin Loaded Polymeric Nanoparticles: Effect of Surface Charge on Nanoparticle Adhesion to MRSA, Antibacterial Activity, and Wound Healing. Pharmaceutics 2019, 11, 236. [Google Scholar] [CrossRef]
- Abdelghany, S.M.; Quinn, D.J.; Ingram, R.J.; Gilmore, B.F.; Donnelly, R.F.; Taggart, C.C.; Scott, C.J. Gentamicin-loaded nanoparticles show improved antimicrobial effects towards Pseudomonas aeruginosa infection. Int. J. Nanomed. 2012, 7, 4053–4063. [Google Scholar] [CrossRef]
- Sabbagh, H.A.K.; Abudayeh, Z.; Abudoleh, S.M.; Alkrad, J.A.; Hussein, M.Z.; Hussein-Al-Ali, S.H. Application of multiple regression analysis in optimization of metronidazole-chitosan nanoparticles. J. Polym. Res. 2019, 26, 1–14. [Google Scholar] [CrossRef]
- Safhi, M.; Sivakumar, S.; Jabeen, A.; Zakir, F.; Islam, F.; Barik, B. Chitosan nanoparticles as a sustained delivery of penicillin G prepared by ionic gelation technique. J. Pharm. Res. 2014, 8, 1352–1354. [Google Scholar]
- Patel, B.K.; Parikh, R.H.; Aboti, P.S. Development of oral sustained release rifampicin loaded chitosan nanoparticles by design of experiment. J. Drug Deliv. 2013, 2013, 370938. [Google Scholar] [CrossRef]
- Kahdestani, S.A.; Shahriari, M.H.; Abdouss, M. Synthesis and characterization of chitosan nanoparticles containing teicoplanin using sol–gel. Polym. Bull. 2021, 78, 1133–1148. [Google Scholar] [CrossRef]
- Beenken, K.E.; Smith, J.K.; Skinner, R.A.; Mclaren, S.G.; Bellamy, W.; Gruenwald, M.J.; Spencer, H.J.; Jennings, J.A.; Haggard, W.O.; Smeltzer, M.S. Chitosan coating to enhance the therapeutic efficacy of calcium sulfate-based antibiotic therapy in the treatment of chronic osteomyelitis. J. Biomater. Appl. 2014, 29, 514–523. [Google Scholar] [CrossRef]
- Zhang, Y.; Liang, R.-j.; Xu, J.-j.; Shen, L.-f.; Gao, J.-q.; Wang, X.-p.; Wang, N.-n.; Shou, D.; Hu, Y. Efficient induction of antimicrobial activity with vancomycin nanoparticle-loaded poly (trimethylene carbonate) localized drug delivery system. Int. J. Nanomed. 2017, 12, 1201. [Google Scholar] [CrossRef] [PubMed]
- Galow, A.M.; Rebl, A.; Koczan, D.; Bonk, S.M.; Baumann, W.; Gimsa, J. Increased osteoblast viability at alkaline pH in vitro provides a new perspective on bone regeneration. Biochem. Biophys. Rep. 2017, 10, 17–25. [Google Scholar] [CrossRef]
- Lu, E.; Franzblau, S.; Onyuksel, H.; Popescu, C. Preparation of aminoglycoside-loaded chitosan nanoparticles using dextran sulphate as a counterion. J. Microencapsul. 2009, 26, 346–354. [Google Scholar] [CrossRef]
- Formulation and Evaluation of Metronidazole Loaded Chitosan Nanoparticles. 2016.
- Zhang, H.-l.; Wu, S.-h.; Tao, Y.; Zang, L.-q.; Su, Z.-q. Preparation and Characterization of Water-Soluble Chitosan Nanoparticles as Protein Delivery System. J. Nanomater. 2010, 2010, 898910. [Google Scholar] [CrossRef]
- Huang, Y.; Lapitsky, Y. Salt-assisted mechanistic analysis of chitosan/tripolyphosphate micro- and nanogel formation. Biomacromolecules 2012, 13, 3868–3876. [Google Scholar] [CrossRef] [PubMed]
- Sobhani, Z.; Mohammadi Samani, S.; Montaseri, H.; Khezri, E. Nanoparticles of Chitosan Loaded Ciprofloxacin: Fabrication and Antimicrobial Activity. Adv. Pharm. Bull. 2017, 7, 427–432. [Google Scholar] [CrossRef]
- Sreekumar, S.; Goycoolea, F.M.; Moerschbacher, B.M.; Rivera-Rodriguez, G.R. Parameters influencing the size of chitosan-TPP nano- and microparticles. Sci. Rep. 2018, 8, 4695. [Google Scholar] [CrossRef] [PubMed]
- Hosseinzadeh, H.; Atyabi, F.; Dinarvand, R.; Ostad, S.N. Chitosan-Pluronic nanoparticles as oral delivery of anticancer gemcitabine: Preparation and in vitro study. Int. J. Nanomed. 2012, 7, 1851–1863. [Google Scholar] [CrossRef]
- de Carvalho, F.G.; Magalhães, T.C.; Teixeira, N.M.; Gondim, B.L.C.; Carlo, H.L.; Dos Santos, R.L.; de Oliveira, A.R.; Denadai, Â.M.L. Synthesis and characterization of TPP/chitosan nanoparticles: Colloidal mechanism of reaction and antifungal effect on C. albicans biofilm formation. Mater. Sci. Eng. C Mater. Biol. Appl. 2019, 104, 109885. [Google Scholar] [CrossRef] [PubMed]
- Limsitthichaikoon, S.; Sinsuebpol, C. Electrostatic Effects of Metronidazole Loaded in Chitosan-Pectin Polyelectrolyte Complexes. Key Eng. Mater. 2019, 819, 27–32. [Google Scholar] [CrossRef]
- Kaur, S.; Vinay, C.; Narang, R.; Geeta, A. Comparative mucopenetration ability of metronidazole loaded chitosan and pegylated chitosan nanoparticles. Asian J. Pharm. Clin. Res. 2017, 10, 125–130. [Google Scholar] [CrossRef]
- Ji, J.; Hao, S.; Wu, D.; Huang, R.; Xu, Y. Preparation, characterization and in vitro release of chitosan nanoparticles loaded with gentamicin and salicylic acid. Carbohydr. Polym. 2011, 85, 803–808. [Google Scholar] [CrossRef]
- Gupta, A.; Aggarwal, G.; Singla, S.; Arora, R. Transfersomes: A novel vesicular carrier for enhanced transdermal delivery of sertraline: Development, characterization, and performance evaluation. Sci. Pharm. 2012, 80, 1061–1080. [Google Scholar] [CrossRef] [PubMed]
- Wong, S.S.; Woo, P.C.; Luk, W.K.; Yuen, K.Y. Susceptibility testing of Clostridium difficile against metronidazole and vancomycin by disk diffusion and Etest. Diagn. Microbiol. Infect. Dis. 1999, 34, 1–6. [Google Scholar] [CrossRef]
- Razei, A.; Cheraghali, A.M.; Saadati, M.; Fasihi Ramandi, M.; Panahi, Y.; Hajizade, A.; Siadat, S.D.; Behrouzi, A. Gentamicin-Loaded Chitosan Nanoparticles Improve Its Therapeutic Effects on Brucella-Infected J774A.1 Murine Cells. Galen. Med. J. 2019, 8, e1296. [Google Scholar] [CrossRef] [PubMed]
- Horváth, G.; Bencsik, T.; Ács, K.; Kocsis, B. Sensitivity of ESBL-Producing Gram-Negative Bacteria to Essential Oils, Plant Extracts, and Their Isolated Compounds.
- Henwood, C.J.; Livermore, D.M.; James, D.; Warner, M. Antimicrobial susceptibility of Pseudomonas aeruginosa: Results of a UK survey and evaluation of the British Society for Antimicrobial Chemotherapy disc susceptibility test. J. Antimicrob. Chemother. 2001, 47, 789–799. [Google Scholar] [CrossRef] [PubMed]
- Naimi, H.M.; Rasekh, H.; Noori, A.Z.; Bahaduri, M.A. Determination of antimicrobial susceptibility patterns in Staphylococcus aureus strains recovered from patients at two main health facilities in Kabul, Afghanistan. BMC Infect. Dis. 2017, 17, 737. [Google Scholar] [CrossRef]
- Rukholm, G.; Mugabe, C.; Azghani, A.O.; Omri, A. Antibacterial activity of liposomal gentamicin against Pseudomonas aeruginosa: A time-kill study. Int. J. Antimicrob. Agents 2006, 27, 247–252. [Google Scholar] [CrossRef]
- Galow, A.-M.; Rebl, A.; Koczan, D.; Bonk, S.M.; Baumann, W.; Gimsa, J. Increased osteoblast viability at alkaline pH in vitro provides a new perspective on bone regeneration. Biochem. Biophys. Rep. 2017, 10, 17–25. [Google Scholar] [CrossRef]
Figure 1.
Particle size, PDI (a) and zeta potential (b) of formulation C6 chitosan: TPP nanoparticles loaded with different concentrations of gentamicin.
Figure 1.
Particle size, PDI (a) and zeta potential (b) of formulation C6 chitosan: TPP nanoparticles loaded with different concentrations of gentamicin.
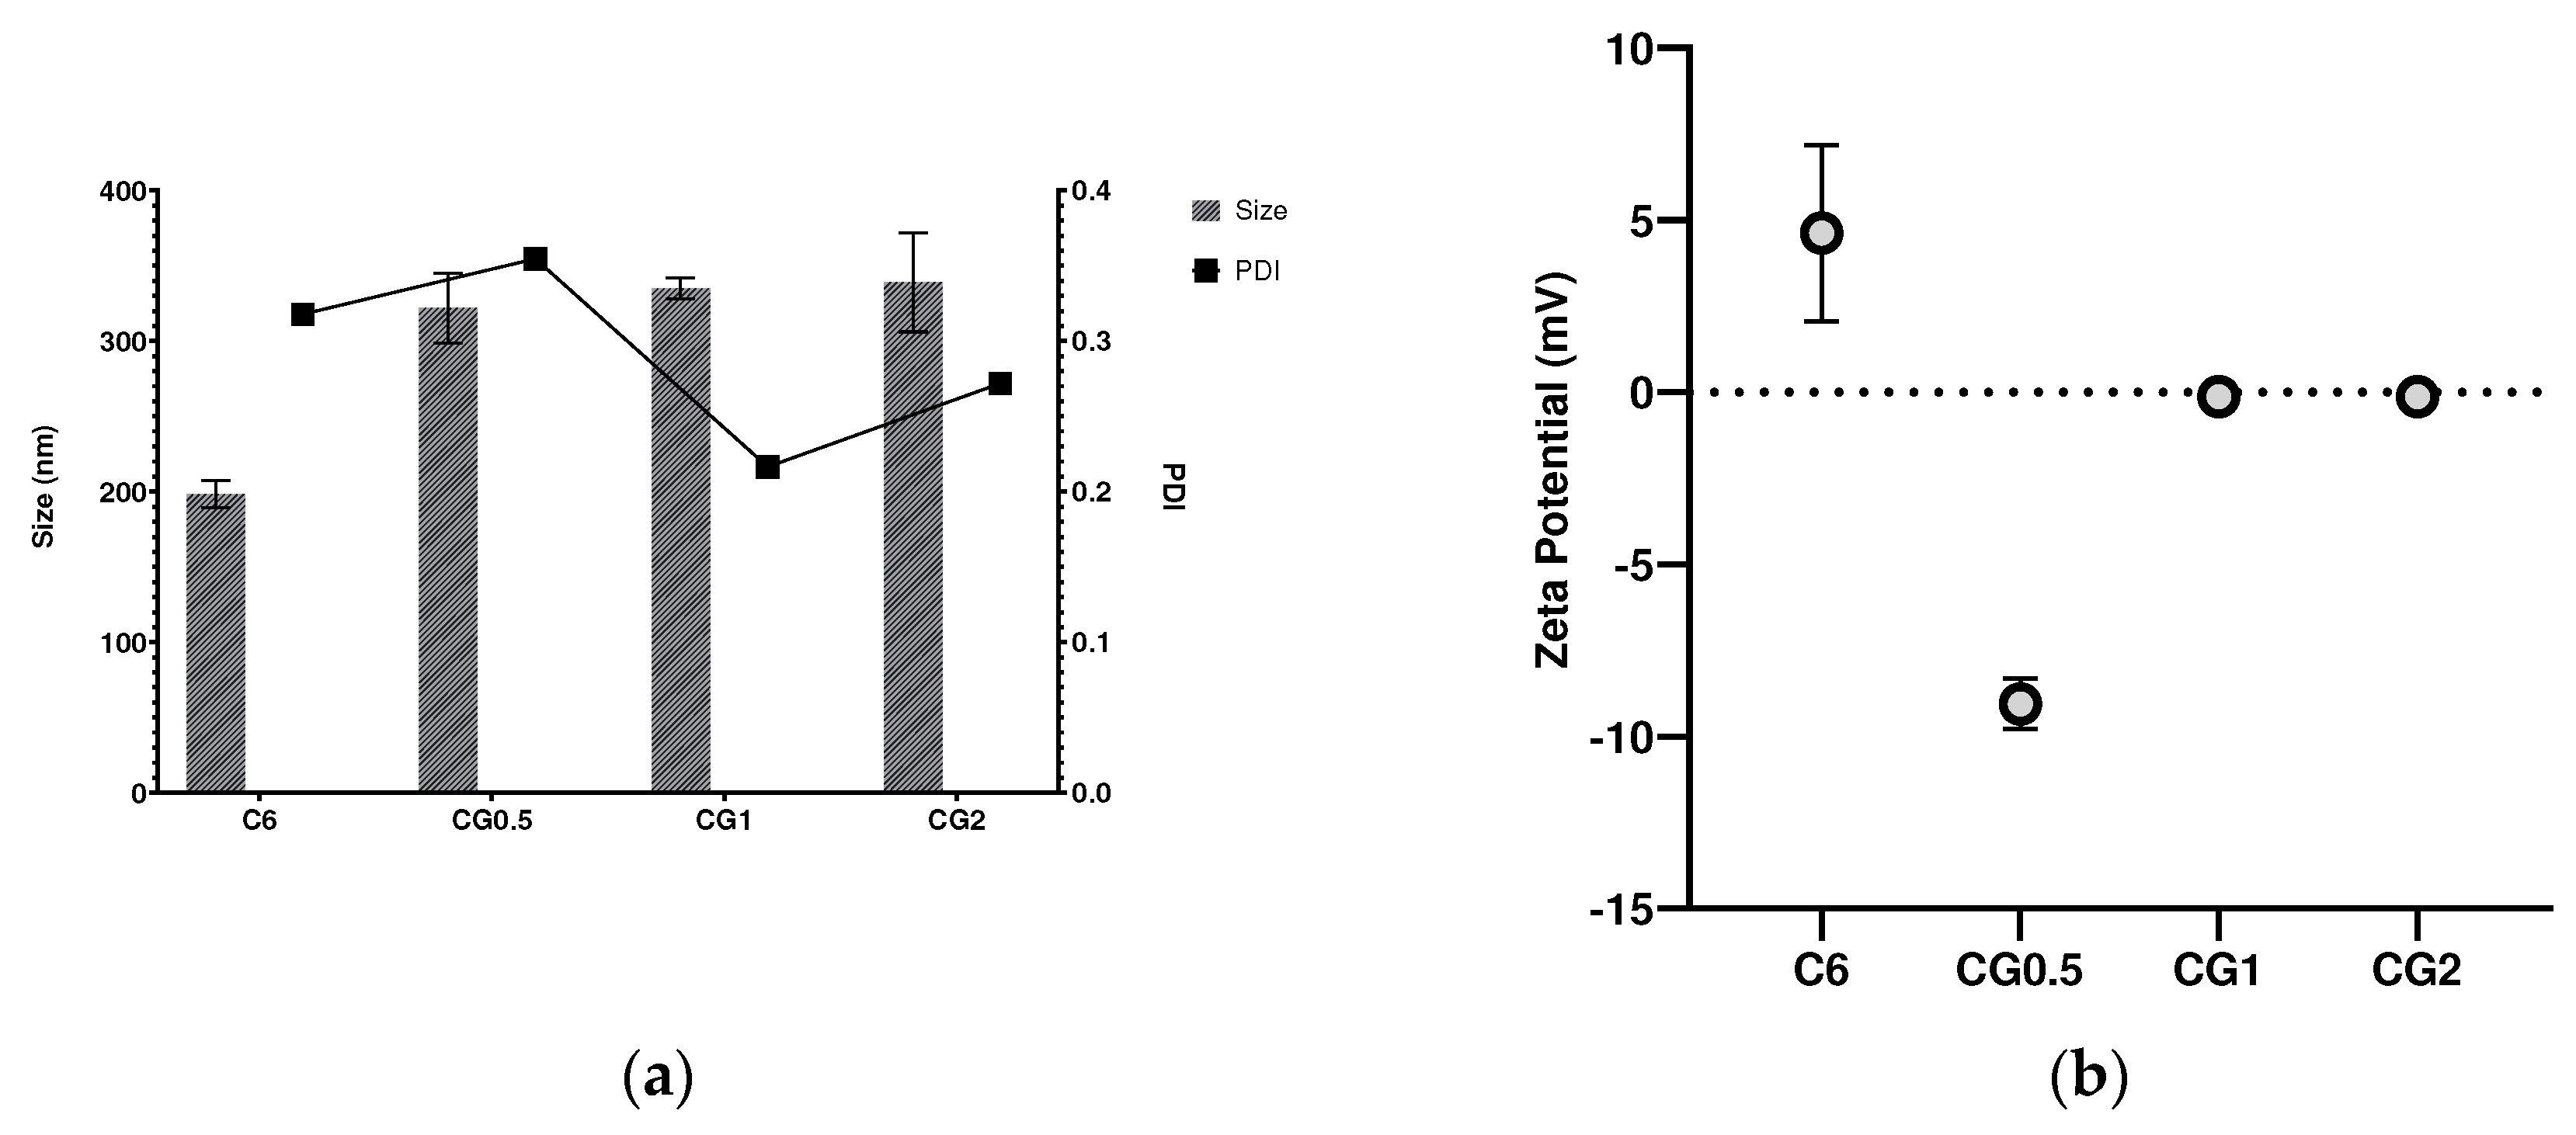
Figure 2.
Direct and Indirect entrapment efficiencies of C6 chitosan: TPP nanoparticles loaded with different concentrations of gentamicin.
Figure 2.
Direct and Indirect entrapment efficiencies of C6 chitosan: TPP nanoparticles loaded with different concentrations of gentamicin.
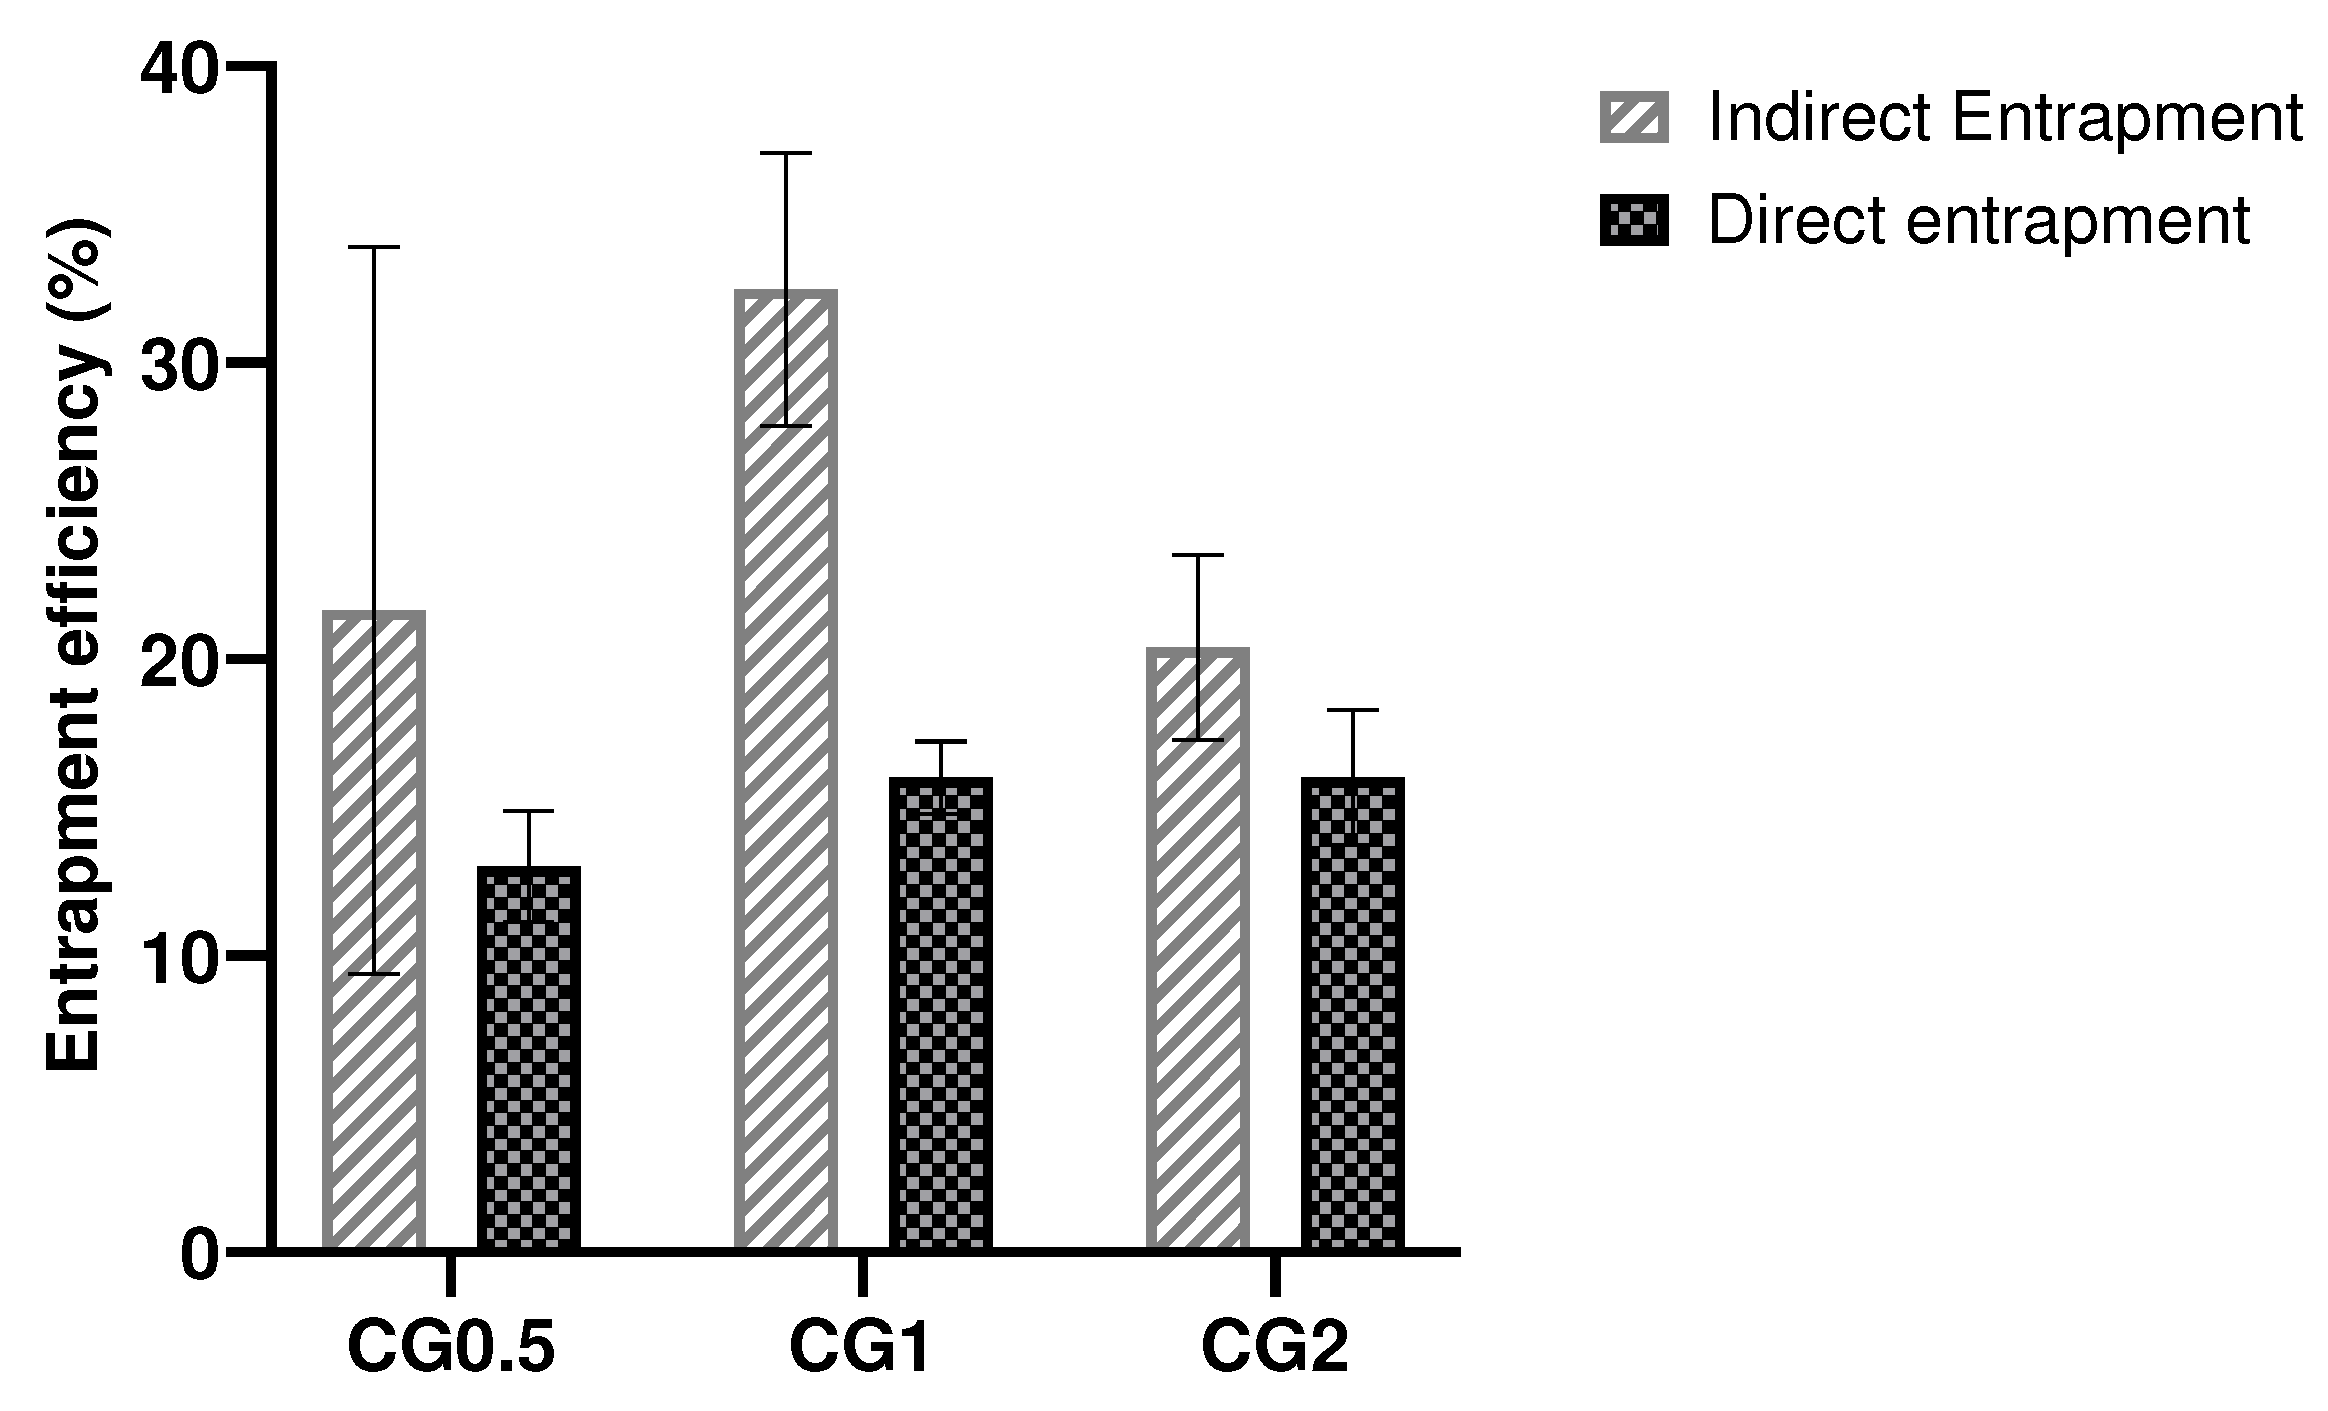
Figure 3.
In vitro cumulative percentage release of gentamicin from Chitosan nanoparticles loaded with various concentrations gentamicin over seven days (n=3).
Figure 3.
In vitro cumulative percentage release of gentamicin from Chitosan nanoparticles loaded with various concentrations gentamicin over seven days (n=3).
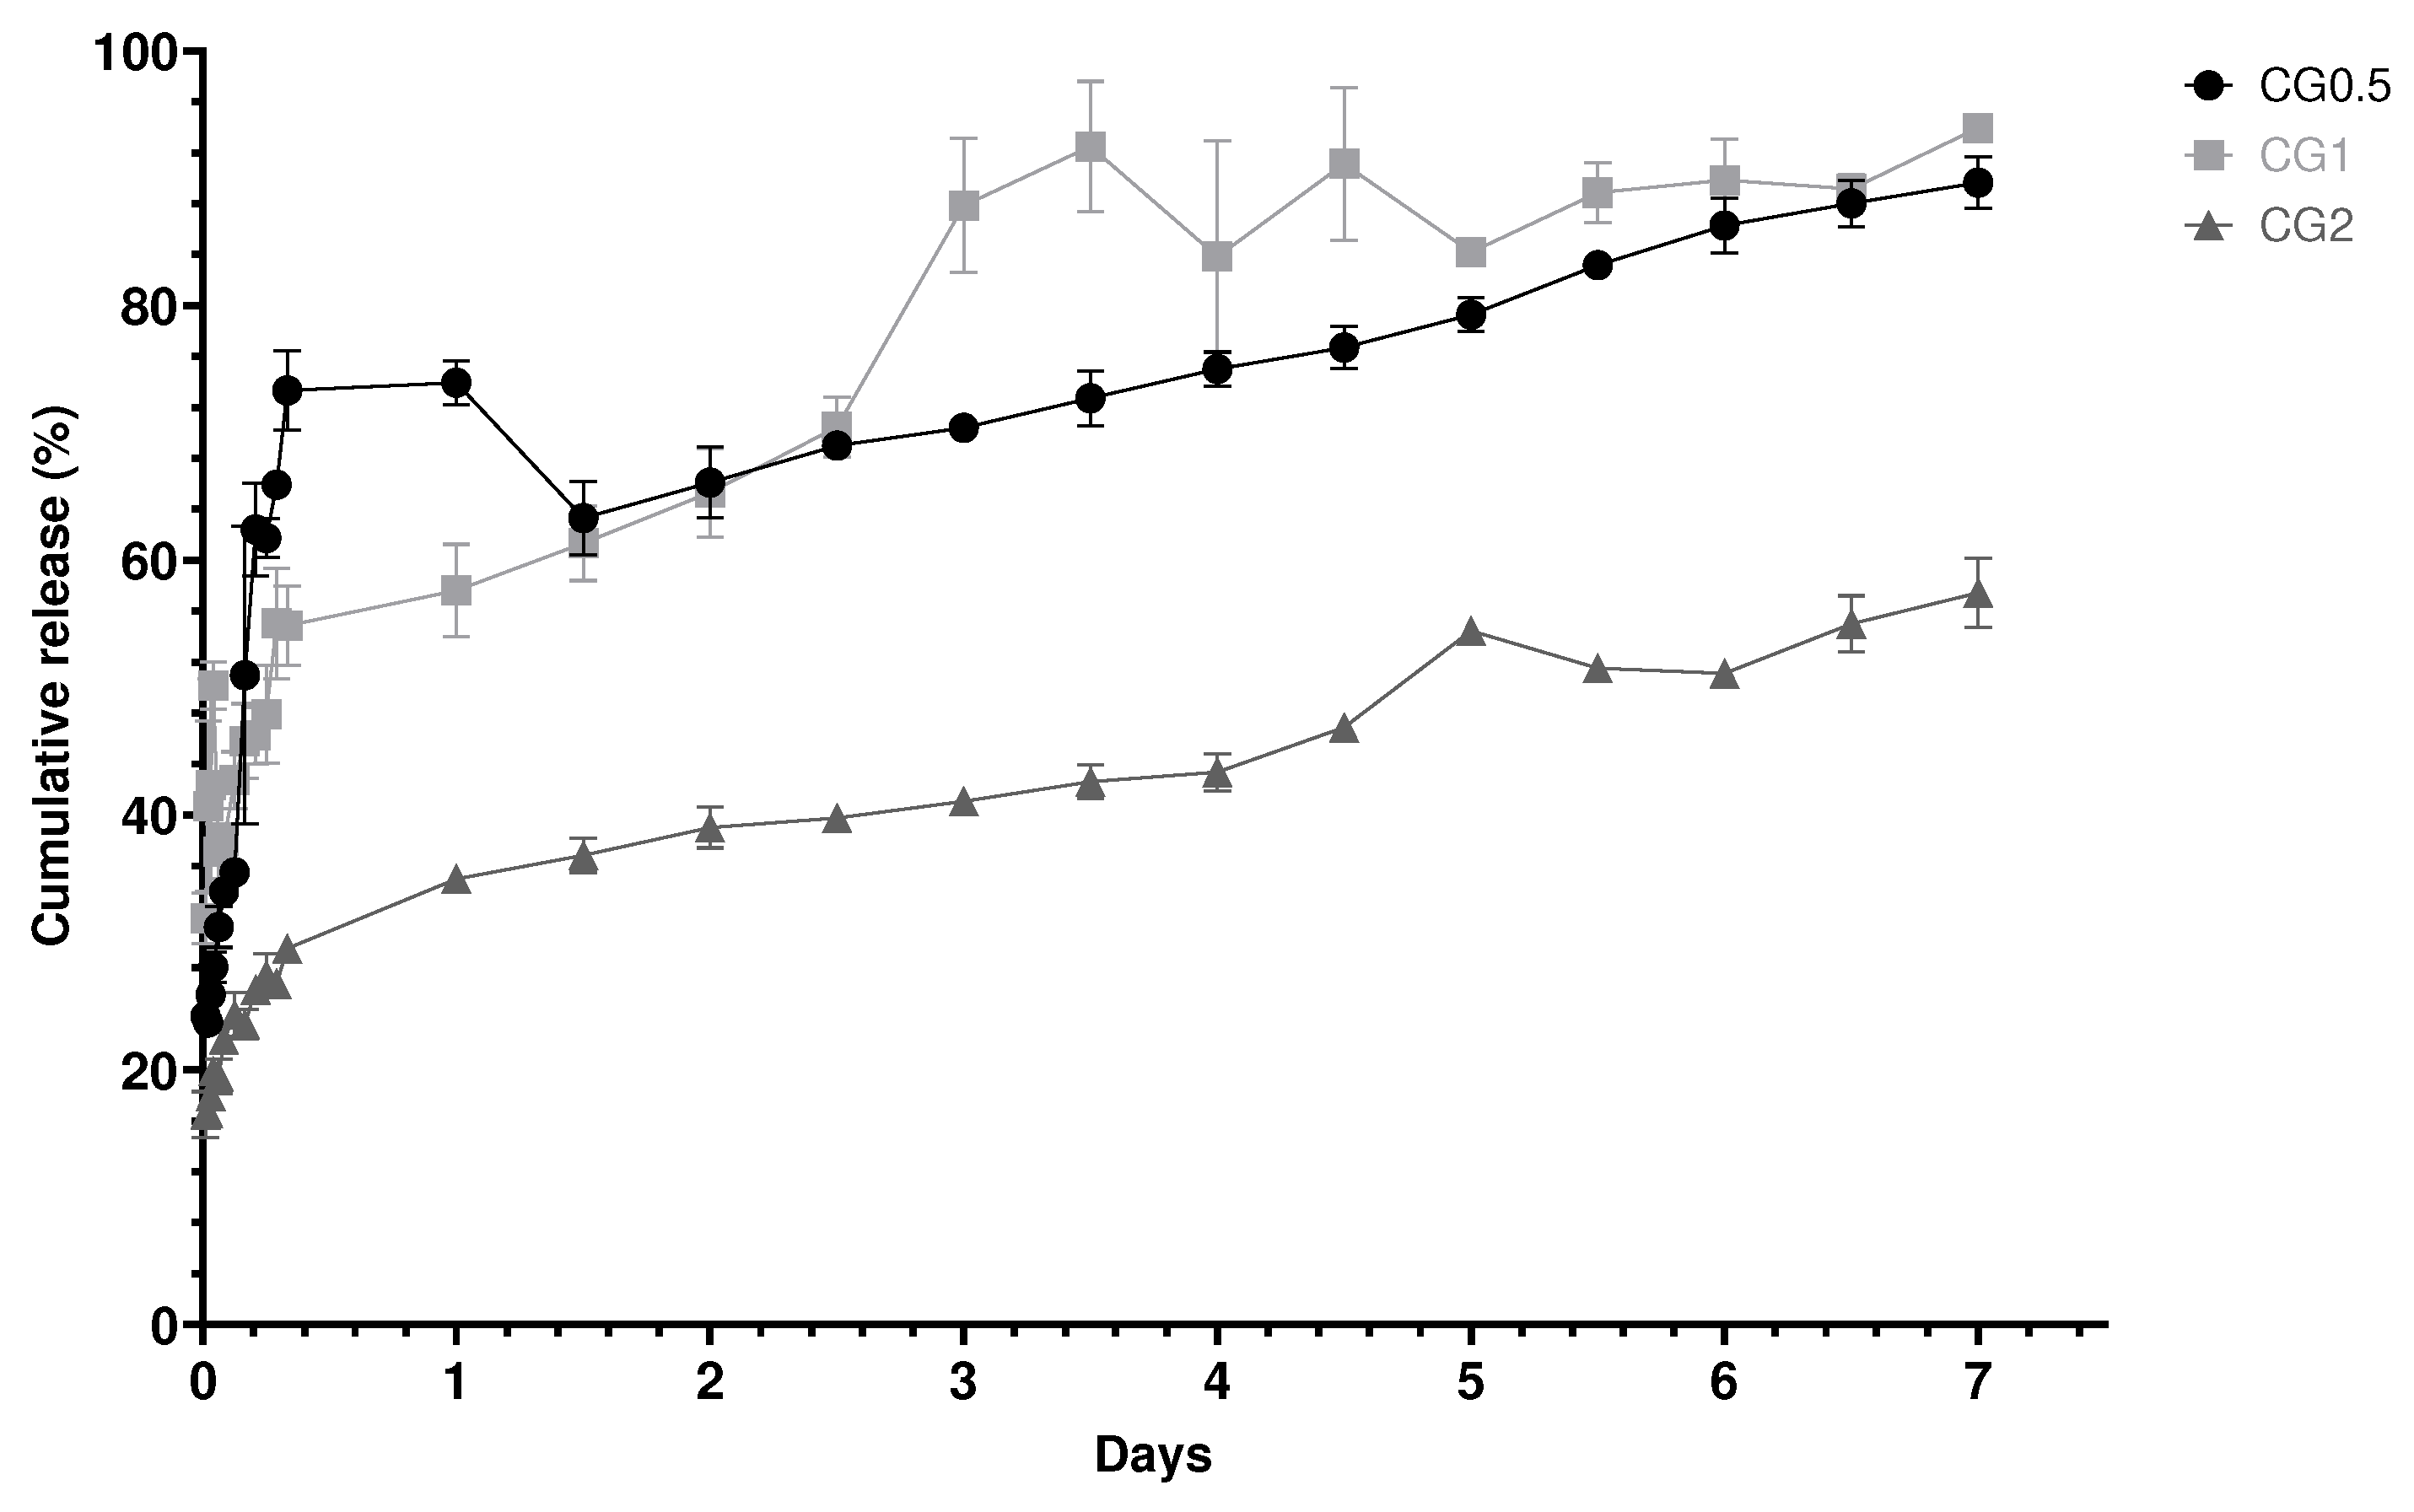
Figure 4.
Zones of inhibition produced using CG nanoparticles loaded with various concentrations of gentamicin, gentamicin standards and a C6 nanoparticle control against P. aeruginosa DSM50071 (n=3) (a) Zones of inhibition produced using CG nanoparticles loaded with various concentrations, gentamicin standards and a C6 nanoparticle control against Methicillin resistant S. aureus ATC43300 (n=3) (b).
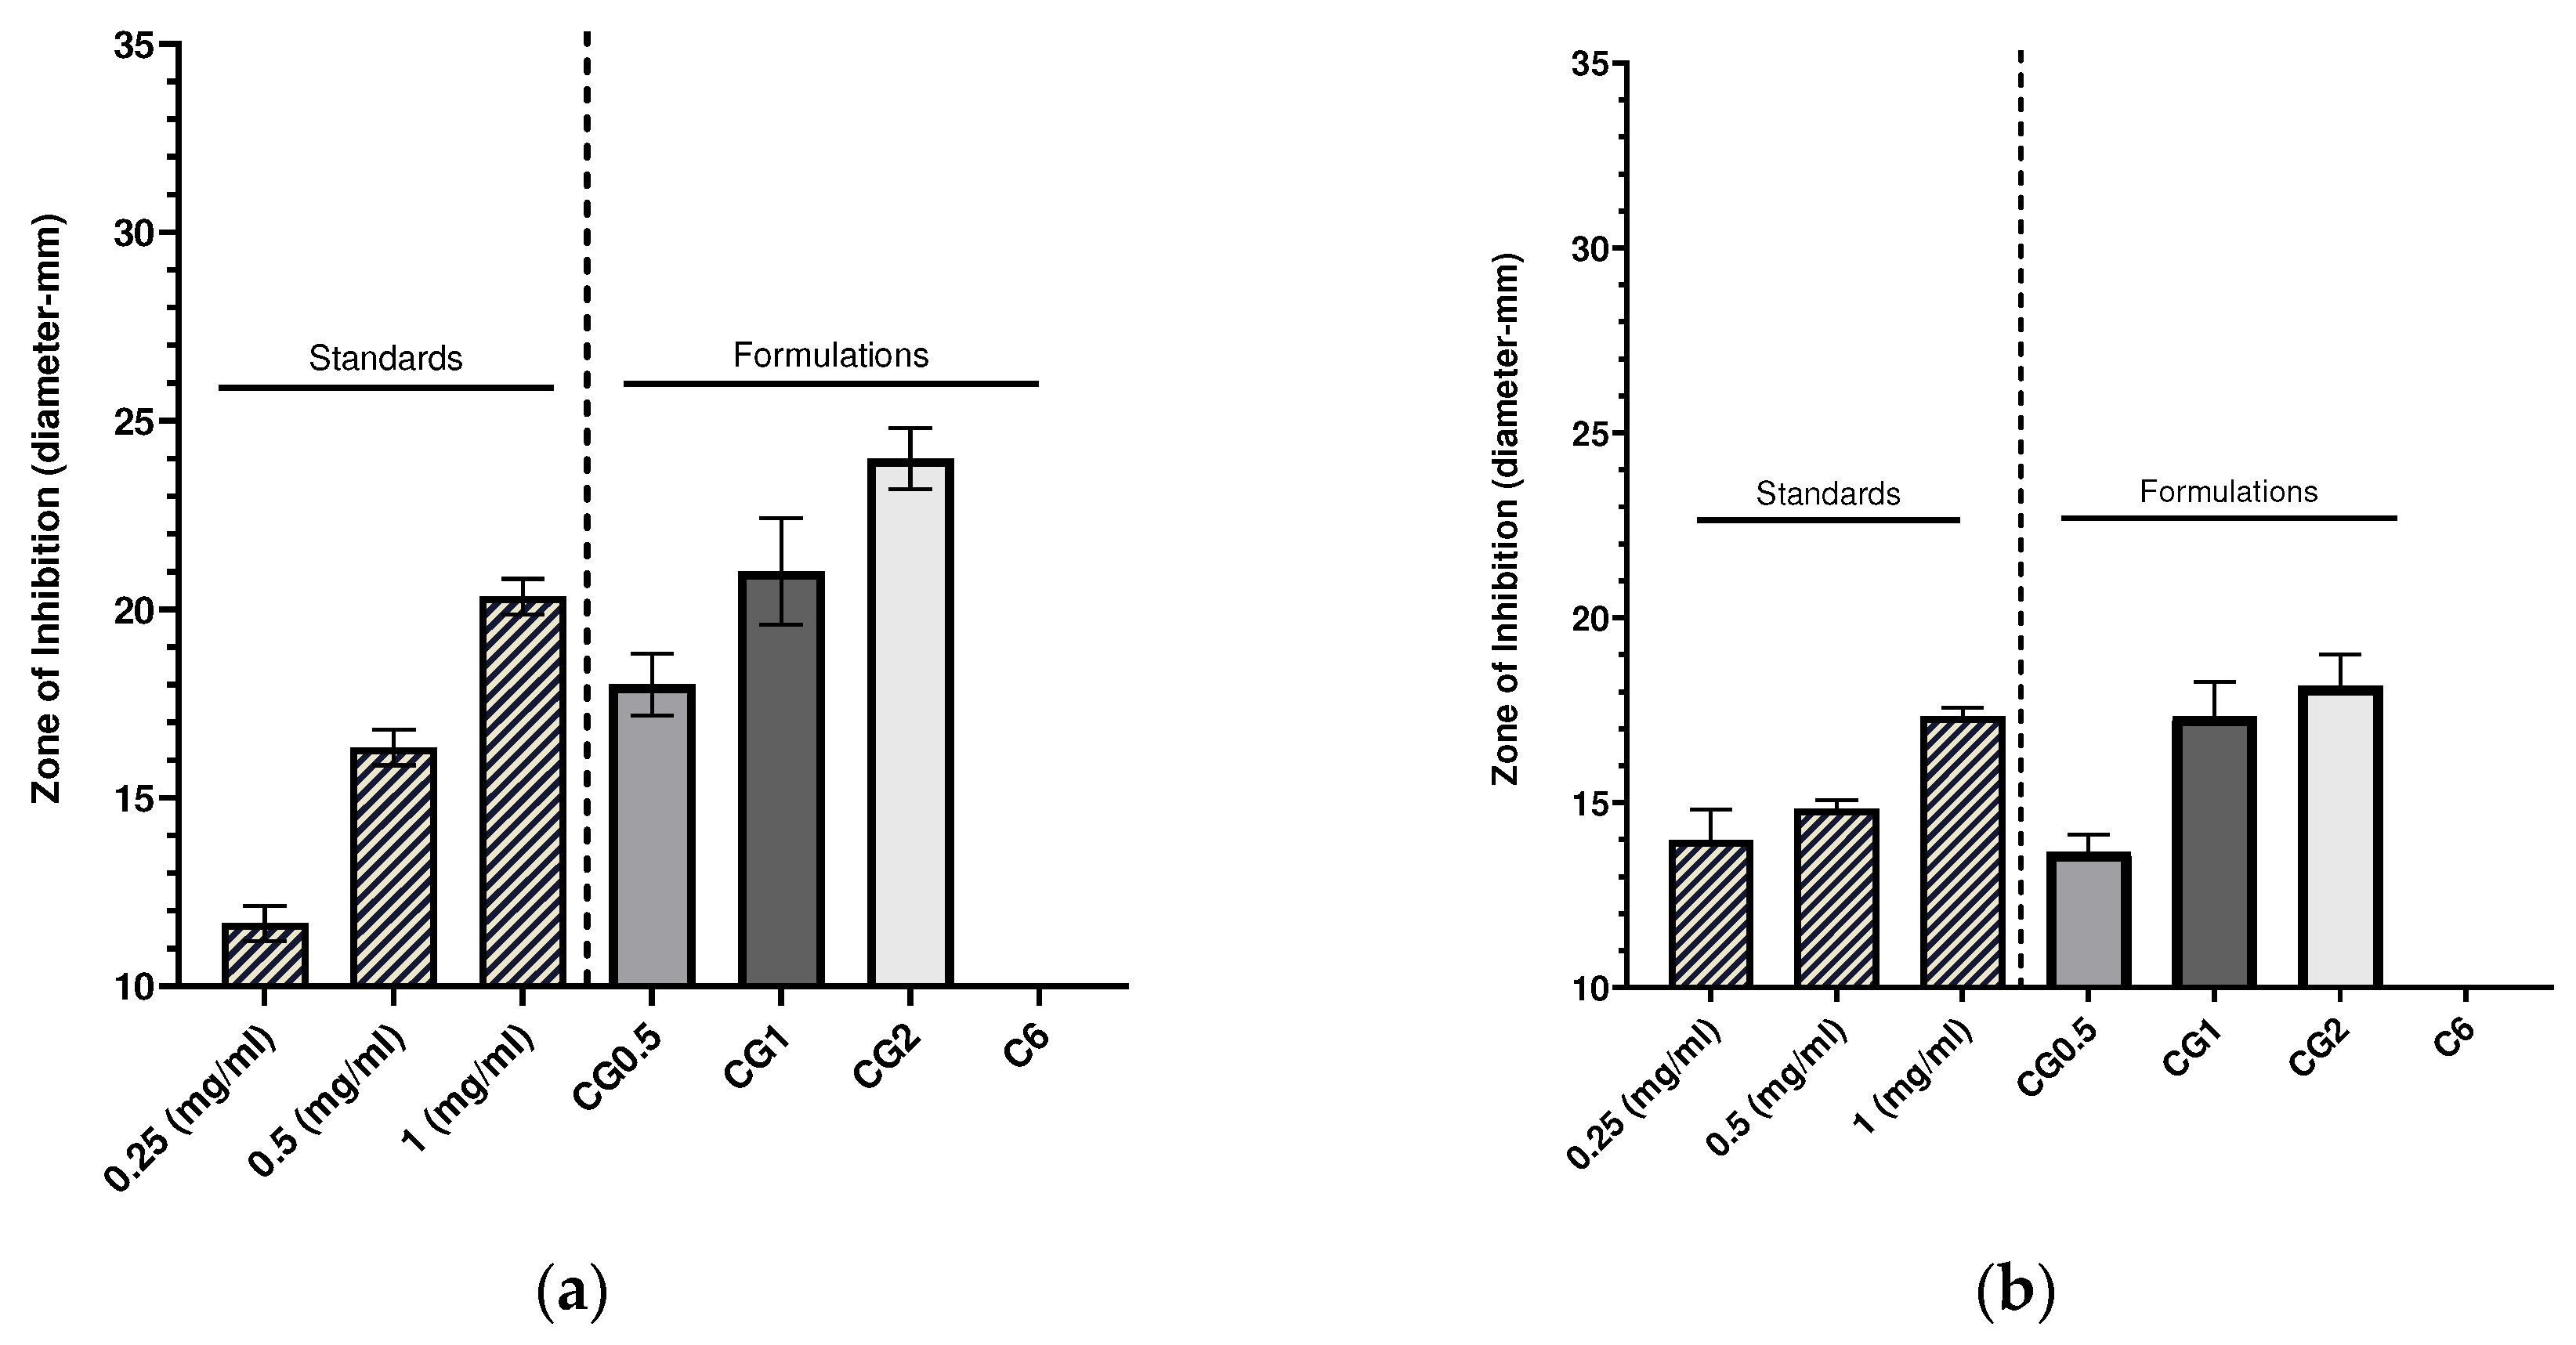
Figure 5.
Colony forming units (CFU) recorded for (a) P. aeruginosa DSM50071 when subjected to CG nanoparticles loaded with different gentamicin concentrations and a C6 nanoparticle control over 24 hours (n=3); (b) MRSA ATC43300 in response to CG nanoparticles loaded with various gentamicin concentrations and a C6 nanoparticle control over 24 hours (n=3).
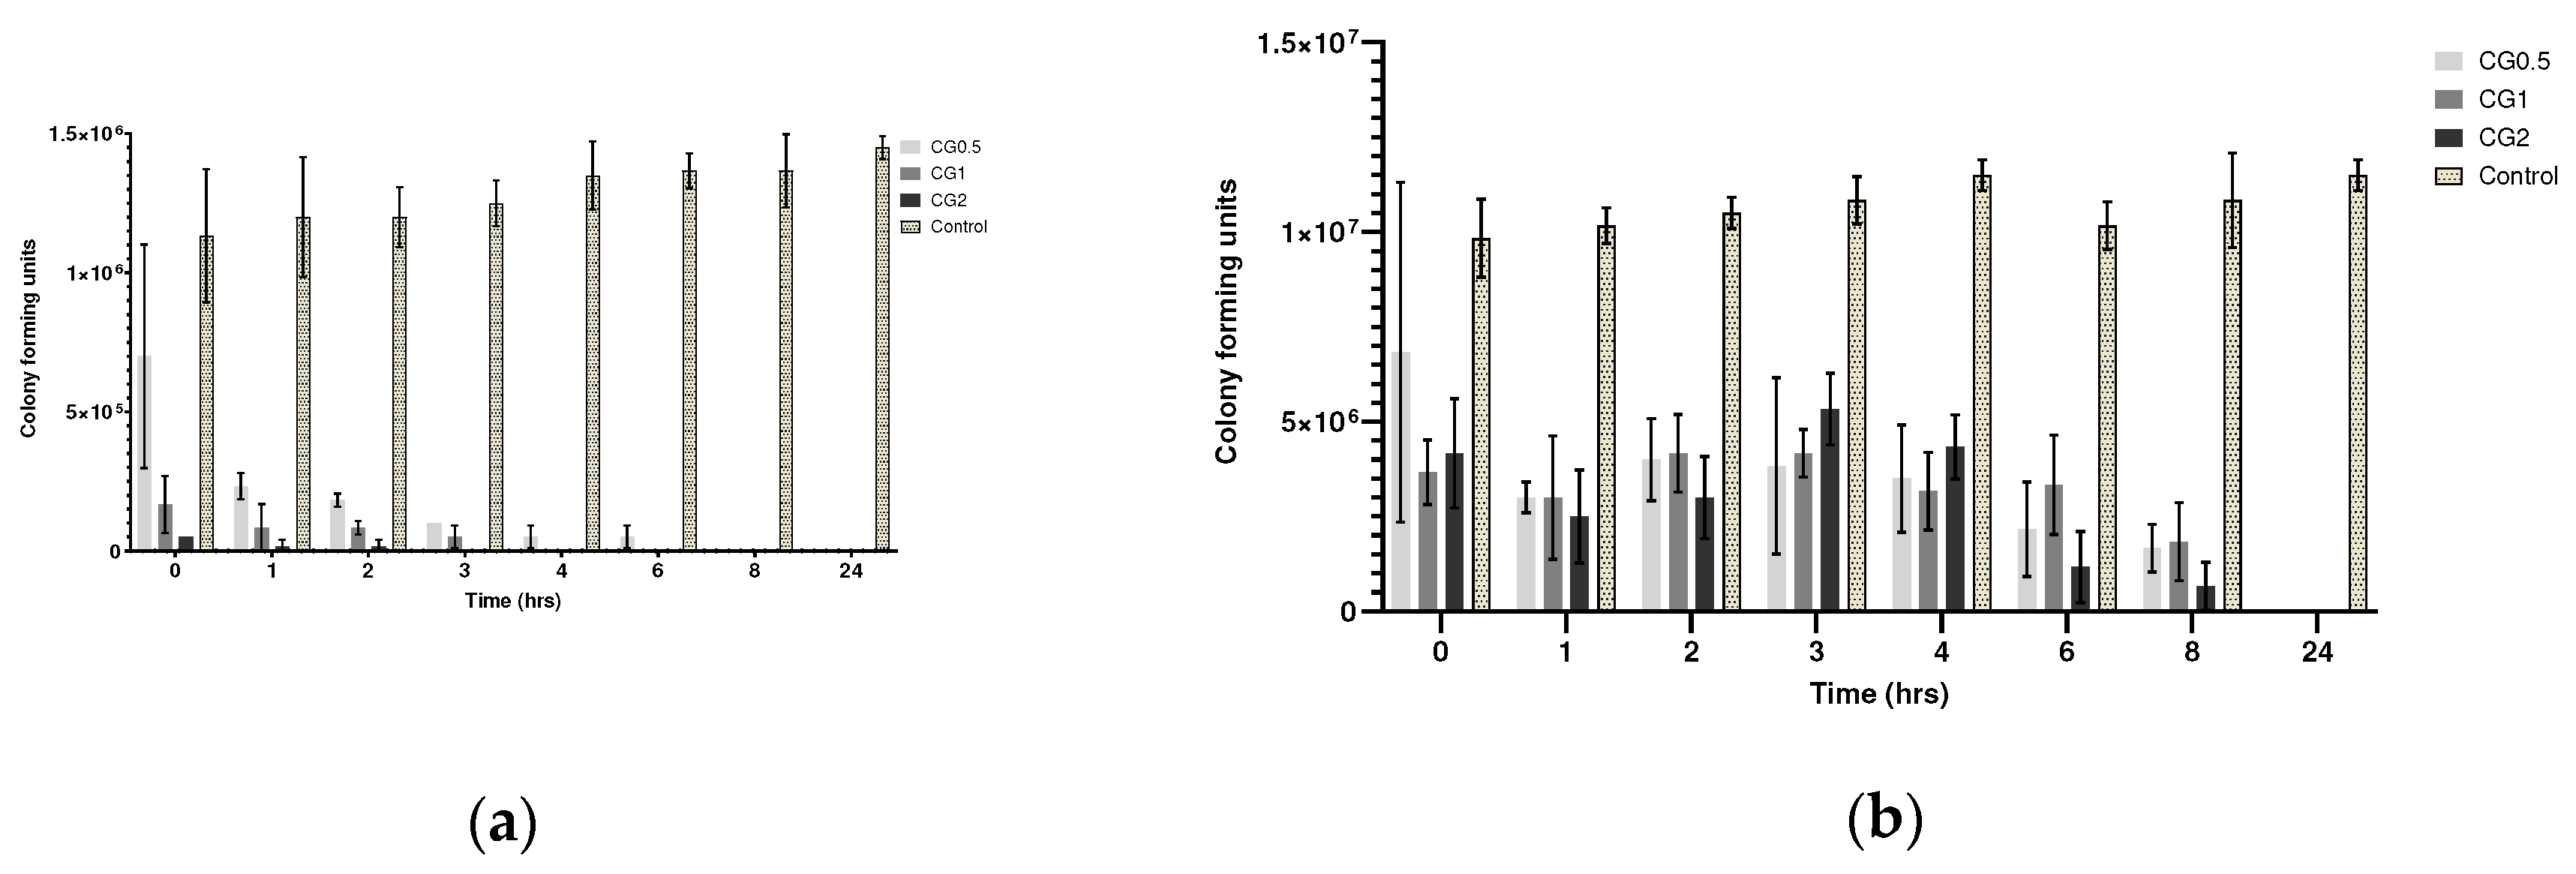
Figure 6.
Agar plates (a) Diagram of agar plate with the position of wells (b) Diagram of the plates used in antimicrobial activity study showing how each plate was divided and the placement of each dilution. Each sample was serially diluted 6 times and 20µl from each dilution was plated and incubated.
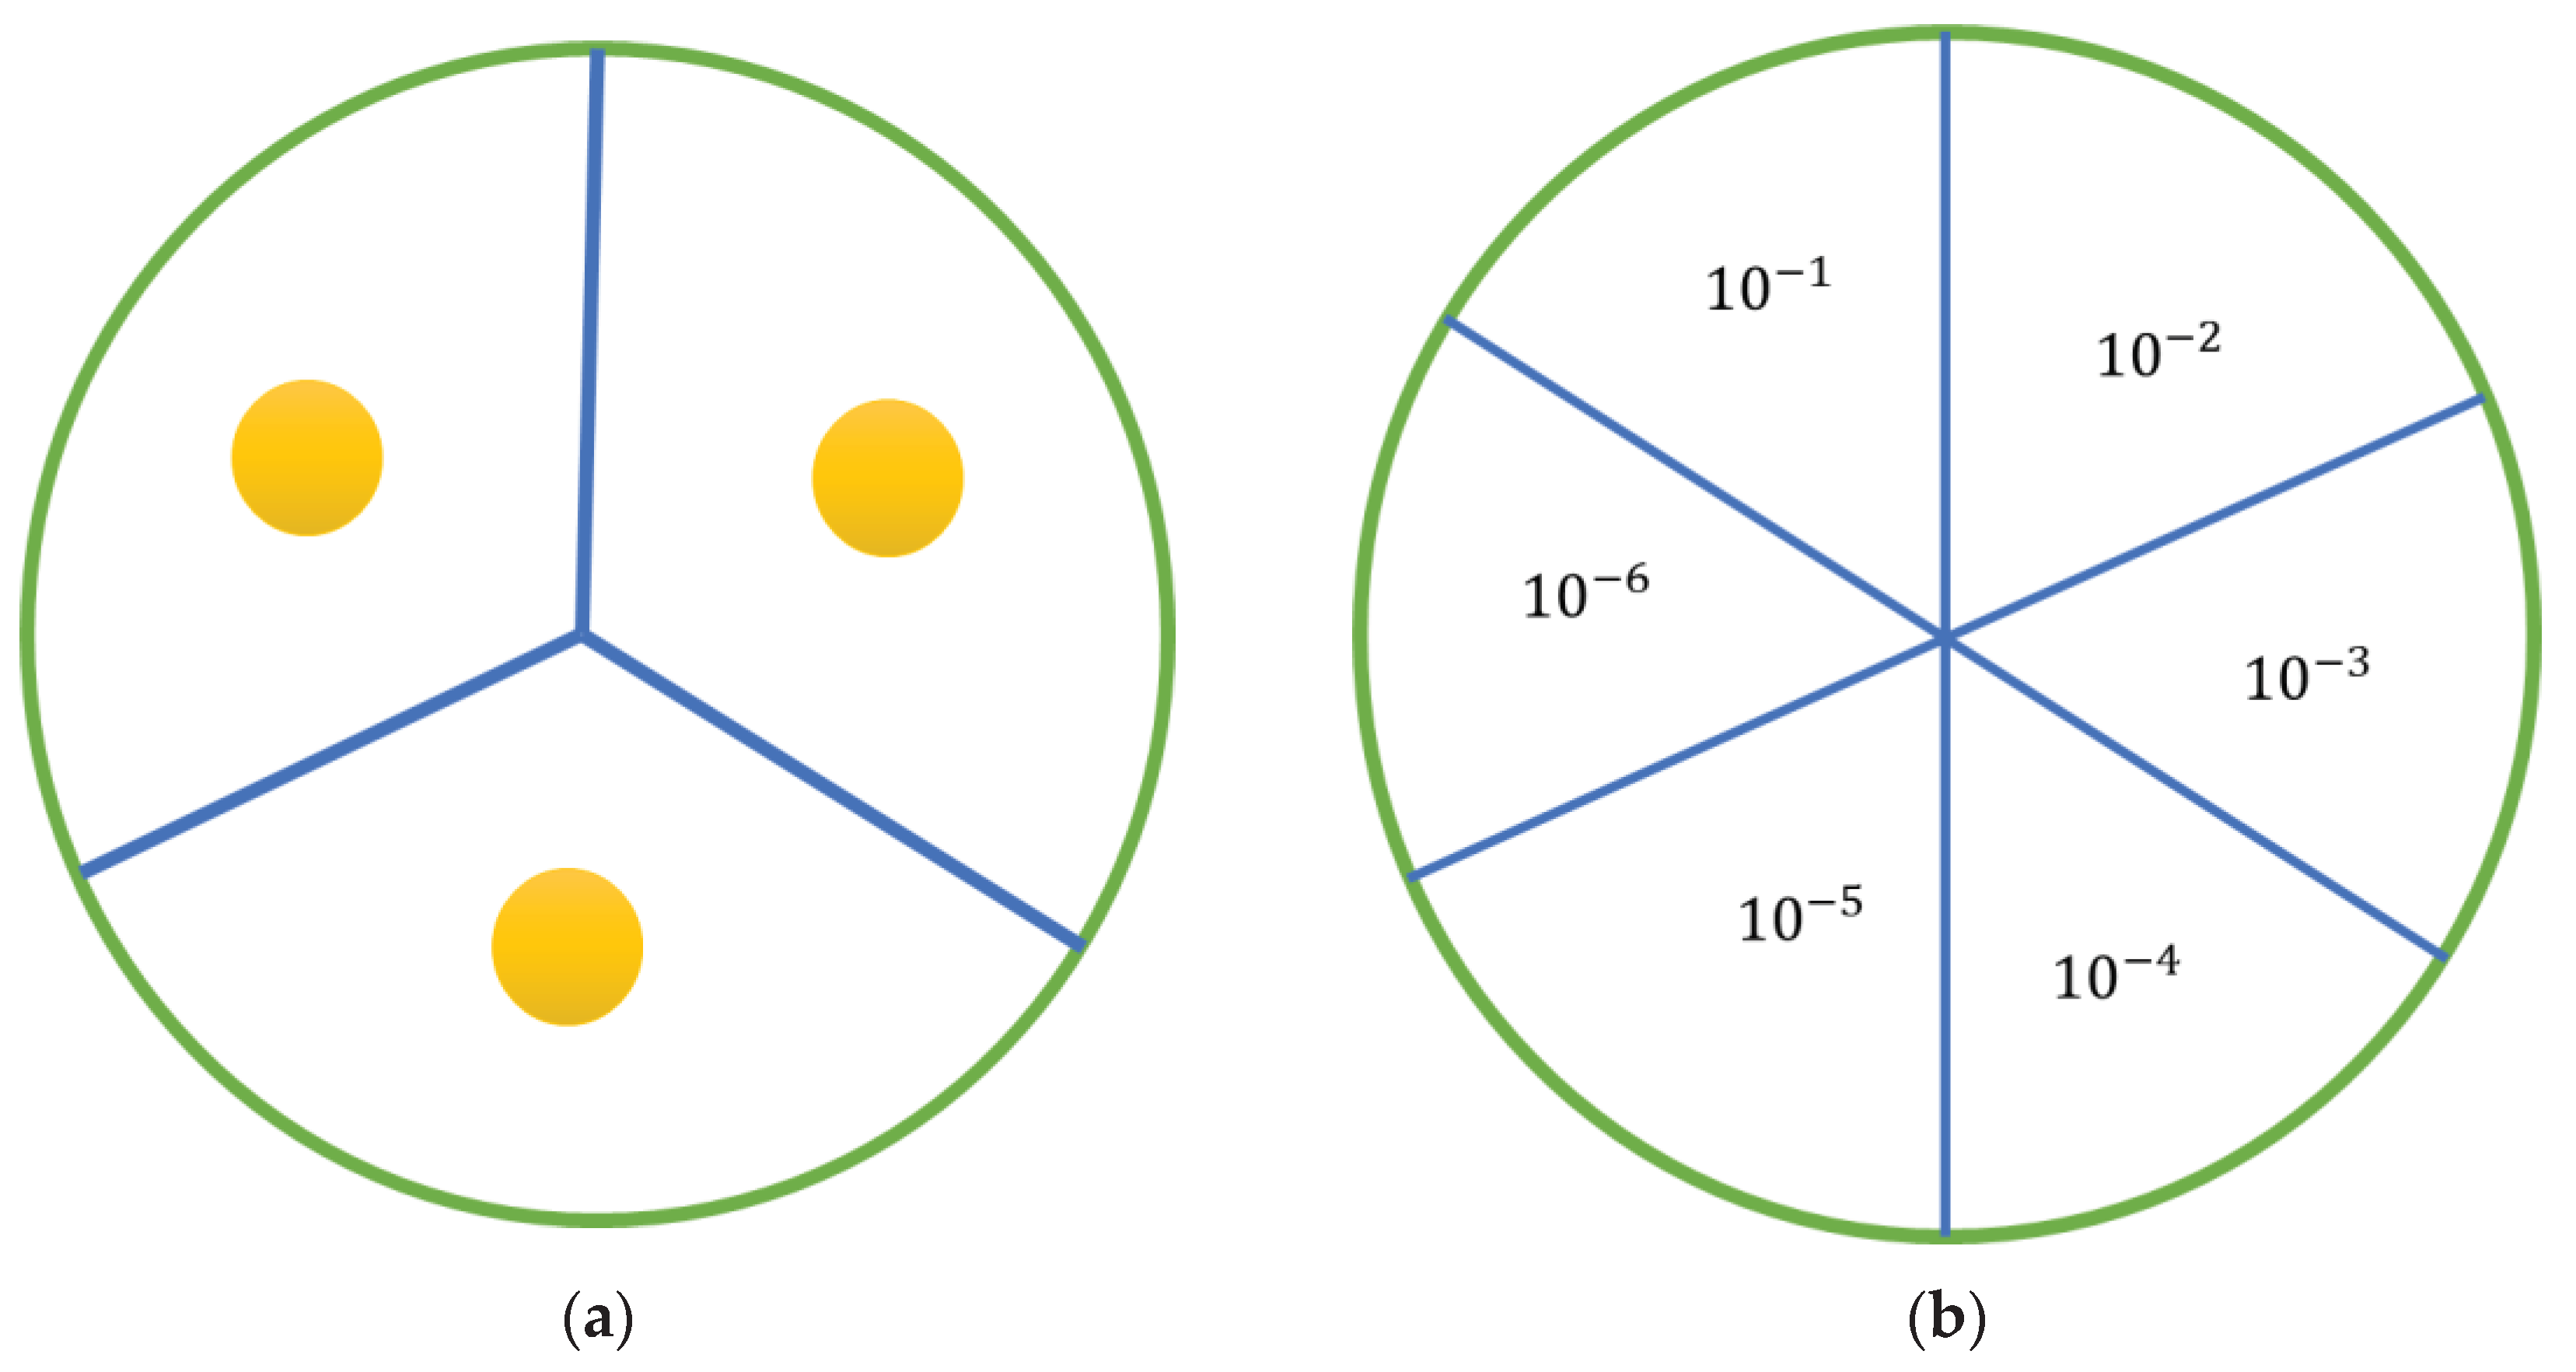

Table 1.
The most promising formulations from initial optimisation and their respective characteristics (n=6).
Table 1.
The most promising formulations from initial optimisation and their respective characteristics (n=6).
| Formulation number | Formulation | Size (nm) | PDI | Zeta Potential (mV) |
|---|---|---|---|---|
| C4 | CS 0.5%: TPP 4% | 212.27 ± 19.69 | 0.33 ± 0.02 | -1.80 ± 1.90 |
| C5 | CS 1%: TPP 0.1% | 236. 08 ± 32.05 | 0.30 ± 0.3 | 8.60 ± 2.30 |
| C6 | CS 1%: TPP 1% | 198.28 ± 9.11 | 0.32 ± 0.02 | 4.60 ± 2.57 |
Table 2.
R2 values produced using various release model graphs using the 1% w/v chitosan and 1% w/v TPP loaded formulations with gentamicin.
Table 2.
R2 values produced using various release model graphs using the 1% w/v chitosan and 1% w/v TPP loaded formulations with gentamicin.
| Formulation number | R2 Zero Order | R2 First order | R2 Higuchi Release | Best Fit model |
| CG0.5 | 0.634 | 0.8055 | 0.7502 | First |
| CG1 | 0.8618 | 0.5188 | 0.9366 | Higuchi |
| CG2 | 0.915 | 0.8189 | 0.9739 | Higuchi |
Table 3.
Formulation scheme.
| Drug loading concentration (%w/v) | Formulation number |
|---|---|
| Gentamicin | |
| 0.5 | CG0.5 |
| 1 | CG1 |
| 2 | CG2 |
Table 4.
Concentration and amount of standard plated in 50µl for standards used in zone of inhibition assays.
Table 4.
Concentration and amount of standard plated in 50µl for standards used in zone of inhibition assays.
| Aerobic strains (P. aeruginosa and S. aureus) | |
|---|---|
| Gentamicin concentration plated (mg/ml) | Amount of Gentamicin plated (µg) |
| 0.25 | 12.5 |
| 0.5 | 25 |
| 1 | 50 |
Disclaimer/Publisher’s Note: The statements, opinions and data contained in all publications are solely those of the individual author(s) and contributor(s) and not of MDPI and/or the editor(s). MDPI and/or the editor(s) disclaim responsibility for any injury to people or property resulting from any ideas, methods, instructions or products referred to in the content. |
© 2023 by the authors. Licensee MDPI, Basel, Switzerland. This article is an open access article distributed under the terms and conditions of the Creative Commons Attribution (CC BY) license (http://creativecommons.org/licenses/by/4.0/).
Copyright: This open access article is published under a Creative Commons CC BY 4.0 license, which permit the free download, distribution, and reuse, provided that the author and preprint are cited in any reuse.


