
Submitted:
17 November 2023
Posted:
20 November 2023
You are already at the latest version
Abstract
In the evolving landscape of pharmaceutical manufacturing, a comprehensive continuous production process is being crafted for small-scale active pharmaceutical ingredient production. This study focuses on continuous crystallization with separate nucleation and crystal growth units, as well as continuous downstream processing, encompassing filtration, washing, and drying until the formation of free-flowing particles. We introduce a novel continuous nucleator designed based on solubility data and produced via 3D printing, enabling a fast and precise small-scale manufacturing of a nucleator meeting the requirements for nucleation and for the further growth processes. The nucleator was evaluated with regard to its suitability for continuous long-term operation across various coupled crystallizers. As a practical application example it is connected to a slug flow crystallizer to enable high-quality continuous crystallization. Additionally, the full integration of downstream processes using the continuous vacuum screw filter to achieve free-flowing product particles is realized. Even under non-optimized process conditions, with the help of in-situ generation of nuclei free-flowing product particles were successfully obtained. This is particularly useful during drug development when no material is available for seed addition and quickly obtain product for further characterization.
Keywords:
Continuous manufacturing
; continuous nucleation
; 3D printing
; continuous downstream
; small-scale production
; high-quality products
; pharmaceuticals
; slug flow crystallizer
; continuous vacuum screw filter
1. Introduction
Crystallization is of particular importance in the pharmaceutical industry, being involved in about 90 % of the manufacturing processes of drug substances or active pharmaceutical ingredients (APIs), respectively [1]. APIs are commonly obtained as crystalline solids at the end of the downstream process. Thereby, APIs are mainly highly specific and, thus, chemically complex, resulting in low bioavailability [2]. Accordingly, the specific adjustment of particle specifications, such as particle size, is crucial concerning the dissolution behavior of APIs. Crystallization as a separation method highly influences the critical quality attributes (CQAs) of the product particles like particle size distribution (PSD), product purity, and particle morphology [3,4,5]. The crystallization process starts from prepurified solution during workup after drug substance synthesis. In the crystallization step, the target component is isolated as solid phase from a liquid phase. The subsequent solid-liquid separation, washing and drying of the particles completes the crystal process chain (CPC) and aims at preserving the PSD, achieving a high product purity and low residual moisture [6].
Especially the processes within the CPC during drug substance manufacturing are still predominantly operated in batch mode. However, a paradigm shift towards continuous processes is currently taking place, as these provide numerous benefits. These include the elimination of batch-to-batch variability, increased space-time yield, and simplified scale-up by, for example, numbering-up due to reduced plant volumes. This enables the use of research and development (R&D) equipment for industrial production just by increasing the runtime, resulting in a reduced time-to-market. [7,8]
Developing an end-to-end continuous manufacturing process for small-scale API production of 250 - 1000 kg a-1, from the raw material treatment to the final dosage form [9], requires, especially for pharmaceutical production, the realization of continuous upstream, crystallization, product isolation, and final formulation processes, ensuring the continuous production of on-spec products [4]. This study focuses on the continuous CPC from continuous crystallization to continuous product isolation.
A major challenge is the connection of the respective unit operations for continuous crystallization and product isolation [9,10]. In our previous study, the successful coupling of continuous crystallization with the slug flow crystallizer (SFC) and continuous product isolation with the continuous vacuum screw filter (CVSF) was already demonstrated [11]. However, continuous seeding of the SFC was required, which is a bottleneck of the continuous CPC. Accordingly, the decoupling of the nucleation and crystal growth process into separate units eliminates the bottleneck by providing an independent control of both processes, leading to an improved product quality control as well as an increased process efficiency [10]. With regard to continuous crystal growth, various concepts have already been elaborated, which are classified into two classes: mixed-suspension mixed-product removal (MSMPR) and tubular plug flow crystallizer (PFC) [4,5,8,9]. In this work, the SFC was used as a continuous crystal growth zone. The SFC belongs to the class of tubular PFCs. The concept of the SFC is based on a segmented flow of two immiscible fluids resulting in a narrow and equal residence time distribution (RTD) of the solid and liquid phases despite laminar flow conditions. Therefore, back-mixing effects can be avoided and a reproducible narrow PSD at the end of the process is achieved [12]. In this work, synthetic air is used to segment the product stream, enabling an effective separation of the segmenting fluid and a high product purity in the subsequent downstream process. The wall friction is responsible for the generation of internal vortices in the slugs, resulting in an effective and gentle suspension of the particles without the use of external equipment. In terms of specific adjustment of the desired particle size, the SFC offers various degrees of freedom. Based on the kinematically limited crystal growth, the residence time (RT) can be regulated by the tubing length and the volume flow rate. In addition, the driving force for crystal growth in the SFC is realized by cooling via a tube-in-tube system along the SFC, whereby the crystal growth can specifically be influenced by the cooling rate. More detailed information concerning the specific setup of the used SFC can be found in the literature [9,10,13,14,15].
Commonly, the apparatuses for continuous crystal growth processes require the supply of seed crystals [16]. However, the addition of seed crystals in a crystallization process could lead to process contaminations, which has to be avoided, particularly in the pharmaceutical industry [15]. Moreover, the particle properties of the seed crystals are crucial for the final product quality, resulting in high requirements for the seed crystal preparation process and, thus, a high time effort [15,17]. Furthermore, long-term operation cannot be realized due to the continuous supply of seed crystals. Accordingly, the demand for a continuous in-situ nucleator in the context of an end-to-end continuous CPC is high. In this study, the design of a continuous in-situ nucleator for coupling to various types of continuous crystallizers is presented.
There are various concepts to realize a continuous nucleation available. These include gassing-induced nucleation [18], sonocrystallization [19], impinging jet [20], and antisolvent nucleation. The selected nucleation method for the designed nucleator in this work is antisolvent nucleation, which is based on lowering the solubility of a solute by the addition of an antisolvent [17,21]. This method requires a low energy input and is suitable for thermally sensitive substances [21]. Additionally, precise adjustment of the degree of supersaturation is possible via the mass of added antisolvent independent of the temperature. Various technical concepts ensuring a continuous, effective, and rapid mixing process of two liquid streams, as fundamental requirements of an in-situ nucleator based on antisolvent nucleation or precipitation, are presented in the literature. The microporous tube-in-tube microchannel reactor (MTMCR) [22], the spinning disc reactor (SDR) [23], and the high-gravity antisolvent precipitation (HGAP) [24] were investigated for antisolvent precipitation of nanoparticles of poorly water-soluble substances. The membrane-assisted antisolvent crystallization (MAAC) as antisolvent nucleation technology was tested for the substance system erythritol/water with ethanol as antisolvent by Li et al. [25]. Engler et al. [26] investigated convective passive micromixers in a T-shape with respect to mixing quality and mixing time. These T-mixers are considered in the study of Engler et al. [26] for application as microreactors for chemical reactions. The aim is to realize an efficient mixing process with short mixing times to ensure that the mixing process is completed before the reaction starts. This objective can also be applied to the process of antisolvent nucleation, where the mixing time should be shorter than the induction time. A T-shaped convective passive mixer offers a rapid and effective diffusive micromixing with the support of convective mixing under laminar conditions [26]. Moreover, the T-shaped micromixer provides higher mixing efficiency and smaller dead zones compared to conventional Y-shaped micromixers [27]. Since the concepts for antisolvent precipitation or nucleation presented above are very challenging due to the complex relationships between process and design parameters, the passive T-shaped micromixer was selected as the most promising concept for the design of a continuous in-situ nucleator in this study. Accordingly, the T-mixer represents a simple, robust, compact, and reliable unit without moving components and external energy input, keeping the investment, operating, and maintenance costs comparatively low. In the context of an end-to-end continuous small-scale drug substance manufacturing process, starting from continuous nucleation in the nucleator to crystal growth in the SFC, continuous product isolation is finally required to obtain free-flowing particles at the end of the process.
The continuous product isolation, including solid-liquid separation, washing and drying, is essential in terms of maintaining CQAs. The patented continuous vacuum screw filter (CVSF) combines the process steps filtration, washing and drying in a modular design [28]. Due to the modular setup of the CVSF, different configurations of the filtration, washing and drying modules can be realized, resulting in a high flexibility of the apparatus regarding various applications and operating points [6,29,30]. The respective modules are tubular glass bodies, which are connected via flanges. The suspension from the preceding crystallization process is fed into the first module, where the filtration step takes place using an applied vacuum and a filter frit incorporated at the bottom of the glass body. The formed filter cake is transported axially through the apparatus by a rotating screw into subsequent modules for further process steps like washing and drying. Fundamental requirements for the continuous product isolation are the preservation of the CQAs designed in the preceding crystallization process and the production of free-flowing particles at the end of the process [6]. In previous studies, we demonstrated for bipyramidal l-alanine particles in aqueous solution and a CVSF configuration consisting of filtration and two-stage washing for suspension volume flow rates of up to 84 mL min-1 and a solid loading of 6 wt.-% that the targeted residual moisture of less than 1 %, the preservation of PSD, and a narrow RTD of the solid phase are ensured [6,30]. Furthermore, the coupling of the SFC as a continuous crystallizer with the CVSF for continuous product isolation was successfully proven [11].
The coupling of various continuous unit operations requires an extensive characterization of the individual apparatuses in order to meet the high requirements of a reproducible high product quality. The characterization of an apparatus includes the understanding of the relationships between input and output parameters and is essential to ensure the compatibility of different apparatuses (nucleator, crystal growth zone, product isolation) in the context of a continuous integrated process [5,8]. The definition of CQAs is decisive for the quality-by-design (QbD) approach in order to evaluate the influence of the critical process parameters (CPPs) on the integrated process performance [8].
The design of the nucleator needs to meet the requirements for compatibility with the respective crystallizer used. Accordingly, the nucleator must generate a sufficient high number of nuclei to prevent fouling in the growth zone and to achieve the highest possible yield without the occurrence of secondary nucleation. We postulate the following hypotheses:
- In the passive T-mixer, a sufficiently rapid micromixing process of feed and antisolvent stream is ensured for equal inlet stream velocities.
- As antisolvent for continuous nucleation the same solvent as used for particle washing within the crystal process chain is suitable.
- The continuously generated nuclei or the solid loading in the continuous nucleator can be estimated from the mixing point in the ternary solubility diagram.
Our work is divided into the following three parts: (1) design and characterization of the continuous in-situ nucleator for coupling with various continuous crystallizers answering the three above mentioned hypotheses, (2) continuous particle design considering nucleation and crystal growth by coupling the nucleator with the slug flow crystallizer (SFC) as crystal growth zone for particles with different aspect ratios ranging from nearly spherical to needle-shaped particles and (3) the demonstration of a full continuous end-to-end small-scale manufacturing process for crystalline particles consisting of the nucleator, the SFC as crystal growth zone, and the CVSF for product isolation.
2. Materials and Analytics
2.1. Substances
The used model substance as target molecule in this study is l-alanine, since it provides similar properties compared to high-value APIs but is easier to handle in the laboratory and much cheaper. l-alanine was sourced with a purity 99.7 % from Evonik Industries AG. Ultrapure, deionized and bacteria-free water acts as main solvent and was provided by the purification system Milli-Q® from Merck KGaA. The binary solubility data of l-alanine/water were generated and regressed by Wohlgemuth et al. [31] (eq. (1)).
Ethanol absolute was used as antisolvent for nucleation and as wash liquid during product isolation, also. It was purchased from VWR Chemicals with a purity of 99.5 %.
l-glutamic acid was used as habit modifier during l-alanine crystallization. With the aid of the addition of l-glutamic acid to the clear solution, various particle shapes of l-alanine depending on the concentration of l-glutamic acid can be realized. l-glutamic acid was purchased from Alfa Aesar with a purity of 99 %. All substances were used within this study without any pretreatment.
2.2. Analytics
The characterization of the nucleator requires the qualitative and quantitative investigation of the in-situ generated nuclei. Therefore, the output of the nucleator was analyzed using light microscopy images, by gravimetric concentration measurements and dynamic image analysis (DIA) at specific RTs.
The light microscopy images were used for the qualitative evaluation of particles in terms of size and shape. In this work, suspension samples were placed on a petri dish and examined directly by utilizing a light microscope (DM2700 M from Leica) with an equipped camera (FLEXACAM C1 from Leica).
The gravimetric concentration measurements represent a loss-on-drying method and were used for the measurement of the liquid l-alanine concentration to determine the solid loading of the suspension after the continuous nucleator. The suspension samples were filtered by a syringe top filter (CHROMAFIL® Xtra PTFE-45/25, 0.45 μm from Macherey-Nagel) and collected in polypropylene (PP) vials to ensure a particle-free solution. After an initial pre-drying step for 24 h in a drying oven at 50 °C, a subsequent intensive drying process in a vacuum dryer for 48 h at 50 °C was carried out. Corresponding to the procedure described in our previous work [6], the solute concentration was calculated. Furthermore, was determined by the difference between the l-alanine concentration of a suspension sample without and with filtration, according to the procedure described above. Moreover, the relative yield ( of the crystallization process was determined based on gravimetric concentration measurements of l-alanine in the liquid phase () and the theoretical saturation concentration at a specific temperature () according to equation (2).
The DIA was conducted with a QICPIC image analysis sensor from Sympatec and a LIXELL dispersion module to evaluate the particle size, its distribution and the shape of particles quantitatively. For a reliable assessment of the developed nucleator, the analysis of small particle sizes had to be ensured. For this reason, the M4 module was used, enabling a reliable detection of particles in a size range from 9.9 µm to 750 µm [32]. The measured projection areas were analyzed by an in-house Matlab script [33,34] with respect to the PSD. Isotropic particles, such as nearly spherical bipyramidal particles, were evaluated based on the equivalent diameter. However, anisotropic particles, such as needles, were characterized by the minor axis length (MIL) and major axis length (MAL) of an ellipse fitted to the respective particle projection area, enabling the calculation of an axis length distribution (ALD), which is strongly coupled to the PSD. A density plot illustrates the probability distribution for anisotropic particles with a certain MIL and MAL. The focus point of the density plot represents the most probable MIL (MILch) and MAL (MALch), serving as characteristic parameters of the PSD of anisotropic particles. In addition, the aspect ratio (AR) was calculated by the quotient of MALch to MILch for further particle characterization. Detailed information concerning the DIA of anisotropic particles can be found in our previous study [35].
3. Design and Characterization of the Continuous Nucleator
In this section, the design of the continuous in-situ nucleator based on antisolvent nucleation for various types of crystallizers is presented. The model substance system used in this study is l-alanine/water. Since ethanol was identified as suitable wash liquid for particle washing, ethanol was applied as antisolvent [36].
3.1. Design of the Continuous Nucleator
The convective passive T-mixer as continuous in-situ nucleator must ensure shorter mixing times (micromixing) than induction times to prevent local supersaturation and guarantee consistent high product quality for a long-term continuous operation [15,17]. Engler et al. [26] describe in their study that in a T-mixer with a 180° inlet configuration, the impingement process of the inlet streams into each other can be classified into three different laminar flow regimes based on the Reynolds number in the mixing channel (, eq. (3)): stratified flow (0 < < 50), vortex flow (50 < < 150), and engulfment flow (150 < < 300).
is composed of the product of the density of the mixture (eq. (4)), the velocity in the mixing channel and the characteristic length divided by the dynamic viscosity of the mixture (eq. (5)). The characteristic length for a circular cross-section is equal to the inner diameter (ID).
The flow patterns have a massive influence on the mixing quality and mixing time, respectively. Accordingly, the impingement of the inlet streams into each other is increased with increasing , generating an intensive mixing already in the impingement zone to achieve shorter mixing times. For an efficient mixing process supported by convection, it is essential to generate the engulfment flow in the T-mixer. Depending on the design and process parameters, the transition from vortex flow to engulfment flow is achieved at different , indicated by a corresponding turnover Reynolds number in the mixing channel (). Based on this, the highest possible velocities of the inlet streams must be realized in order to maximize . An increase in the velocities of the inlet streams can be accomplished by increasing the volume flow rate or reducing the cross-sectional area. Since in practical application the feed volume flow rate is set through a defined product capacity and cannot be varied freely, the increase in velocity of the inlet streams was achieved by minimizing the cross-sectional area, here the inner diameter of the T-mixer. For a worst case estimation a minimum volume flow rate was set to an often applied value of 10 mL min-1 [11,12,37,38].
The study of Engler et al. [26] shows that for a cross-sectional area ratio (, eq. (6)) between the mixing channel () and the inlet channels () of = 2, the is approximately 150. This represents the minimum in the mixing channel for the design of a T-mixer with 180° inlet configuration in order to create the engulfment flow and, thus, realize short mixing times.
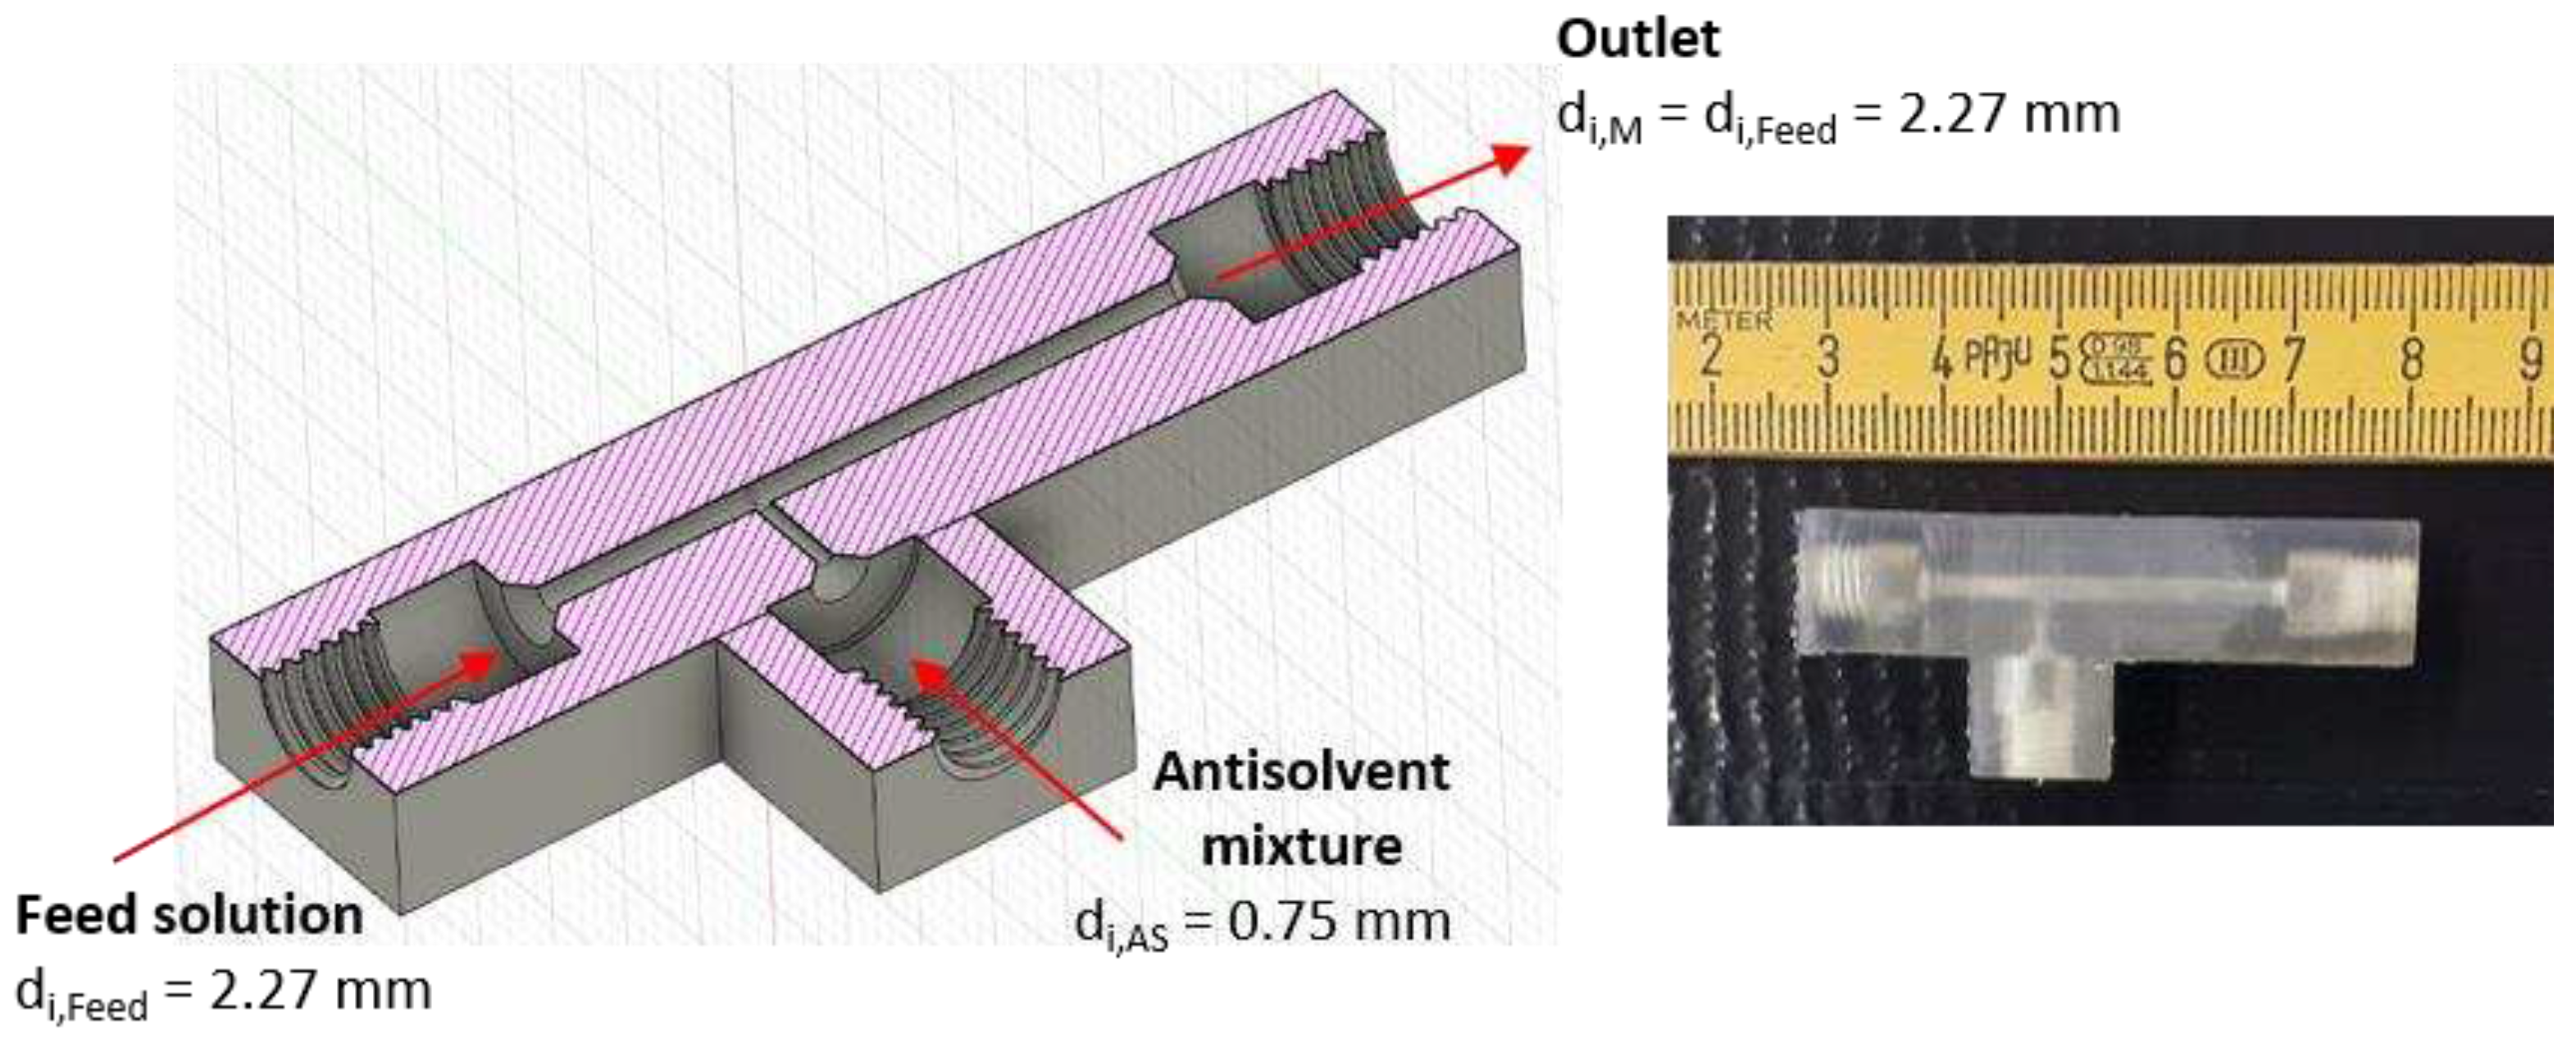
Moreover, design parameters for the convective passive T-mixer (180° inlets) design were defined. A fundamental condition is the equality of feed and antisolvent inlet velocities to avoid backmixing. Additionally, the inlet volume flow rates are equalized to provide identical inlet diameters and, thus, equal front faces of the impinging inlet streams in a 180° inlet configured T-mixer. This is a crucial factor for the mixing process and ensures the validity of the correlations from Engler et al. [26]. Consequently, the antisolvent volume flow rate was aligned to the set feed volume flow rate. Considering 2, an inlet ID () of 0.75 mm (lower manufacturing limit) results in an ID of the mixing channel () of 1.06 mm (Figure 1).
Batch cooling crystallization commonly focuses on a seed loading in a range of 0.1 - 1.5 wt.-% with seed crystals in a size range from 40 - 330 µm at relatively low cooling rates (e.g., of 1.5 wt.-% for a cooling rate of 0.15 K min-1) [36,37,38]. Since continuous crystallization aims to realize high cooling rates (e.g. 1.5 K min-1) in order to achieve high space-time yields, a higher surface area provided by nuclei is required for efficient crystal growth. Therefore, as a further restriction in the context of continuous cooling crystallization, a of at least 1 wt.-% is targeted in the design of the T-mixer as continuous nucleator. In this study, the composition of the antisolvent mixture used in the T-mixer as nucleator is determined graphically in corresponding ternary solubility diagrams. Considering that the volume flow rates of the feed () and the antisolvent mixture () are set to the same value so that both streams meet at the same velocity, the distances for the feed () and antisolvent mixture () mass flow rates were calculated by equations (7) - (9), to determine the mixing point (MP) graphically. This is shown exemplary for a nucleation process with a feed solution (F) and an antisolvent mixture (AS) containing 75 wt.-% ethanol at = 20 °C and 1 bar in Figure 2a.
The total mass flow rate in equation (9) represents the total length of the dashed red line. The densities for the feed () and antisolvent mixture () solutions are calculated by equation (4) according to the corresponding compositions. Generally, based on equations (7) – (9), different MPs result for different antisolvent mixture compositions, which simultaneously results in different . The latter can be calculated by the ratio of the solid mass flow rate () to the mass flow rate of the solution () according to equation (10), which can be graphically determined by applying the lever rule illustrated in Figure 2b. In the example shown, this results in a of approximately 5 wt.-%.
The ternary solubility diagram indicates according to the lever rule, that dilution of ethanol as antisolvent with water is required so that a MP results, where is reduced to 1 wt.-%, as given in Table S2 in the Supporting Information.
For the characterization experiments an of 50 wt.-% was exemplary chosen, resulting in an of 23 wt.-%, a of 2.26 wt.-%, and of 362 according to the graphical analysis. This operating point was promising concerning the generation of a sufficient quantity of nuclei and an effective micromixing process.
3.2. Manufacturing of a Continuous Nucleator
In this study, 3D printing was used as manufacturing method for the nucleator. Considering the low flexibility of the T-mixer with regard to changing process parameters, in-house 3D printing enables fast, precise and robust manufacturing of differently configured T-mixers. In particular, masked stereolithography (MSLA) printing provides a relatively fast and precise small-scale manufacturing from a temperature-resistant resin (High Temp V2) purchased from Formlabs. With an adjusted layer height of 50 µm, the MSLA printer (Type Saturn from Elegoo) offers high accuracy and high surface quality with low material consumption and a relatively high printing speed. The lower manufacturing limit for circular channels is a diameter of 0.75 mm.
3.3. Experimental Setups and Procedures
The characterization experiments were conducted at ambient temperature ( ≈ 20 °C) to exclude the influence of potential heat losses on the performance of the T-mixer as a continuous nucleator and obtain reliable data. In order to evaluate the degradation of the induced supersaturation by the addition of antisolvent in the T-mixer, the formed nuclei were quantified at different RTs (6 s, 5 min, 10 min, and 15 min) after the mixing process. The experimental setups are depicted in Figure 3.
The feed solution and antisolvent mixture were provided in Schott glass bottles ( = 0.5 L), whereby the saturated feed solution was prepared for a saturation temperature = 20 °C in accordance to equation (1). Each solution was conveyed by a peristaltic pump (REGLO Digital MS-4/12, 12 rollers from ISMATEC). The used pump tubes (TYGON LMT-55 from IDEX Health & Science GmbH) had an ID of 3.17 mm or 1.75 mm with a wall thickness of 0.9 mm or 0.75 mm, respectively. Considering the scale of the volume flow rates, tubes with an ID of 1.75 mm were used for precise pumping performance at low volume flow rates. As depicted in Figure 3a, the outlet of the T-mixer was directly connected to a further tubing for analytics. The volume flow rate of the outlet stream of the T-mixer and the tubing length (47.5 cm) caused a RT of approximately 6 s until samples were withdrawn and analytics applied. Since the nucleation and growth kinetics are unknown, experiments were performed to investigate the supersaturation degradation as a function of RT qualitatively. Therefore, approximately 30 mL of the product stream was collected in a stirred batch vessel after the mixing process in the T-mixer (Figure 3b). Subsequently, analyses were done after specific RTs each (5 min, 10 min, and 15 min).
3.4. Results
The results of the in-line DIA showed that a very low number of projection areas of particles were detected. Since the lower detection limit of the DIA is 9.9 µm and the critical nuclei size is unknown, the in-line DIA is not valid for the analysis of instantly formed nuclei smaller than 9.9 µm.
The microscopic analysis of the outlet stream of the T-mixer 20 s after sampling (Figure 4b) indicated that considerably more nuclei are visible compared to the in-line DIA (Figure 4a). Furthermore, the microscope image of the same sample 60 s after sampling (Figure 4c) revealed a significantly increased number of nuclei qualitatively.
It is assumed that the induced supersaturation is not completely degraded instantly by nucleation after a RT of approximately 6 s provided by the periphery due to the low number of nuclei detected by the in-line DIA (Figure 4a), whereas the microscopic images depict a comparatively high particle density. Moreover, the microscopic images (Figure 4bc) indicate anisotropic nuclei, which can be confirmed after 5 min, 10 min and 15 min RT. The experiments indicated increasing of needles with increasing RT due to nucleation and subsequent crystal growth, as exemplary shown for 15 min RT in Figure 5ab. Thus, a of 0.17 wt.-% after 5 min RT, a of 0.26 wt.-% after 10 min RT, and a of 0.60 wt.-% after 15 min RT was determined. Consequently, it cannot be assumed that the induced supersaturation was completely degraded after 15 min, since based on thermodynamics a of 2.26 wt.-% should result. Since the particles are anisotropic, the PSD was determined by ALD approach as described in Section 2.2. Therefore, MILch, MALch, and the resulting AR served as characterization parameters for the PSD of anisotropic particles obtained in this experiment (Figure 5c).
Furthermore, the T-mixer was operated for 90 min. Within this time, no encrustations occurred and the operating performance was not restricted. Thus, operating times beyond 90 min could be realized, proving that the T-mixer is suitable for long-term operation.
In conclusion, the T-mixer with 180° inlets is considered as a potentially suitable long-term operating continuous in-situ nucleator based on antisolvent nucleation for coupling with different types of crystallizers. Since thermodynamic equilibrium is not instantly reached in the continuous in-situ nucleator, of approximately 1 wt.-% is not instantly generated for subsequent crystal growth. Accordingly, higher theoretical could be targeted in the graphical design of the nucleation process to realize instantaneously real of about 1 wt.-% (Table S1). Nevertheless, the nuclei formed after a RT of 6 s, being below the lower detection limit of the DIA, could provide sufficient surface area for efficient crystal growth in the subsequent crystallizer due to the high surface-to-volume ratio. Therefore, a higher would be required compared to smaller in-situ generated nuclei to provide the same surface area for the subsequent crystal growth. Moreover, the compatibility of the in-situ nucleator with a crystallizer could be ensured despite the residual supersaturation by appropriately adjusting the process parameters of the crystallizer. In order to prove the hypothesis that small nuclei at below 1 wt.-% already provide sufficient surface area for crystal growth in the subsequent continuous crystallizer and that the compatibility of the continuous in-situ nucleator with a continuous crystallizer can be ensured despite the residual supersaturation from the nucleator, the T-mixer as continuous in-situ nucleator was tested by coupling to the SFC as growth zone.
4. Continuous Particle Design Considering Nucleation and Crystal Growth
In this section, the adaption of the nucleator for coupling with an SFC is shown and validated following the procedure described in Section 3. Furthermore, continuous cooling crystallization experiments with coupled nucleator and the SFC as growth zone were carried out for different shaped particles to show its broad applicability.
4.1. Adaption of the Nucleator for Coupling with a Slug Flow Crystallizer
The coupling of the continuous nucleator to the SFC requires the consideration of the mass fraction of ethanol as an antisolvent in the mixture, since it affects the slug flow stability and, thus, the performance of the SFC. High slug stability is aimed at avoiding the migration of particles to neighboring slugs and, thus, generating a narrow RTD of the liquid and solid phase due to the characteristic flow pattern of alternating slug flow [12,40]. Furthermore, a high slug stability provides a narrow slug length distribution (SLD), ensuring uniform growth conditions in the slugs and, thus, a reproducible high product quality. A high slug stability is characterized by convex slugs, requiring the absence of a wall film, the so-called dry pattern. The wall film formation depends on the dynamic three-phase contact angle () between the tubing material and the gas and the liquid phases. In this context, the interfacial tension between the gas and liquid phases () is crucial. For the generation of nuclei in the continuous nucleator, ethanol (antisolvent) is added to the aqueous l-alanine solution, which increases the ethanol concentration in the mixture and decreases and . Using the experimental strategy from our previous publication, it is possible to identify a well-suited operating range of the SFC for the respective substance system to apply continuous cooling crystallization [41]. From this, the ethanol concentration in the mixture should not exceed of 10 wt.-% for a total volume flow rate of 40 mL min-1 at 20 °C for the applied SFC setup.
From the graphical construction of the nucleation process in the T-mixer with 180° inlet configuration, it is evident that, considering the restrictions of equal inlet volume flow rates of feed and antisolvent, for a of maximum 10 wt.-% as well as a generated of at least 1 wt.%, a high dilution results. Due to the high dilution, the MP is located outside the miscibility gap, and no supersaturation is generated for nucleation (Figure S1). For this reason, it is not possible to operate the T-mixer with 180° inlets with equal inlet volume flow rates and guarantee a of maximum 10 wt.-% as well as a of at least 1 wt.-%. Therefore, the nucleator concept was adapted for a T-mixer with 90° inlets (Figure 7) in order to realize equal inlet velocities for the feed solution and antisolvent mixture. Accordingly, the ID dimensions of the feed and antisolvent inlets were modified, enabling equal velocities at the MP and avoiding backmixing during the mixing process.
Furthermore, regarding the crystallization experiments and the coupling of the T-mixer with the SFC, the design of the nucleator should be constructed for the use at 𝜗 = 50 °C. Therefore, as a further restriction, it must be taken into account that the classification of a stable operation zone for ensuring the favored slug formation mechanism and a stable slug flow at a total volume flow rate of 40 mL min-1 and a of 10 wt.-% is only valid for 𝜗 = 20 °C [41]. Nevertheless, the influence of the temperature increase to 𝜗 = 50 °C for the coupling with the SFC can be qualitatively evaluated from the Capillary number . Since is reduced with increasing temperature, 𝐶𝑎 is increased, leading to the conclusion of enhanced wall film present. Consequently, it is expected that forcing the favored slug formation mechanism at 𝜗 = 50 °C requires a decrease of 𝐶𝑎. This was realized by designing T-mixers with 90° inlets, providing of 5 wt.-%. The graphical construction can be seen in Figure 6. The constructed and 3D printed T-mixer is shown in Figure 7.
Figure 6.
Ternary solubility diagram of l-alanine/water/ethanol at 50 °C and 1 bar. The solid blue line represents the solubility curve based on the experimental data from An et al. [39]. The solid green line describes the underlying conode of the nucleation process until thermodynamic equilibrium is reached. The dashed red line connects the feed solution (F, blue triangle) and antisolvent mixture (AS, red triangle, ) to be mixed and the intersection between the dashed red line and the green line defines the MP (black dot). By using the lever rule, as well as the ratio of the feed and antisolvent mass flow rate can be calculated based on the location of the MP on the conode. Graphical construction of nucleation process for the 90° T-mixer for of 5 wt.-% and of 1 wt.-%.
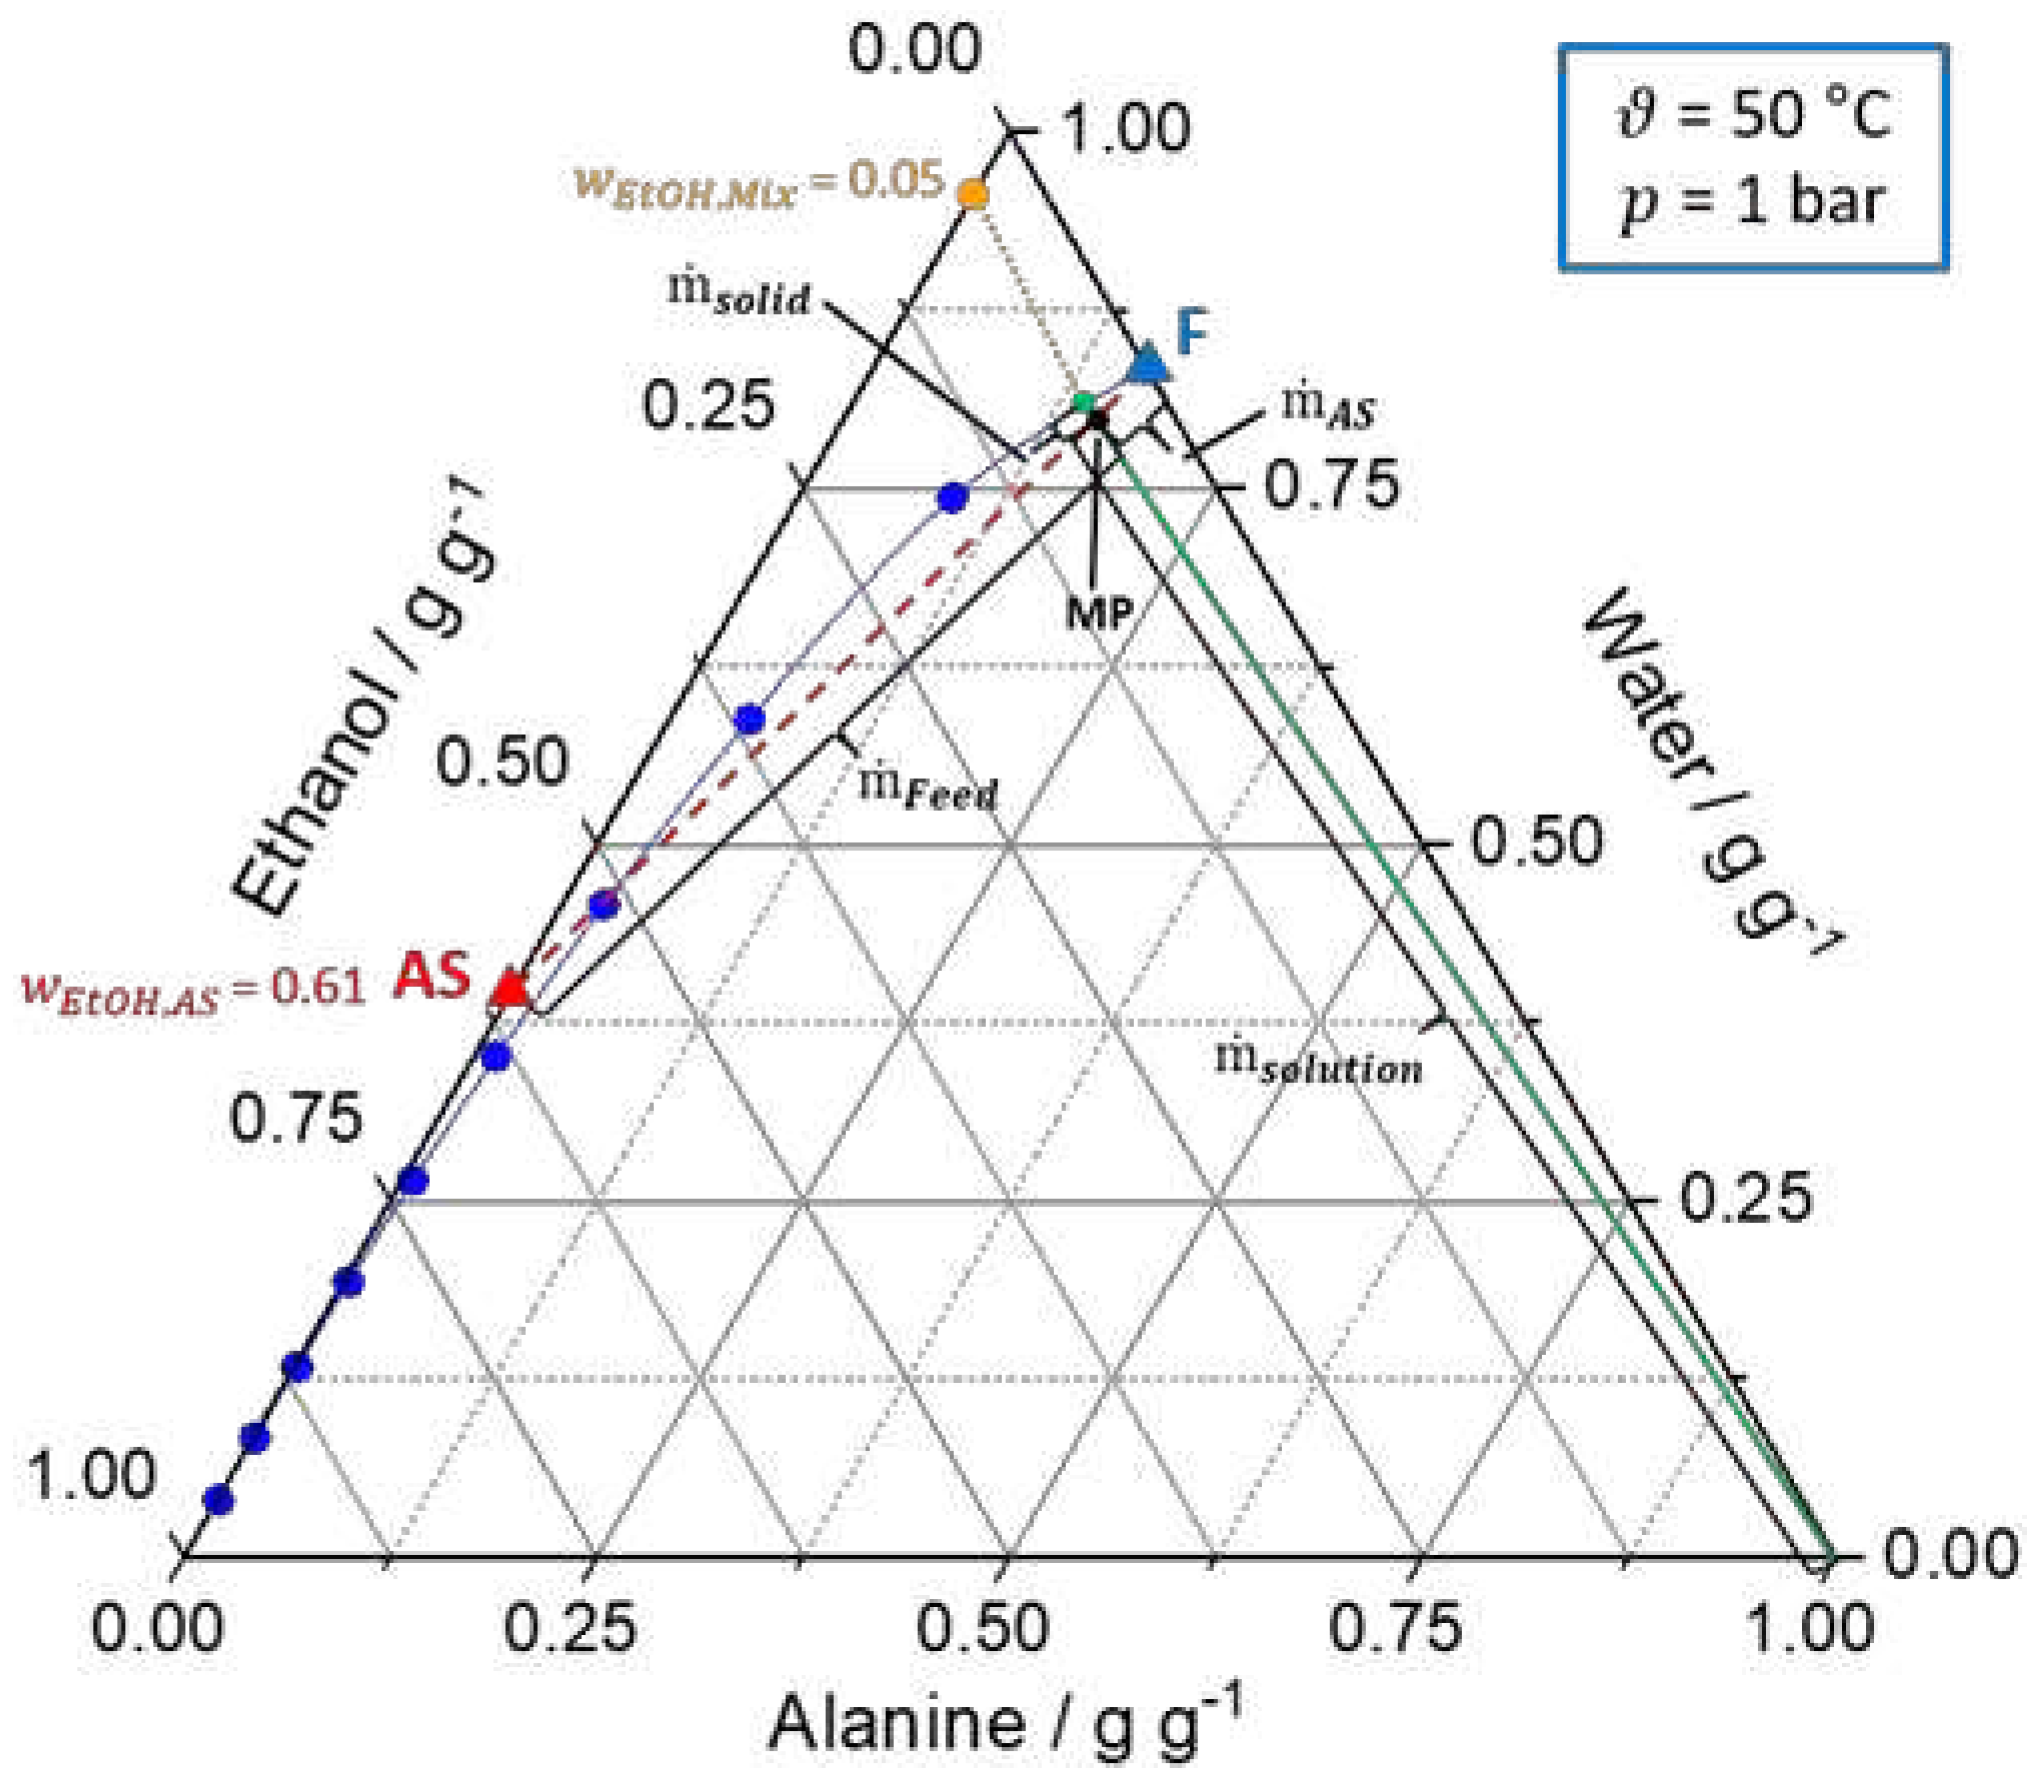
Figure 7.
Design of the T-mixer with 90° inlets as continuous nucleator for of 5 wt.-% at 𝜗 = 50 °C: (left) Illustration of a cross-section created by the CAD software Fusion 360 with ID dimensions. The IDs of the feed and the mixing channel depend on the process parameters. (right) Photo of the 3D printed T-mixer.
Before coupling the nucleator to the SFC, the T-mixer and its performance are first checked. For the characterization experiments examining the T-mixer as continuous in-situ nucleator, the experiments were conducted at 𝜗 = 20 °C to evaluate the performance of the nucleator without heat losses. The design and process parameters of the T-mixer with 90° inlets for the characterization (Design 1) and coupling experiments with the SFC as growth zone (Design 2) are summarized in Table 1.
4.2. Validation Experiments for SFC Nucleator
The characterization experiments for the mixer with 90° inlets were carried out according to the process parameters listed in Table 1 (Design 1) to validate the nuclei formation and to verify the suitability as continuous nucleator for the SFC. The results are shown in Figure 8.
The resulting particle shape is characterized as mainly bipyramidal, respectively, isotropic particles. The in-line DIA measurements were conducted twice. Despite the low particle number, a narrow PSD with a defined mean particle size was obtained (Figure 8, blue data points).
The low number of measured particles suggested a relatively high residual supersaturation at the time of measurement in the QICPIC flow cell after a RT of approximately 10 s provided by the periphery. Therefore, analogous to the characterization experiments of the T-mixer with 180° inlets (Section 3.3.2), at-line gravimetric concentration measurements were conducted after 5, 10, and 15 min of RT to evaluate whether a steady-state value is established after a certain time period. For this configuration used in this section, the mass fraction slightly increased during the observed RT of 15 min (Table S1), indicating slow nucleation and growth kinetics. The DIA after a RT of 15 min (Figure 8, orange data points) shows a high number of particles detected with a of 52.54 ± 4.20 µm and width of PSD of = 64.82 ± 1.85 µm. The low standard deviations show that the nucleator design with 90° provides highly reproducible results.
The characterization experiments were conducted for 90 min each without the occurrence of encrustations or restricted operating performance. Hence, this nucleator is assumed to be suitable for long-term operation and coupling to the SFC serving as a growth zone.
4.3. Experimental Setup and Procedure
The setup used for the continuous crystallization experiments containing the nucleator in front of the SFC as growth zone is shown in Figure 9. The feed solution (𝑉 = 5 L) was prepared for a saturation temperature of = 50 °C (eq. (1)) and stirred for 1 h at 55 °C at a rotational stirrer speed of 250 rpm. This ensured that the solute l-alanine was completely dissolved and a crystal-free solution could be generated. After one hour, the antisolvent mixture (𝑉 = 0.3 L) was prepared and stirred at 150 rpm. Afterwards, the feed solution and antisolvent mixture were pumped into the T-mixer serving as continuous nucleator. In order to compensate heat losses in the periphery between the vessels ( = 103.4 cm; = 49.4 cm) and the nucleator as well as between the nucleator and the SFC ( = 10 cm), the feed vessel was tempered to 52 °C and the antisolvent vessel to 53 °C during the operation. Furthermore, as illustrated in Figure 9, the feed line, the antisolvent line and the connection line were isolated in order to improve temperature control.
The pumps and tubing used for these experiments are identical to the experimental setup described previously for the independent investigation of the nucleator (Section 3.3.). The subsequent slug formation zone was realized with a T-junction (PP, = 102°), which is fed with the suspension from the nucleator from the top and synthetic air from the bottom. The volume flow rate of the synthetic air is regulated with a high-resolution needle valve (NV-001-HR from Bronkhorst) and a flow meter (El-Flow-Select from Bronkhorst). In addition, the synthetic air is heated up to solution temperature by a tube-in-tube construction to avoid wall crystallization in the T-junction due to the temperature difference between the suspension and the synthetic air. The constructive connection from the T-junction to the SFC tubing is decisive for the slug stability. Since the IDs of the T-junction ( = 3 mm) and the SFC tubing ( = 3.18 mm) are almost equal, a flush connection can be realized [64]. The SFC tubing is manufactured of fluorinated ethylene propylene (FEP) and has a total length of 26.54 m. FEP is characterized by a strong hydrophobicity and a high wetting angle of = 108.5° so that the risk of wall film formation in the SFC can be minimized.
The driving force for crystallization within the growth zone is realized by cooling. For this purpose, a co-current tube-in-tube is used around the FEP tubing, which allows a gentle cooling of the suspension and the flexible adjustment of different cooling rates via the final temperature and the volume flow rate of the tempering medium (water) [12].
At the outlet of the crystallizer, analytics for qualitative and quantitative evaluation of product particles are conducted as described in Section 2.2. In addition, the stability and consistency of slug flow are observed with a non-invasive video analysis. Therefore, the FEP tubing passes through a transparent glass box (14 cm × 6 cm × 6 cm) filled with degassed water, illuminated by a LED lamp. This minimizes reflections and light effects of the environment and creates a high contrast. Depending on the adjusted temperature at the end of the SFC, the glass box is filled with appropriately tempered water to prevent wall crystallization due to temperature differences. The videos were recorded with a Canon EOS M6 camera and processed with an in-house MATLAB script to determine the slug length and its distribution. [42,43].
The overall crystallization process, including nucleation and growth zone, is evaluated with respect to relative yield, long-term operability, reproducibility, and product quality in terms of PSD. Therefore, one operating point (OP1) in triplicate was tested for validation of the continuous nucleator and its suitability for coupling with the SFC for the proof of concept. The selection of the experimental parameters is based on preliminary experiments so that the occurrence of wall crystallization can be avoided and stable and long-term operation of the connected apparatus can be guaranteed. Nevertheless, this operating point is known to be not optimal regarding suspension of particles so that agglomeration events may frequently occur.
In order to enhance the suspension, the suspension correlation developed in our previous publication [44] was used to determine the velocity necessary for homogeneous horizontal and vertical particle suspension inside the slugs. Therefore, two experiments (OP2) were conducted to qualitatively show the suitability of the coupled nucleation and growth zone producing high-quality products. The total liquid volume flow rate was increased, as this has been shown to be the CPP for suspension [42]. However, this leads to a reduction of at constant and, thus, less time remains for crystal growth inside the SFC. The design and process parameters of both operating points are displayed in Table 2.
Regarding the production of APIs in the pharmaceutical industry, the feasibility of the continuous crystallization process for non-bipyramidal, anisotropic particle shapes is of major importance since most APIs exhibit a high AR [45]. Accordingly, the T-mixer with 90° inlets as a continuous nucleator based on antisolvent nucleation was qualitatively examined with respect to its potential for the operation with various crystal shapes of l-alanine. The T-mixer characterization experiments in Section 3.4. indicated that with regard to antisolvent nucleation, the particle shape is influenced by the ethanol concentration. Thus, the experimental results revealed that bipyramidal particles were generated at = 5 wt.-% and needle-shaped particles were obtained at = 23 wt.-%. Since explicitly for the coupling with the SFC, a specific particle shape formation by adjusting is not possible due to the operational limitation regarding the ethanol concentration for stable slug flow, the influence of the addition of l-glutamic acid on the particle shape in the context of a quaternary substance system l-alanine/l-glutamic acid/water/ethanol was evaluated. The l-glutamic acid was added with a concentration of 5.8 g kg-1 regarding the mass of water to the feed solution (l-alanine/water) at = 50 °C. The experiments were performed using process parameters of OP2 (Table 2) for enhanced particle suspension in the slugs in duplicate. The relatively high 𝜅̅ of 1.90 K min-1 favored the formation of the largest possible optically detectable particles to ensure reliable microscopic examination of the particle shape.
4.4. Results
The results of the crystallization experiments with the 90° T-mixer as continuous nucleator coupled with the SFC according to the operating points for ternary substance system in Table 2 are given in Table 3 and Figure 10. During the entire processing time of OP1 experiments of about 45 min each, the desired squeezing mechanism inside the slug formation zone was observed confirming the assumptions made according to the findings of Kufner et al. [41]. Furthermore, the low standard deviations with respect to the process parameters , and ensure a reliable evaluation of the experiments and its reproducibility. In terms of , 81.52 ± 3.61 % was obtained within a RT of 16.44 ± 1.21 min using a moderate mean cooling rate () of 1.51 ± 0.09 K min-1.
Regarding the particle size, a of 484.14 ± 54.60 µm and a broad particle size width of = 530.47 ± 50.21 µm was measured via the at-line DIA procedure. This confirms that suspension of particles is not sufficient to distribute the particles equally in horizontal and vertical directions within the slugs (Figure 10, bottom left) leading to a high contact time of particles. This enables the formation of solid bridges between them resulting in agglomerates, which is qualitatively confirmed by microscopic images (see exemplarily Figure 10, top left). The particle shapes are bipyramidal and correspond to the shapes obtained in the characterization experiments of the 90° T-mixer shown in Section 4.2.
In case of OP2, no single particles or particle clusters are visible to the naked eye at the end of the SFC tubing, but a white shimmer is visible within the entire liquid slug (Figure 10, bottom right), proving the assumption that the suspension state was sufficient. The microscopic image shows that small, bipyramidal single particles have been formed (Figure 10, top right) so that this operating point is capable of producing particles with a low agglomeration degree. Unfortunately, this could not be conclusively confirmed by at-line DIA, as the particles were too small for the measurements.
Figure 11 shows the results of using quaternary substance system l-alanine/l-glutamic acid/water/ethanol to demonstrate the potential application of the T-mixer as continuous nucleator for producing particles with increasing aspect ratio. During experiments optically no particles were detected in the slugs via naked eye (see Figure 11, bottom). This qualitatively suggests a broader metastable zone width (MZW) of the quaternary substance system compared to the ternary substance system used before. But, Figure 11 shows a corresponding microscopic image of the suspension at the outlet of the SFC, showing small needle-shaped particles. Consequently, the influence of l-glutamic acid on the particle shape is verified. Furthermore, the microscopic image qualitatively shows a narrow PSD with relatively small mean particle size. This aligns with the observation that no particles were optically detected in the SFC due to relatively small particle sizes. Moreover, the small particle sizes indicate an effective suspension of the particles in the slugs reflected qualitatively by the formation of single or low agglomerated particles, respectively.
The experimental results presented in this section qualitatively demonstrate that the T-mixer with 90° inlets as continuous nucleator coupled with the SFC as growth zone in the context of continuous crystallization is also feasible for the production of non-bipyramidal, respectively, anisotropic particles.
5. Full-Continuous End-to-End Small-Scale Manufacturing
In this section, the full-continuous end-to-end small-scale manufacturing process of crystalline particles from continuous nucleation to free-flowing particles was realized by adding the continuous particle isolation unit ending up in free-flowing particles.
5.1. Experimental Setup and Procedure
The experimental setup is depicted in Figure 12. The integrated process is divided into three stages, whereby experimental conditions of all stages are summarized in Table 4.
Stage 1 comprises the continuous nucleator realized by the T-mixer with 90° inlet configuration of design 2 according to Table 1. Subsequently, the continuous crystallization takes place in the SFC in stage 2 with process parameters OP1 (see Table 2). OP1 provides a higher and a lower SFC outlet temperature compared to OP2, ensuring a higher after the crystallization, which is needed for higher downstream performance inside the CVSF (described below), and reliable analysis at the SFC outlet with minimal temperature influence. Finally, the continuous particle isolation, namely solid-liquid separation and particle washing, is performed by the patented CVSF in stage 3 to achieve free-flowing particles at the end of the CPC [28,35].
The coupling of the SFC to the CVSF was already investigated by us in a previous study at two different operating points [11]. For continuous crystallizers, residual supersaturation at its outlet is a major challenge with respect to coupling with subsequent unit operations especially for solid-liquid separation based on filtration. The residual supersaturation of the mother liquor potentially leads to clogging of the filter medium, decreasing the performance of the continuous solid-liquid separation. As described in our previous work [11], the residual supersaturation of the mother liquor at the continuous crystallizer outlet can be degraded by rapidly heating to a slightly undersaturated state without dissolving the product particles due to a short RT in this state before filtration. Consequently, a tube-in-tube heater was implemented between the SFC and CVSF. The outlet temperature of the SFC from the coupling experiments of the T-mixer with 90° inlet configuration and the SFC (Section 4.3.) was used for the operating temperature of the heater as well as for the adjustment of the operating parameters of the CVSF. Based on a total volume flow rate of the SFC outlet stream of approximately 12.8 mL min-1 and an ID of 3.18 mm of the inner FEP tubing of the heater, a tubing length for the heater of 19 mm was chosen to provide a RT of merely 7 s in the heater () and, thus, rapid heating while avoiding particle dissolution. The preservation of the PSD before and after the heater for < 10 s was proven in preliminary experiments in our previous work [11]. The outer tubing of the heater was made of polyvinyl chloride (PVC) with an ID of 15 mm. The tube-in-tube heater was operated in co-current mode by using a thermostat (Huber CC-K6). Regarding the outlet temperature of the SFC of 24 °C, the mother liquor was rapidly heated by 7 K to 31 °C in the heater to ensure a slightly undersaturated state before entering the CVSF.
The modular CVSF in stage 3 consists of tubular, double-walled cylindrical modules for the process steps filtration and washing. As investigated in previous studies for the substance system l-alanine/water with bipyramidal l-alanine particles, the CVSF setup providing filtration and two-stage washing guarantees dry, free-flowing particles already without additional drying [35]. More detailed information regarding the CVSF setup can be found in previous publications [6,30]. The suspension from the SFC was continuously heated in the tube-in-tube heater and supplied into the first module of the CVSF, where the initial solid-liquid separation was performed by vacuum filtration. The vacuum in the modules was applied by corresponding vacuum pumps (Vacuubrand PC 2004 Vario) and the filtrates were collected in respective vessels. The formed filter cake was axially transported simultaneously to the first washing step in the subsequent module by a slowly rotating screw. The wash liquid in the first washing module was a mixture of ethanol and water in a volumetric ratio of 4:1. The composition was chosen to prevent nucleation due to an antisolvent effect of the remaining mother liquor in the filter cake after the filtration process. In the second washing module pure ethanol was applied as wash liquid. Hollow cone nozzles (Lechler 220.014) were used for a homogenous distribution of the wash liquids on the filter cake. Peristaltic pumps (Masterflex 07528-30) were utilized for pumping the wash liquids to the nozzles of the corresponding washing module. In the washing modules, the displaced liquid from the pores of the filter cake as well as the applied wash liquid were simultaneously removed by vacuum filtration analogous to the sole filtration process in the first module.
The filling degree is an essential parameter for the CVSF operation and performance. Therefore, should be adjusted to minimum 50 % to ensure an effective filtration and washing process [6,30]. Since the volume flow rate of the suspension and are predefined by the preceded crystallization process in the SFC, the was set by the rotational screw speed . The directly influences the in the CVSF. Accordingly, a maximum, non-optimal of 5 % was realized at a minimum of 1 rpm. The volume flow rates of the wash liquids were each set to the minimum volume flow rate of 15 mL min-1 to provide the lowest possible wash ratio in both washing modules.
Gravimetric concentration measurements at the outlet of the SFC were conducted, enabling the calculation of the achieved of the continuous crystallization process in the SFC. Moreover, the PSDs was measured using at-line DIA at the inlet and outlet of the CVSF in order to demonstrate that the CVSF operation ensures the preservation of the particle properties designed in the preceded continuous crystallization process in the SFC. Finally, the residual moisture of the particles at the outlet of the CVSF was determined by gravimetric concentration measurements in order to guarantee free-flowing particles at the end of the full-continuous CPC.
5.2. Results
From the concentration measurements at the outlet of the SFC, a high of 87.5 ± 2.5 % was achieved in the continuous crystallization step based on three experiments. Furthermore, confirming the experimental results in Section 4.4., the continuous nucleation in the T-mixer with 90° inlets coupled with the SFC provides reproducible results in terms of the achieved . The PSDs determined at the inlet and outlet of the CVSF of one experiment are depicted in Figure 13 together with representative images from DIA.
Based on the PSD in Figure 13, a of 377..25 µm was determined. This value is in the same magnitude as the from the coupling experiments in Section 4.4., indicating a reproducible continuous nucleation and growth process. Furthermore, a of 258.92 µm was derived. Compared to our previous study regarding the coupling of the SFC with the CVSF based on seed supply (350-560 µm) [11], a narrower PSD was achieved in this work by using the T-mixer with 90° inlets as continuous in-situ nucleator. The PSD at the CVSF outlet is characterized by a of 353.29 µm and a of 267.60 µm. Consequently, the mean particle size () and the particle size width () at the inlet and outlet of the CVSF show a high level of agreement, demonstrating the preservation of the CQAs during CVSF operation.
A reproducibly measured residual moisture of 3 ± 0.16 % in three experiments indicated almost dry, free-flowing particles, despite the low of 5 %, leading to a restricted deliquoring process and, thus, a higher residual moisture.
Regarding long-term operation of the entire integrated process, the SFC was operated for 45 min until increased wall crystallization inside the SFC and the heater occurred. The CVSF exhibited a constant performance over the total 60 min operation time. Accordingly, no filter clogging occurred as evidenced by a constant pressure drop in the filtration module (Figure 14, left) and a constant filtration performance (Figure 14, right). This suggested that the supersaturated mother liquor at the outlet of the SFC was sufficiently undersaturated in the heater in order to prevent filter clogging in the filtration module of the CVSF.
The experimental results presented in this section demonstrate for OP1 (Table 2) that the full-continuous end-to-end small-scale manufacturing process, consisting of the T-mixer with 90° inlet configuration, the SFC, and the CVSF, provides a high of approximately 80 % in the continuous crystal growth process in the SFC. Additionally, the preservation of the CQAs during CVSF operation can be inferred from the high agreement of PSDs in terms of mean particle size () and particle size width () at the inlet and outlet of the CVSF. Furthermore, a low residual moisture of approximately 3 % was reproducibly determined at the CVSF outlet, indicating free-flowing particles at the CVSF outlet, despite at a low, non-optimal of 5 % in the CVSF.
6. Conclusions
Production in the pharmaceutical industry for a small-scale production (250 - 100 kg a-1) is undergoing a turnaround in terms of processing methods. Thus, more and more research is performed in the direction of continuous production, which, however, brings challenges on a small scale like this. There are already some concepts for continuous cooling crystallization and very few concepts for downstream, but there is still a lack of suitable methods to provide continuous nucleation and, thus, continuous in-situ seeds for crystallization. This leads to the fact that a long-term operation of a continuous production of crystalline products is not easily possible.
Our study follows this line of thought, introducing a novel continuous nucleator designed based on phase diagrams making use of antisolvent nucleation. The choice of antisolvent used for nucleation should ideally match the solvent used in the washing step. For rapid and precise creation of the nucleator on a small scale, meeting diverse requirements for nucleation and subsequent growth processes it is fabricated through fast 3D printing. The suitability of the nucleator for continuous, long-term operation in combination with various crystallizers was assessed to ensure an adequate number of nuclei for the subsequent growth process and substantial consumption of supersaturation, minimizing the risk of fouling in the crystallizer. The developed nucleator in form of a T-mixer could be implemented in front of various crystallizers. Here its implementation was shown for the slug flow crystallizer (SFC) with the aim of producing high-quality product particles. These results obtained using the coupled continuous nucleator and the SFC as growth zone are qualitatively comparable to the results of a batch cooling crystallization [11] and the SFC crystallization from the literature [11,12], which, however, were carried out with the binary substance system l-alanine/water. In this context, the concept of continuous in-situ nucleation compared to seed crystal addition provides both a reduced time effort, since the production of seed crystals with high-quality specifications is not required, and the prevention of potential contamination due to the in-situ production of nuclei.
Furthermore, with the connection to the continuous vacuum screw filter (CVSF) the fully continuous crystal process chain (CPC) up to free-flowing particles was completed and the experimental results demonstrate that the full-continuous end-to-end small-scale manufacturing of free-flowing particles is possible, achieving reproducibly high relative yields in the crystal growth process in the SFC of approximately 80 %, preserving the critical quality attributes (CQAs) during CVSF operation and ending up with residual moistures of around 3 % with the configuration used, despite a low, non-optimal filling degree of 5 % in the CVSF. The modular setup of the CVSF provides the option to extend the CVSF by a drying module in order to further reduce the residual moisture below 1 % and obtain dry, free-flowing particles at the end of the integrated process. Additionally, the CVSF offers the potential to realize higher filling degrees independent from the suspension volume flow rate and solid loading by increasing the shaft diameter of the screw. This will further improve the flexibility of the CVSF with regard to the compatibility to various types of continuous crystallizers and operation points. A summary of all results for nucleator characterization and coupling experiments are listed in Table S3.
With respect to long-term operation, the processing time could be extended by implementing a cleaning-in-place (CIP) system when fouling is detected in the SFC. Moreover, the proof of concept experiments were performed with the model substance system l-alanine/water/ethanol, resulting in limited achievable yields and solid loadings in the SFC based on the solubility data. Consequently, the integrated process consisting of the T-mixer with 90° inlets configuration as continuous nucleator, the SFC for continuous crystallization and the CVSF for continuous product isolation must comprehensively investigated with respect to different substance systems and operating windows.
The end-to-end continuous small-scale manufacturing process for free-flowing crystalline particles investigated in this study shows that even at non-optimized conditions the concepts used enable fast production of high-quality crystalline particles, which is of high importance during the drug development phase especially for new drug substances.
Supplementary Materials
The following supporting information can be downloaded at the website of this paper posted on Preprints.org.
Author Contributions
Conceptualization, A.C.K. and K.W.; methodology, A.C.K. and M.M.; investigation, A.C.K. and M.M.; writing—original draft preparation, A.C.K. and M.M.; writing—review and editing, K.W.; visualization, A.C.K. and M.M.; supervision, K.W.; All authors have read and agreed to the published version of the manuscript.
Funding
Our research receives funding by the German Research Foundation (Deutsche Forschungsgemeinschaft—DFG) in the framework of the Priority Programme SPP 2364—Project No. 504676854.
Data Availability Statement
Data is contained within the article or supplementary material.
Conflicts of Interest
The authors declare no conflict of interest. The funders had no role in the design of the study; in the collection, analyses, or interpretation of data; in the writing of the manuscript; or in the decision to publish the results.
Abbreviations
| ALD | Axis length distribution |
| API | Active pharmaceutical ingredient |
| AR | Aspect ratio |
| AS | Antisolvent |
| CAD | Computer aided design |
| CPC | Crystal process chain |
| CPP | Critical process parameter |
| CQA | Critical quality attribute |
| CVSF | Continuous vacuum screw filter |
| DIA | Dynamic image analysis |
| F | Feed |
| FEP | Fluorinated-ethylene-propylene |
| HGAP | High-gravity antisolvent precipitation |
| ID | Inner diameter |
| MAAC | Membrane-assisted antisolvent crystallization |
| MAL | Major axis length |
| MALch | Characteristic major axis length |
| MIL | Minor axis length |
| MILch | Characteristic minor axis length |
| MP | Mixing point |
| MSLA | Masked stereolithography |
| MSMPR | Mixed-suspension mixed-product removal |
| MTMCR | Microporous tube-in-tube microchannel reactor |
| MZW | Metastable zone width |
| NZ | Nucleation zone |
| OP | Operating point |
| PFC | Plug flow crystallizer |
| PP | Polypropylene |
| PSD | Particle size distribution |
| PVC | Polyvinyl chloride |
| QbD | Quality by design |
| RT | Residence time |
| RTD | Residence time distribution |
| R&D | Research and development |
| SDR | Spinning disc reactor |
| SFC | Slug flow crystallizer |
| SLD | Slug length distribution |
| Latin Symbols | |
| A | Area/m-2 |
| Concentration/g g−1 | |
| Saturation concentration/g g−1 | |
| Ca | Capillary number/- |
| d | Diameter/m |
| h | Height/m |
| L | Characteristic length/m |
| m | Mass/kg |
| Mass flow/kg s-1 | |
| n | Particle number density of class i/- |
| Q | Volume flow rate/mL min−1 |
| r | Radius/m |
| Reynolds number | |
| Supersaturation/- | |
| V | Volume/m-3 |
| v | Velocity/m s-1 |
| w | Mass fraction/- |
| Y | Yield/% |
| Greek Symbols | |
| α | Filling degree/_ |
| ∆c | Concentration difference/g g-1 |
| ε | Liquid hold-up/- |
| Dynamic viscosity/Pa s | |
| Three-phase contact angle/° | |
| Temperature/°C | |
| Cooling rate/K min-1 | |
| Density/kg m-3 | |
| Surface tension/N m-1 | |
| Residence time/s | |
| Cross-sectional area/- | |
| Indices | |
| 0 | Initial state |
| 10,3 | 10 % of the distribution by volume |
| 50,3 | Median by volume |
| 90,3 | 90 % of the distribution by volume |
| Saturation | |
| Ala | l-alanine |
| ambient | Ambient temperature |
| AS | Antisolvent |
| AS line | Tubing of the antisolvent line |
| BV | Batch vessel |
| Connection line | Tubing between nucleator outlet and SFC inlet |
| dry | Dry solid |
| dyn | dynamic |
| empty | Empty vessel |
| EtOH | Ethanol |
| Feed | Feed stream |
| Feed line | Tubing of the feed line |
| G/L | Between gas and liquid phase |
| Inner | |
| L | Liquid |
| M | Mixing channel |
| mix | Mixture |
| rel | relative |
| sat | Saturation |
| SFC,end | Outlet of the SFC |
| SFC,start | Inlet of the SFC |
| solid | Solid phase |
| solution | Solution (liquid phase) |
| TO | Turnover |
References
- J. Chen, B. Sarma, J.M.B. Evans, A.S. Myerson, Pharmaceutical Crystallization, Crystal Growth & Design 11 (2011) 887–895. [CrossRef]
- T. Vetter, C.L. Burcham, M.F. Doherty, Regions of attainable particle sizes in continuous and batch crystallization processes, Chemical Engineering Science 106 (2014) 167–180. [CrossRef]
- P. Kleinebudde, J. Khinast, J. Rantanen, Continuous manufacturing of pharmaceuticals, Wiley, Hoboken, NJ, 2017.
- A. Cote, D. Erdemir, K.P. Girard, D.A. Green, M.A. Lovette, E. Sirota, N.K. Nere, Perspectives on the Current State, Challenges, and Opportunities in Pharmaceutical Crystallization Process Development, Crystal Growth & Design 20 (2020) 7568–7581. [CrossRef]
- J. Orehek, D. Teslić, B. Likozar, Continuous Crystallization Processes in Pharmaceutical Manufacturing: A Review, Org. Process Res. Dev. 25 (2021) 16–42. [CrossRef]
- C. Steenweg, A.I. Seifert, G. Schembecker, K. Wohlgemuth, Characterization of a Modular Continuous Vacuum Screw Filter for Small-Scale Solid–Liquid Separation of Suspensions, Org. Process Res. Dev. 25 (2021) 926–940. [CrossRef]
- C.J. Testa, K. Shvedova, C. Hu, W. Wu, S.C. Born, B. Takizawa, S. Mascia, Heterogeneous Crystallization as a Process Intensification Technology in an Integrated Continuous Manufacturing Process for Pharmaceuticals, Org. Process Res. Dev. 25 (2021) 225–238. [CrossRef]
- A. Domokos, B. Nagy, B. Szilágyi, G. Marosi, Z.K. Nagy, Integrated Continuous Pharmaceutical Technologies—A Review, Org. Process Res. Dev. 25 (2021) 721–739. [CrossRef]
- B. Wood, K.P. Girard, C.S. Polster, D.M. Croker, Progress to Date in the Design and Operation of Continuous Crystallization Processes for Pharmaceutical Applications, Org. Process Res. Dev. 23 (2019) 122–144. [CrossRef]
- D. Zhang, S. Xu, S. Du, J. Wang, J. Gong, Progress of Pharmaceutical Continuous Crystallization, Engineering 3 (2017) 354–364. [CrossRef]
- C. Steenweg, A.C. Kufner, J. Habicht, K. Wohlgemuth, Towards Continuous Primary Manufacturing Processes—Particle Design through Combined Crystallization and Particle Isolation, Processes 9 (2021) 2187. [CrossRef]
- M. Termühlen, M.M. Etmanski, I. Kryschewski, A.C. Kufner, G. Schembecker, K. Wohlgemuth, Continuous slug flow crystallization: Impact of design and operating parameters on product quality, Chemical Engineering Research and Design 170 (2021) 290–303. [CrossRef]
- T. Wang, H. Lu, J. Wang, Y. Xiao, Y. Zhou, Y. Bao, H. Hao, Recent progress of continuous crystallization, Journal of Industrial and Engineering Chemistry 54 (2017) 14–29. [CrossRef]
- Continuous Pharmaceutical Processing, Springer, Cham, 2020.
- N. Yazdanpanah, Z.K. Nagy (Eds.), The Handbook of continuous crystallization, Royal Society of Chemistry, London, 2020.
- J.W. Mullin, Crystallization, 4th ed., Elsevier Science & Technology, Oxford, 2001.
- W. Beckmann, Crystallization: Basic Concepts and Industrial Applications, 1st ed., Wiley-VCH, Weinheim, 2013.
- M.-C. Lührmann, M. Termühlen, J. Timmermann, G. Schembecker, K. Wohlgemuth, Induced nucleation by gassing and its monitoring for the design and operation of an MSMPR cascade, Chemical Engineering Science 192 (2018) 840–849. [CrossRef]
- R.J.P. Eder, S. Schrank, M.O. Besenhard, E. Roblegg, H. Gruber-Woelfler, J.G. Khinast, Continuous Sonocrystallization of Acetylsalicylic Acid (ASA): Control of Crystal Size, Crystal Growth & Design 12 (2012) 4733–4738. [CrossRef]
- M. Jiang, Z. Zhu, E. Jimenez, C.D. Papageorgiou, J. Waetzig, A. Hardy, M. Langston, R.D. Braatz, Continuous-Flow Tubular Crystallization in Slugs Spontaneously Induced by Hydrodynamics, Crystal Growth & Design 14 (2014) 851–860. [CrossRef]
- J.M. Schall, J.S. Mandur, R.D. Braatz, A.S. Myerson, Nucleation and Growth Kinetics for Combined Cooling and Antisolvent Crystallization in a Mixed-Suspension, Mixed-Product Removal System: Estimating Solvent Dependency, Crystal Growth & Design 18 (2018) 1560–1570. [CrossRef]
- W.-Z. Zhu, J.-X. Wang, L. Shao, H. Zhang, Q. Zhang, J.-F. Chen, Liquid antisolvent preparation of amorphous cefuroxime axetil nanoparticles in a tube-in-tube microchannel reactor, International Journal of Pharmaceutics 395 (2010) 260–265. [CrossRef]
- S. Sana, K. Boodhoo, V. Zivkovic, Production of starch nanoparticles through solvent-antisolvent precipitation in a spinning disc reactor, Green Processing and Synthesis (019) 507–515.
- J.-F. Chen, J.-Y. Zhang, Z.-G. Shen, J. Zhong, J. Yun, Preparation and Characterization of Amorphous Cefuroxime Axetil Drug Nanoparticles with Novel Technology: High-Gravity Antisolvent Precipitation, Industrial & Engineering Chemistry Research 45 (2006) 8723–8727. [CrossRef]
- J. Li, L. Sheng, L. Tuo, W. Xiao, X. Ruan, X. Yan, G. He, X. Jiang, Membrane-Assisted Antisolvent Crystallization: Interfacial Mass-Transfer Simulation and Multistage Process Control, Industrial & Engineering Chemistry Research 59 (2020) 10160–10171. [CrossRef]
- M. Engler, N. Kockmann, T. Kiefer, P. Woias, Convective Mixing and Its Application to Micro Reactors, ASME 2004 2nd International Conference on Microchannels and Minichannels (2008) 781–788. [CrossRef]
- S.-S. Hsieh, J.-W. Lin, J.-H. Chen, Mixing efficiency of Y-type micromixers with different angles, International Journal of Heat and Fluid Flow 44 (2013) 130–139. [CrossRef]
- C. Steenweg, G. Schembecker, K. Wohlgemuth, ROTATING-SCREW DRYING REACTOR WO 2021/148108 A1.
- Modular, kleinskalig und kontinuierlich—Von der Suspension zum getrockneten Produkt mittels neuartigem Vakuumschraubenfilter, 2021.
- C. Steenweg, A.I. Seifert, N. Böttger, K. Wohlgemuth, Process Intensification Enabling Continuous Manufacturing Processes Using Modular Continuous Vacuum Screw Filter, Org. Process Res. Dev. 25 (2021) 2525–2536. [CrossRef]
- K. Wohlgemuth, G. Schembecker, Modeling induced nucleation processes during batch cooling crystallization: A sequential parameter determination procedure, Computers & Chemical Engineering 52 (2013) 216–229. [CrossRef]
- QICPIC Messbereiche, ISO Norm QICPIC Module. Available online: https://www.sympatec.com/de/partikelmesstechnik/sensoren/dynamische-bildanalyse/qicpic/ (accessed on 2 February 2023).
- M.O. Besenhard, P. Neugebauer, O. Scheibelhofer, J.G. Khinast, Crystal Engineering in Continuous Plug-Flow Crystallizers, Crystal Growth & Design 17 (2017) 6432–6444. [CrossRef]
- P. Neugebauer, J. Cardona, M.O. Besenhard, A. Peter, H. Gruber-Woelfler, C. Tachtatzis, A. Cleary, I. Andonovic, J. Sefcik, J.G. Khinast, Crystal Shape Modification via Cycles of Growth and Dissolution in a Tubular Crystallizer, Crystal Growth & Design 18 (2018) 4403–4415. [CrossRef]
- C. Steenweg, J. Habicht, K. Wohlgemuth, Continuous Isolation of Particles with Varying Aspect Ratios up to Thin Needles Achieving Free-Flowing Products, Crystals 12 (2022) 137. [CrossRef]
- Moore W. P., Optimize batch crystallization, Chemical engineering progress 90 (1994) 73–79.
- E. Aamir, Z.K. Nagy, C.D. Rielly, Evaluation of the Effect of Seed Preparation Method on the Product Crystal Size Distribution for Batch Cooling Crystallization Processes, Crystal Growth & Design 10 (2010) 4728–4740. [CrossRef]
- N. Kubota, N. Doki, M. Yokota, A. Sato, Seeding policy in batch cooling crystallization, Powder Technology 121 (2001) 31–38. [CrossRef]
- M. An, J. Qiu, D. Yi, H. Liu, S. Hu, J. Han, H. Huang, H. He, C. Liu, Z. Zhao, Y. Shi, P. Wang, Measurement and Correlation for Solubility of l -Alanine in Pure and Binary Solvents at Temperatures from 283.15 to 323.15 K, Journal of Chemical & Engineering Data 65 (2020) 549–560. [CrossRef]
- M. Su, Y. Gao, Air–Liquid Segmented Continuous Crystallization Process Optimization of the Flow Field, Growth Rate, and Size Distribution of Crystals, Industrial & Engineering Chemistry Research 57 (2018) 3781–3791. [CrossRef]
- A.C. Kufner, A. Krummnow, A. Danzer, K. Wohlgemuth, Strategy for Fast Decision on Material System Suitability for Continuous Crystallization Inside a Slug Flow Crystallizer, Micromachines 13 (2022) 1795. [CrossRef]
- M. Termühlen, B. Strakeljahn, G. Schembecker, K. Wohlgemuth, Quantification and evaluation of operating parameters’ effect on suspension behavior for slug flow crystallization, Chemical Engineering Science 243 (2021) 116771. [CrossRef]
- M. Termühlen, B. Strakeljahn, G. Schembecker, K. Wohlgemuth, Characterization of slug formation towards the performance of air-liquid segmented flow, Chemical Engineering Science 207 (2019) 1288–1298. [CrossRef]
- A.C. Kufner, N. Westkämper, H. Bettin, K. Wohlgemuth, Prediction of particle suspension state for various particle shapes used in slug flow crystallization, 2023.
- A. Eren, B. Szilagyi, J.L. Quon, C.D. Papageorgiou, Z.K. Nagy, Experimental Investigation of an Integrated Crystallization and Wet-Milling System with Temperature Cycling to Control the Size and Aspect Ratio of Needle-Shaped Pharmaceutical Crystals, Crystal Growth & Design 21 (2021) 3981–3993. [CrossRef]
Figure 1.
Design of the T-mixer with 180° inlets as continuous nucleator: (left) Illustration of a cross-section created by the CAD software Fusion 360 with ID dimensions. (right) Photo of the 3D printed T-mixer.
Figure 1.
Design of the T-mixer with 180° inlets as continuous nucleator: (left) Illustration of a cross-section created by the CAD software Fusion 360 with ID dimensions. (right) Photo of the 3D printed T-mixer.
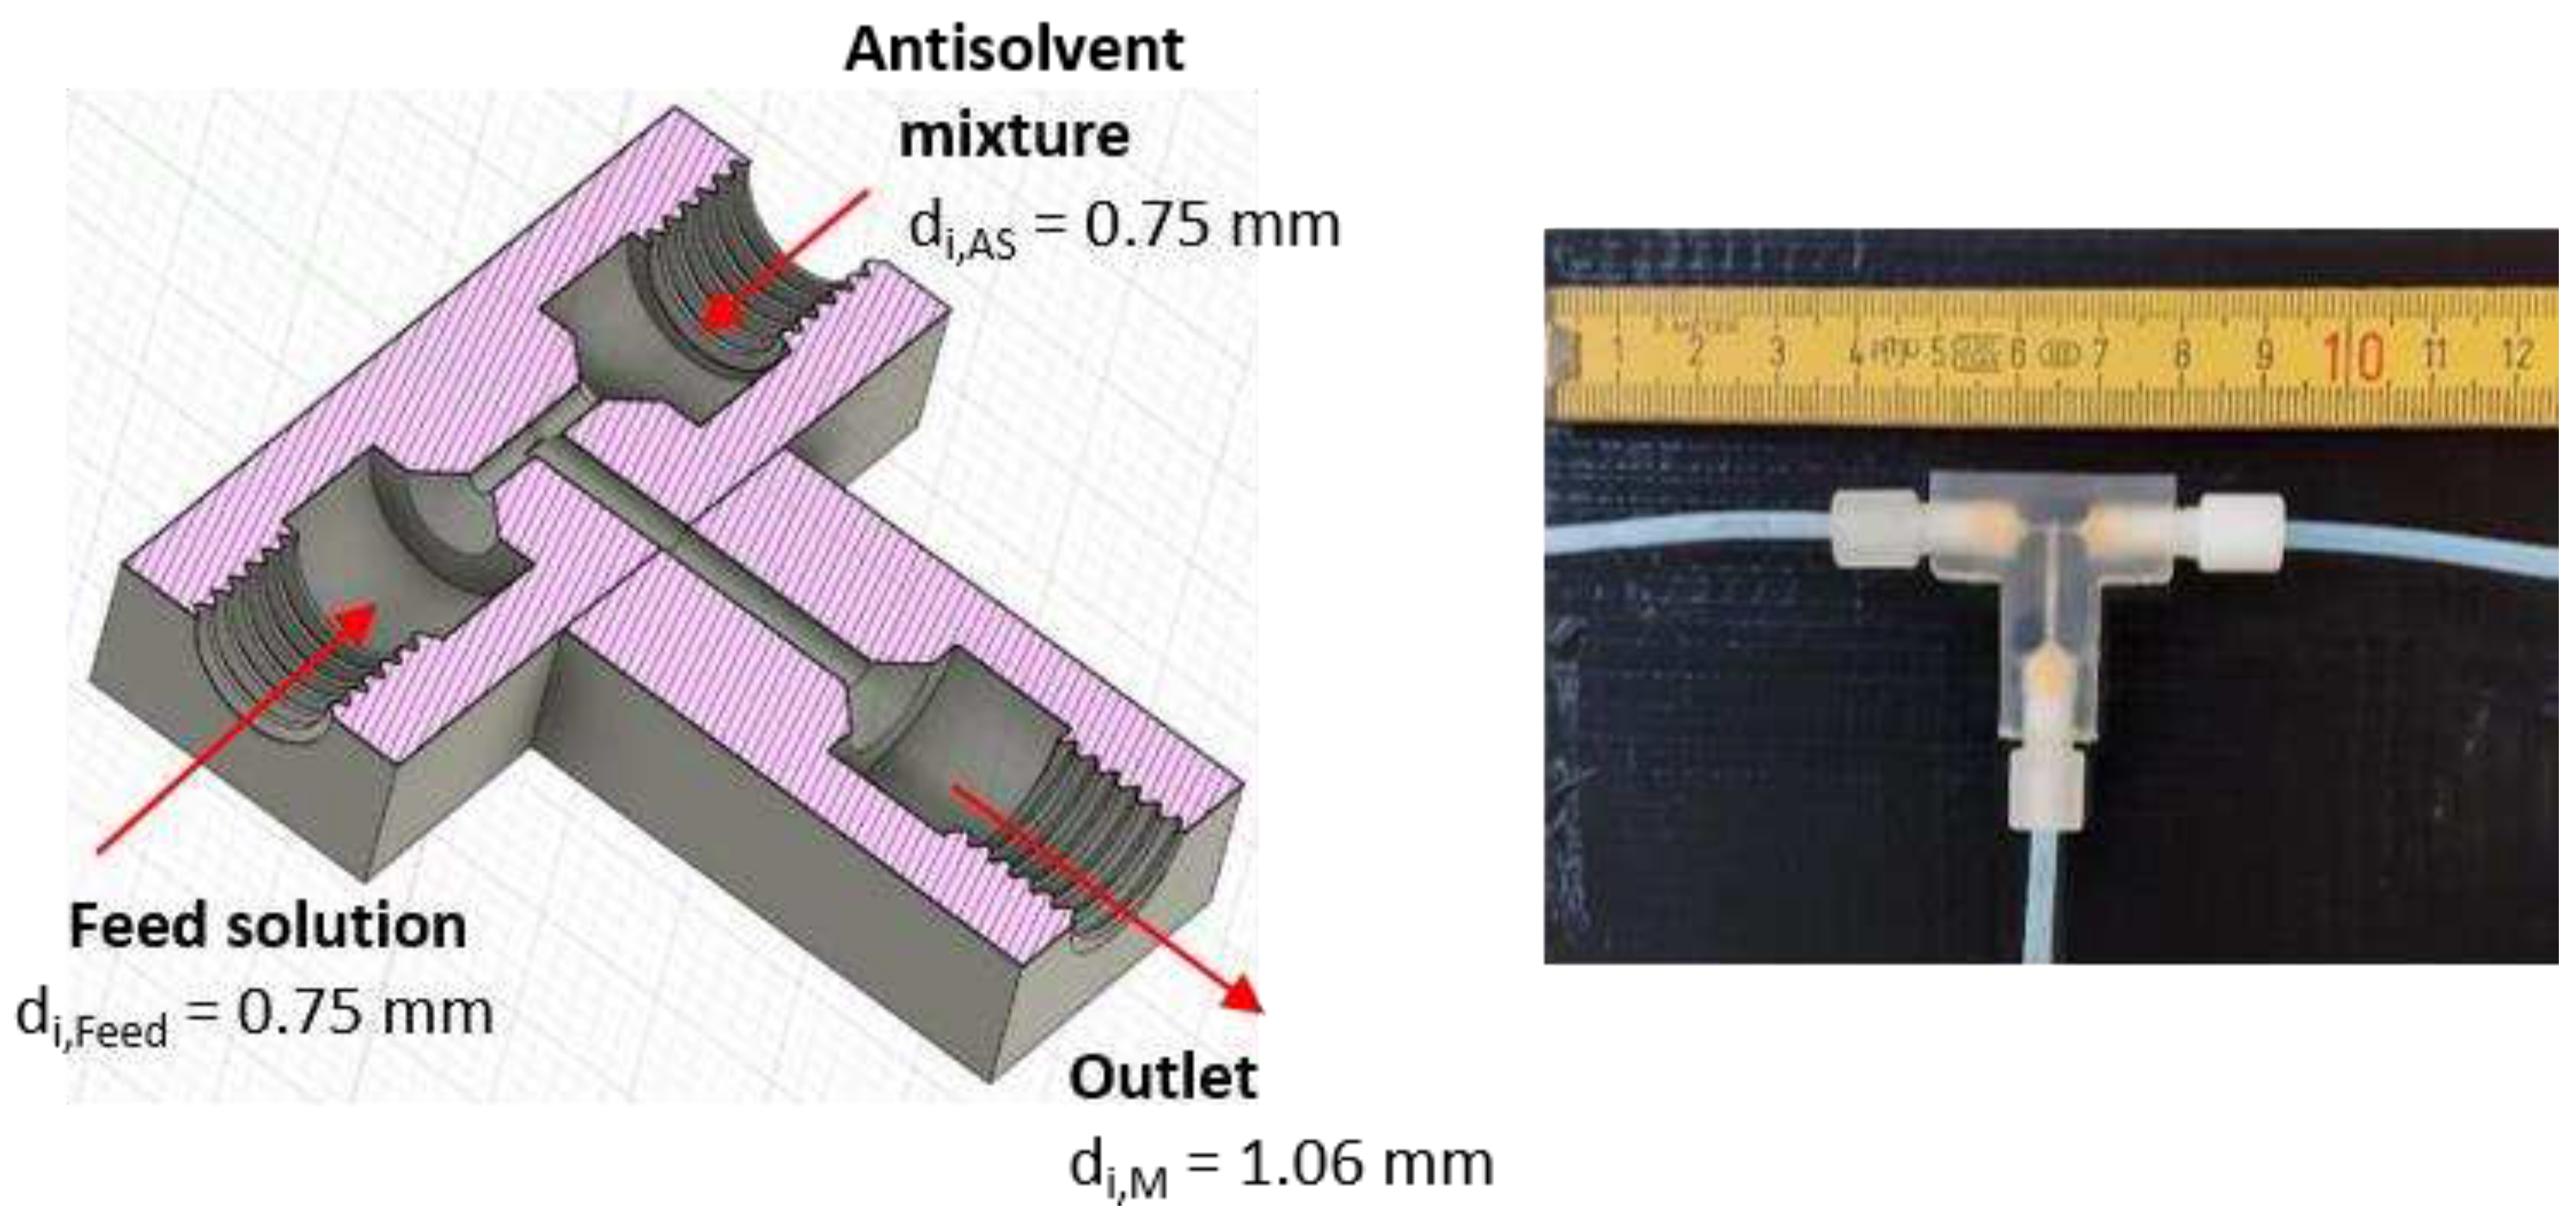
Figure 2.
Ternary solubility diagrams of l-alanine/water/ethanol at 20 °C and 1 bar. The solid blue line represents the solubility curve based on the experimental data from An et al. [39]. The solid green line describes the underlying conode for nucleation, respectively, crystallization process until thermodynamic equilibrium is reached. Additionally, the orange dot () indicates the composition of the liquid phase in the equilibrium state. Furthermore, the dashed red line connects the feed solution (F, blue triangle) and antisolvent mixture (AS, red triangle, ) to be mixed and the intersection between the dashed red line and the green line defines the mixing point (MP, black dot). (a) shows the calculation of the ratio of the feed and antisolvent mass flow rate based on the location of the MP on the conode by applying the lever rule (eq. (7) - (9)). (b) displays the calculation of based on the location of the MP on the conode by using the lever rule (eq. (10)). Different operating points for the T-mixer with 180° inlets based on graphical construction are shown in Table S1.
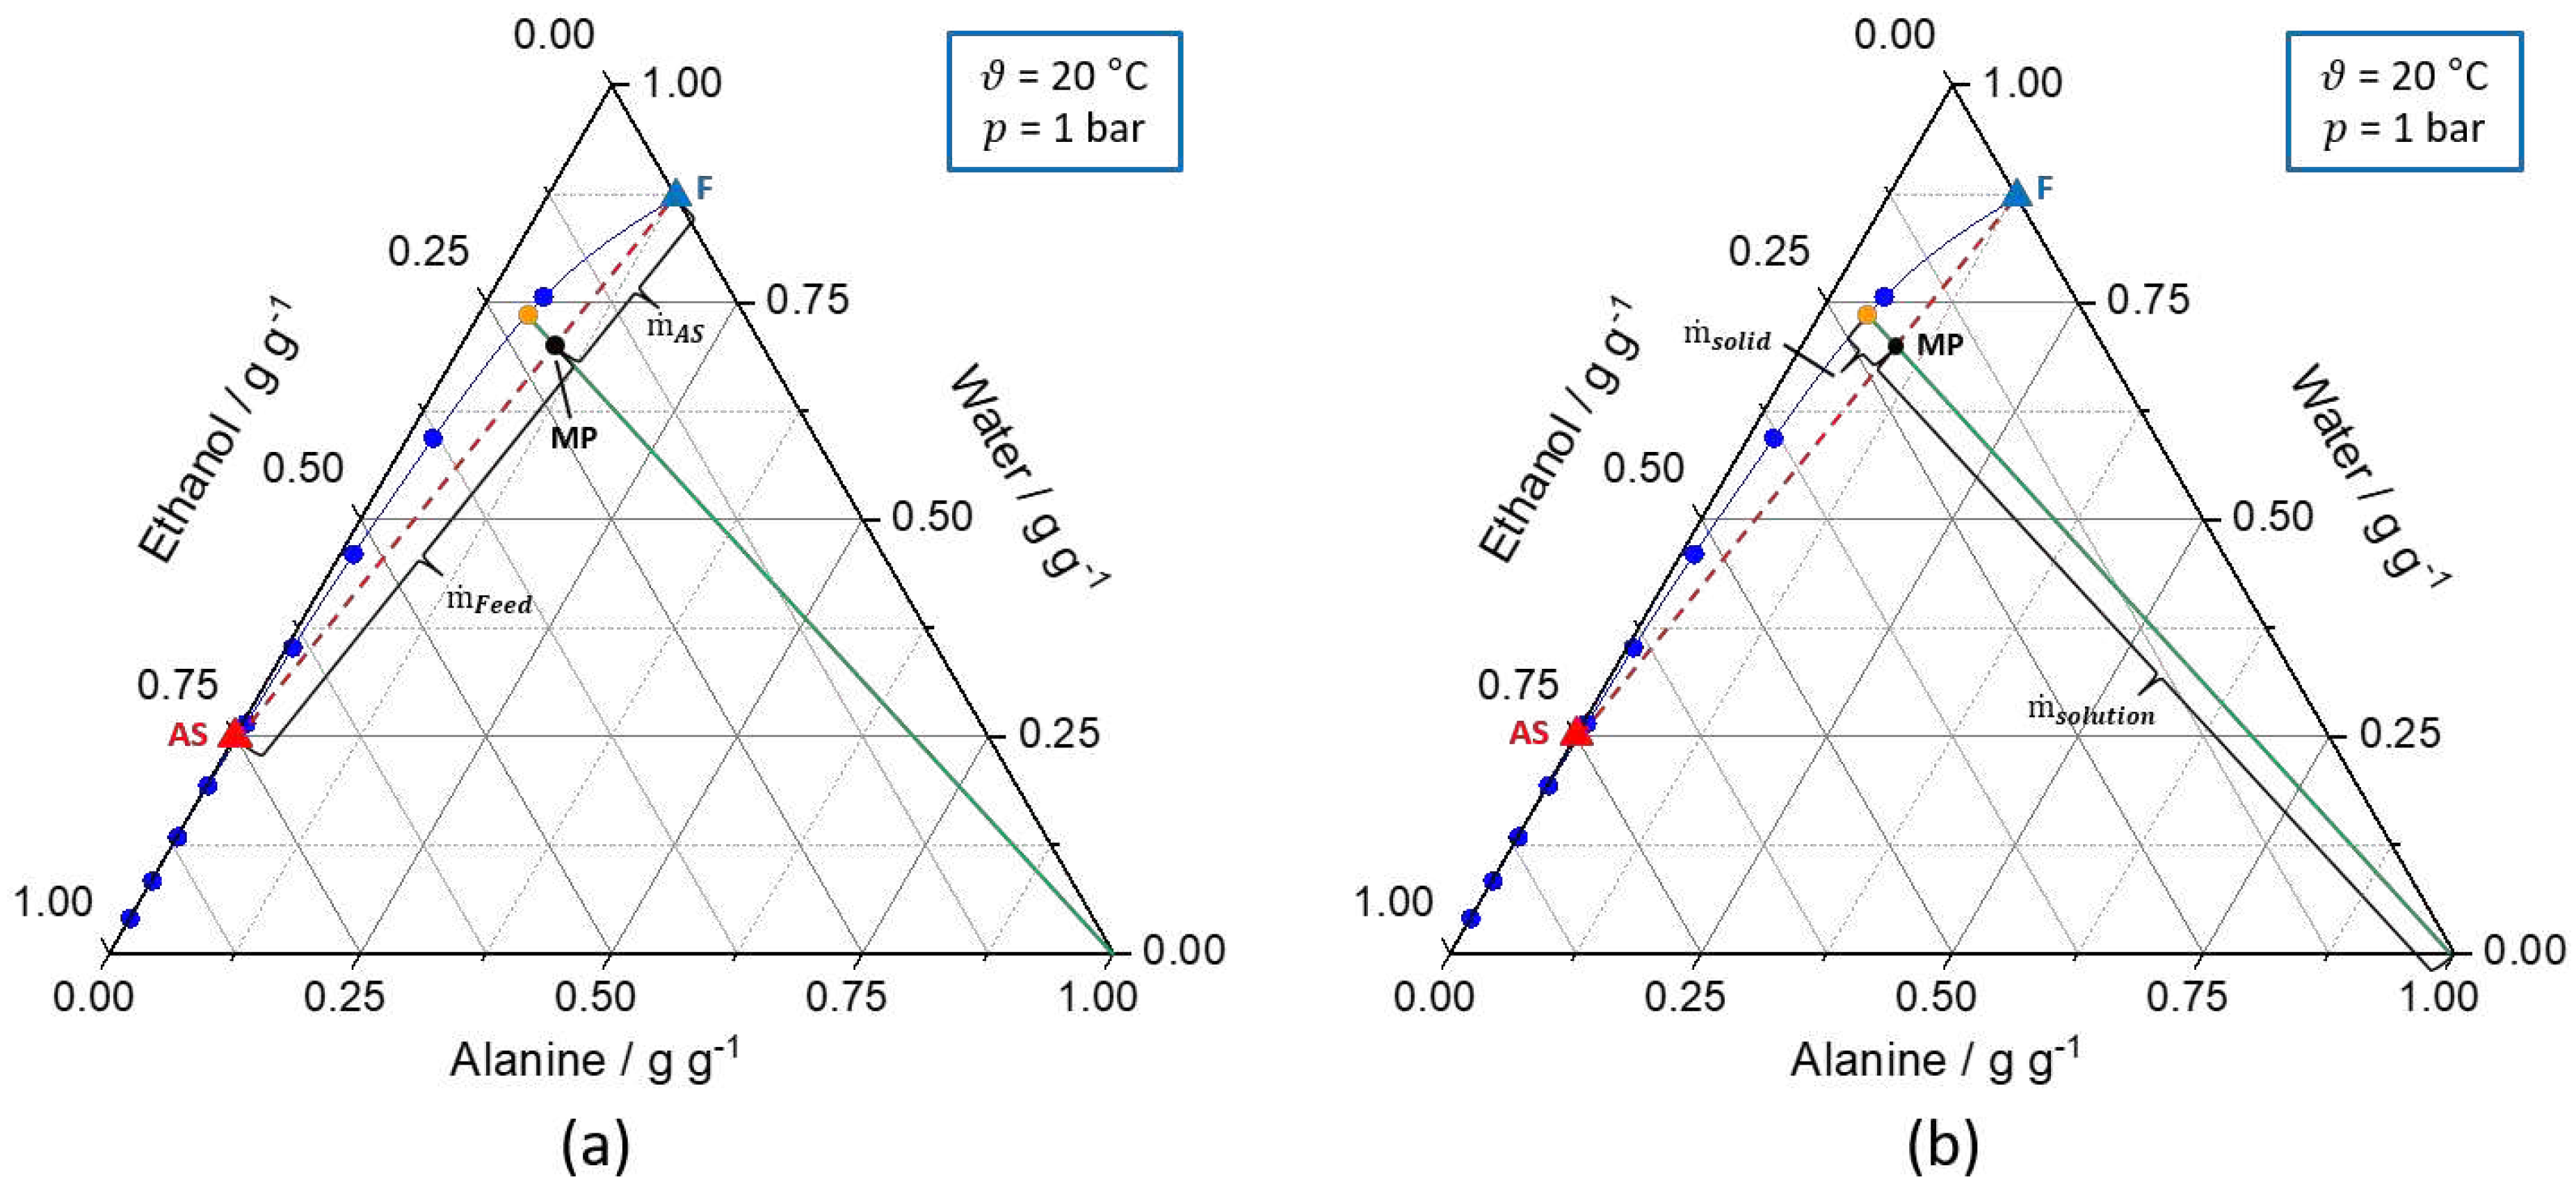
Figure 3.
Schematic experimental setup for the characterization of the T-mixer with 180° inlet configuration as continuous nucleator. (a) Experimental setup for the analysis of generated nuclei after a short RT of 6 s provided by the periphery. (b) Extended setup by a batch vessel, enabling the adjustment of specific RTs (5 min, 10 min, and 15 min).
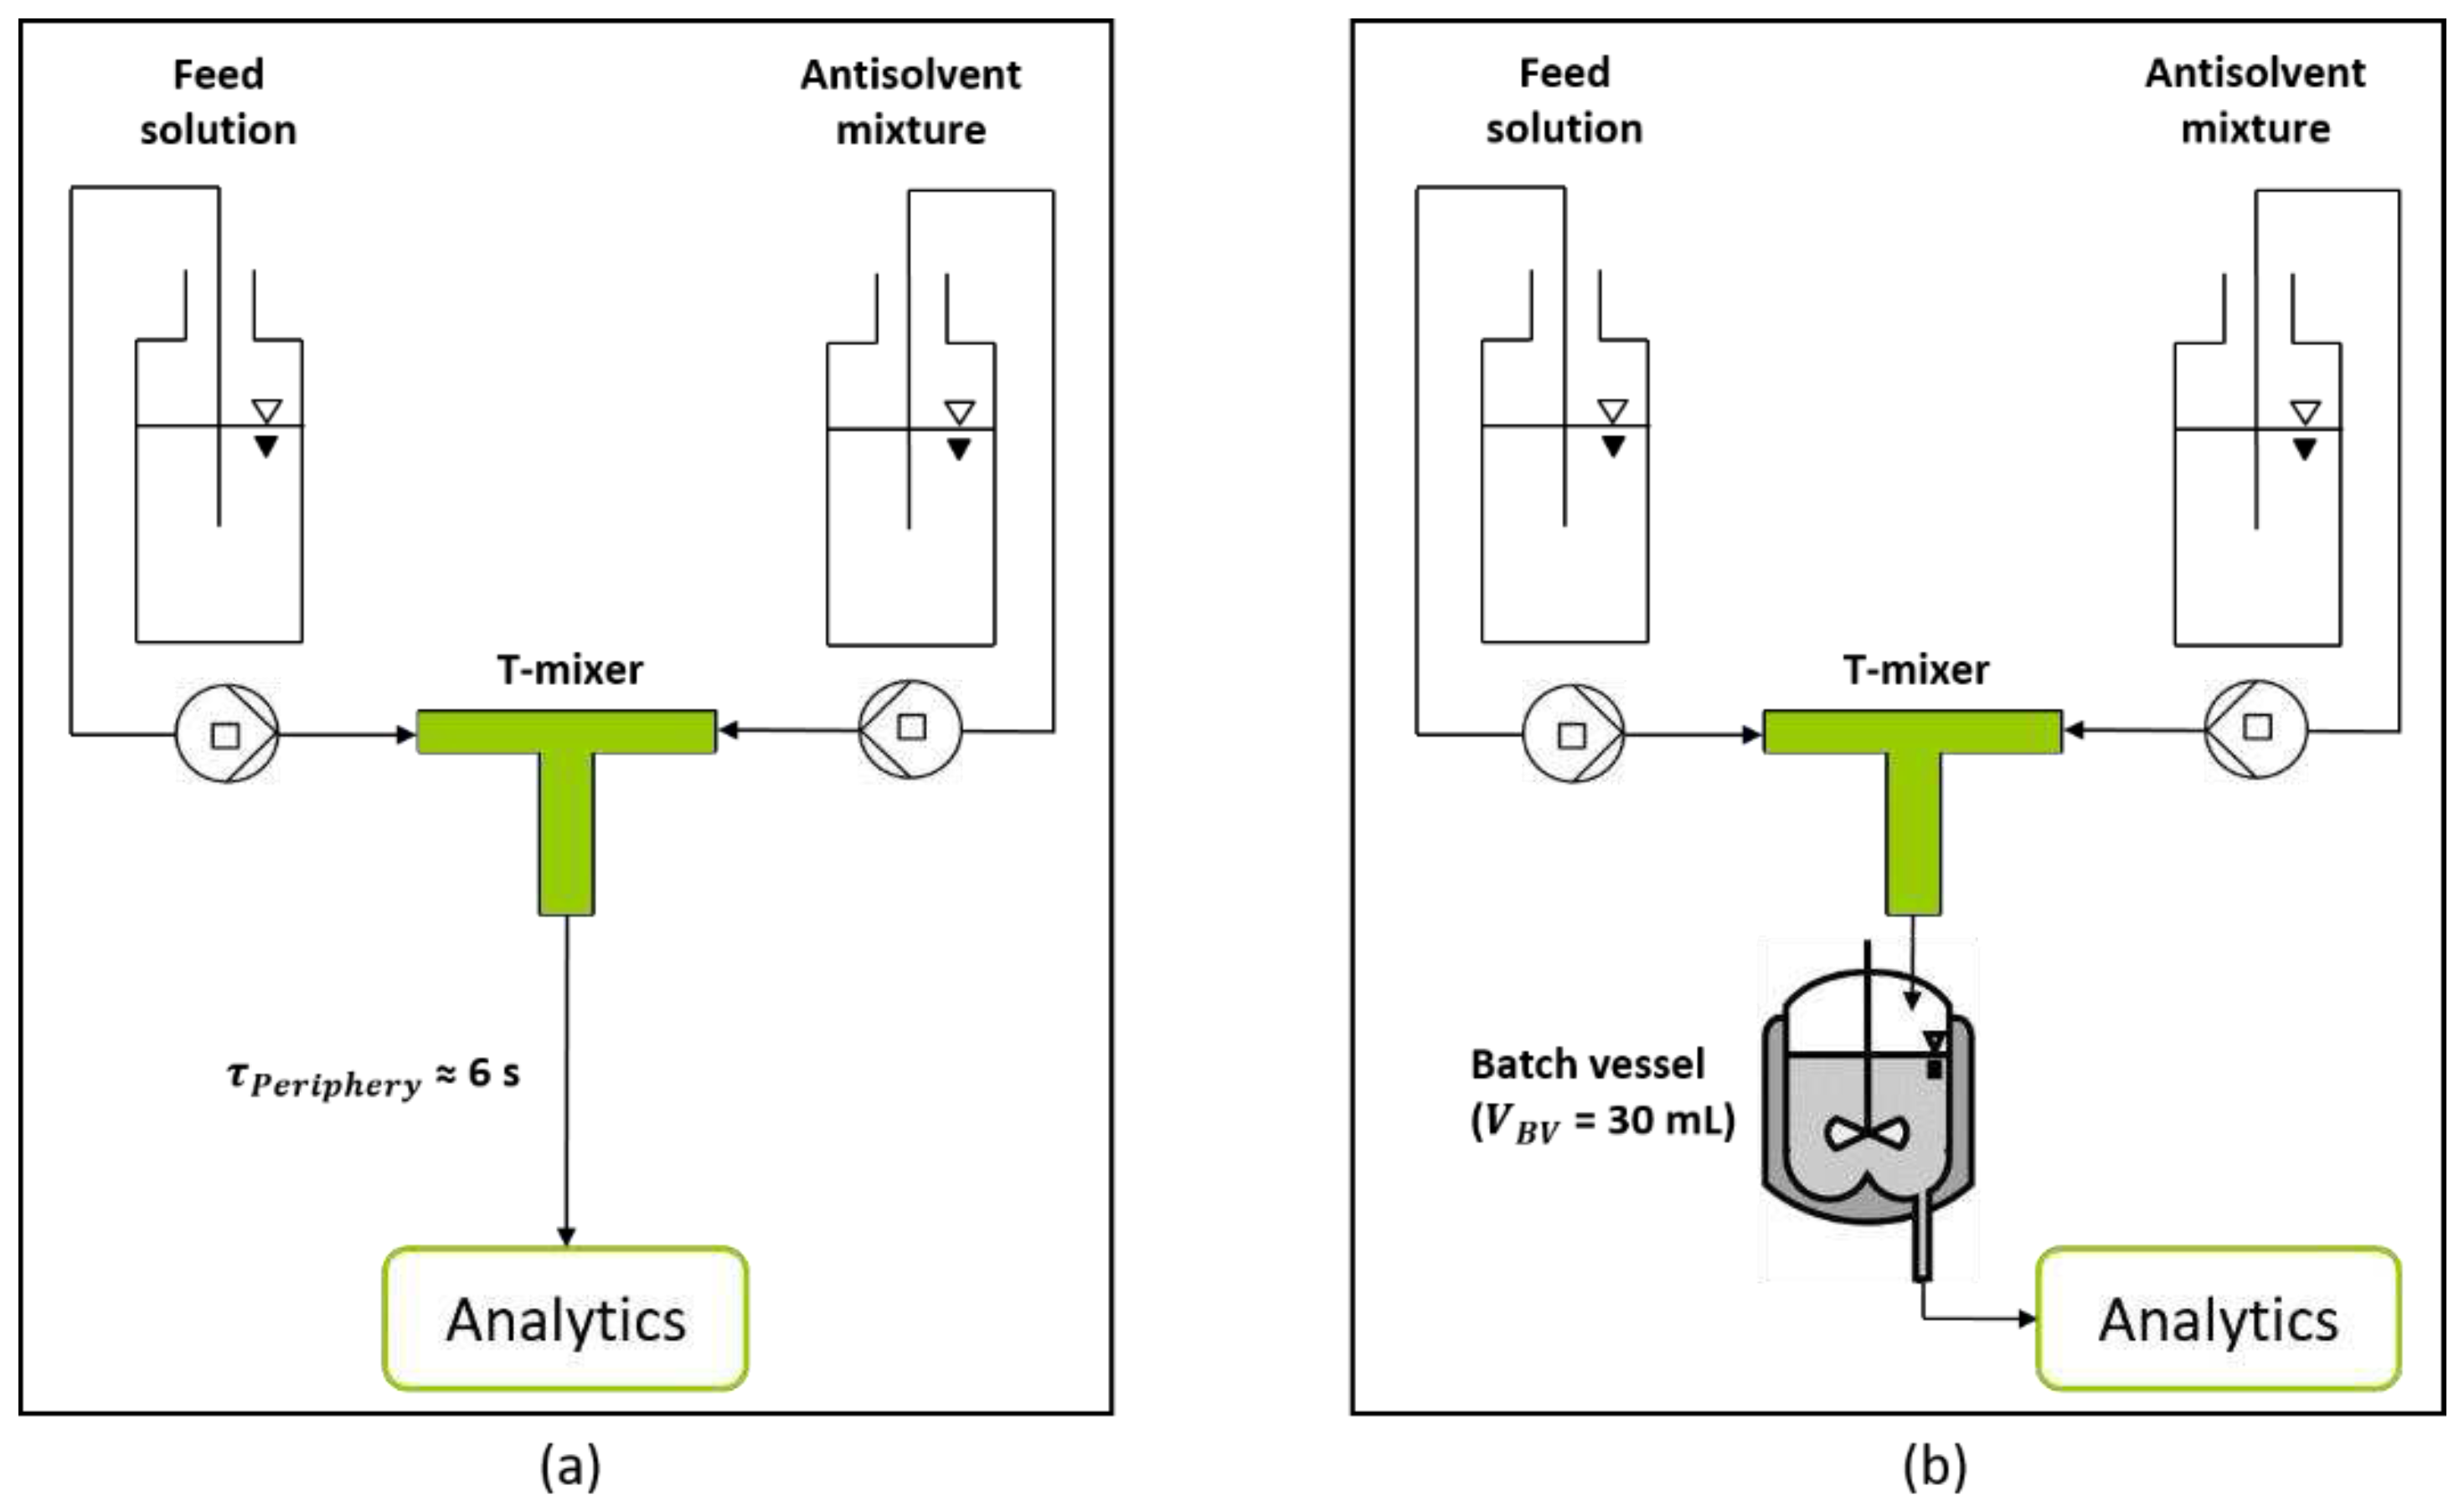
Figure 4.
(a) displays a screenshot from the in-line DIA. Additionally, light microscopic images of the same sample after a RT of approximately 6 s provided by the periphery taken 20 s (b) and 60 s (c) after sampling are shown.
Figure 4.
(a) displays a screenshot from the in-line DIA. Additionally, light microscopic images of the same sample after a RT of approximately 6 s provided by the periphery taken 20 s (b) and 60 s (c) after sampling are shown.
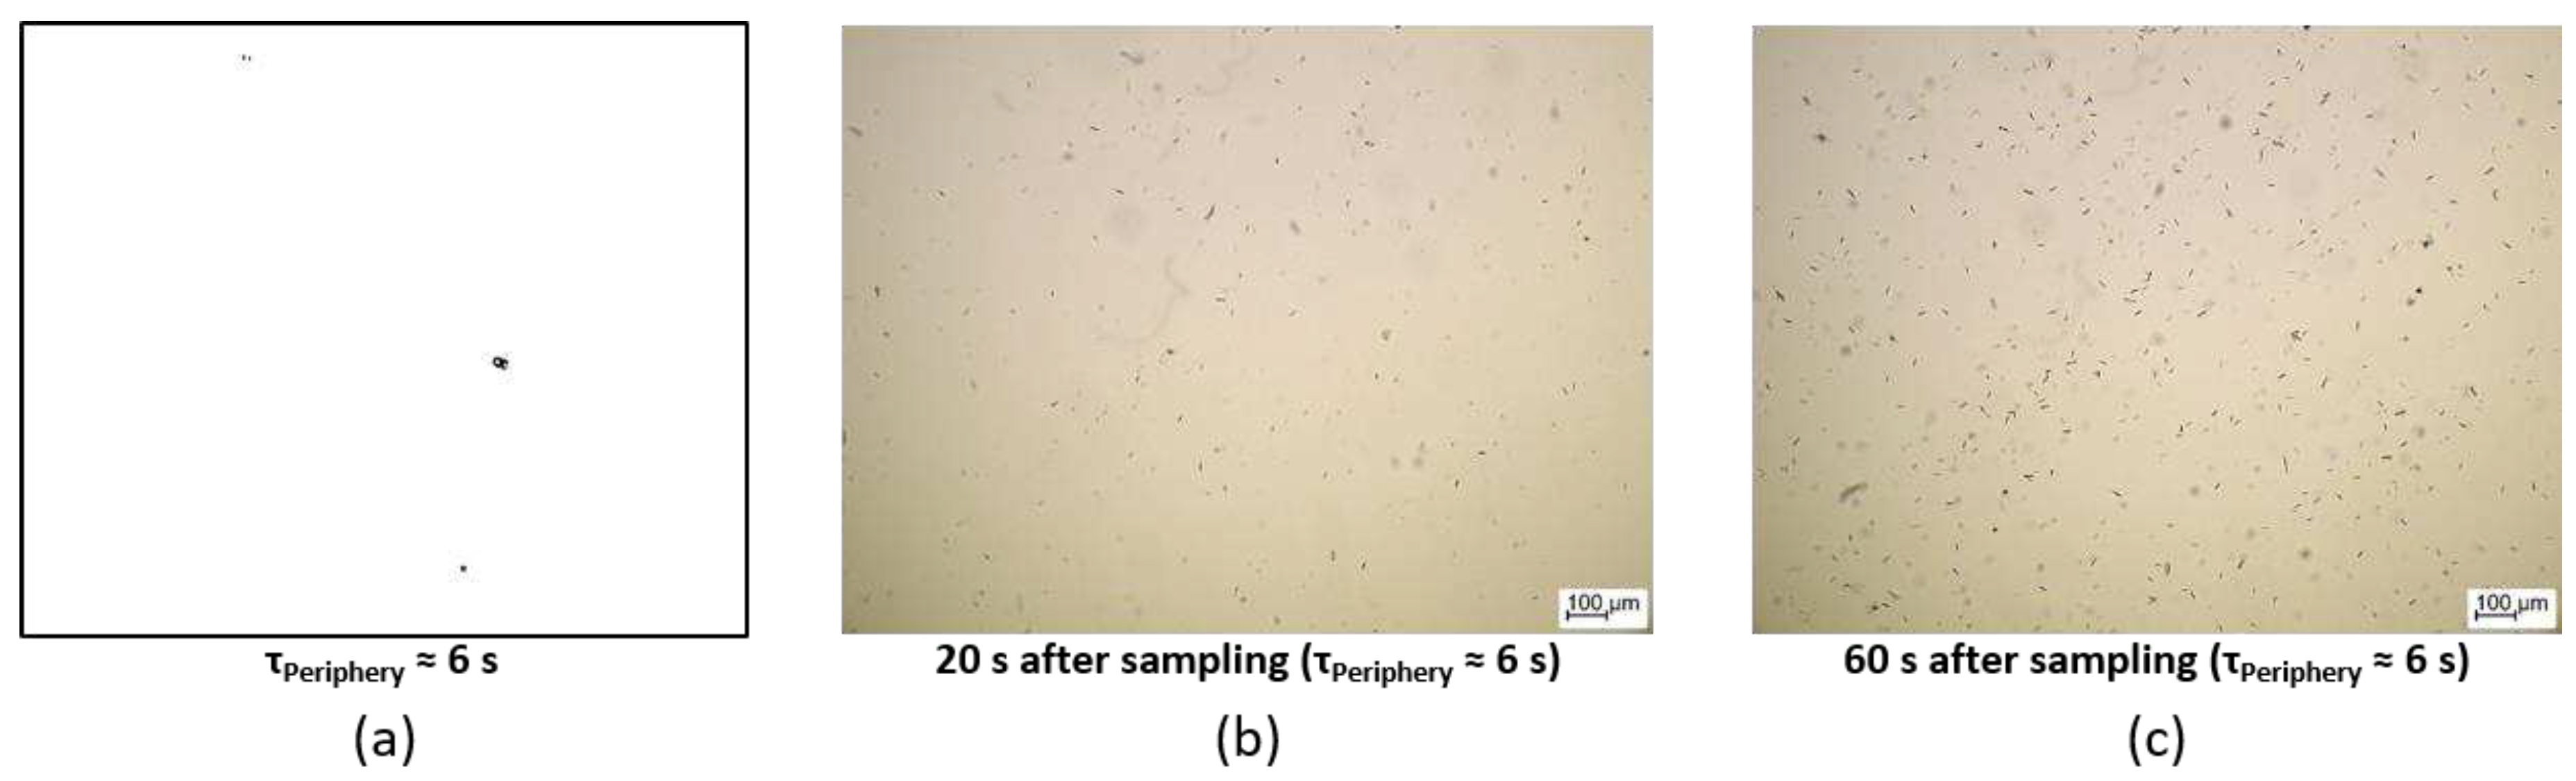
Figure 5.
Light microscopic images of the same sample after a RT of 15 min in the batch vessel 20 s (a) and 60 s (b) after sampling. (c) ALD of anisotropic particles after 15 min inside the batch vessel. The data points are plotted as a function of MIL, MAL, AR, and measurement probability. The red star indicates the centroid of the data points and, thus, the most probable projection area to be measured, characterized by MILch, MALch, and AR.
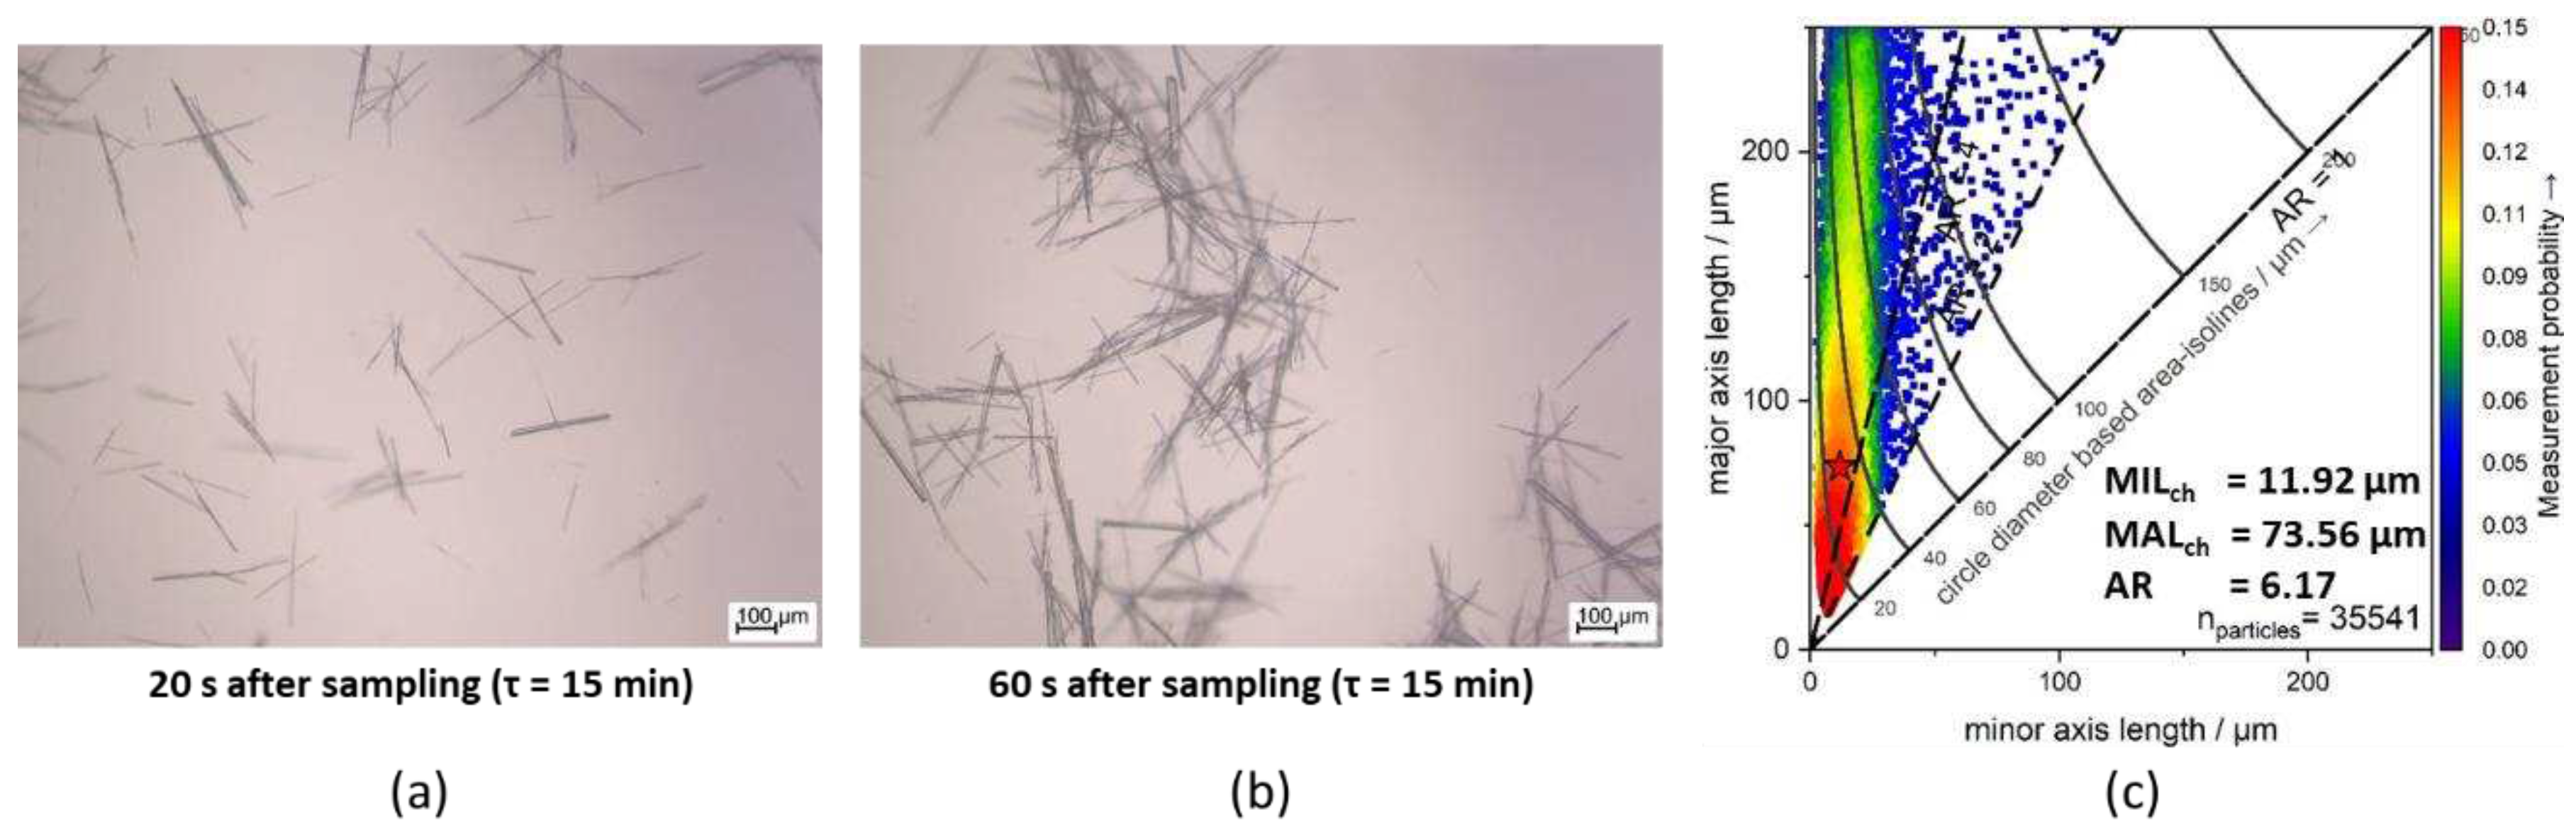
Figure 8.
Microscopic images and the respective PSD for the characterization experiments for the T-mixer with 90° inlets in blue after a RT of approximately 10 s (in-line) and in orange after RT of 15 min (at-line). The PSD measurements were conducted twice.
Figure 8.
Microscopic images and the respective PSD for the characterization experiments for the T-mixer with 90° inlets in blue after a RT of approximately 10 s (in-line) and in orange after RT of 15 min (at-line). The PSD measurements were conducted twice.
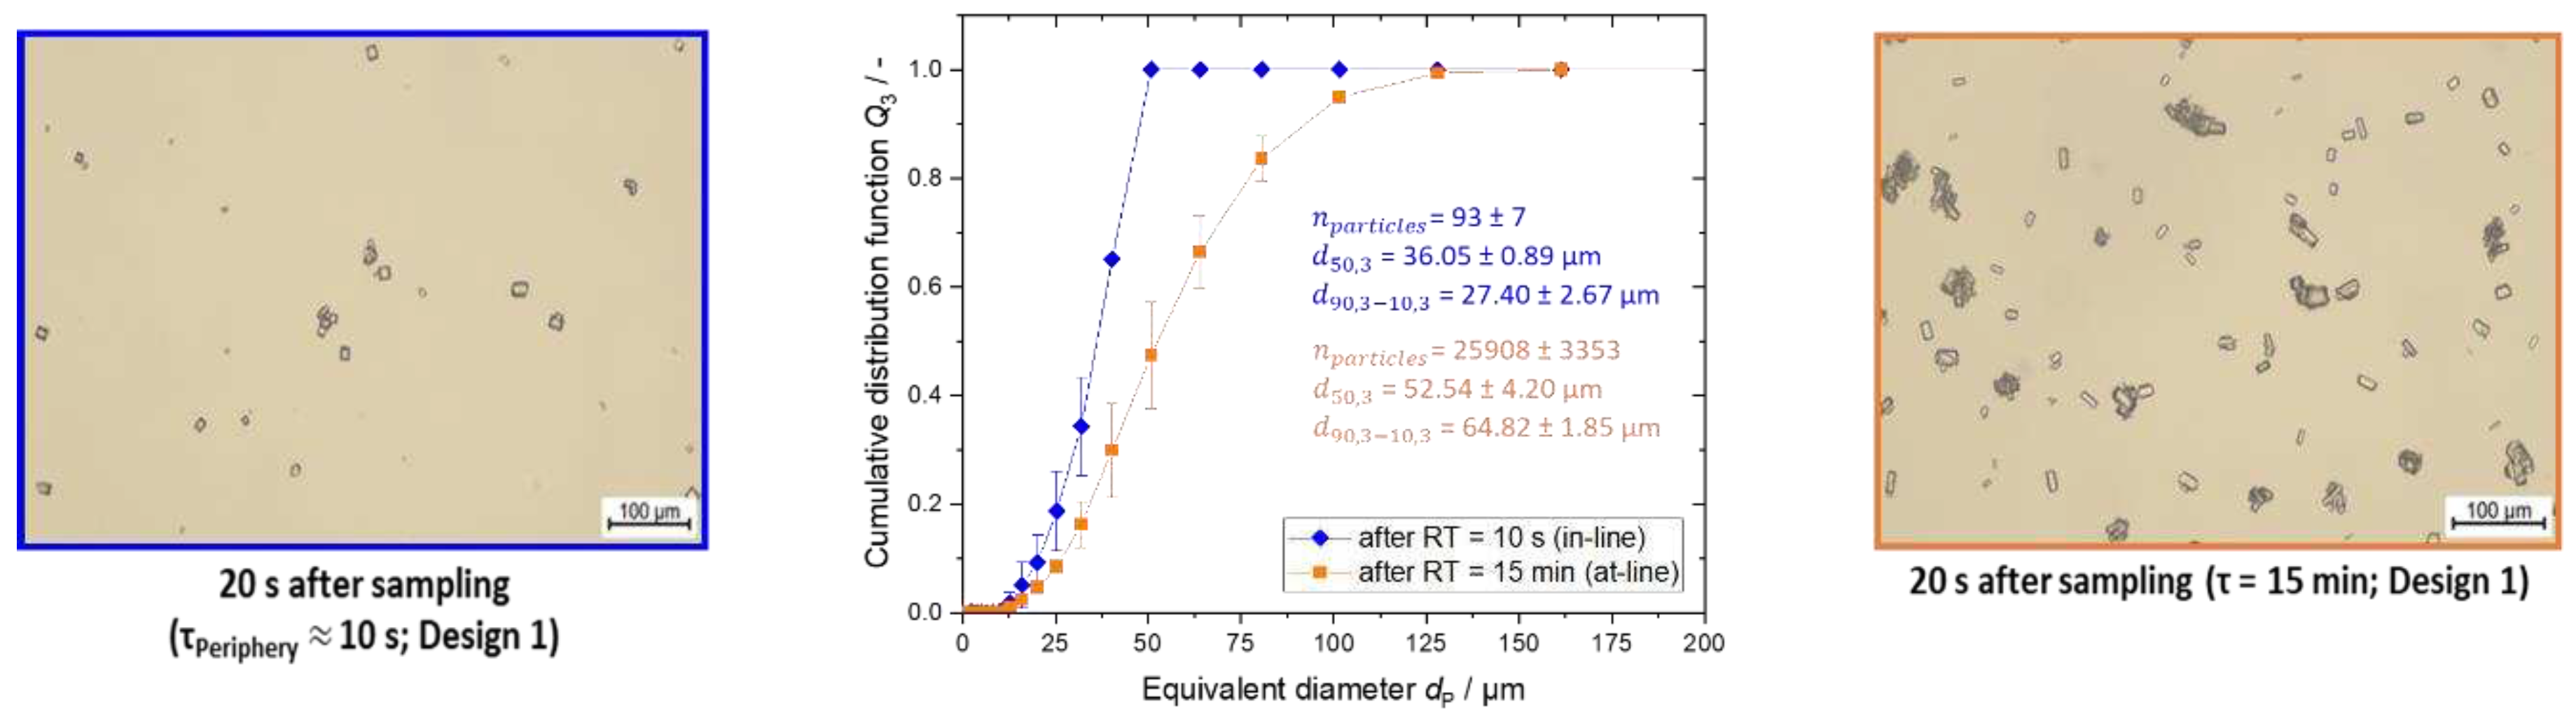
Figure 9.
Schematic experimental setup of the nucleator coupled with the SFC.
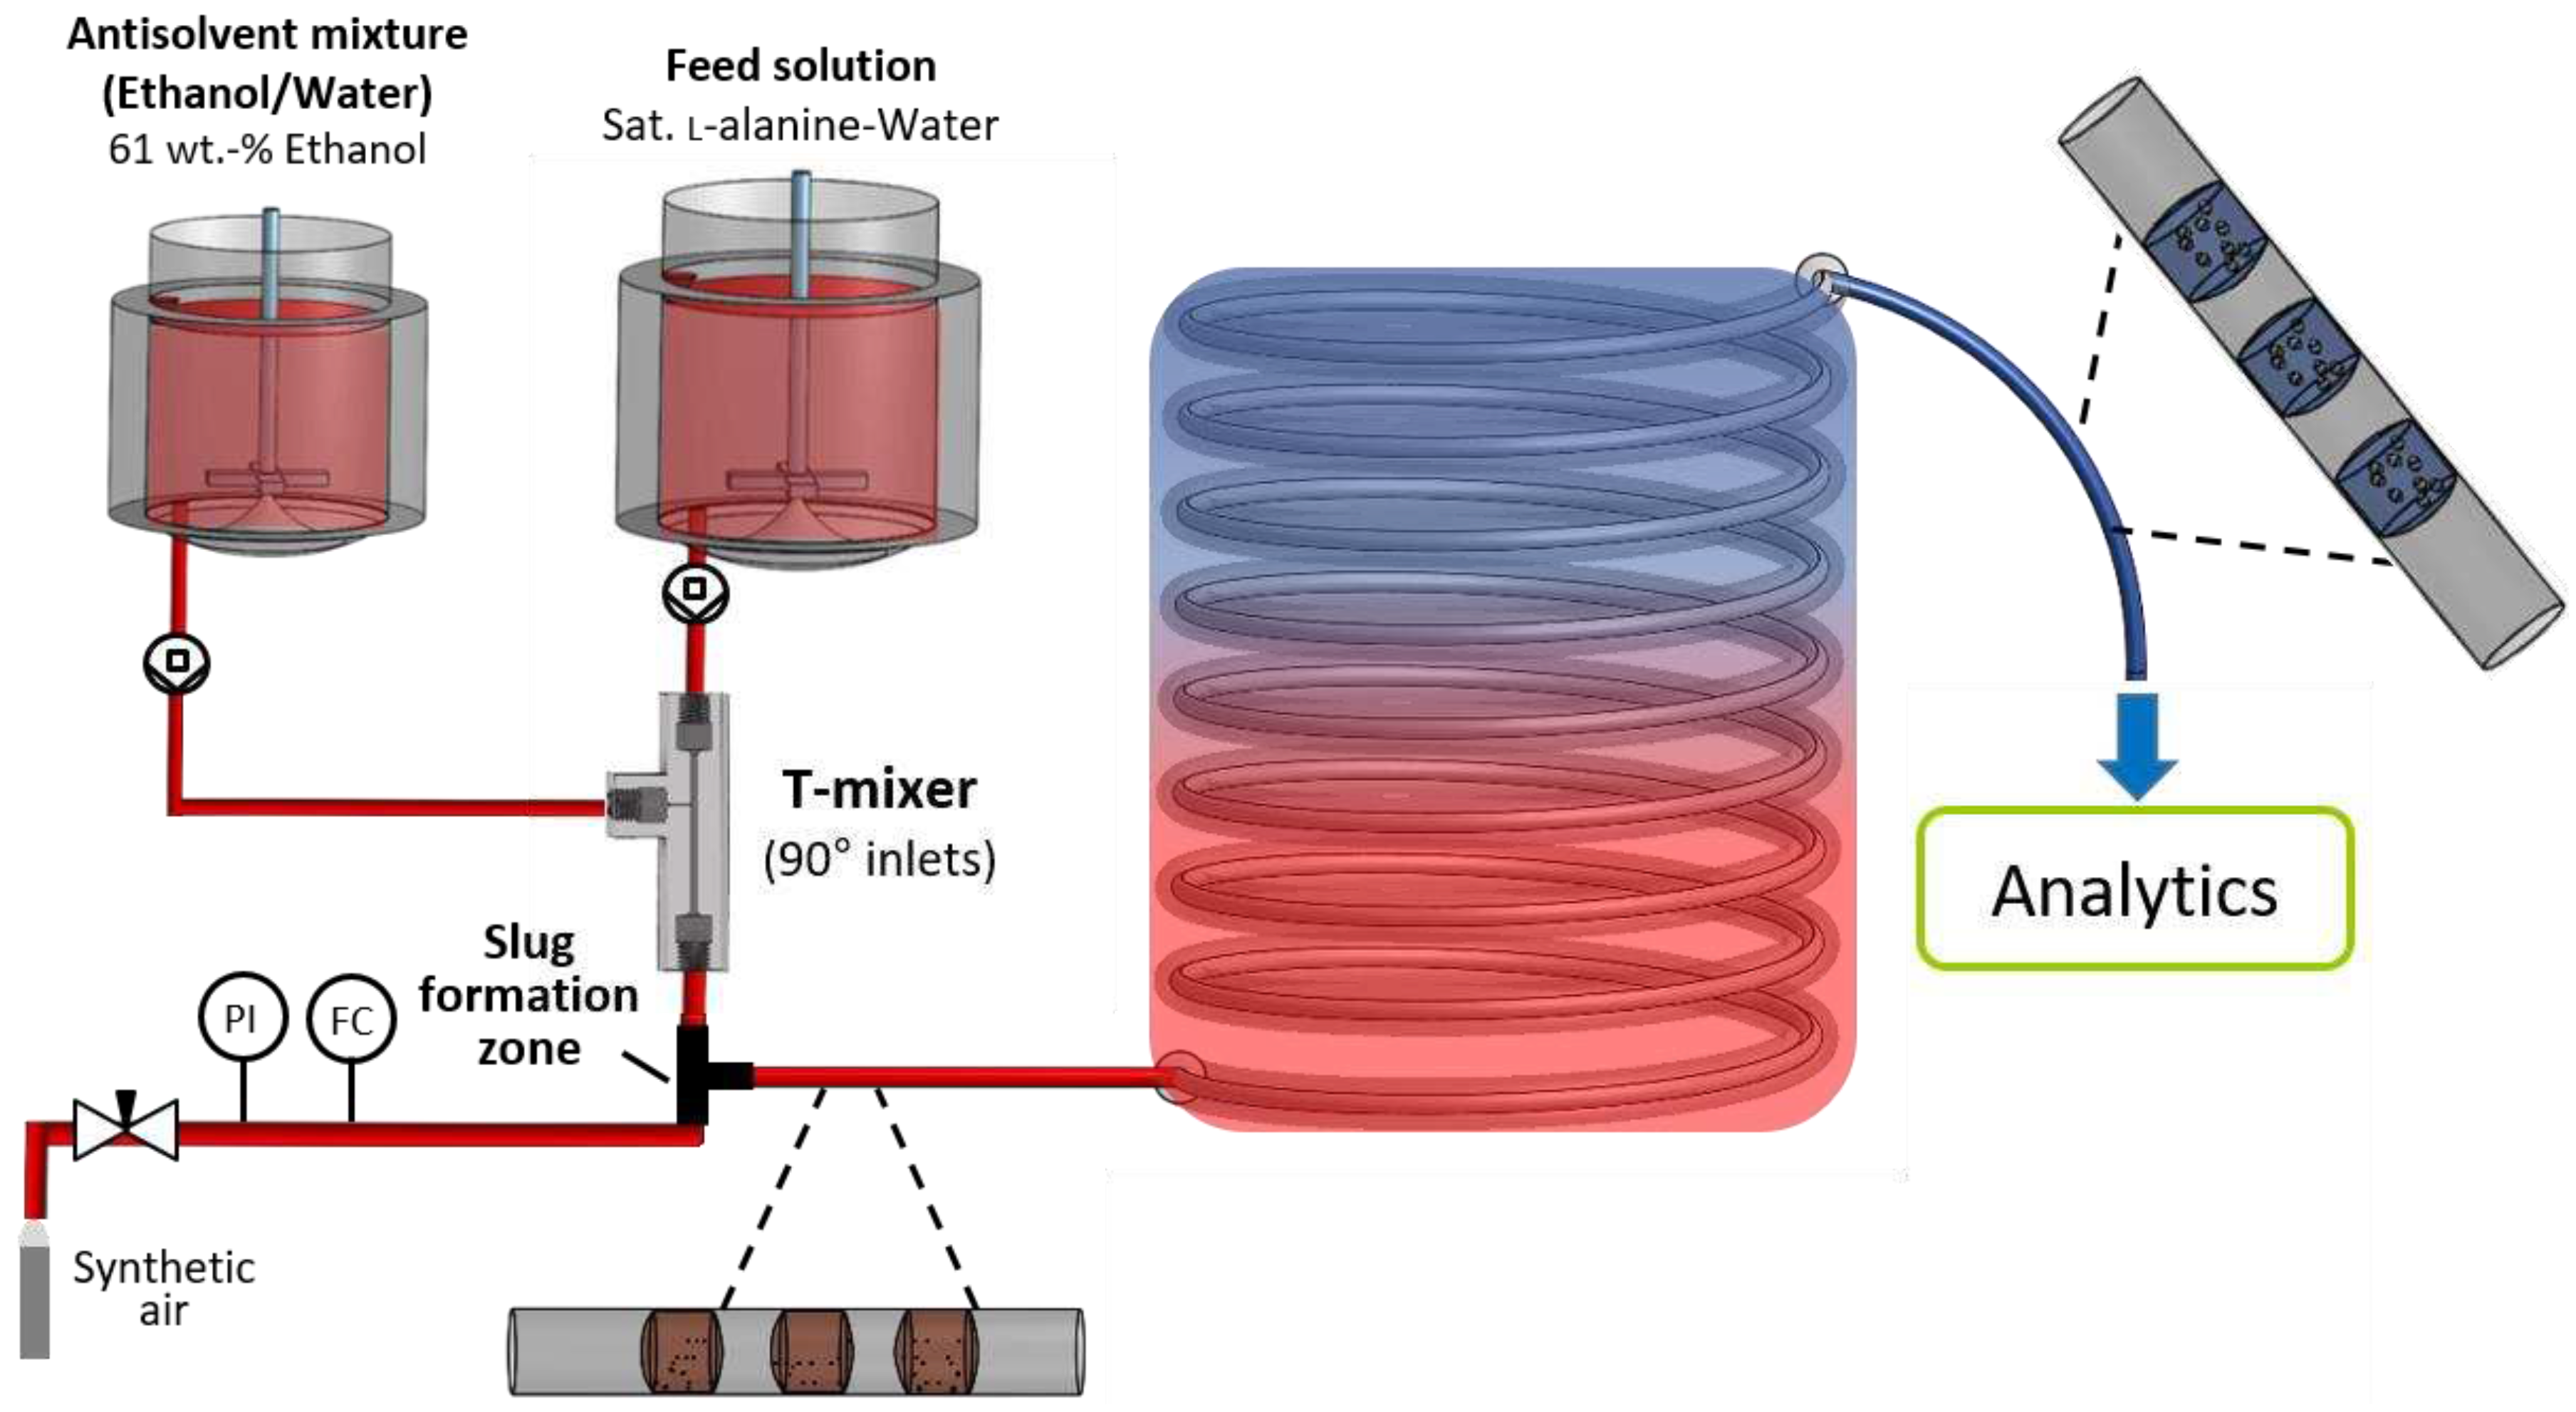
Figure 10.
Microscopic images (top) and pictures of slug flow with suspended particles taken at the end of the SFC (bottom) for inhomogeneous (left, black, OP1) and homogeneous (right, green, OP2) suspension state during the crystallization process inside the SFC.
Figure 10.
Microscopic images (top) and pictures of slug flow with suspended particles taken at the end of the SFC (bottom) for inhomogeneous (left, black, OP1) and homogeneous (right, green, OP2) suspension state during the crystallization process inside the SFC.
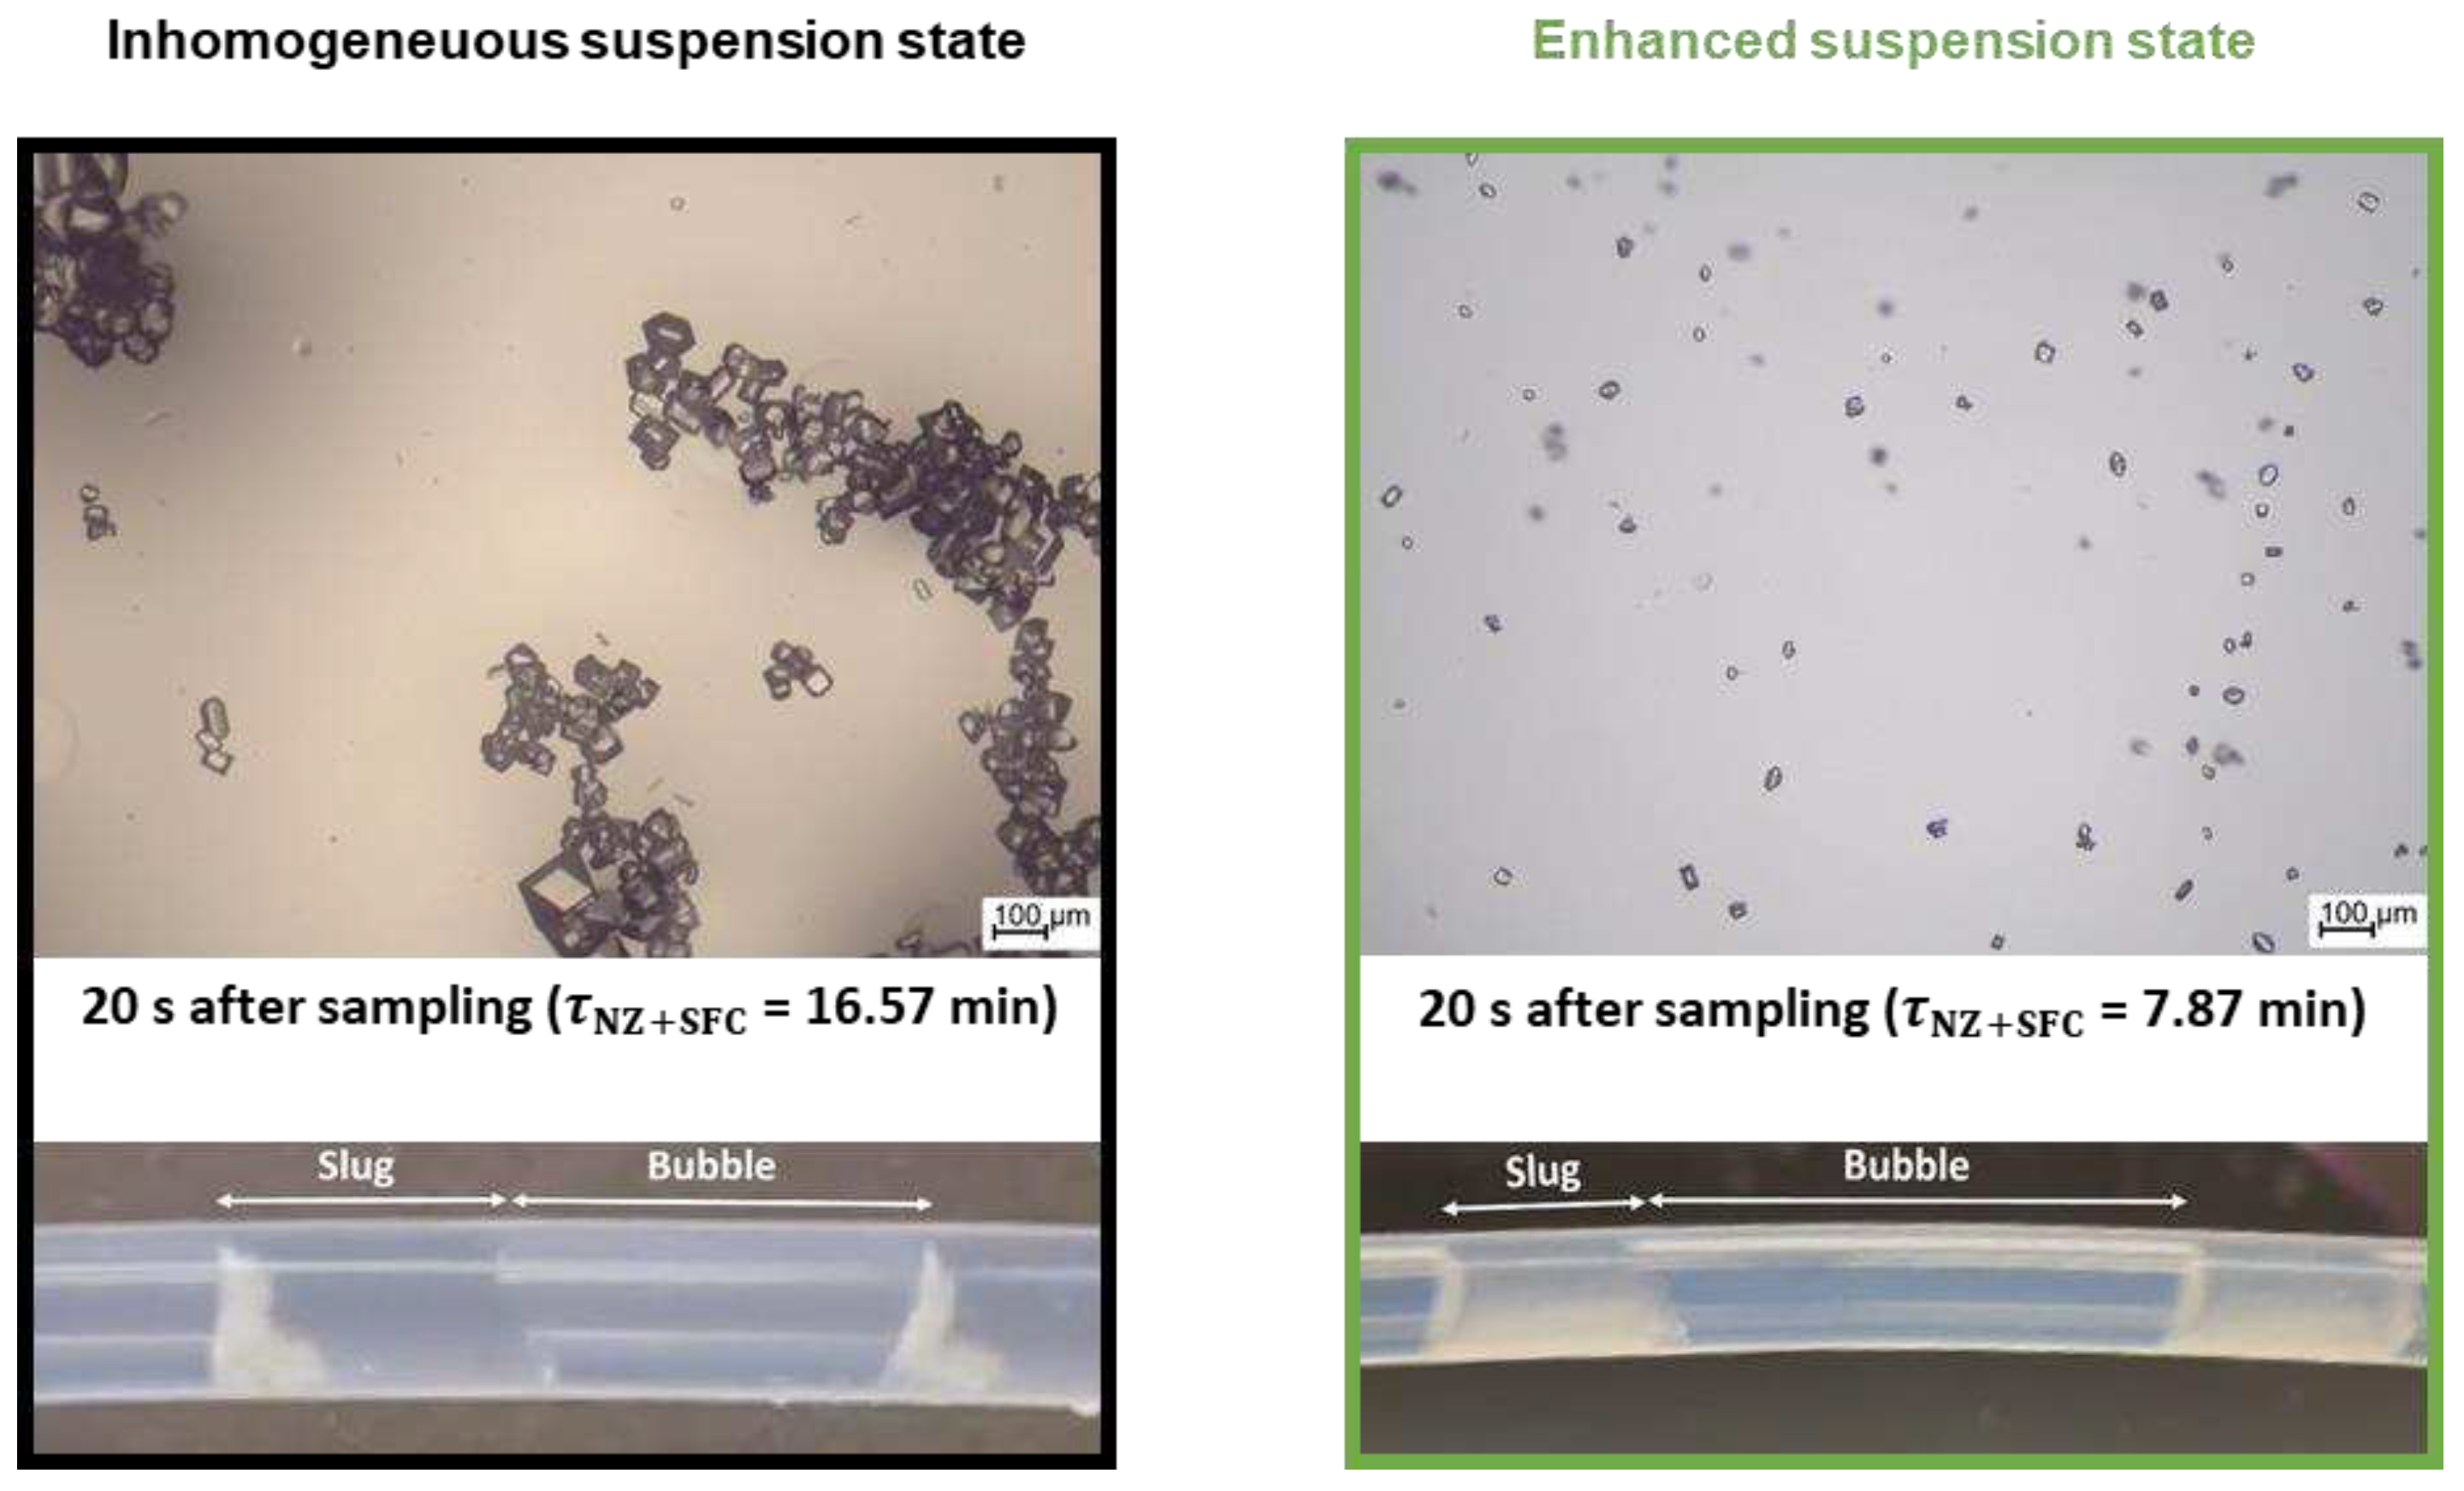
Figure 11.
Microscopic image (top) and picture of slug flow taken at the end of the SFC (bottom) at of 34.75 °C. Addition of l-glutamic acid for the operation with the process parameters of OP2 (Table 2).
Figure 11.
Microscopic image (top) and picture of slug flow taken at the end of the SFC (bottom) at of 34.75 °C. Addition of l-glutamic acid for the operation with the process parameters of OP2 (Table 2).
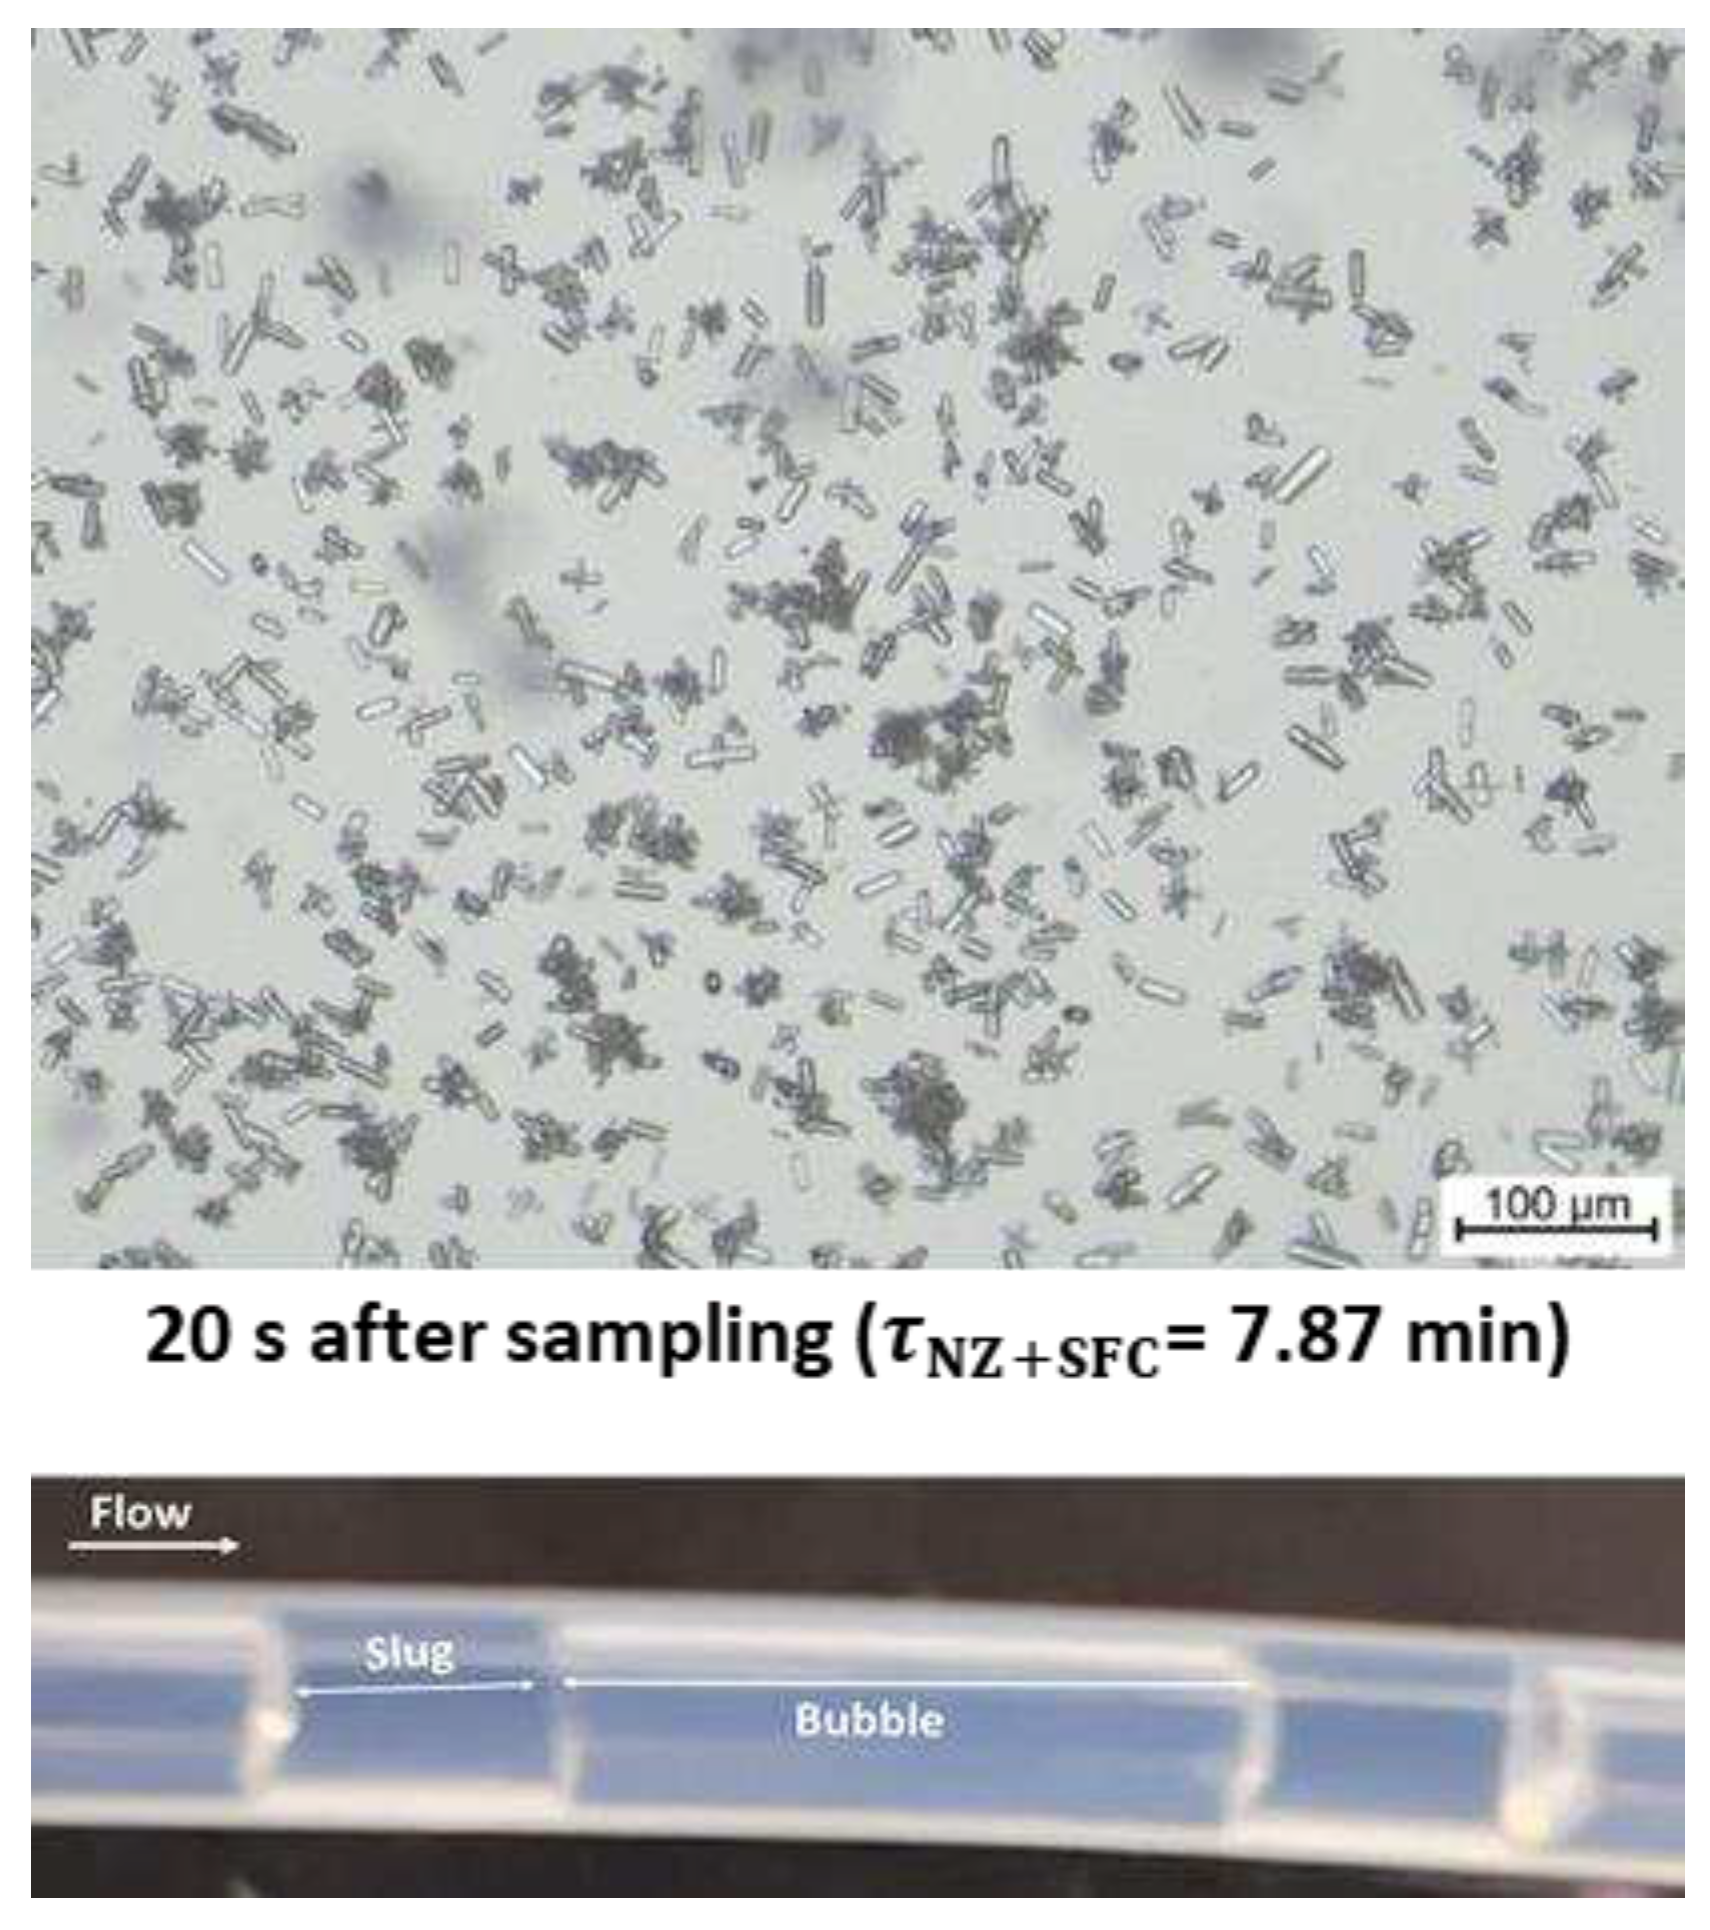
Figure 12.
Schematic experimental setup for end-to-end continuous small-scale manufacturing of free-flowing particles containing a continuous nucleator (T-mixer with 90° inlet configuration) in stage 1, continuous crystallization (SFC) in stage 2 and continuous particle isolation consisting of filtration and two-stage washing (CVSF) as well as a heater between SFC and CVSF in stage 3.
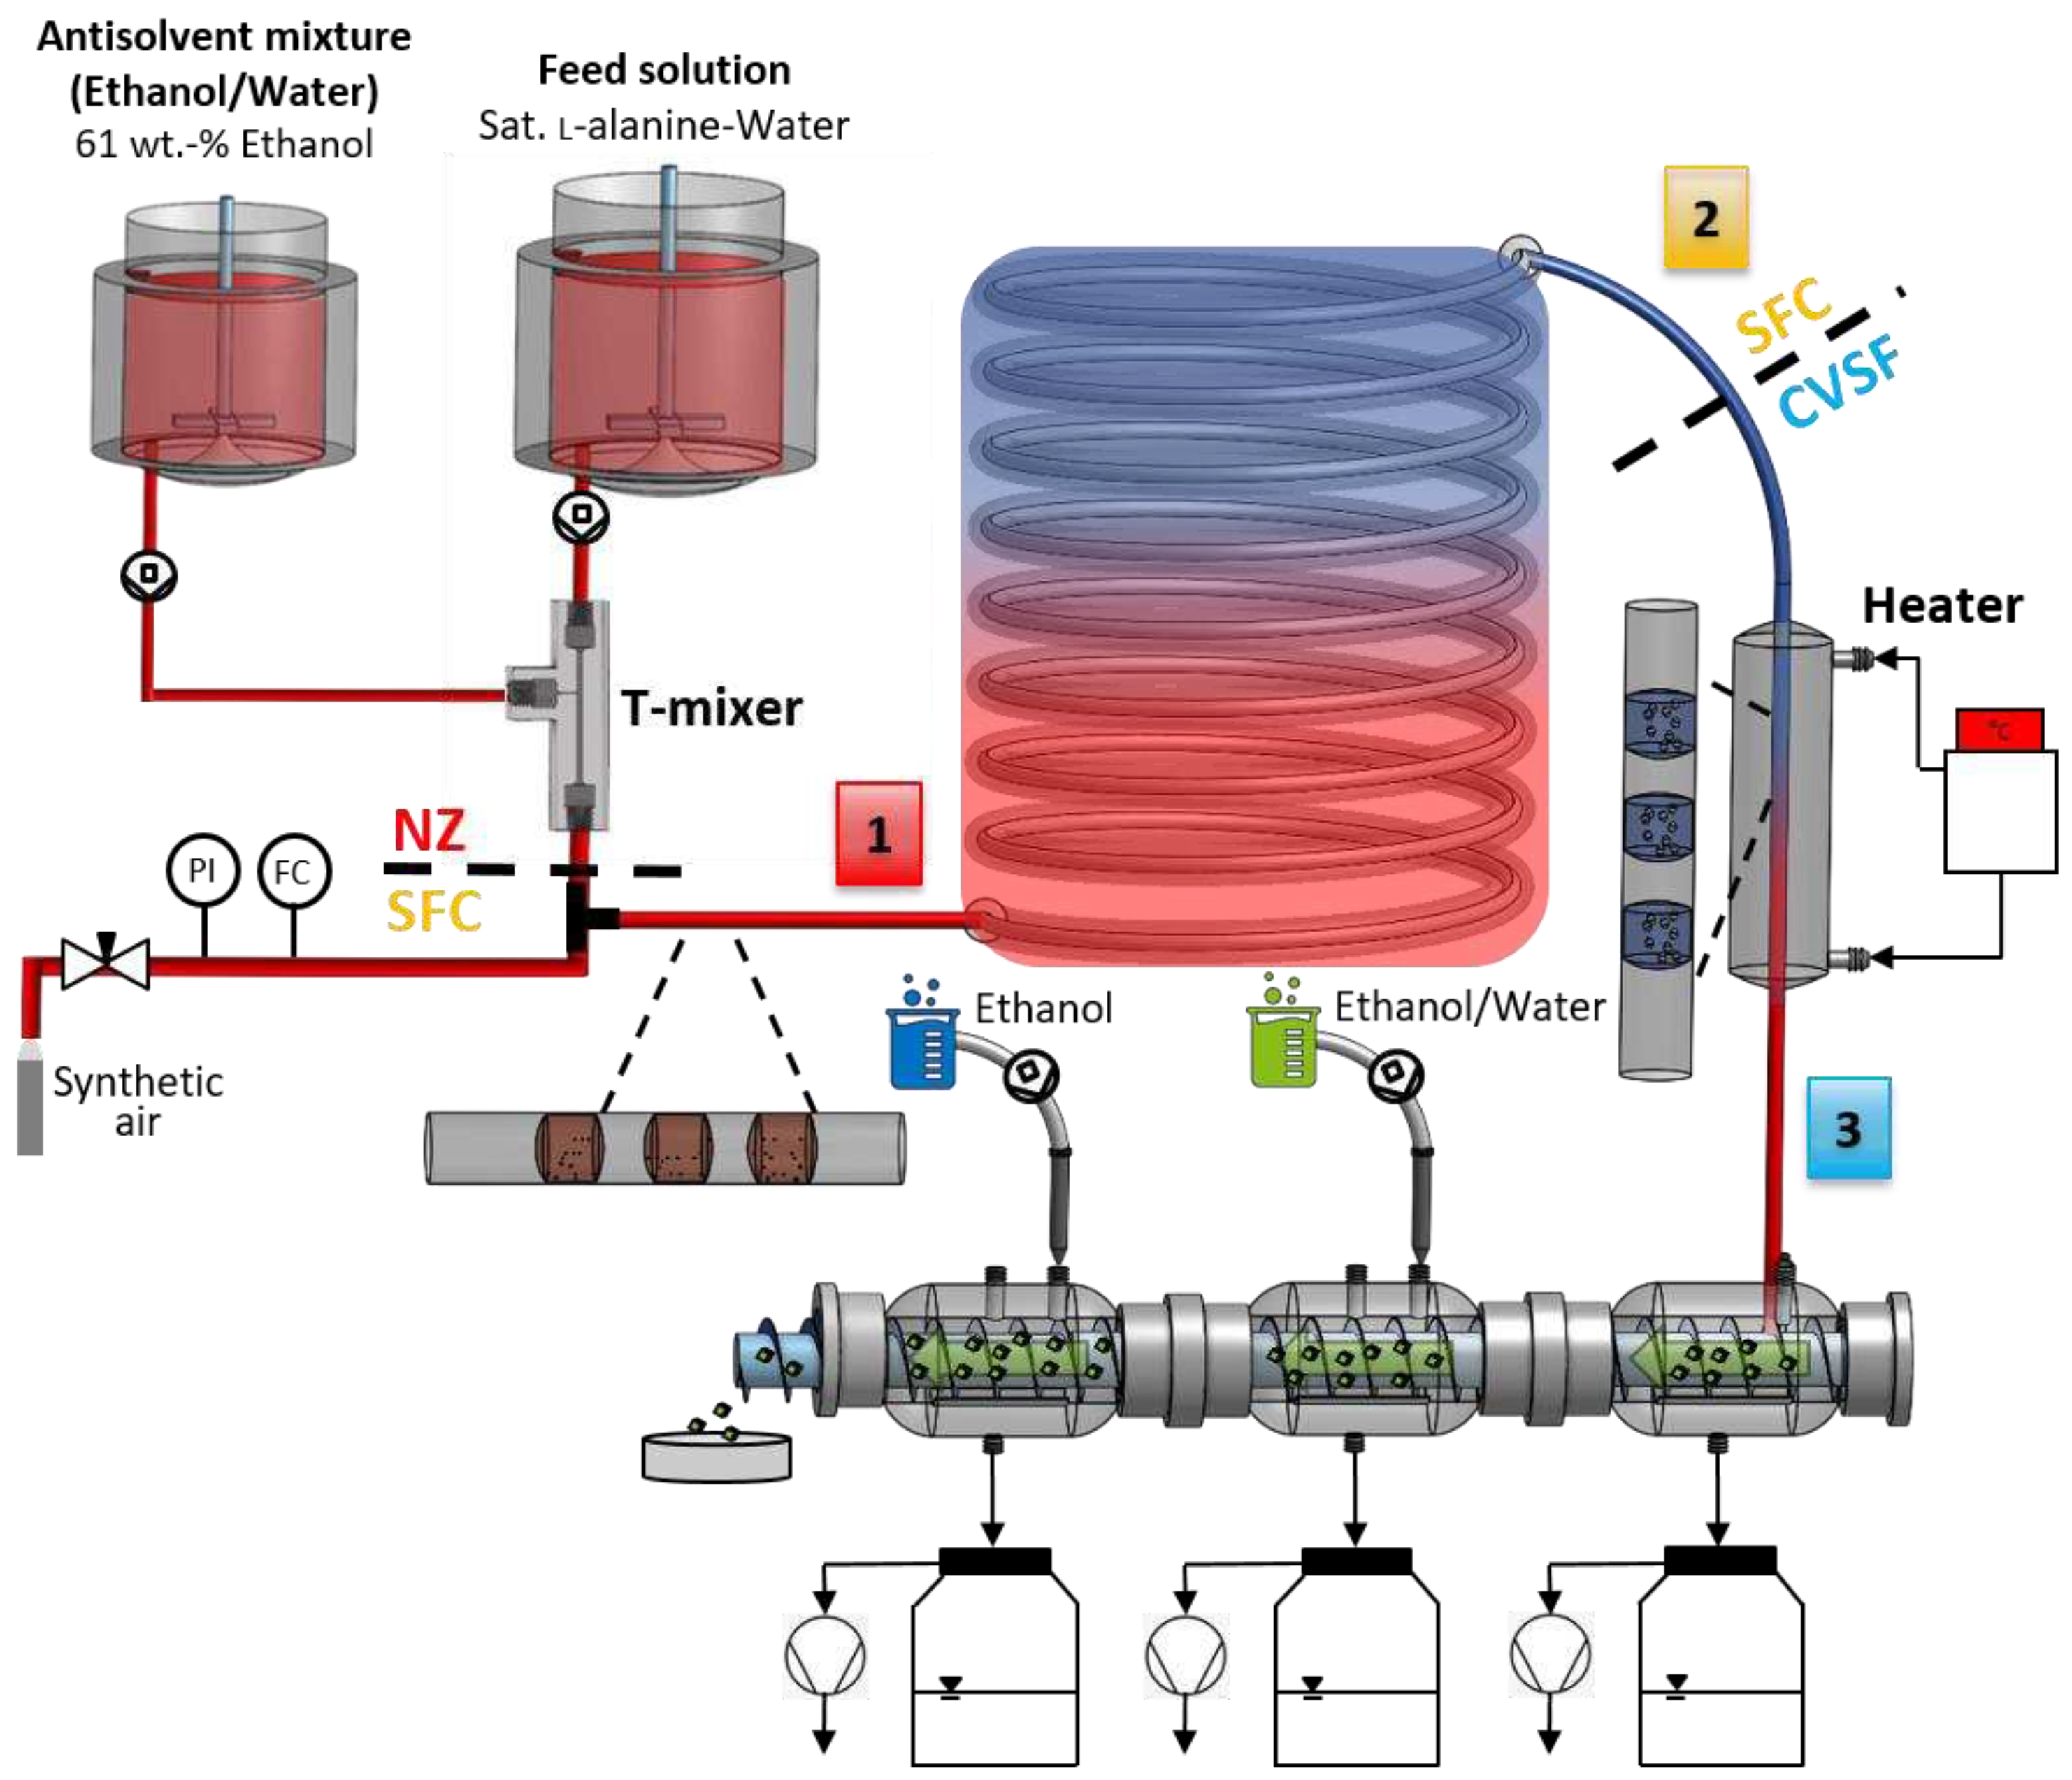
Figure 13.
Results at the inlet and outlet of the CVSF. (left) The PSDs of the product particles at the inlet (CVSFIN, red) and outlet (CVSFOUT, blue) of the CVSF. (right) Exemplary DIA binary images of particles at the inlet (top, red) and outlet (bottom, blue).
Figure 13.
Results at the inlet and outlet of the CVSF. (left) The PSDs of the product particles at the inlet (CVSFIN, red) and outlet (CVSFOUT, blue) of the CVSF. (right) Exemplary DIA binary images of particles at the inlet (top, red) and outlet (bottom, blue).
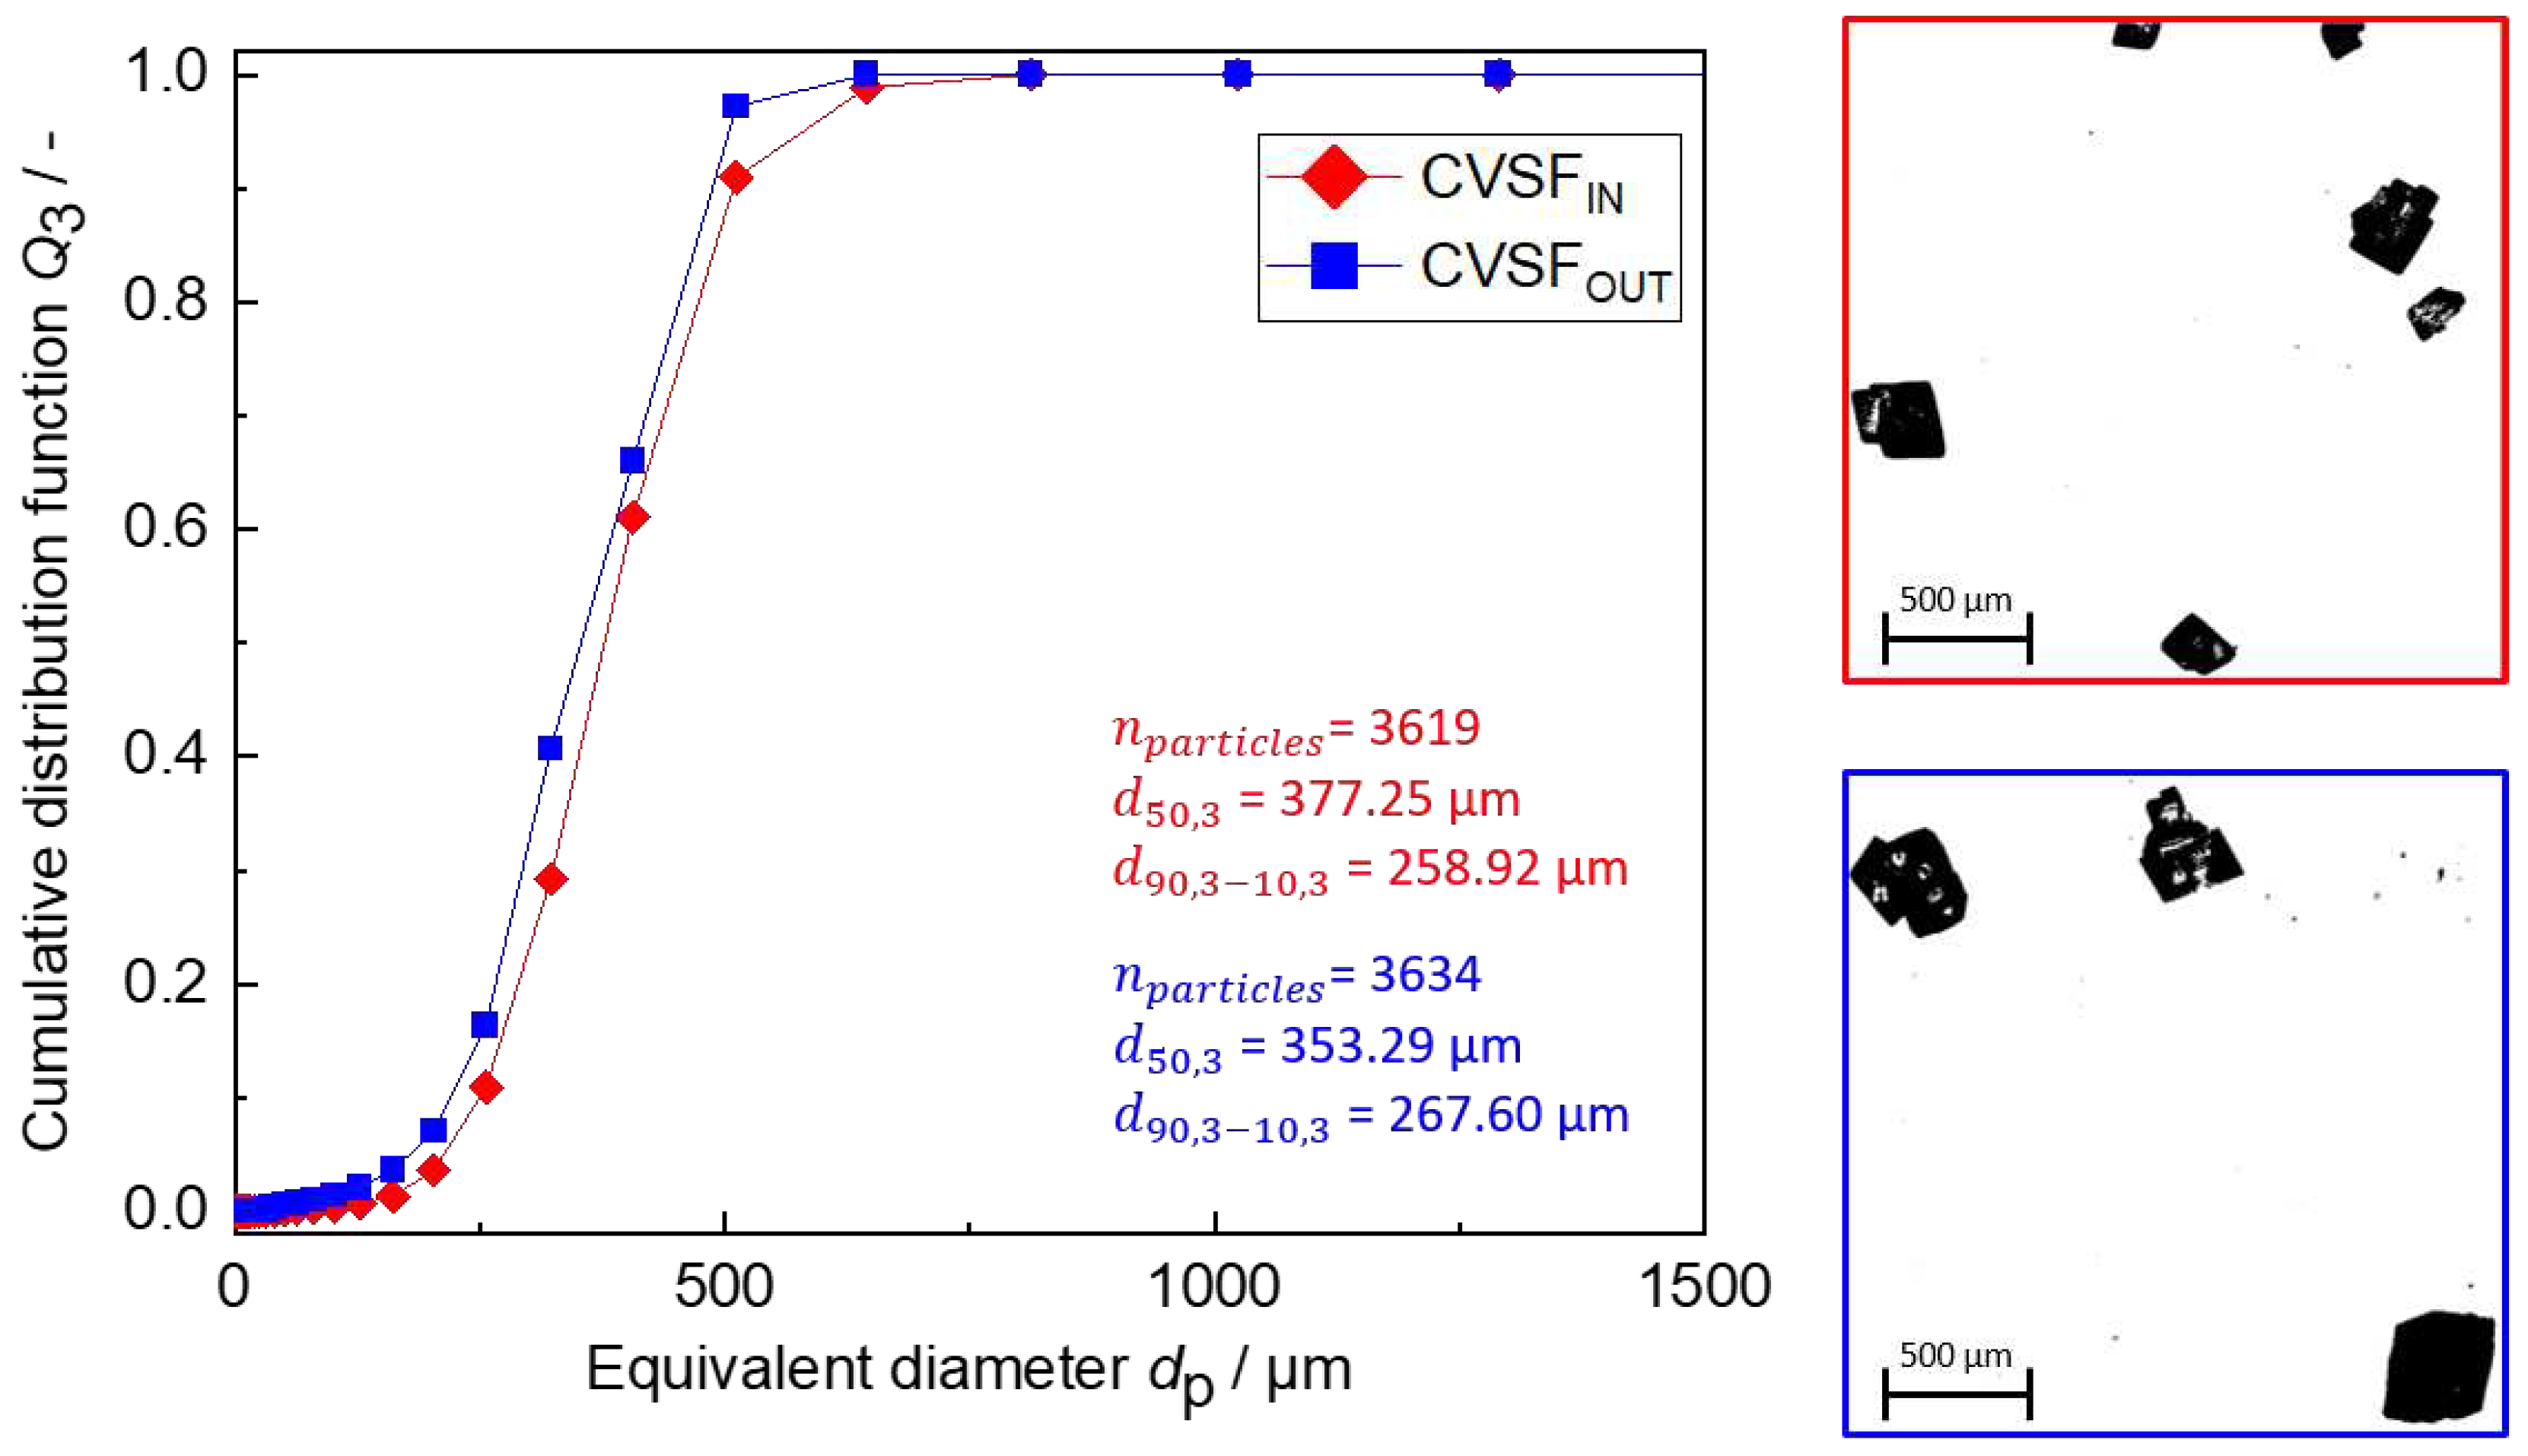
Figure 14.
Results of the filtration module during CVSF operation. (left) Pressure drop of the vacuum pump over the process time (blue line). The vertical green line indicates the end of the suspension supply from the SFC. The horizontal dotted red line represents the set pressure drop . (right) Filtrate mass over the process time until the end of the suspension supply into the CVSF.
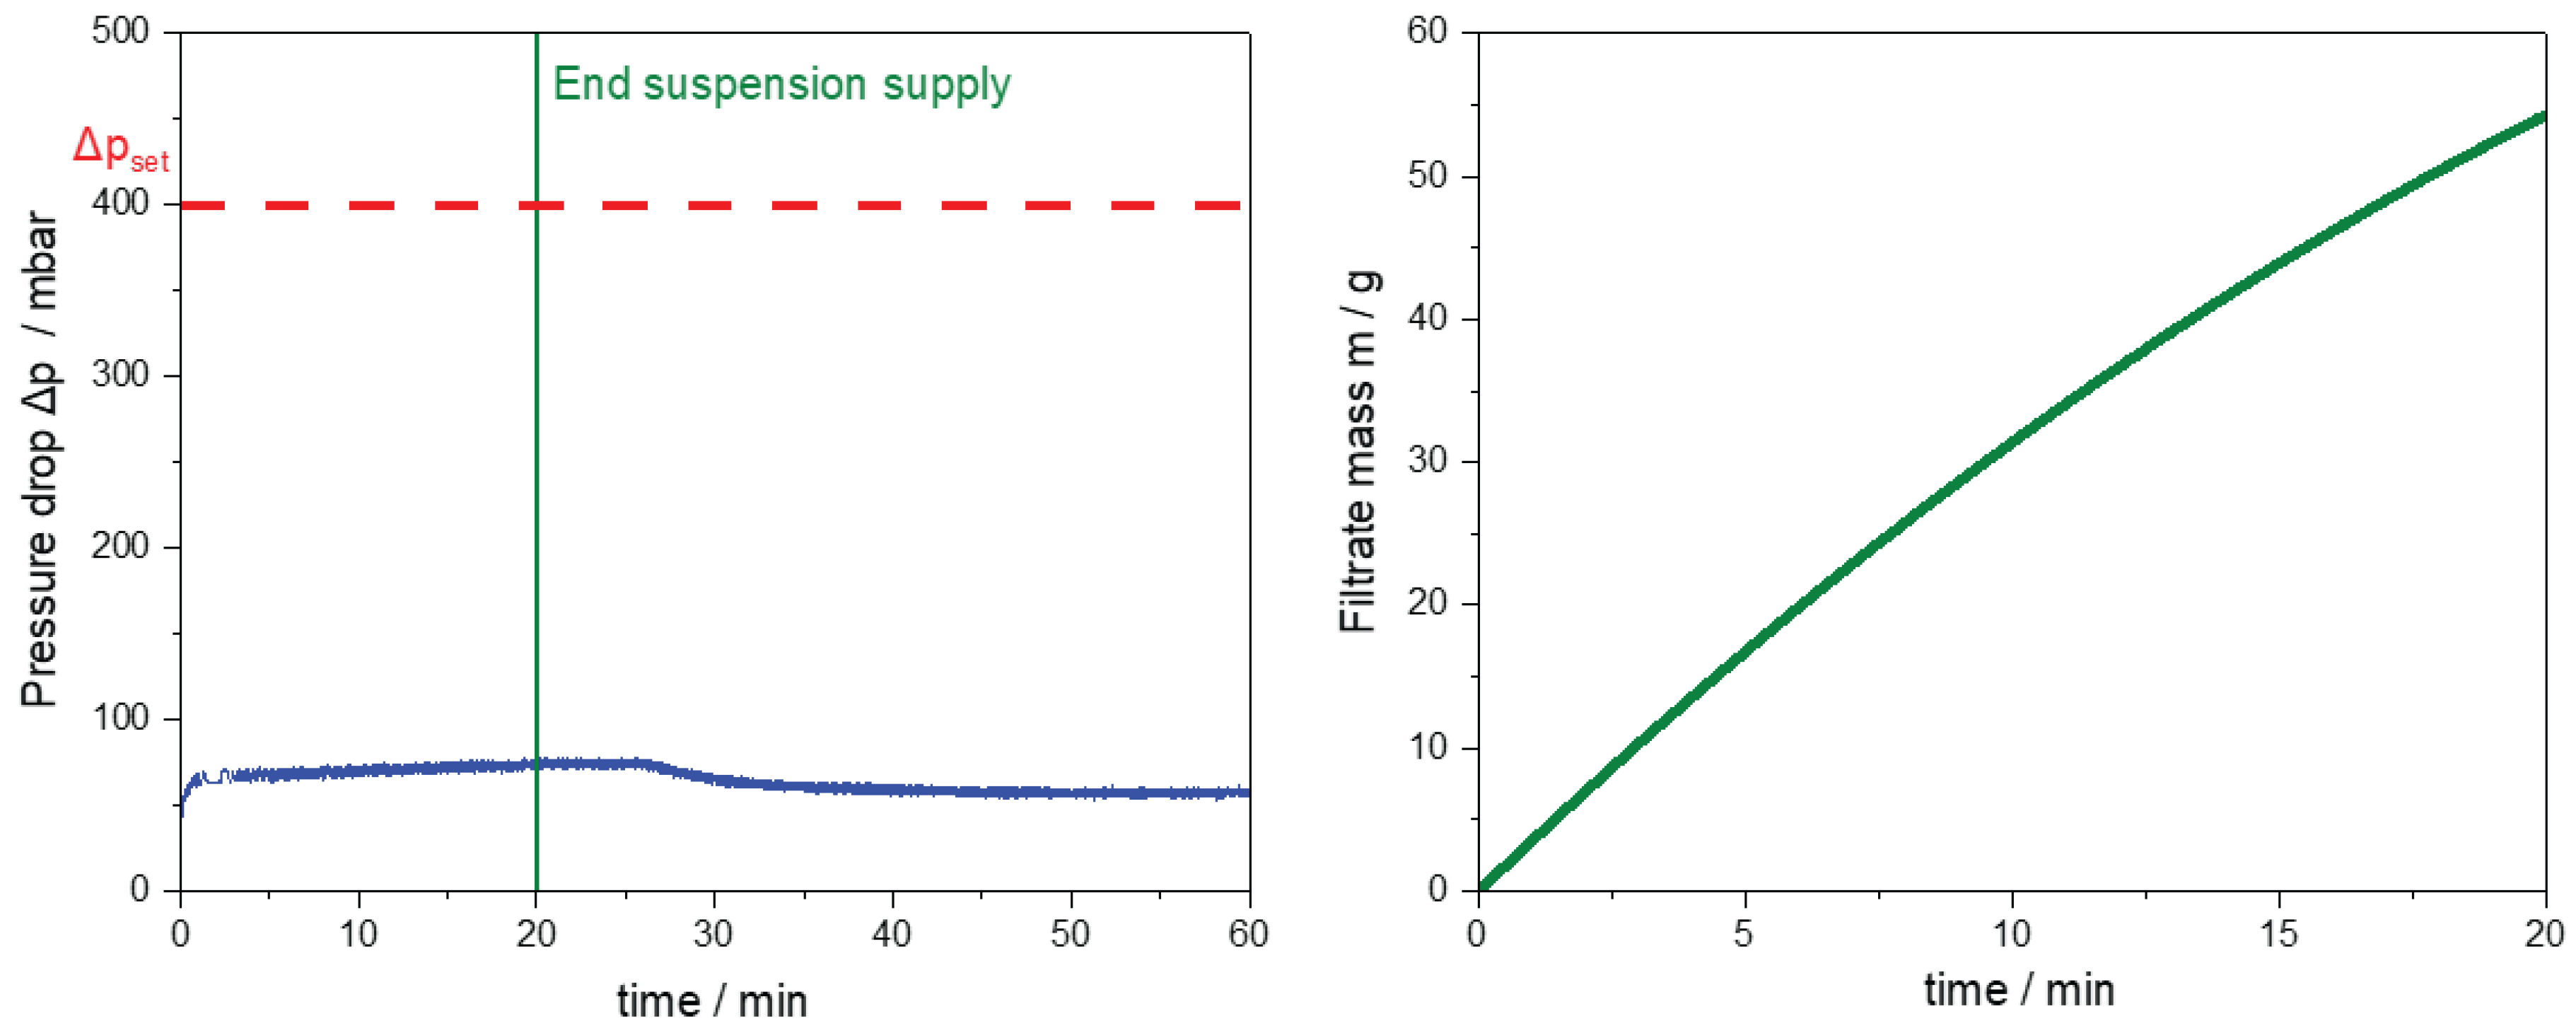

Table 1.
Graphically determined process parameters and resulting design parameters of T-mixers with 90° inlets and equal velocities at the mixing point, providing of 5 wt.-%.
Table 1.
Graphically determined process parameters and resulting design parameters of T-mixers with 90° inlets and equal velocities at the mixing point, providing of 5 wt.-%.
| Design | 1 | 2 |
| T-mixer configuration | 90° | 90° |
| / °C | 20 | 50 |
| / mm | 0.75 | 0.75 |
| / mm | 2.61 | 2.27 |
| / mm | 2.61 | 2.27 |
| / wt.-% | 5 | 5 |
| / wt.-% | 1 | 1 |
| / mL min-1 | 10 | 10 |
| / mL min-1 | 0.83 | 1.10 |
| / wt.-% | 72 | 61 |
| / - | 88 | 190 |
Table 2.
Experimental and resulting parameters for a T-mixer with 90° inlets ( = 5 wt.-%, Design 2) as continuous nucleator coupled with the SFC ( = 26.54 m) for two different operating points (OP1 and OP2). The experiments for OP1 and OP2 were performed three and two times, respectively.
Table 2.
Experimental and resulting parameters for a T-mixer with 90° inlets ( = 5 wt.-%, Design 2) as continuous nucleator coupled with the SFC ( = 26.54 m) for two different operating points (OP1 and OP2). The experiments for OP1 and OP2 were performed three and two times, respectively.
| Parameters | OP1 | OP2 |
|---|---|---|
| / mL min-1 | 5.55 | 11.09 |
| / - | 0.43 ± 0.03 | 0.41 ± 0.01 |
| / min | 16.44 ± 1.21 | 7.74 ± 0.13 |
| / °C | 50.35 ± 0.11 | 49.46 ± 0.01 |
| / °C | 25.64 ± 0.41 | 34.75 ± 0.08 |
| / K min-1 | 1.51 ± 0.09 | 1.90 ± 0.02 |
Table 3.
Experimental results for the crystallization processes using process parametes given in Table 2.
Table 3.
Experimental results for the crystallization processes using process parametes given in Table 2.
| Parameters | OP1 | OP2 |
|---|---|---|
| / % | 81.52 ± 3.61 | 65.65 ± 2.07 |
| / - | 494 ± 248 | n.a. * |
| / µm | 484.14 ± 54.60 | n.a. * |
| / µm | 530.47 ± 50.21 | n.a. * |
* PSD could not be measured due to the high end temperature at the SFC, so that influences during the collection of the suspension as well as during the measurement cannot be excluded.
Table 4.
Experimental process and resulting parameters for the integrated process consisting of coupled nucleator, SFC, heater and CVSF based on triple experiments.
Table 4.
Experimental process and resulting parameters for the integrated process consisting of coupled nucleator, SFC, heater and CVSF based on triple experiments.
| Parameters | Value | |
|---|---|---|
| T-mixer (90° inlets) | / mL min-1 | 5.55 |
| / mL min-1 | 5 | |
| / mL min-1 | 0.55 | |
| / wt.-% | 61 | |
| / wt.-% | 5 | |
| SFC | / mL min-1 | 5.55 |
| / - | 0.44 ± 0.00 | |
| / min | 16.72 ± 0.04 | |
| / °C | 48.89 ± 0.24 | |
| / °C | 23.63 ± 0.19 | |
| / K min-1 | 1.51 ± 0.03 | |
| / wt.-% | 2.73 ± 0.56 | |
| Heater | / °C | 51 |
| / °C | 31 | |
| CVSF | / rpm | 1 |
| / mbar | 400 | |
| / mL min-1 | 15 | |
| / % | 5 | |
| / min | 32 |
Disclaimer/Publisher’s Note: The statements, opinions and data contained in all publications are solely those of the individual author(s) and contributor(s) and not of MDPI and/or the editor(s). MDPI and/or the editor(s) disclaim responsibility for any injury to people or property resulting from any ideas, methods, instructions or products referred to in the content. |
© 2023 by the authors. Licensee MDPI, Basel, Switzerland. This article is an open access article distributed under the terms and conditions of the Creative Commons Attribution (CC BY) license (http://creativecommons.org/licenses/by/4.0/).
Copyright: This open access article is published under a Creative Commons CC BY 4.0 license, which permit the free download, distribution, and reuse, provided that the author and preprint are cited in any reuse.


