1. Introduction
Semiconductor quantum dots (QDs) are important building blocks for applications in quantum information technology where they act as qubits[
1] and deterministic sources of single photons[
2] or entangled photon pairs [
3,
4,
5,
6]. In this field, the QDs are usually operated at liquid helium temperature to preserve clear excitonic features in the optical spectra. But for device applications an operation at higher temperatures would be desirable to avoid expensive, large, and maintenance-intensive cooling technologies like liquid-helium cryostats or closed-cycle Gifford-McMahon (GM) systems.
However, with increasing temperature
T, a broadening of the QD excitonic lines is reported as well as the formation of phonon sidebands.[
7,
8,
9,
10,
11] Furthermore, a substantial degradation of the intensity of the emission from various types of the QDs at higher temperatures is observed.[
7,
8,
12,
13,
14,
15,
16,
17,
18] Both effects seriously interfere with an application of QDs in optical quantum information technology at elevated temperatures.
This study focuses on GaAs cone-shell QDs (CSQDs) fabricated in a self-assembled fashion by local droplet etching[
19] during molecular beam epitaxy (MBE). The self-assembled droplet etching of nanoholes into GaAs surfaces was first demonstrated by Wang et al.[
20] and the fabrication of strain-free GaAs QDs by filling of droplet-etched nahoholes in AlGaAs with GaAs by us[
21]. This type of QDs demonstrates a high degree of single-photon emission and a very low neutral exciton fine-structure splitting[
22] which suggests it for applications in quantum information technology[
4].
The present temperature-dependent single-dot photoluminescence (PL) experiments show an only slight exciton peak broadening and only weak phonon sidebands. Even more important, the optical data establish a significant temperature enhancement of the exciton intensity with a maximum at a temperature around T = 30 K. This allows spectroscopy and possible device applications using economical and compact Stirling cryocoolers. Detailed PL measurements are performed to evaluate the temperature-dependent intensities of the exciton and biexciton peaks at varied excitation power P and for QDs with varied size. The peak intensities show a complex interplay between T- and P-dependence. For an excitation power being high enough, a rising temperature yields first an enhancement of the exciton peak intensity up to a factor of five followed by the expected reduction. For an interpretation of the data and to identify the underlying mechanisms, a model is introduced which quantitative reproduces the experimental T- and P-dependence including the temperature enhancement.
2. Experimental Setup
The fabrication of the samples with GaAs QDs embedded in an AlGaAs matrix by local droplet etching during MBE is described in previous publications[
19,
21]. In brief, about 30 nm deep cone-like nanoholes with a density of
cm
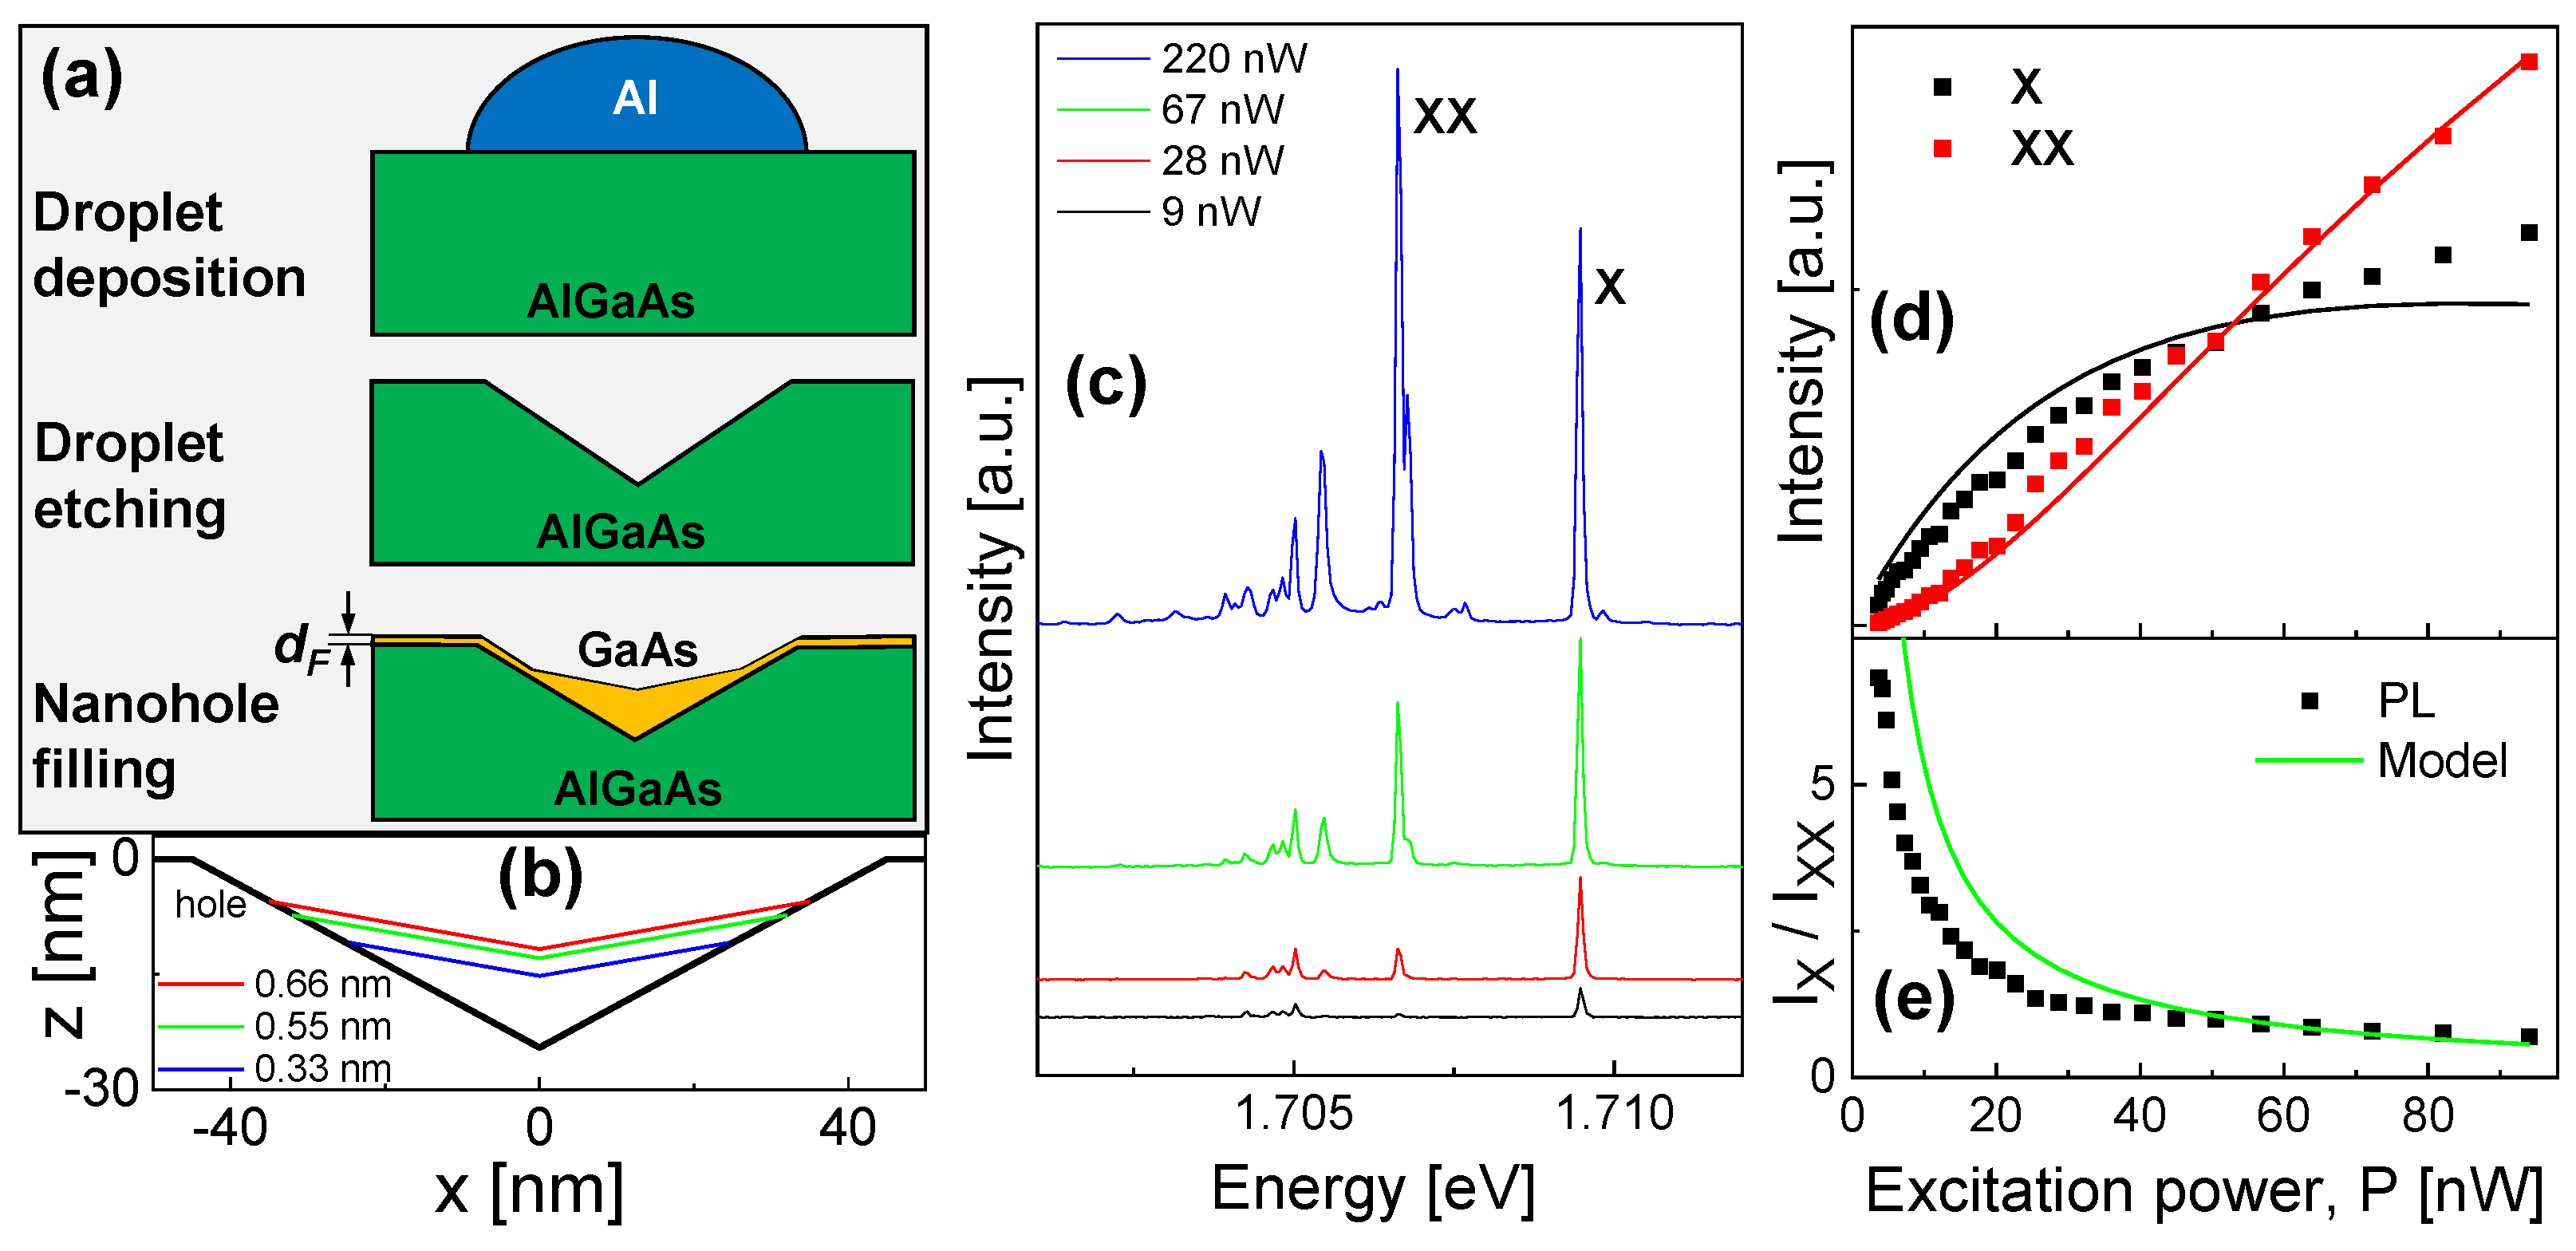
−2 are drilled into an AlGaAs substrate (the Al content is 33 %) by self-assembled etching with Al droplets. The nanoholes are filled with GaAs for QD generation, where the thickness
of the GaAs filling layer controls the QD size (
Figure 1a). For the present samples, the value of
is varied from 0.33...0.66 nm. We note that
is no equal to the final height of the QDs, a recent study discussing the shape and size of droplet etched QDs is given in ref. [
19]. The shapes of CSQDs with the sizes discussed in the present work are calculated according to ref.[
23] and shown in
Figure 1b.
For the micro-PL measurements the samples are installed in an optical closed-cycle cryostat (Montana Cryostation S100), which allows a precise variation of the sample temperature from T = 3.2 K up to 350 K. For sample movement and QD selection, a stack of piezo motors is integrated inside the cryostat. The QDs are optically excited by a green (532 nm) LED laser where the laser power P is adjustable by neutral density filters. The laser power is measured with a power meter and the reading is corrected for the entrance window of the cryostat. The objective (Olympus LMPLFLN-BD, 100x0.8) for focusing the laser and collecting the light emitted from the sample is installed inside the cryostat. Due to the low QD density, individual QDs are selected without aperture by the focused laser. The QD emission is analyzed by a f=500 mm monochromator in combination with an EMCCD camera for detection.
3. Experimental Results
This section addresses measurements of the excitation power and temperature dependence of the exciton and biexcitons peak intensities from different samples with varied QD size. A model of the data is described in
Section 4 and a comparison between experimental and model results in
Section 5.
3.1. Power Dependence at Low T
Figure 1c shows typical spectra from the s-shell of a single QD taken at a low temperature (
T = 3.2 K) and at a varied laser power
P. We identify the peaks as follows[
24,
25]: the first peak arising at low
P and with the highest energy is related to an exciton (one electrostatically coupled electron-hole pair). The biexciton is composed of two excitons, it has a smaller energy, and its intensity exceeds that of the exciton at higher
P. The other peaks are related to charged excitons (trions) and multiexcitonic states caused by the beginning p-shell occupation. In
Figure 1d an example of a measured
P-dependence of the X- and XX-peak intensities is plotted and in
Figure 1e the ratio of the peak intensities.
3.2. Temperature and Power Dependence
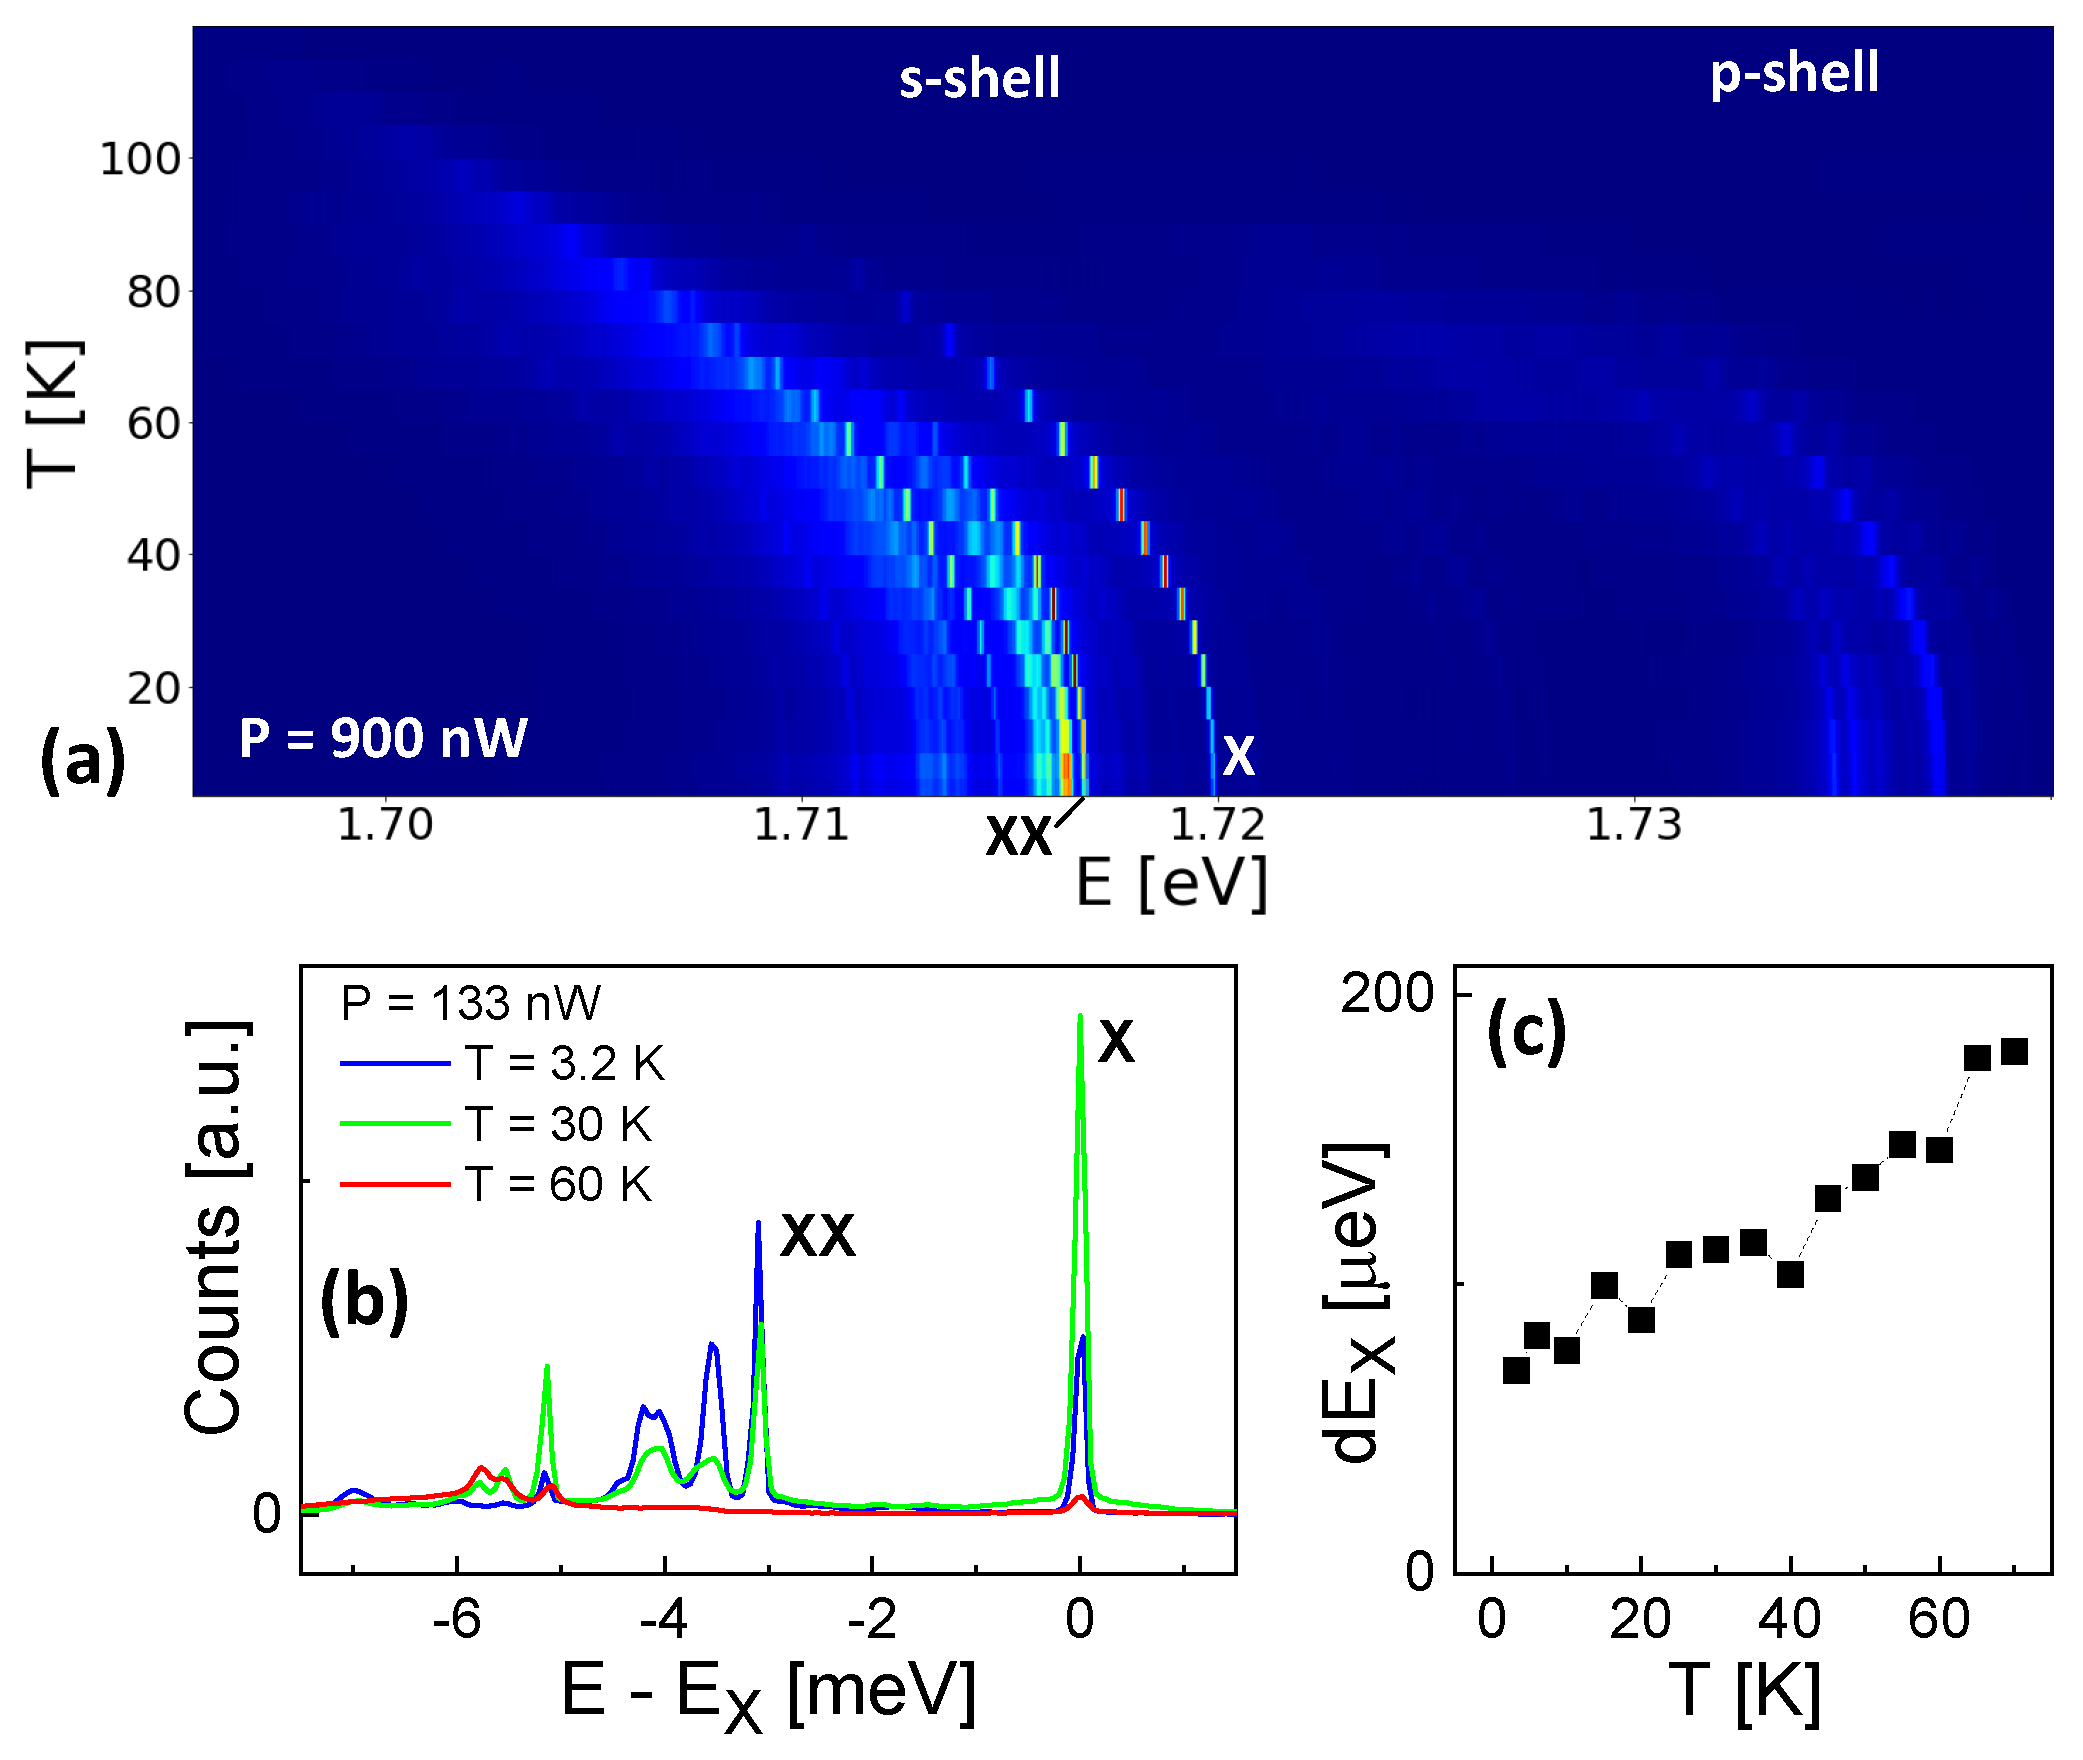
Figure 2a shows a color-coded plot of the temperature-dependent emission of a QD with
= 0.33 nm. The data are taken at a high
P = 900 nW to increase the intensity at elevated temperatures. Due to the strong excitation, in addition to the X and XX lines also further multiexcitonic states in the s-shell and even p-shell emission are visible. The X and XX peaks are determined by
P-dependent measurements as is described in
Section 3.1. The temperature dependent shift of the emission energies agrees with the shift of the GaAs bandgap, which means that the QD quantization energies do not depend on
T.
Figure 2b shows typical spectra from the same QD but now at a reduced
P = 133 nW. As an important feature, the exciton intensity at
T = 30 K is much higher in comparison to
T = 3.2 K. This temperature enhancement is not observed for the biexciton intensity. Furthermore, the exciton peak in
Figure 6c shows only weak phonon sidebands[
7,
8,
9,
10,
11] and an only slight broadening (
Figure 2c) at elevated
T. We note that the low-temperature linewidth of 70 µeV represents the resolution limit of our spectrometer. In the following, the influence of
T and
P on the X and XX intensities is discussed in more detail.
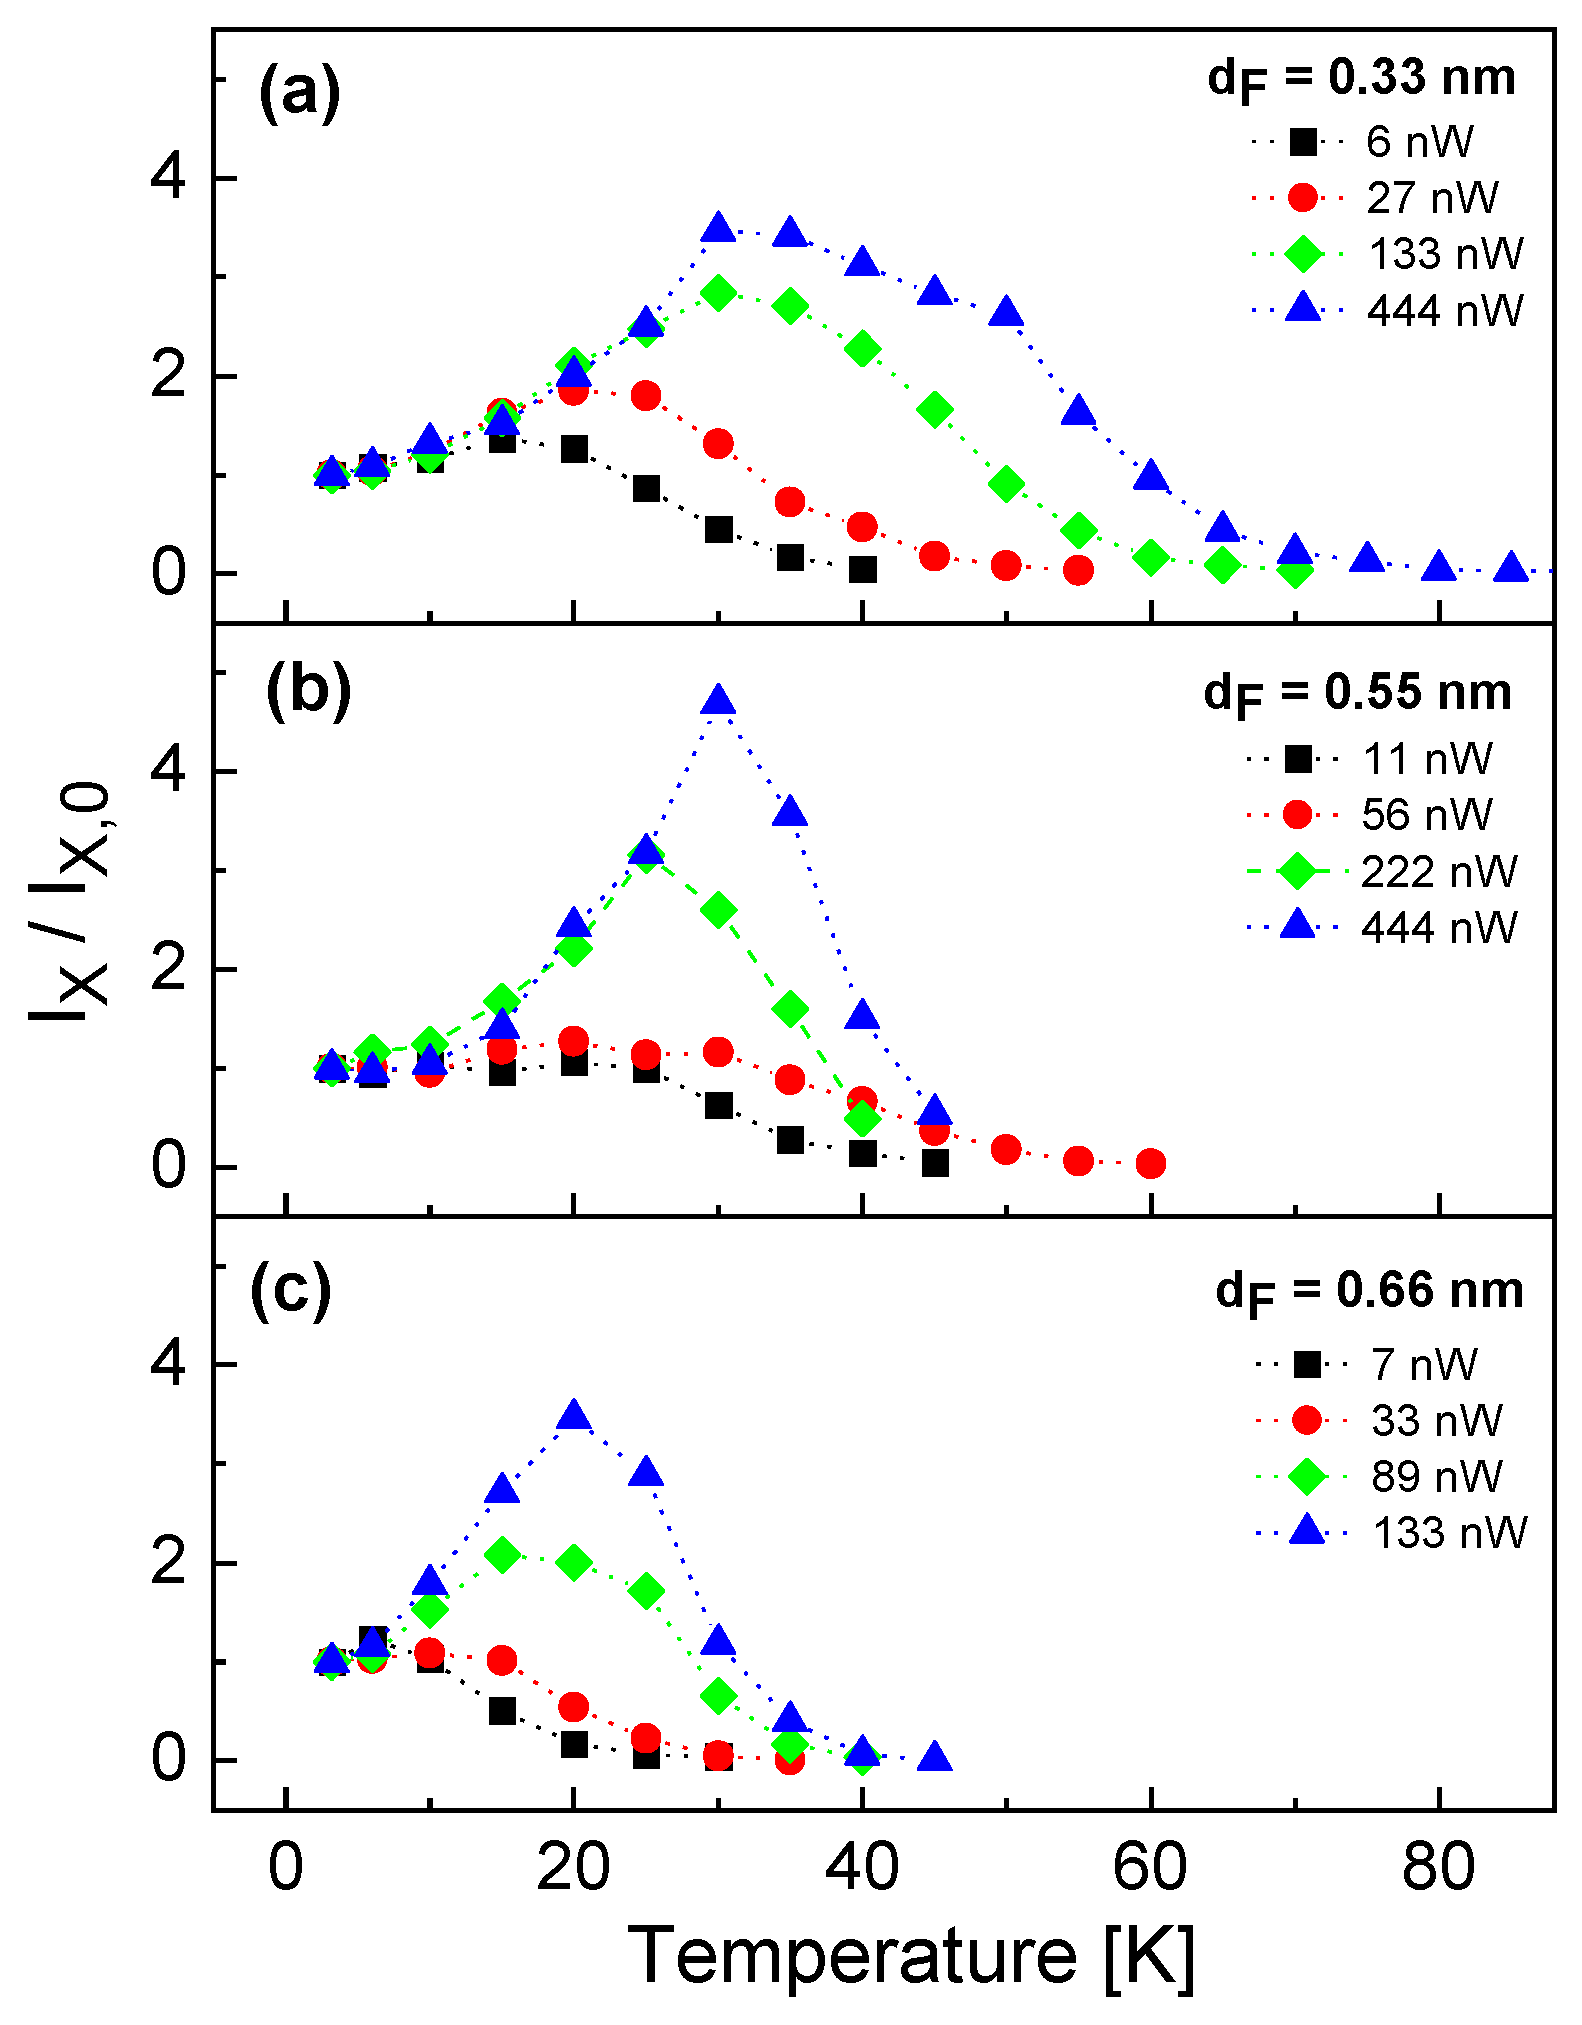
In
Figure 3 the temperature dependence of the exciton intensity
normalized to the intensity
at
T = 3.2 K is plotted for different QDs with varied filling layer thickness
measured at varied excitation power
P. For an increasing temperature the data show that first
increases up to a maximum intensity
at a temperature
, which is followed by a strongly decreasing exciton intensity up to a complete disappearance of the signal. The unexpected increase of the intensity is explained below by an increasing excitation rate due to the onset of thermally-driven diffusion of bulk excitons from the barrier layer into the dot. The decrease above
is explained by loss channels like bulk-exciton break-off or thermal escape of charge carriers from the QD.
Furthermore, both
and the corresponding
increase with increasing excitation power.
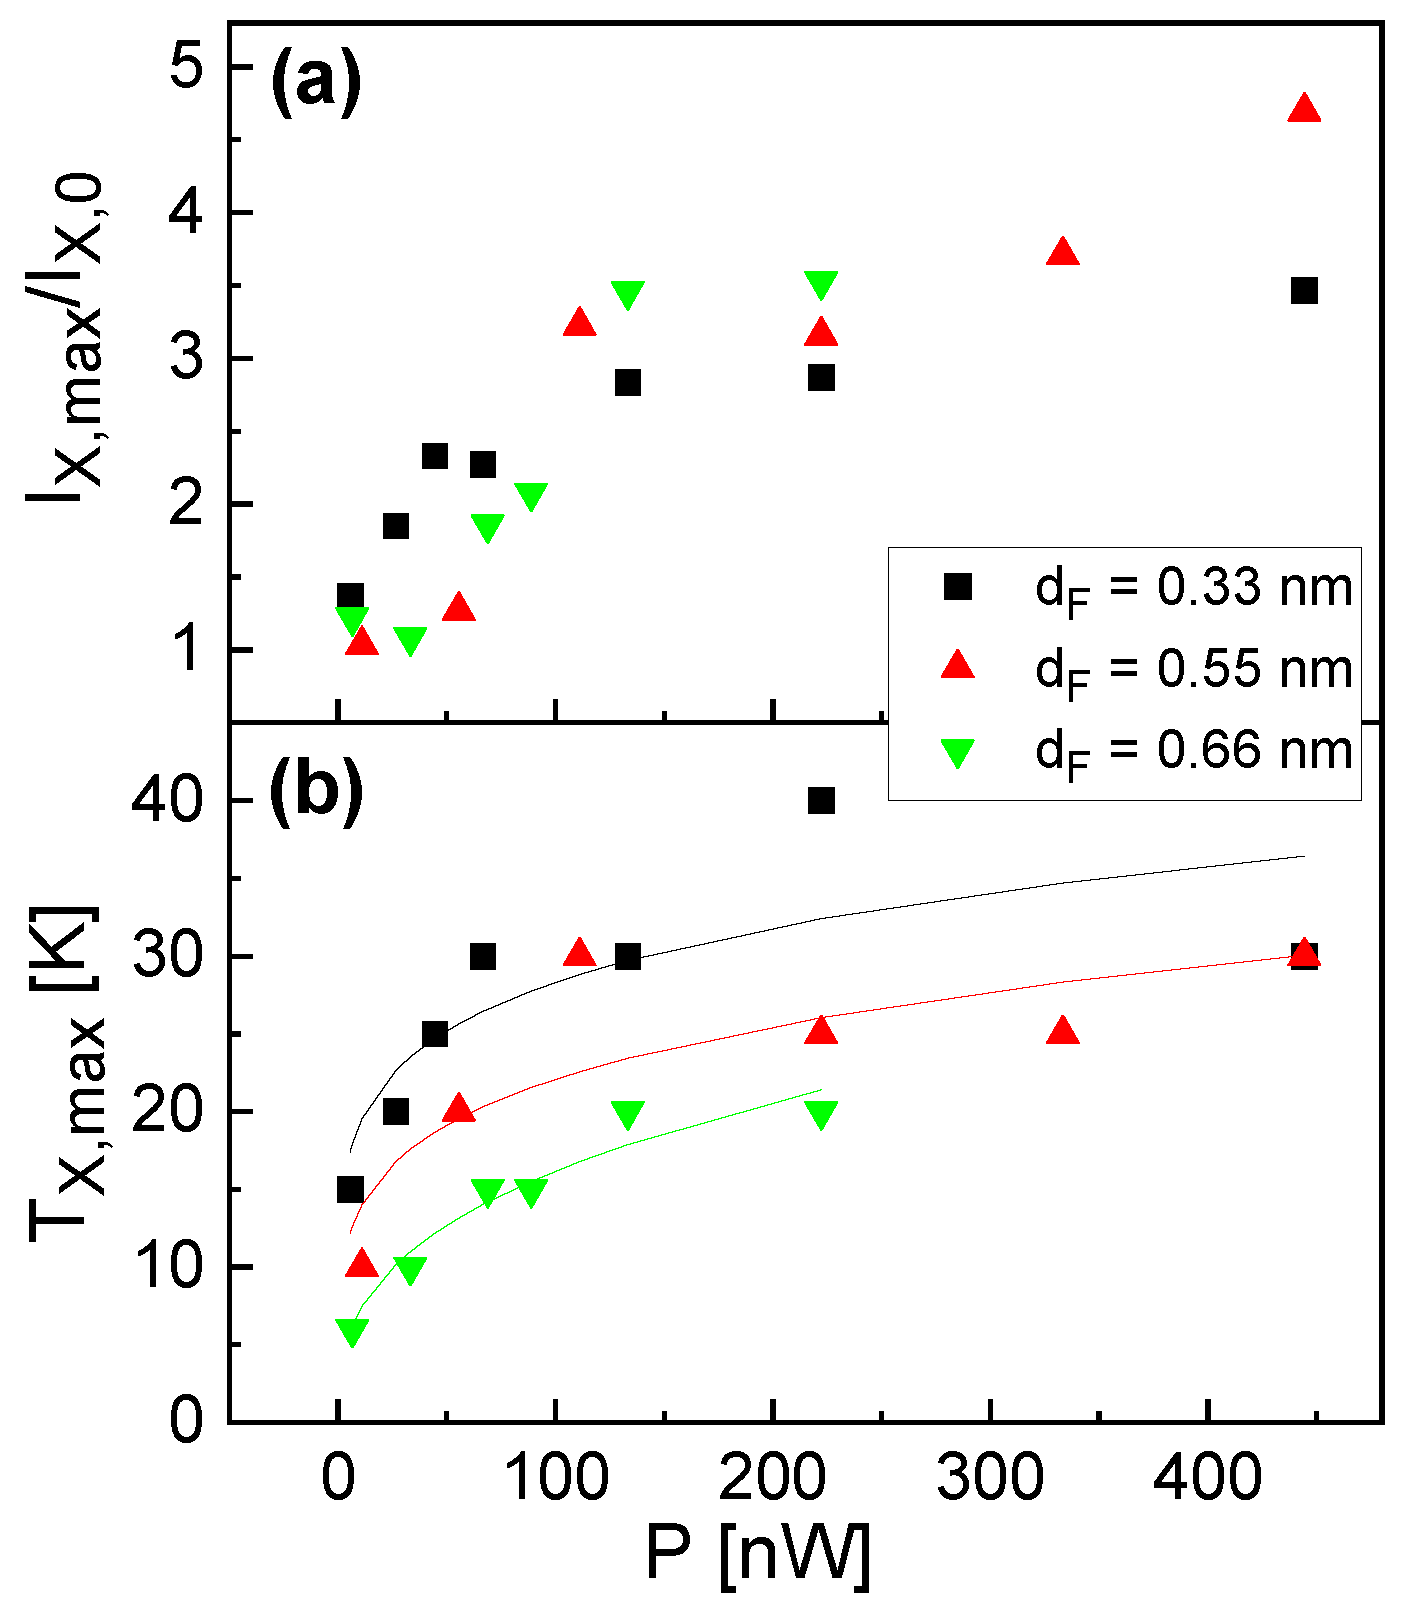
Figure 4 summarizes the maximum exciton intensity
and the corresponding temperature
as function of the excitation power. We see again the increase of both quantities with increasing
P up to a saturation at about
P = 150 nW. Regarding the QD size, there is no clear dependence of
on
, whereas
shows larger values for a smaller
.
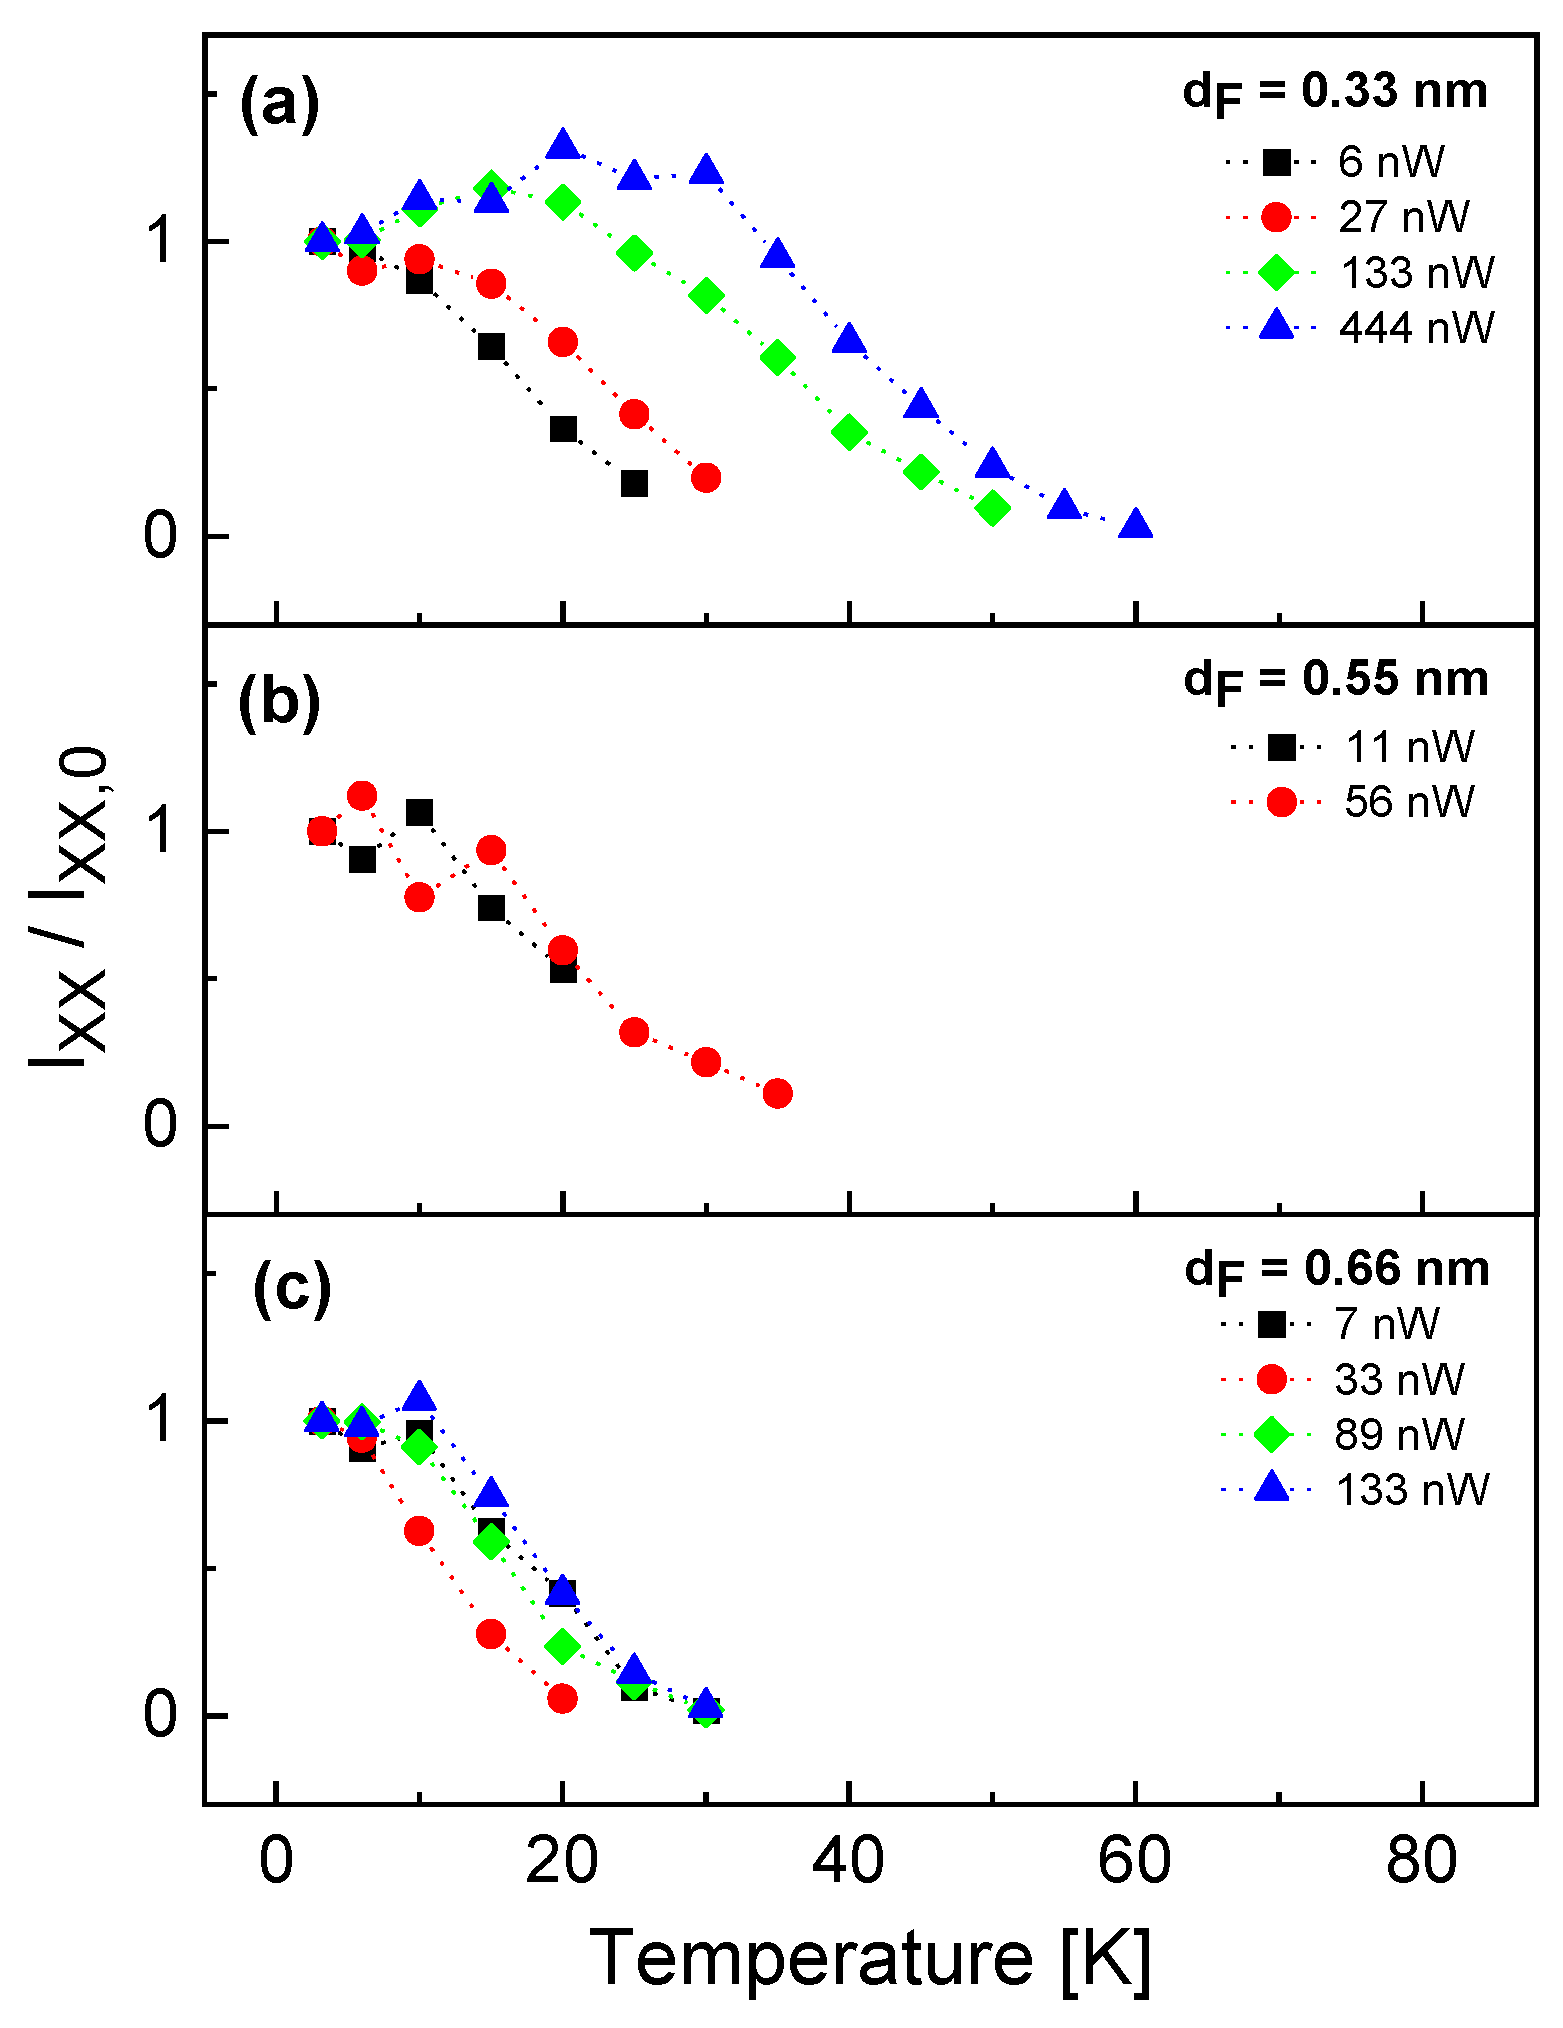
In contrast to the exciton, the biexciton intensity shows only for a high excitation power a slight increase with increasing
T, at low
P the intensity decreases almost directly (
Figure 5). For a further analysis of this effect,
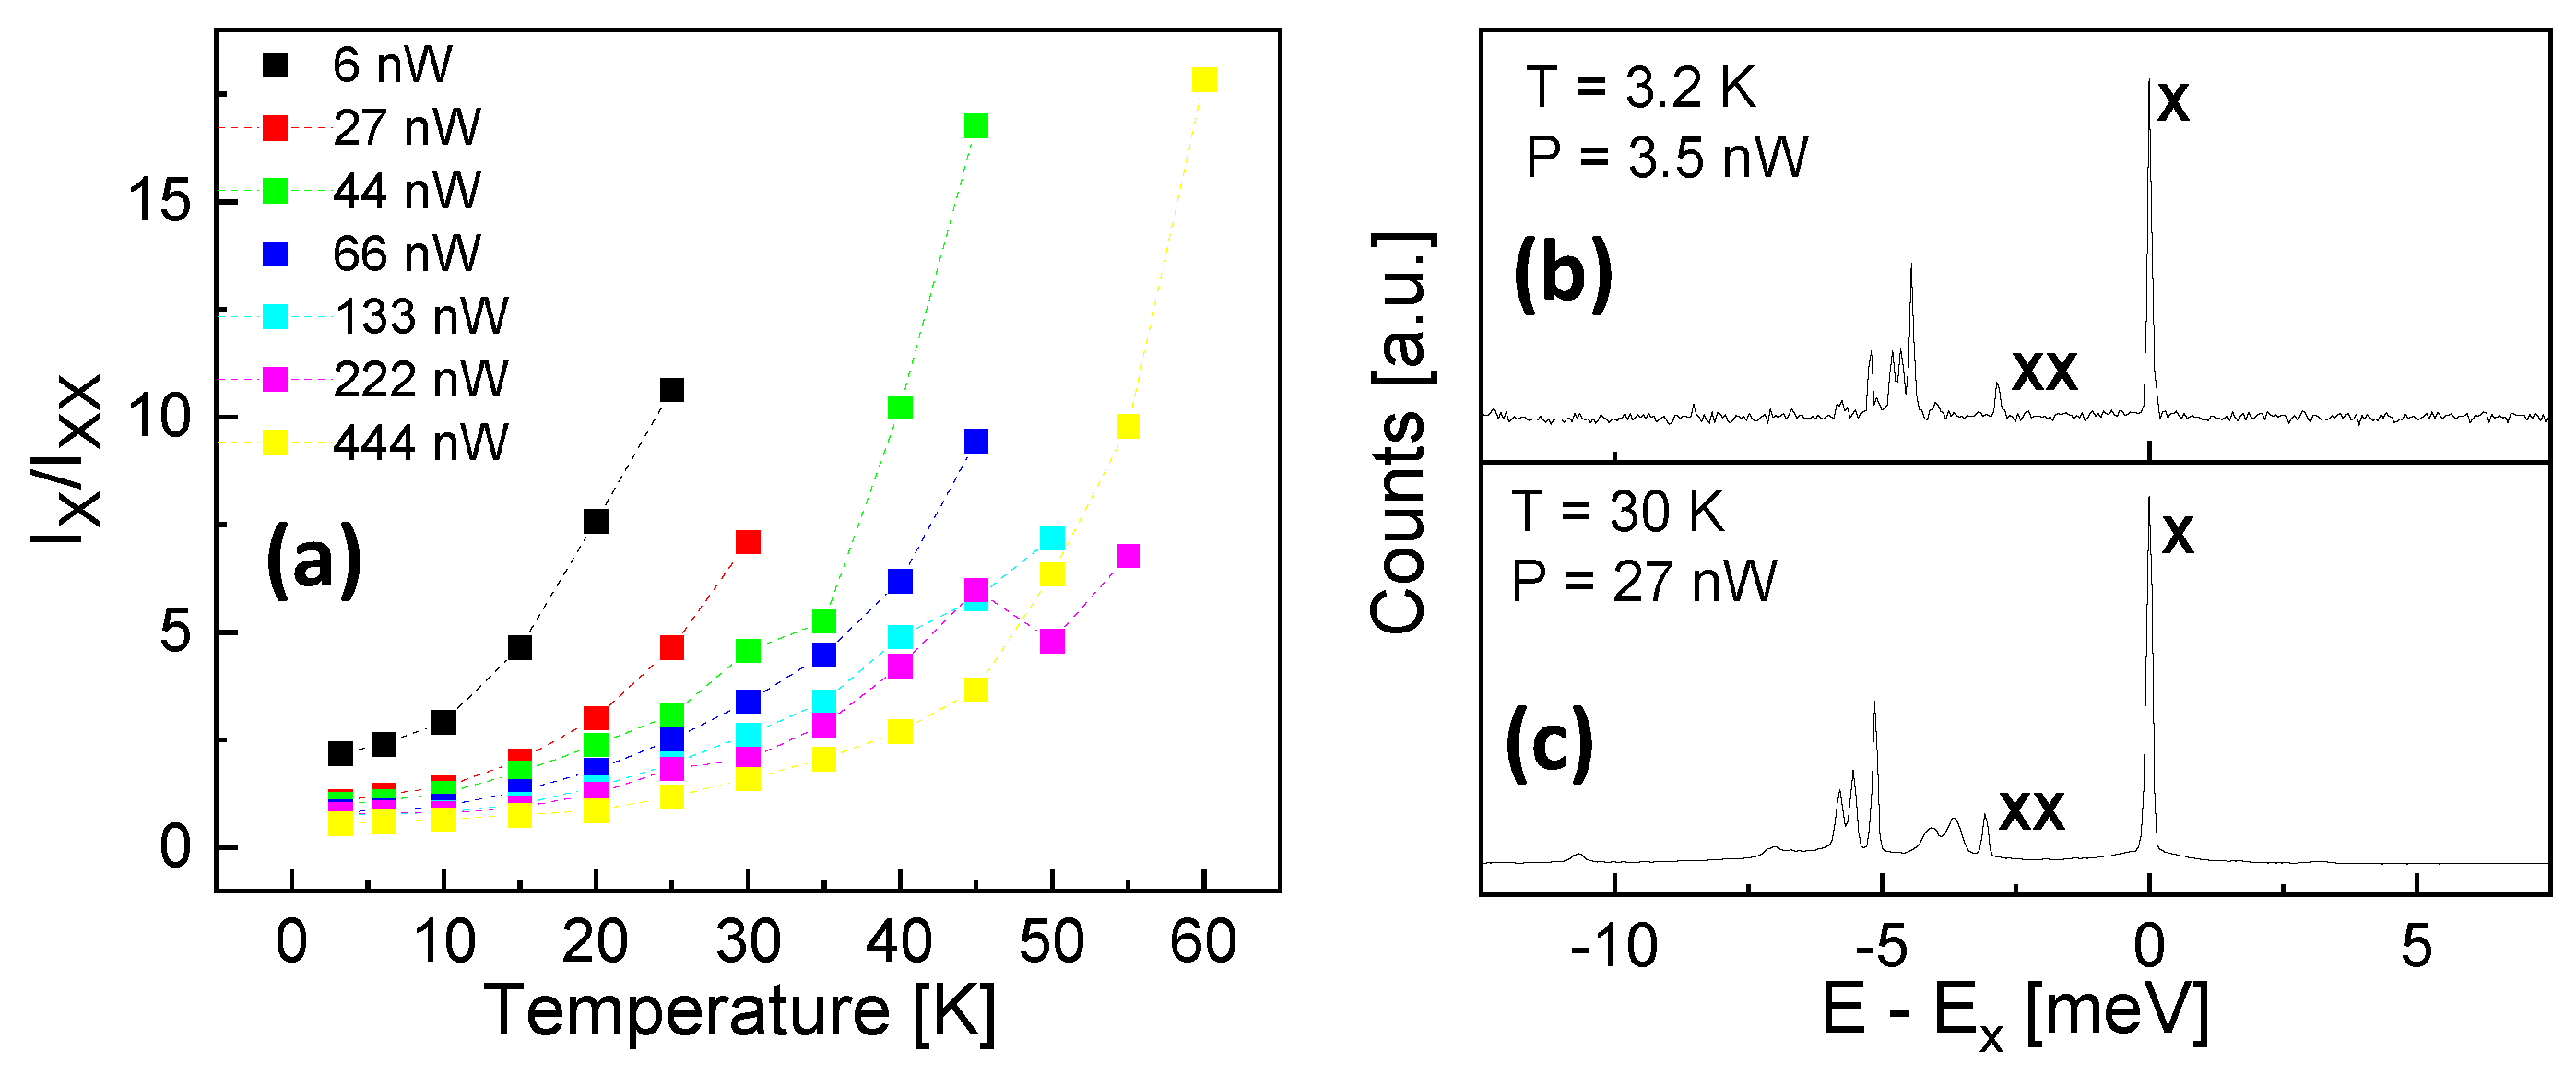
Figure 6a shows the ratio of the measured exciton and biexciton intensities as function of
T at varied
P. Clearly visible is a strong increase of
with increasing
T and a reduction with increasing
P.
Figure 5.
Temperature dependence of the biexciton peak intensity normalized to the intensity at T = 3.2 K. (a)...(c) Results from different QDs with varied filling layer thickness measured at the indicated excitation power P.
Figure 5.
Temperature dependence of the biexciton peak intensity normalized to the intensity at T = 3.2 K. (a)...(c) Results from different QDs with varied filling layer thickness measured at the indicated excitation power P.
Figure 6.
(a) Ratio of the measured exciton and biexciton intensities for a QD with = 0.33 nm as function of T at varied P as indicated; (b) PL spectrum of a QD with = 0.33 nm at T = 3.2 K and P = 3 nW; (c) PL spectrum of a QD with = 0.33 nm at T = 30 K and P = 27 nW. The energy scale is normalized to the exciton energy .
Figure 6b,c compare two scenarios to achieve a dominant exciton emission with
5. The exciton and biexciton peaks are identified by their
P-dependence as is described in
Section 3.1. The usual approach using a low temperature
T = 3.2 K and a low excitation power
P = 3.5 nW yields
= 6.6 and an exciton peak linewidth of
= 71 µeV. A measurement at a higher
T = 30 K and
P = 27 nW yields
= 7.1 and
= 109 µeV. So, the measurement a higher
T maintains the peak ratio
but broadens the linewidth by about 50%. However, we note that the accuracy of the linewidth is rather low due to the resolution limit of the spectrometer. Other artifacts like phonon sidebands are only very weak.
4. Model
The experimental data are interpreted on basis of a rate model. Starting point are the exciton and biexciton peak intensities which are described by the rate of radiative recombinations in a QD. Further considered processes are the generation of excitons by laser illumination either directly inside the QD or indirectly by diffusion from the barrier material into the dot, as well as nonradiative loss channels by bulk exciton break-off and thermal escape of excitons from a dot.
4.1. QD Peak Intensities
The QD exciton (X) and biexciton (XX) peak intensities in terms of photons per time are given by the respective rates of radiative recombinations in the QD
with a constant
, the rates
of exciton and biexciton radiative recombinations, the exciton and biexciton radiative lifetimes
, and the populations
,
of the exciton and biexciton states, respectively. The time-dependent populations are given by
with the rate
G of exciton generation in the QD and the rate
A of exciton or biexciton nonradiative annihilation processes in the QD. Here,
characterizes the generation of excitons in non-occupied dot states,
the exciton to biexciton transformation,
,
the excition and biexciton radiative decay, and
,
exciton and biexciton nonradiative annihilation processes. In equilibrium (
,
) we get
4.2. Exciton Generation
As the central approach to explain the temperature-enhancement of the QD exciton emission, we assume that a QD collects excitons by direct generation inside the dot plus additional bulk excitons that diffuse from the barrier material into the dot:
where
is the rate of direct exciton generation inside a QD and
the rate of exciton diffusion from the barrier material into a dot.
The laser illumination with power
P means a flux of
photons per unit of time and volume element towards the sample surface, with a constant
. The photon flux is attenuated inside the AlGaAs barrier material which is described following the Lambert-Beer law
, with the depth
x below the surface,
, and the absorption coefficient
= 55930 cm
−1 (AlGaAs with an Al content of 0.315 at a laser wavelength of 532 nm [
26]). In an undoped semiconductor, light is mainly absorbed by the formation of excitons. This gives the depth profile of the exciton generation rate
. Assuming a spherical QD with a radius
= 5 nm which is located
d = 80 nm below the surface, the rate of direct exciton generation in a QD becomes
with
and
= 0.00348 nm.
To evaluate the diffusion of excitons from the barrier material into a dot, we apply the approximation that the direct exciton generation rate inside a QD and in the surrounding barrier material is constant and equals
. Far away from the dot, the density of bulk excitons in the barrier material is
, with the rate
of bulk exciton radiative recombinations and the rate
at which bulk excitons are annihilated by thermal break-off. In equilibrium (
,
) we get
. For the bulk exciton radiative decay in AlGaAs we assume a lifetime
1 ns[
27] and for the annihilation of bulk excitons by thermal break-off we assume a rate
, where
is a prefactor,
an activation energy, and
Boltzmann’s constant. We introduce now the diffusion of excitons from the barrier material into a QD that is treated like a spherical sink with radius
. In steady-state the rate at which excitons diffuse towards the dot is
, with the diffusion coefficient
, the prefactor
, the activation energy
, and the radial distance
r to the QD center at
. This is solved by
. With the boundary condition
at the QD surface, we get
. Now, the rate of indirect exciton generation in a QD by exciton diffusion from the barrier becomes
4.3. Exciton Annihilation
Two mechanisms for the annihilation of generated excitons are considered. The thermal break-off in the barrier material is described already above in
Section 4.2. In addition, exciton annihilation can take place by thermal escape of charge carriers from a QD (see eqns.
2 and
3), which is already addressed in ref. [
18]. The rate of thermal escape is described by
, where
is a prefactor and
an activation energy. Of course there are other possible exciton loss-channels like Auger processes[
28]. However these are neglected here since we do not expect a strong temperature dependence.
5. Model Results
This section addresses the application of the model for the interpretation of the experimental PL data.
5.1. Power Dependence at Low T
At low
T = 3.2 K, several approximations can be applied to the model of eqn.
3. In detail, the thermally activated loss channels
A and the diffusion coefficient
D for indirect exciton generation are negligible small which yields
. This simplifies eqn.
3 to
Equations
1 and
7 allow the calculation of the X and XX power dependencies and a comparison with the experimental data in
Figure 1b using four free model parameters
,
,
, and
. To reduce the number of free parameters, we consider previous lifetime measurements[
19] of similar QDs which indicate
= 0.39 ns for
= 0.33 nm. The remaining parameters are determined by fitting:
= 0.068 ns,
= 0.0265 ns
−1nW
−1nm
−2, and
= 226.
Figure 1d shows a comparison of the model results with the experimental data at low
T = 3.2 K. Despite its simplicity, the model demonstrates a good reproduction of the power dependence of
and
. Also the power dependence of the intensity ratio
is well reproduced by the model (
Figure 1e), where eqn.
7 predicts
. However, we note that the fitted value of
is unrealistic small. In a simple approximation it can be assumed that
= 0.145 ns, since a biexciton with a doubled number of charge carriers has a doubled recombination rate in comparison to a single exciton. The inaccuracy of the fitted
can be related to the influence of states in higher shells that are not considered in the model.
5.2. Temperature and Power Dependence
The temperature dependence of the normalized exciton intensity in
Figure 3 is modeled by
, where
(eqn.
3) considers the temperature dependence and
(eqn.
7) the intensity at low temperature
T = 3.2 K, as is addressed above in
Section 5.1. We use the model parameters
= 226,
= 0.0265 ns
−1nW
−1nm
−2, as well as
= 0.39 ns and
= 0.145 ns according to
Section 5.1. Due to the number of remaining model parameters, the fitting is done in several steps.
In a first step, the bulk exciton diffusion related parameters
= 3.2
s
−1 and
= 4.2 meV are determined for best agreement with the approximately exponential growth of
in the temperature range of
T = 3.2...30 K. In a next step, the bulk exciton break-off related parameters
= 2.22
s
−1 and
= 20.5 meV are fitted in the temperature range of
T = 3.2...50 K. And finally, the parameters
= 3.22
s
−1 and
= 72 meV describing the thermal escape are fitted over the whole temperature range.
Figure 7a visualizes the respective regimes at which the different processes have an influence and demonstrates the very good reproduction of the experimental temperature-dependence by the model.
However, as a significant difference to the experimental behavior (
Figure 3), the model shows almost no influence of the excitation power
P on the normalized exciton intensity
. Mathematically, this is caused by the normalization, where two quantities with similar
P-dependence are divided. Obviously, the mechanism for the experimental
P-dependence is not included in the model. Since the slope of the bulk exciton diffusion related increase does not depend on
P (
Figure 3a), we assume here an additional
P-dependence of either the bulk exciton break-off or the thermal escape. To test this, we have fitted the exciton-annihilation related parameters for other values of
P. The resulting activation energies
for bulk exciton break-off and
for thermal escape are plotted in
Figure 7c. There, the values of
show a clear increase with
P, whereas
is almost constant. We assume a mechanism where exciton annihilation by thermal escape is caused by a combination of several thermally activated processes, with the respective strengths being controlled by the excitation power.
6. Discussion and Conclusions
The temperature dependence of the exciton and biexciton peak intensities from GaAs cone-shell QDs is studied at varied excitation power and dot size. An interesting finding is a strong temperature enhancement of the exciton emission up to a factor of five. The maximum intensity and the corresponding temperature depend on excitation power and dot size. The experimental data are modeled by considering the competing processes of exciton generation, annihilation, and recombination. Exciton generation in the QDs takes place by direct excitation in the dot layer plus additional bulk excitons that diffuse from the barrier layers into the dot. The temperature-dependent bulk-exciton diffusion is the reason for the temperature-enhanced exciton emission. Above , the intensity decreases due to exciton annihilation processes. In comparison to the exciton, the biexciton intensity shows an only very weak enhancement, which is attributed to a more efficient annihilation.
A temperature enhancement was also reported for the optical emission from GaAs quantum wells embedded in an AlGaAs barrier.[
27]. There, the enhancement was related to the same mechanism as depicted in the present study, i.e., generation of excitons also in the barrier material and their temperature-driven diffusion into the quantum wells. Considering this mechanism, a temperature enhancement of the exciton intensity under nonresonant excitation is expected for all types of QDs which are embedded in a thick semiconductor barrier. Such epitaxial QDs are usually fabricated by MBE. Nevertheless, the literature which provides
T-dependent PL data on various types of single epitaxial QDs[
7,
8,
13,
15,
16] reports no temperature enhancement. Only in ref. [
17] a slight temperature enhancement is observed for InAs/GaAs multilayer QDs. However, these measurements are done using ensemble PL, which integrates the whole s-shell intensity including charged excitons and multiexcitonic lines and allows no clear relation to the pure exciton intensity. According to
Figure 4, a probable reason for the absence of a temperature enhancement is a very low excitation power
P, which is often used in the literature for studies focusing on the exciton behavior.
From a practical point of view, the enhancement of the exciton intensity can substantially simplify the spectroscopy of single QDs. A
around 30 K allows to substitute the usual expensive, large, and maintenance-intensive sample-cooling technologies (liquid-helium or closed-cycle Gifford-McMahon cryostats) which is required for the spectroscopy at liquid helium temperature. With a base temperature around 30 K, spectroscopy of excitonic features becomes now possible by inexpensive and compact Stirling cryocoolers with a long Mean Time To Failure (MTTF). The usage of Stirling cryocoolers also simplifies the development of devices for quantum information technology, where single QDs are utilized as a single-photon source[
15]. On the other side, studies including the behavior of biexcitons are suggested at liquid-helium temperature, since the biexciton intensity shows an only very weak temperature enhancement and significantly degrades at elevated temperatures.
Author Contributions
Conceptualization, C.H. and L.R.; methodology, C.H., L.R., and A.A.; software, C.H. and C.D.; validation, C.H., L.R., C.D., and R.B.; formal analysis, C.H. and L.R.; investigation, C.H., L.R., and A.A.; resources, C.H. and R.B.; data curation, C.H., L.R., and A.A.; writing—original draft preparation, C.H.; writing—review and editing, L.R., C.D., and R.B; visualization, C.H. and L.R.; supervision, C.H. and R.B.; project administration, L.R. and C.H.; funding acquisition, C.H.. All authors have read and agreed to the published version of the manuscript.
Funding
This research received funding from the “Deutsche Forschungsgemeinschaft” via HE 2466/2-1, the European Union’s Horizon 2020 research and innovation program via the Marie Skłodowska-Curie Grant No. 721394, and the “Bundesministerium für Bildung und Forschung” via ForLab Helios.
Acknowledgments
The authors thank Wolfgang Hansen for very useful discussions, the “Deutsche Forschungsgemeinschaft” for funding via HE 2466/2-1, the European Union’s Horizon 2020 research and innovation program via the Marie Skłodowska-Curie Grant No. 721394, and the “Bundesministerium für Bildung und Forschung” via ForLab Helios.
Conflicts of Interest
The authors declare no conflict of interest.
References
- Vasconcellos, S.M.d.; Gordon, S.; Bichler, M.; Meier, T.; Zrenner, A. Coherent control of a single exciton qubit by optoelectronic manipulation. Nature Photonics 2010, 4, 545–548. [Google Scholar] [CrossRef]
- Somaschi, N.; Giesz, V.; Santis, L.D.; Loredo, J.C.; Almeida, M.P.; Hornecker, G.; Portalupi, S.L.; Grange, T.; Antón, C.; Demory, J.; et al. Near-optimal single-photon sources in the solid state. Nature Photonics 2016, 10, 340–345. [Google Scholar] [CrossRef]
- Keil, R.; Zopf, M.; Chen, Y.; Höfer, B.; Zhang, J.; Ding, F.; Schmidt, O.G. Solid-state ensemble of highly entangled photon sources at rubidium atomic transitions. Nature Communications 2017, 8, 15501. [Google Scholar] [CrossRef]
- Huber, D.; Reindl, M.; Huo, Y.; Huang, H.; Wildmann, J.S.; Schmidt, O.G.; Rastelli, A.; Trotta, R. Highly indistinguishable and strongly entangled photons from symmetric GaAs quantum dots. Nature Communications 2017, 8, 15506. [Google Scholar] [CrossRef]
- Arakawa, Y.; Holmes, M.J. Progress in quantum-dot single photon sources for quantum information technologies: A broad spectrum overview. Applied Physics Reviews 2020, 7, 021309. [Google Scholar] [CrossRef]
- Lodahl, P.; Ludwig, A.; Warburton, R.J. A deterministic source of single photons. Physics Today 2022, 75, 44–50. [Google Scholar] [CrossRef]
- Besombes, L.; Kheng, K.; Marsal, L.; Mariette, H. Acoustic phonon broadening mechanism in single quantum dot emission. Physical Review B 2001, 63, 155307. [Google Scholar] [CrossRef]
- Abbarchi, M.; Gurioli, M.; Vinattieri, A.; Sanguinetti, S.; Bonfanti, M.; Mano, T.; Watanabe, K.; Kuroda, T.; Koguchi, N. Phonon sideband recombination kinetics in single quantum dots. Journal of Applied Physics 2008, 104, 023504. [Google Scholar] [CrossRef]
- Denning, E.V.; Iles-Smith, J.; Gregersen, N.; Mork, J. Phonon effects in quantum dot single-photon sources. Optical Materials Express 2020, 10, 222–239. [Google Scholar] [CrossRef]
- Abbarchi, M.; Mano, T.; Kuroda, T.; Sakoda, K. Exciton Dynamics in Droplet Epitaxial Quantum Dots Grown on (311)A-Oriented Substrates. Nanomaterials 2020, 10, 1833. [Google Scholar] [CrossRef]
- Wigger, D.; Karakhanyan, V.; Schneider, C.; Kamp, M.; Höfling, S.; Machnikowski, P.; Kuhn, T.; Kasprzak, J. Acoustic phonon sideband dynamics during polaron formation in a single quantum dot. Optics Letters 2020, 45, 919–922. [Google Scholar] [CrossRef] [PubMed]
- Jing, P.; Zheng, J.; Ikezawa, M.; Liu, X.; Lv, S.; Kong, X.; Zhao, J.; Masumoto, Y. Temperature-Dependent Photoluminescence of CdSe-Core CdS/CdZnS/ZnS-Multishell Quantum Dots. The Journal of Physical Chemistry C 2009, 113, 13545–13550. [Google Scholar] [CrossRef]
- Tighineanu, P.; Daveau, R.; Lee, E.H.; Song, J.D.; Stobbe, S.; Lodahl, P. Decay dynamics and exciton localization in large GaAs quantum dots grown by droplet epitaxy. Physical Review B 2013, 88, 155320. [Google Scholar] [CrossRef]
- Jagtap, A.M.; Khatei, J.; Rao, K.S.R.K. Exciton–phonon scattering and nonradiative relaxation of excited carriers in hydrothermally synthesized CdTe quantum dots. Physical Chemistry Chemical Physics 2015, 17, 27579–27587. [Google Scholar] [CrossRef]
- Schlehahn, A.; Krüger, L.; Gschrey, M.; Schulze, J.H.; Rodt, S.; Strittmatter, A.; Heindel, T.; Reitzenstein, S. Operating single quantum emitters with a compact Stirling cryocooler. Review of Scientific Instruments 2015, 86, 013113. [Google Scholar] [CrossRef] [PubMed]
- Yuan, Q.; Liang, B.; Zhou, C.; Wang, Y.; Guo, Y.; Wang, S.; Fu, G.; Mazur, Y.I.; Ware, M.E.; Salamo, G.J. Interplay Effect of Temperature and Excitation Intensity on the Photoluminescence Characteristics of InGaAs/GaAs Surface Quantum Dots. Nanoscale Research Letters 2018, 13, 387. [Google Scholar] [CrossRef] [PubMed]
- Abiedh, K.; Zaaboub, Z.; Hassen, F.; David, T.; Sfaxi, L.; Maaref, H. Experimental and theoretical study of thermally activated carrier transfer in InAs/GaAs multilayer quantum dots. Applied Physics A 2020, 126, 491. [Google Scholar] [CrossRef]
- Ranasinghe, L.; Heyn, C.; Deneke, K.; Zocher, M.; Korneev, R.; Hansen, W. Luminescence from Droplet-Etched GaAs Quantum Dots at and Close to Room Temperature. Nanomaterials 2021, 11, 690. [Google Scholar] [CrossRef] [PubMed]
- Heyn, C.; Gräfenstein, A.; Pirard, G.; Ranasinghe, L.; Deneke, K.; Alshaikh, A.; Bester, G.; Hansen, W. Dot-Size Dependent Excitons in Droplet-Etched Cone-Shell GaAs Quantum Dots. Nanomaterials 2022, 12, 2981. [Google Scholar] [CrossRef]
- Wang, Z.M.; Liang, B.L.; Sablon, K.A.; Salamo, G.J. Nanoholes fabricated by self-assembled gallium nanodrill on GaAs(100). Applied Physics Letters 2007, 90, 113120–113122. [Google Scholar] [CrossRef]
- Heyn, C.; Stemmann, A.; Köppen, T.; Strelow, C.; Kipp, T.; Grave, M.; Mendach, S.; Hansen, W. Highly uniform and strain-free GaAs quantum dots fabricated by filling of self-assembled nanoholes. Applied Physics Letters 2009, 94, 183113–183115. [Google Scholar] [CrossRef]
- Küster, A.; Heyn, C.; Ungeheuer, A.; Juska, G.; Tommaso Moroni, S.; Pelucchi, E.; Hansen, W. Droplet etching of deep nanoholes for filling with self-aligned complex quantum structures. Nanoscale Research Letters 2016, 11. [Google Scholar] [CrossRef] [PubMed]
- Heyn, C.; Ranasinghe, L.; Deneke, K.; Alshaikh, A.; Duque, C.A.; Hansen, W. Strong Electric Polarizability of Cone–Shell Quantum Structures for a Large Stark Shift, Tunable Long Exciton Lifetimes, and a Dot-to-Ring Transformation. Nanomaterials 2023, 13, 857, Number: 5 Publisher: Multidisciplinary Digital Publishing Institute. [Google Scholar] [CrossRef] [PubMed]
- Heyn, C.; Strelow, C.; Hansen, W. Excitonic lifetimes in single GaAs quantum dots fabricated by local droplet etching. New Journal of Physics 2012, 14, 053004–053015. [Google Scholar] [CrossRef]
- Graf, A.; Sonnenberg, D.; Paulava, V.; Schliwa, A.; Heyn, C.; Hansen, W. Excitonic states in GaAs quantum dots fabricated by local droplet etching. Physical Review B 2014, 89, 115314. [Google Scholar] [CrossRef]
- Aspnes, D.E.; Kelso, S.M.; Logan, R.A.; Bhat, R. Optical properties of AlGaAs. Journal of Applied Physics 1986, 60, 754–767. [Google Scholar] [CrossRef]
- Jiang, D.S.; Jung, H.; Ploog, K. Temperature dependence of photoluminescence from GaAs single and multiple quantum-well heterostructures grown by molecular-beam epitaxy. Journal of Applied Physics 1988, 64, 1371–1377. [Google Scholar] [CrossRef]
- Efros, A.L.; Nesbitt, D.J. Origin and control of blinking in quantum dots. Nature Nanotechnology 2016, 11, 661–671. [Google Scholar] [CrossRef]
|
Disclaimer/Publisher’s Note: The statements, opinions and data contained in all publications are solely those of the individual author(s) and contributor(s) and not of MDPI and/or the editor(s). MDPI and/or the editor(s) disclaim responsibility for any injury to people or property resulting from any ideas, methods, instructions or products referred to in the content. |
© 2023 by the authors. Licensee MDPI, Basel, Switzerland. This article is an open access article distributed under the terms and conditions of the Creative Commons Attribution (CC BY) license (http://creativecommons.org/licenses/by/4.0/).
