
Submitted:
15 November 2023
Posted:
15 November 2023
You are already at the latest version
Abstract
In order to obtain the good match between yield strength and low-temperature toughness, the short-time partial austenitization (SPA) process was employed for V-microalloying 0.22C-5.24Mn steel. The initial microstructure after intercritical tempering was dual-phase ferrite and reversed austenite (RA), while the final microstructure was consisted of ferrite, RA and secondary martensite (SM) after subjected to SPA process. (V, Mo)C with disc-like morphology mainly precipitated during intercritial tempering, and the aspect ratio of particle decreased, leading to the appearance of near-spherical morphology. After subjected to SPA process, the resultant multiphase hierarchical microstructure (three layers: out layer of ferrite, interlayer of SM and inner layer RA) enabled high yield strength of 1097 MPa, total elongation of 14%, and impressive impact energy of 33.3 J at -20 °C. The strengthening contribution of (V, Mo)C precipitation was estimated about 108 MPa.
Keywords:
medium manganese steel
; short-time partial austenitization
; strength and toughness
; multiphase hierarchical microstructure
; (V
; Mo)C precipitation
1. Introduction
Medium manganese steels (MMS) are promising structural materials, attracting intensive attentions due to their superior comprehensive mechanical properties, such as high strength, excellent ductility and good low-temperature toughness, attributing to the introduce of reversed austenite (RA) [1,2,3,4]. The RA is formed by the intercritical annealing or tempering (termed as IA or IT) process, where the specimen was heated to α+γ two phase region for C and Mn partition [5,6]. The treating temperature and preservation duration will affect the stability of RA [7,8], which can be applied to tailor the mechanical properties by triggering the transformation induced plasticity (TRIP) effect [9]. To obtain admirable product of tensile strength and total elongation, many new-type treatment processes for tailoring RA to induce the positive TRIP effect presented. Sadeghpour, et al. [10] proposed a new combinatorial processing route, low-temperature prior deformation and high-temperature annealing partitioning, to achieve an ultrafine-grained, multiphase microstructure and stable austenite in a MMS steel. A deformed and partitioned process was treated by Liu, et al. [11] to tailor the lamellar structure of austenite and martensite to realize high fracture toughness under the yield strength of 2 GPa. A combination of cold rolling and intercitical recrystallization annealing is often adopted to control the reversed austenite with different stabilities [12]. However, the studies on the process to tailor the MMS steel with high yield strength and good low-temperature toughness are rarely reported.
In MMS dual-phase steel, ferrite possesses high toughness and ductility [13] whereas RA contributes to good plasticity and toughness [14]. Furthermore, RA induced TRIP effect during deformation can significantly increase the working hardening capability [15], contributing to good synergy of strength and ductility. Unfortunately, both ferrite and RA are soft phases. Although the initial microstructure was fully martensite for low-carbon MMS [16], the supersaturated C atoms diffuse into RA during IT [17], leading to the formation of ferrite [18]. Compared to ferrite, RA is easier to deform at lower strength level, so MMS subjected to traditional IT or IA process has a low yield strength. For engineering structures, the good match between yield strength and low-temperature toughness shows more needs than the match between tensile strength and total elongation. Yield strength is ability to suppress deformation, while toughness is ability to inhibit crack propagation. Therefore, the MMS with low yield strength is limited in wide applications.
Many attempts have been utilized to increase the yield strength of MMS, among them the most crucial methods lie in the addition of microalloying elements and short-time partial austenitization (SPA) treatment [19,20]. Due to the affinity difference between alloying elements and C, i.e., Ti, Nb and V, the carbides would precipitate at different ranges of temperature, which is also affected by the solubility of alloying elements. Importantly, the temperature range of Mn partition is usually the optimal precipitation temperature range. With higher solubility in α-Fe, micro-alloyed V tends to precipitate with C at lower temperature compared with Ti and Nb. The carbides formed at low temperature have small size and then possess the considerable strengthening effect [21,22]. Unfortunately, the ripening rate is higher of VC compared to TiC and NbC. Molybdenum is an element that not only promotes the precipitation of MC phase, but also inhibits the ripening rate. Meanwhile, Mo could also increase additional strengthening effect. Therefore, the coupling addition of microalloying element and Mo is the development trend of MMS. Alternatively, the SPA treatment is another effective route to strengthen MMS by grain refinement and the introduce of hard secondary martensite (SM). Although many efforts have been made, the mechanism of the SPA process has been seldomly investigated in micro-alloyed MMS. Therefore, in this work, 0.22C-5.24Mn steel micro-alloyed by 0.26Mo and 0.15V was designed. The SPA process was applied for the steel, and the phase transformation mechanism and strengthening contributions were analyzed.
2. Experimental materials and procedure
The nominal composition of the studied steel is Fe-0.22C-0.31Si-5.24Mn-0.26Mo-0.15V-0.026Ti (wt.%). The steel was smelted in a 50 kg vacuum induction furnace. After casting, the steel was forged into a billet with cross section dimensions of 150 mm and 60 mm. The steel was rolled from 60 mm into a final thickness of 20 mm by several passes, with air cooling to ambient temperature. Subsequently, the hot-rolled steel was subjected to a multi-step heat treatment, as shown in Figure 1. The steel was reheated to 650 °C for triggering the RA transformation, as well as the avoidance the cementite appearance. The heat preservation time was about 6 h for adequate Mn partition. The SPA process was performed at 750 °C with total time of 20 and 40 mins in furnace (namely, SPA20 and SPA 40) after 650 °C IT (referred as IT650), respectively, subsequent with water cooling to room temperature. In order to eliminate quenching stress, a low-temperature process of 200 °C for 40 min was performed.
Standard round tensile specimens with the gauge length of 50 mm, diameter of 10 mm and total length of 110 mm were prepared from steels along the rolling direction according to our national standard: GB∕T228.1-2021. These specimens were performed a strain rate of 0.5 mm/min at room temperature using WE-300 hydraulic tensile testing machine for mechanic properties. Charpy V-notch (CVN) specimens with 10 mm × 10 mm × 55 mm were also prepared along the rolling direction and performed at JBN-300B impact machine at -20 °C. There are two parallel samples for tensile properties, while the low-temperature impact energies were determined by three parallel samples.
Specimens were conducted by FEI Quanta 650 field emission scanning electron microscopy (SEM) for observing microstructure after etched in a solution of 4 % nital. The OXFORD NordlysNano detector was used for electron backscattered diffraction (EBSD) examination, with the step size of 0.05 μm. Slices with 300 μm thickness were cut, and machined to 50 μm thickness, which were subjected to twin-jet electrolytic polishing under a constant current of 30 mA. The prepared samples were observed by FEI TECNAI G2 20 transmission electron microscopy (TEM) with 200 kV voltage. Co-Kα target was used for X-ray diffraction to detect matrix phases after the samples remove the surface residual stress. The scanning step size was 0.02 ° and the scanning speed was 76.8 °/min. The volume fractions of phases were estimated by the following equation [20]:
where, Iα and Iγ are the diffraction peaks of α-Fe and γ-Fe.
3. Results
3.1. Microstructure characterization
Figure 2 shows the SEM microstructure characterization of samples in different stages. The microstructure of IT650 was consisted of tempered martensite or ferrite and RA. Considering the partition time of 6 h, the carbon atoms diffused from martensite into RA, so the tempered martensite is so-called ferrite. After subject to SPA process, microstructure contained RA, ferrite and secondary martensite (SM), where the block structure was SM, the lath-like structure was ferrite, and the corrosion hole was RA. The opinion that corrosion hole was RA sees our previous reports [6,17].
Further microstructure by EBSD shows that the microstructure after subjected to IT at 650 °C possessed a mixed microstructure of ferrite and RA, as shown in Figure 3. The RA was mainly distributed among martensite lath, and martensite sub-structure boundaries. The microstructure fits well with the result in Figure 2a. The content of RA was about 25.1% tested by EBSD.
TEM characterization shows that the mean RA width was about 137 nm, while the mean martensite lath width was about 500 nm (Figure 4a). The mean RA width was about 27.4% of the mean martensite lath. Figure 4b presents the Kurdjumov–Sachs orientation relationship between martensite lath and RA [6,7]. Some stacking faults appeared in RA lath. Furthermore, plenty of dispersed particles were observed and many of them are disc-like. Interestingly, some (V, Mo)C particles located in the RA/ferrite interface boundary, pinning the migrating velocity of γ/α interface [23].
As shown in Figure 5, the estimated content of RA was about 30.0%, 25.9% and 15.6% for IT650, SPA20 and SPA40, respectively. The result showed that part of the RA of IT650 transformed in to martensite. Limited by the measurement accuracy of EBSD, the RA content detected by XRD was used for the subsequent strengthening mechanism analysis. Furthermore, the width of diffraction peaks of α-Fe and γ-Fe increased after subjected to SPA treatment, indicating that the higher dislocation density in austenite and martensite [24]. Another phenomenon located in that the diffraction peaks of γ-Fe shifted toward right, implying the lower carbon content in RA [1].
The EBSD characterization of SPA20 and SPA40 are listed in Figure 6. Limited by the poor calibration rate of hard martensite with high-density dislocations, RA was almost not detected. According to the difference between ferrite and fresh martensite, the peak-differentiating way was used to divide the microstructure into ferrite and SM [25,26]. According to the curves of peak1 (SM) and peak2 (ferrite), the estimated content of ferrite was 53.8% and 53.6% for SPA20 and SPA40, while the content of SM was 20.3% and 33.8%, respectively.
TEM images shows that the microstructure was a mixed complex-phase structure after subjected to SPA process (Figure 7). The microstructure of three-layer microstructures were obtained: ferrite (out layer), SM (interlayer) and RA (inner layer). The content of them is consistent with the result by EBSD analysis (Table 1).
The content of both (V, Mo)C and cementite varying with temperature was calculated by Thermo-Calc with TCFE10.0 database (Figure 8). The completely dissolved temperature of cementite is 633 °C, while it is 1165 °C for (V, Mo)C precipitation. It was because of the addition of microalloying Ti that increases the completely dissolved temperature of (V, Mo)C precipitation. Actually, the addition of Ti almost precipitates with N at high temperature so that V carbides mainly precipitates at about 900 °C, where the slope of precipitation curve changes. Therefore, it could be deduced that the precipitation was mainly (V, Mo)C below 900 °C.
(V, Mo)C particles before and after subjected to SPA process were displayed in Figure 9. The result shows that the (V, Mo)C precipitates are disc-like some of them are parallel to the martensite and RA length direction, showing the parallel orientation relationship. Once subjected to SPA process, particle morphology of (V, Mo)C changed from the disc-like shape to near-spherical shape, which relying on the different orientation relationship between (V, Mo)C and ferrite and austenite. Furthermore, the number density did not varied, indicating that the (V, Mo)C almost precipitated when tempered at 650 °C. The particles, marked by blue line in Figure 9a, usually had large size due to the fast diffusivity at high temperature so that they provided limited strengthening contribution [27]. There are two types of (V, Mo)C particles after subjected to SPA process: Type 1 with bigger size precipitated during rolling and Type 2 with smaller size precipitated during IT and SPA process, named T1 and T2, respectively (Figure 9a and b).
3.2. Mechanical Property Characterization
The engineering stress and strain curves of SPA20 and SPA40 are showed in Figure 10a. The yield strength increased from 882 MPa to 1097 MPa with the total elongation shrinkage from 19.0% to 14.0% of SPA20 and SPA40 (Table 2). The tensile strength was 1341 MPa and 1521 MPa, respectively. The -20 °C impact energy were 36.7 and 33.3 J for SPA20 and SPA40, respectively (Figure 10b and Table 2). The results indicated that the yield strength was optimized by SPA process with little loss of ductility and toughness.
4. Discussion
4.1. Phase transformation mechanism analysis
Considering the high hardenability of 0.22C-5.24Mn steel, the initial microstructure was single martensite after rolling. During intercritical tempering at 650 °C for 6 h, the partition of both C and Mn appeared, implying the RA transformation presented. Both Figure 2a and Figure 3 showed that the RA was mainly displayed along martensite lath, and the morphology of RA was also lath-like. Although other martensite sub-structure boundaries could also be regard as the nucleation sites of RA, the amount of martensite lath boundaries is more than other sub-structure boundaries [6,7]. Therefore, the plane model of nucleation was used to simulate the kinetics of RA transformation. The mean martensite lath width was estimated about 500 nm, and the initial RA width was about 4 nm.
The schematics of the semi-diffusion couple applied for DICTRA simulation of IT650 is presented in Figure 11. As the transformation time increases, the α/γ interface migrated from lath boundaries toward martensite interior. Meanwhile, the carbon concentration gradient across the α/γ interface decreased and some spikes disappeared. Different from the distribution of C, the distribution of Mn is uneven, especially in γ-Fe. Although the phase transformation time increased to 21600 s, the distribution in γ-Fe is not uniform in γ-Fe. However, the distribution of Mn is uniform as the phase transformation time is above 3600 s. The results locate in the higher diffusion velocity of C than Mn, and locate in the higher diffusion velocity of α-Fe than γ-Fe. Furthermore, the α/γ interphase migrated in reverse when the phase transformation is above 3600 s. After intercritical tempering at 650 °C for 6 h, the microstructure was consisted of ferrite and RA, which was estimated about 30%.
After subjected to the SPA process, the RA content decreased from 30% to 25.9% and 15.6% of SPA20 and SPA40, respectively. The decrease of RA content showed that part of them transformed into martensite, which was directly observed in Figure 7. The SPA process was simulated by DICTRA with MOB6 database (Figure 12a). The simulated result of C and Mn concentration profile near the γ/α interface at 650 °C for 6 h was exhibited in blue line in Figure 12b and c, which is regarded as the initial conditions for the SPA process. γ/α two phase interface migrated into ferrite during SPA process, where C and Mn content in ferrite had little variation between SPA20 and SPA40. The content of C and Mn decreased from center to edge, potentially indicating that martensite transformation appeared at edge. This was consistent with the TEM observation that RA was surrounded by SM. The Ms temperature was estimated according to the empirical formula [28]:
where C, Mn and Si is their concentration in RA, wt.%. The schematic diagram of phase transformation is showed in Figure 1. Herein, the three-layer microstructures were obtained: ferrite (out layer), SM (interlayer) and RA (inner layer).
Ms (°C)=539-423C-30.4Mn-7.5Si
In view of the optimal precipitation temperature range, all the (V, Mo)C particles precipitated during IT at 650 °C. Meanwhile, the mean particle size increased to 17.2 nm, showing the ripiening appeared. Actually, the ripening rate is high for single VC precipitaiton [29]. However, the ripiening rate was relatively low because Mo was the effective element to inhibit coarsening in view of the larger atom size and lower diffusion veloctiy. The disc-like (V, Mo)C formed basing on the Baker-Nutting orientation relationship in matrix during IT [30], while few disc-like particles were found at 750 °C for 20 and 40 mins, implying that part of them dissolved during 750 °C preservation. For small particle, it was at the ends of disc that begin to dissolve due to the specific interface energy varying with temperature [29].
4.2. Strengthening contribution analysis
Consisted by a mixed microstructure of ferrite, RA and SM, the strengthening contribution calculation depends on the composite law, where both the content and single yield strength of ferrite, RA and SM are considered. The yield strength of the studied steel obeyed the composite law of multiphase microstructure according to the following equation [6,31]:
where, is the volume fraction of RA, ferrite and SM. is the yield strength of RA, ferrite and SM.
- (V, Mo)C precipitation strengthening
The equilibrium content of (V, Mo)C particles is 0.00227 at 650 °C. There was no obvious coarsening of (V, Mo)C particles during SPA process so that the mean size of 18 nm is used for the precipitation strengthening. (V, Mo)C precipitation strengthening occurs by Ashby-Orowan dislocation looping mechanism, and it was calculated using the classical Ashby-Orowan equation expressed as [32,33]:
where, M and v are the Taylor factor and Poisson’s ratio, taken as 2.75 and 0.293. G is the shear modulus for low carbon steel. b is Burger’s vector taken as 0.2482 nm. Herein, it was assumed that (V, Mo)C particles were uniformly distributed in matrix. 𝑙 is the mean nearest-neighbor particle spacing [33]:
where, f and d are the volume fraction and size of (V, Mo)C precipitation particles. The calculated precipitation strengthening is about 108 MPa. The (V, Mo)C precipitation strengthening in RA, ferrite and SM are the same in hypothesis.
- Dislocation density and strengthening in ferrite and SM
The dislocation density in ferrite is relatively low that it is hard to be accurately estimated by the Williamson–Hall method using the XRD profiles. The dislocation density in ferrite was estimated about 1×10¹⁴ /m2 [34]. The Williamson–Hall method usually overestimates the dislocation density, so Ungar et al. [35] develops a modified Williamson–Hall (MWH) method by accounting for the influence of the strain anisotropy. The dislocation density according to the MWH is as following:
where, D is the crystallite size, K is the magnitude of the diffraction vector, b is the magnitude of the Burgers vector and ρ is the dislocation density, is the dislocation contrast factor, and M is a dimensionless constant. The dislocation density strongly depends on the slope of curves between ΔK and KC1/2, in Figure 13. Please refer to the literatures for the detailed calculation steps [24,36,37]. The calculated dislocation density of SPA20 and SPA40 is shown in Table 3.
The dislocation strengthening was estimated by the following equation [31]:
where M is the Taylor factor (4), α is the geometrical constant (0.25), G is the shear modulus of the material (80 GPa), b is the Burgers vector (0.2482 nm), is the dislocation density in ferrite or SM. The calculated dislocation strengthening is displayed in Table S2.
- Yield strength of RA
The C content in RA is hard to be accurately detected by TEM-EDS. The empirical formula of C concentration in RA is as following [38]:
where is the lattice constant of RA, and are C and Mn concentrations in RA. The calculated C content in RA is exhibited in Table 4, where Si, Mn and Mo are tested by TEM-EDS.
The yield strength of RA is according to the following equation [6]:
where, , and are the concentrations in RA. is the RA size in mm (300 and 185 nm of SPA20 and SPA40, respectively). is the (V, Mo)C precipitation strengthening in RA. The yield strength of RA in SPA20 and SPA40 were 362 and 355 MPa, respectively.
- Yield strength of ferrite
The yield strength of ferrite is determined by the following equation:
where is the lattice friction force, about 50 MPa. , , , and are the solution, grain boundary, dislocation and precipitation strengthening [39,40]
where, Xi is the element content of i in ferrite, wt.%.
where, ky is the Hall-Petch parameter and D is the effective grain size [31].
The content of element i in ferrite and effective grain size (EGS) are displayed in Table 5. And the strengthening components of ferrite are shown in Table 6.
- Yield strength of SM
The strength of martensite is calculated in the same way as that of ferrite. The content of element i in SM and effective grain size (EGS) are shown in Table 7. And, the strengthening components of SM are shown in Table 8.
- The calculated yield strength of the studied steel
According to the equation (3), the yield strength of the studied steel obeyed the composite law of multiphase microstructure. The calculated result sees Table 9.
The yield strength was 882 MPa and 1097 MPa of SPA20 and SPA40, respectively (Table 2). As the soaking time increased from 20 to 40 mins, the yield and tensile strength increased by 215 and 180 MPa, while -20 °C impact energy, total elongation and volume fraction of RA decreased by 3.4 J, 5.0% and 10.3%, respectively. The results show that RA had more important effect on strength than toughness in such high yield strength steel, which did not agree with the report by Chen, et al [41]. It could be reasonable inferred that RA was so stable that the TRIP effect was hard to be induced during impact tests, leading to the initial crack nucleation at SM/ferrite boundary [6].
The strengthening increment of ferrite, RA and SM were displayed in Figure 14. The calculated yield strength of RA, ferrite and SM were 355, 958 and 1598 MPa in SPA40, while they were 362, 939 and 1456 MPa in SPA20, respectively (Figure 14a). The high yield strength of ferrite was due to the ultrafine grain size transformed from martensite. Moreover, RA, ferrite and SM provided the yield strength of 94, 505 and 296 MPa of SPA20, and 55, 484 and 540 MPa of SPA40, respectively (Figure 14b). Although both RA content decrease and SM content increase increased the yield strength about 215 MPa, they damaged total elongation about 5.0%. However, the RA was stable that the TRIP effect was hard to induce, leading to the little difference of -20 °C impact energy.
5. Conclusions
The short-time partial austenitization (SPA) process and V-microalloying were introduced to optimize the phase transformation and final mechanical properties of 0.2C-5.0Mn steel. The main conclusions were as following:
- The initial microstructure was a dual-phase structure containing ferrite and RA after intercritically tempered at 650 °C for 6 h, and the RA content was about 30%. Once subject to SPA process, the microstructure was consisted of ferrite, RA and SM and the content of them were 53.8%, 25.9% and 20.3 for SPA20, and 50.6%, 15.6% and 33.8% for SPA40.
- The mean (V, Mo)C particle size was about 17.2 nm of IT650, while the mean particle size was about 18.0 nm of SPA process. The morphology of (V, Mo)C particle was disc-like, while it tended to be near-spherical morphology after subjected to the SPA process.
- The yield strength increased by about 215 MPa from SPA20 to SPA40 of 1097 MPa, while there was acceptable shrinkage in total elongation from 19.0% to 14.0 % and in -20 °C impact energy from 36.7 J to 33.3 J.
- Protected by SM, the stable RA displayed the positive effect on yield strength, while it showed little effect on ductility and toughness. The ultrafine-grain ferrite and SM, formed during SPA process, jointly strengthened above 1000 MPa for SPA40. The (V, Mo)C provided the precipitation strengthening increment about 108 MPa.
Acknowledgements
The work was financially supported by the National Key R&D Program of China (No. 2023YFB3711701).
References
- B. He, B. Hu, H. Yen, G. Cheng, Z. Wang, H. Luo, M. Huang, High dislocation density–induced large ductility in deformed and partitioned steels, Science 357(6355) (2017) 1029-1032. [CrossRef]
- F. Yang, H. Luo, C. Hu, E. Pu, H. Dong, Effects of intercritical annealing process on microstructures and tensile properties of cold-rolled 7Mn steel, Materials Science and Engineering: A 685 (2017) 115-122. [CrossRef]
- Y. Wang, M. Zhang, Q. Cen, W. Wang, X. Sun, A novel process combining thermal deformation and intercritical annealing to enhance mechanical properties and avoid Lüders strain of Fe-0.2 C–7Mn TRIP steel, Materials Science and Engineering: A 839 (2022) 142849. [CrossRef]
- Q. Guo, H.W. Yen, H. Luo, S.P. Ringer, On the mechanism of Mn partitioning during intercritical annealing in medium Mn steels, Acta Materialia 225 (2022) 117601. [CrossRef]
- G. Bansal, D. Madhukar, A. Chandan, K. Ashok, G. Mandal, V. Srivastava, On the intercritical annealing parameters and ensuing mechanical properties of low-carbon medium-Mn steel, Materials Science and Engineering: A 733 (2018) 246-256. [CrossRef]
- D. Zhang, G. Liu, K. Zhang, X. Sun, X. Liang, Q. Yong, Effect of Nb microalloying on microstructure evolution and mechanical properties in low carbon medium manganese steel, Materials Science and Engineering: A 824 (2021) 141813. [CrossRef]
- H. Luo, J. Shi, C. Wang, W. Cao, X. Sun, H. Dong, Experimental and numerical analysis on formation of stable austenite during the intercritical annealing of 5Mn steel, Acta Materialia 59(10) (2011) 4002-4014. [CrossRef]
- Y. Zhang, L. Wang, K.O. Findley, J.G. Speer, Influence of temperature and grain size on austenite stability in medium manganese steels, Metallurgical and Materials Transactions A 48 (2017) 2140-2149. [CrossRef]
- M.I. Latypov, S. Shin, B.C. De Cooman, H.S. Kim, Micromechanical finite element analysis of strain partitioning in multiphase medium manganese TWIP+ TRIP steel, Acta Materialia 108 (2016) 219-228. [CrossRef]
- S. Sadeghpour, M.C. Somani, J. Kömi, L.P. Karjalainen, A new combinatorial processing route to achieve an ultrafine-grained, multiphase microstructure in a medium Mn steel, Journal of Materials Research and Technology 15 (2021) 3426-3446. [CrossRef]
- L. Liu, Q. Yu, Z. Wang, J. Ell, M. Huang, R.O. Ritchie, Making ultrastrong steel tough by grain-boundary delamination, Science 368(6497) (2020) 1347-1352. [CrossRef]
- J. Zhang, Y. Xu, D. Han, Z. Tong, Improving yield strength and elongation combination by tailoring austenite characteristics and deformation mechanism in medium Mn steel, Scripta Materialia 218 (2022) 114790. [CrossRef]
- J. Hu, L. Du, M. Zang, S. Yin, Y. Wang, X. Qi, X. Gao, R. Misra, On the determining role of acicular ferrite in VN microalloyed steel in increasing strength-toughness combination, Materials Characterization 118 (2016) 446-453. [CrossRef]
- Q. Zhou, L. Qian, J. Tan, J. Meng, F. Zhang, Inconsistent effects of mechanical stability of retained austenite on ductility and toughness of transformation-induced plasticity steels, Materials Science and Engineering: A 578 (2013) 370-376. [CrossRef]
- R. Ding, Z. Dai, M. Huang, Z. Yang, C. Zhang, H. Chen, Effect of pre-existed austenite on austenite reversion and mechanical behavior of an Fe-0.2 C-8Mn-2Al medium Mn steel, Acta Materialia 147 (2018) 59-69. [CrossRef]
- Y.G. Yang, Z.L. Mi, M. Xu, Q. Xiu, J. Li, H.T. Jiang, Impact of intercritical annealing temperature and strain state on mechanical stability of retained austenite in medium Mn steel, Materials Science and Engineering: A 725 (2018) 389-397. [CrossRef]
- G. Liu, B. Li, S. Xu, S. Tong, X. Wang, X. Liang, X. Sun, Effect of intercritical annealing temperature on multiphase microstructure evolution in ultra-low carbon medium manganese steel, Materials Characterization 173 (2021) 110920. [CrossRef]
- N. Nakada, K. Mizutani, T. Tsuchiyama, S. Takaki, Difference in transformation behavior between ferrite and austenite formations in medium manganese steel, Acta materialia 65 (2014) 251-258. [CrossRef]
- S. Liu, Z. Xiong, H. Guo, C. Shang, R. Misra, The significance of multi-step partitioning: Processing-structure-property relationship in governing high strength-high ductility combination in medium-manganese steels, Acta materialia 124 (2017) 159-172. [CrossRef]
- Y. Zou, Y. Xu, Z. Hu, X. Gu, F. Peng, X. Tan, S. Chen, D. Han, R. Misra, G. Wang, Austenite stability and its effect on the toughness of a high strength ultra-low carbon medium manganese steel plate, Materials Science and Engineering: A 675 (2016) 153-163. [CrossRef]
- Y. Han, J. Shi, L. Xu, W. Cao, H. Dong, TiC precipitation induced effect on microstructure and mechanical properties in low carbon medium manganese steel, Materials Science and Engineering: A 530 (2011) 643-651. [CrossRef]
- G. Tirumalasetty, M. Van Huis, C. Fang, Q. Xu, F. Tichelaar, D. Hanlon, J. Sietsma, H. Zandbergen, Characterization of NbC and (Nb, Ti) N nanoprecipitates in TRIP assisted multiphase steels, Acta Materialia 59(19) (2011) 7406-7415. [CrossRef]
- R.S. Varanasi, B. Gault, D. Ponge, Effect of Nb micro-alloying on austenite nucleation and growth in a medium manganese steel during intercritical annealing, Acta Materialia 229 (2022) 117786. [CrossRef]
- F. HajyAkbary, J. Sietsma, A.J. Böttger, M.J. Santofimia, An improved X-ray diffraction analysis method to characterize dislocation density in lath martensitic structures, Materials Science and Engineering: A 639 (2015) 208-218. [CrossRef]
- Y. Wang, J. Hua, M. Kong, Y. Zeng, J. Liu, Z. Liu, Quantitative analysis of martensite and bainite microstructures using electron backscatter diffraction, Microscopy Research and Technique 79(9) (2016) 814-819. [CrossRef]
- X. Li, A. Ramazani, U. Prahl, W. Bleck, Quantification of complex-phase steel microstructure by using combined EBSD and EPMA measurements, Materials Characterization 142 (2018) 179-186. [CrossRef]
- S. Xu, X. Sun, X. Liang, J. Liu, Q. Yong, Effect of hot rolling deformation on microstructure and mechanical properties of a high-Ti wear-resistant steel, Acta Metall Sin 56(12) (2020) 1581-1591.
- D.M. Field, D.S. Baker, D.C. Van Aken, On the prediction of α-martensite temperatures in medium manganese steels, Metallurgical and Materials Transactions A 48 (2017) 2150-2163. [CrossRef]
- Q.L. Yong, Secondary Phases in Steels, Metallurgical Industry Press, Beijing, 2006.
- Z. Wang, Y. Zhang, G. Miyamoto, T. Furuhara, Formation of abnormal nodular ferrite with interphase precipitation in a vanadium microalloyed low carbon steel, Scripta Materialia 198 (2021) 113823. [CrossRef]
- G. Gao, B. Gao, X. Gui, J. Hu, J. He, Z. Tan, B. Bai, Correlation between microstructure and yield strength of as-quenched and Q&P steels with different carbon content (0.06–0.42 wt% C), Materials Science and Engineering: A 753 (2019) 1-10. [CrossRef]
- X. Ma, C. Miao, B. Langelier, S. Subramanian, Suppression of strain-induced precipitation of NbC by epitaxial growth of NbC on pre-existing TiN in Nb-Ti microalloyed steel, Materials & Design 132 (2017) 244-249. [CrossRef]
- W. Zhao, D. Zhou, S. Jiang, H. Wang, Y. Wu, X. Liu, X. Wang, Z. Lu, Ultrahigh stability and strong precipitation strengthening of nanosized NbC in alumina-forming austenitic stainless steels subjecting to long-term high-temperature exposure, Materials Science and Engineering: A 738 (2018) 295-307. [CrossRef]
- J. Yang, H. Bhadeshia, The dislocation density of acicular ferrite in steel welds, Welding Research Supplement 69 (1990) 305-307.
- T. Ungár, A. Borbély, The effect of dislocation contrast on x-ray line broadening: A new approach to line profile analysis, Applied Physics Letters 69(21) (1996) 3173-3175. [CrossRef]
- T. Ungár, I. Dragomir, Á. Révész, A. Borbély, The contrast factors of dislocations in cubic crystals: the dislocation model of strain anisotropy in practice, Journal of Applied Crystallography 32(5) (1999) 992-1002. [CrossRef]
- S. Takebayashi, T. Kunieda, N. Yoshinaga, K. Ushioda, S. Ogata, Comparison of the dislocation density in martensitic steels evaluated by some X-ray diffraction methods, ISIJ International 50(6) (2010) 875-882. [CrossRef]
- M. Santofimia, T. Nguyen-Minh, L. Zhao, R. Petrov, I. Sabirov, J. Sietsma, New low carbon Q&P steels containing film-like intercritical ferrite, Materials Science and Engineering: A 527(23) (2010) 6429-6439. [CrossRef]
- S. Morito, H. Yoshida, T. Maki, X. Huang, Effect of block size on the strength of lath martensite in low carbon steels, Materials Science and Engineering: A 438 (2006) 237-240. [CrossRef]
- K. Zhang, Z.D. Li, X.J. Sun, Q.L. Yong, J.W. Yang, Y.M. Li, P.L. Zhao, Development of Ti–V–Mo complex microalloyed hot-rolled 900-MPa-grade high-strength steel, Acta Metallurgica Sinica (English Letters) 28 (2015) 641-648.
- J. Chen, M. Lv, S. Tang, Z. Liu, G. Wang, Correlation between mechanical properties and retained austenite characteristics in a low-carbon medium manganese alloyed steel plate, Materials Characterization 106 (2015) 108-111. [CrossRef]
Figure 1.
Schematic diagram of hot rolling, multistep heat treatment process and phase transformation. (AC: air cooling; WC: water cooling; F: ferrite; RA: reversed austenite; SM: secondary martensite.).
Figure 1.
Schematic diagram of hot rolling, multistep heat treatment process and phase transformation. (AC: air cooling; WC: water cooling; F: ferrite; RA: reversed austenite; SM: secondary martensite.).
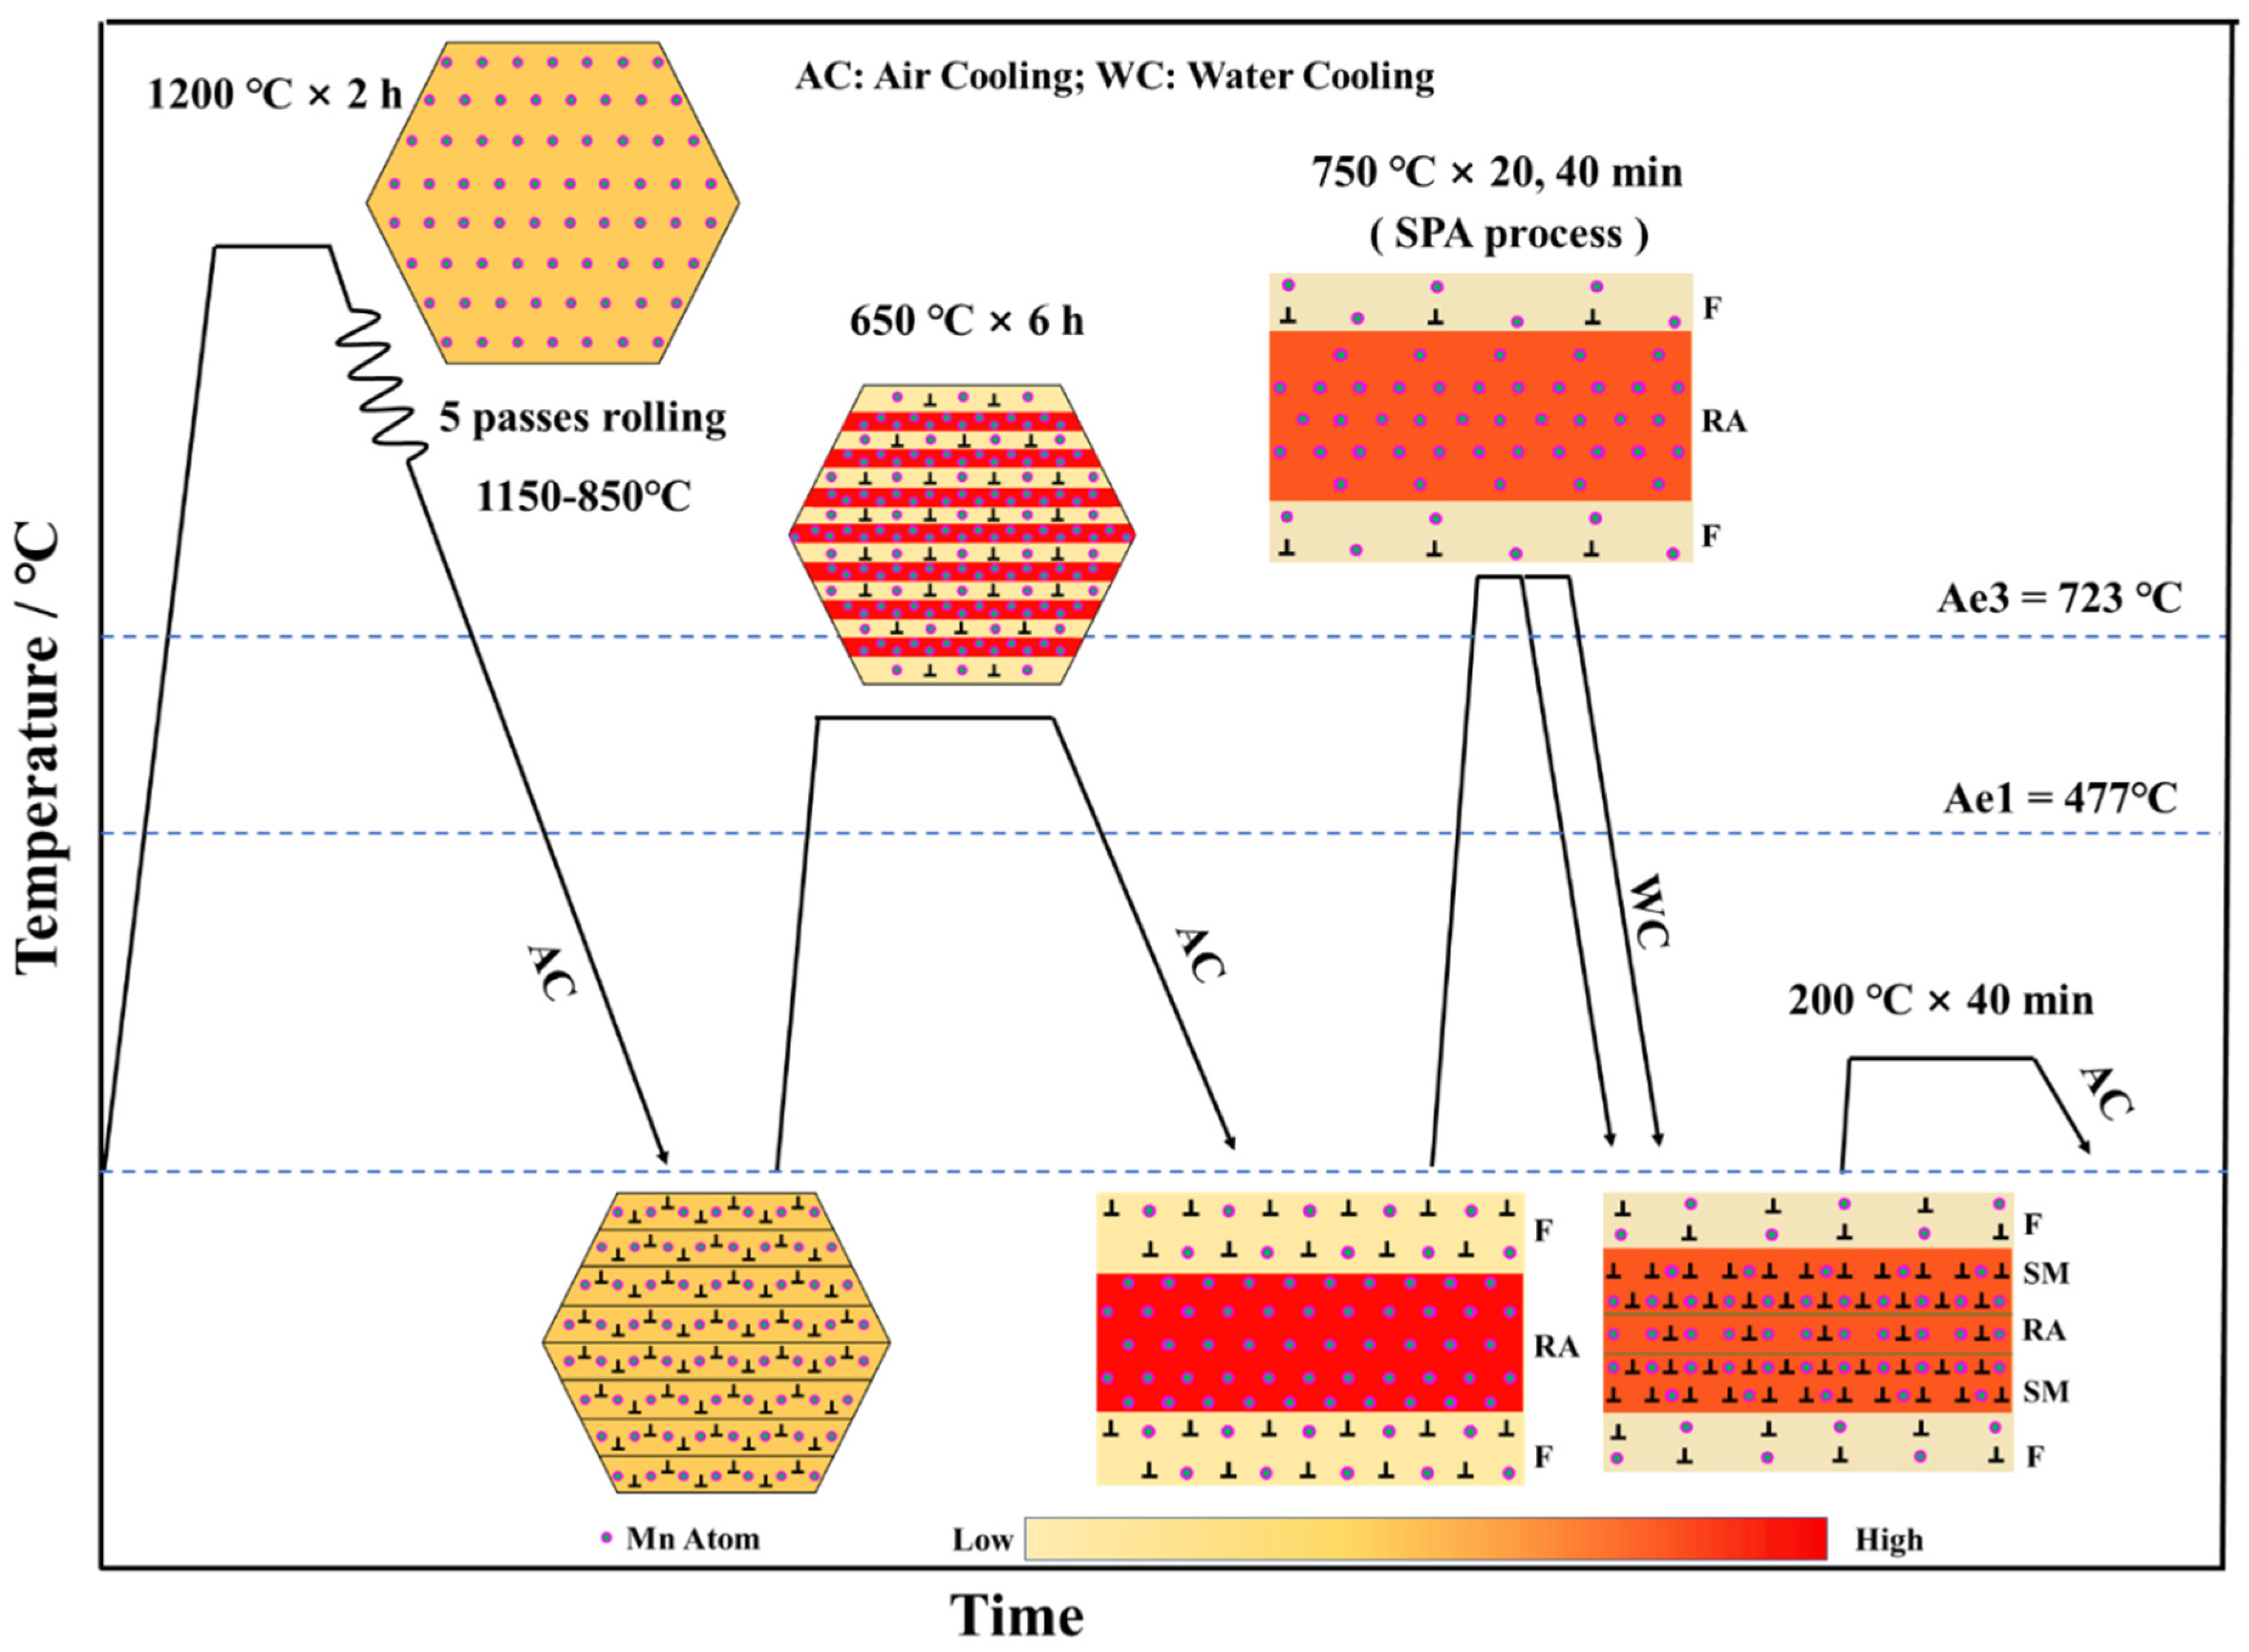
Figure 2.
SEM images: (a) IT650, (b) SPA20 and (c) SPA40.
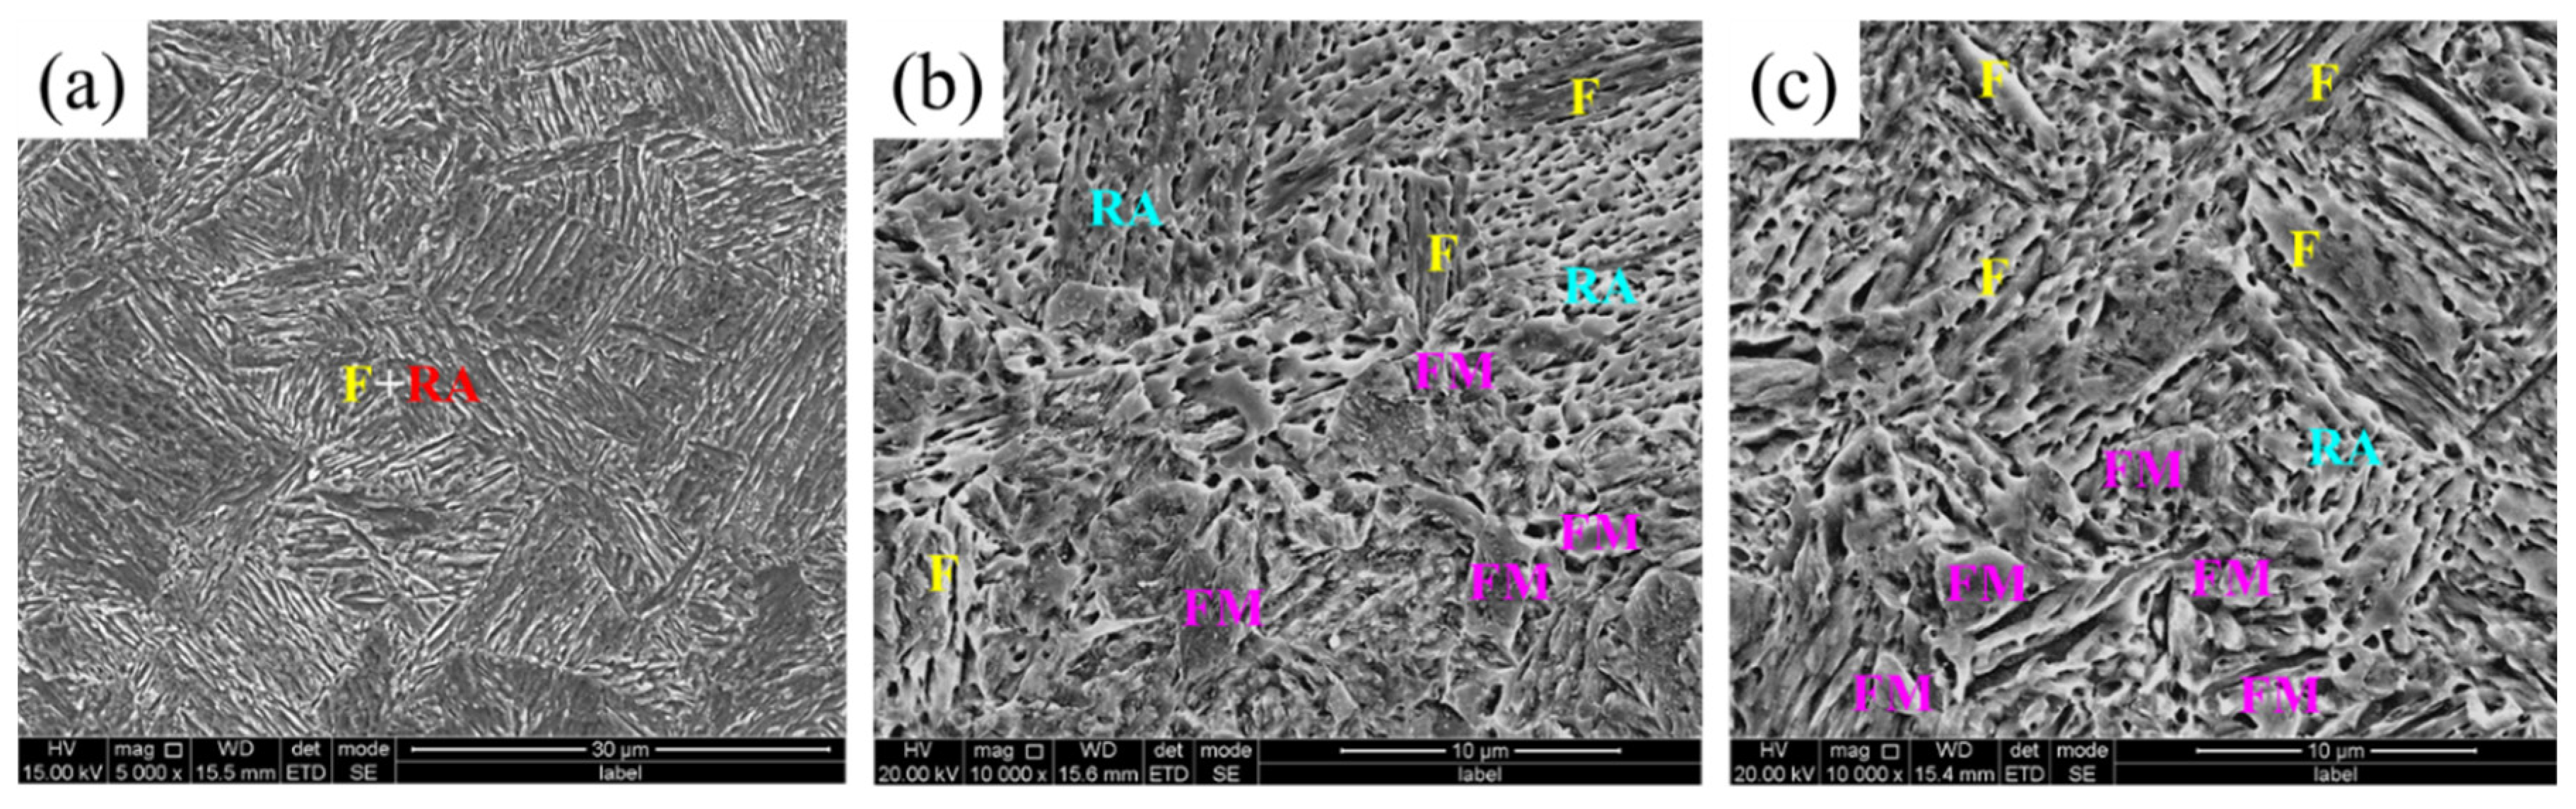
Figure 3.
EBSD images of IT650: (a) Band contrast image inserted by RA in red color; (b) Phase image.
Figure 3.
EBSD images of IT650: (a) Band contrast image inserted by RA in red color; (b) Phase image.
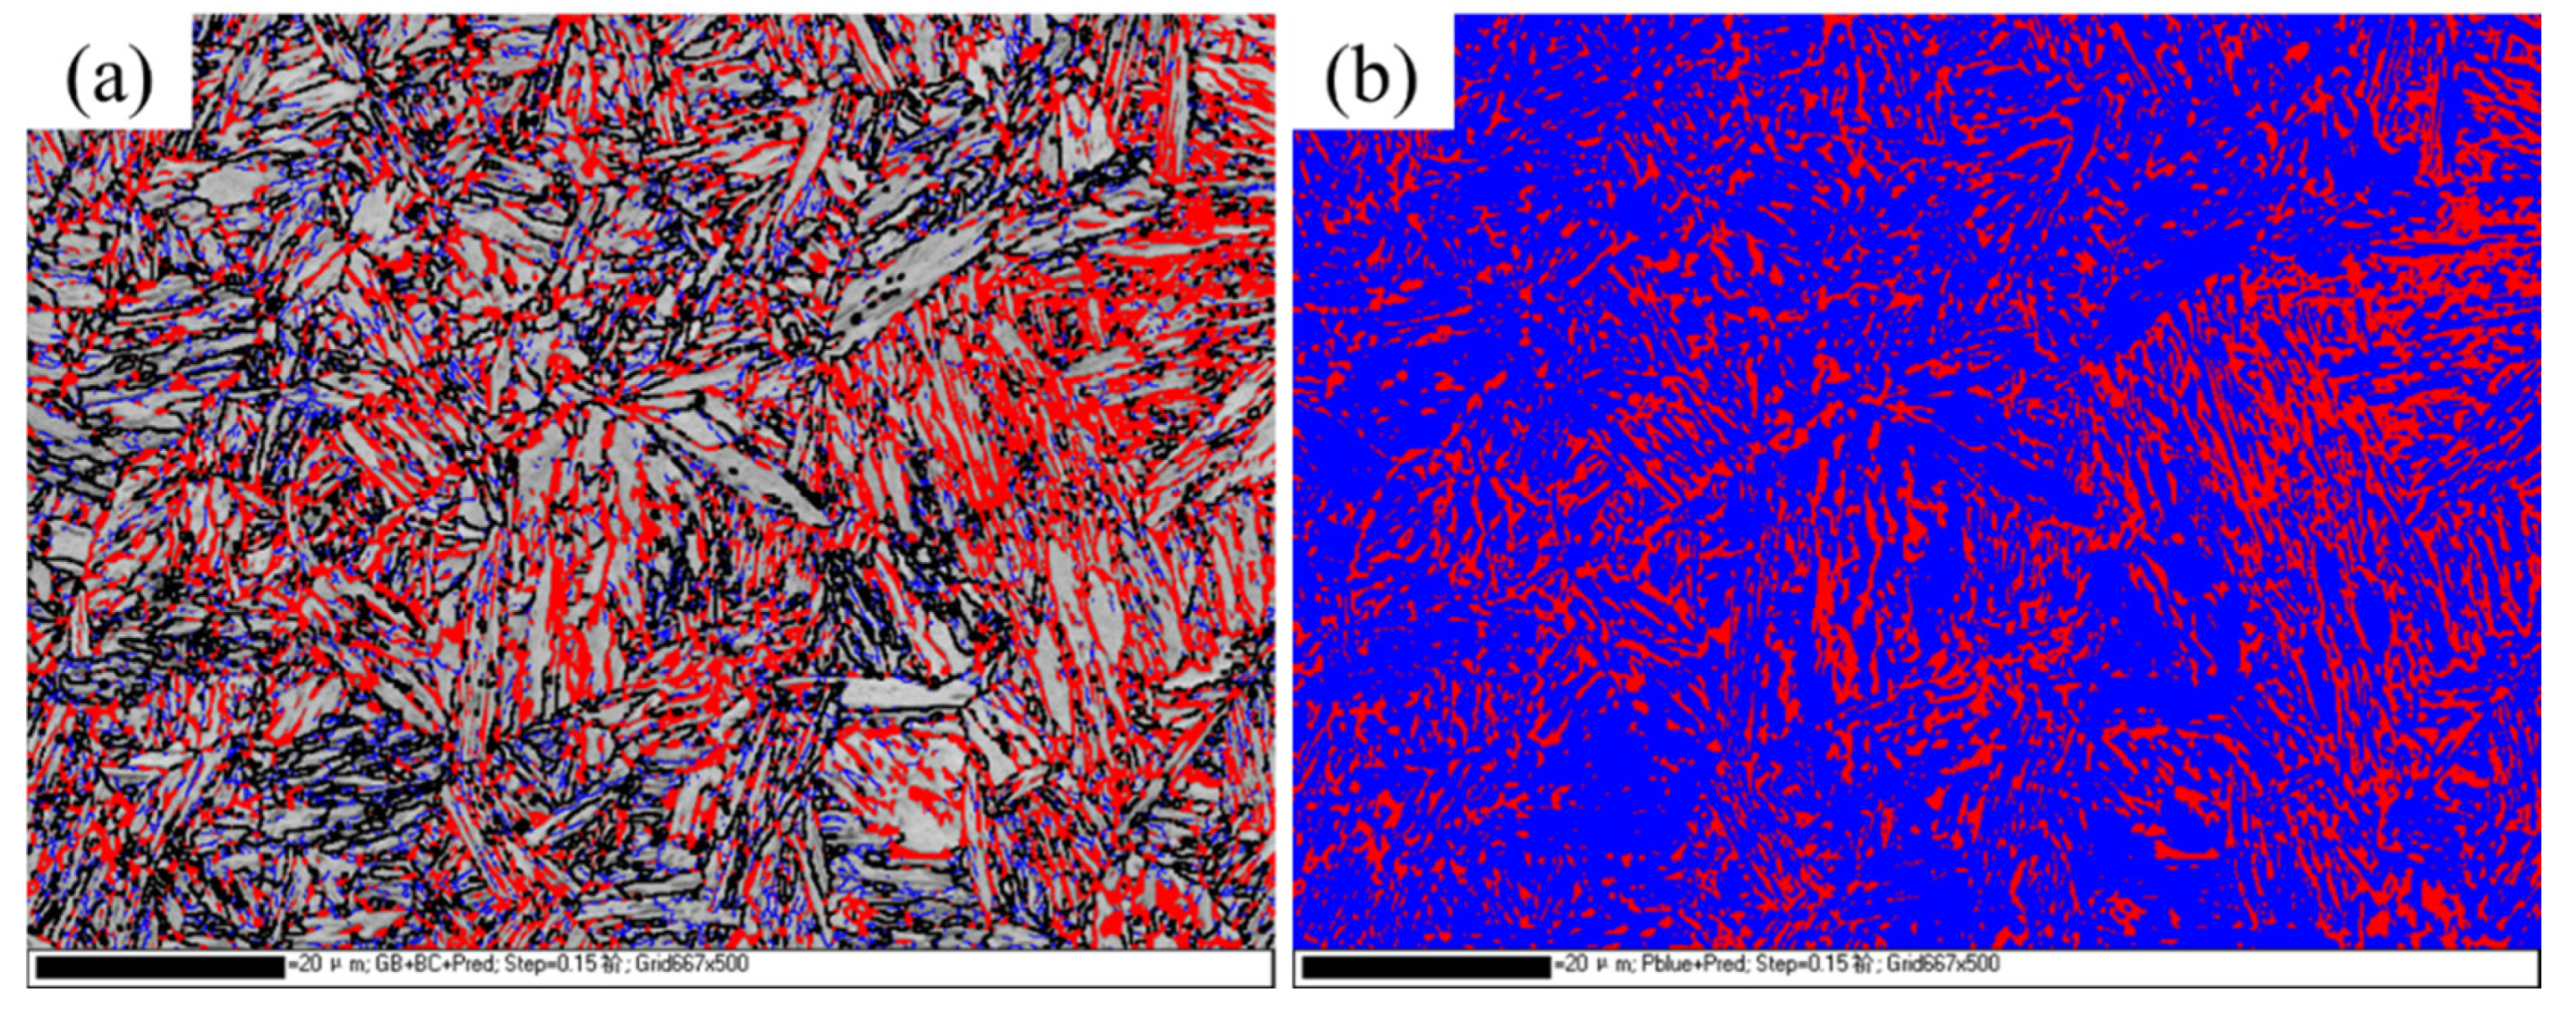
Figure 4.
TEM images of IT650: (a) bright field image; (b) selected area electron diffraction pattern showing Kurdjumov–Sachs orientation relationship.
Figure 4.
TEM images of IT650: (a) bright field image; (b) selected area electron diffraction pattern showing Kurdjumov–Sachs orientation relationship.
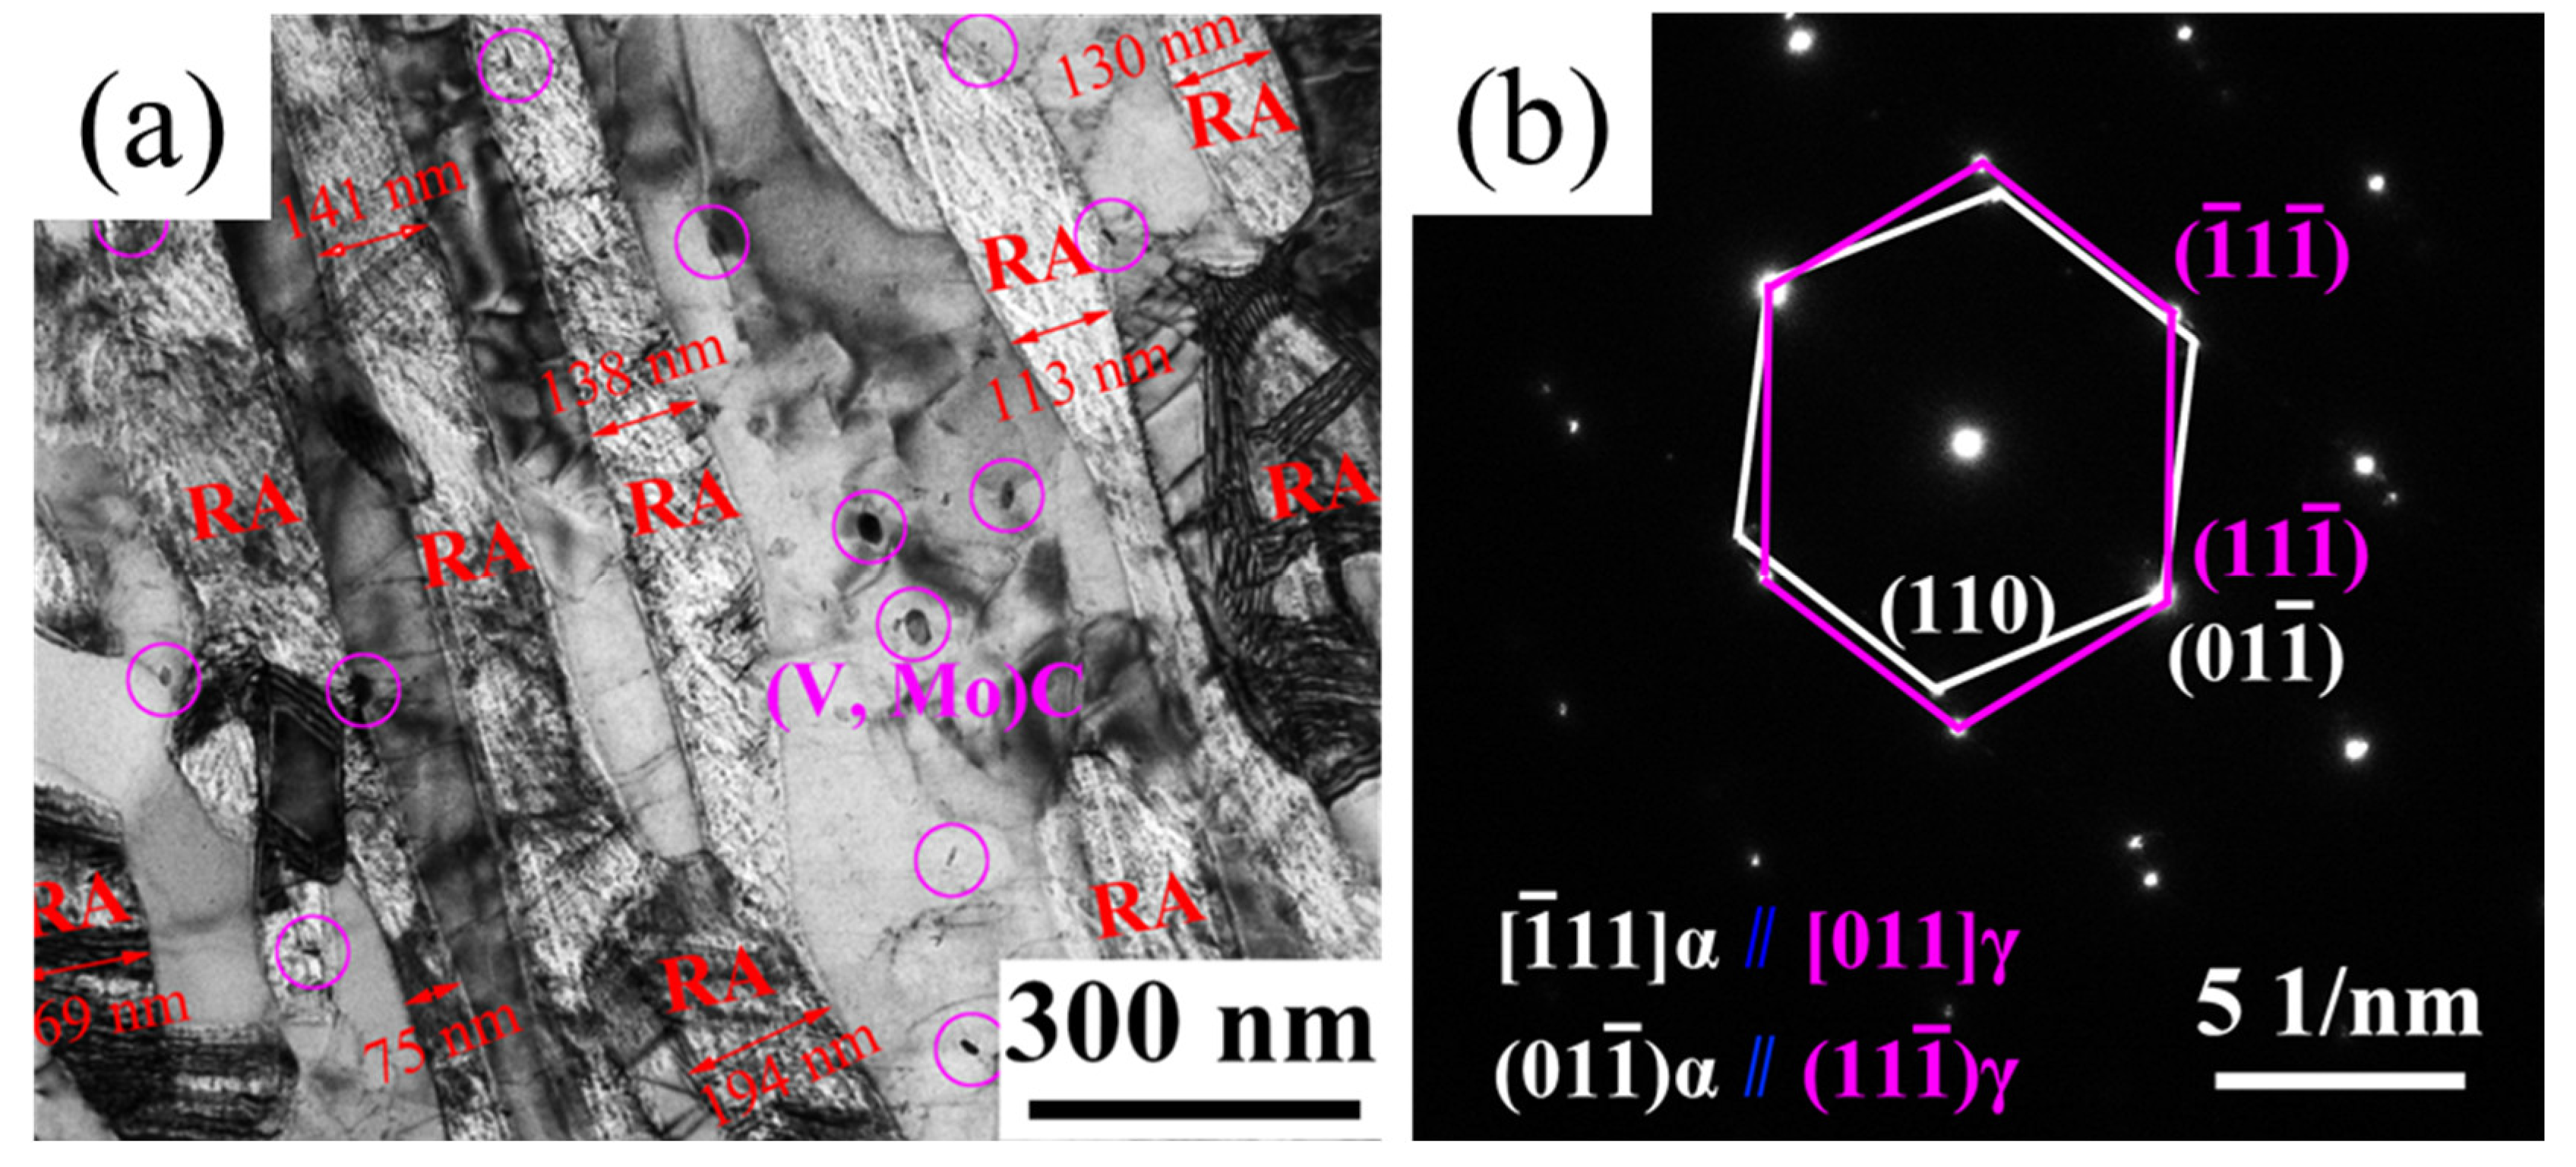
Figure 5.
XRD line spectra of samples at different stages.
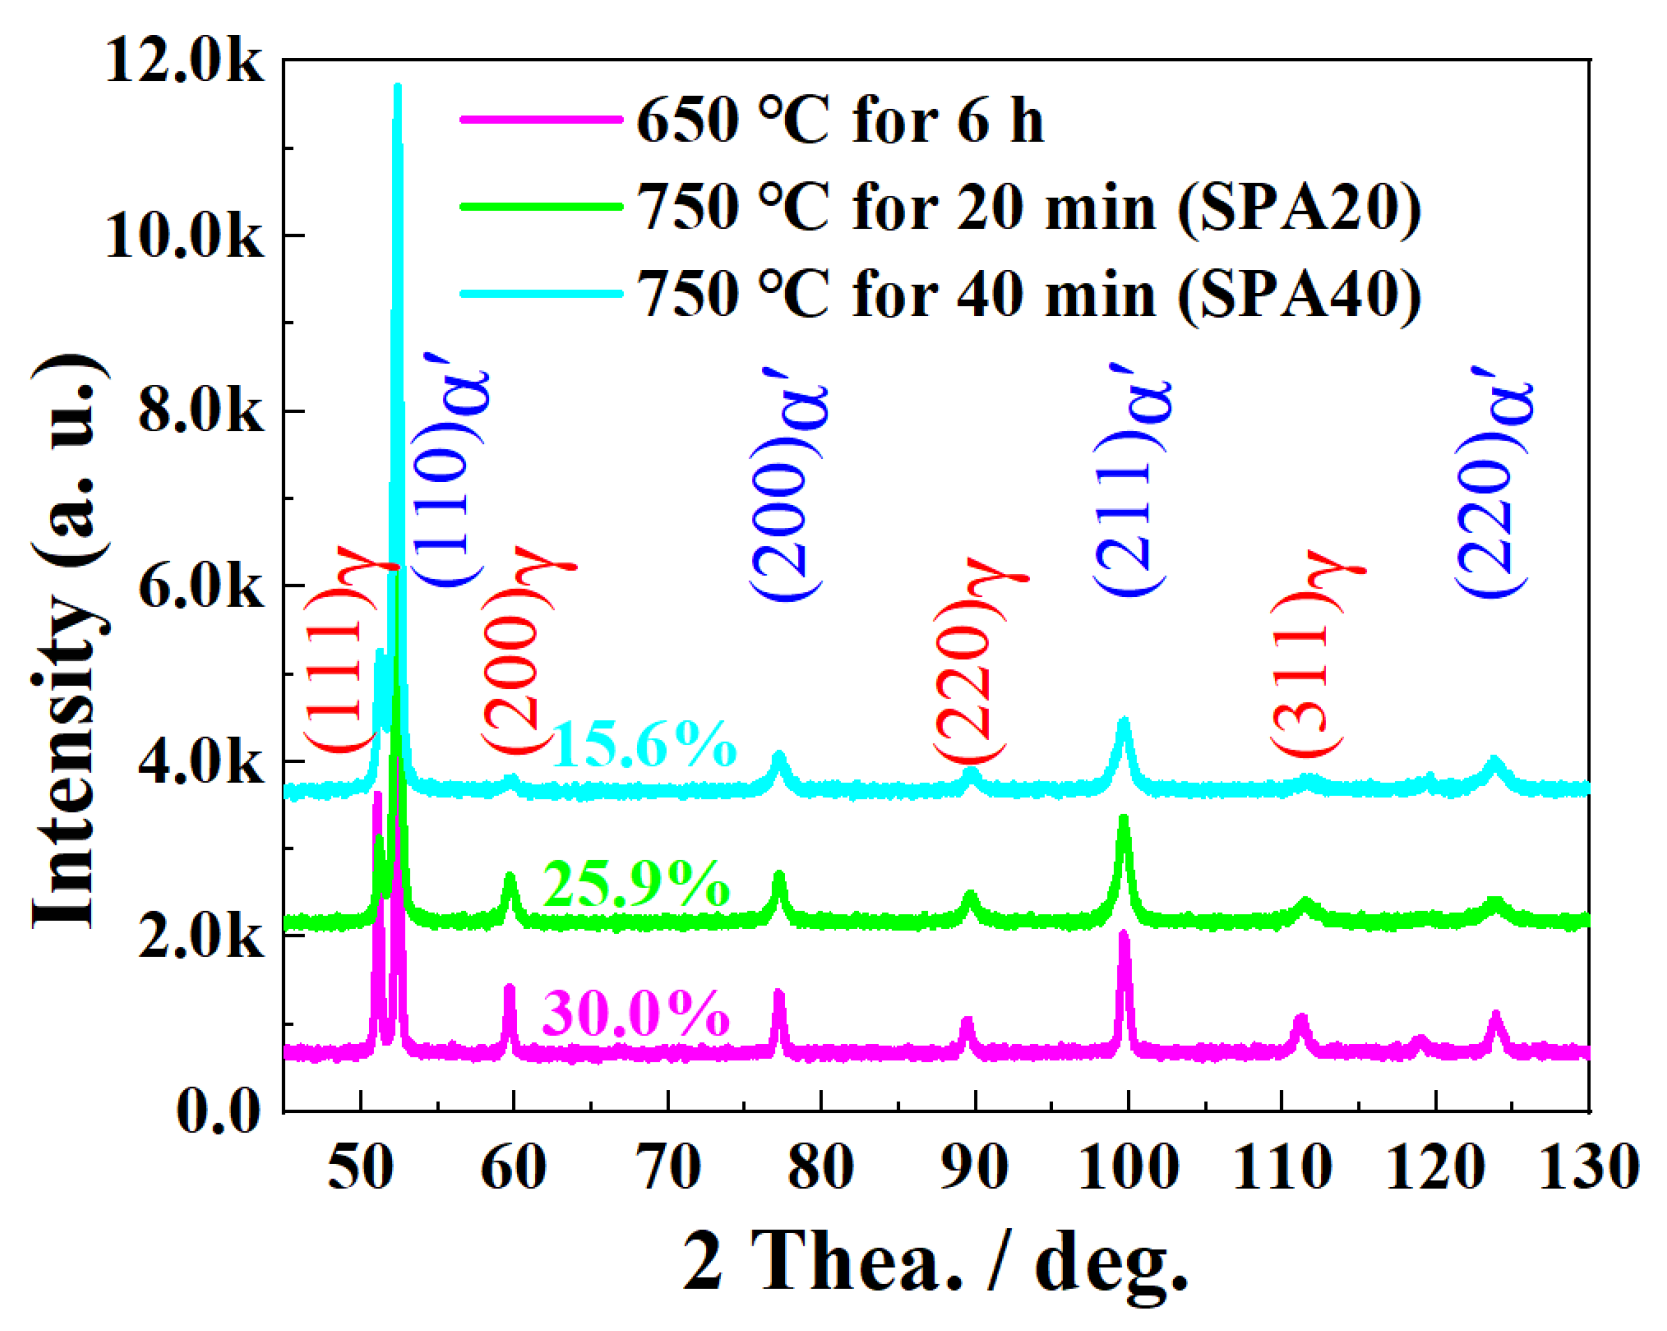
Figure 6.
EBSD images: (a) SPA20; (b) SPA40; (c) and (d) The band contrast peak of SPA20 and SPA40 was the divided into two peaks of F and SM.
Figure 6.
EBSD images: (a) SPA20; (b) SPA40; (c) and (d) The band contrast peak of SPA20 and SPA40 was the divided into two peaks of F and SM.
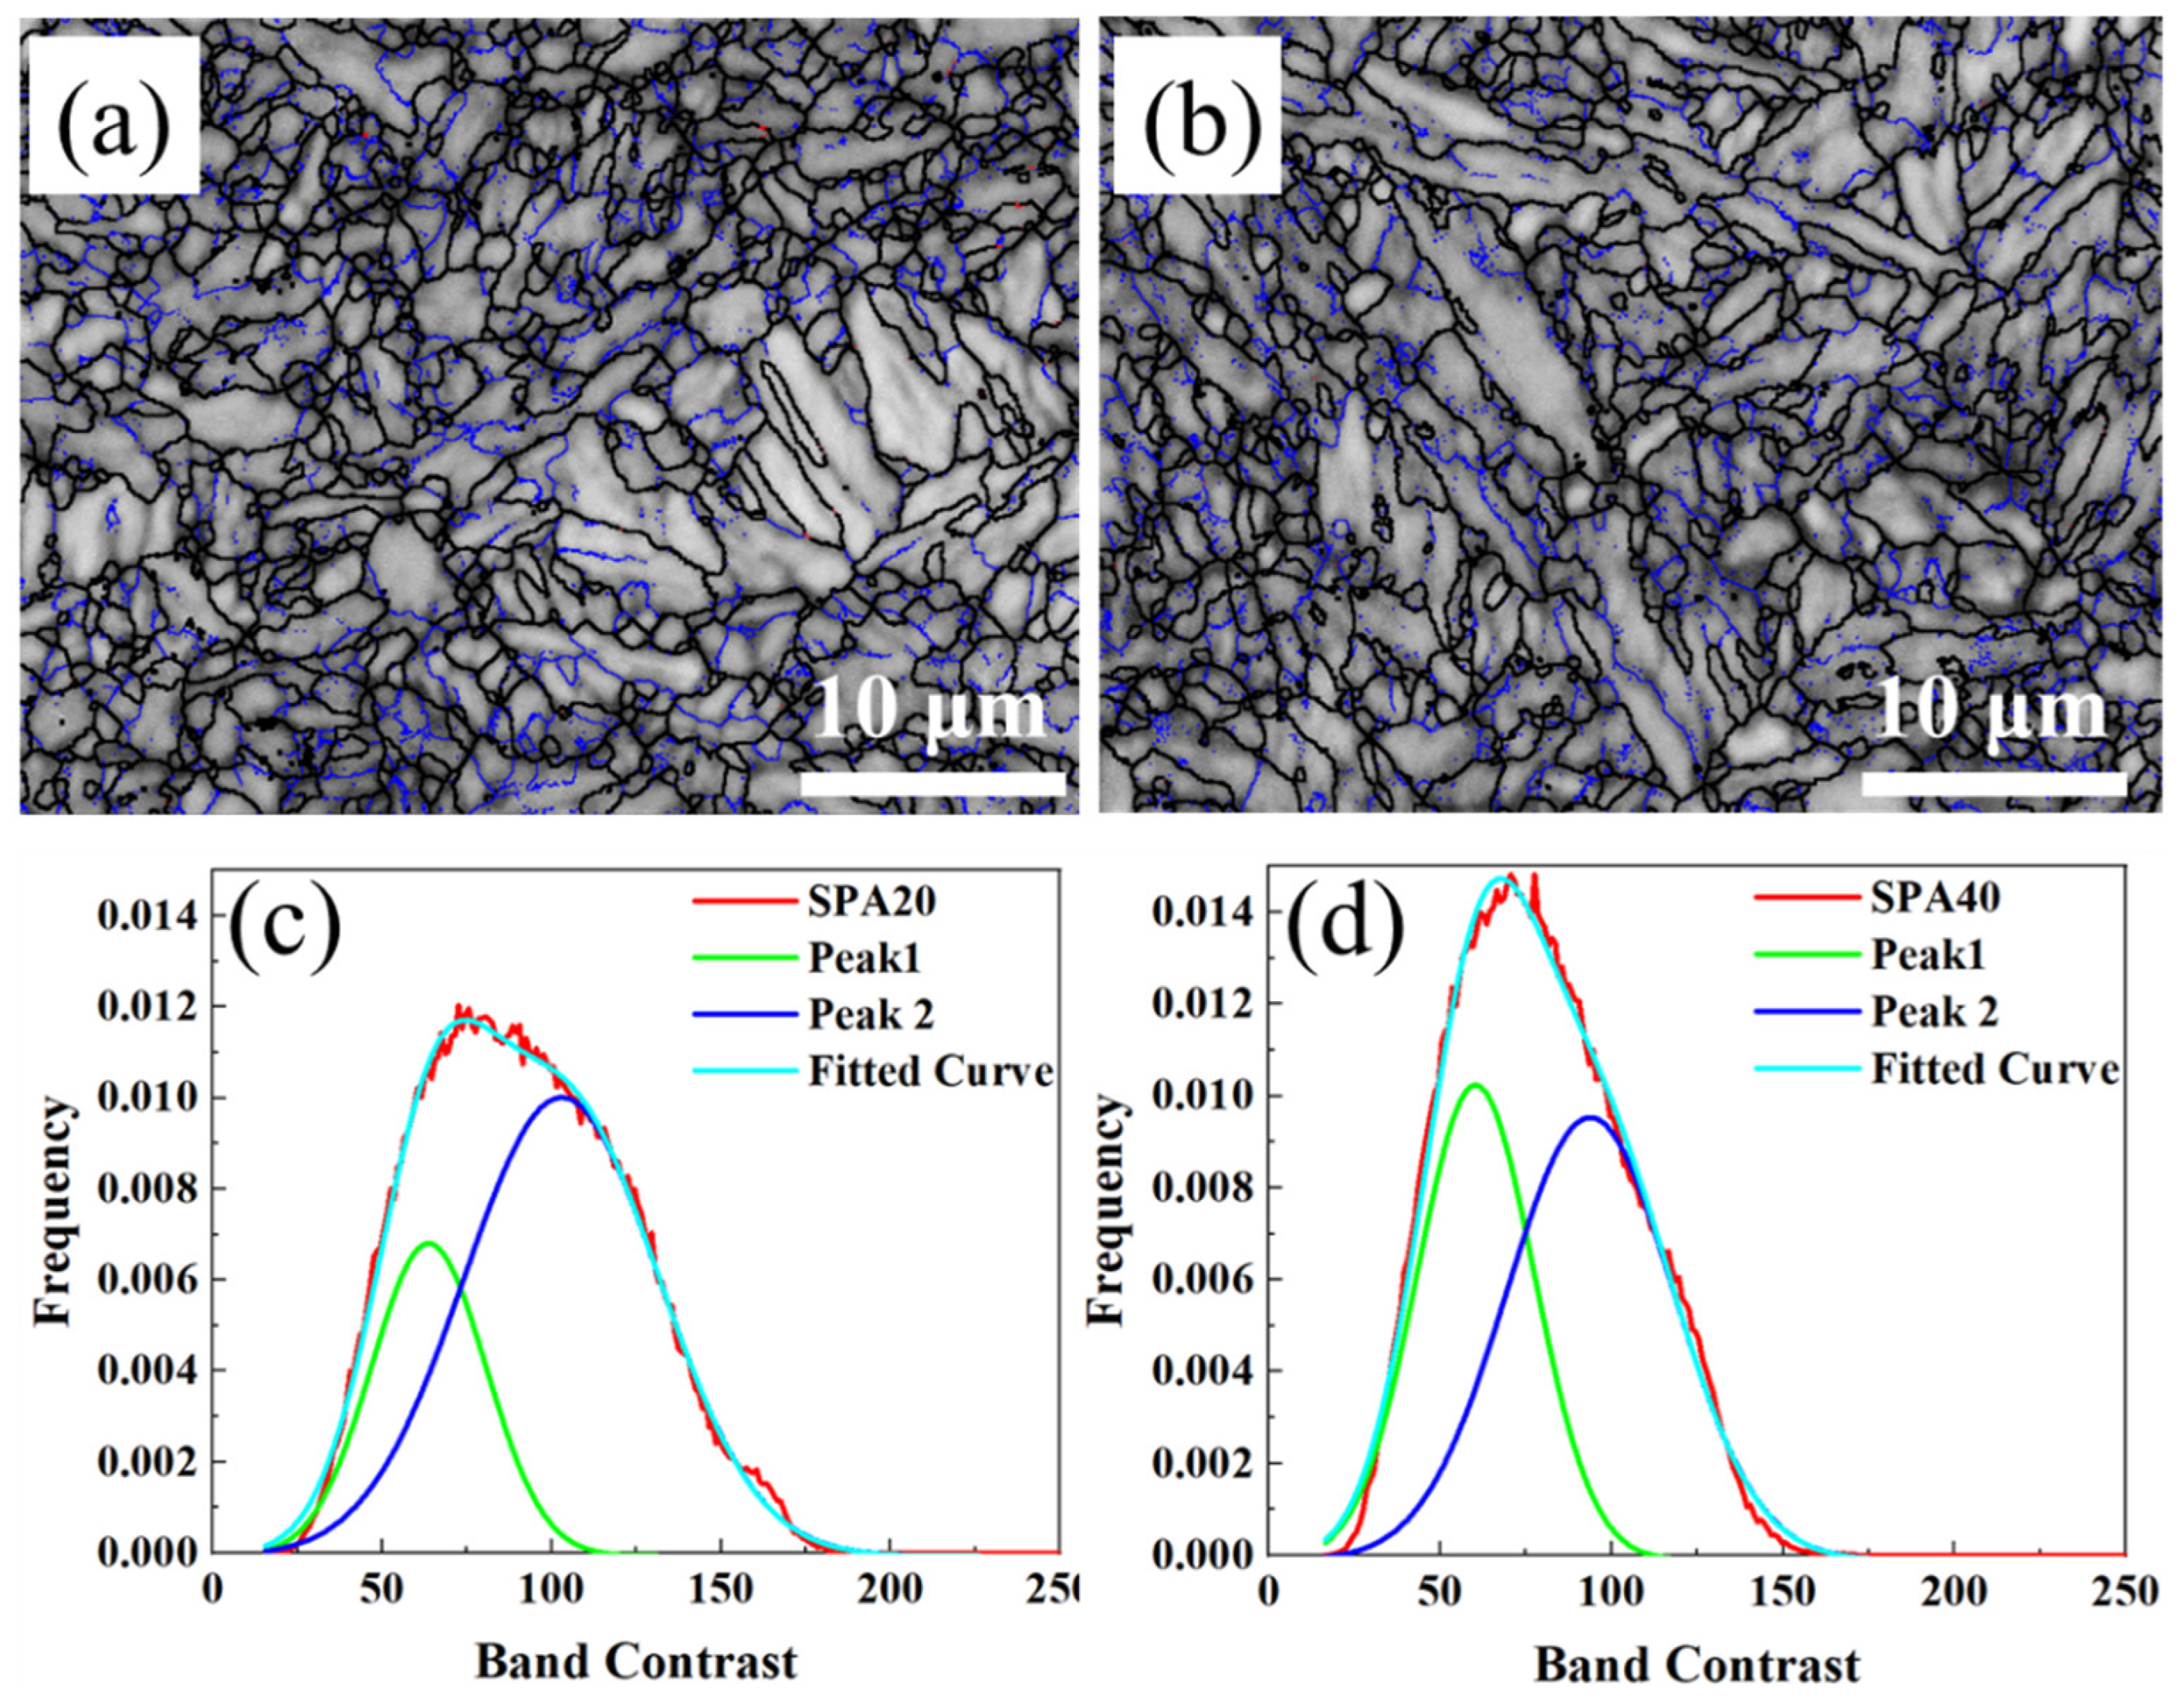
Figure 7.
TEM images of (a) SPA20 and (b) SPA40.
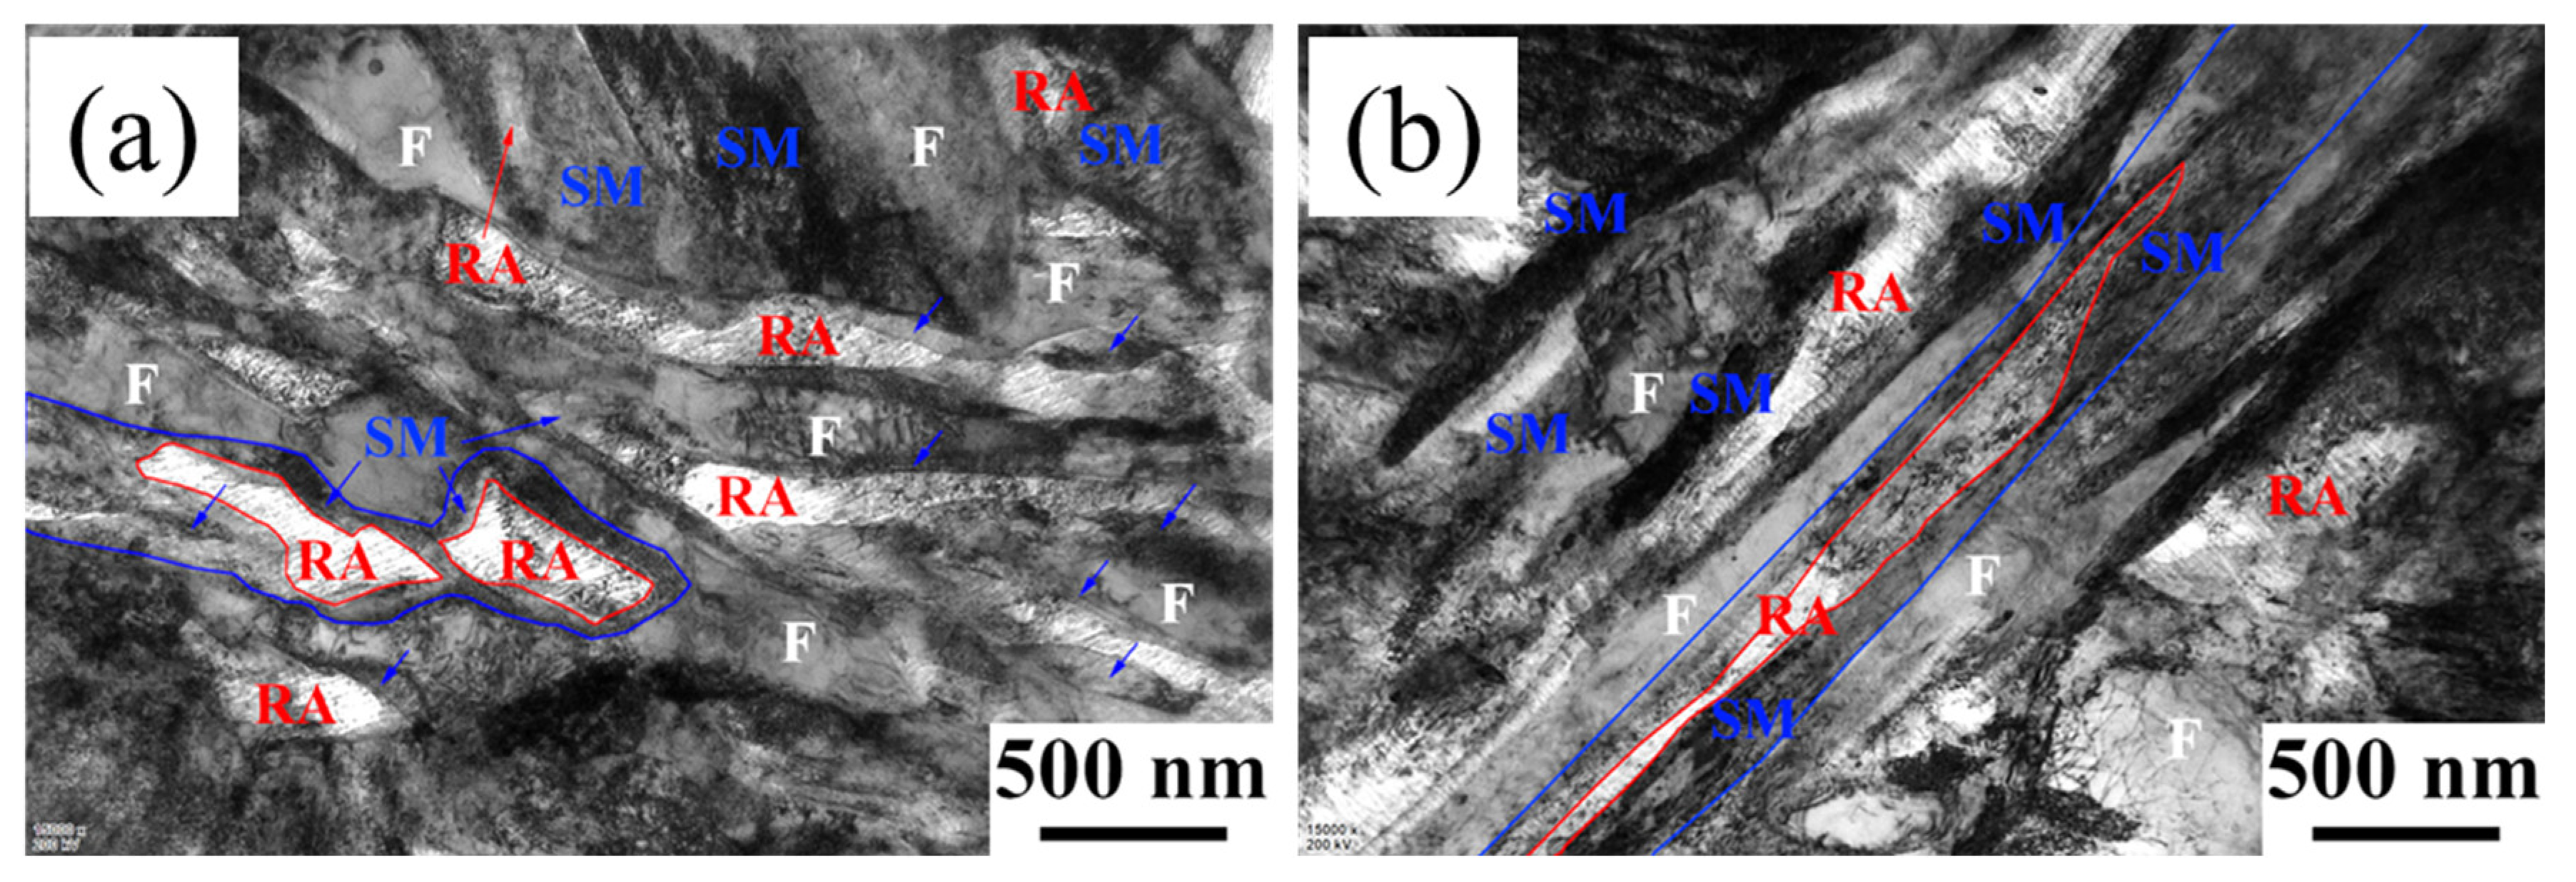
Figure 8.
The precipitation contents varying with temperature calculated by Thermo-Calc.
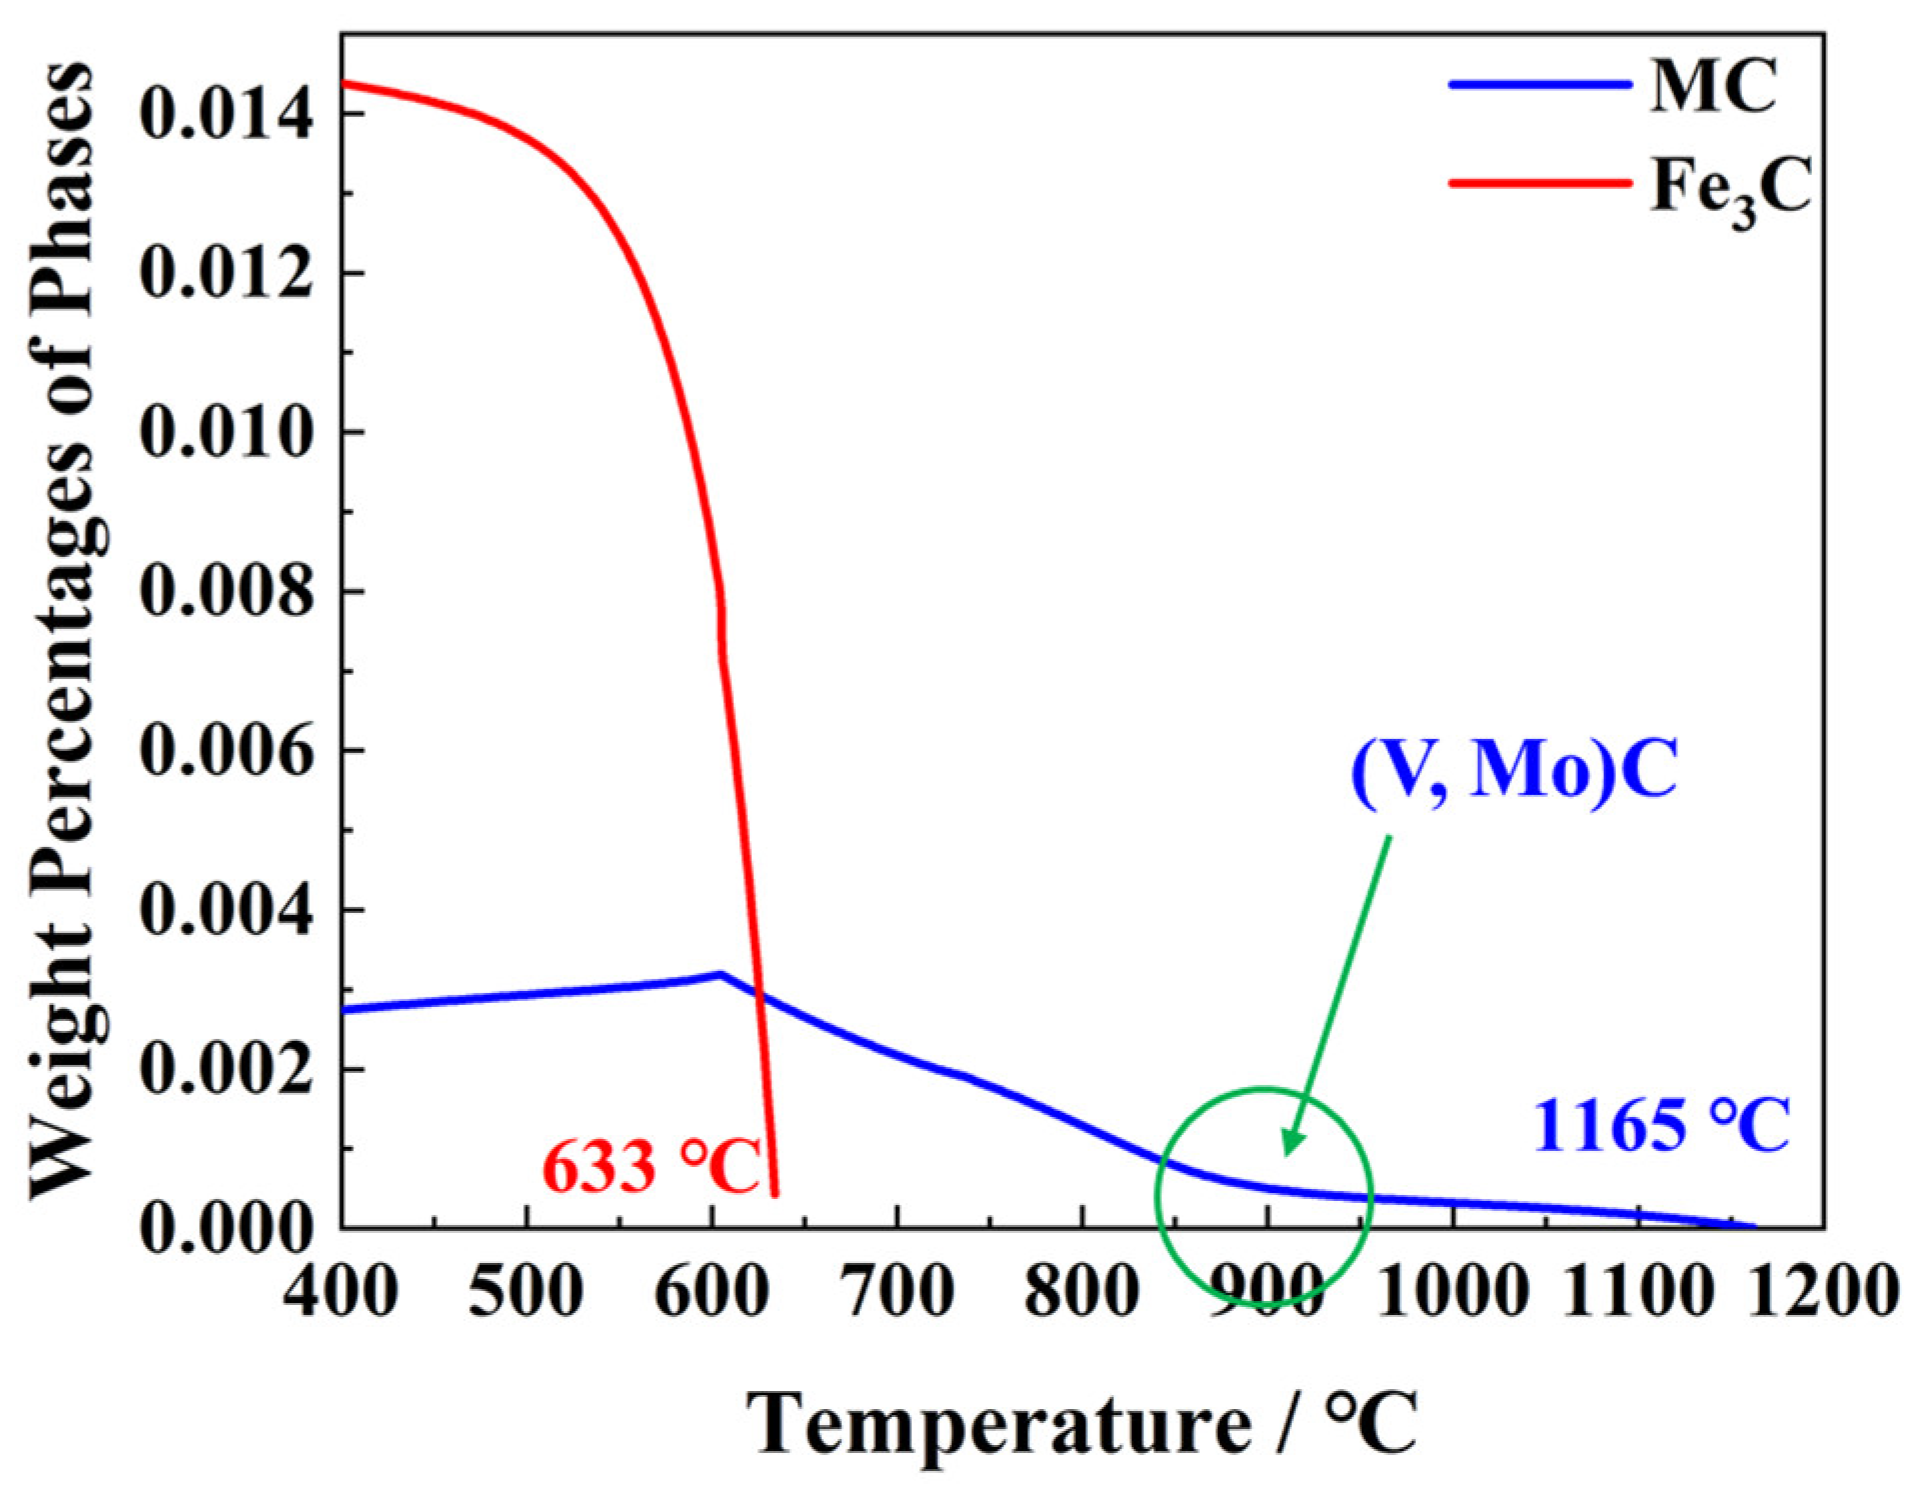
Figure 9.
TEM images of carbon extraction replicas of (V, Mo)C particles: (a) IT650; (b) SPA20 and (c) SPA40.
Figure 9.
TEM images of carbon extraction replicas of (V, Mo)C particles: (a) IT650; (b) SPA20 and (c) SPA40.
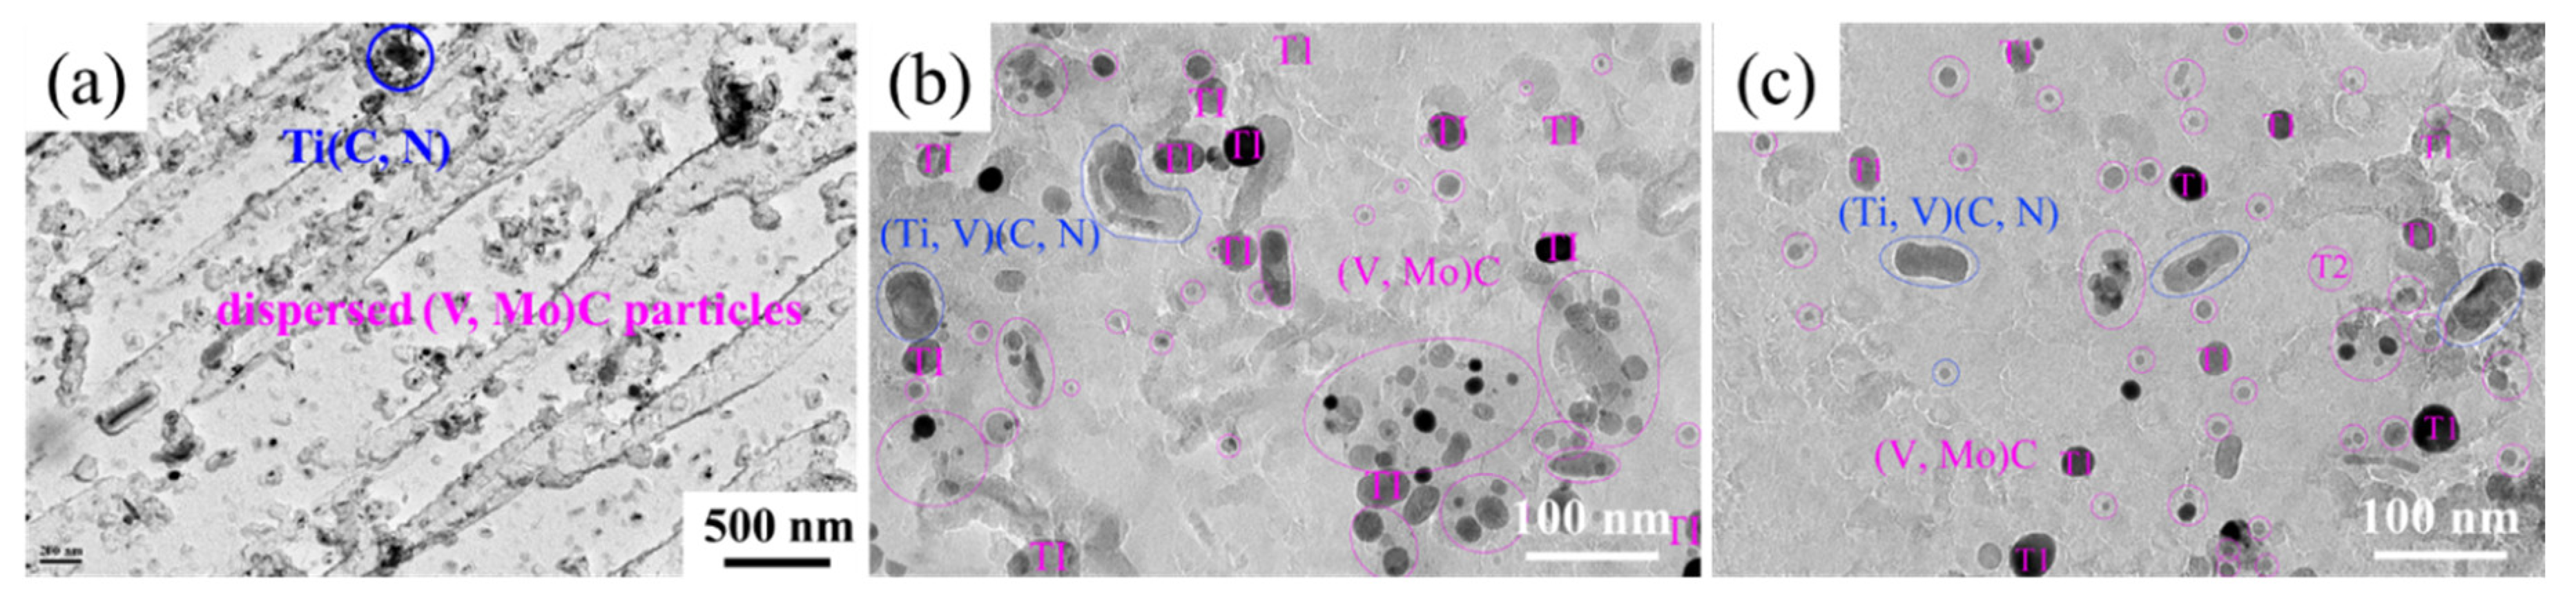
Figure 10.
(a) Engineering stress and strain curves of SPA20 and SPA40; (b) relationship between -20 °C impact energy and volume fraction of RA.
Figure 10.
(a) Engineering stress and strain curves of SPA20 and SPA40; (b) relationship between -20 °C impact energy and volume fraction of RA.
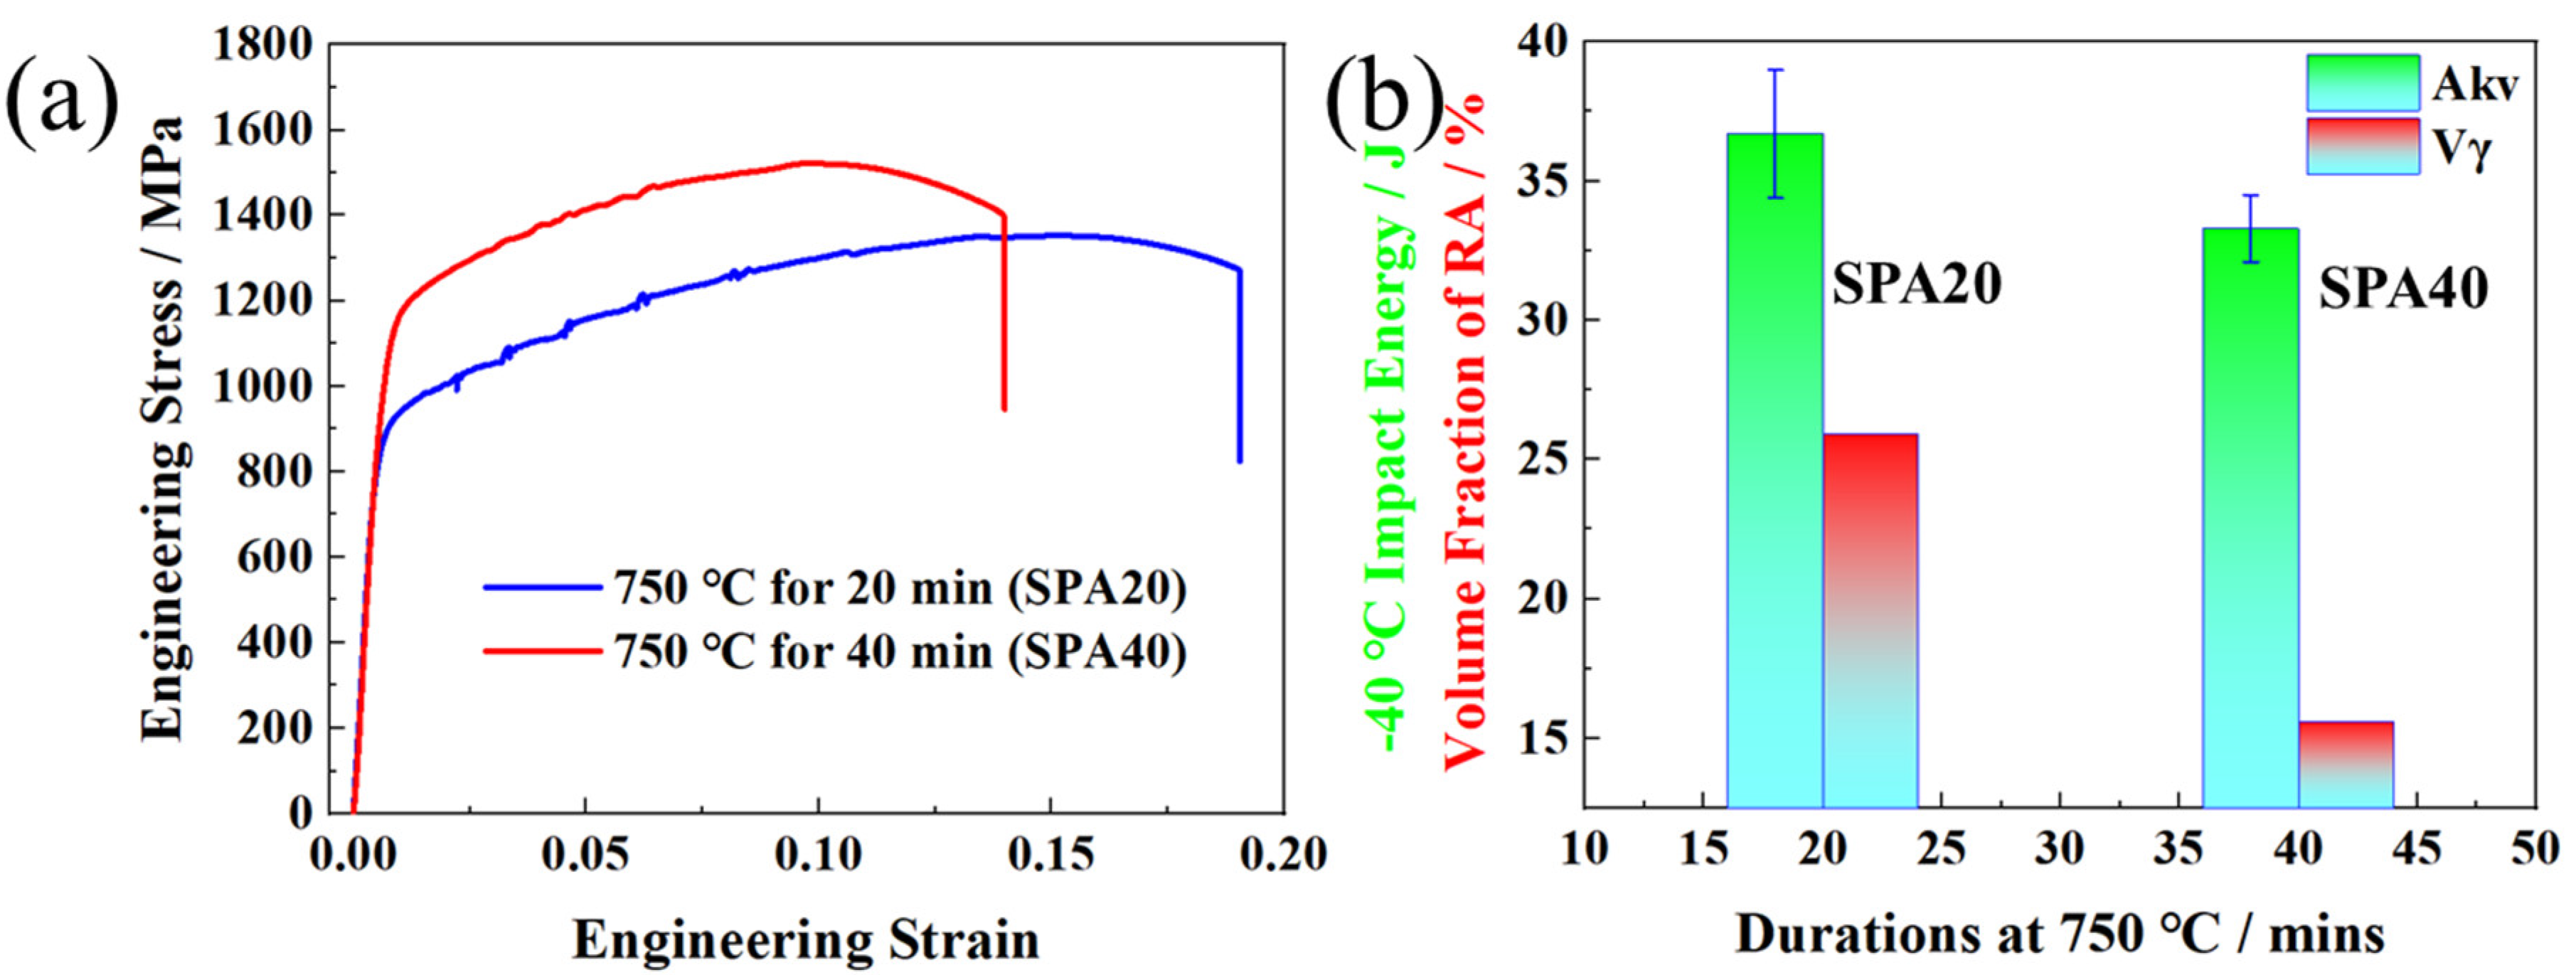
Figure 11.
(a) Schematic diagram of the diffusion couple applied for DICTRA simulation of IT650. (b, c) Element concentration profiles of C and Mn near the γ/α interface, showing the moving γ/α interface.
Figure 11.
(a) Schematic diagram of the diffusion couple applied for DICTRA simulation of IT650. (b, c) Element concentration profiles of C and Mn near the γ/α interface, showing the moving γ/α interface.
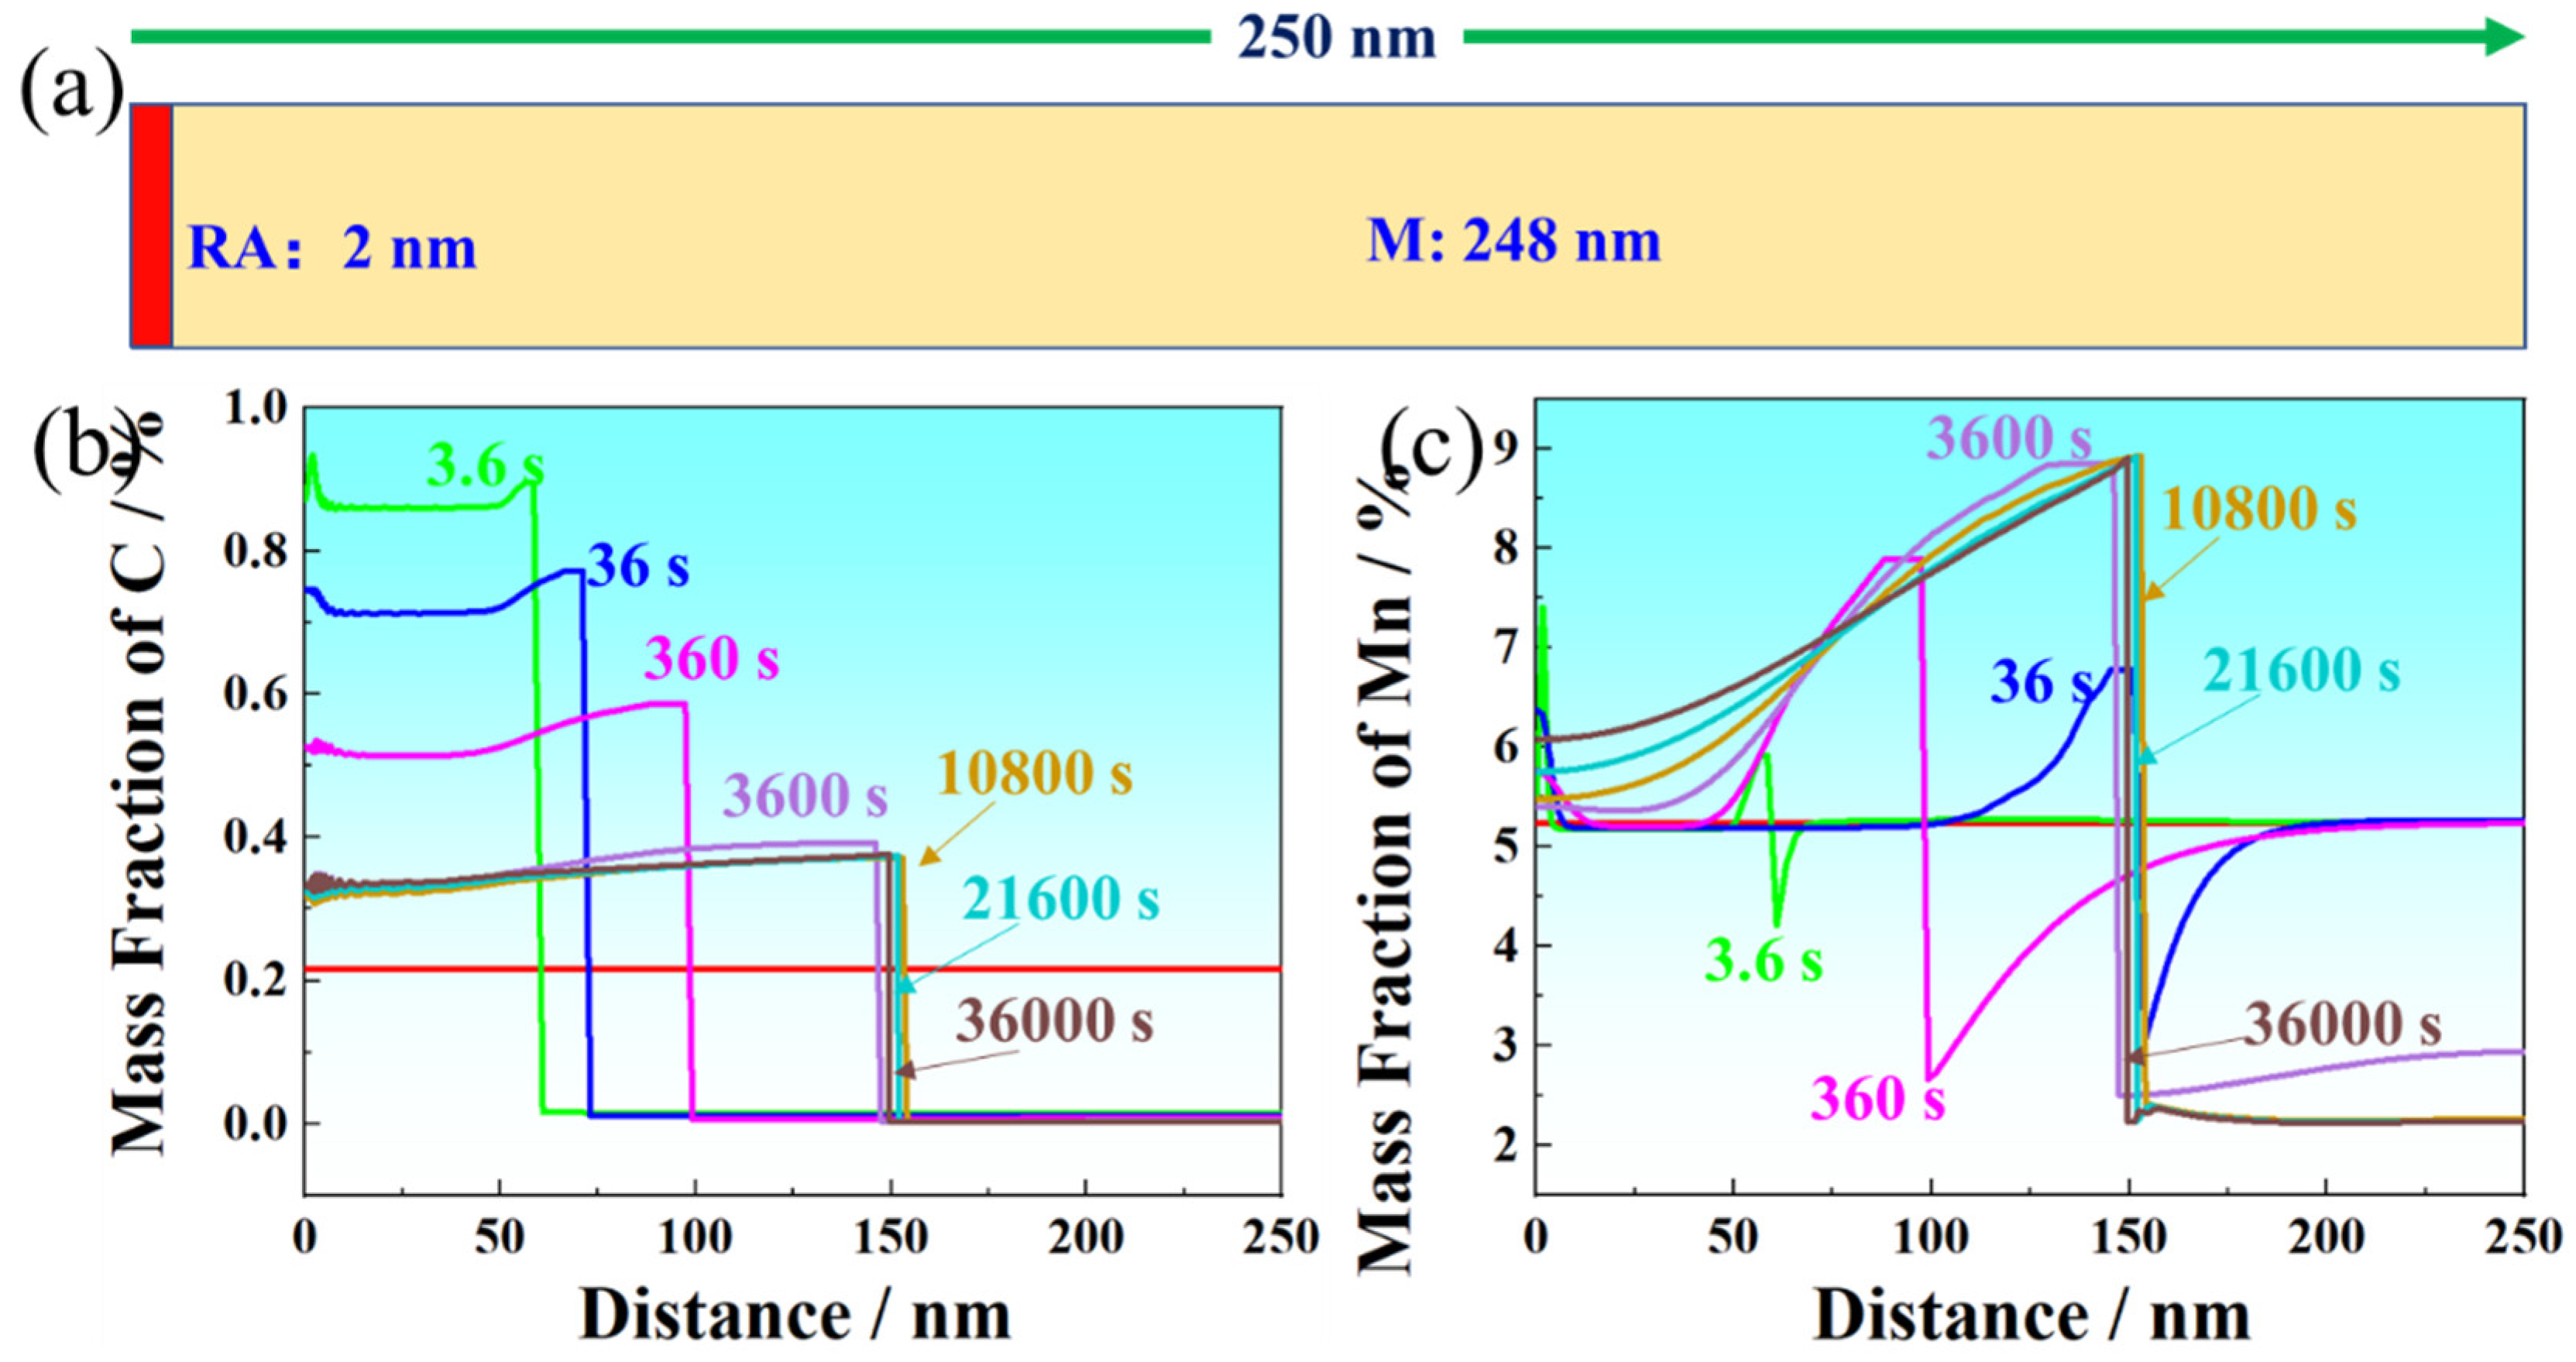
Figure 12.
(a) Schematic diagram of the diffusion couple applied for DICTRA simulation of SPA process. (b, c) Element concentration profiles of C and Mn near the γ/α interface, showing the moving γ/α interface.
Figure 12.
(a) Schematic diagram of the diffusion couple applied for DICTRA simulation of SPA process. (b, c) Element concentration profiles of C and Mn near the γ/α interface, showing the moving γ/α interface.
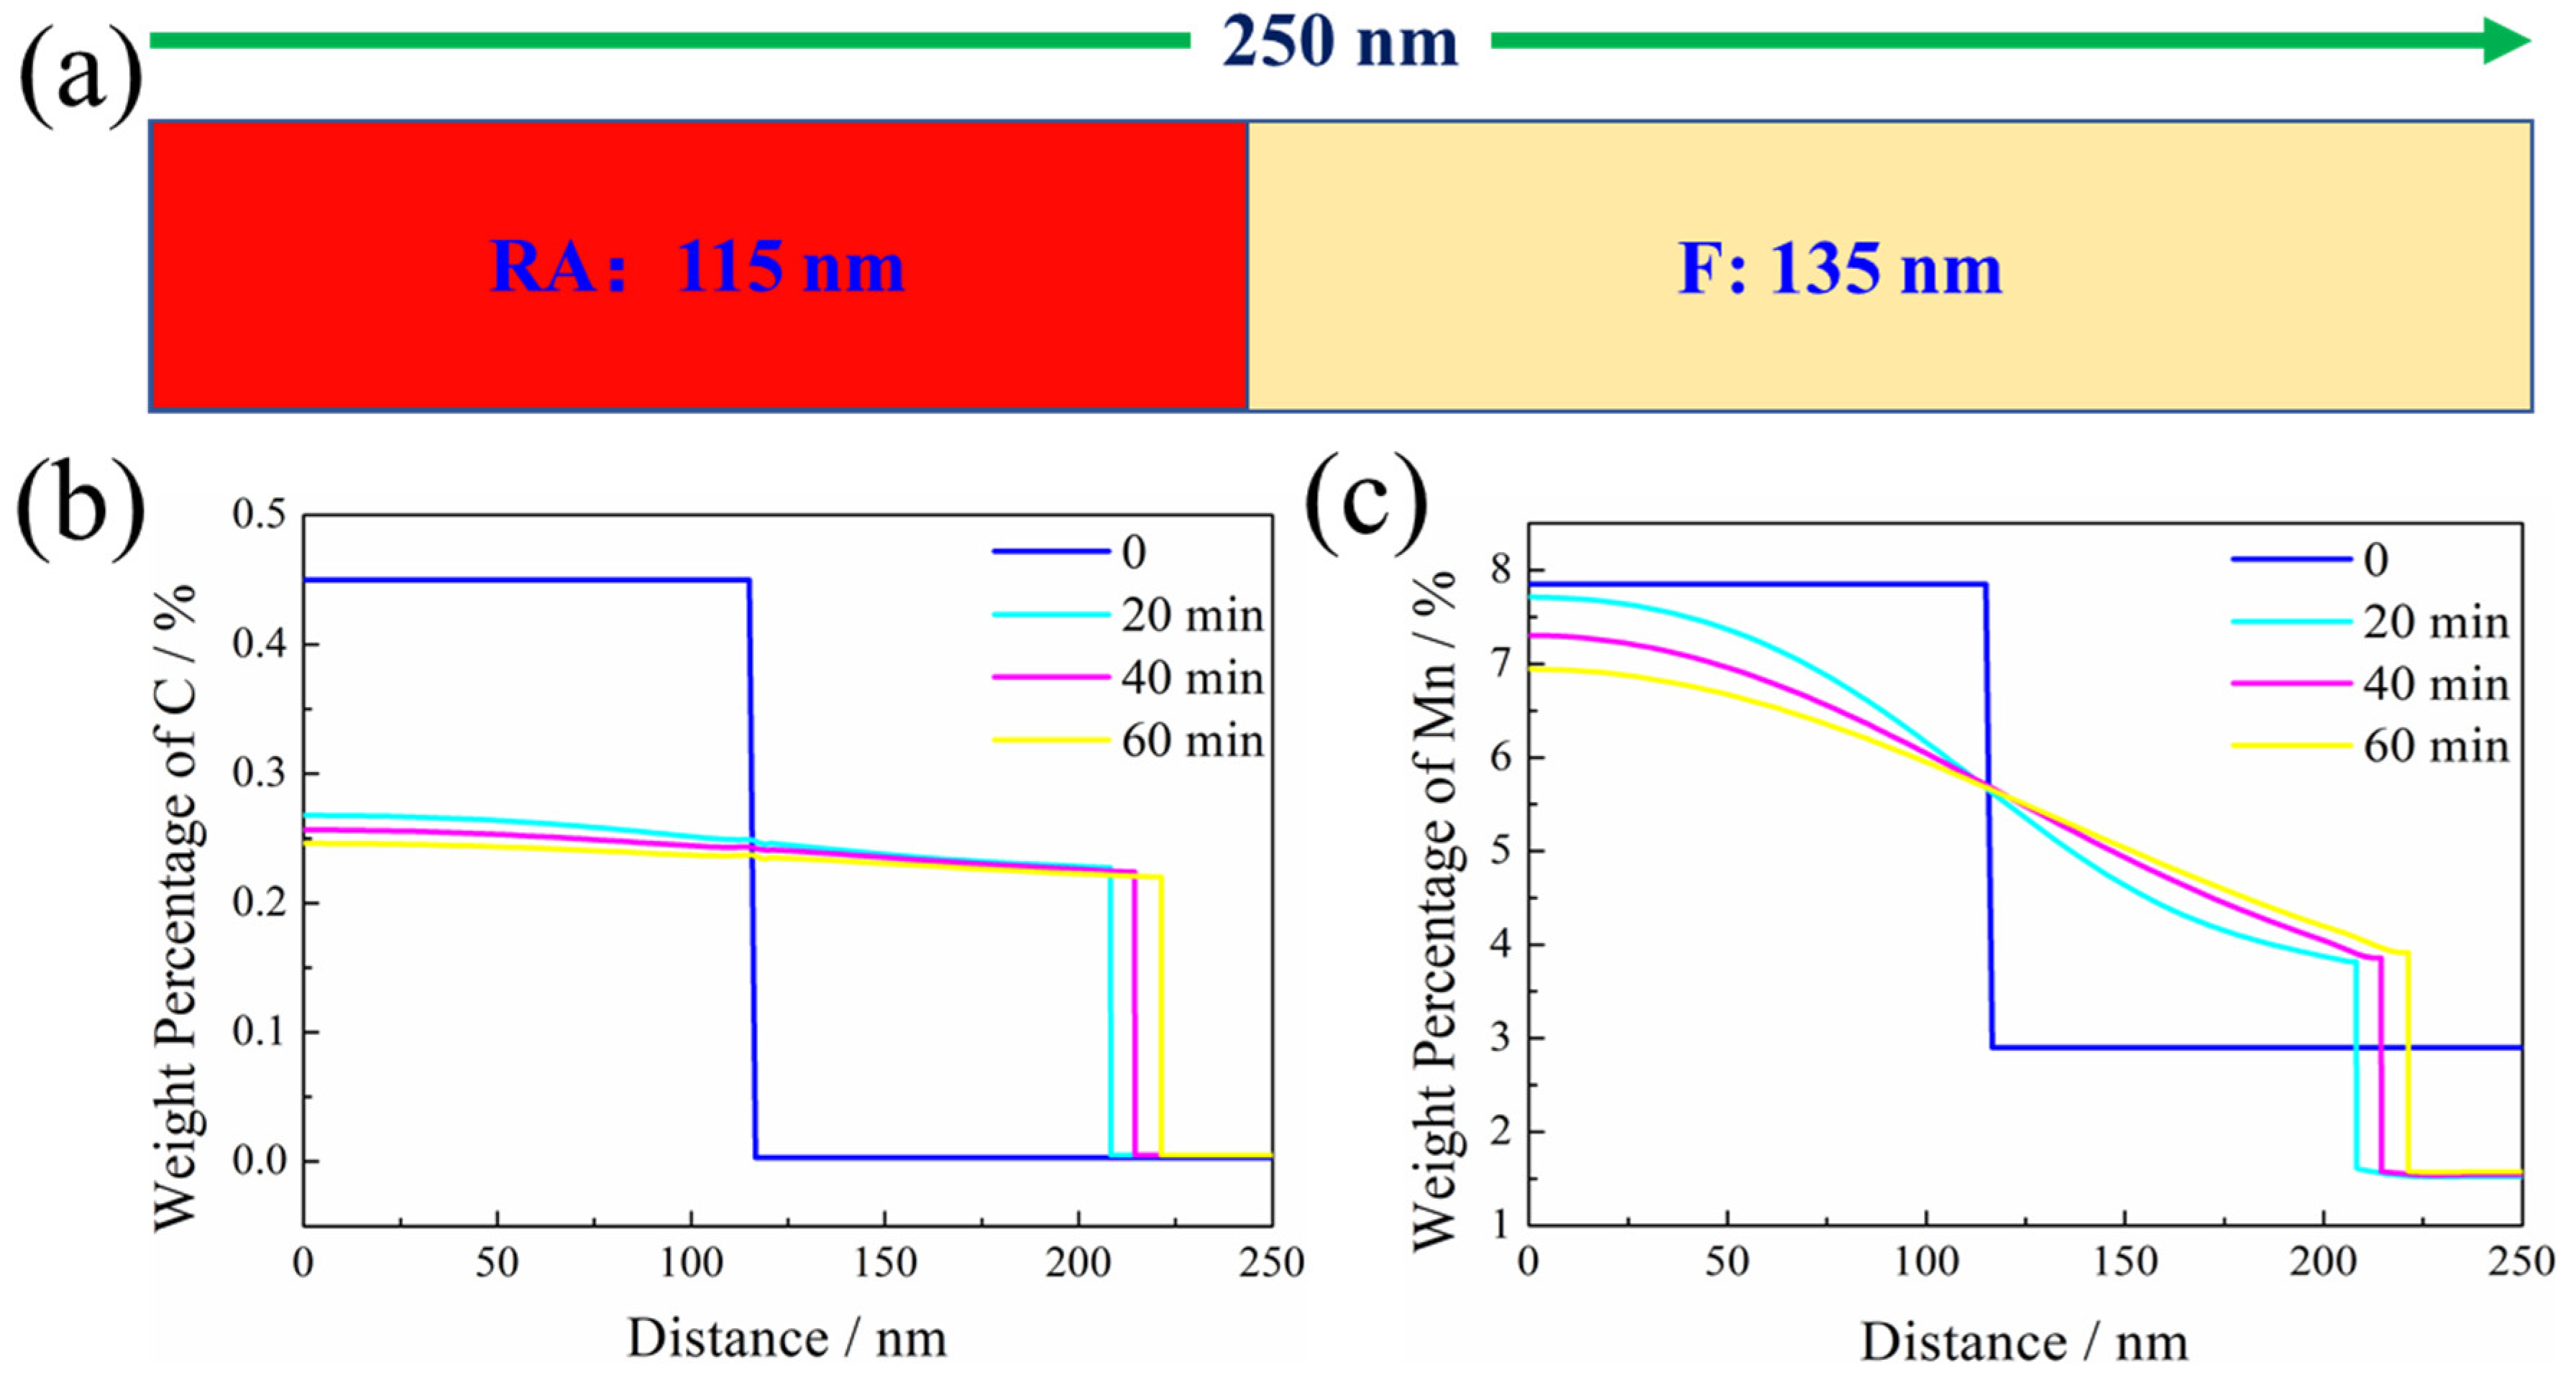
Figure 13.
Peak broadening analysis: (a) SPA20 and (b) SPA40.
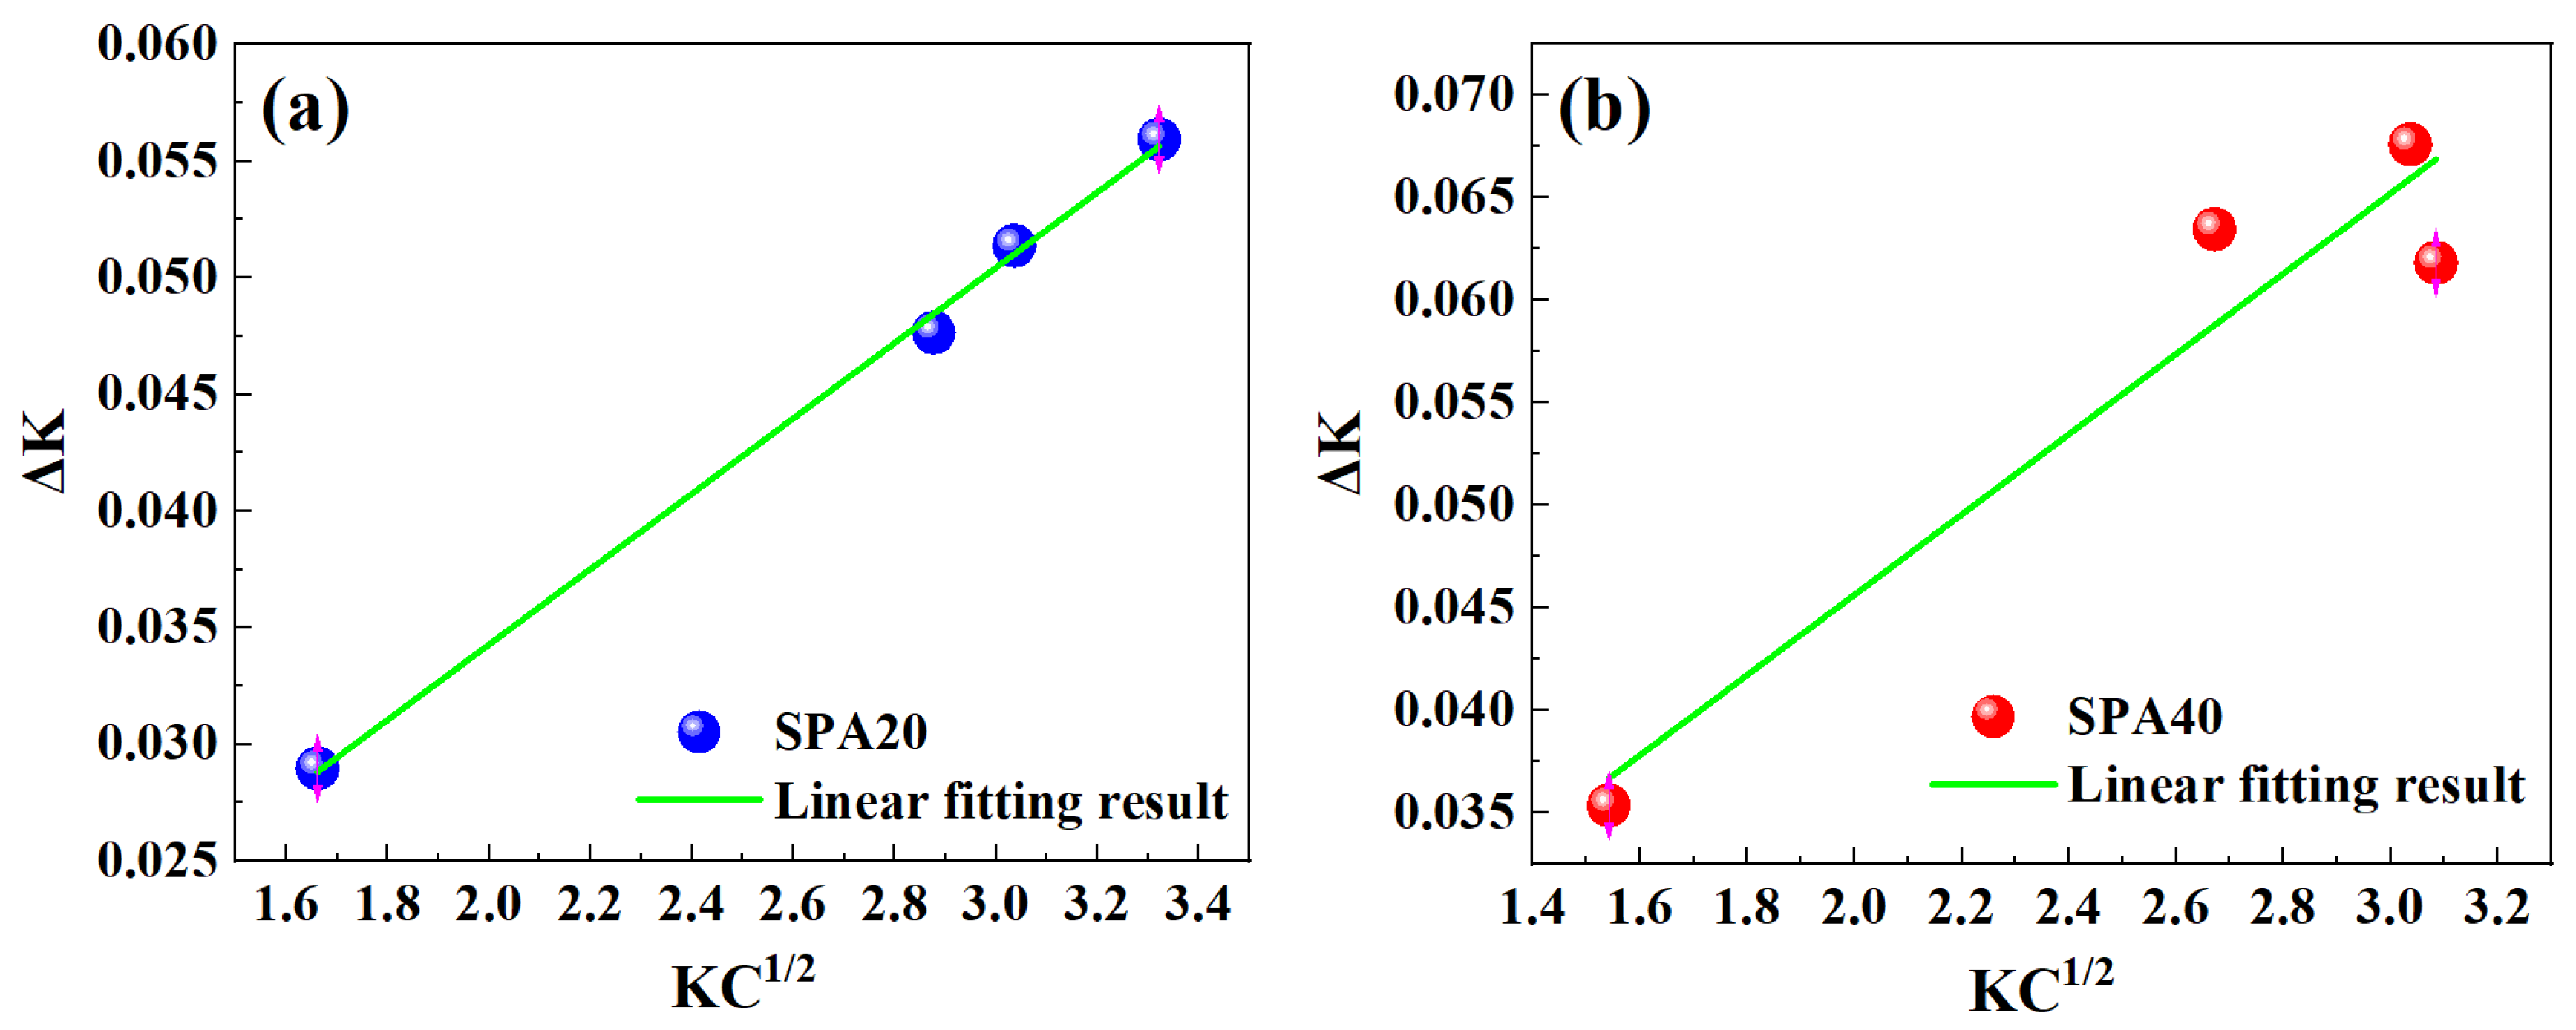
Figure 14.
(a) Strengthening components of SPA20 and SPA40. (b) Strengthening contributions of SPA20 and SPA40 of the multiphase microstructures. (F, RA, and SM represent ferrite, reversed austenite and secondary martensite).
Figure 14.
(a) Strengthening components of SPA20 and SPA40. (b) Strengthening contributions of SPA20 and SPA40 of the multiphase microstructures. (F, RA, and SM represent ferrite, reversed austenite and secondary martensite).
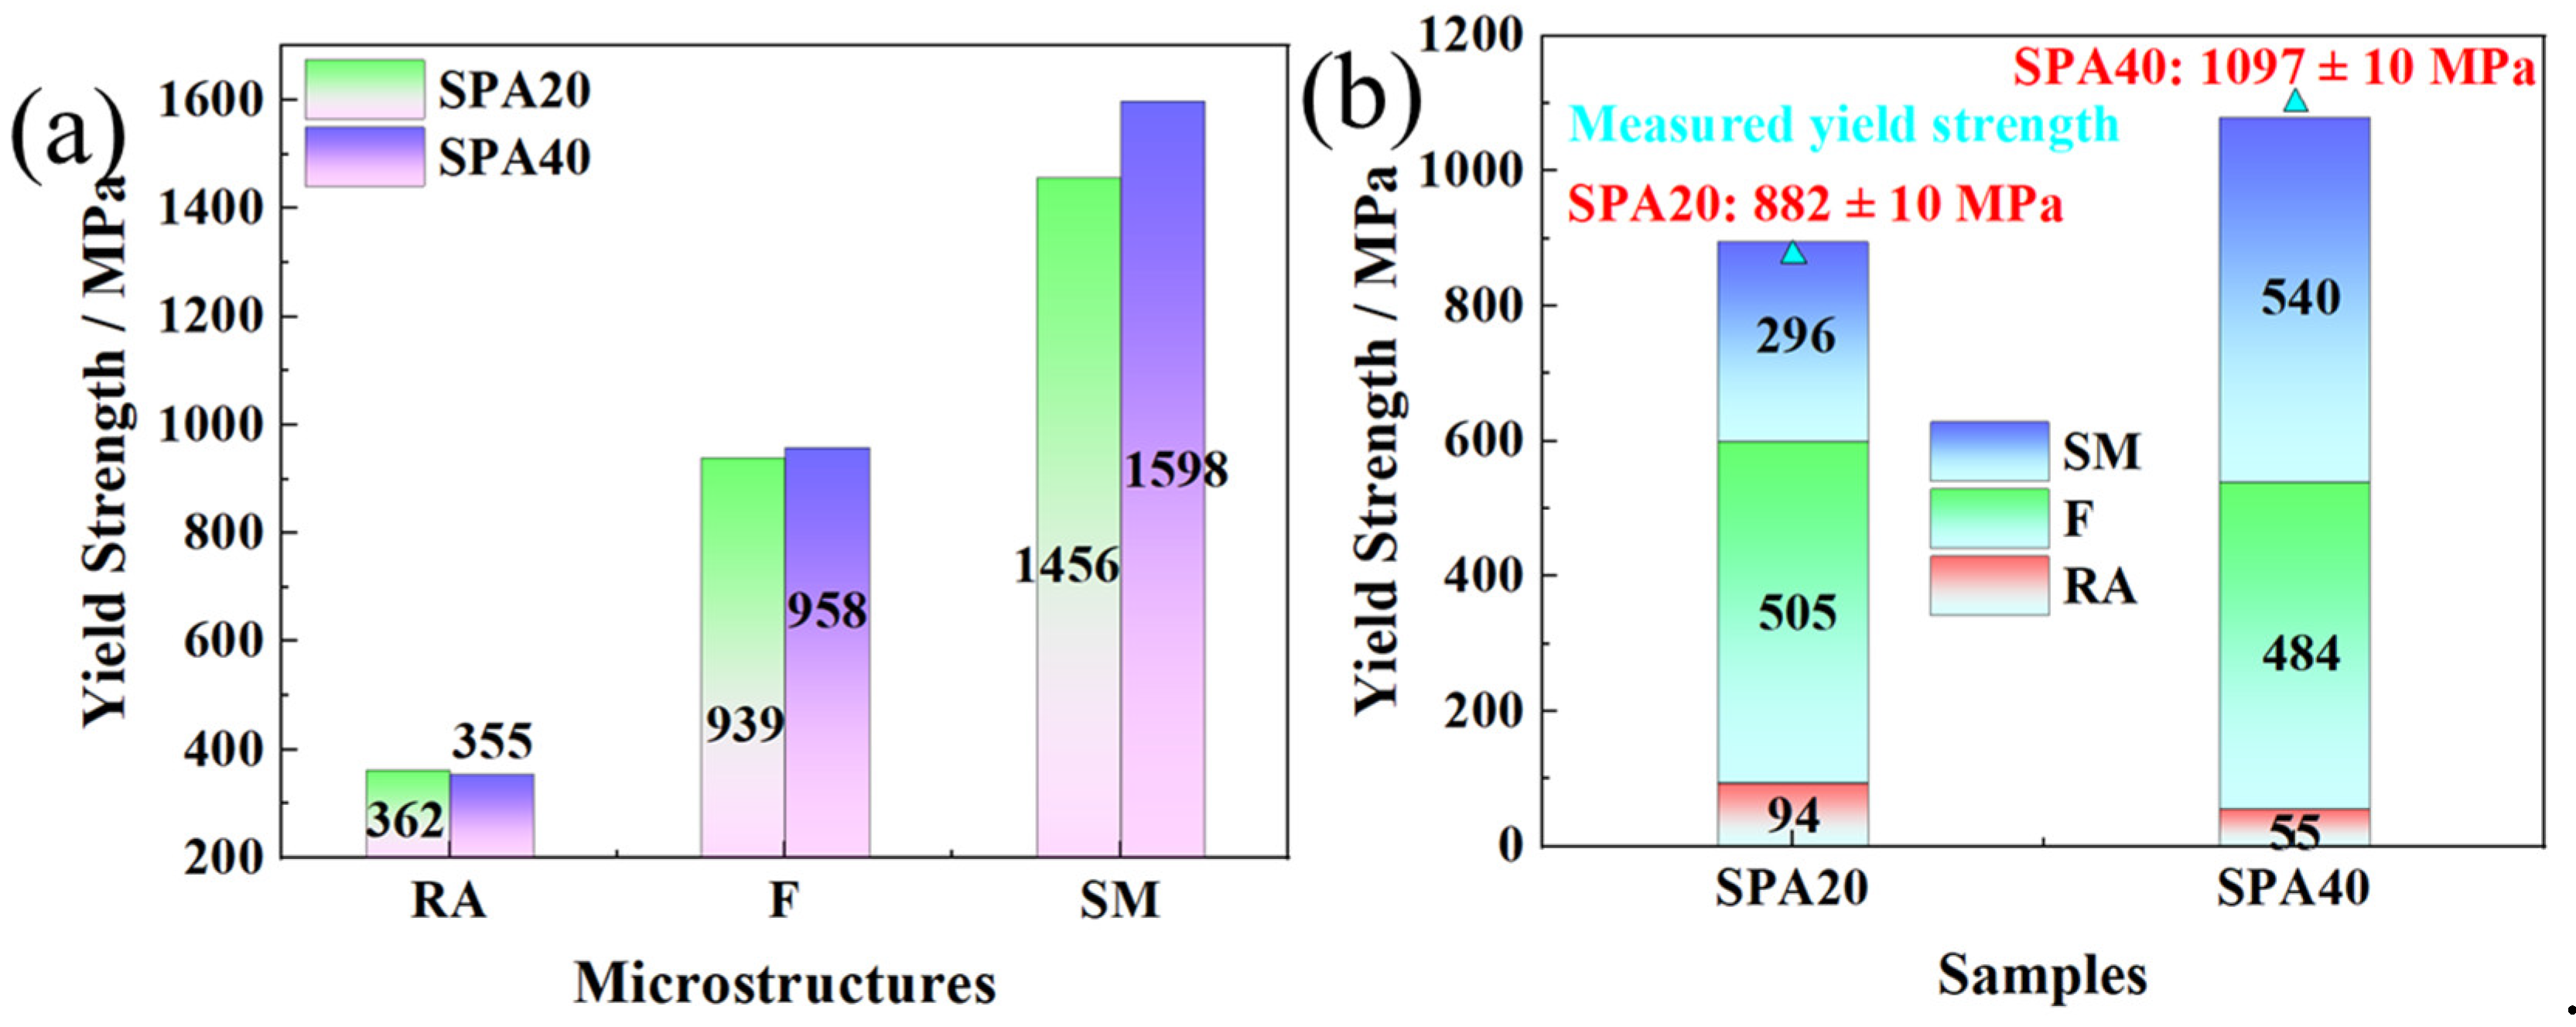

Table 1.
Volume fraction of RA, ferrite and SM, respectively.
| Samples | RA / % | ferrite / % | SM / % |
| SPA20 | 25.9 | 53.8 | 20.3 |
| SPA40 | 15.6 | 50.6 | 33.8 |
Table 2.
Mechanical properties and RA contents of the steel subjected to multistep heat treatment process.
Table 2.
Mechanical properties and RA contents of the steel subjected to multistep heat treatment process.
| Samples |
Yield Strength / MPa |
Tensile Strength / MPa |
Total Elongation / % |
Akv at -20 °C / J |
Vγ / % |
| SPA20 | 882 ± 10 | 1341 ± 11 | 19.0 ± 1.5 | 36.7 ± 2.3 | 25.9 |
| SPA40 | 1097 ± 10 | 1521 ± 2 | 14.0 ± 1.0 | 33.3 ± 1.2 | 15.6 |
Table 3.
Dislocation density and strengthening in ferrite and SM, respectively.
| Samples | Dislocation density (/m2) and strengthening (MPa) in ferrite | Dislocation density (/m2) and strengthening (MPa) in SM |
| SPA20 | 1×10¹⁴ / 149 | 1.375×10¹⁵ / 552 |
| SPA40 | 1×10¹⁴ / 149 | 2.109×10¹⁵ / 683 |
Table 4.
Nominal chemical composition in RA, wt.%.
| Samples | C | Si | Mn | Mo |
| SPA20 | 0.6169 | 0.35 | 8.8 | 0.15 |
| SPA40 | 0.5753 | 0.35 | 7.0 | 0.15 |
Table 5.
Nominal chemical composition in ferrite and EGS.
| Samples | C | Si | Mn | Mo | EGS / μm |
| SPA20 | 0.05 | 0.3 | 2.8 | 0.2 | 1.26 |
| SPA40 | 0.05 | 0.3 | 2.5 | 0.2 | 1.19 |
Table 6.
Different strengthening components of ferrite.
| Samples | / MPa |
/ MPa |
/ MPa |
/ MPa |
/ MPa |
/ MPa |
|---|---|---|---|---|---|---|
| SPA20 | 50 | 215 | 490 | 149 | 108 | 940 |
| SPA40 | 50 | 204 | 520 | 149 | 108 | 958 |
Table 7.
Nominal chemical composition in SM and EGS.
| Samples | C | Si | Mn | Mo | EGS / μm |
| SPA20 | 0.05 | 0.35 | 8.8 | 0.2 | 1.26 |
| SPA40 | 0.05 | 0.35 | 7.0 | 0.2 | 1.19 |
Table 8.
Different strengthening components of SM.
| Samples | / MPa |
/ MPa |
/ MPa |
/ MPa |
/ MPa |
/ MPa |
|---|---|---|---|---|---|---|
| SPA20 | 50 | 352 | 490 | 553 | 108 | 1456 |
| SPA40 | 50 | 352 | 504 | 683 | 108 | 1598 |
Table 9.
The calculated and measured yield strength of SPA20 and SPA40, MPa.
| Samples | , calculated yield strength | yield strength Measured yield strength | |||
| SPA20 | 362 | 939 | 1456 | 895 | 882 |
| SPA40 | 355 | 958 | 1598 | 1080 | 1097 |
Disclaimer/Publisher’s Note: The statements, opinions and data contained in all publications are solely those of the individual author(s) and contributor(s) and not of MDPI and/or the editor(s). MDPI and/or the editor(s) disclaim responsibility for any injury to people or property resulting from any ideas, methods, instructions or products referred to in the content. |
© 2023 by the authors. Licensee MDPI, Basel, Switzerland. This article is an open access article distributed under the terms and conditions of the Creative Commons Attribution (CC BY) license (http://creativecommons.org/licenses/by/4.0/).
Copyright: This open access article is published under a Creative Commons CC BY 4.0 license, which permit the free download, distribution, and reuse, provided that the author and preprint are cited in any reuse.


