
Submitted:
27 December 2023
Posted:
27 December 2023
You are already at the latest version
Abstract
The diversity of leaf characteristics, including leaf color, is a prominent subject of study in plant science. Leaf color is predominantly determined by the synthesis and functionality of chlorophyll, a key component of photosynthesis. The regulation of chlorophyll synthesis and degradation involves complex gene interactions, and disruptions in these processes can lead to abnormal chlorophyll synthesis and impact leaf color. This study focuses on Bambusa multiplex f. silverstripe, a natural variant with various leaf colors, including green, white, and green-white leaves. The variations in leaf color are attributed to genetic factors and their influence on gene expression. By employing RNA-seq, we investigate the molecular mechanisms behind chlorophyll anomalies and genetic factors in Silverstripe. Our findings shed light on the complexity of gene interactions and regulatory networks that underlie leaf color diversity and provide valuable insights for future research and plant breeding.
Keywords:
chlorophyll deficiency
; leaf color variation
; Bambusa multiplex
; transcriptome analysis
; Photosynthesis
1. Introduction
The diversity of leaf characteristics, including leaf color, is indeed a key area of research in plant science [1,2]. The synthesis and functionality of chlorophyll are key factors determining leaf color [3]. During leaf development, the synthesis and degradation of chlorophyll are regulated by multiple genes [4]. In some plants, even though the normal chlorophyll synthesis genes may be present at the genetic level, abnormal gene expression regulation can lead to aberrant chlorophyll synthesis or functionality, ultimately affecting leaf color [5]. The synthesis and functionality of chlorophyll involve complex gene interactions and regulatory networks [6]. Disruptions in these interactions and networks by genetic factors can result in abnormal chlorophyll synthesis or functionality, consequently impacting plant leaf color [1,7].
In this study, we focus on Bambusa multiplex f. silverstripe (hereafter referred to as Silverstripe) a natural variant of Bambusa multiplex widely distributed in South China. Silverstripe displays a variety of leaf colors, including green, white, and green-white. Notably, phenotypic variation due to genetic information may lead to changes in gene expression caused by antagonistic interactions. Transcriptome studies can provide insights into the mechanisms underlying the chlorophyll deficiency and identify differentially expressed genes (DEGs) among different tissues [8]. Therefore, Silverstripe provides us with a unique opportunity to delve into the molecular mechanisms behind chlorophyll anomalies and genetic factors. By applying RNA-seq, we contribute new insights to unravel the mysteries behind plant leaf color diversity, laying the foundation for future research and applications. Exploring this field will enhance our understanding of plant development and leaf formation, ultimately providing valuable support for the development of plant breeding.
2. Methods
2.1. Plant Materials and Transcriptome Sequencing
The samples were collected from the Bamboo Botanical Garden of Fujian Agriculture and Forestry University, located in Cangshan District, Fuzhou City, Fujian Province, China (N26°05', E119°14'). For RNA extraction, fresh leaves were collected from five Silverstripe plants under the same normal maintenance conditions and free from any diseases, including individuals with green leaves (G), white leaves (W), and green-white leaves (GW). We ensured that the selected leaves from each plant exhibited similar growth levels, even though their sizes varied (Figure 1A). The collected leaves were promptly mixed and then flash-frozen in liquid nitrogen. Subsequently, they were then stored at -80°C. Total RNA from the leaves was extracted using the RNA prep Pure Plant Kit (Tiangen, Beijing, China). The quality of total RNA was assessed by 2% agarose gel electrophoresis. RNA concentration was measured using the NanoPhotometer® spectrophotometer (IMPLEN, CA, USA) and the Qubit® RNA Assay Kit with a Qubit® 2.0 fluorometer (Life Technologies, California, USA). RNA integrity was evaluated using the RNA Nano 6000 Assay Kit on the Agilent® Bioanalyzer 2100 system (Agilent Technologies, CA, USA). Library construction was carried out using the NEB-Next® Ultra™ RNA Library Prep Kit for Illumina® (NEB, USA). All samples were sequenced on the Illumina® 6000 platform, generating 150 bp paired-end reads. RNA-seq for each type of leaf was performed with three technical replicates.
2.2. Assembly and Function Annotation
The initial processing of raw RNA-Seq reads was performed using fastp v0.23.2 [9] to remove sequences with adapters and those where the percentage of bases with a Qphred ≤ 20 exceeded 50% of the total length, as well as sequences with an N-base percentage > 15%. The remaining clean reads were utilized for reference-based transcriptome assembly. De novo transcriptome assembly was carried out using Trinity v2.5.1 with default parameters [10]. Subsequently, Corset v1.07 [11] was employed for clustering to obtain non-redundant transcript groups. The longest transcript from each transcript group was chosen as a unigene. Custom Python scripts were utilized to rename each unigene for subsequent analyses. The completeness of the transcriptome was assessed using the Benchmarking Universal Single Copy Orthologs (BUSCO) tool v5.1.2 [12].
For functional annotation, the transcripts were annotated using eggNOG v2.1.12 [13], based on diamond alignment (e-value ≤ 0.001), and InterProScan v5.63 with default parameters. Transcripts that remained unannotated were subjected to a BLAST v2.10.0 search (e-value ≤ 1e-5) [14] against the Arabidopsis thaliana (TAIR10) coding sequences (CDS) database. Additionally, transcripts were mapped to the Kyoto Encyclopedia of Genes and Genomes (KEGG) pathway database using KofamKOALA [15] and the KAAS [16] server with default parameters.
2.3. Alignment, Quantification, and Identification of DEGs
In order to assess the utility of the reference transcriptome for gene expression quantification, we utilized the align_and_estimate_abundance.pl script from Trinity. This script utilizes bowtie2 v2.4.2 [17] for transcriptome alignment and RSEM v1.3.3 [18] for transcript abundance estimation. TBtools v2.012 [19] calculates the transcripts per kilobase million (TPM) normalized gene expression estimations, TPM values were used for the Principal Component Analysis (PCA) analysis, while log2 transformed TPM values were used for gene expression graphs.
For statistical differential expression tests, count data were further analyzed using the R package DESeq2 v1.41.12 [20], |log2 (Fold Change)| ≥1 and FDR (False Discovery Rate) < 0.01 were used as screening criteria. Subsequently, common DEGs among different types were identified using the Venn module within TBtools.
2.4. Expression Clustering and Functional Enrichment
For the clustering of common DEGs, TPM values were utilized, and the analysis was performed using Mfuzz v2.60.0. Gene Ontology (GO) and Kyoto Encyclopedia of Genes and Genomes (KEGG) enrichment analysis was conducted using ClusterProfile v4.10.0 [21]. To create gene expression graphs, the heatmap module within TBtools was employed.
2.5. Measurement of Photosynthetic Gigments and Nutrient Concentrations
The photosynthetic pigments (chlorophyll a, chlorophyll b, chlorophyll (a+b), and carotenoids) were extracted from finely chopped fresh leaf tissues (0.25 g) using the acetone extraction method. The absorbance of the extracts was measured at three different wavelengths (λ=663 nm, λ=645 nm, λ=470 nm) using a UV-spectrophotometer (TU-1900, Persee, Beijing, China). Based on the obtained optical density values, the concentrations of photosynthetic pigments were calculated (Document S1).
Nutrient content was assessed using dried samples (approximately 0.5 g of powdered tissue), with three biological replicates conducted for each measurement. The concentrations of total nitrogen (N) and sulfur (S) in the samples were determined using an Elemental Analyzer (EMA502, VELP, Italy). The concentrations of other elements ,including potassium (K), calcium (Ca), magnesium (Mg), copper (Cu), iron (Fe), manganese (Mn), zinc (Zn), and sodium (Na), were quantified using Inductively Coupled Plasma Mass Spectrometry (ICP-MS) (Perkin NexION 300X, Waltham, MA, USA), as described (Document S1).
3. Results
3.1. Summary of Sequencing Data and Assembly
After trimming and quality assessment of the raw reads, we obtained a total of 76.17 GB of clean reads (Table S1). Following the assembly process, we identified 336,879 non-redundant unigenes. Subsequently, the unigenes were renamed from Bm000001 to Bm336879. Among them, 100951 (29.97%) of the unigenes ranged from 201 to 500 bp in length, 111452 (33.08%) of the unigenes ranged from 501 to 1000 bp in length, 77117 (22.89%) of the unigenes ranged from 1001 to 2000 bp in length, and 47359 (14.06%) unigenes were > 2000 bp in length (Table S2). The N50 value of the assembly was 1,586 bp, and the Benchmarking Universal Single-Copy Orthologs (BUSCO) value was 89.0% (Figure S1).
3.2. Expression Quantification and Classification
To elucidate the transcriptional mechanisms underlying the heterogeneity of leaf color in bamboo, we conducted an RNA-seq experiment covering three leaf colors (Figure 1A). By aligning and quantifying the sequencing data, we obtained count data and calculated TPM values (Table S3; Table S4). To further investigate the differences between the chlorophyll-deficient type and the normal type, we performed PCA analysis on the expression data of the nine transcriptome samples and generated a correlation heatmap to study their variation and similarity. In the scatterplot between PC1 and PC2, it is evident that the three replicates of each leaf color type cluster closely together, indicating similarities in gene expression levels. Additionally, there is a notable distinction between G and GW or W, whereas the GW and W exhibit closer distribution and smaller differences (Figure 1B).
Furthermore, the correlation heatmap demonstrates high within-group correlation for samples of the same leaf color type, while the inter-group correlation is comparatively lower (Figure 1C). In line with the PCA analysis results, the correlation between W and GW is significantly higher than the correlation between G and either of them.
3.3. Identification of DEGs
Significant differences in transcript abundance were identified by DESeq2 based on the count data (Figure S2). Among the different combinations, the G vs. W combination had the highest number of DEGs. There were a total of 22,523 upregulated genes and 28,978 downregulated genes in this combination. In contrast, the GW vs. W combination had the lowest number of DEGs, with 2,846 genes upregulated and 1,326 genes downregulated. Additionally, in the G vs. GW combination, there were 12,220 upregulated genes and 23,069 downregulated genes (Figure S1). These results suggest that as the differences in leaf color become more pronounced in Silverstripe, the number of DEGs increases.
Further analysis revealed that there were 1,430 common DEGs shared among the three combinations (Figure 1D). Moreover, cluster analysis showed that these DEGs could be categorized into three clusters (Figure 1E). Furthermore, there were 405 genes and 609 genes that exhibited the highest expression levels in the W and G groups, respectively, and their expression patterns consistently upregulated or downregulated with the degree of leaf whitening (Figure 1E; Figure 1G). This implies that these genes may be associated with the proportion of leaf white area and are considered as key genes related to chlorophyll deficiency.
3.4. Function Annotation and Enrichment
To gain a deeper understanding of the molecular mechanisms behind physiological changes and to explore the biological significance of key genes in more detail, we initiated functional annotation for all unigenes. A total of 170,574 unigenes were successfully associated with GO terms (Table S5), accounting for 50.63% of all unigenes. However, only 53,046 unigenes, representing 15.75% of the total unigenes, could be effectively annotated to corresponding KEGG pathways. These pathways were distributed across 121 different categories (Table S6).
To gain a more in-depth understanding of the functional roles of the key genes in leaf color differentiation, we conducted KEGG pathway and GO enrichment analyses. In W, the relative upregulated key genes were subjected to GO functional enrichment, revealing their enrichment in 145 GO terms, which could be categorized into five main classes: amino acid and organic acid transport (e.g., amino acid transport, amino acid transmembrane transport), cell wall metabolism (e.g., cell wall macromolecule catabolic process, cell wall macromolecule metabolic process, chitinase activity), wall-related enzyme activity (e.g., chitinase activity and galactosyltransferase activity), metabolic pathways (L-phenylalanine biosynthetic process, chitin metabolic process), and the regulation of biological processes (e.g., RNA-directed RNA polymerase complex, regulation of DNA-templated transcription) (Figure 2A; Table S7). Additionally, KEGG analysis only enriched eight pathways. This might be due to the relatively smaller number of unigenes included in the KEGG annotation background. However, similar to the GO enrichment results, these pathways can be simplified into categories such as transcription factors (TFs) regulatory pathways (e.g., Transcription factors and Plant hormone signal transduction), organic acid metabolism (e.g., Phenylalanine, tyrosine, and tryptophan biosynthesis and alpha-Linolenic acid metabolism), and Starch and sucrose metabolism (Figure 2A; Table S7).
Among the downregulated key genes, GO functional enrichment analysis revealed their enrichment in 175 GO terms, primarily falling into four categories: photosynthesis-related pathways (e.g., photosystem, photosynthetic membrane), chloroplast-related processes (e.g., chloroplast thylakoid, plastid stroma), redox reactions (e.g., oxidoreductase complex, photosystem II oxygen evolving complex, oxidoreductase activity), and metabolic processes (e.g., glycine catabolic process, serine family amino acid catabolic process) (Figure 2B; Table S8). Correspondingly, KEGG pathway analysis enriched 17 pathways, largely related to photosynthesis (e.g., Photosynthesis - antenna proteins, Photosynthesis proteins), amino acid metabolism (e.g., Alanine, aspartate, and glutamate metabolism, Arginine biosynthesis), and carbon and energy metabolism (e.g., Glyoxylate and dicarboxylate metabolism, One carbon pool by folate) (Figure 2B; Table S8).
The result of GO and KEGG functional enrichment indicates that as chlorophyll content decreases in the leaves, genes involved in TFs regulatory and organic acid metabolism pathways are significantly upregulated, while genes related to photosynthesis and carbohydrate metabolism pathways may be downregulated as the extent of chlorophyll deficiency increases.
3.5. Photosynthetic Pigments and Nutrient Concentrations of Three Color Types
To gain a deeper understanding of the formation mechanism and physiological response of the chlorophyll-deficient phenotype, we conducted quantitative analyses of photosynthetic pigments and nutrient contents in leaves of three color types. The analysis revealed a decreasing trend in the content of photosynthetic pigments in G, GW, and W types, consistent with their lack of green pigmentation (Figure 3A). There were no significant differences in the content of Ca, S, Zn, Mn, and Cu among the three types. However, significant differences were observed in the content of N and Fe among the types, with a decrease corresponding to the degree of chlorophyll deficiency (Figure 3B; Figure 3C). N is a key element in the amino acids and proteins that constitute chlorophyll molecules, while Fe is an essential trace element in the process of chlorophyll synthesis. Therefore, the observed variations might be due to an impediment in the transport and metabolism of these elements in tissues lacking chlorophyll, indirectly affecting the synthesis of chlorophyll and photosynthesis. Additionally, the content of Mg in GW and W types also decreased (Figure 3C). Since Mg is a core component of the chlorophyll molecule, this observation might be a consequence of the reduced chlorophyll content in the tissues. Concurrently, the decrease in K and Na content in W type (Figure 3C) may suggest changes in broader metabolic pathways and ion transport mechanisms potentially caused by chlorophyll deficiency and obstructed photosynthetic pathways.
4. Discussion
In previous studies on variegated plants, the rich diversity in leaf colors is primarily attributed to variations in the types, quantities, and distribution of pigments within leaf cells [22]. However, Silverstripe as a variegated plant, it characterized by a fact that white leaves resulting from chlorophyll deficiency, which represents a significant departure from color changes induced by pigment accumulation. Therefore, studying the functional genes associated with chlorophyll deficiency phenotype provides novel insights into plant leaf color variation.
Upon the identification of DEGs among different color types, it was observed that the number of downregulated genes in the chlorophyll-deficient W and GW phenotypes, as compared to the green G phenotype, exceeded the number of upregulated genes (Figure S1). Chlorophyll is a fundamental component of photosynthesis, and its deficiency can impact energy conversion and biomass accumulation [23]. Consequently, chlorophyll deficiency likely mediates gene expression changes at the RNA level, resulting in disruptions in various biological functions, including photosynthesis. The functional enrichment analysis of key genes that exhibit consistent upregulation in the chlorophyll-deficient phenotype reveals their association with transcription factor regulation and organic acid metabolism (Figure 2A). Plants can adapt to chlorophyll deficiency by adjusting metabolic pathways such as carbon and organic acid metabolism [24]. Some intermediates of the citric acid cycle are known to regulate certain enzymes in the chlorophyll synthesis pathway [25]. Notably, one of the precursors required for chlorophyll synthesis is 5-aminolevulinic acid (ALA) [26], and the citric acid cycle, also known as the tricarboxylic acid cycle, is one of the pathways for ALA production [25]. This suggests that the regulation of organic acid metabolism may influence the rate of chlorophyll synthesis. In the following discussion, we will explore the ALA biosynthesis pathway, the transcriptional changes related to chlorophyll deficiency, and their impact on photosynthesis and sugar metabolism.
4.1. Chlorophyll Biosynthesis in Chlorophyll Deficiency in Bamboo Leaves
Chlorophyll is the primary pigment in plant chloroplasts, actively participating in photosynthesis to convert light energy into chemical energy. Chlorophyll synthesis is a complex process involving multiple steps and precursor molecules, such as ALA, porphyrins, Mg-protoporphyrin, protopheophorbide, and protochlorophyllide [27]. Additionally, pyrrole is a nitrogen-containing organic compound and a crucial precursor for pigments like chlorophyll and hemoglobin [28]. The pyrrole metabolic pathway refers to a series of biochemical reactions from the precursor substance ALA to chlorophyll or hemoglobin [29].
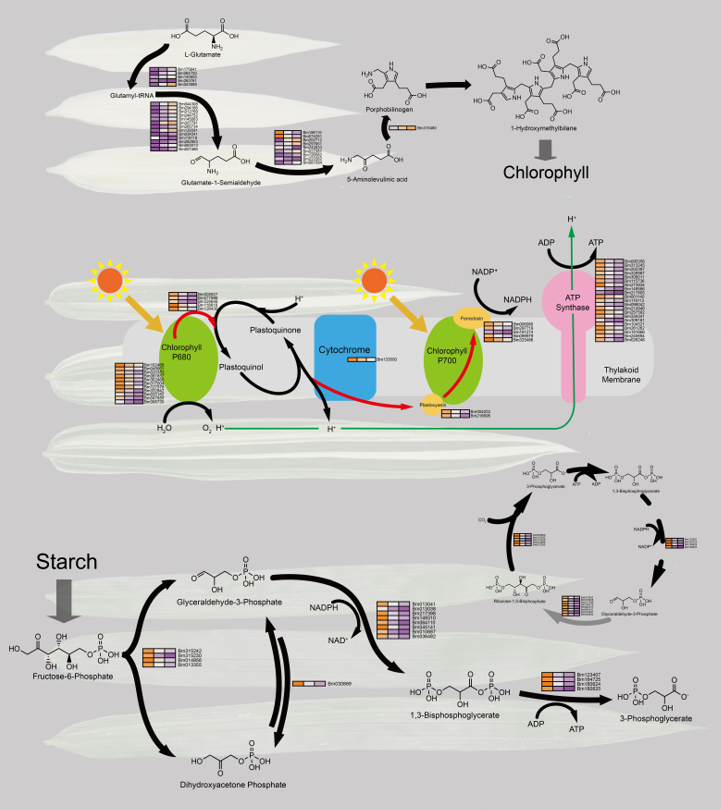
Unexpectedly, many structural genes related to the pyrrole biosynthetic pathway are instead increased expression in tissues with a higher degree of chlorophyll deficiency (Figure 4A). We identified 28 key genes in this pathway, with the majority of genes upregulated in the white phenotype, and only six genes downregulated. One possible inference is that these genes may be involved in negatively regulating the synthesis of various enzymes in the pyrrole biosynthetic pathway or accelerating the degradation of some chlorophyll precursor molecules. Additionally, when chloroplasts are deficient or damaged, plants may increase the synthesis of other pigments to compensate for the loss of photosynthesis [30]. Furthermore, the pyrrole metabolic pathway also provides essential functional molecules for plants, such as hemoglobin, vitamin B12, and carotenoids, which play crucial roles in plant respiration, metabolism, antioxidant defense, and photoprotection [28]. Therefore, the upregulation of these genes in expression may contribute to maintaining the supply of chlorophyll precursors, thus sustaining a certain level of chloroplast function and physiological stability. However, in the ALA pathway, a small subset of genes also exhibits higher expression in the green phenotype (Figure 4A). Since light is essential for the expression of hundreds of chloroplast- and photosynthesis-related genes, chlorophyll deficiency may result in some light-responsive genes not being activated normally [31]. This could potentially lead to the negative regulation of a few ALA synthesis genes by light-responsive genes.
Additionally, N is crucial for the synthesis of enzymes involved in chlorophyll production. A deficiency in N supply can directly impact the synthesis of chlorophyll, thereby affecting the plant's photosynthetic capability and overall health [32,33]. In the phenotype with chlorophyll deficiency, a decrease in N content could lead to a reduced rate of chlorophyll precursor biosynthesis and consequent reduction in the number or functionality of chloroplasts (Figure 3B; Figure 4A). Furthermore, the chlorophyll molecule consists of four pyrrole rings connected by N atoms, forming a ring structure around a Mg atom [34,35]. A decrease in Mg content directly affects the synthesis and stability of the chlorophyll molecule and might also impact the structure and function of chloroplasts (Figure 3B). Additionally, Fe acts as a cofactor for various enzymes involved in the synthesis of chlorophyll precursors. Notably, in the early stages of chlorophyll biosynthesis, Fe is a component of the enzyme divinyl protochlorophyllide reductase (DPOR), which is involved in converting protochlorophyllide into chlorophyll [36,37]. This suggests that the stability of chlorophyll precursor synthesis might be reduced in the chlorophyll-deficient phenotype. In summary, the reduction in the content of these elements could be due to genetic variations causing an obstruction in the chlorophyll synthesis pathway, or it might represent an adaptive response of the plant to the state of chlorophyll deficiency, reflecting the direct impact on chlorophyll synthesis and the physiological and metabolic regulation in response to the chlorophyll deficiency.
4.2. Chlorophyll Deficiency Induces Alterations in the Photosynthetic Process
The expression of pigment synthesis protein genes is followed by the expression of genes related to the light-dependent reactions of photosynthesis and the final carbon metabolism [38]. Chlorophyll is a core component of photosynthesis, and its loss affects energy conversion and biomass accumulation [23]. The results indicate that the downregulated DEGs in white leaves are involved in the light reactions of photosynthesis (Figure 4B), as expected due to the lack of chlorophyll in white leaves, hindering the proper functioning of photosynthesis.
The genes predominantly downregulated in white leaves are those that play a role in the light reactions of photosystem I and the reduction phase of the Calvin cycle (Figure 4B; Figure 4C), such as NADP+ reductase and glyceraldehyde-3-phosphate dehydrogenase. These genes are responsible for converting light energy into chemical energy and reducing fixed carbon dioxide to glyceraldehyde-3-phosphate. The downregulation of these genes implies a reduction in the efficiency of light energy utilization and carbon fixation in white leaves, leading to a decrease in carbohydrate levels. This aligns with reported effects of chlorophyll deficiency on plant physiological metabolism [39,40]. Additionally, the content of Fe is reduced in the phenotype of chlorophyll deficiency (Figure 3C). In chloroplasts, Fe, as a part of iron-sulfur proteins, participates in the electron transfer of photosynthesis [41,42], and we observed a downregulation of genes related to the electron transfer in photosynthesis (Figure 4B). Therefore, the reduction in Fe content may directly affect the biosynthesis of chlorophyll and the efficiency of the photosynthetic electron transport chain.
These observations reflect the inhibitory response of leaves to genes related to photosynthesis under conditions of chlorophyl deficiency. This regulatory mechanism may involve complex signaling pathways, including light signal transduction and plant hormone regulation [43,44,45]. These findings remind us that the differential gene regulation in white leaves is associated with maintaining plant energy balance and growth, providing deeper insights into understanding the regulatory network of photosynthesis.
4.3. Differential Glycolysis in Chlorophyll-Deficient Phenotypes
An intriguing finding is the downregulation of key genes in white leaves associated with glycolysis. This suggests that, despite defects in photosynthesis, white leaves may sustain survival by adjusting glycolysis. A previous study emphasized that plants, when facing disruptions in photosynthesis, regulate the activity of sugar metabolism pathways to maintain energy balance [46]. Glycolysis is crucial for plant growth and development as it not only provides energy but also participates in various biochemical processes [47]. A part of the glycolytic pathway, known as the Pentose Phosphate Pathway (PPP), shares some common intermediates with the Calvin cycle (Figure 4D). These intermediates can be interconverted in different pathways to meet the cell's energy and synthesis requirements [48,49].
On the other hand, deficiencies in protochlorophyllide or any of these other components lead to absent or aberrant prolamellar bodies [50]. Photosynthesis in chloroplasts is a highly regulated process, and the downregulation of sugar metabolism-related genes in white leaves may be due to the potential generation of oxygen radicals when chlorophyll is absent, leading to oxidative stress [6]. This oxidative stress results in lipid peroxidation and cell membrane damage, thereby reducing sugar metabolism to minimize reactive oxygen species production. We observed that the downregulated genes in white leaves are primarily involved in the glycolytic pathway, such as phosphoglyceraldehyde kinase and phosphoglycerate mutase, which both participate in the transfer of phosphate groups in sugar metabolism. The downregulation of these genes implies lower glycolytic activity and pentose phosphate pathway activity in white leaves, possibly as a response to cell damage and energy consumption caused by oxidative stress. Additionally, the regulation of aging by carbon signaling and the accumulation of sugars in aging leaves serve as signals for the initiation or acceleration of plant senescence [46,51]. The downregulation of sugar metabolism genes may contribute to increased sugar accumulation to some extent, ultimately leading to premature senescence in chloroplast-deficient tissues.
5. Conclusion
The diversity of leaf characteristics, including leaf color, is a prominent subject of study in plant science. Leaf color is predominantly determined by the synthesis and functionality of chlorophyll, a key component of photosynthesis. The regulation of chlorophyll synthesis and degradation involves complex gene interactions, and disruptions in these processes can lead to abnormal chlorophyll synthesis and impact leaf color. This study focuses on Bambusa multiplex f. silverstripe, a natural variant with various leaf colors, including green, white, and green-white leaves. The variations in leaf color are attributed to genetic factors and their influence on gene expression. By employing RNA-seq, we investigated the molecular mechanisms behind chlorophyll anomalies and genetic factors in Silverstripe.
Overall, the white phenotype exhibits lower levels of photosynthetic and sugar metabolism activity compared to the green phenotype, with potential implications for cellular structural damage and reduced chlorophyll synthesis efficiency. However, these mutant tissues demonstrate slower growth rates and shorter lifespans, potentially compromising their survival advantages [1,40]. Fortunately, in environments with lower competition and other mild environmental pressures, these mutant variants can maintain stable populations. As horticultural industries evolve, there is a growing appreciation for the ornamental value of these color mutants, leading to their cultivation and selective breeding. This may contribute to positive selection for genes associated with chlorophyll synthesis defects. Given the limited research on the regulatory relationships between mutation sites and transcriptional control in color mutant individuals, further studies from a whole-genome perspective are warranted to explore mutation sites related to chlorophyll deficiency in bamboo.
Supplementary Materials
The following supporting information can be downloaded at the website of this paper posted on Preprints.org, Figure S1. Benchmarking Universal Single-Copy Orthologs (BUSCO) assessment results of transcriptome assembly. Figure S2. Differentially expressed genes (DEGs) among different color types. Table S1. Summary of clean reads. Table S2. Unigene length interval and information of transcriptome assembly. Table S3. Count value of unigenes. Table S4. TPM value of unigenes. Table S5. GO annotation of unigenes. Table S6. KEGG annotation of unigenes. Table S7. GO and KEGG enrichment result of upregulated key genes. Table S8. GO and KEGG enrichment result of downregulated key genes. Document S1. Detailed Measuring Methods.
Author Contributions
PZ performed the Formal Analysis, Methodology and wrote the manuscript. LC contributed to Conceptualization and Investigation. Other authors suggested the concept of the review.
Funding
This research was funded by the National Key Research and Development Program of China (2021YFD2200501), Scientific Research Project of Fujian Province (2023J01478) and Forestry Peak Discipline Construction Project from Fujian Agriculture and Forestry University (72202200205). The funding agency was not involved in the design of the study, collection, analysis, interpretation of data and writing the manuscript.
Institutional Review Board Statement
Not applicable.
Informed Consent Statement
Not applicable.
Data Availability Statement
The data supporting the findings of this work are available within the paper and the supplementary material. Please request further information from the corresponding author.
Conflicts of Interest
The authors declare no conflict of interest.
References
- Zhao, M.-H.; Li, X.; Zhang, X.-X.; Zhang, H.; Zhao, X.-Y. Mutation Mechanism of Leaf Color in Plants: A Review. Forests 2020, 11, 851. [CrossRef]
- Peng, X.Q.; Ai, Y.J.; Pu, Y.T.; Wang, X.J.; Li, Y.H.; Wang, Z.; Zhuang, W.B.; Yu, B.J.; Zhu, Z.Q. Transcriptome and Metabolome Analyses Reveal Molecular Mechanisms of Anthocyanin-Related Leaf Color Variation in Poplar (Populus Deltoides) Cultivars. Front. Plant Sci. 2023, 14, 1103468. [CrossRef]
- Tripathy, B.C.; Pattanayak, G.K. Chlorophyll Biosynthesis in Higher Plants. In Photosynthesis; Eaton-Rye, J.J., Tripathy, B.C., Sharkey, T.D., Eds.; Advances in Photosynthesis and Respiration; Springer Netherlands: Dordrecht, 2012; Vol. 34, pp. 63–94 ISBN 978-94-007-1578-3. Dordrecht.
- Gao, L.-L.; Hong, Z.-H.; Wang, Y.; Wu, G.-Z. Chloroplast Proteostasis: A Story of Birth, Life, and Death. Plant Communications 2023, 4, 100424. [CrossRef]
- Fu, M.; Cheng, S.; Xu, F.; Chen, Z.; Liu, Z.; Zhang, W.; Zheng, J.; Wang, L. Advance in Mechanism of Plant Leaf Colour Mutation. Not Bot Horti Agrobo 2021, 49, 12071. [CrossRef]
- Cackett, L.; Luginbuehl, L.H.; Schreier, T.B.; Lopez-Juez, E.; Hibberd, J.M. Chloroplast Development in Green Plant Tissues: The Interplay between Light, Hormone, and Transcriptional Regulation. New Phytologist 2022, 233, 2000–2016. [CrossRef]
- Nakayama, H.; Leichty, A.R.; Sinha, N.R. Molecular Mechanisms Underlying Leaf Development, Morphological Diversification, and Beyond. The Plant Cell 2022, 34, 2534–2548. [CrossRef]
- Tyagi, P.; Singh, D.; Mathur, S.; Singh, A.; Ranjan, R. Upcoming Progress of Transcriptomics Studies on Plants: An Overview. Front. Plant Sci. 2022, 13, 1030890. [CrossRef]
- Chen, S.; Zhou, Y.; Chen, Y.; Gu, J. Fastp: An Ultra-Fast All-in-One FASTQ Preprocessor. Bioinformatics 2018, 34, i884–i890. [CrossRef]
- Haas, B.J.; Papanicolaou, A.; Yassour, M.; Grabherr, M.; Blood, P.D.; Bowden, J.; Couger, M.B.; Eccles, D.; Li, B.; Lieber, M.; et al. De Novo Transcript Sequence Reconstruction from RNA-Seq Using the Trinity Platform for Reference Generation and Analysis. Nat Protoc 2013, 8, 1494–1512. [CrossRef]
- Davidson, N.M.; Oshlack, A. Corset: Enabling Differential Gene Expression Analysis for de Novoassembled Transcriptomes. Genome Biol 2014, 15, 410. [CrossRef]
- Simão, F.A.; Waterhouse, R.M.; Ioannidis, P.; Kriventseva, E.V.; Zdobnov, E.M. BUSCO: Assessing Genome Assembly and Annotation Completeness with Single-Copy Orthologs. Bioinformatics 2015, 31, 3210–3212. [CrossRef]
- Cantalapiedra, C.P.; Hernández-Plaza, A.; Letunic, I.; Bork, P.; Huerta-Cepas, J. eggNOG-Mapper v2: Functional Annotation, Orthology Assignments, and Domain Prediction at the Metagenomic Scale. Molecular Biology and Evolution 2021, 38, 5825–5829. [CrossRef]
- Altschul, S.F.; Gish, W.; Miller, W.; Myers, E.W.; Lipman, D.J. Basic Local Alignment Search Tool. Journal of Molecular Biology 1990, 215, 403–410. [CrossRef]
- Aramaki, T.; Blanc-Mathieu, R.; Endo, H.; Ohkubo, K.; Kanehisa, M.; Goto, S.; Ogata, H. KofamKOALA: KEGG Ortholog Assignment Based on Profile HMM and Adaptive Score Threshold. Bioinformatics 2020, 36, 2251–2252. [CrossRef]
- Moriya, Y.; Itoh, M.; Okuda, S.; Yoshizawa, A.C.; Kanehisa, M. KAAS: An Automatic Genome Annotation and Pathway Reconstruction Server. Nucleic Acids Research 2007, 35, W182–W185. [CrossRef]
- Langmead, B.; Salzberg, S.L. Fast Gapped-Read Alignment with Bowtie 2. Nat Methods 2012, 9, 357–359. [CrossRef]
- Li, B.; Dewey, C.N. RSEM: Accurate Transcript Quantification from RNA-Seq Data with or without a Reference Genome. BMC Bioinformatics 2011, 12, 323. [CrossRef]
- Chen, C.; Chen, H.; Zhang, Y.; Thomas, H.R.; Frank, M.H.; He, Y.; Xia, R. TBtools: An Integrative Toolkit Developed for Interactive Analyses of Big Biological Data. Molecular Plant 2020, 13, 1194–1202. [CrossRef]
- Love, M.I.; Huber, W.; Anders, S. Moderated Estimation of Fold Change and Dispersion for RNA-Seq Data with DESeq2. Genome Biol 2014, 15, 550. [CrossRef]
- Wu, T.; Hu, E.; Xu, S.; Chen, M.; Guo, P.; Dai, Z.; Feng, T.; Zhou, L.; Tang, W.; Zhan, L.; et al. clusterProfiler 4.0: A Universal Enrichment Tool for Interpreting Omics Data. The Innovation 2021, 2, 100141. [CrossRef]
- Guo, P.; Huang, Z.; Zhao, W.; Lin, N.; Wang, Y.; Shang, F. Mechanisms for Leaf Color Changes in Osmanthus Fragrans ‘Ziyan Gongzhu’ Using Physiology, Transcriptomics and Metabolomics. BMC Plant Biol 2023, 23, 453. [CrossRef]
- Horton, P. Molecular Design of the Photosystem II Light-Harvesting Antenna: Photosynthesis and Photoprotection. Journal of Experimental Botany 2004, 56, 365–373. [CrossRef]
- Maeda, H.A.; Fernie, A.R. Evolutionary History of Plant Metabolism. Annu. Rev. Plant Biol. 2021, 72, 185–216. [CrossRef]
- Akram, M. Citric Acid Cycle and Role of Its Intermediates in Metabolism. Cell Biochem Biophys 2014, 68, 475–478. [CrossRef]
- Jiang, M.; Hong, K.; Mao, Y.; Ma, H.; Chen, T.; Wang, Z. Natural 5-Aminolevulinic Acid: Sources, Biosynthesis, Detection and Applications. Front. Bioeng. Biotechnol. 2022, 10, 841443. [CrossRef]
- Zhang, W.; Willows, R.D.; Deng, R.; Li, Z.; Li, M.; Wang, Y.; Guo, Y.; Shi, W.; Fan, Q.; Martin, S.S.; et al. Bilin-Dependent Regulation of Chlorophyll Biosynthesis by GUN4. Proc. Natl. Acad. Sci. U.S.A. 2021, 118, e2104443118. [CrossRef]
- Wang, P.; Grimm, B. Connecting Chlorophyll Metabolism with Accumulation of the Photosynthetic Apparatus. Trends in Plant Science 2021, 26, 484–495. [CrossRef]
- Brzezowski, P.; Richter, A.S.; Grimm, B. Regulation and Function of Tetrapyrrole Biosynthesis in Plants and Algae. Biochimica et Biophysica Acta (BBA) - Bioenergetics 2015, 1847, 968–985. [CrossRef]
- Woodson, J.D.; Joens, M.S.; Sinson, A.B.; Gilkerson, J.; Salomé, P.A.; Weigel, D.; Fitzpatrick, J.A.; Chory, J. Ubiquitin Facilitates a Quality-Control Pathway That Removes Damaged Chloroplasts. Science 2015, 350, 450–454. [CrossRef]
- Hills, A.C.; Khan, S.; López-Juez, E. Chloroplast Biogenesis-Associated Nuclear Genes: Control by Plastid Signals Evolved Prior to Their Regulation as Part of Photomorphogenesis. Front. Plant Sci. 2015, 6. [CrossRef]
- Mahmud, K.; Makaju, S.; Ibrahim, R.; Missaoui, A. Current Progress in Nitrogen Fixing Plants and Microbiome Research. Plants 2020, 9. [CrossRef]
- Ye, J.Y.; Tian, W.H.; Jin, C.W. Nitrogen in Plants: From Nutrition to the Modulation of Abiotic Stress Adaptation. Stress Biology 2022, 2, 4. [CrossRef]
- Battersby, A.R. Tetrapyrroles: The Pigments of Life. Nat. Prod. Rep. 2000, 17, 507–526. [CrossRef]
- Eckhardt, U.; Grimm, B.; Hrtensteiner, S. Recent Advances in Chlorophyll Biosynthesis and Breakdown in Higher Plants. Plant Mol Biol 2004, 56, 1–14. [CrossRef]
- Yamamoto, H.; Nomata, J.; Fuita, Y. Functional Expression of Nitrogenase-like Protochlorophyllide Reductase from Rhodobacter Capsulatus in Escherichia Coli. Photochem. Photobiol. Sci. 2008, 7, 1238–1242. [CrossRef]
- Fujita, Y.; Yamakawa, H. Biochemistry of Chlorophyll Biosynthesis in Photosynthetic Prokaryotes. In Modern Topics in the Phototrophic Prokaryotes: Metabolism, Bioenergetics, and Omics; Hallenbeck, P.C., Ed.; Springer International Publishing: Cham, 2017; pp. 67–122 ISBN 978-3-319-51365-2.
- Loudya, N.; Mishra, P.; Takahagi, K.; Uehara-Yamaguchi, Y.; Inoue, K.; Bogre, L.; Mochida, K.; López-Juez, E. Cellular and Transcriptomic Analyses Reveal Two-Staged Chloroplast Biogenesis Underpinning Photosynthesis Build-up in the Wheat Leaf. Genome Biol 2021, 22, 151. [CrossRef]
- Su, N.; Hu, M.-L.; Wu, D.-X.; Wu, F.-Q.; Fei, G.-L.; Lan, Y.; Chen, X.-L.; Shu, X.-L.; Zhang, X.; Guo, X.-P.; et al. Disruption of a Rice Pentatricopeptide Repeat Protein Causes a Seedling-Specific Albino Phenotype and Its Utilization to Enhance Seed Purity in Hybrid Rice Production. Plant Physiology 2012, 159, 227–238. [CrossRef]
- Wang, L.; Yue, C.; Cao, H.; Zhou, Y.; Zeng, J.; Yang, Y.; Wang, X. Biochemical and Transcriptome Analyses of a Novel Chlorophyll-Deficient Chlorina Tea Plant Cultivar. BMC Plant Biol 2014, 14, 352. [CrossRef]
- Sun, N.; Dey, A.; Xiao, Z.; Wedd, A.G.; Hodgson, K.O.; Hedman, B.; Solomon, E.I. Solvation Effects on S K-Edge XAS Spectra of Fe−S Proteins: Normal and Inverse Effects on WT and Mutant Rubredoxin. J. Am. Chem. Soc. 2010, 132, 12639–12647. [CrossRef]
- Rao, G.; Pattenaude, S.A.; Alwan, K.; Blackburn, N.J.; Britt, R.D.; Rauchfuss, T.B. The Binuclear Cluster of [FeFe] Hydrogenase Is Formed with Sulfur Donated by Cysteine of an [Fe(Cys)(CO) 2 (CN)] Organometallic Precursor. Proc. Natl. Acad. Sci. U.S.A. 2019, 116, 20850–20855. [CrossRef]
- Muhammad, I.; Shalmani, A.; Ali, M.; Yang, Q.-H.; Ahmad, H.; Li, F.B. Mechanisms Regulating the Dynamics of Photosynthesis Under Abiotic Stresses. Front. Plant Sci. 2021, 11, 615942. [CrossRef]
- Liu, Y.; Jafari, F.; Wang, H. Integration of Light and Hormone Signaling Pathways in the Regulation of Plant Shade Avoidance Syndrome. aBIOTECH 2021, 2, 131–145. [CrossRef]
- Gupta, N.; Nath, U. Integration of Light and Hormone Response during Seedling Establishment. J. Plant Biochem. Biotechnol. 2020, 29, 652–664. [CrossRef]
- Wingler, A.; Masclaux-Daubresse, C.; Fischer, A.M. Sugars, Senescence, and Ageing in Plants and Heterotrophic Organisms. Journal of Experimental Botany 2009, 60, 1063–1066. [CrossRef]
- Raheel, C.; Matthew Biochemistry, Glycolysis. Available online: https://www.ncbi.nlm.nih.gov/books/NBK482303/.
- Liu, Q.; Zhu, F.; Liu, X.; Lu, Y.; Yao, K.; Tian, N.; Tong, L.; Figge, D.A.; Wang, X.; Han, Y.; et al. Non-Oxidative Pentose Phosphate Pathway Controls Regulatory T Cell Function by Integrating Metabolism and Epigenetics. Nat Metab 2022, 4, 559–574. [CrossRef]
- Gupta, R.; Gupta, N. Glycolysis and Gluconeogenesis. In Fundamentals of Bacterial Physiology and Metabolism; Springer Singapore: Singapore, 2021; pp. 267–287 ISBN 9789811607226.
- Solymosi, K.; Aronsson, H. Etioplasts and Their Significance in Chloroplast Biogenesis. In Plastid Development in Leaves during Growth and Senescence; Biswal, B., Krupinska, K., Biswal, U.C., Eds.; Advances in Photosynthesis and Respiration; Springer Netherlands: Dordrecht, 2013; Vol. 36, pp. 39–71 ISBN 978-94-007-5723-3.
- Wingler, A.; Henriques, R. Sugars and the Speed of Life—Metabolic Signals That Determine Plant Growth, Development and Death. Physiologia Plantarum 2022, 174, e13656. [CrossRef]
Figure 1.
(A) Three leaf color types. As the degree of chlorophyll deficiency in the leaves increases, the growth vigor will weaken. (B) Principal Component Analysis (PCA) Distribution of three color types. (C) correlation heatmap of three color types. (D) A Venn plot illustrating the filtration of common differentially expressed genes (DEGs) among different combinations. (E) A cluster analysis of transcripts per kilobase million (TPM) values for the common DEGs. G: green leaves. GW: green-white leaves. W: white leaves.
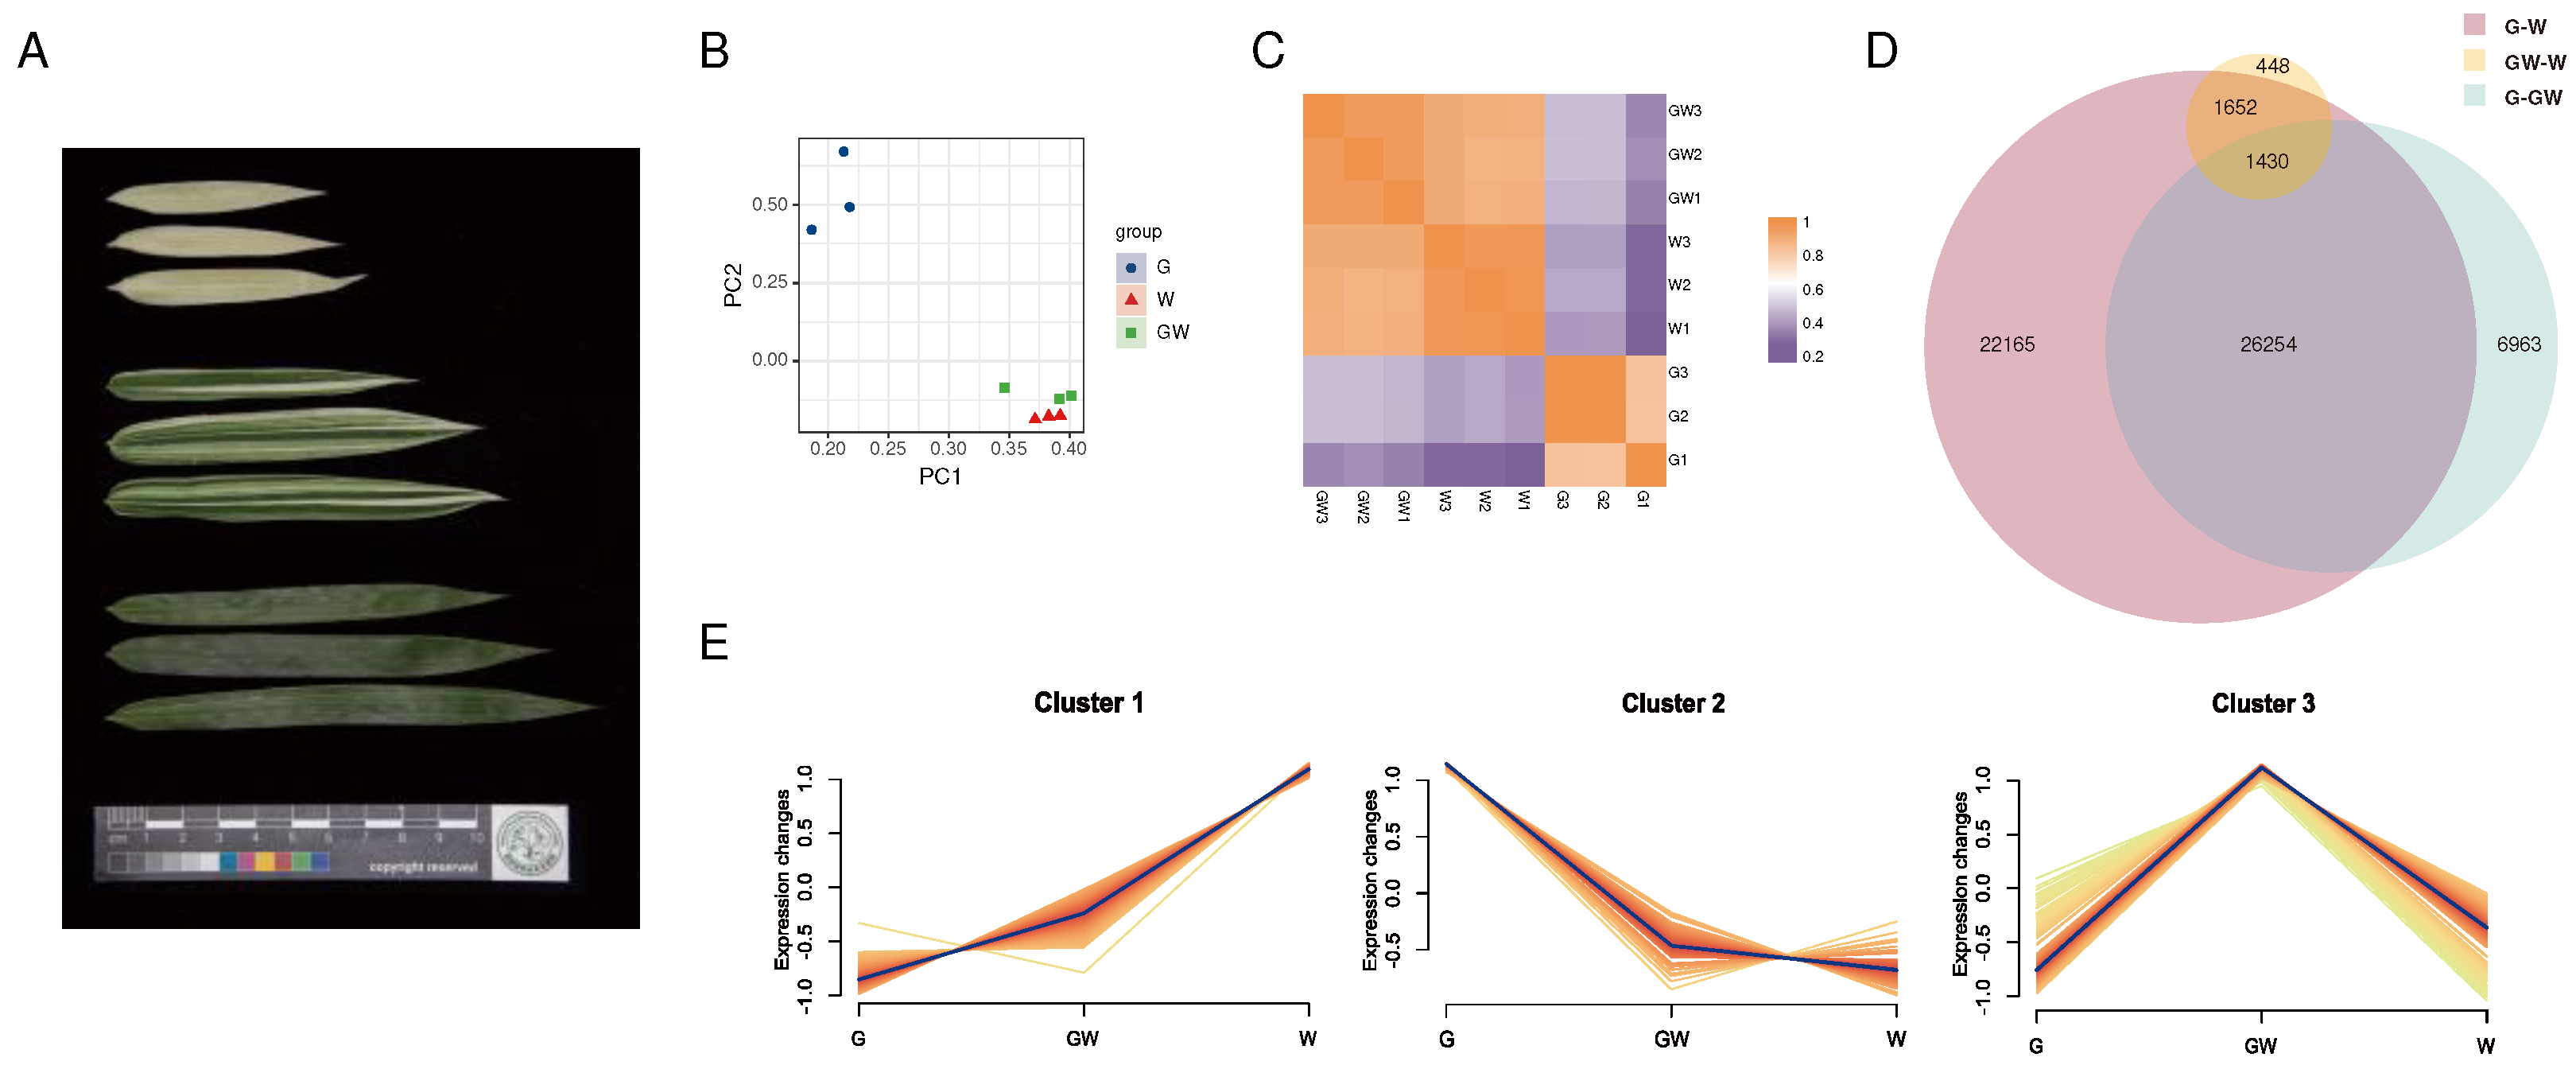
Figure 2.
Function enrichment result of key genes. (A) GO and KEGG enrichment of upregulated key genes. (B) GO and KEGG enrichment of downregulated key genes.
Figure 2.
Function enrichment result of key genes. (A) GO and KEGG enrichment of upregulated key genes. (B) GO and KEGG enrichment of downregulated key genes.
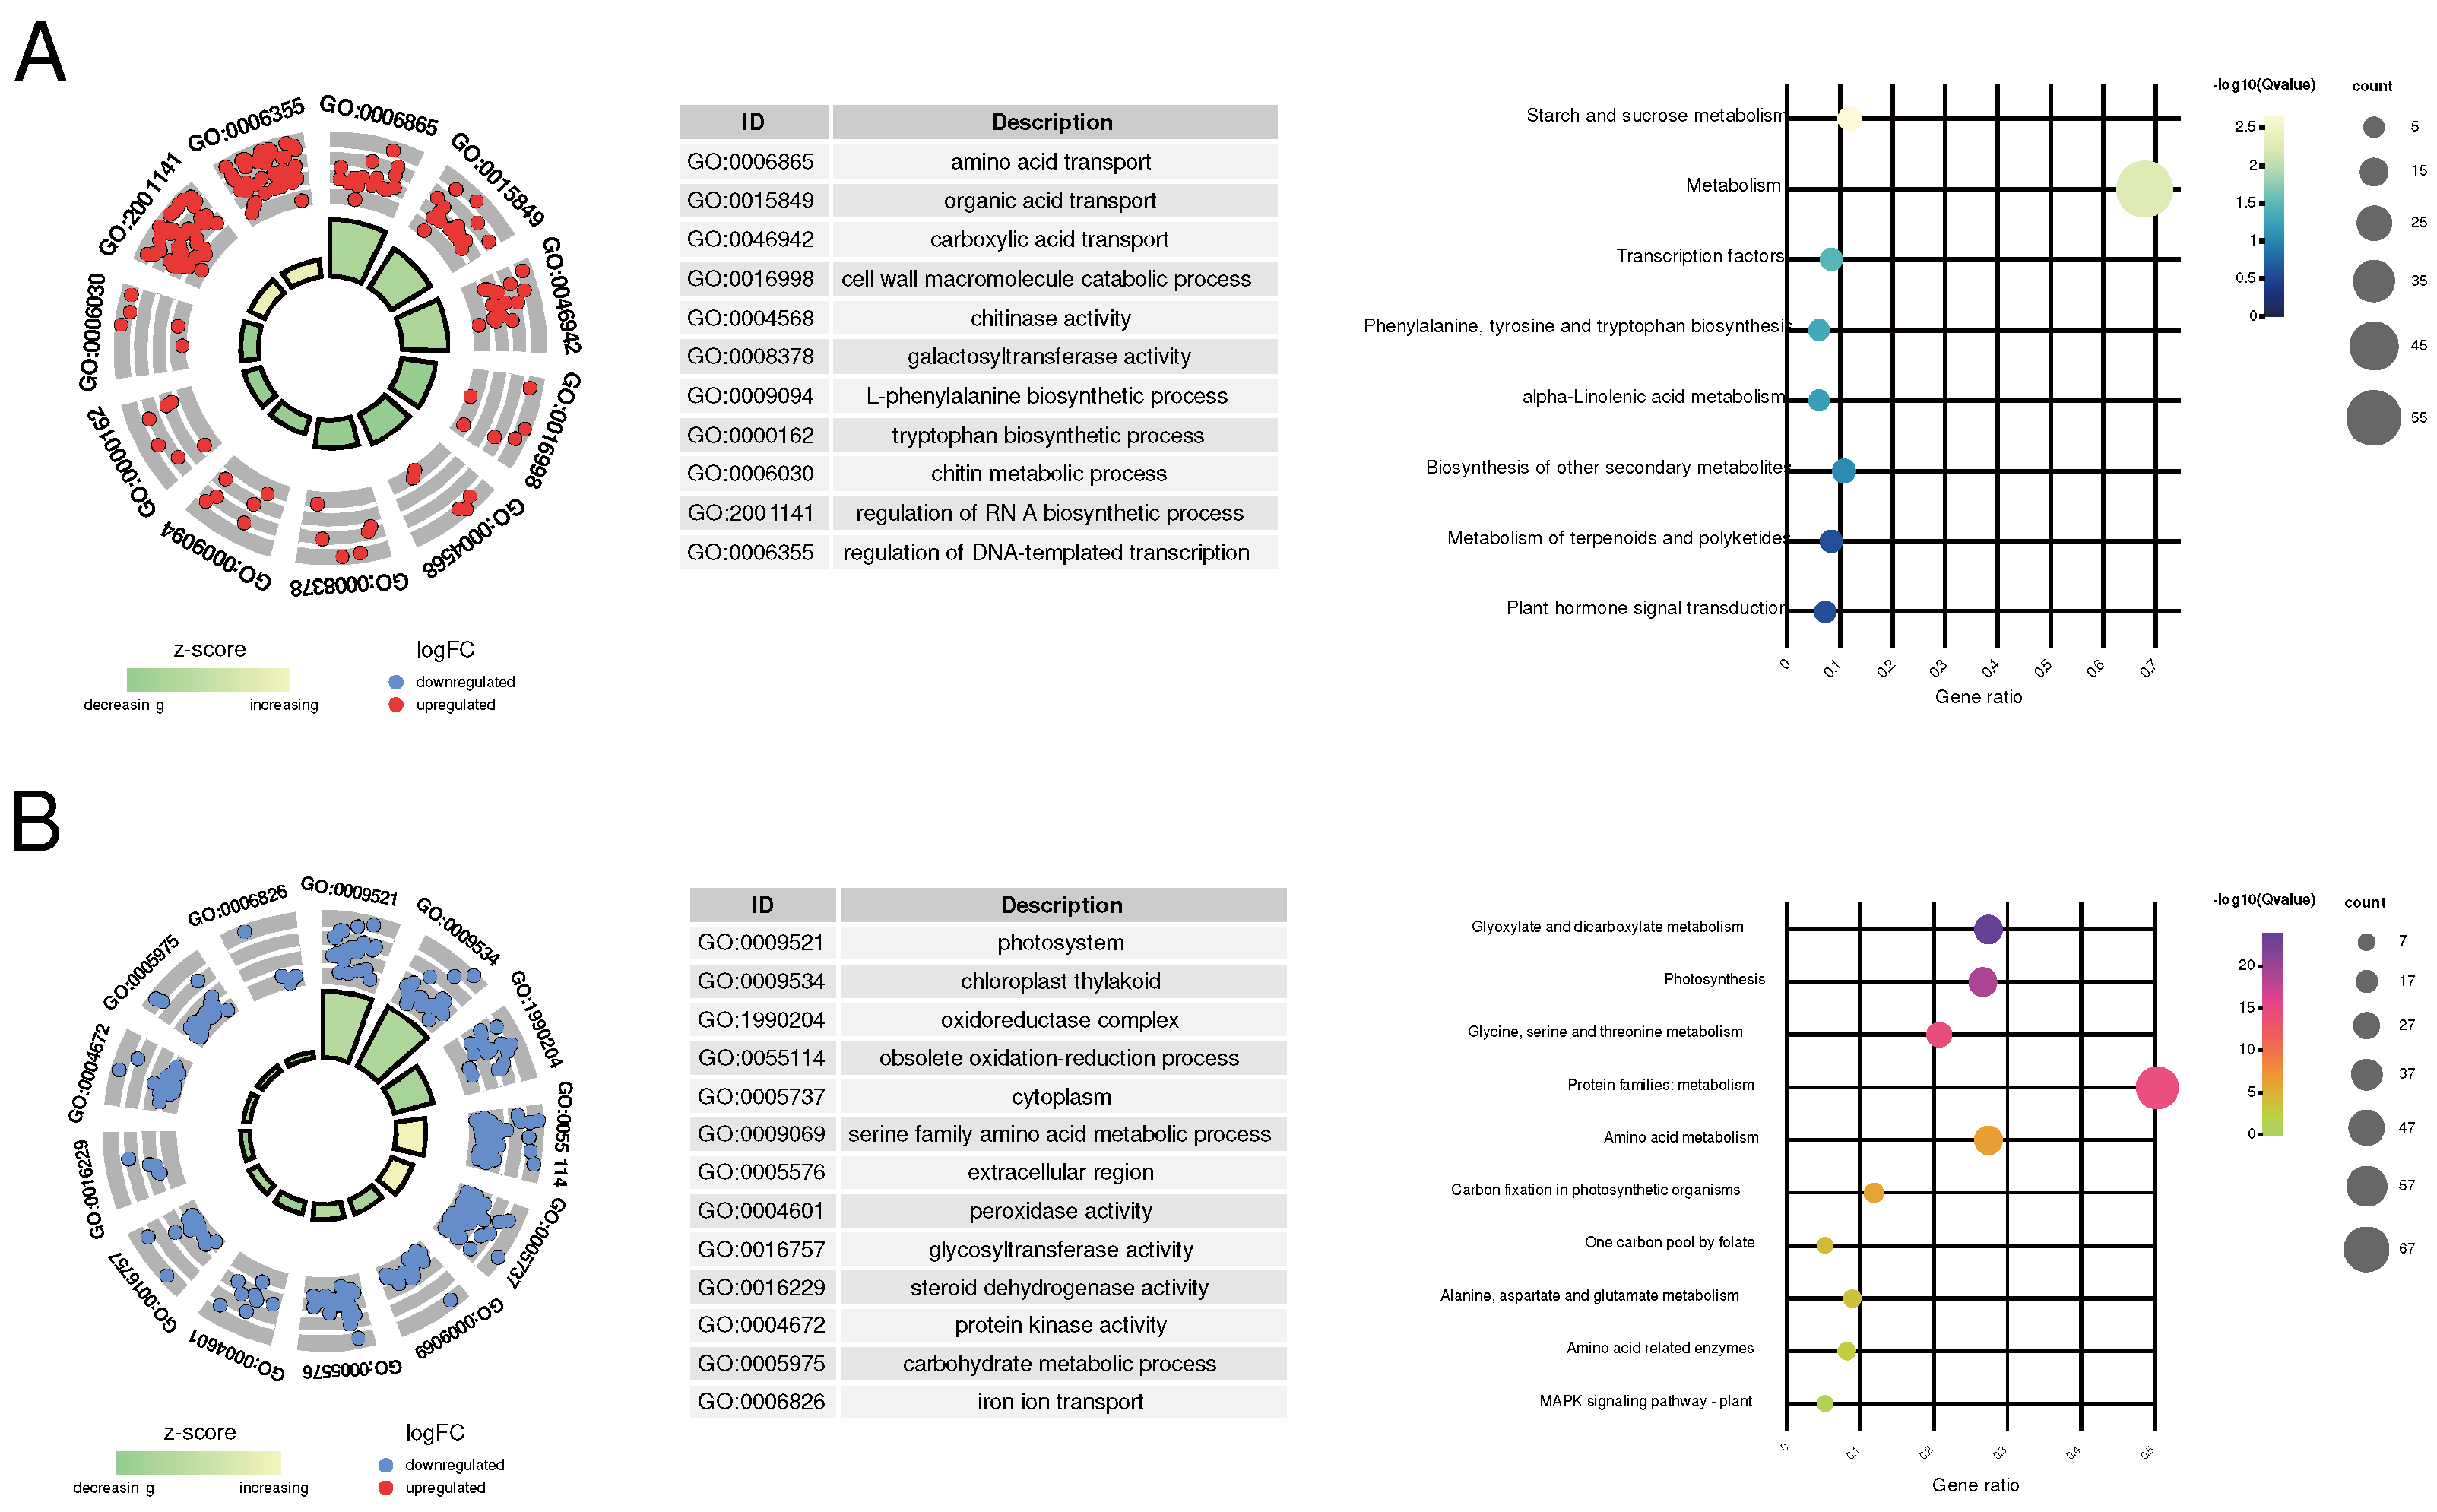
Figure 3.
(A) Concentrations of photosynthetic pigments. (B) Concentrations of micronutrient. (C) Concentrations of macronutrient.
Figure 3.
(A) Concentrations of photosynthetic pigments. (B) Concentrations of micronutrient. (C) Concentrations of macronutrient.
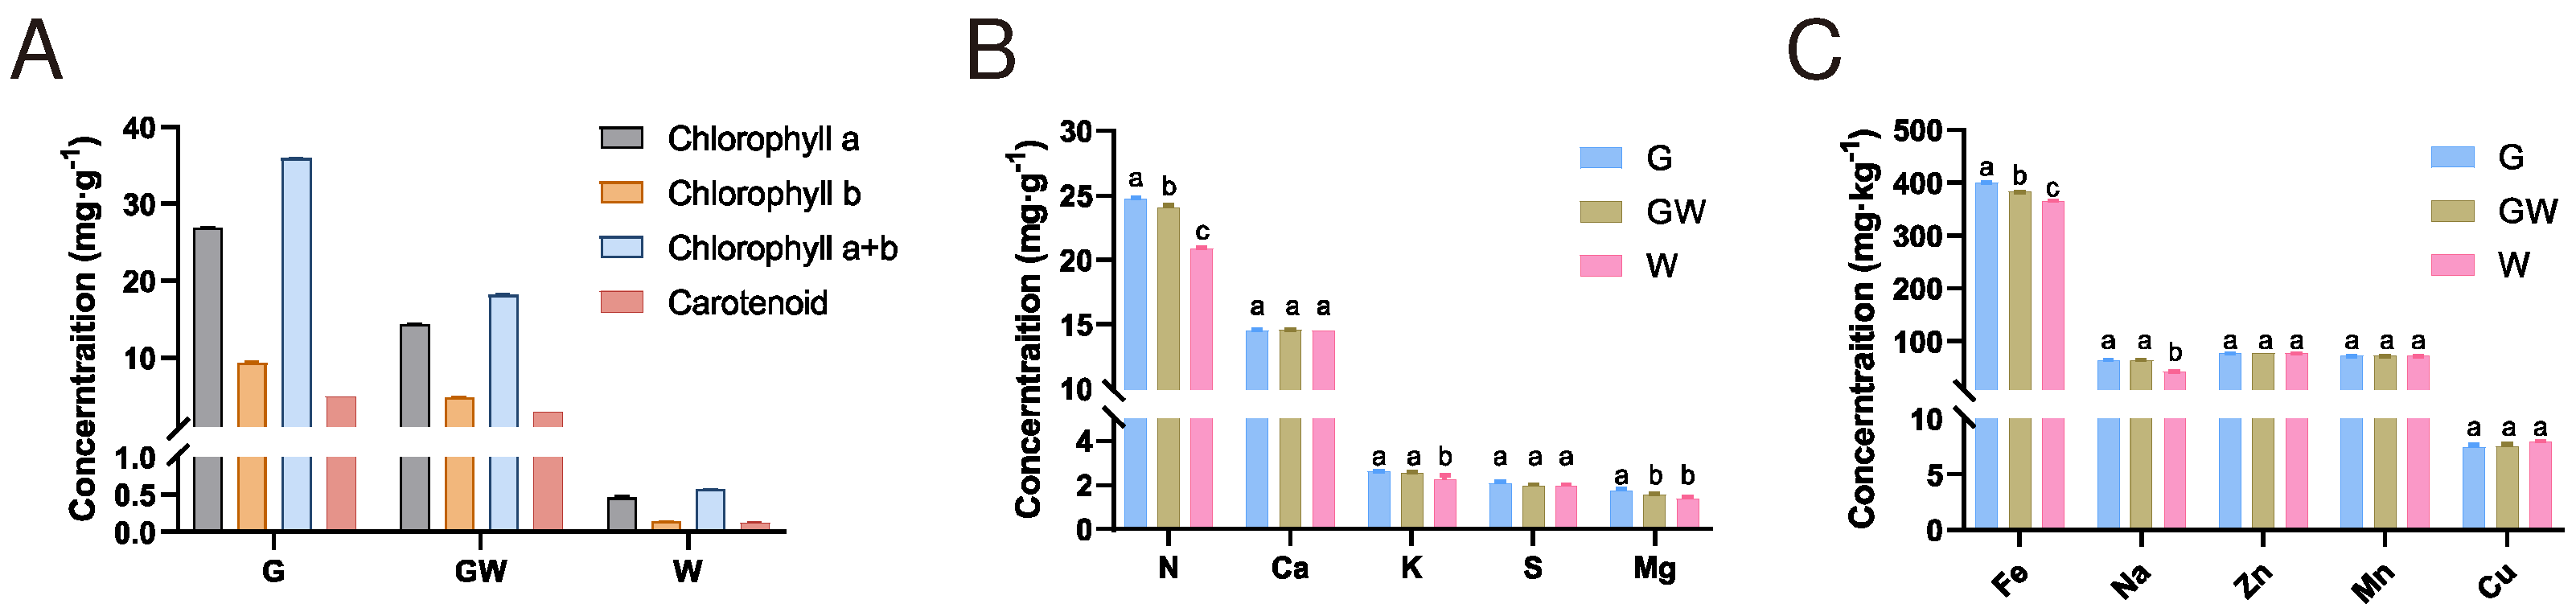
Figure 4.
(A) Tetrapyrrole biosynthesis pathway. (B) Photoreaction process in photosynthesis. (C) Calvin cycle process in photosynthesis. (D) Plant glycolysis process. Black arrows indicate substance conversion. Gray arrows indicate substance conversion with omitted intermediate products. Red arrows indicate electron transfer. Green arrows indicate H+ transfer. The dashed lines in the figure represent the departure of some metabolites from the cycle.

Disclaimer/Publisher’s Note: The statements, opinions and data contained in all publications are solely those of the individual author(s) and contributor(s) and not of MDPI and/or the editor(s). MDPI and/or the editor(s) disclaim responsibility for any injury to people or property resulting from any ideas, methods, instructions or products referred to in the content. |
© 2023 by the authors. Licensee MDPI, Basel, Switzerland. This article is an open access article distributed under the terms and conditions of the Creative Commons Attribution (CC BY) license (http://creativecommons.org/licenses/by/4.0/).
Copyright: This open access article is published under a Creative Commons CC BY 4.0 license, which permit the free download, distribution, and reuse, provided that the author and preprint are cited in any reuse.


