
Submitted:
13 November 2023
Posted:
14 November 2023
You are already at the latest version
Abstract
Somerateofmutationisinevitable,eveningenesthatthemselvesdeterminethemutation rate. Because mutation in these genes can alter the mutation rate, variation in the mutation rate is inevitable. This simple line of reasoning is corroborated by a handful of empirical studies that found mutation-rate variation in natural and laboratory populations. The evolutionary consequences of mutation-rate variation in natural populations can be many and can be difficult to predict, as selection on such variation can be both direct and indirect. For example, lineages with increased mutation rate will have increased adaptability in the long term but decreased overall fitness in the short term because most fitness mutations are immediately deleterious. In spite of its great relevance to basic and applied science, the rate of mutation to mutator phenotype continues to be essentially unknown. The reasons for this gap in our knowledge are largely methodological; in general, a mutator phenotype cannot be observed directly but must instead be inferred from numbers of some neutral “marker” mutation that can be observed directly: different mutation-rate variants will produce this marker mutation at different rates. Here, we derive the expected distribution of numbers of the marker mutants observed, accounting for the fact that some of the mutants will have been produced by a mutator phenotype that itself arose by mutation during the growth of the culture. This development makes possible a novel experimental protocol for estimating the rate of mutation to mutator phenotype. Simulated experiments using biologically-reasonable parameters that employ this protocol show that such experiments in the lab can give us fairly accurate estimates of the rate of mutation to mutator phenotype. Although our ability to estimate mutation-to-mutator rates from simulated experiments is promising, we view this study as a proof-of-concept study and only a first step towards practical empirical estimation.
Keywords:
fluctuation assay
; Luria-Delbruck distribution
; mutation rate evolution
1. Introduction
Replication fidelity is paramount to the survival of species and to the origin of complex life [1,2]. The fidelity required for survival increases with the complexity of an organism [1], the length of its genome [1,3,4], and the genetic linkage within that genome [5]. That such high fidelity of replication is vital to survival is evidenced by the observation that, across the tree of life, large fractions of organisms’ genomes consist of genes dedicated to aspects of replication, proofreading and repair that insure high-fidelity replication [6,7,8]. Any mutation appearing within any of these many genes has the potential to affect replication fidelity. In this light, it is not surprising that variation in replication fidelity has been observed in many species [9,10,11]. The amount of variation in mutation rate, however, is not necessarily reflective of the rate of mutation to mutation-rate variants, as indirect selection on the mutation rate in nature is a major confounding factor that is variable. Additionally, the number of mutations occurring in replication and repair genes that actually affect replication fidelity is largely unknown. And of those mutations that do affect fidelity, the magnitude of that effect is also largely unknown. This deficits in our knowledge surrounding the mutation rate to mutation-rate variants is primarily due to methodological difficulties and certainly not to a lack of interest or importance. Filling these gaps in our knowledge would impact both basic and applied sciences, shedding new light on basic evolutionary processes and providing key parameters that have been missing from cancer biology, bacterial evolution, and viral evolution. The present manuscript develops a novel method for estimating these missing parameters. It takes advantage of an under-appreciated way to increase statistical power in such assays, dubbed the “Jones protocol” [12,13,14]. We test our methods against computer simulations of feasible laboratory experiments using biologically reasonable parameters, and we find that it may indeed be possible to empirically estimate rates of mutation to mutation-rate variants. We briefly discuss application of these methods to the study of organismal and somatic evolution.
The observation that all eukaryotes have costly mechanisms for proofreading and repair suggests that low mutation rates must be advantageous and perhaps even essential for the survival of species. Even the large RNA virus SARS-CoV-2 has primitive proofreading/repair machinery, providing a large mutational target for mutation-rate variation [15]. A fairly simple information-theoretic argument [1,16] predicts an inverse relationship between the length of an organism’s genome and the maximum tolerable mutation rate allowed (or minimum replication fidelity required) for the organism’s long-term survival [4,16,17,18,19,20,21].
One way organisms can reduce the effective length of their genome and thereby tolerate higher mutation rates is by introducing recombination [22]. The observation that asexual species on the tree of life are rare and relatively short-lived may be interpreted as evidence for the evolutionary advantage of sex and recombination [23,24]; but it can also be interpreted as evidence for the evolutionary advantage of low genomic, or more precisely, low effective-genomic, mutation rates. Under free recombination, the effective-genomic mutation rate is the genic mutation rate, i.e., the per-gene mutation rate, which can be much lower than the per-genome mutation rate.
A previous study [25] estimated the rate of mutation to mutator phenotype made possible by an observation that mutators would form colonies on plates that looked qualitatively different from non-mutators (or wildtype). This study depended, however, on the judgment of a human being peering into a microscope. Furthermore, the authors of this study employed one type of cell and made no claims that such distinguishable colony morphology might be observed with other cell types. The methodology we present here does not depend on cell type, colony morphology or on the accuracy of a possibly overworked lab technician.
In addition to basic evolutionary questions our experimental protocol can address, such as those outlined above, there are also significant biomedical applications that can be addressed, not least of which is cancer research [26,27,28,29,30,31,32,33,34]. The rate at which mutation rate variants are produced in populations of somatic cells is a key parameter for understanding and predicting somatic evolution leading to oncogenic transitions; despite its critical role, however, this parameter remains unknown. The work we present here may help to remedy this deficiency.
2. Materials and Methods
2.1. Definitions
| initial and final population size | |
| r | growth rate |
| marker mutation rate of wildtype | |
| marker mutation rate of mutator | |
| rate of mutation from wildtype to mutator | |
| m | factor by which wildtype and mutator mutation rates differ: |
| recruitment rate of mutations; e.g. for marker recruitment rate on the wildtype background | |
| probability that a mutation appearing at time t leaves k mutants in the final population | |
| expected number of mutations of “type k”, i.e., that leave k mutants in the final population | |
| time at which population attains its maximum size: | |
| total number of marker mutations that occur on the wildtype background: | |
| total number of mutator mutations that occur on the wildtype background: | |
| pgf for the total number of mutants observed in the final population, given that a total of mutations occurred during growth. | |
| fast Fourier transform of function f. | |
| likelihood function for the i-th growth cycle. | |
A “mutation” is an error that occurs during replication. A “mutant” is an individual that carries a “mutation”. Mutations of interest here are specific mutations (replication errors) that can be observed experimentally. For example, two ways in which specific mutations can be observed are: 1) by eliminating everyone in the population that does not carry the specific mutation (for example, applying an antibiotic to screen for antibiotic-resistant mutations), and 2) by causing a fluorescent marker to fluoresce. Such observable mutations are sometimes called “selectable markers”, and we will refer to such mutations as “marker mutations”, and to the rate at which such mutations occur as “marker mutation rate”. When a mutation occurs, it becomes the founding member of a new “mutant lineage” in which all descendants will carry that “mutation”. In what follows, we use the terms “mutation” and “mutant lineage” interchangeably. For example, we will introduce the concept of a “type-k mutation”, referring to a marker mutation that forms a mutant lineage that ultimately gives rise to k “marker mutants” in the final culture. (We could equivalently say “type-k mutant lineages”.)
By “mutator”, we refer to a genotype with some mutation in its replication/proofreading/repair mechanisms that causes it to replicate with reduced accuracy. And here we digress briefly to explain the title of our paper: “Estimating the rate of mutation to a mutator phenotype”. A more accurate title might be “Estimating the rate of mutation to a mutation-rate-variant phenotype”, as our methods could in theory detect a decrease in mutation rate as well as an increase. We have kept the former title, however, because mutator mutations (mutations that increase mutation rate) are typically loss-of-function mutations and are therefore overwhelmingly more common than mutations that decrease mutation rate (which are gain-of-function mutations).
2.2. Experimental Protocol
- Grow a bacterial population from initial size to a large (known) number, N, at time T.
-
At time T:
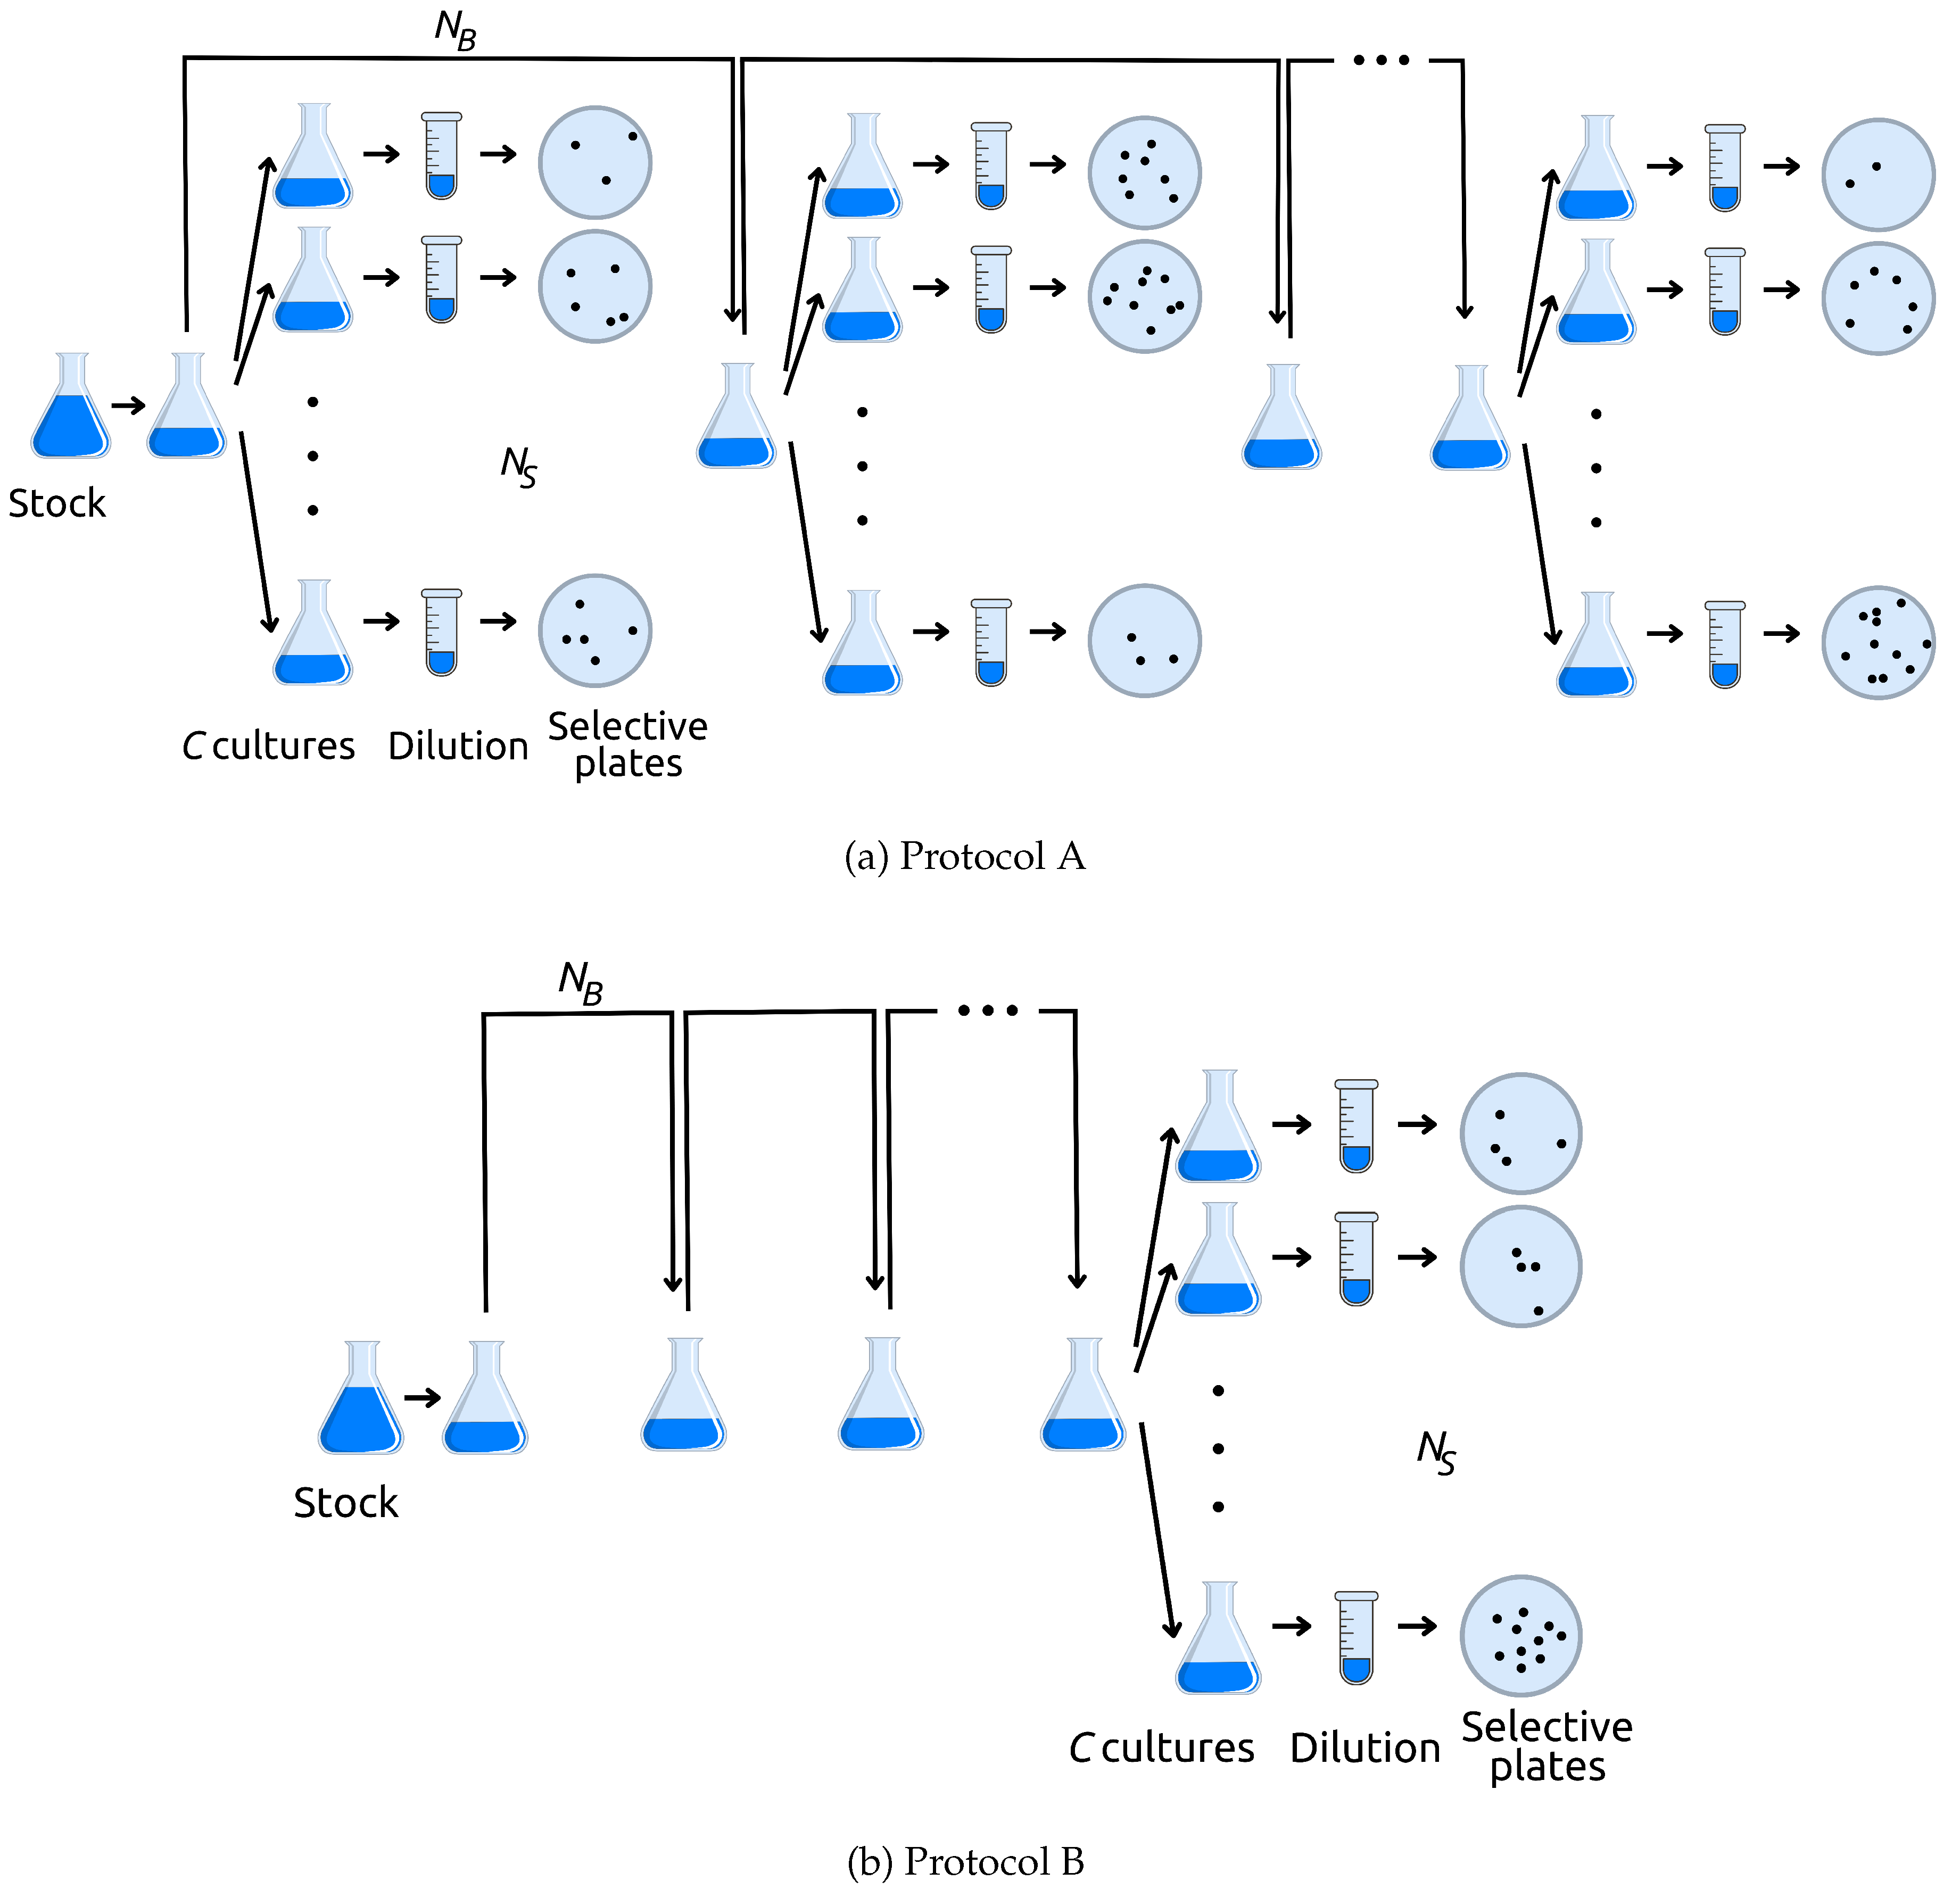
- Protocol A: Take two random samples of size and , where (S for sample, and B for bottleneck). Use the sample of size to inoculate a number c of flasks with fresh media; these independent cultures grow and each is then screened for marker mutants. Record the number of marker mutants observed in each of the c cultures. Use the sample of size to inoculate fresh media in a single flask to start the next growth cycle.
- Protocol B: Take one random sample of size to inoculate fresh medium to start the next growth cycle.
- Repeat Step 2 times (for n growth cycles)
- After the final growth cycle, take one random sample of size . Use this sample to inoculate a number c of flasks with fresh media; these independent cultures grow and each is then screened for marker mutants. Record the number of marker mutants observed in each of the c cultures.
Figure 1.
Schematic of the two experimental protocols. To maximize statistical power, the serially-passaged populations (i.e., the populations at each growth cycle) should be grown to the largest N possible, then diluted to obtain countable numbers of mutants on the selective plates [12]. This takes advantage of the increased statistical power conferred by the “Jones protocol” [12,13,14], an improvement on the standard fluctuation test [35,36,37,38,39].
2.3. Analysis
For simplicity of presentation, we will assume that the population grows exponentially during the growth phase, such that the initial population size is , and the final population size at time is given by . We note that our results do not depend on this assumption: we only require that the population grows from size to N by means of some pure-birth process (meaning that the total number of replications is exactly ). We let denote "recruitment rate" of mutations at time t, i.e., , where is mutation rate per individual per unit time. We let denote the probability that a mutation appearing in the small time interval leaves k mutants in the final population.

Table 1.
Simulated data from protocol B with three growth cycles. Parameters were , , ,
| Numbers of marker mutants | |||
| Growth cycle | |||
| Culture | 1 | 2 | 3 |
| 1 | 1 | 6 | 9 |
| 2 | 1 | 9 | 13 |
| 3 | 4 | 8 | 19 |
| 4 | 23 | 8 | 15 |
| 5 | 5 | 8 | 13 |
| 6 | 3 | 5 | 14 |
| 7 | 12 | 3 | 9 |
| 8 | 1 | 7 | 7 |
| 9 | 8 | 8 | 13 |
| 10 | 4 | 5 | 7 |
| 11 | 1 | 7 | 8 |
| 12 | 3 | 10 | 12 |
We will refer to a mutation (or mutant lineage) as being of “type k” if it leaves k mutants in the final population. We define random variable to denote the number of mutations (or mutant lineages) of type k. We make the very weak assumption that the are independent, in which case, we have:
where
The total number of mutants in the final population is:
For a "pure birth" process of constant birth rate r, and assuming that the mutations have no effect on fitness, we know that:
([40], p 450). While we assume r to be a constant here, we note that the results we obtain are robust to this assumption; i.e., any pure-birth regime () should in principle give the same results. This fact may be intuited by recalling that we implicitly make a very weak assumption (i.e., a very reasonable assumption from a biological perspective) that mutation occurs primarily during replication. Under this assumption, what counts is simply the number of replication events and not the dynamics of replication rates. This assumption can be violated for example, when ultra-violet radiation is the primary source of mutation, but we suppose that such scenarios are exceptional. From here we have:
given that , , and
Now that we have derived the overall expected number of mutant lineages of type k, , we return to equation 1 and write the pgf for the number of type k mutant lineages as:
Since each of these lineages contributes exactly k mutants to the final population, the pgf for the total number of mutants contributed by type k lineages to the final population is simply:
The pgf for the total number of mutants observed in the final population, from all types, is then given by
Substituting the expression for we find:
where . The notation emphasizes that the pgf for the total number of observed mutants at the final time depends on a single parameter, the product of the final population size and the mutation rate.
We can simplify this expression by considering the following lemma and theorem.
Lemma 1.Given then
Proof.
If we have that
For case , let’s recall that the Taylor series of is
Which implies that
for each . Therefore
Theorem 1.Given and under the convention that then
Proof.
In the limit as , Eq. (5) holds by the convention.
Let be a fixed number and let . By Lemma 1, we have that
Thus
□
Applying Theorem 1 to Equation 2, we see that if a population grows from a single individual to final size N, creating de novo (neutral) mutant lineages at rate per individual per unit time, then the total number of mutant individuals in the population at the final time will be described by the pgf:
which we will also write as:
where
Finally, we note that Equation 7 gives the pgf for the number of mutant individuals in a final population of N individuals. Trivially, we re-write as ; we find that gives the pgf for numbers of mutants that a single replication event will leave in the final population. We will use this result in interpreting the expression for at the end of the following section.
2.3.1. Incorporating mutators
The foregoing theory does not account for the fact that, as a population grows, variants carrying an elevated mutation rate (mutators) may appear as a consequence of mutations occurring in genes encoding any aspect of replication, proofreading or repair. We now modify the foregoing theory to account for mutators.
Let denote the mutation rate of the mutator to observable mutants (i.e., to the selectable phenotype). Consider a mutator lineage of type k (i.e., a clone that leaves k mutators in the final culture). Since this lineage grows to final size k and produces observable mutants at rate , we can use Equation 6 directly. The number of observable mutants in the final population that were produced within a mutator clone of type k therefore has pgf
where this distribution depends again on the product of the final population size – in this case k – and the mutator mutation rate, . If there are j mutator clones of type k, then the number of observable mutants produced by type-k clones has pgf:
And the total number of observable mutants produced by type-k mutators has pgf:
The total number of observable mutants produced by mutators of all types is therefore described by the pgf:
which may be rewritten as:
where
We define to be the recruitment rate of mutators in the population, where is the rate of mutation to mutators. Substituting the expression for , using Lemma 1 and letting , we find:
The pgf for the total number of observable mutants produced by mutators may thus be written as:
Since the pgf describing the total number of observable mutants produced by the wildtype is given by (Eq 6), the total number observable mutants produced in the culture (i.e., by either wildtype or mutator) therefore has pgf:
This expression has a clear intuitive explanation. We know that describes the total number of mutators produced by the wildtype in the final population. Since the pgf for the number of observable mutants produced by a single replication event within a mutator lineage is given by , the composition gives the associated with the total number of observable mutants in the final population produced by mutators. The product of this term with the pgf for the observable mutants produced by the wildtype, , then gives the pgf for the total number of observable mutants in the final population.
2.4. Model fitting and validation
Our overall goal is to use the analytical results described above to estimate the underlying mutation rates in populations that have been propagated as described in Section 2.2. To test this idea, we generate simulated data using three independent approaches, which are described in detail, with pseudocode, in Appendix A. In Section 3.1 we test the validity of these simulated data sets, using the simple case of a single bottleneck and no mutators as a test case. We then use all three methods to produce datasets including mutators. Finally, in Section 3.2, we describe and test the accuracy of three methods to estimate the mutation-to-mutator rate from the simulated data.
3. Results
3.1. Model reliability
Since our theoretical approaches can be regarded as numerical methods, we validated reliability by performing simulations. It is widely known that the Moran model can be used to simulate cell growth where mutations are allowed [41, Figure 5B]. Here, we employ the Moran model to model a growing population; this differs from common usage of the Moran model but is equally valid.
A cell population where only observable (marker) mutations are allowed, such that no mutators or mutant cells with mutator phenotypes appear, can also be modeled with the graphical model (described in Appendix A.1) and the quantile function model (described in Appendix A.2), stopping them at Eq. (A5) and Eq. (A18), respectively. Additional growth cycles can be simulated by implementing a random sampling of the desired size to found the next growth cycle.
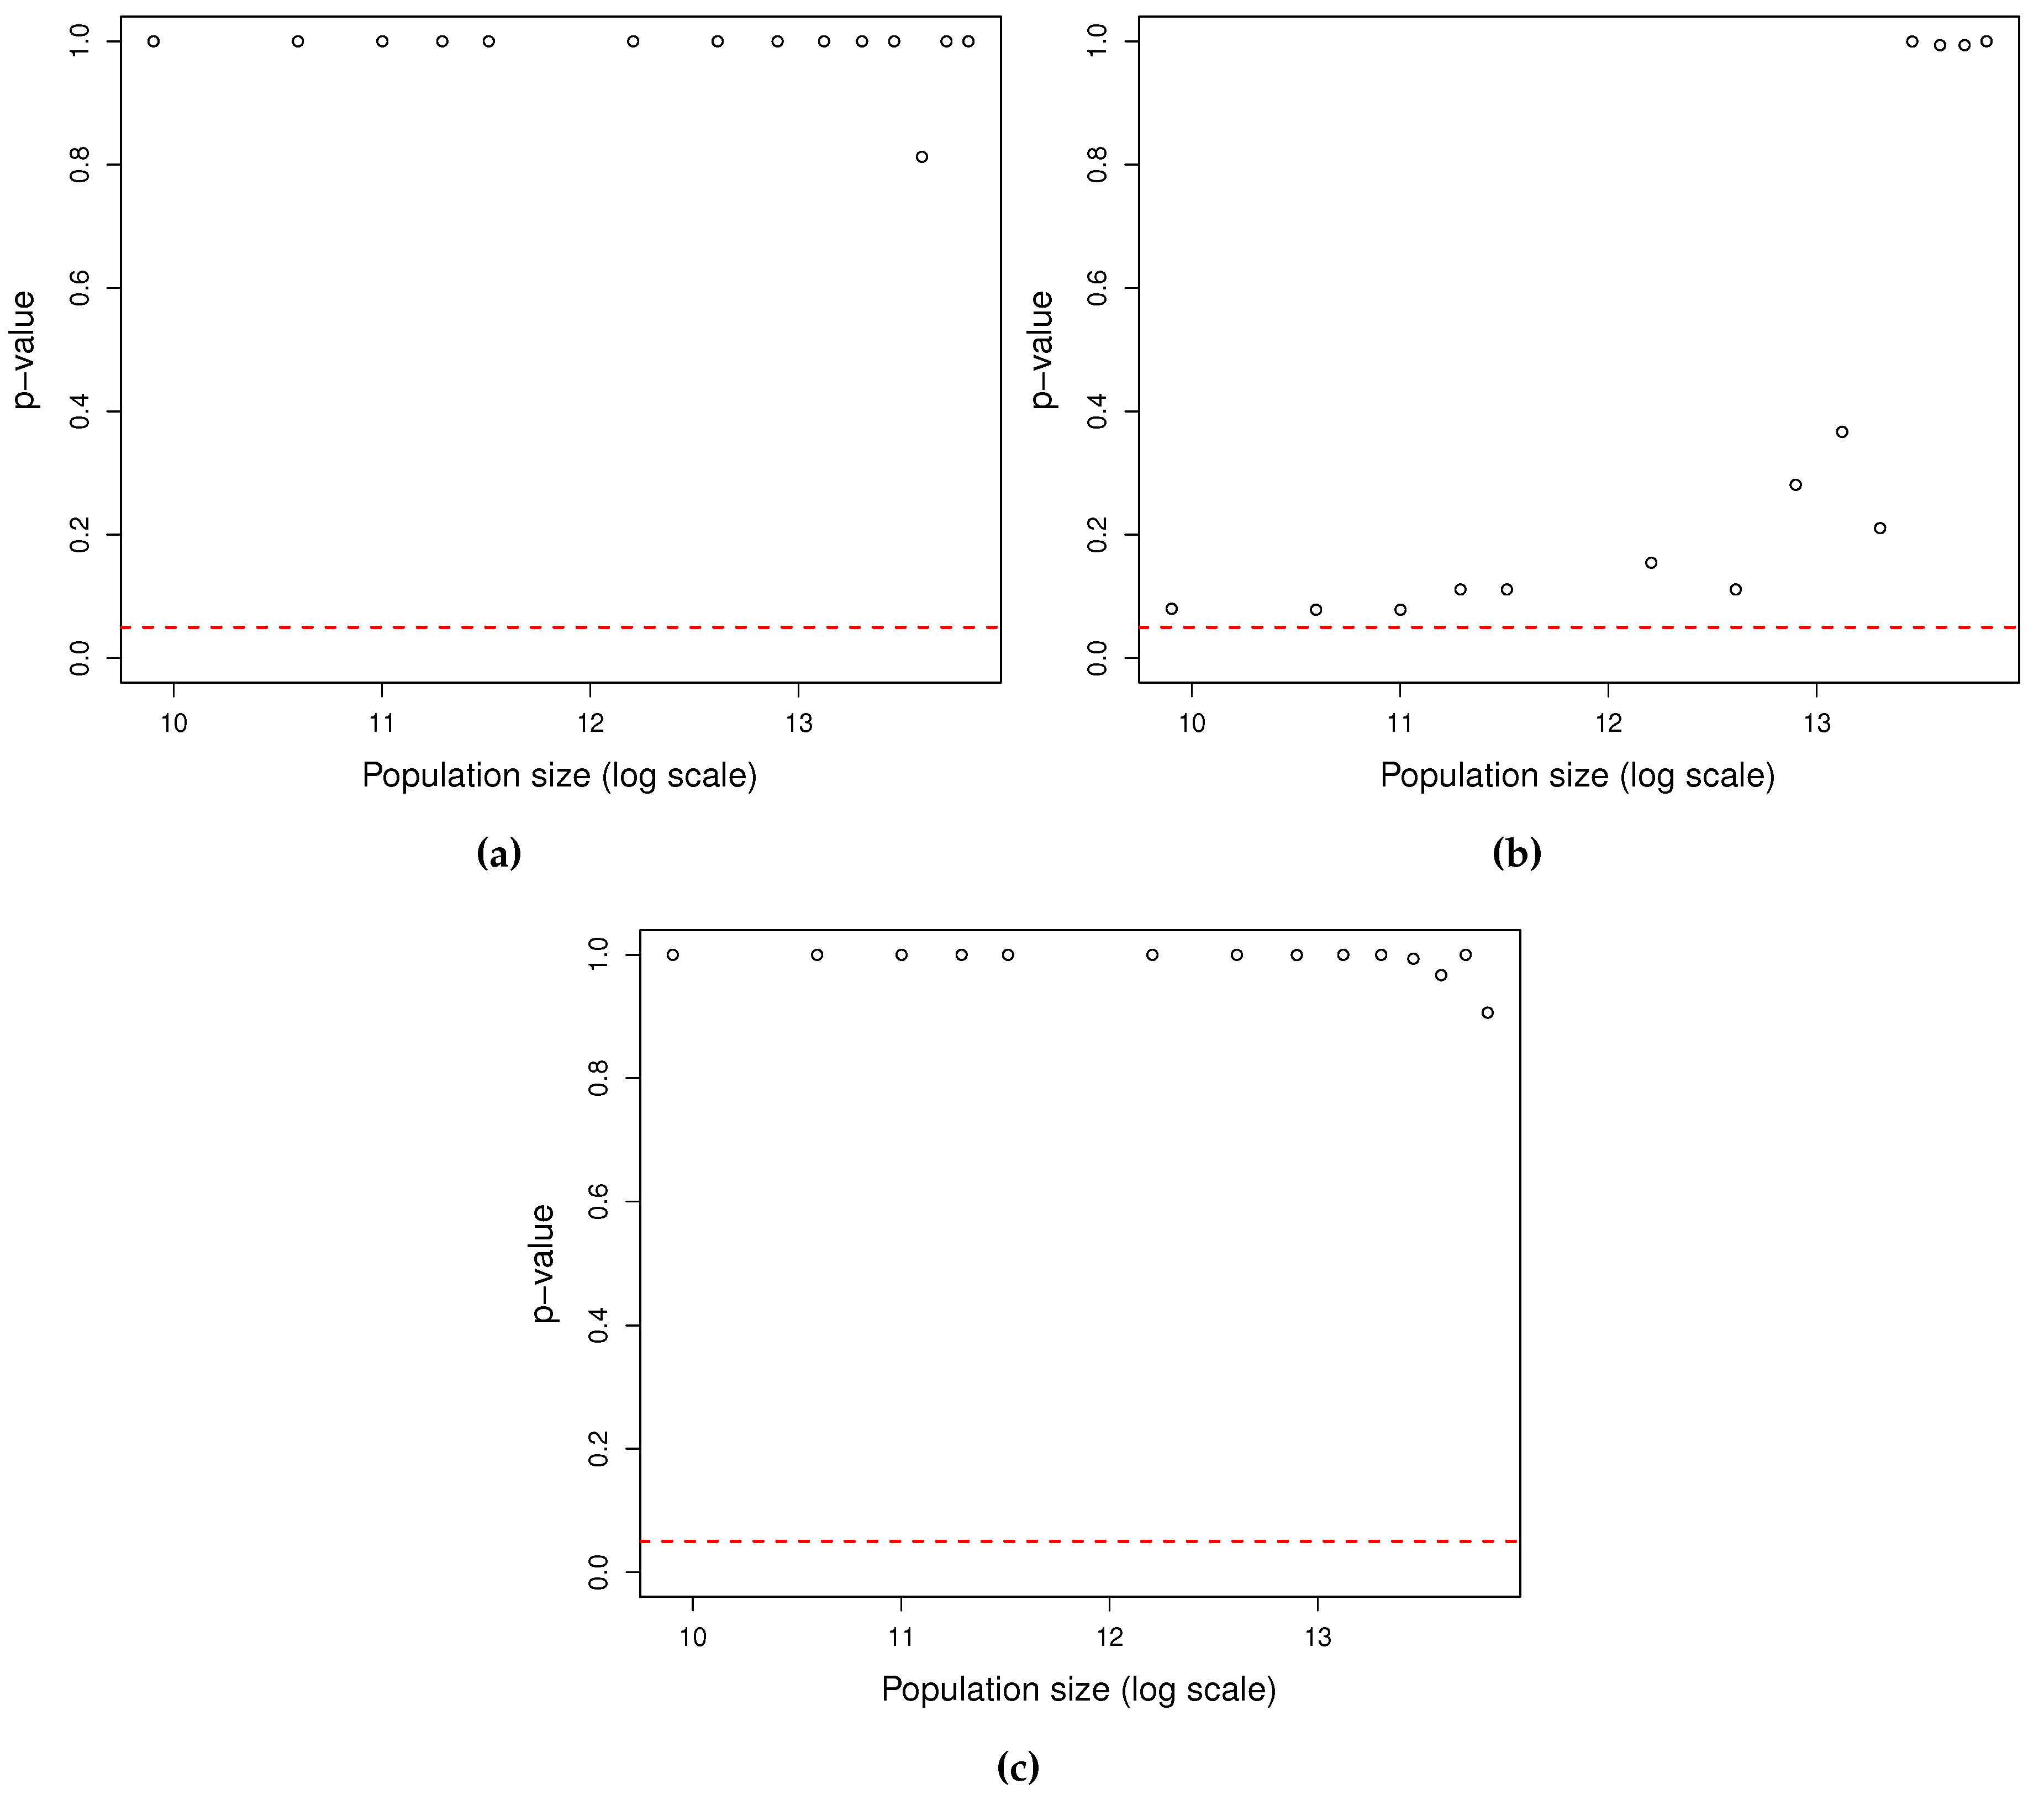
For each of the final population sizes , 100 simulations were generated by the Moran, graphical, and the quantile function models, respectively. Goodness-of-fit tests were carried out to determine whether the null hypothesis, : the data sets are drawn from the same distribution, can be rejected. Pairwise two-sample Kolmogorov-Smirnov tests for discrete distributions [42] were performed, as used in Ycart (2013) [43].
As shown in Figure 2, the distributions associated with the simulations generated by Moran, graphical, and quantile function models were not significantly different for all final population sizes tested.
Furthermore, the underlying distribution of the data sets is known since the number of mutants produced by wildtype cells has the Luria-Delbrück distribution [44, Eq. 15]. For each data set with a final population size , used for Figure 2, analysis on the web tool bz-rates [45] was performed.
The bz-rates platform provides visual verification of the fitting of data sets to the Luria-Delbrück distribution, an estimation of the mutation rate, the 95% confidence interval for the mutation rate, etc. In addition, a goodness-of-fit test is performed to determine whether the null hypothesis, : the data set was drawn from a Luria-Delbrück distribution, can be rejected.
As shown in Figure 3, it was not possible to reject the null hypothesis that the data sets were drawn from a Luria-Delbrück distribution, with the Luria-Delbrück and data set distributions not being statistically different (), see Table 2.
Figure 2.
Statistical comparison of data set distributions. Given a final population size N, , 100 simulations were generated with each of the models. For the three models, the parameters were , , and ; hence only mutant cells produced by wildtype cells were allowed. The horizontal red dashed line shows the upper bound of the rejection region () for the null hypothesis which states that both data sets come from the same distribution. (a) p-values of the Kolmogorov-Smirnov test, per final population size, between the data sets of the Moran and graphical models. (b) p-values of the Kolmogorov-Smirnov test, per final population size, between the data sets of the Moran and quantile function models. (c) p-values of the Kolmogorov-Smirnov test, per final population size, between the data sets of the graphical and quantile function models.
3.2. Estimations reliability
By inspection, it was noted that considering more than one growth cycle provides no estimation improvement. Thus, we present the estimates and confidence intervals for the first growth cycle only, obtained by three methods, described in detail in Section 3.2: 1) bootstrap confidence interval and point estimation [46, Ch. 13] applied to the direct estimation of (direct estimations bootstrap), 2) the likelihood-based confidence region ([47], Eq. 14; [48]) applied to the maximum likelihood estimation of (MLE), and 3) the likelihood-based confidence region where the mutator strength was fixed applied to the maximum likelihood estimation of (Two-variable MLE).
To standardize the estimation methods, given a mutation rate we defined the interval , as
Moreover, parameter was set as 20 and since only the first growth cycle will be considered .
Three data sets were created to test the estimation methods, with replicates for the data set built with the Moran model and replicates for the data sets built with the graphical and quantile function models. The first data set was built with the Moran model (parameters: , , , , ), the second one was built with the quantile function model (parameters: , , , , ), and the last one was built with the graphical model (parameters: , , , , ).
For the direct estimations bootstrap method, a total of 500 estimations were performed maintaining the dilution parameters as for dilution due to bottlenecks between growth cycles and for dilution used for plating and counting mutants.
For the MLE method, a single estimation was performed setting .
Lastly, for the two-variable MLE, a single estimation was performed setting and was taken as , where denoting the mutator strength was chosen to be when data sets built with the Moran model and graphical method were used to perform the estimations, and when the data set built with the quantile method were used to perform the estimations.
Given a data set, a performance comparison between the three methods was conducted. For comparisons related to the data set built with the Moran model, the quantile function method, and the graphical method see Table 3, Table 4, and Table 5, respectively.
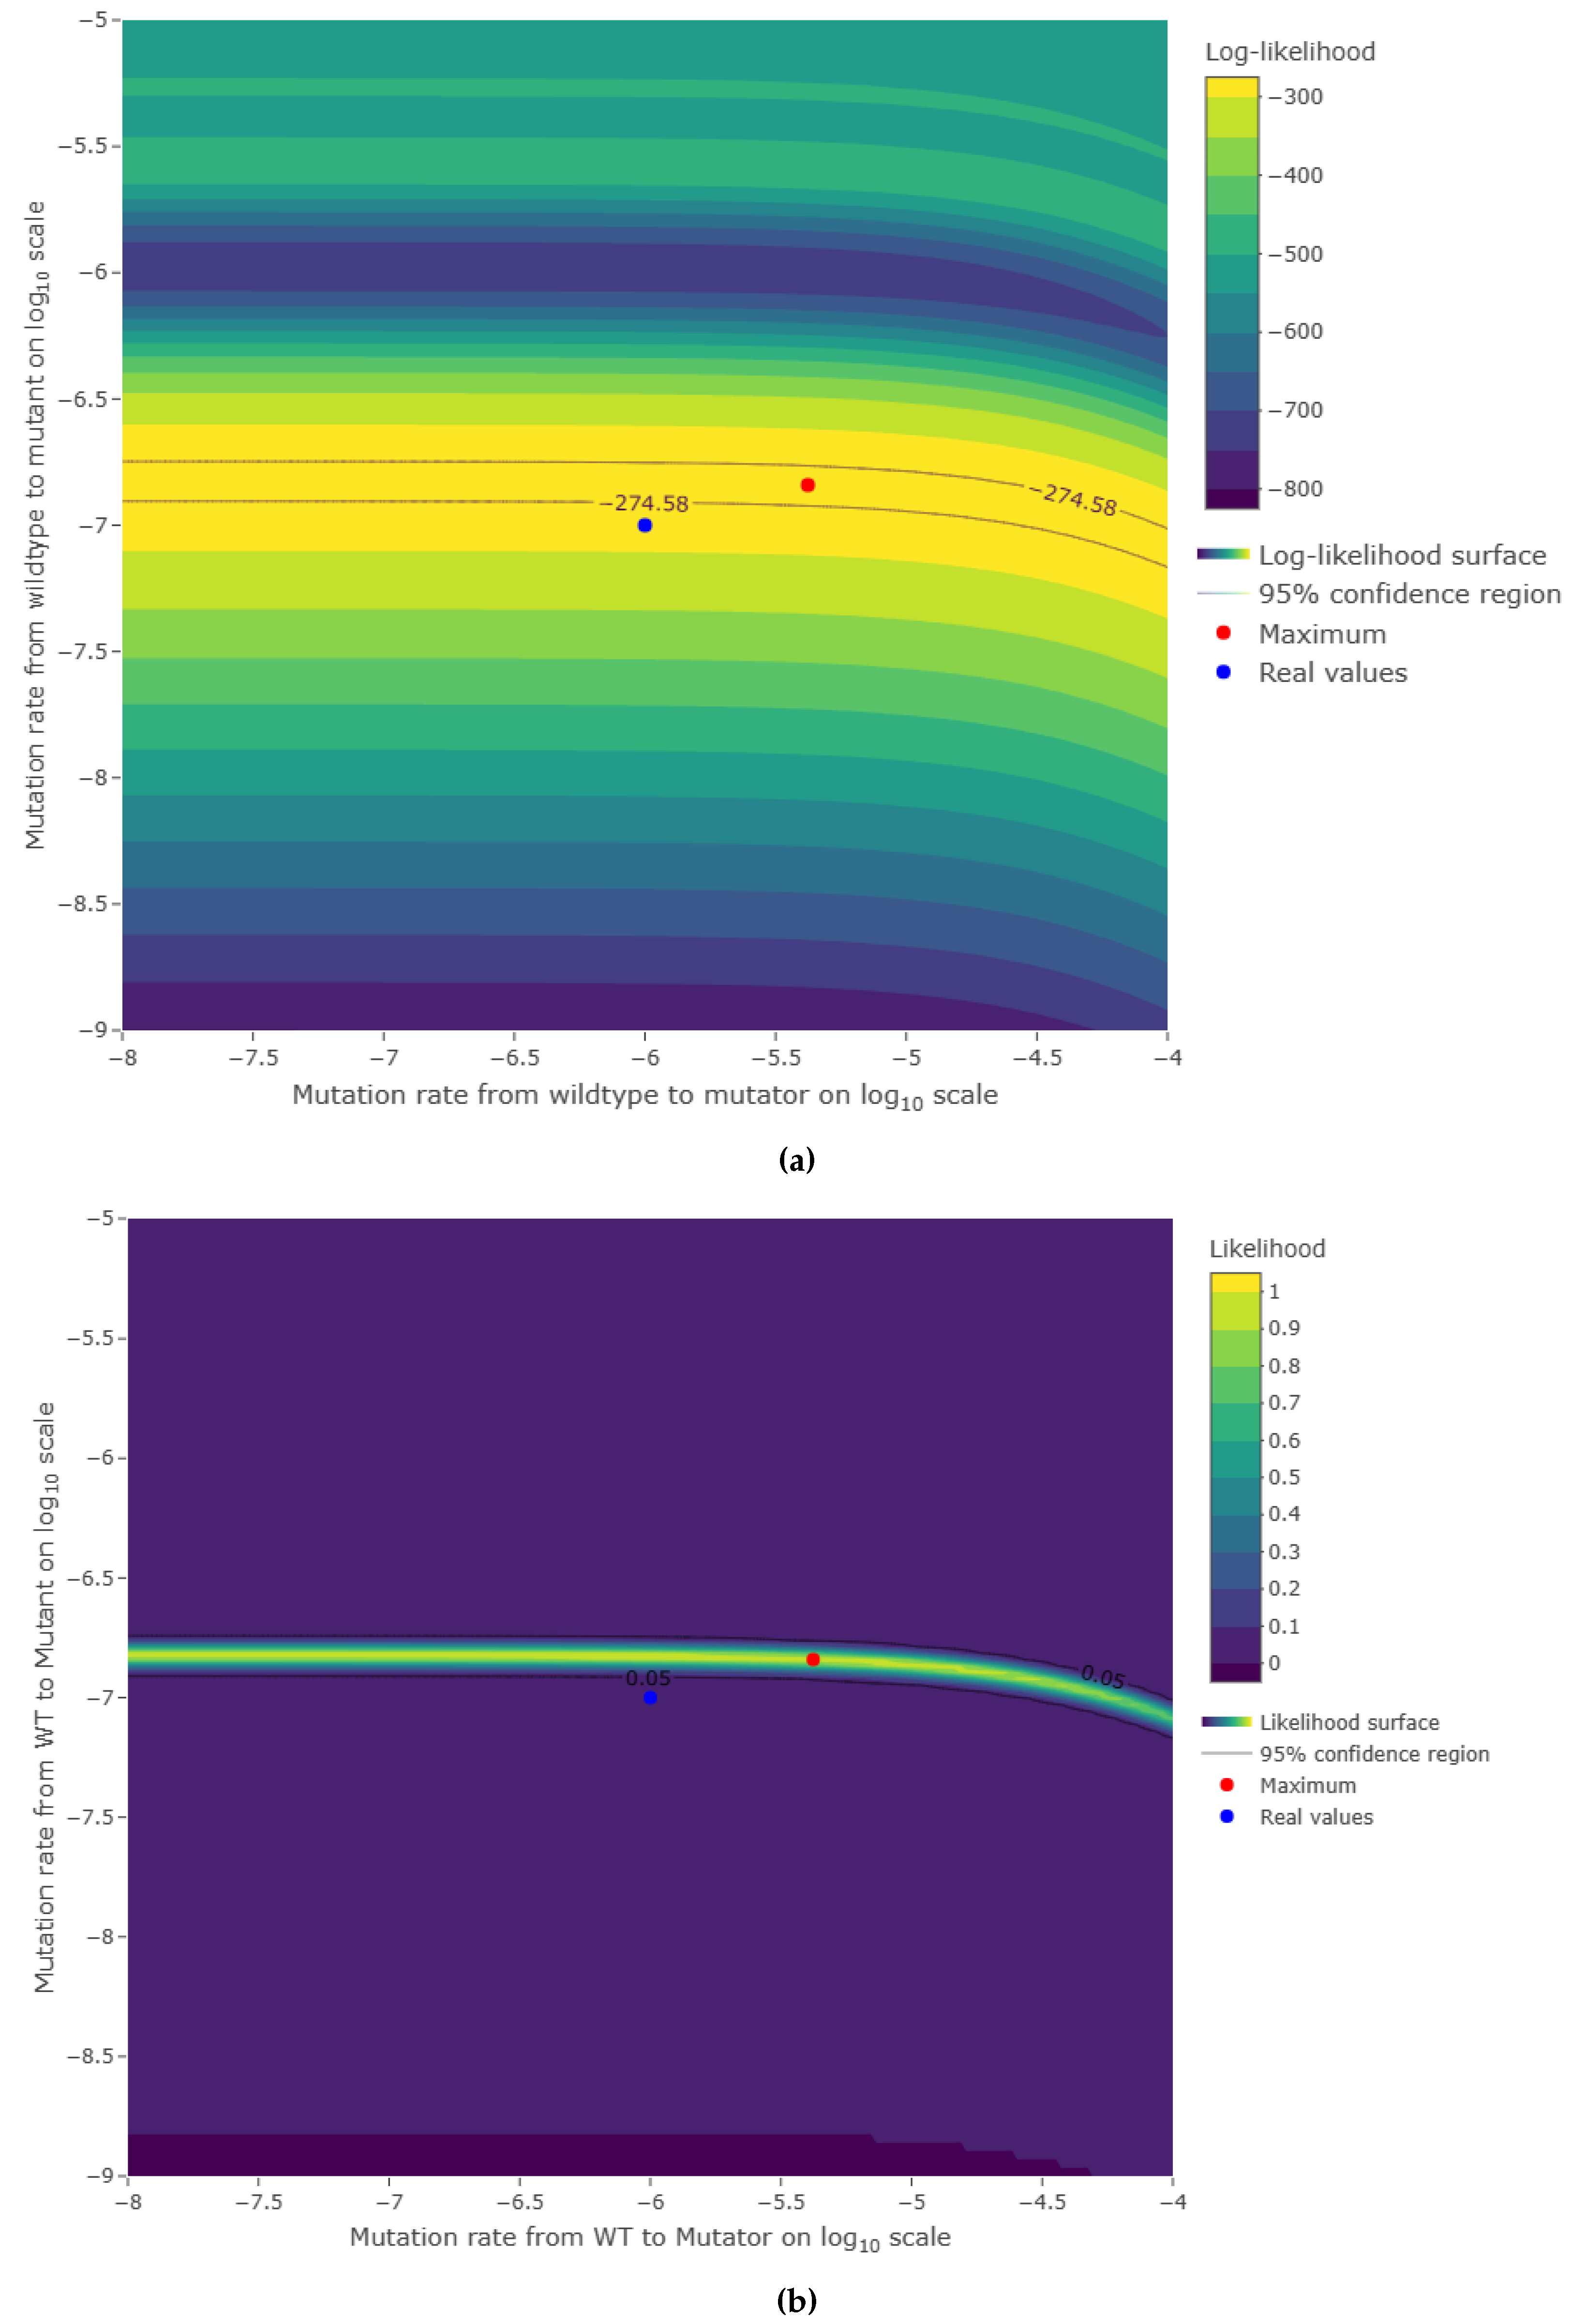
Figure 4.
Contour graph of the log-likelihood function and likelihood function, respectively. Given the data set built with the Moran model used for Table 3, Figure 4a shows the log-likelihood function , where the mutator strength was fixed (two-variable MLE), was constructed; while Figure 4b shows the likelihood function multiplied by the scaling factor . All parameters remain unchanged except for , instead of , for better image resolution. The red dot shows where the maximum of the function was attained, the blue point displays the actual mutation rates, and the region between the black curves represents the 95% confidence region.
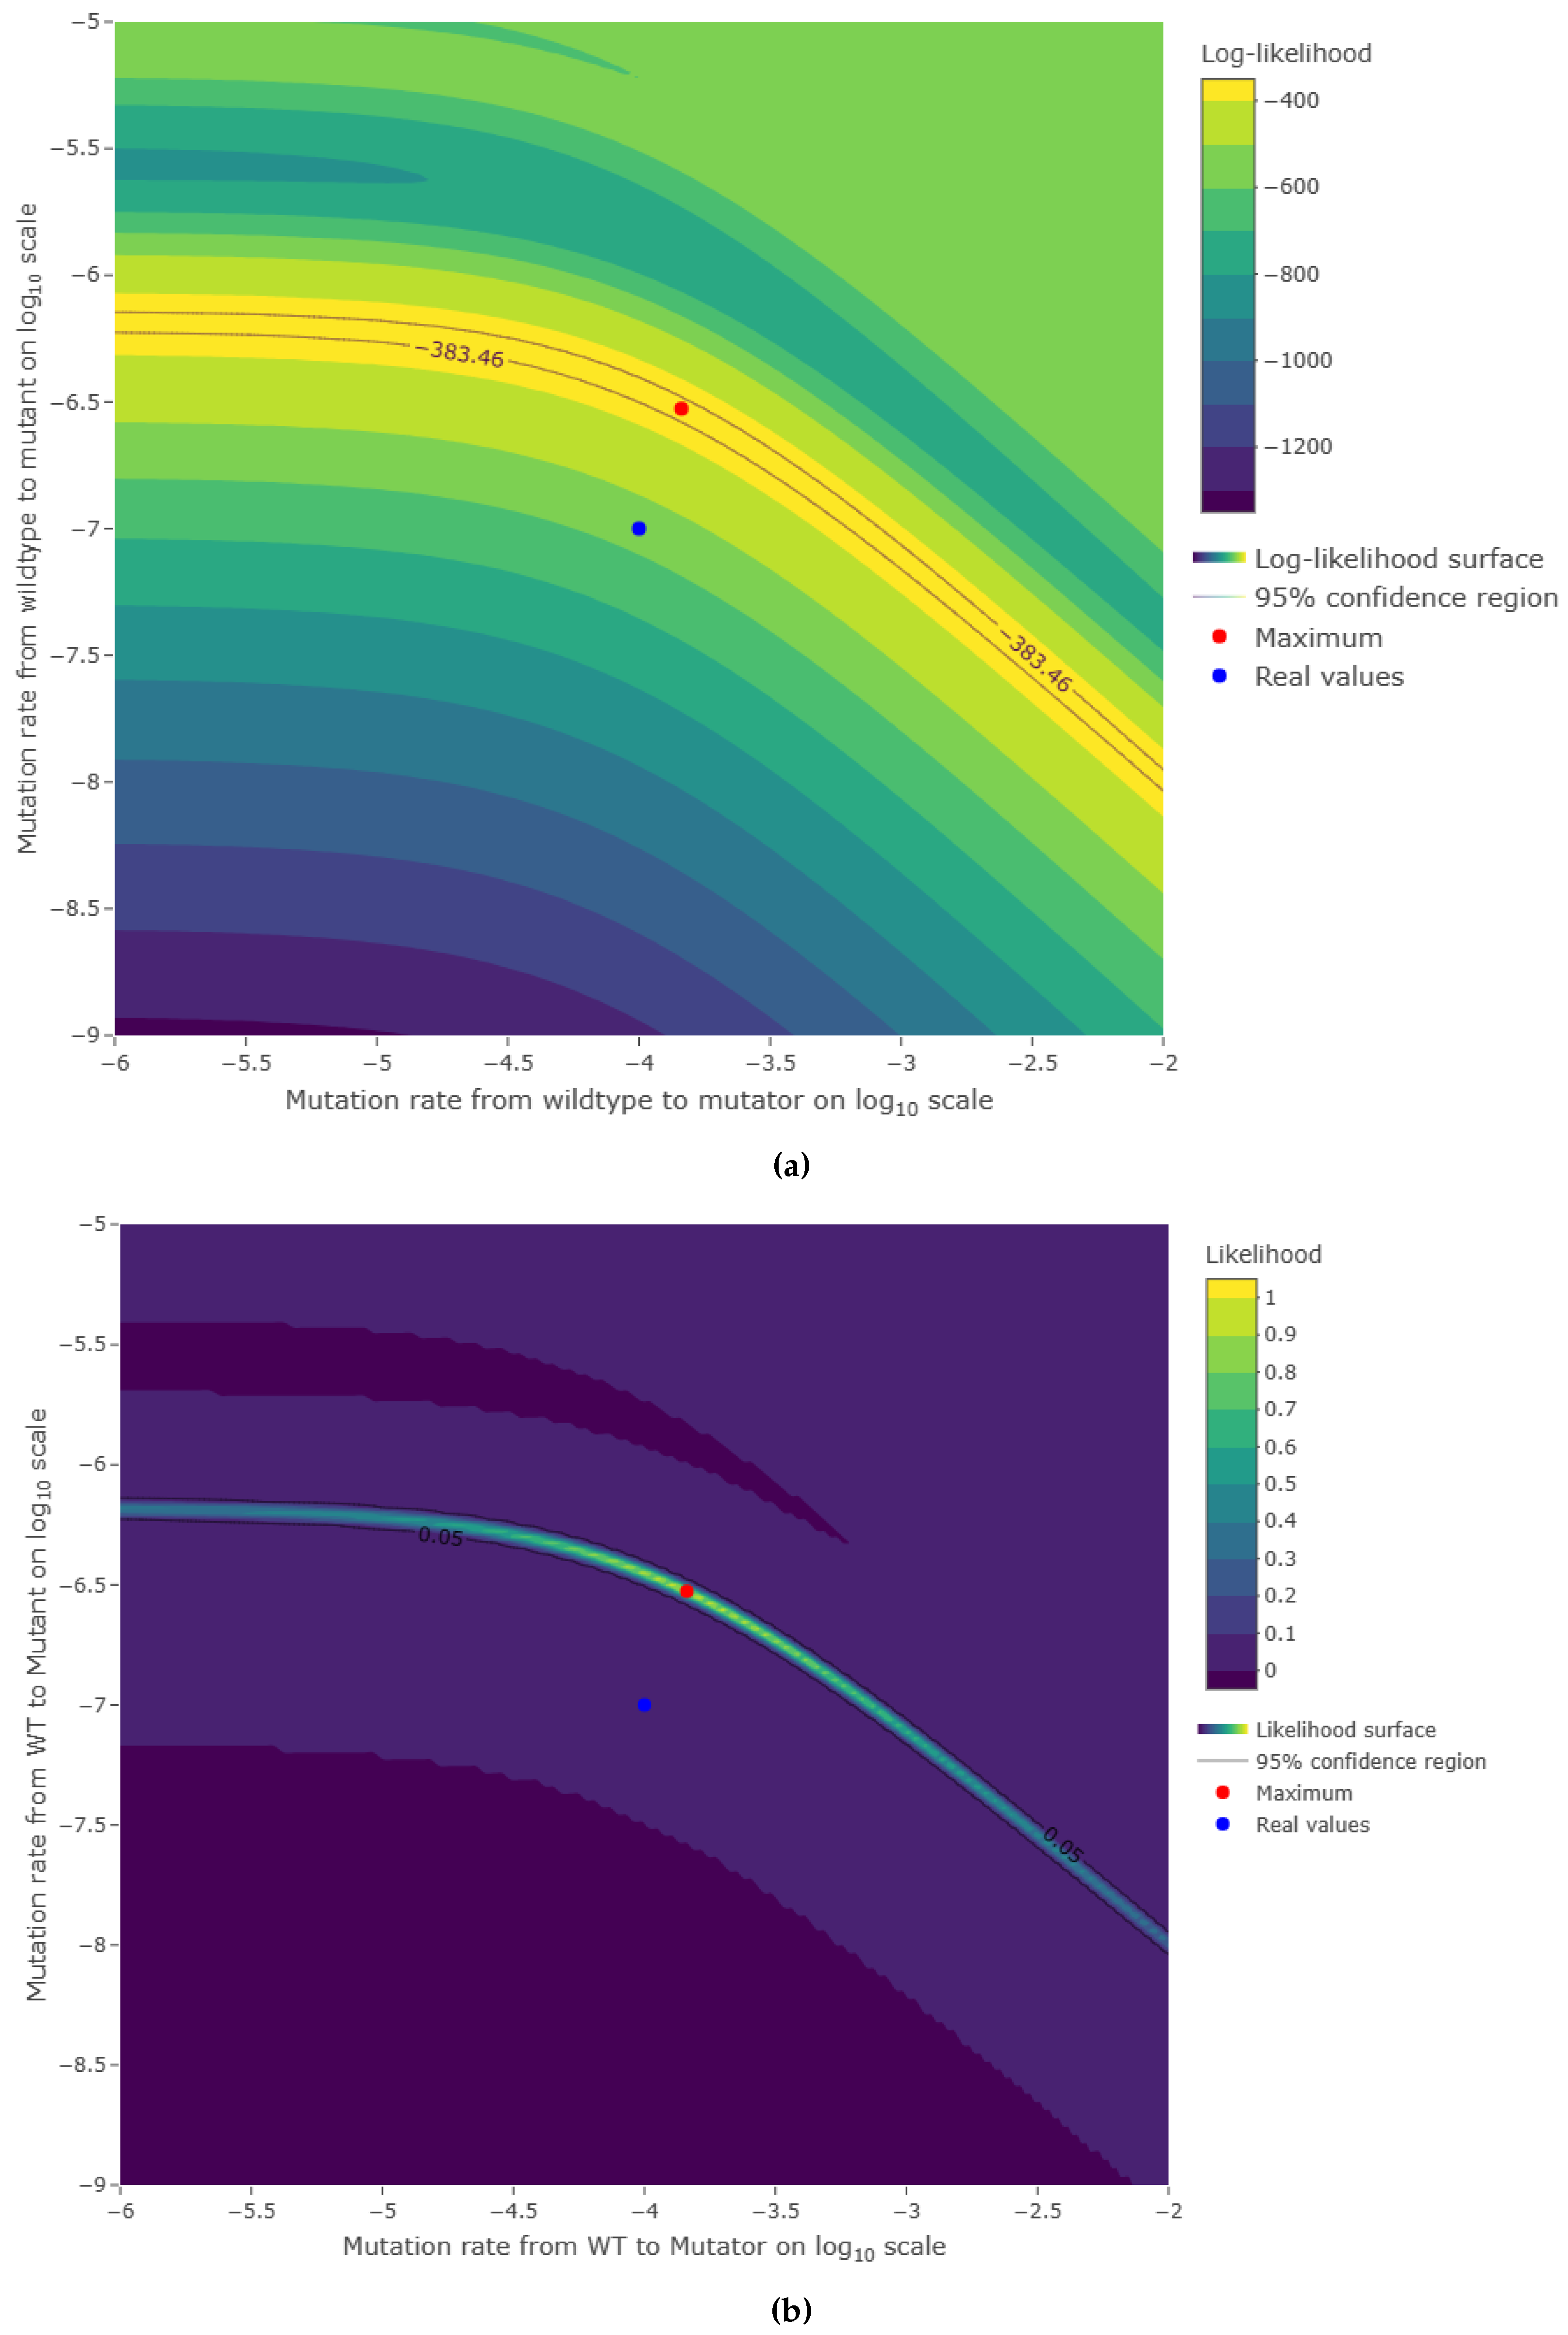
Figure 5.
Contour graph of the log-likelihood function and likelihood function, respectively. Given the data set built with the quantile method used for Table 4, Figure 5a shows the log-likelihood function , where the mutator strength was fixed (two-variable MLE), was constructed; while Figure 5b shows the likelihood function multiplied by the scaling factor . All parameters remain unchanged except for , instead of , for better image resolution. The red dot shows where the maximum of the function was attained, the blue dot displays the actual mutation rates, and the region between the black curves represents the 95% confidence region.
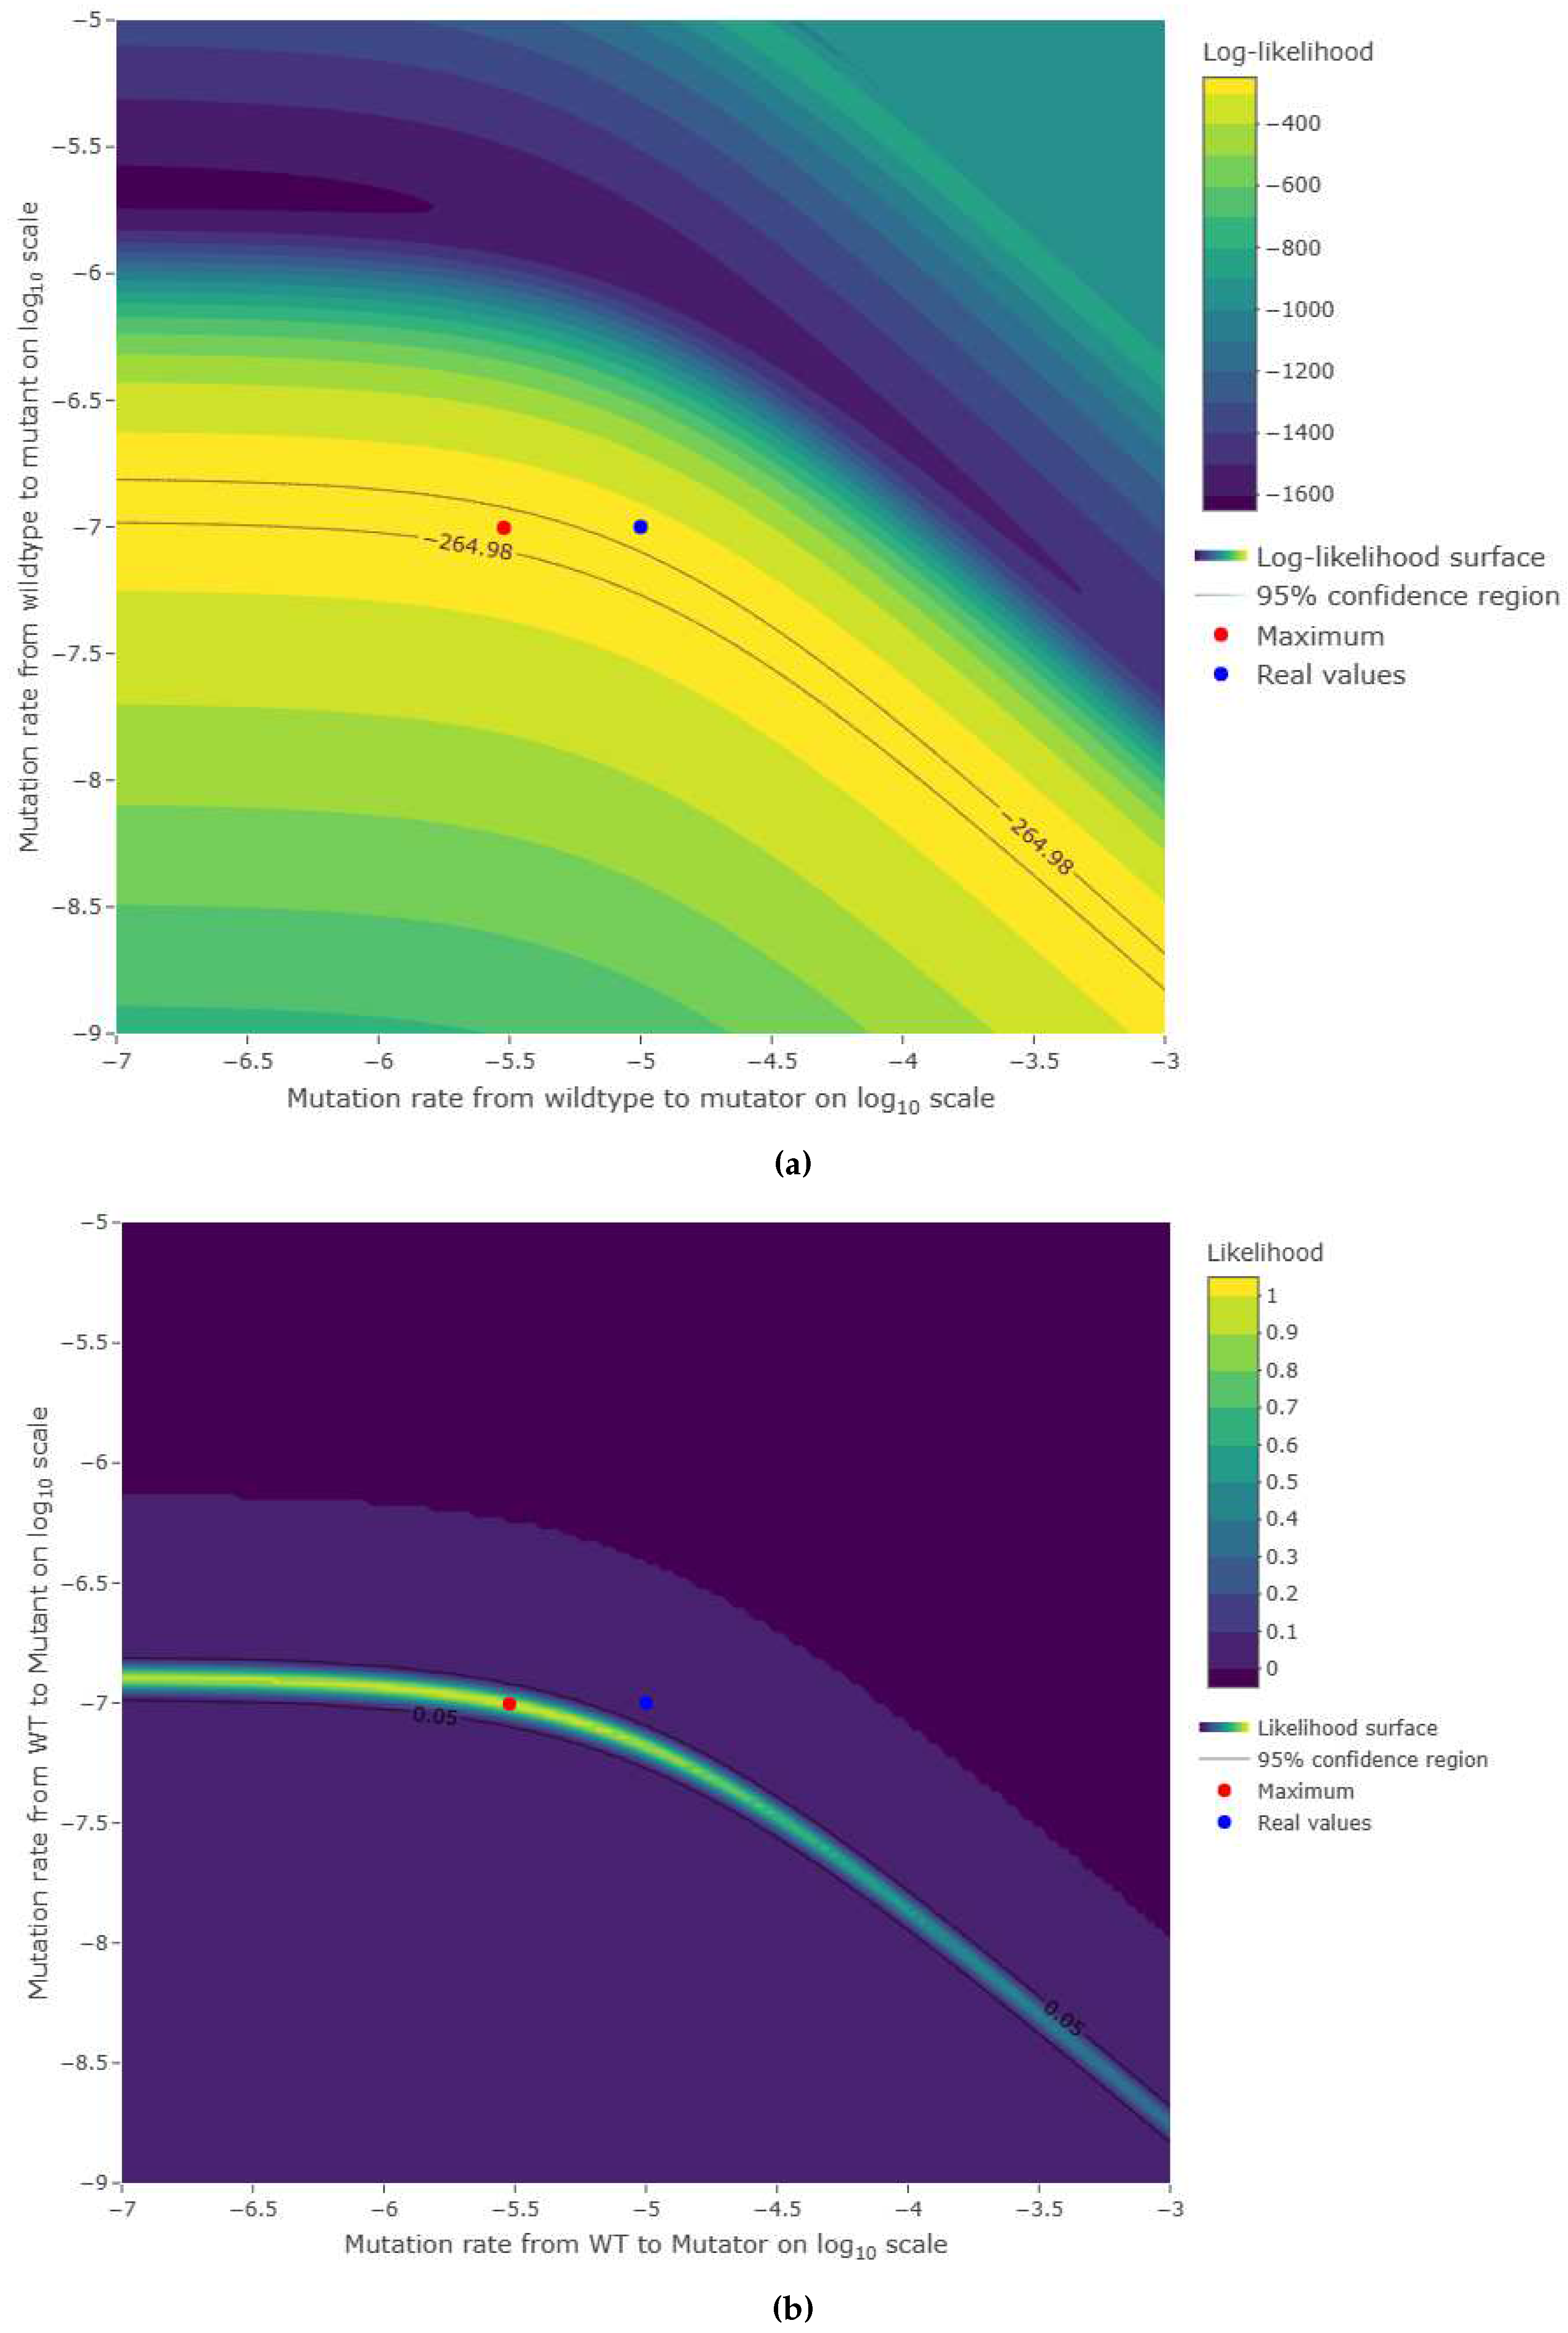
Figure 6.
Contour graph of the log-likelihood function and likelihood function, respectively. Given the data set built with the graphical method used for Table 5, Figure 6a shows the log-likelihood function , where the mutator strength was fixed (two-variable MLE), was constructed; while Figure 6b shows the likelihood function multiplied by the scaling factor . All parameters remain unchanged except for , instead of , for better image resolution. The red dot shows where the maximum of the function was attained, the blue dot displays the actual mutation rates, and the region between the black curves represents the 95% confidence region.
4. Discussion
Our results suggest that a feasible experimental protocol – a variant of the famous Luria-Delbruck experiment – for estimating the rate of mutation to mutator phenotypes may not be out of reach. To assess this possibility, we have explored a parameter space within which we know the relevant parameters lie. There is, however, one parameter that presents us with a caveat; somewhat vexingly, this parameter is precisely the one that we are most interested in, namely, the rate of mutation to mutator. The reason for this caveat lies in a fact that we point out at the very beginning of this manuscript: aside from hand-wavy gene-counting arguments, we have no a priori knowledge of what a range of plausible values might be for the rate of mutation to mutator. This is of course not a problem for assessing our methods by comparison with simulation. It is a problem, however, when assessing the practical feasibility of our proposed protocol in the lab: if this parameter is much lower in reality than what we are assuming, the population sizes required for its estimation may become unfeasible.
One parameter whose effect we have not explored is the bottleneck size: we have only employed a bottleneck size of . With this bottleneck size, we found that applying more than one growth cycle did not yield much improvement in the estimates. It may be that for a different bottleneck size, estimates can be improved by performing more than one growth cycle.
Funding
This research was funded by the US National Institutes of Health (National Institute of General Medical Sciences) grant number R35GM137919 (PI: G. Bradburd). First author, Isaac Vazquez-Mendoza, received financial support from the Society for the Study of Evolution to attend, and present this work at, Evolution 2023 in Albuquerque NM. LMW gratefully acknowledges the support of the Natural Sciences and Engineering Research Council of Canada grant RGPIN-2019-06294.
Acknowledgments
We would like to thank the Center for Advanced Research Computing at the University of New Mexico, supported in part by the National Science Foundation, for providing the high performance computing resources used in this work.
Conflicts of Interest
The authors declare no conflict of interest.
Abbreviations
The following abbreviations are used in this manuscript:
| MLE | maximum likelihood estimation |
| pgf | probability generating function |
Appendix A. Simulations
Appendix A.1. Graphical model
Suppose we grow a bacterial population inside a flask, where diet and space requirements are fulfilled for up to N cells and no cell dies. Taking N as the carrying capacity and considering a constant growth rate r associated with each individual in the bacterial population, we have a pure birth process where the population size reaches the carrying capacity in units of time. Here, as in many biological contexts, time is measured in generations; i.e., is such that . Additionally, let’s suppose is the mutation rate to mutator phenotypes and is the mutation rate of mutator cells to the marker phenotype.
With the above assumptions, we have a pure birth process called Yule process [49], and the expected number of mutations to the mutator phenotype occurring from the beginning of the experiment until time is
Moreover, if M is a random variable modeling the number of mutations occurring in the time interval , M follows a Poisson distribution [50], so
Our framework leads to the following simplification, the bacterial population grows exponentially; this is, given then , with , denotes the population size at time t.
Let be a function such that
Hence, denotes the population size at time t compared to the final population, as a fraction.
Let be a random vector, where and then C represents a mutant cell that appeared at time T and belongs to the fraction F of the final population. By considering a random sample of size M from C, , and scattering them within , we obtain feasible and not feasible mutants since, regarding f as a probability density function, all feasible mutations lie under the graph of f and disregard them otherwise.
Figure A1 shows an example of the method above described.
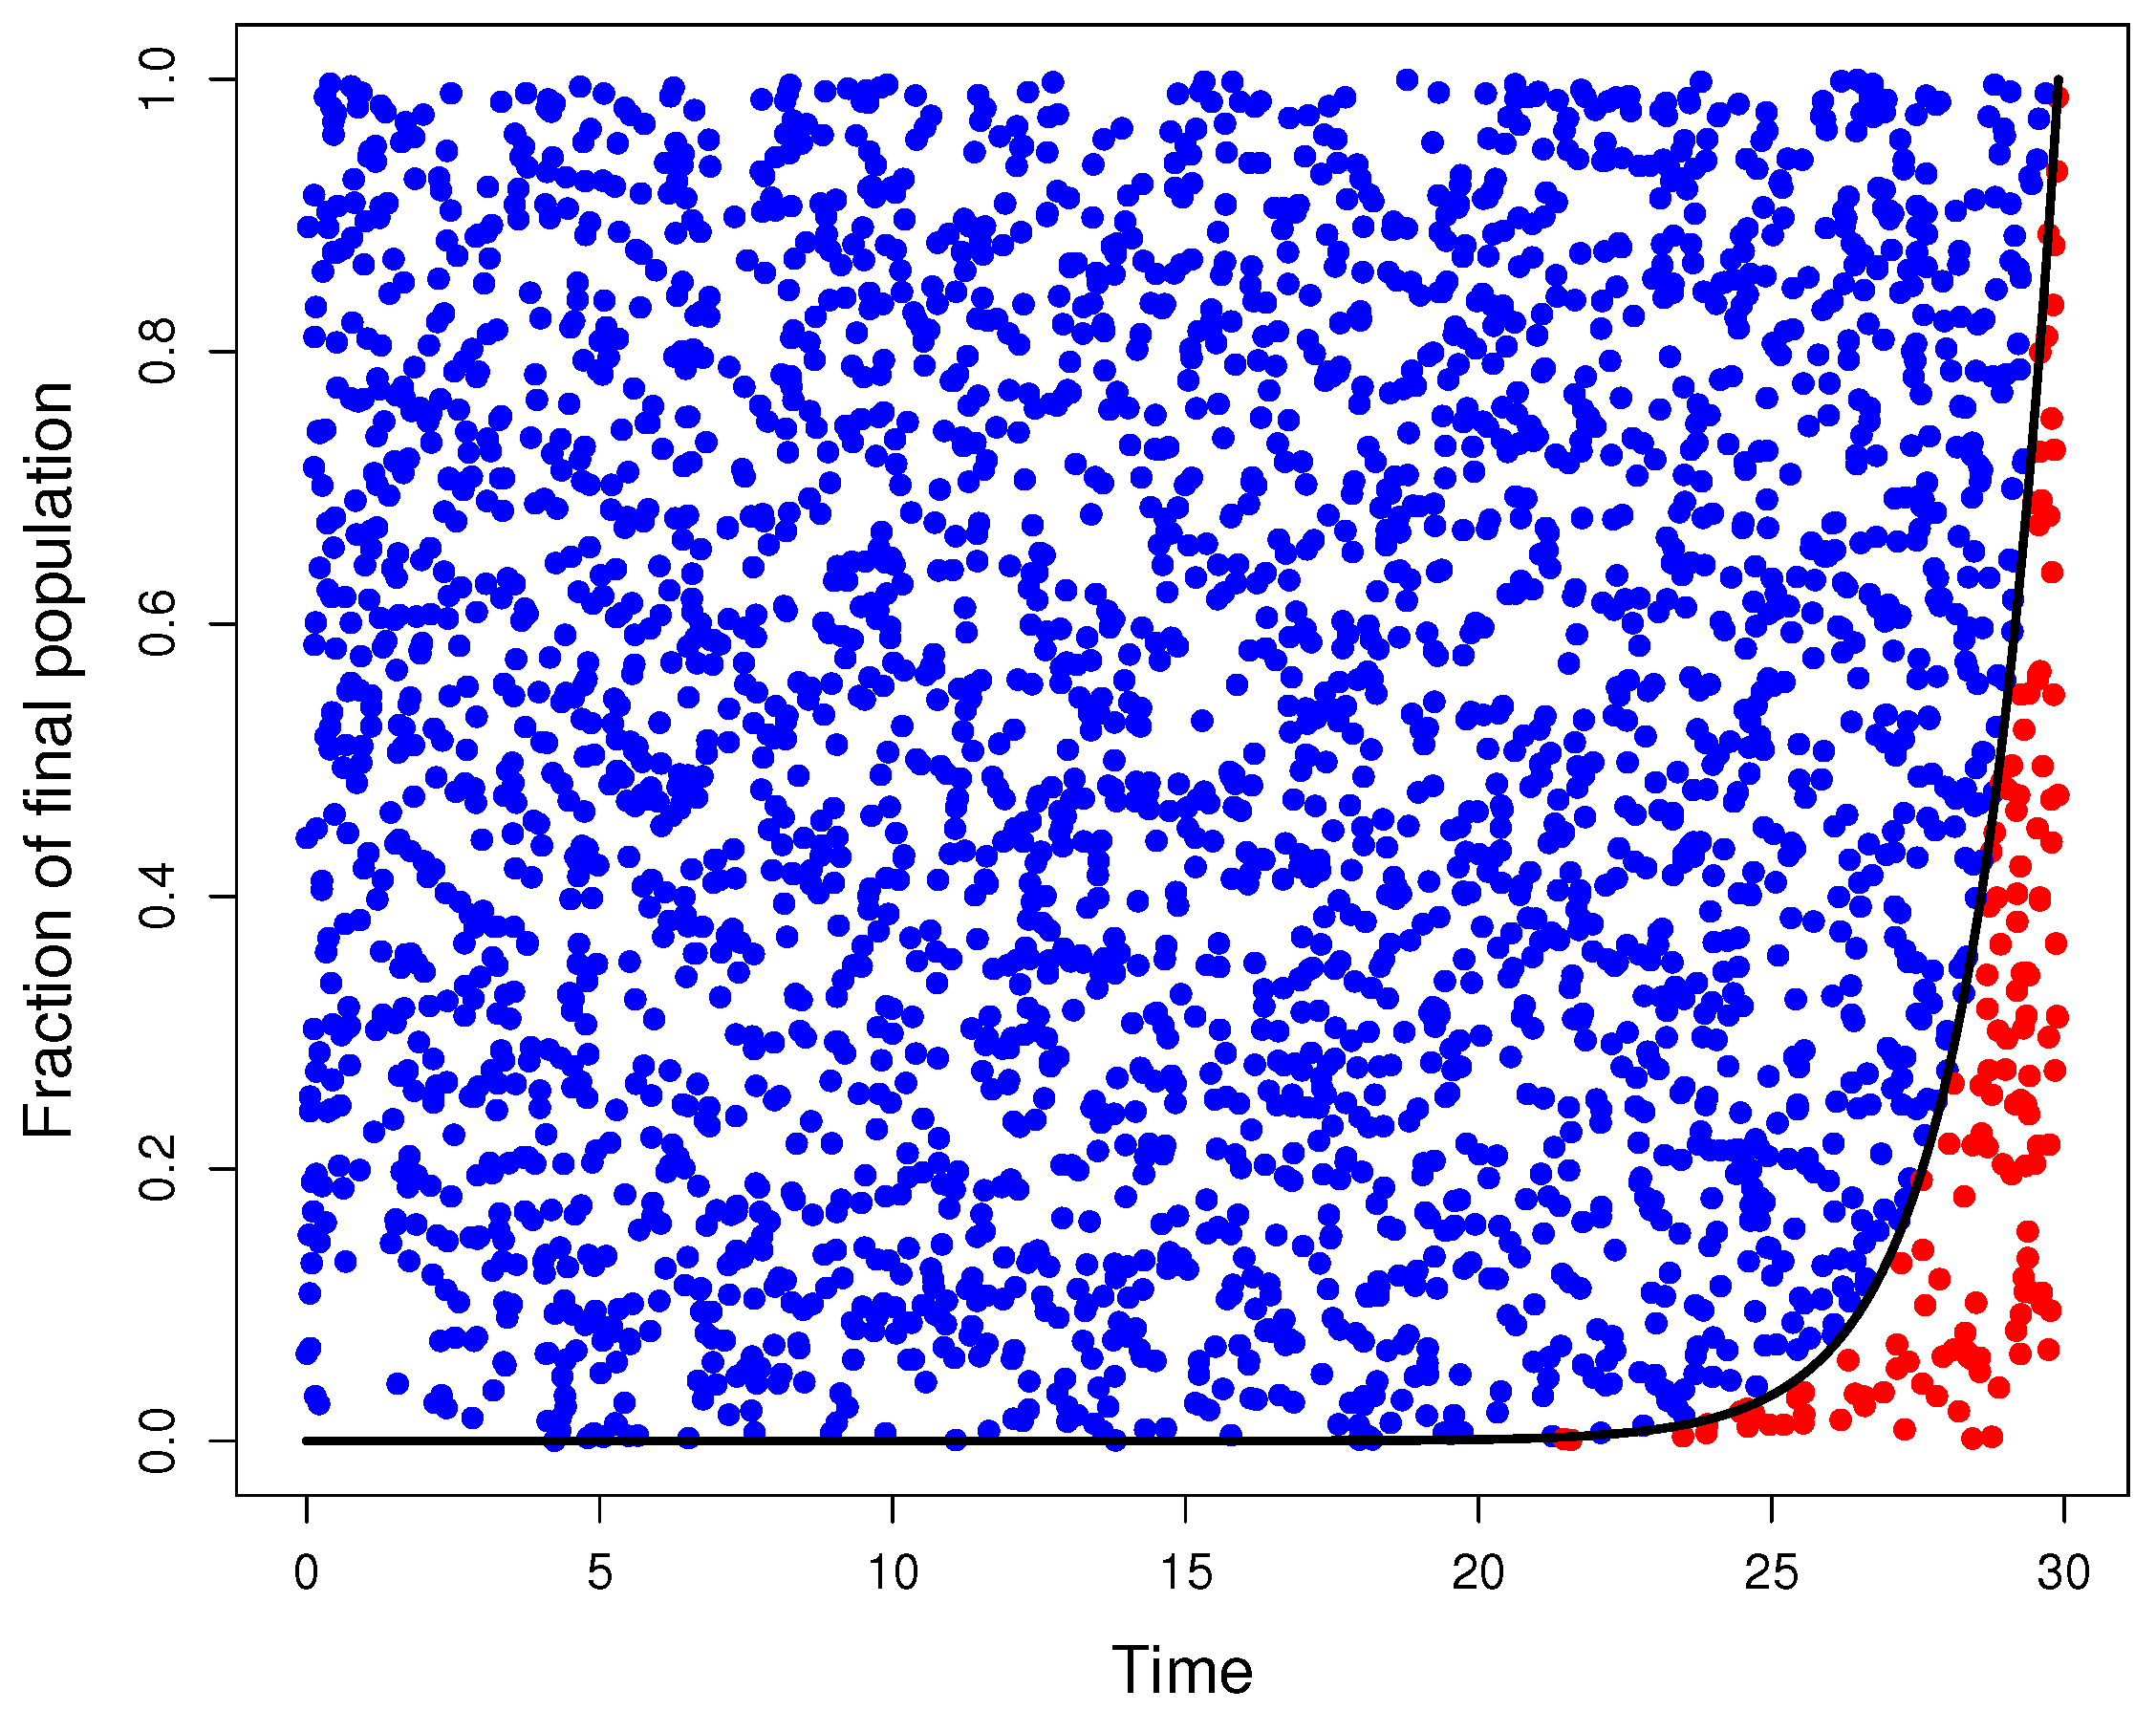
Figure A1.
Graphical model for selecting feasible mutations. mutations were generated as random points on . The parameter for final population size was , for wildtype mutation rate was , and for the final time was . The graph of (black curve) played a discriminant role since all points below the graph of f (red points) represent actual mutations while the rest of the points (blue points) were disregarded.
Let be the number of actual mutations from wildtype to mutator cells. Without loss of generality, let’s suppose is the mutant cell associated with the i-th mutation, . Let’s note that each mutant cell , appearing at time , has units of time to give rise to its clonal linage; i.e. a subpopulation of size . Now, in a Yule process the clone population size that starts with individuals, each one with growth rate , has a negative binomial () distribution with parameters j and ([49],[pp. 377–378; [51], [Eq. 3.15; [52]).
Therefore, is a random variable such that
since denotes the number of cells in the linage of cell , excluding the initial cell . This is due to the support of the negative binomial distribution we are computationally working with [53, func.
rnbinom], . When the support of this distribution is , as in ([49], pp. 377–378; [51], Eq.
3.15; [52]), Equation (A4) should be rewritten as
Furthermore, in both cases, the total number of mutators in the population at time is
To incorporate mutant cells with mutator phenotypes, let’s suppose they appear as the result of mutations within the mutator cells subpopulation. Then, mutant cells with mutator phenotypes can appear only along the growth cycle of each mutant cell , .
Let be a fixed index. We know there are exactly mutator cells that have been raised by mutator cell , and if any mutant cell with a mutator phenotype is appearing will be in the time interval . Setting as the carrying capacity, mutant cells with mutator phenotypes have units of time to appear, which happens with frequency .
Consequently, under a similar reasoning for Equation (A2), we have that the number of mutations leading to mutant cells with mutator phenotypes is a random variable such that
Let , with and , a random sample of size . Hence, each , is a random point on , representing a potential mutant cell with a mutator phenotype.
Analogous to Equation (A3), function defined by
with , plays the discriminant role for the mutants cells with mutator phenotypes. Where, as before, all points except those below the graph of were disregarded since they represent actual mutant cells with mutator phenotypes.
Let be the number of actual mutant cells with mutator phenotypes that appeared along the growth cycle of mutator cell . Without loss of generality, let’s say represent mutant cells with mutator phenotypes then, for each , the mutant cell with a mutator phenotypes has units of time to give rise to its offspring of size , which, according to Equation (A4), is a random variable such that
for every .
By repeating this process for each we have that the total number of mutators in the population at time is
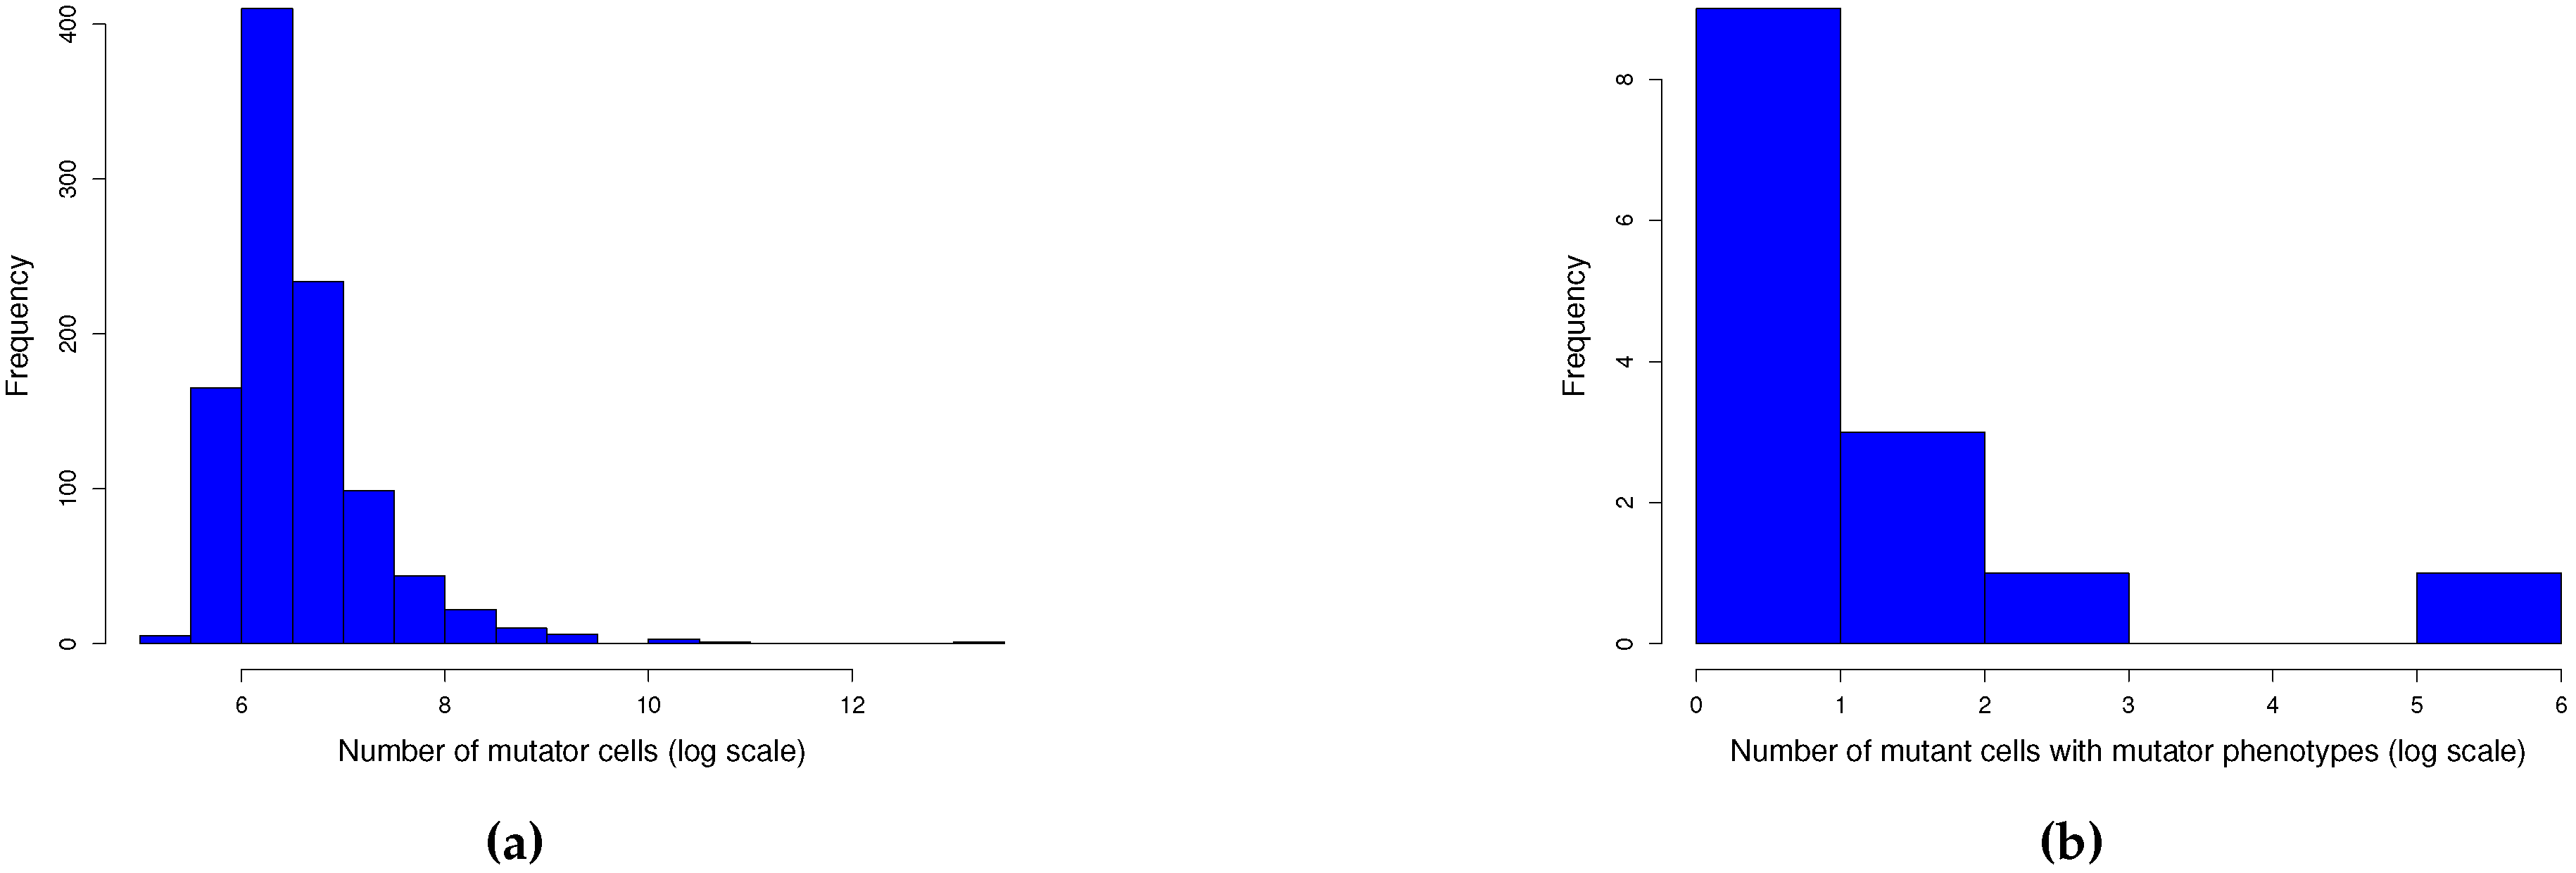
Furthermore, we can study the distribution of the numbers of mutator cells and mutant cells with mutator phenotypes, as shown in Figure A2.
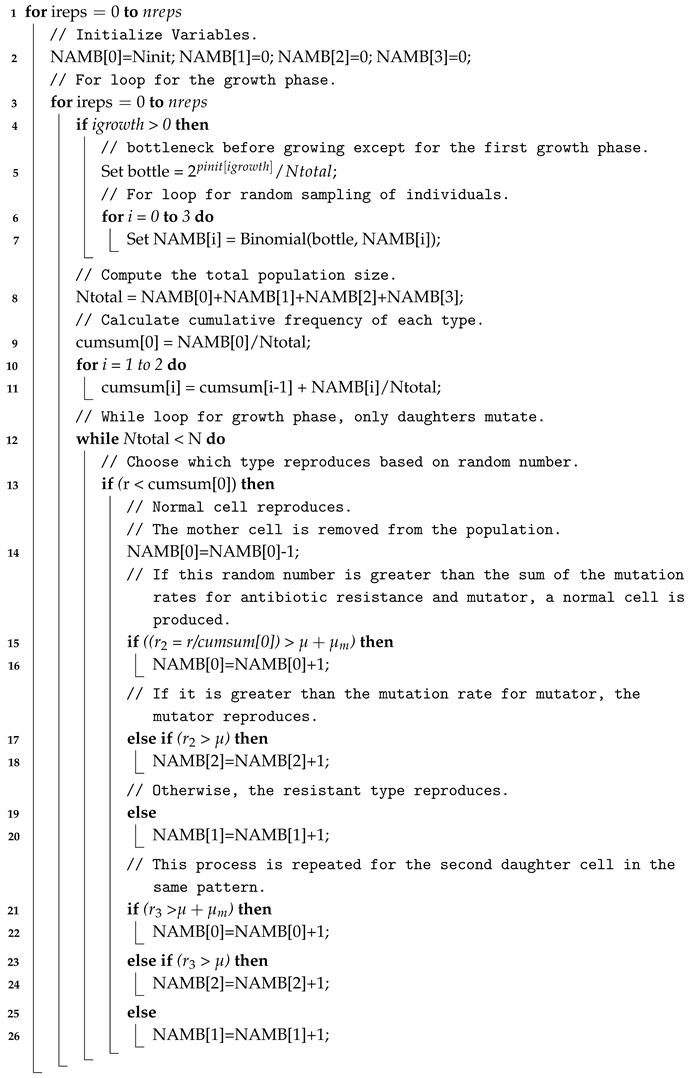
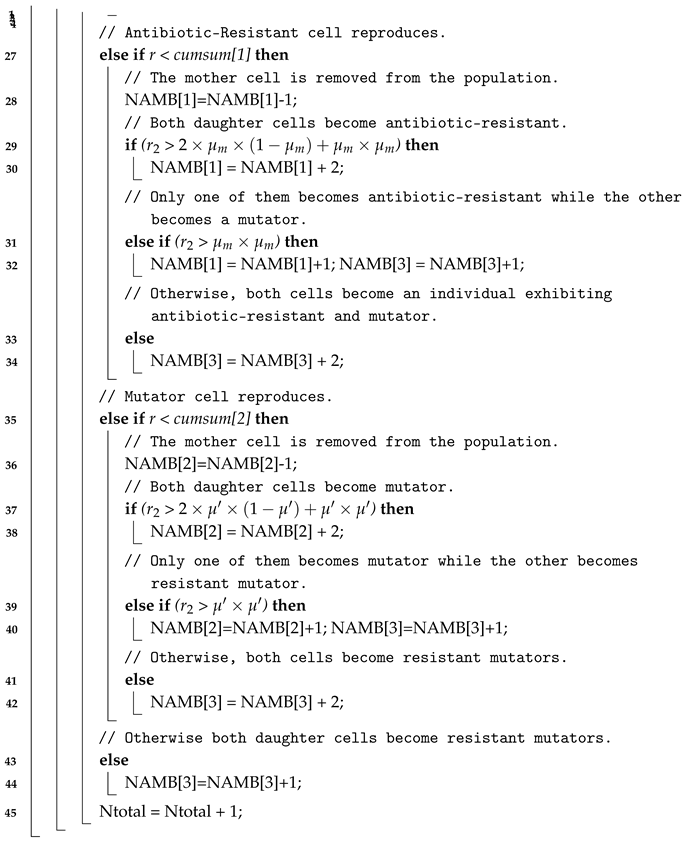
For a pseudocode description of the graphical model, see Algorithm 4.
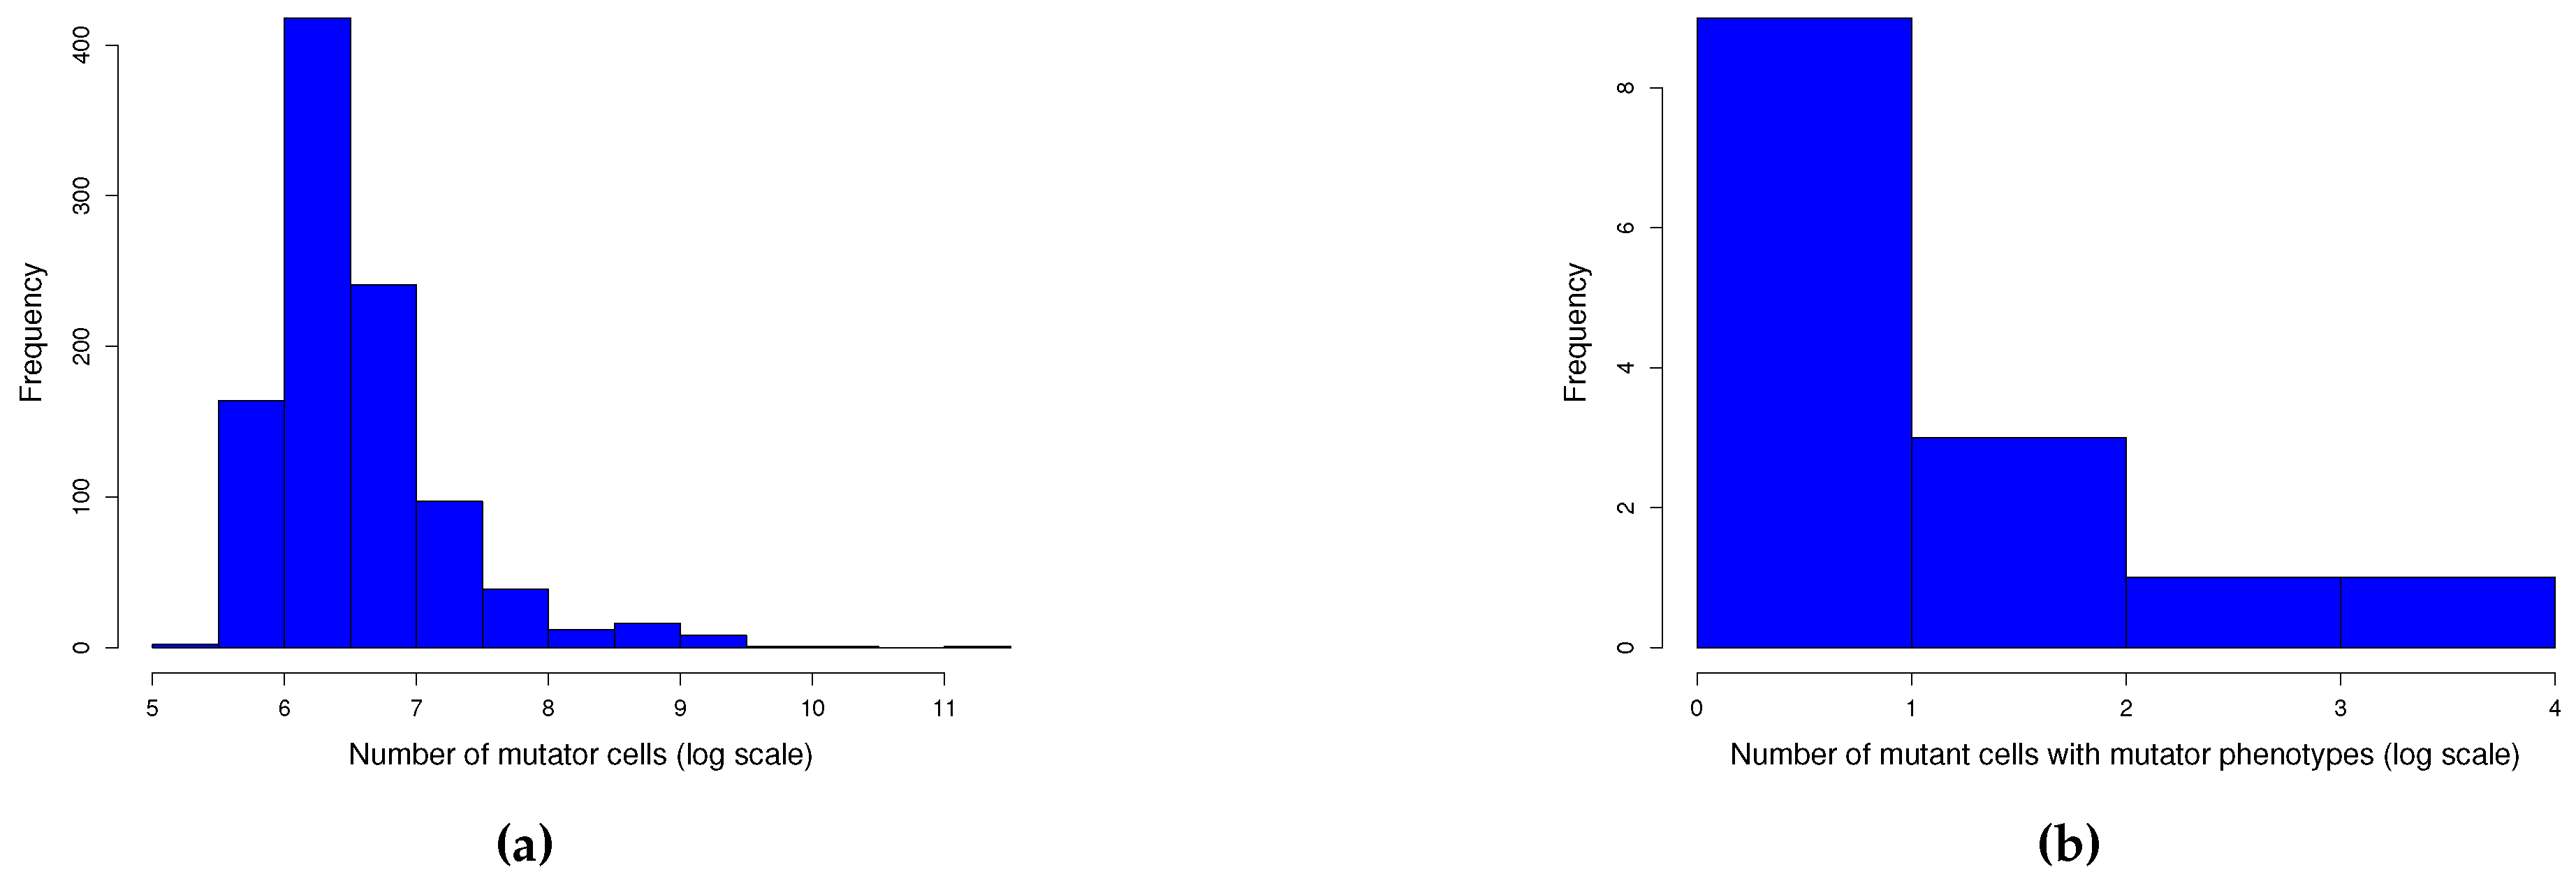
Figure A2.
One thousand simulations of graphical method. (a) Histogram of the number of mutants on log scale and (b) histogram of the number of mutators on log scale. Given the parameters in Figure A1 and a mutation rate to mutator phenotype we simulated 1000 cultures in 354 seconds (printing plots) and in 5 seconds (printing no plots) described method. The distributions of the numbers of mutants and mutators were heavy-tailed, as expected.
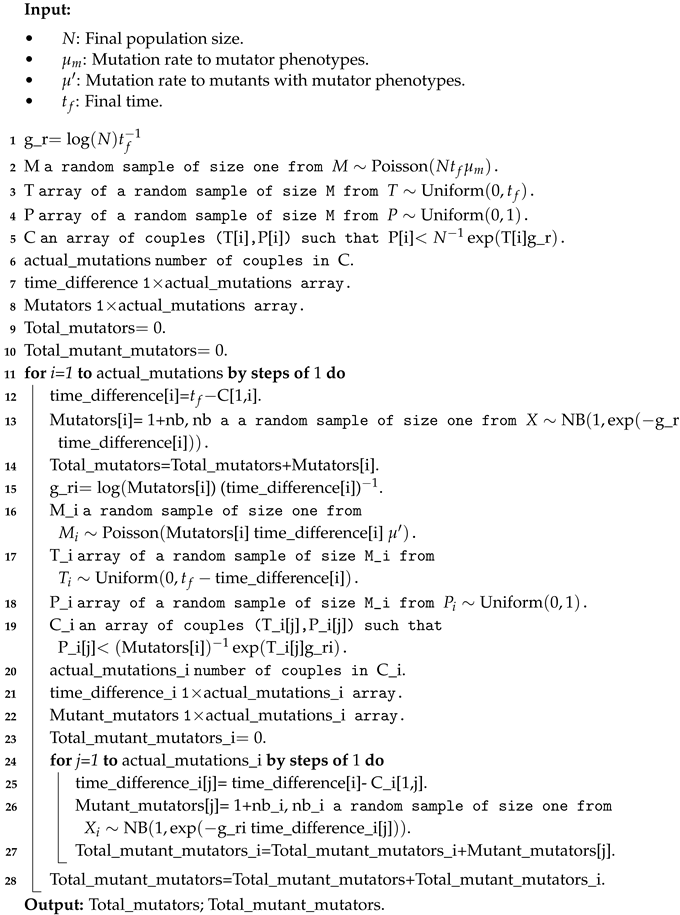
Appendix A.2. Quantile function model
Let’s recall that given a function we say it is invertible if there exists a function (called the inverse function of g) such that
Definition A1
(Quantile function). Let be a cumulative distribution function. The quantile function of F is defined by
.
Quantile functions generalize the concept of the inverse of a function g when g is a cumulative distribution function. Now, quantile functions have a remarkable application, often called the inversion method, which is used to simulate random variables [Proposition 2 [54], a tool used in the following method.
Under assumptions and using the notation of the graphical model, given , denotes the population size at time t. Then denotes the expected number of mutant cells at time t, which, as a function, can be regarded as a probability density function. Furthermore, let then given by
is a probability density function, where its cumulative distribution function is defined by
Hence its quantile function is given by
So if , then
is such that , by the inversion method.
Applying the inversion method as above, only actual mutations leading to mutator phenotypes and their respective appearing time are provided (see Figure A3). Thus, instead of asking for the expected number of mutations, as in Eq. (A1), it is sufficient to ask for the expected number of mutators in the population, which is
Therefore, Equation (A2) is rewritten as
Then we can get the appearing time of M mutator cells by generating a random sample from V of size M, . Note that with this framework there is no need to disregard any point. Therefore, the number of actual mutations coincides with M, which implies Equation (A4) is rewritten as
and then the total number of mutators in the population at time is
To incorporate mutant cells with mutator phenotypes we proceed as in Eq. (A15). For each , the expected number of mutants within the i-th mutator’s offspring of size is In consequence, the random variable, , counting the number of mutations leading to mutant cells with the i-th mutator phenotype is such that
Now, given a fixed index, let then defined by
is the probability density function whose quantile function given by
Thus if , then
is such that , where .
Let a random sample from , then denotes the appearing time of the j-th mutant cell with the i-th mutator phenotype. Therefore, analogous to Eq. (A17), the size of their offspring is a random variable such that
Implying that the number of mutant cells with mutator phenotypes is
For a pseudocode description of the quantile function method, refer to Algorithm 5.
Figure A3.
Comparison between simulated data and actual probability density function. Parameters were the same as in Figure A1. Data for the histogram of the appearing time of mutant cells were simulated by the inversion method and Equation (A14). The graph of (black curve) was included for reference since simulated data has distribution h.
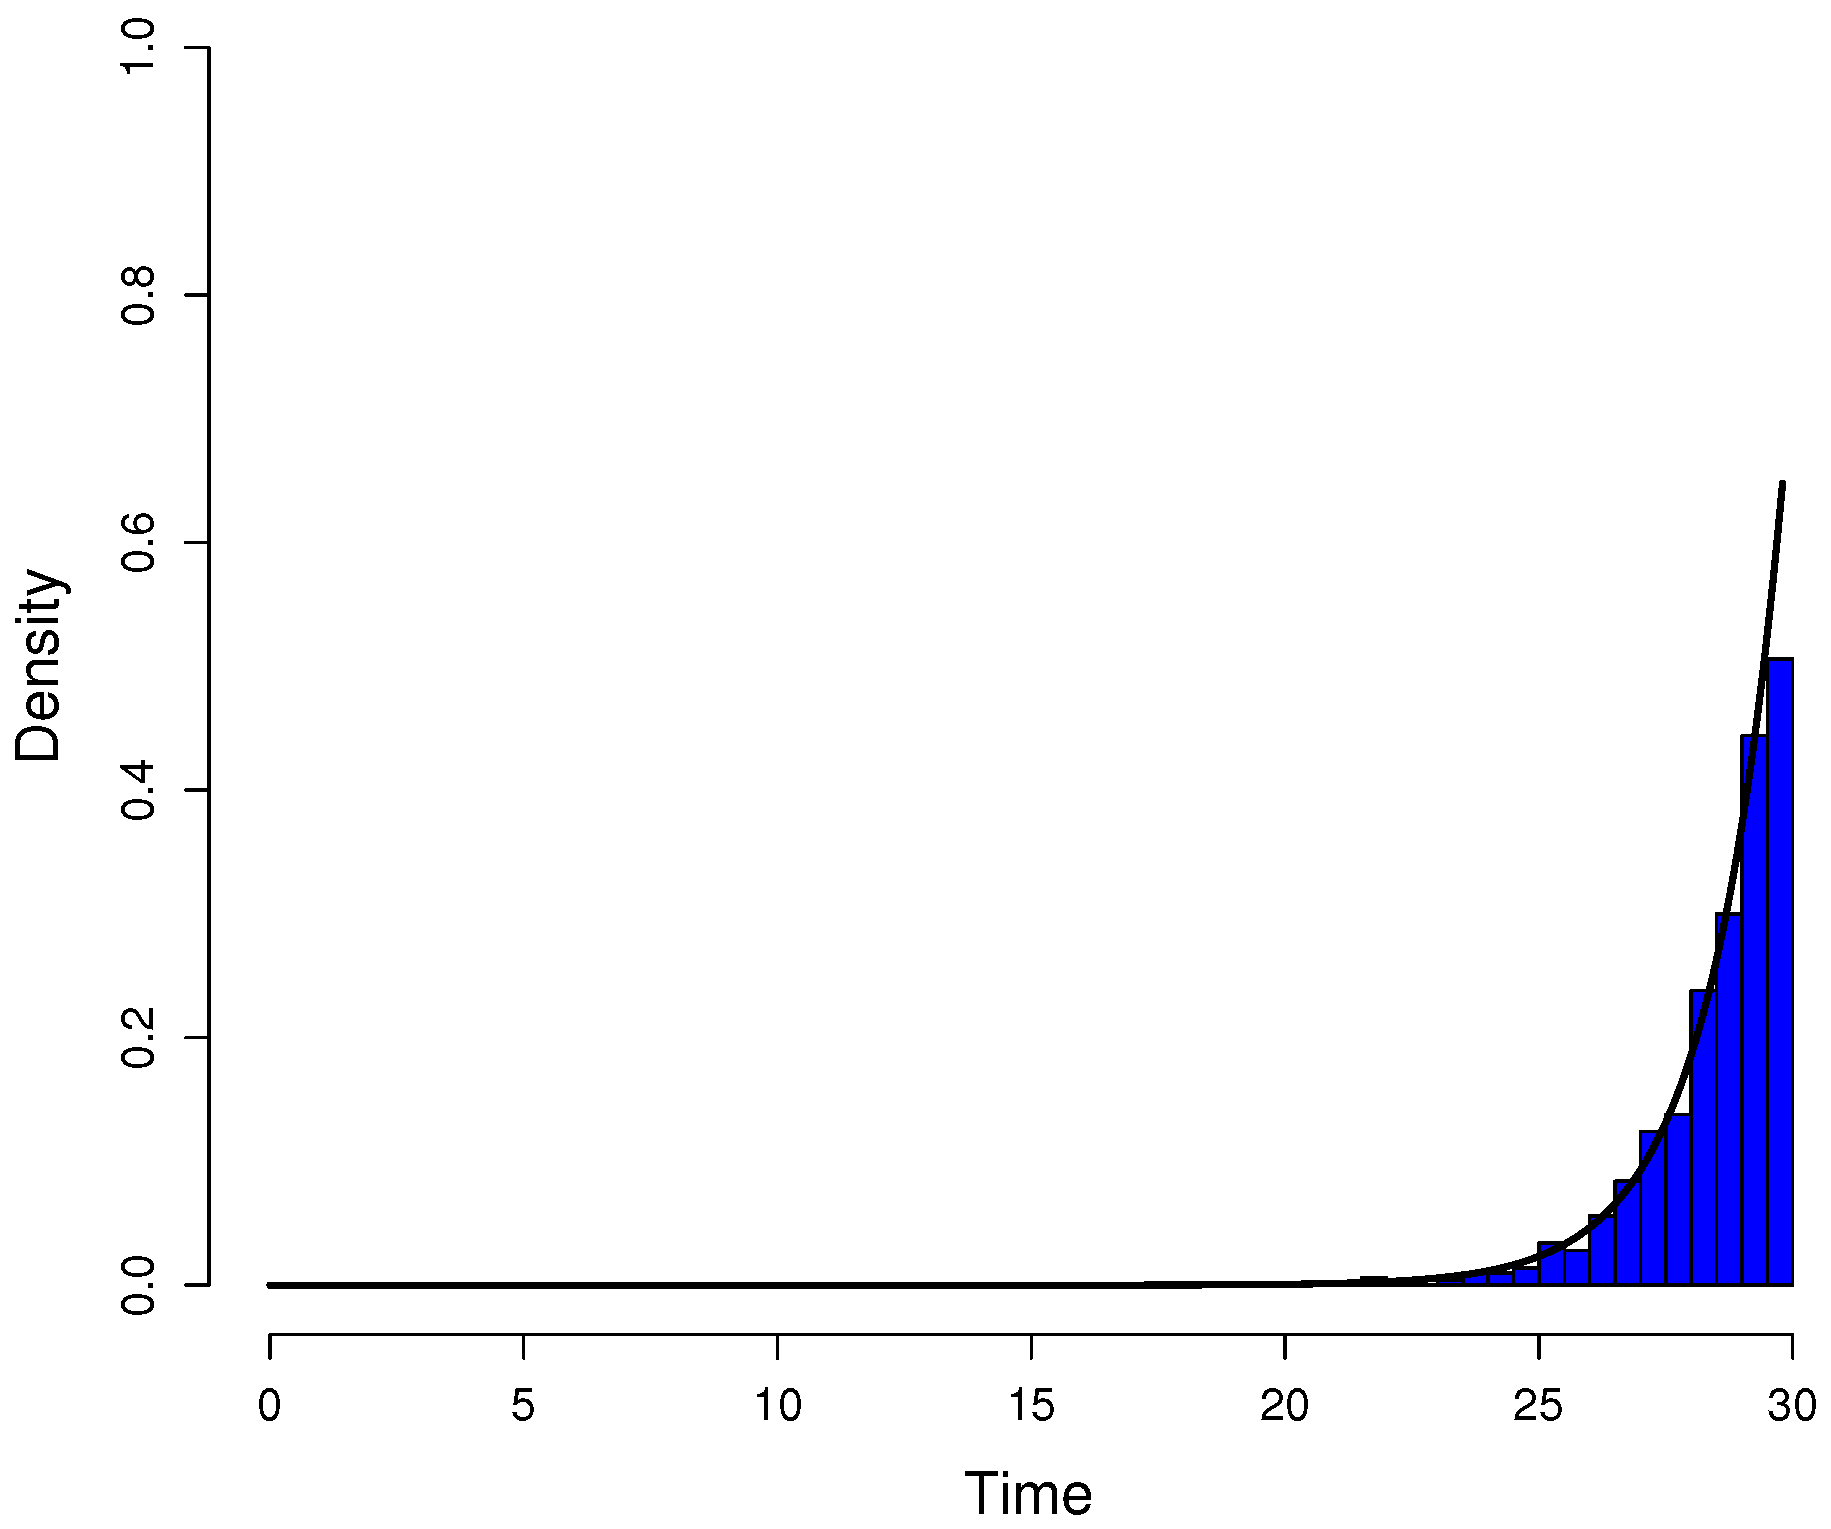
Figure A4.
(a) Histogram of the number of mutants on log scale and (b) histogram of the number of mutators on log scale. The same parameters of Figure A2 were used to simulate 1000 cultures in two seconds using the quantile function method.
Figure A4.
(a) Histogram of the number of mutants on log scale and (b) histogram of the number of mutators on log scale. The same parameters of Figure A2 were used to simulate 1000 cultures in two seconds using the quantile function method.
Appendix A.3. Description of the Moran model
We started the simulation with a single individual referred to as a normal cell (neither mutator nor antibiotic resistance). In order to simulate a pure birth process, a single individual is chosen at random from the population to reproduce. This individual divides into two equal daughter cells, and the mother cell is removed from the population.
At each birth event, each normal daughter cell may mutate to the antibiotic resistant phenotype at mutation rate , or to the mutator phenotype at rate . Individuals with the mutator phenotype have a mutation rate that is k times higher than the normal mutation rate. When either mutation happens, all subsequent offspring inherit the new phenotype.
We note that the mutator phenotype does not have antibiotic resistance directly, but its offspring can develop antibiotic resistance in the future. In particular, daughters of a mutator cell develop antibiotic resistance with mutation rate , while daughters of an antibiotic resistant cell become mutators at rate . Consequently, the population consists of four types of individuals: normal cells, antibiotic resistant cells, mutator cells, and individuals exhibiting both antibiotic resistance and the mutator phenotype.
In summary, the simulation proceeds by choosing an individual at random to reproduce, removing that individual, and determining which types of daughters are added in its place, as described above. This process is repeated until the population size reaches the desired final size (e.g. ). We can also simulate repeated growth phases and population bottlenecks by randomly sampling the final population to achieve a desired initial population size (e.g. , and repeating the procedure above. See Algorithm 1, 2, and 3 for a detailed pseudocode description.
| Algorithm 1: Moran model definitions |
|
Input:
|
| Algorithm 2: Moran model pseudocode |
 |
| Algorithm 3: Moran model pseudocode, continued. |
 |
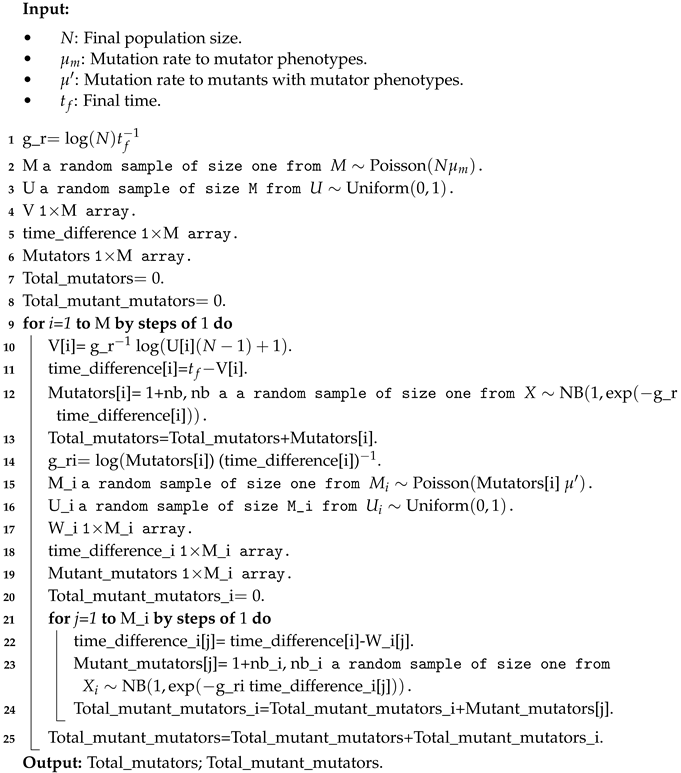
| Algorithm 4: Graphical model pseudocode. |
 |
| Algorithm 5: Quantile function model pseudocode. |
 |
Appendix B. Estimation methods
In previous works dedicated to estimating the mutation rate from wildtype to mutant cells [55,56,57,58,59,60,61,62], methodologies with high accuracy have been developed. In this study, we rely on this literature, which is primarily based on the probability-generating function and its empirical counterpart [63]. Additionally, we discuss the methods we have developed to estimate the mutation rate from wildtype to mutator phenotypes. The first method implements direct fitting techniques using the least squares method, minimizing the distance between the probability-generating function and the empirical probability-generating function to produce the desired estimates. Meanwhile, the second method takes greater advantage of the dilution process proposed as part of the experimental protocol, utilizing the fast Fourier transform and maximum likelihood methods to generate the estimations.
Appendix B.1. Direct estimations
Let X be a discrete random variable with support S and probability mass function , for all . Let’s denote by R the convergence range of the empirical probability-generating function of X
It is known that because for any arbitrary and fixed complex number such that , it holds that
Implying converges absolutely on , which proves the statement.
However, when working with the Luria-Delbrück probability generating function, it is customary to consider the set exclusively; i.e., the interval . This is primarily due to biological considerations. Values close to zero, approaching from the right side, reflect the effect of observing small quantities of mutant cells, while values close to one, approaching from the left side, reflect the influence of large quantities of mutant cells in cell cultures [64].
In works such as [45] and [64], the study of the probability-generating function has been restricted to the points , where , to generate estimates of . However, to estimate , we consider the points , where .
This choice is made because we will be using the probability generating function for the sum of the random variable counting the number of mutant cells produced by wildtype cells and the one counting the number of mutant cells produced by mutator cells. Since we expect to observe small quantities of mutant cells sporadically. Hence, considering the set allows us to reflect this framework.
Let’s assume that replicates of the experiment have been considered, each with growth cycles. Let , where , be a vector whose j-th entry, , represents the sum of the number of mutant cells produced by wildtype cells and the number of mutant cells produced by mutator cells.
To incorporate this information into the dilution process of the experimental protocol, let’s define the vector , where , such that its j-th entry, , corresponds to a realization of the random variable
where and represent the j-th entry of the vector and the dilution factor considered for the i-th growth cycle, respectively.
Before introducing the estimation method, we propose intervals , and such that
Given that, for computational purposes, the approach above provides greater accuracy in the estimation process.
To work with a finite number of possibilities, the intervals will be partitioned to consider only points within the set . Thus, instead of working with the interval , where , we will work with the set of points
Let be defined as
and let be given by
for .
In this way, the estimators , , and for , , and in the i-th growth cycle, respectively, are those that satisfy
for .
Appendix B.2. Maximum likelihood estimations
Applying maximum likelihood methods requires working directly with probability mass functions. In this case, it would involve dealing with the explicit expression of the Luria-Delbrück distribution, which admits no explicit analytic expression [47].
However, by considering the direct approach, outlined up to Equation (A27), sufficient information is provided to recover the probability mass states of the Luria-Delbrück distribution and implement maximum likelihood methods. This can be done by employing the fast Fourier transform as in [65] and [66, Eq. 5].
The Luria-Delbruck distribution, in its simplest form (i.e., the Lea-Coulson formulation that we employ here), has no finite moments, hence its moment-generating function is not analytic. Its characteristic function, on the other hand is analytic, and it is . We leverage this fact to obtain the probability mass function defined by the inverse Fourier transform of .
Let , where is the j-th entry of the vector , for . In other words, is the maximum number of mutant cells present in the i-th growth cycle after dilution.
In this way, given , and defining , the real part of the fast Fourier transform of
where , approximates the value of
for . Where is the random variable whose probability-generating function is . In other words, Eq. (A28) provides an approximation to the probability of observing k mutants on the i-th growth cycle after the dilution.
Therefore,
denotes the likelihood function associated with the i-th growth cycle.
This implies that the maximum likelihood estimators , , and for , , and in the i-th growth cycle, respectively, are those satisfying
References
- Eigen, M.; Schuster, P. The hypercycle. Naturwissenschaften 1978, 65, 7–41. [Google Scholar] [CrossRef]
- Jeancolas, C.; Malaterre, C.; Nghe, P. Thresholds in Origin of Life Scenarios. iScience 2020, 23, 101756. [Google Scholar] [CrossRef]
- Drake, J.W. A constant rate of spontaneous mutation in DNA-based microbes. Proc. Natl. Acad. Sci. U. S. A. 1991, 88, 7160–7164. [Google Scholar] [CrossRef]
- Biebricher, C.K.; Eigen, M. The error threshold. Virus Res. 2005, 107, 117–127. [Google Scholar] [CrossRef]
- Sniegowski, P.D.; Gerrish, P.J.; Johnson, T.; Shaver, A. The evolution of mutation rates: separating causes from consequences. Bioessays 2000, 22, 1057–1066. [Google Scholar] [CrossRef]
- Richard, G.F.; Kerrest, A.; Lafontaine, I.; Dujon, B. Comparative Genomics of Hemiascomycete Yeasts: Genes Involved in DNA Replication, Repair, and Recombination. Mol. Biol. Evol. 2005, 22, 1011–1023. [Google Scholar] [CrossRef] [PubMed]
- Barr, J.N.; Fearns, R. How RNA viruses maintain their genome integrity. J. Gen. Virol. 2010, 91, 1373–1387. [Google Scholar] [CrossRef] [PubMed]
- Drake, J.W.; Charlesworth, B.; Charlesworth, D.; Crow, J.F. Rates of spontaneous mutation. Genetics 1998, 148, 1667–1686. [Google Scholar] [CrossRef] [PubMed]
- Jiang, P.; Ollodart, A.R.; Sudhesh, V.; Herr, A.J.; Dunham, M.J.; Harris, K. A modified fluctuation assay reveals a natural mutator phenotype that drives mutation spectrum variation within Saccharomyces cerevisiae. Elife 2021, 10, e68285. [Google Scholar] [CrossRef] [PubMed]
- Singh, T.; Hyun, M.; Sniegowski, P. Evolution of mutation rates in hypermutable populations of Escherichia coli propagated at very small effective population size. Biol. Lett. 2017, 13. [Google Scholar] [CrossRef]
- Harpak, A.; Bhaskar, A.; Pritchard, J.K. Mutation Rate Variation is a Primary Determinant of the Distribution of Allele Frequencies in Humans. PLoS Genet. 2016, 12, e1006489. [Google Scholar] [CrossRef] [PubMed]
- Gerrish, P. A simple formula for obtaining markedly improved mutation rate estimates. Genetics 2008, 180, 1773–1778. [Google Scholar] [CrossRef] [PubMed]
- Jones, M.E. An algorithm accounting for plating efficiency in estimating spontaneous mutation rates. Comput. Biol. Med. 1993, 23, 455–461. [Google Scholar] [CrossRef]
- Jones, M.E.; Thomas, S.M.; Rogers, A. Luria-Delbrück fluctuation experiments: design and analysis. Genetics 1994, 136, 1209–1216. [Google Scholar] [CrossRef] [PubMed]
- Amicone, M.; Borges, V.; Alves, M.J.; Isidro, J.; Zé-Zé, L.; Duarte, S.; Vieira, L.; Guiomar, R.; Gomes, J.P.; Gordo, I. Mutation rate of SARS-CoV-2 and emergence of mutators during experimental evolution. Evol Med Public Health 2022, 10, 142–155. [Google Scholar] [CrossRef]
- Biebricher, C.K.; Eigen, M. What is a quasispecies? Curr. Top. Microbiol. Immunol. 2006, 299, 1–31. [Google Scholar]
- Ancel, L.W.; Fontana, W. Plasticity, evolvability, and modularity in RNA. J. Exp. Zool. 2000, 288, 242–283. [Google Scholar] [CrossRef]
- Nowak, M.; Schuster, P. Error thresholds of replication in finite populations mutation frequencies and the onset of Muller’s ratchet. J. Theor. Biol. 1989, 137, 375–395. [Google Scholar] [CrossRef]
- Sardanyés, J.; Elena, S.F. Error threshold in RNA quasispecies models with complementation. J. Theor. Biol. 2010, 265, 278–286. [Google Scholar] [CrossRef]
- Wiehe, T. Model dependency of error thresholds: the role of fitness functions and contrasts between the finite and infinite sites models. Genet. Res. 1997, 69, 127–136. [Google Scholar] [CrossRef]
- Baake, E.; Wagner, H. Mutation–selection models solved exactly with methods of statistical mechanics. Genet. Res. 2001, 78, 93–117. [Google Scholar] [CrossRef]
- Boerlijst, M.C.; Bonhoeffer, S.; Nowak, M.A. Viral Quasi-Species and Recombination. Proc. Biol. Sci. 1996, 263, 1577–1584. [Google Scholar]
- Gardner, A.; Welch, J.J. A formal theory of the selfish gene. J. Evol. Biol. 2011, 24, 1801–1813. [Google Scholar] [CrossRef]
- Dawkins, R. The Selfish Gene; Oxford University Press, 1989.
- Mao, E.F.; Lane, L.; Lee, J.; Miller, J.H. Proliferation of mutators in A cell population. J. Bacteriol. 1997, 179, 417–422. [Google Scholar] [CrossRef] [PubMed]
- Neinavaie, F.; Kramer, A. Does mutation rate of cancer cells change as the stage of the disease advances? Cancer Res. 2022, 82, A038–A038. [Google Scholar] [CrossRef]
- Hao, D.; Wang, L.; Di, L.J. Distinct mutation accumulation rates among tissues determine the variation in cancer risk. Sci. Rep. 2016, 6, 1–5. [Google Scholar] [CrossRef] [PubMed]
- Tomlinson, I.P.M.; Novelli, M.R.; Bodmer, W.F. The mutation rate and cancer. Proceedings of the National Academy of Sciences 1996, 93, 14800–14803. [Google Scholar] [CrossRef]
- Fox, E.J.; Prindle, M.J.; Loeb, L.A. Do mutator mutations fuel tumorigenesis? Cancer Metastasis Rev. 2013, 32, 353–361. [Google Scholar] [CrossRef] [PubMed]
- Russo, M.; Pompei, S.; Sogari, A.; Corigliano, M.; Crisafulli, G.; Puliafito, A.; Lamba, S.; Erriquez, J.; Bertotti, A.; Gherardi, M.; et al. A modified fluctuation-test framework characterizes the population dynamics and mutation rate of colorectal cancer persister cells. Nat. Genet. 2022, 54, 976–984. [Google Scholar] [CrossRef]
- Bielas, J.H.; Loeb, K.R.; Rubin, B.P.; True, L.D.; Loeb, L.A. Human cancers express a mutator phenotype. Proc. Natl. Acad. Sci. U. S. A. 2006, 103, 18238–18242. [Google Scholar] [CrossRef]
- Natali, F.; Rancati, G. The Mutator Phenotype: Adapting Microbial Evolution to Cancer Biology. Front. Genet. 2019, 10, 713. [Google Scholar] [CrossRef] [PubMed]
- Nowell, P.C. The clonal evolution of tumor cell populations. Science 1976, 194, 23–28. [Google Scholar] [CrossRef] [PubMed]
- Sprouffske, K.; Merlo, L.M.F.; Gerrish, P.J.; Maley, C.C.; Sniegowski, P.D. Cancer in Light of Experimental Evolution. Curr. Biol. 2012, 22, R762–R771. [Google Scholar] [CrossRef] [PubMed]
- Stewart, F.M. Fluctuation analysis: the effect of plating efficiency. Genetica 1991, 84, 51–55. [Google Scholar] [CrossRef] [PubMed]
- Bokes, P.; Singh, A. A modified fluctuation test for elucidating drug resistance in microbial and cancer cells. Eur. J. Control 2021, 62, 130–135. [Google Scholar] [CrossRef]
- Luria, S.E.; Delbrück, M. Mutations of Bacteria from Virus Sensitivity to Virus Resistance. Genetics 1943, 28, 491–511. [Google Scholar] [CrossRef] [PubMed]
- Hamon, A.; Ycart, B. Statistics for the Luria-Delbrück distribution. EJSS 2012, 6, 1251–1272. [Google Scholar] [CrossRef]
- Ycart, B. Fluctuation analysis: can estimates be trusted? PLoS One 2013, 8, e80958. [Google Scholar] [CrossRef]
- Feller, W. An Introduction to Probability Theory and Its Applications; New York; Chapman & Hall: London, 1957. [Google Scholar]
- Brunetti, M.; Mackey, M.; Craig, M. Understanding normal and pathological hematopoietic stem cell biology using mathematical modelling. Current Stem Cell Reports 2021, 7, 109–120. [Google Scholar] [CrossRef]
- Arnold, T.; Emerson, J. Nonparametric goodness-of-fit tests for discrete null distributions. R Journal 2011, 3. [Google Scholar] [CrossRef]
- Ycart, B. Fluctuation Analysis: Can Estimates Be Trusted? PLoS ONE 2013, 8, e80958. [Google Scholar] [CrossRef]
- Lea, D.; Coulson, C. The distribution of the numbers of mutants in bacterial populations. Journal of Genetics 1949, 49, 264–285. [Google Scholar] [CrossRef] [PubMed]
- Gillet-Markowska, A.; Louvel, G.; Fischer, G. bz-rates: A Web Tool to Estimate Mutation Rates from Fluctuation Analysis. G3 Genes|Genomes|Genetics 2015, 5, 2323–2327. [Google Scholar] [CrossRef] [PubMed]
- Ramachandran, K.; Tsokos, C. Mathematical Statistics with Applications; Elsevier Science, 2009.
- Zheng, Q. New algorithms for Luria-Delbrück fluctuation analysis. Mathematical Biosciences 2005, 196, 198–214. [Google Scholar] [CrossRef] [PubMed]
- Feng, Z.; McCulloch, C.E. Statistical inference using maximum likelihood estimation and the generalized likelihood ratio when the true parameter is on the boundary of the parameter space. Statistics & Probability Letters 1992, 13, 325–332. [Google Scholar] [CrossRef]
- Ross, S. Introduction to probability models; Academic press, 2007.
- Luria S.E., D. M. Mutations of bacteria from virus sensitivity to virus resistance. Genetics 1943, 28, 491. [Google Scholar] [CrossRef] [PubMed]
- Chiang, C.L. . Introduction to Stochastic Processes in Biostatistics; John Wiley & Sons, Inc., 1968.
- Waller, J.H.; Rao, B.R.; Li, C.C. Heterogeneity of childless families. Social Biology 1973, 20, 133–138. [Google Scholar] [CrossRef] [PubMed]
- R Core Team. R: A Language and Environment for Statistical Computing, R Foundation for Statistical Computing: Vienna, Austria, 2022.
- Embrechts, P.; Hofert, M. A note on generalized inverses. Mathematical Methods of Operations Research 2013, 77, 423–432. [Google Scholar] [CrossRef]
- Crane, G. A modified Luria-Delbrück fluctuation assay for estimating and comparing mutation rates. Mutation Research/Fundamental and Molecular Mechanisms of Mutagenesis 1996, 354, 171–182. [Google Scholar] [CrossRef]
- de la Iglesia, F.; Martínez, F.; Hillung, J.; Cuevas, J.M.; Gerrish, P.J.; Daròs, J.A.; Elena, S.F. Luria-Delbrück Estimation of Turnip Mosaic Virus Mutation Rate In Vivo. Journal of Virology 2012, 86, 3386–3388. [Google Scholar] [CrossRef]
- Hall, B.M.; Ma, C.X.; Liang, P.; Singh, K.K. Fluctuation AnaLysis CalculatOR: a web tool for the determination of mutation rate using Luria–Delbrück fluctuation analysis. Bioinformatics 2009, 25, 1564–1565, [https://academic.oup.com/bioinformatics/article-pdf/25/12/1564/482426/btp253.pdf]. [Google Scholar] [CrossRef] [PubMed]
- Koch, A.L. Mutation and growth rates from Luria-Delbrück fluctuation tests. Mutation Research/Fundamental and Molecular Mechanisms of Mutagenesis 1982, 95, 129–143. [Google Scholar] [CrossRef]
- Kosterlitz, O.; Tirado, A.M.; Wate, C.; Elg, C.; Bozic, I.; Top, E.M.; Kerr, B. Estimating the rate of plasmid transfer with an adapted Luria–Delbrück fluctuation analysis. bioRxiv, 2022; pp. 2021–01. [Google Scholar]
- Lang, G.I. Measuring Mutation Rates Using the Luria-Delbrück Fluctuation Assay. In Methods in Molecular Biology; Springer New York, 2017; pp. 21–31. [CrossRef]
- Zheng, Q. A new practical guide to the Luria–Delbrück protocol. Mutation Research/Fundamental and Molecular Mechanisms of Mutagenesis 2015, 781, 7–13. [Google Scholar] [CrossRef]
- Zheng, Q. New approaches to mutation rate fold change in Luria–Delbrück fluctuation experiments. Mathematical Biosciences 2021, 335, 108572. [Google Scholar] [CrossRef]
- Nakamura, M.; Pérez-Abreu, V. Empirical probability generating function: An overview. Insurance: Mathematics and Economics 1993, 12, 287–295. [Google Scholar] [CrossRef]
- Hamon, A.; Ycart, B. Statistics for the Luria-Delbrück distribution. Electronic Journal of Statistics 2012, 6, 1251–1272. [Google Scholar] [CrossRef]
- Alexander, H.K. Conditional Distributions and Waiting Times in Multitype Branching Processes. Advances in Applied Probability 2013, 45, 692–718. [Google Scholar] [CrossRef]
- Lange, K. Calculation of the Equilibrium Distribution for a Deleterious Gene by the Finite Fourier Transform. Biometrics 1982, 38, 79–86. [Google Scholar] [CrossRef]
Figure 3.
Fitting data sets of mutants produced by wildtype cells to the Luria-Delbrück distribution. Data sets for final population size , used for Figure 2, were used to visually verify their fit to the Luria-Delbrück distribution. The blue dashed line shows the cumulative distribution function associated with the Luria-Delbrück distribution, and the black dots show the empirical cumulative distribution function associated with the data set. (a) Fitting of the Moran model simulations. (b) Fitting of the graphical model simulations. (c) Fitting of the quantile function model simulations.
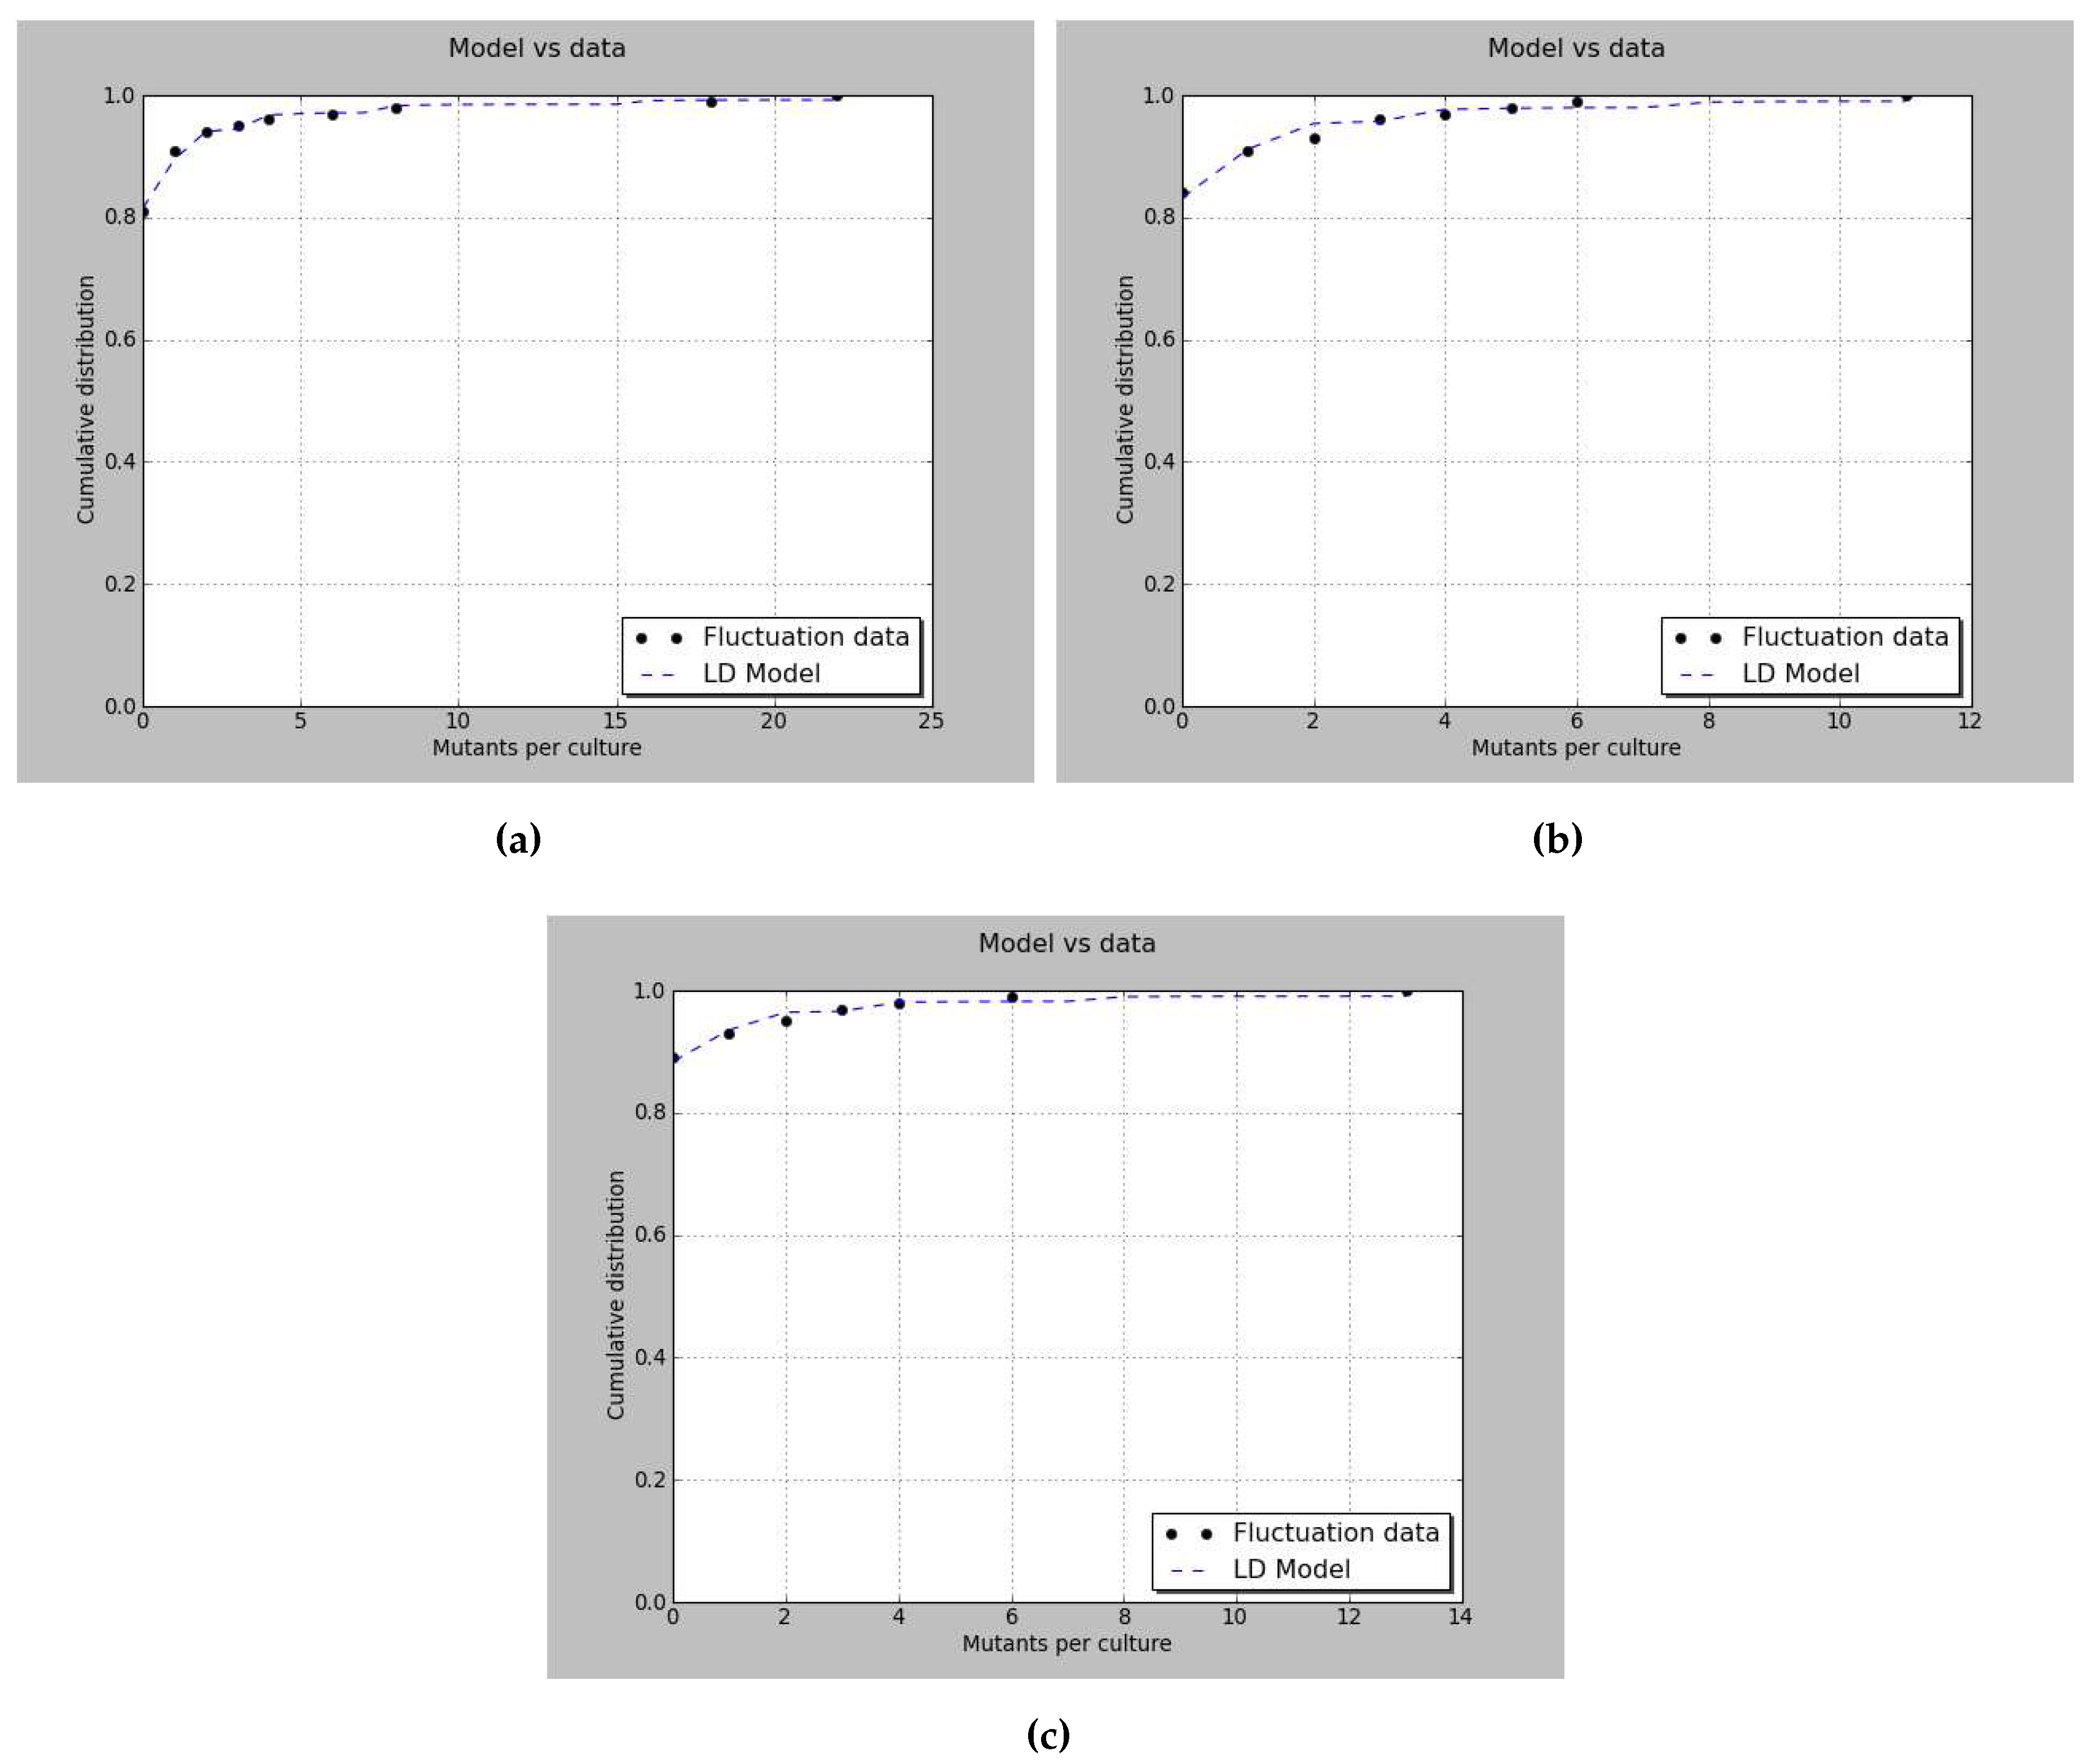
Table 2.
Parameter estimation analysis on bz-rates. Data sets of mutants produced by wildtype cells in a final population size with mutation rates , , and , used for Figure 2 were taken.
Table 2.
Parameter estimation analysis on bz-rates. Data sets of mutants produced by wildtype cells in a final population size with mutation rates , , and , used for Figure 2 were taken.
| Moran | Graphical | Quantile function | |
|---|---|---|---|
| Estimate of | |||
| Estimation error | |||
| 95% confidence interval lower bound | |||
| 95% confidence interval upper bound | |||
| Pearson’s value | 1.6333 | 4.1370 | 1.0446 |
| p-value | 0.8027 | 0.3877 | 0.9029 |
Table 3.
Estimates and 95% confidence intervals for a data set built with the Moran model. For the data set the following parameters were considered: , , , and .
Table 3.
Estimates and 95% confidence intervals for a data set built with the Moran model. For the data set the following parameters were considered: , , , and .
| Method | Estimate of | 95% confidence interval |
|---|---|---|
|
Direct estimations bootstrap |
||
| MLE | ||
|
Two-variable MLE |
Table 4.
Estimates and 95% confidence intervals for a data set built with the quantile function model. For the data set the following parameters were considered: , , , and .
Table 4.
Estimates and 95% confidence intervals for a data set built with the quantile function model. For the data set the following parameters were considered: , , , and .
| Method | Estimate of | 95% confidence interval |
|---|---|---|
|
Direct estimations bootstrap |
||
| MLE | ||
|
Two-variable MLE |
Table 5.
Estimates and 95% confidence intervals for a data set built with the graphical model. For the data set the following parameters were considered: , , , , and .
Table 5.
Estimates and 95% confidence intervals for a data set built with the graphical model. For the data set the following parameters were considered: , , , , and .
| Method | Estimate of | 95% confidence interval |
|---|---|---|
|
Direct estimations bootstrap |
||
| MLE | ||
|
Two-variable MLE |
Disclaimer/Publisher’s Note: The statements, opinions and data contained in all publications are solely those of the individual author(s) and contributor(s) and not of MDPI and/or the editor(s). MDPI and/or the editor(s) disclaim responsibility for any injury to people or property resulting from any ideas, methods, instructions or products referred to in the content. |
© 2023 by the authors. Licensee MDPI, Basel, Switzerland. This article is an open access article distributed under the terms and conditions of the Creative Commons Attribution (CC BY) license (http://creativecommons.org/licenses/by/4.0/).
Copyright: This open access article is published under a Creative Commons CC BY 4.0 license, which permit the free download, distribution, and reuse, provided that the author and preprint are cited in any reuse.


