Submitted:
10 November 2023
Posted:
13 November 2023
You are already at the latest version
Abstract
The radiation stability of polymer test objects fabricated by direct laser writing is studied. The two groups of 6 cubes (50×50×50 μm3) were printed on a common silicon substrate. 6 cubes were irradiated with X-rays in the synchrotron radiation beam (12 keV, 1010 photons/mm2/s), the other 6 kept non-irradiated for the reference. In each group, the fabrication parameters (laser power and slicing step) were uniformly varied from cube to cube. Each irradiated cube was exposed with the dose of 1013 X-ray photons. The calibration of this dose in the radiological units (Gy) was carried out using the tissue-equivalent thermoluminescent detectors (TLD-800). The corresponding exposition dose was estimated as 30 kGy for each cube. The radiation effects were evaluated by Raman spectroscopy and by morphological changes observed with the raster electron microscope. The primary radiation effect appears in the essential increase of the polymerization degree with consuming carbon-carbon double bonds in favor of the polymer cross-linking. Only one cube of 6 has changed the size and shape due to this effect, while the others retained the initial shape. Morphological changes are connected with the improper fabrication parameters (laser power and slicing step). Properly fabricated objects withstand the X-rays of the synchrotron radiation beam.
Keywords:
Additive manufacturing
; direct laser writing
; X-ray optics
; radiation effects in polymer materials
; thermoluminescent radiation detectors
1. Introduction
The employment of laser-induced photopolymerization opened a new era in additive technologies. Direct laser writing (DLW) provides the versatile means to make 3D-structures of the micron scale with a sub-micron resolution. An increased resolution was possible due to the two-photon polymerization technique, and this promoted a heavy growth of the DLW technology and implementations thereof [1,2]. Laser-printed structures have many applications, from refractive focusing elements for X-ray microscopy [3,4,5,6] to scaffolds for studying separated immobilized cells [7,8,9]. Nobody stands against obvious demands of durability of the X-ray focusing accessories in the X-ray radiation field, but the same requirements become applicable to the scaffolds: at present, many biological studies involving scaffolds employ synchrotron radiation (SR) X-ray sources [10,11,12]. The destruction of the X-ray lenses under the SR-beam radiation has been demonstrated previously [3,4], however, the more detailed studies were left over until better times. Hence, the crucial question yet persists: how stable are the laser-printed polymeric objects under the SR beam? The present work tries to give a practical answer to this question. The experiments described here include laser-printing of test objects, their irradiation with a high X-ray radiation dose (~30 kGy) by the SR beam (12 keV, 1010 photons/(mm2·s)), and the estimation of the radiation dose by means of tissue-equivalent thermoluminescent detectors. The electron microscopy and Raman spectroscopy data for the test objects before and after the SR effect are compared in order to monitor radiation-induced changes.
2. Experimental materials, methods, and equipment
2.1. DLW technique and materials
A commercial setup Nanoscribe Professional (Nanoscribe, Germany) was employed for laser-printed objects fabrication. A femtosecond Ti:Sa laser (the repetition rate of 80 MHz, the wavelength of 780 nm) was used to initiate the two-photon photopolymerization reaction. A Zeiss high-aperture planapochromatic objective PlanApo (, NA=1.4) focused the laser radiation on the photosensitive composition. The composition contained 49.5% of PETA (Pentaerythritol triacrylate, Sigma-Aldrich), 29.7% of Bis-GMA (bisphenol A-glycidyl methacrylate, Sigma-Aldrich), and 19.8% of TEGDMA (triethylene glycol dimethacrylate, Sigma-Aldrich). A sensitizing dye 4MET-BAC (photoinitiator) [13] was added in the amount of 1%. After the DLW process, the unexposed regions of the composition were removed by washing for 25 min in PEGMA (propylene glycol monomethyl ether acetate), and then for 5 min in IPA (isopropyl alcohol). The DLW with hatching step of 0.2 μm was used for all 12 cubic samples ( μm3), while the laser power and slicing step were varied uniformly from sample to sample in two groups of 6 cubic samples. These two groups of cubic samples were produced on a common silicon substrate.
The first group, placed near the substrate corner, was destined for the X-ray treatment. The second group, placed farther from the corner, was not affected by the radiation; these cubic samples were destined for the reference. The slicing step and laser power for the samples are given in Table 1.
The positions of fabricated cubes on the substrate were checked with the SopTop RX50M optical microscope (Sunny Optical Technology, China). The first group of samples is shown in Figure 1, where the microscope picture is placed into the frame indicating the position of the substrate in the window during the followed SR-beam irradiation (see below).
2.2. SR-beam irradiation
2.2.1. The SR source and setup
The samples were irradiated with the SR beam on the “Microfocus” beamline at the “Siberia-2” SR source of the National Research Center “Kurchatov Institute”. The optical part of the beamline consisted of two achromatic flat mirrors and a double multilayer monochromator. The first mirror was Pt-plated, the second had Si coating. The mirrors were set at a 2θ angle of 2.67 mrad. This setup provided the pass-through band below the X-ray photon energy of 12 keV. The beam was further conditioned using a double multilayer W/C[] monochromator on a Si substrate with the layer period of 3.24 nm and the energy resolution dE/E ~ , which provided in our case the energy width of 0.6 keV. The flux of X-ray photons was measured with a Single Channel Scintillation Detector SCSD-4 (Radicon Ltd.). To keep the photon count in the dynamic range of the detector (up to cps), a set of attenuators was employed (1 mm 1.5 mm of Al folium, with total transmittance T = ). The substrate carrying the test objects was adjusted with the SmarAct SLC-32 precision positioners driven by SmarAct MCS2 controller. Real-time remote observation of samples was arranged with the Optem FUSION optical microscope equipped with the Motic Moticam 1080 camera. The test objects were positioned at the central region of the SR beam in the square working window of mm2 (see Figure 1). The working window was composed of two crossed Tantalum slits.
2.2.2. Radiation exposition dose (number of X-ray photons)
To gain a large radiation dose, the objects were exposed during three subsequent beam-times (total time of ~55 hours). Beam lifetime of any electron storage ring is limited due to collisions of the electrons with the molecules of residual gas and with the ions released from the walls of vacuum chamber stroked by the SR photons [14]. At any instant t, the beam current j obeys the equation:
In Equation (1), is beam lifetime. This gives exponential decay at any instant. However, the residual gas pressure changes due to various factors modulating τ on longer time intervals. Finally, the amount of positive ions in vacuum chamber becomes crucial for the electron beam stable being, and then beam current decreases in a short time. Each electron in the beam produces SR, hence, the SR intensity in the window is proportional to the beam current. The exposition dose behind the working window can be defined as the integral photon flux over the exposition time , where is calibration constant for a particular setup:
Before proceeding with the expositions, the number of X-ray photons per second crossing the square window of 1 mm2 was measured. The photon count photons/s was obtained with the attenuator of transmittance . At photon counting, the beam current mA was observed. The calibration constant photons/(s·mA·mm2):
The beam current integrals over the beam-times were calculated with two different approaches. The running sums of the array of current values were calculated over “bad” time intervals when fast changes of beam current have occurred. For “normal” time intervals, the beam current was approximated by a sum of two decaying exponents:
The beam current integral for the first beam-time was mA·s which corresponds to photons throughout the window. After the second beam-time the corresponding values were mA·s and photons, and after the third one they were mA·s and photons, respectively. Total X-ray photon flux through the window after three beam-times was photons. The exposition dose for the test objects can be calculated if one knows the distribution function of the X-ray photons in the working window. To obtain this function, the SR beam field was scanned with the scan step of 0.2 mm using the crossed slits selecting the area of mm2. The scanning range was wider than working window, mm both in vertical and horizontal directions.
Exposition time was 3 s at each scan point, where photon flux was attenuated before measuring with the coefficient of (by a 2 mm thick aluminium folium). The obtained flux values ( matrix) were then interpolated by the bivariate cubic splines using Wolfram Mathematica software. The radiation distribution function in the working window ( mm2) was derived by normalization of these data where integration is over the working window area :
This function is plotted in Figure 2. Red spots indicate the positions of test objects.
Knowing the total (integrated over the exposition time) photon flux in the working window, one can calculate the exposition dose in photons for each test object , where is the radiation distribution function value at the position of the center of object , and is the ratio of the object i exposition area to the working window area :
The results for 6 objects are given in Table 2. The data are shifted in columns to mimic the positions of samples in Figure 2 for best clarity. The exposition was sufficiently uniform, with a slightly higher dose at the left-bottom corner. Thus, the radiation exposition dose expressed in the number of incident X-ray photons can be estimated directly, however, it would be reasonable to express these data in the radiological units.
2.2.3. Radiation exposition dose (radiological units, Gy)
To relate the number of incident SR beam photons to the radiological units, one needs to measure SR beam radiation dose with a calibrated detector.
Relatively high dose rates in the SR-beam impose using radiation-stable wide-range detectors. The best solutions can be found among thermoluminescent detectors (TLDs). There are two classes of wide-range detectors, TLD-400 (CaF2:Mn) [15] and TLD-800 (Li2B4O7:Mn) [16]. The latter seem to be the most suitable ones: first, they have been proved to withstand high dose rates up to 32 Gy/s/cm2 [16], and second, they are based on the tissue-equivalent material providing the flat dependence of the response on the incident radiation energy [17]. The latter property facilitates a calibration procedure for detectors, since the reference dose can be acquired from almost any available radiation source. TLD-800 detectors were obtained in the form of ceramic tablets according to manufacturing process described in papers [16,18] (see Figure 3). The reference dose of Gy was given at the Laboratory of Detectors of JSC “SNIIP”. The detectors were irradiated at the same SR beamline where the test objects were studied. Several paper layers placed behind the detectors provided the absence of scattered radiation background. The crossed slits with a small open area of mm2 ensured a complete interception of the SR beam by a detector (~4.4 mm in diameter). The SR beam photon energy of 12 keV was conditioned with the setup described above. A smaller window allowed to use a thinner attenuator (an 0.8 mm thick Al folium of the transmittance ).
Calibration constant in photons/(mA·s) for the particular setup was determined in three subsequent measurements summarized in Table 3. The value obtained here should be corrected for the attenuator transmittance:
The detectors were irradiated in the same setup without the attenuator, so this value was applied to estimate the detectors exposition dose expressed in the number of X-ray photons.
The readout of the TLD-800 detectors was carried out with the TLD reader DVG-2M (SPC “Doza”). The heating rate of 2 K/s was used at readout. A typical thermally stimulated luminescence (TSL) curve obtained after the reference dose of 1.90 Gy (detector Nr. 3) is shown in Figure 4. The area under the TSL curve peak at 480 K is a measure of the detector response to dose. This TSL peak stores dose information for a sufficiently long time being subjected to fading neither in dark nor in daylight. The response of the detectors to the reference dose of 1.90 Gy was taken as their calibration. With the knowledge of the response linearity against the radiation dose [18], one can compare the X-ray SR beam doses with the reference dose. The detectors were given four different expositions in the X-ray SR beam: 5, 10, 20 and 40 s. The exposition time was set remotely using an electromagnetic shutter. Due to variations in the shutter actuation time and operator reaction, the exposition of 5 s demonstrated essential errors. So, it was excluded from the further calculations.
The idea of calculations is to connect the number of X-ray photons in the SR beam with the radiological units (Gy). The results are given in Table 4.
With the knowledge of the transition coefficient photons/Gy, one can estimate the exposition radiation doses for the studied test objects dividing photon numbers by this coefficient.
The results are given in Table 5. The radiation dose of about 30 kGy is high enough to destroy various materials, hence, the changes in the test objects should be at least observable.
2.3. Morphological evaluations
The shape of test objects was evaluated with the raster electron microscope (REM) before and after irradiation. CUBE II REM (Emcrafts, Korea) was used for this purpose, with a very thin platinum layer (of several nanometers) being vacuum-deposited on the samples. An attempt to work without Pt deposition was not successful due to image distortions caused by stored electrical charge.
2.4. Estimation of the polymerization degree by Raman spectroscopy
2.4.1. Raman spectroscopy setup
Raman spectra were measured using spectrometer In Via Raman Microscope (Renishaw, GB), with the excitation performed by the diode laser of the 785 nm wavelength. The laser beam was focused on the sample via the objective N Plan 50/0.50 of the 8 mm working distance (Leica, Germany). Power at the focal point was 0.5-5 mW. Acquisition time for spectra was 30-100 sec. The setup operated under the control of the Renishaw software (RenishawFixture-Builderx64).
2.4.2. Raman spectra analysis
Polymerization of the acrylic-based compositions consumes carbon-carbon double bonds (C═C) for crosslinking. The degree of monomer to polymer conversion (DC) is used to quantify the polymerization efficiency [13,19]. The suggested DC calculation relies upon the ratio of the C═C related peak (1635 cm-1) to the CO related peak (1723 cm-1) using the latter as a reference; the decrease of this ratio after laser treatment related to the initial ratio is the measure of DC [13,19]. However, we cannot use the same reference peak to estimate the radiation-induced effects: unfortunately, the peak related to C═O chemical bonds also degrades at irradiation. So, the asymmetric peak at 940 cm-1 connected to a second-order response of the Si substrate was chosen to serve as a reference.
Typical Raman spectra in the region of interest are shown in Figure 5. One can see that the C═C related peak at 1635 cm-1 almost disappears due to X-rays effect. One more peak (located at ~1410 cm-1 and related to the OH acidic bending group of the acidic monomers) also disappeared in spectra after irradiation. This peak is present in dental compositions containing Bis-GMA, and disappears at their polymerization [20,21]. Qualitative effect of the X-ray exposition appears in the essential increase of the polymerization degree, and, most probably, in the enhanced cross-linking in polymer objects. The details for the studied samples will be discussed below.
3. Result and discussion
3.1. Morphological changes
When comparing the front views of the test objects before and after X-ray exposition, no obvious changes can be noticed.
The frontal projections are shown in Figure 6.
However, the tilted view (even taken with a lower resolution) reveals the changes of the height and shape of one of the objects (see Figure 7). The sample which has been printed with a lower laser power of 7 mW and with a smaller slicing step of 0.1 μm became reduced in height and slightly concave-shaped after the X-irradiation (at the left corner). However, it has some shape peculiarities yet before the irradiation.
A picture of a higher resolution helps to understand the mechanism of these distortions (see Figure 8). Laser beam is reflected from the Si substrate which increases the effective laser exposition for the composition located near the substrate. The cross-linking in the “overexposed” composition involves neighboring layers which become non-uniformly linked together (more closely in the central regions), so, they are made slightly bended. The X-raying strongly enhances this effect due to the essential increase of monomer-to-polymer conversion. Moreover, the scattered from the substrate X-rays produce a higher absorbed radiation dose near the substrate. The test objects created with a higher laser power and a larger distance between layers do not suffer from such distortions. Hence, the problem of distortions can be solved if the laser power will be properly varied according to the distance from the substrate.
3.2. Radiation-induced changes traced by Raman spectroscopy
The “classical” estimation of the degree of monomer to polymer conversion (DC) is hardly applicable for the test objects exposed to the X-rays. After the X-ray exposition, the corresponding to CC peak at 1635 cm-1 disappears almost completely, falling down below the noise level.
The discussed here spectral interval and the treatment of the corresponding line are shown in Figure 9 for the first and for the last cubic sample (the shape of the first was distorted by X-ray irradiation, while the shape of the last one was not). One can see that the complete disappearance of the CC related peak at 1635 cm-1 occurs after irradiation in all cases, independently of the shape distortions. This fact, together with the uniform dose distribution among the test objects, indicates that the shape distortion effects can be completely avoided by selecting proper fabrication parameters.
4. Conclusions
The results discussed in the present paper concern only one mechanism of mechanical distortions promoted by the X-ray irradiation. According to the present studies, the primary X-ray effect is connected with the essential increase of the amount of CC chemical bonds at the expense of the CC ones. This provides a strong cross-linking in the polymer structure. When the laser-printed objects are fabricated with improper technological parameters (laser power, slicing step), the cross-linking between neighboring layers can cause mechanical distortions. One can avoid this problem by the optimization of technological parameters.
However, it would be wrong to forget one more problem, which should be at least formulated here. The radiation dose of 30 kGy estimated here for the test objects is the exposition dose, not the absorbed one. It can be roughly imagined as if the energy of 30 kJ were released in one kilogram of air. However, the absorbed by test objects dose is much lower, by several orders of magnitude. When speaking about the interaction of X-rays with matter, a complex refractive index is used: n = 1 − δ + iβ. The imaginary part value (β) is responsible for the radiation absorption. For the organic compounds, β is usually of the order of 10-9. However, there is an intention to increase the real part value (δ) for improving refractive properties of X-ray optics. Typically, this is achieved by doping the compositions with the high-Z elements, and very often is accompanied with the increase of β. Such improvements of refractive properties can result in the release of essential energy in the small refractive elements and cause their overheating in strong radiation fields.
Finally, it is time to answer the question formulated from the very beginning. The laser-printed 3D-structures do withstand the SR-beam X-ray radiation, if two conditions are observed: first, the fabrication technology is optimized taking in consideration strong cross-linking effects; second, the polymer material composition does not contain strongly absorbing X-rays components.
Author Contributions
All authors contributed equally.
Funding
This research was funded by Ministry of Science and Higher Education of the Russian Federation, grant number 15.SIN.21.0008 (No. 075-11-2021-086).
Acknowledgements
The authors are grateful to the staff of the laboratory of Prof. S. A. Chesnokov (G.A. Razuvaev Institute of Organometallic Chemistry of the Russian Academy of Sciences) for the provided original photosensitive compositions. The authors acknowledge the financial support of the Ministry of Science and Higher Education of the Russian Federation, scientific project 15.SIN.21.0008 (Agreement No. 075-11-2021-086). The provision of subsidies from the federal budget (Agreement No. 075-02-2022-1672) is also gratefully acknowledged.
Conflicts of Interest
The authors declare no conflict of interest.
Abbreviations
The following abbreviations are used in this manuscript:
| DLW | Direct laser writing |
| SR | Synchrotron radiation |
| PETA | Pentaerythritol triacrylate |
| Bis-GMA | Bisphenol A-glycidyl methacrylate |
| TEGDMA | Triethylene glycol dimethacrylate |
| PEGMA | Propylene glycol monomethyl ether acetate |
| IPA | Isopropyl alcohol |
| TLD | Thermoluminescent detectors |
| TSL | Thermally stimulated luminescence |
| REM | Raster electron microscope |
| DC | Degree of conversion |
References
- Geng, Q.; Wang, D.; Chen, P.; Chen, S.-C. Ultrafast multi-focus 3-D nano-fabrication based on two-photon polymerization. Nature communications. 2019, 10(1), 2179. [Google Scholar] [CrossRef] [PubMed]
- Marino, A.; Ciofani, G.; Filippeschi, C.; Pellegrino, M.; Pellegrini, M.; Orsini, P.; Pasqualetti, M.; Mattoli, V.; Mazzolai, B. Two-photon polymerization of sub-micrometric patterned surfaces: investigation of cell-substrate interactions and improved differentiation of neuron-like cells. ACS Appl. Mater. Interfaces, 2013; 5, 13012–13021. [Google Scholar] [CrossRef]
- Pavlov, G.; Snigireva, I.; Snigirev, A.; Sagdullin, T.; Schmidt, M. Studying properties of polymer X-ray lenses. Technical Physics Letters, 38. [CrossRef]
- Barannikov, A.; Polikarpov, M.; Ershov, P.; Bessonov, V.; Abrashitova, K.; Snigireva, I.; Yunkin, V.; Bourenkov, G.; Schneider, T.; Fedyanin, A. A.; Snigirev, A. Optical performance and radiation stability of polymer X-ray refractive nano-lenses. Journal of Synchrotron Radiation. [CrossRef]
- Sanli, U. T.; Ceylan, H.; Bykova, I.; Weigand, M.; Sitti, M.; Schütz, G.; Keskinbora, K. 3D nanoprinted plastic kinoform X Ray optics. Advanced Materials, 1802. [Google Scholar] [CrossRef]
- Patolyatov, A. D.; Shcherbakov, D. A.; Kolymagin, D. A.; Matital, R. P.; Chubich, D. A.; Vitukhovsky, A. G. Refractive X-ray lenses made by the two-photon laser lithography method. Physics of Wave Phenomena. [CrossRef]
- Greiner, A. M.; Richter, B.; Bastmeyer, M. Micro engineered 3D scaffolds for cell culture - studies. Macromolecular bioscience, 1301. [Google Scholar] [CrossRef]
- Hippler, M.; Lemma, E. D.; Bertels, S.; Blasco, E.; Barner Kowollik, C.; Wegener, M.; Bastmeyer, M. 3D scaffolds to study basic cell biology. Advanced Materials, 1808. [Google Scholar] [CrossRef]
- Selimis, A.; Mironov, V.; Farsari, M. Direct laser writing: Principles and materials for scaffold 3D printing. Microelectronic Engineering. [CrossRef]
- Renghini, C.; Giuliani, A.; Mazzoni, S.; Brun, F.; Larsson, E.; Baino, F.; Vitale-Brovarone, C. Microstructural characterization and in vitro bioactivity of porous glass-ceramic scaffolds for bone regeneration by synchrotron radiation X-ray microtomography. Journal of the European ceramic society, 1553. [Google Scholar] [CrossRef]
- Giuliani, A.; Moroncini, F.; Mazzoni, S.; Belicchi, M. L. C.; Villa, C.; Erratico, S.; Colombo, E.; Calcaterra, F.; Brambilla, L.; Torrente, Y.; Albertini, G.; Della Bella, S. Polyglycolic Acid– Polylactic Acid scaffold response to different progenitor cell in vitro cultures: A demonstrative and comparative X-Ray Synchrotron Radiation Phase-Contrast Microtomography study. Tissue Engineering Part C: Methods. [CrossRef]
- Duan, X.; Li, N.; Chen, X.; Zhu, N. Characterization of tissue scaffolds using synchrotron radiation microcomputed tomography imaging. Tissue Engineering Part C: Methods. [CrossRef]
- Egorov, A. E.; Kostyukov, A. A.; Shcherbakov, D. A.; Kolymagin, D. A.; Chubich, D. A.; Matital, R. P.; Arsenyev, M. V.; Burtsev, I. D.; Mestergazi, M. G.; Zhiganshina, E. R.; Chesnokov, S. A.; Vitukhnovsky, A. G.; Kuzmin, V. A. Benzylidene cyclopentanone derivative photoinitiator for two-photon photopolymerization-photochemistry and 3d structures fabrication for x-ray application. Polymers. [CrossRef]
- Kelly, D. R. C.; Bialowons, W.; Brinkmann, R.; Ehrlichmann, H.; Kouptsidis, J. The electron beam lifetime problem in HERA. In Proceedings Particle Accelerator Conference, 05 May 1995; 3. [Google Scholar] [CrossRef]
- Bakshi, A. K.; Dhabekar, B.; Rawat, N. S.; Singh, S. G.; Joshi, V.J.; Kumar, V. Study on TL and OSL characteristics of indigenously developed CaF2: Mn phosphor. Nuclear Instruments and Methods in Physics Research Section B: Beam Interactions with Materials and Atoms. [CrossRef]
- Danilkin, M.; Jaek, I.; Kerikmäe, M.; Lust, A.; Mändar, H.; Pung, L.; Ratas, A.; Seeman, V.; Klimonsky, S.; Kuznetsov, V. Storage mechanism and OSL-readout possibility of Li2B4O7:Mn (TLD-800). Radiation Measurements. [CrossRef]
- Selvam, T. P.; Keshavkumar, B. Monte Carlo investigation of energy response of various detector materials in and brachytherapy dosimetry. Journal of Applied Clinical Medical Physics. [CrossRef]
- Danilkin, M. I.; Koksharov, Y. A.; Romet, I.; Seeman, V. O.; Vereschagina, N. Y.; Zubov, A. I.; Selyukov, A. S. Manganese agglomeration and radiation damage in doped Li2B4O7. Radiation Measurements. [CrossRef]
- Jiang, L. J.; Zhou, Y. S.; Xiong, W.; Gao, Y.; Huang, X.; Jiang, L.; Baldacchini, T.; Silvain, J.-F.; Lu, Y. F. Two-photon polymerization: investigation of chemical and mechanical properties of resins using Raman microspectroscopy. Optics letters, 2014; 39, 3034–3037. [Google Scholar] [CrossRef]
- Bayarı, S. H. , Krafft, C., İde, S., Popp, J., Guven, G., Cehreli, Z. C., Soylu, E. H. Investigation of adhesive–dentin interfaces using Raman microspectroscopy and small angle X ray scattering. Journal of Raman Spectroscopy. [CrossRef]
- Navarra, C. O. , Cadenaro, M., Frassetto, A., Fontanive, L., Di Lenarda, R., Breschi, L. Degree of conversion of self-etch adhesives: in situ micro-raman analysis. Operative Dentistry. [CrossRef]
Figure 1.
The first group of samples destined for X-raying placed at the center of the treatment window.
Figure 1.
The first group of samples destined for X-raying placed at the center of the treatment window.
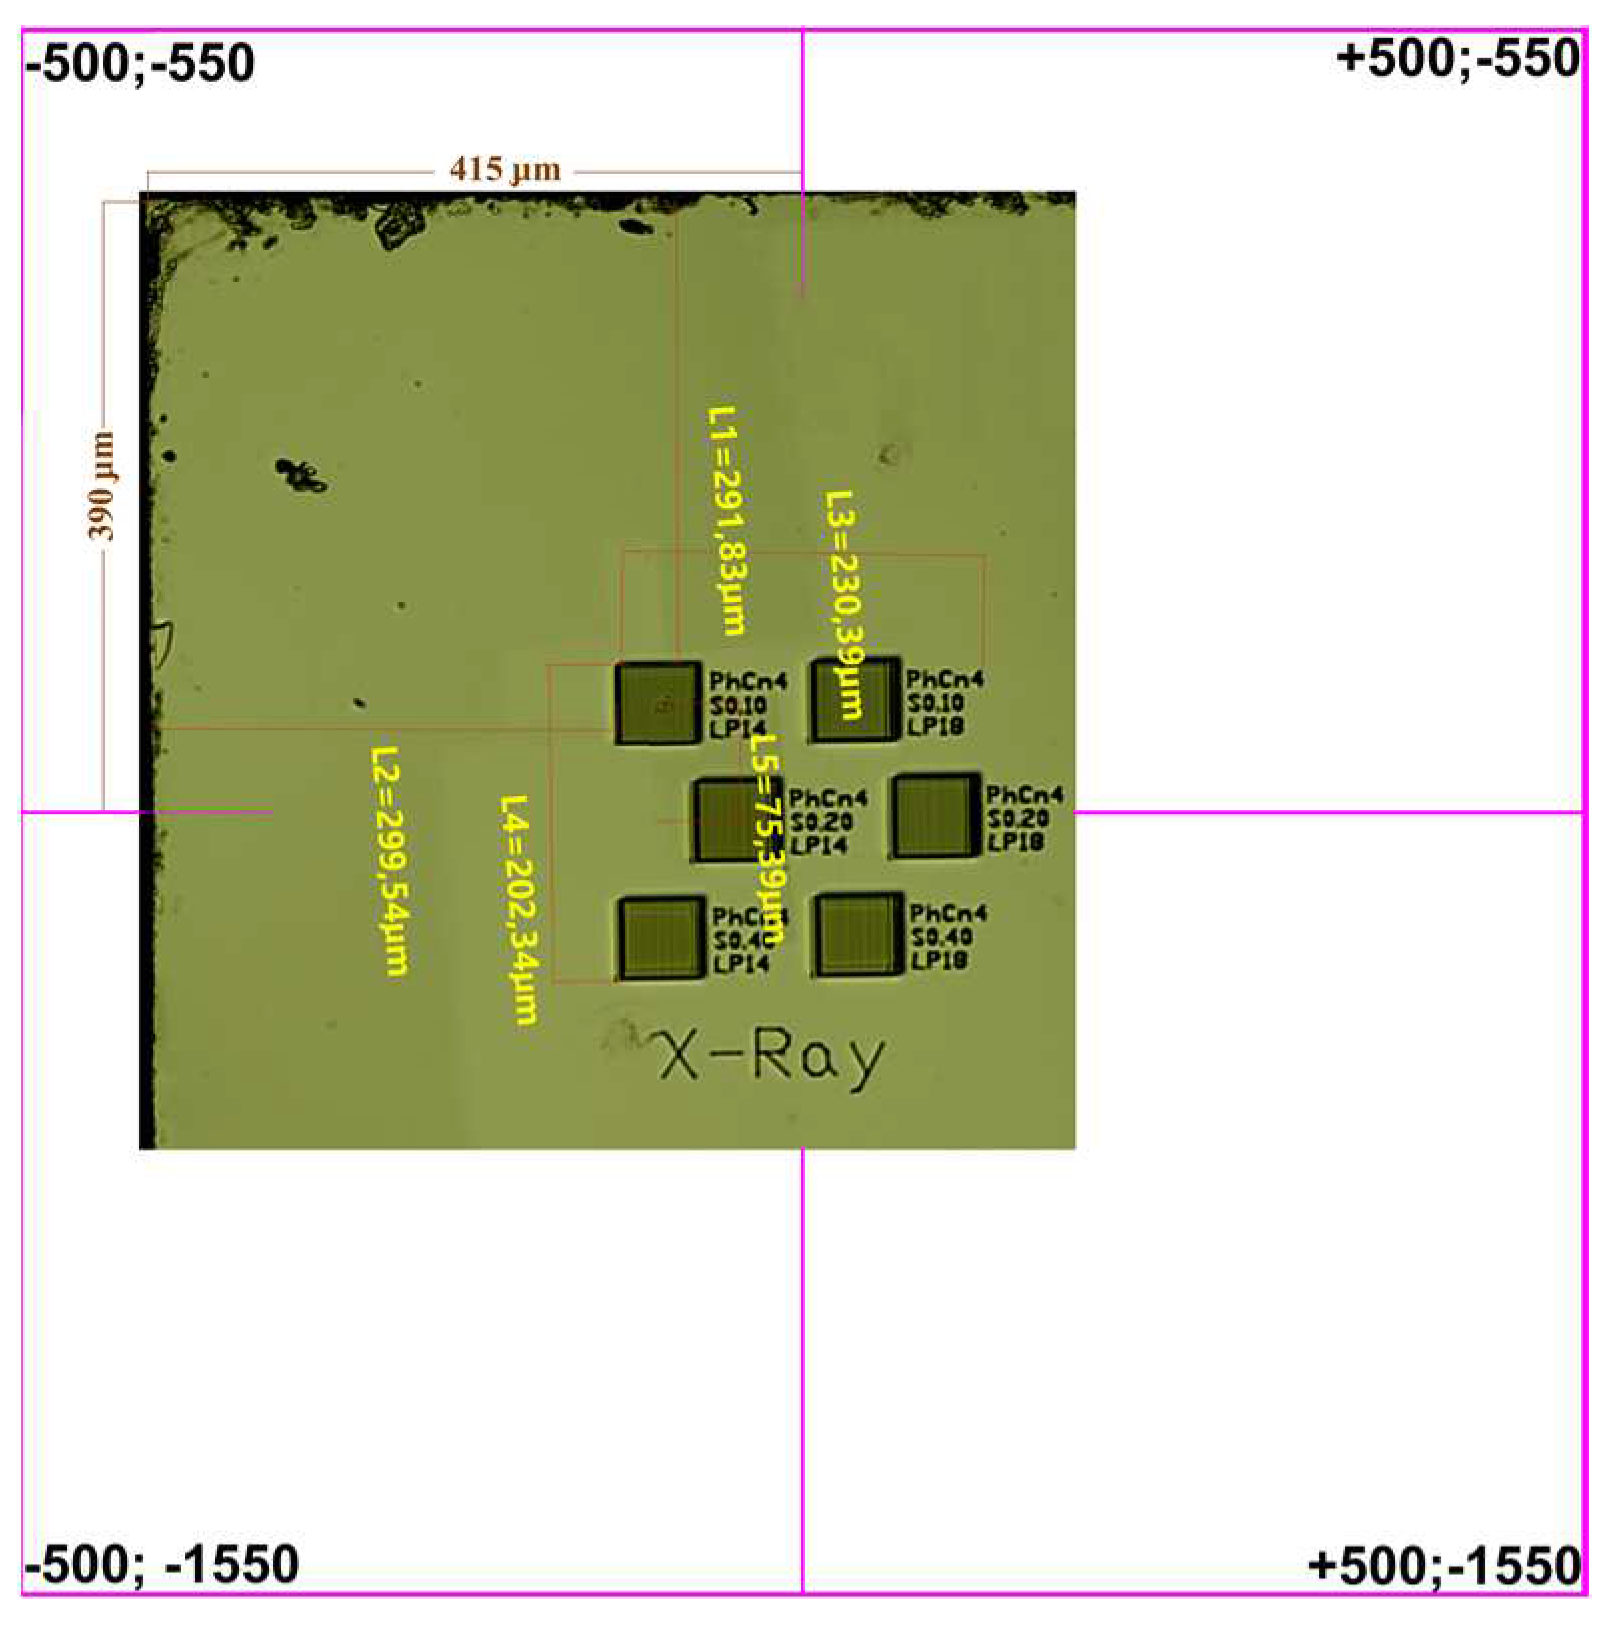
Figure 2.
Distribution function of X-ray photons in the window. Red spots mark test objects positions.
Figure 2.
Distribution function of X-ray photons in the window. Red spots mark test objects positions.
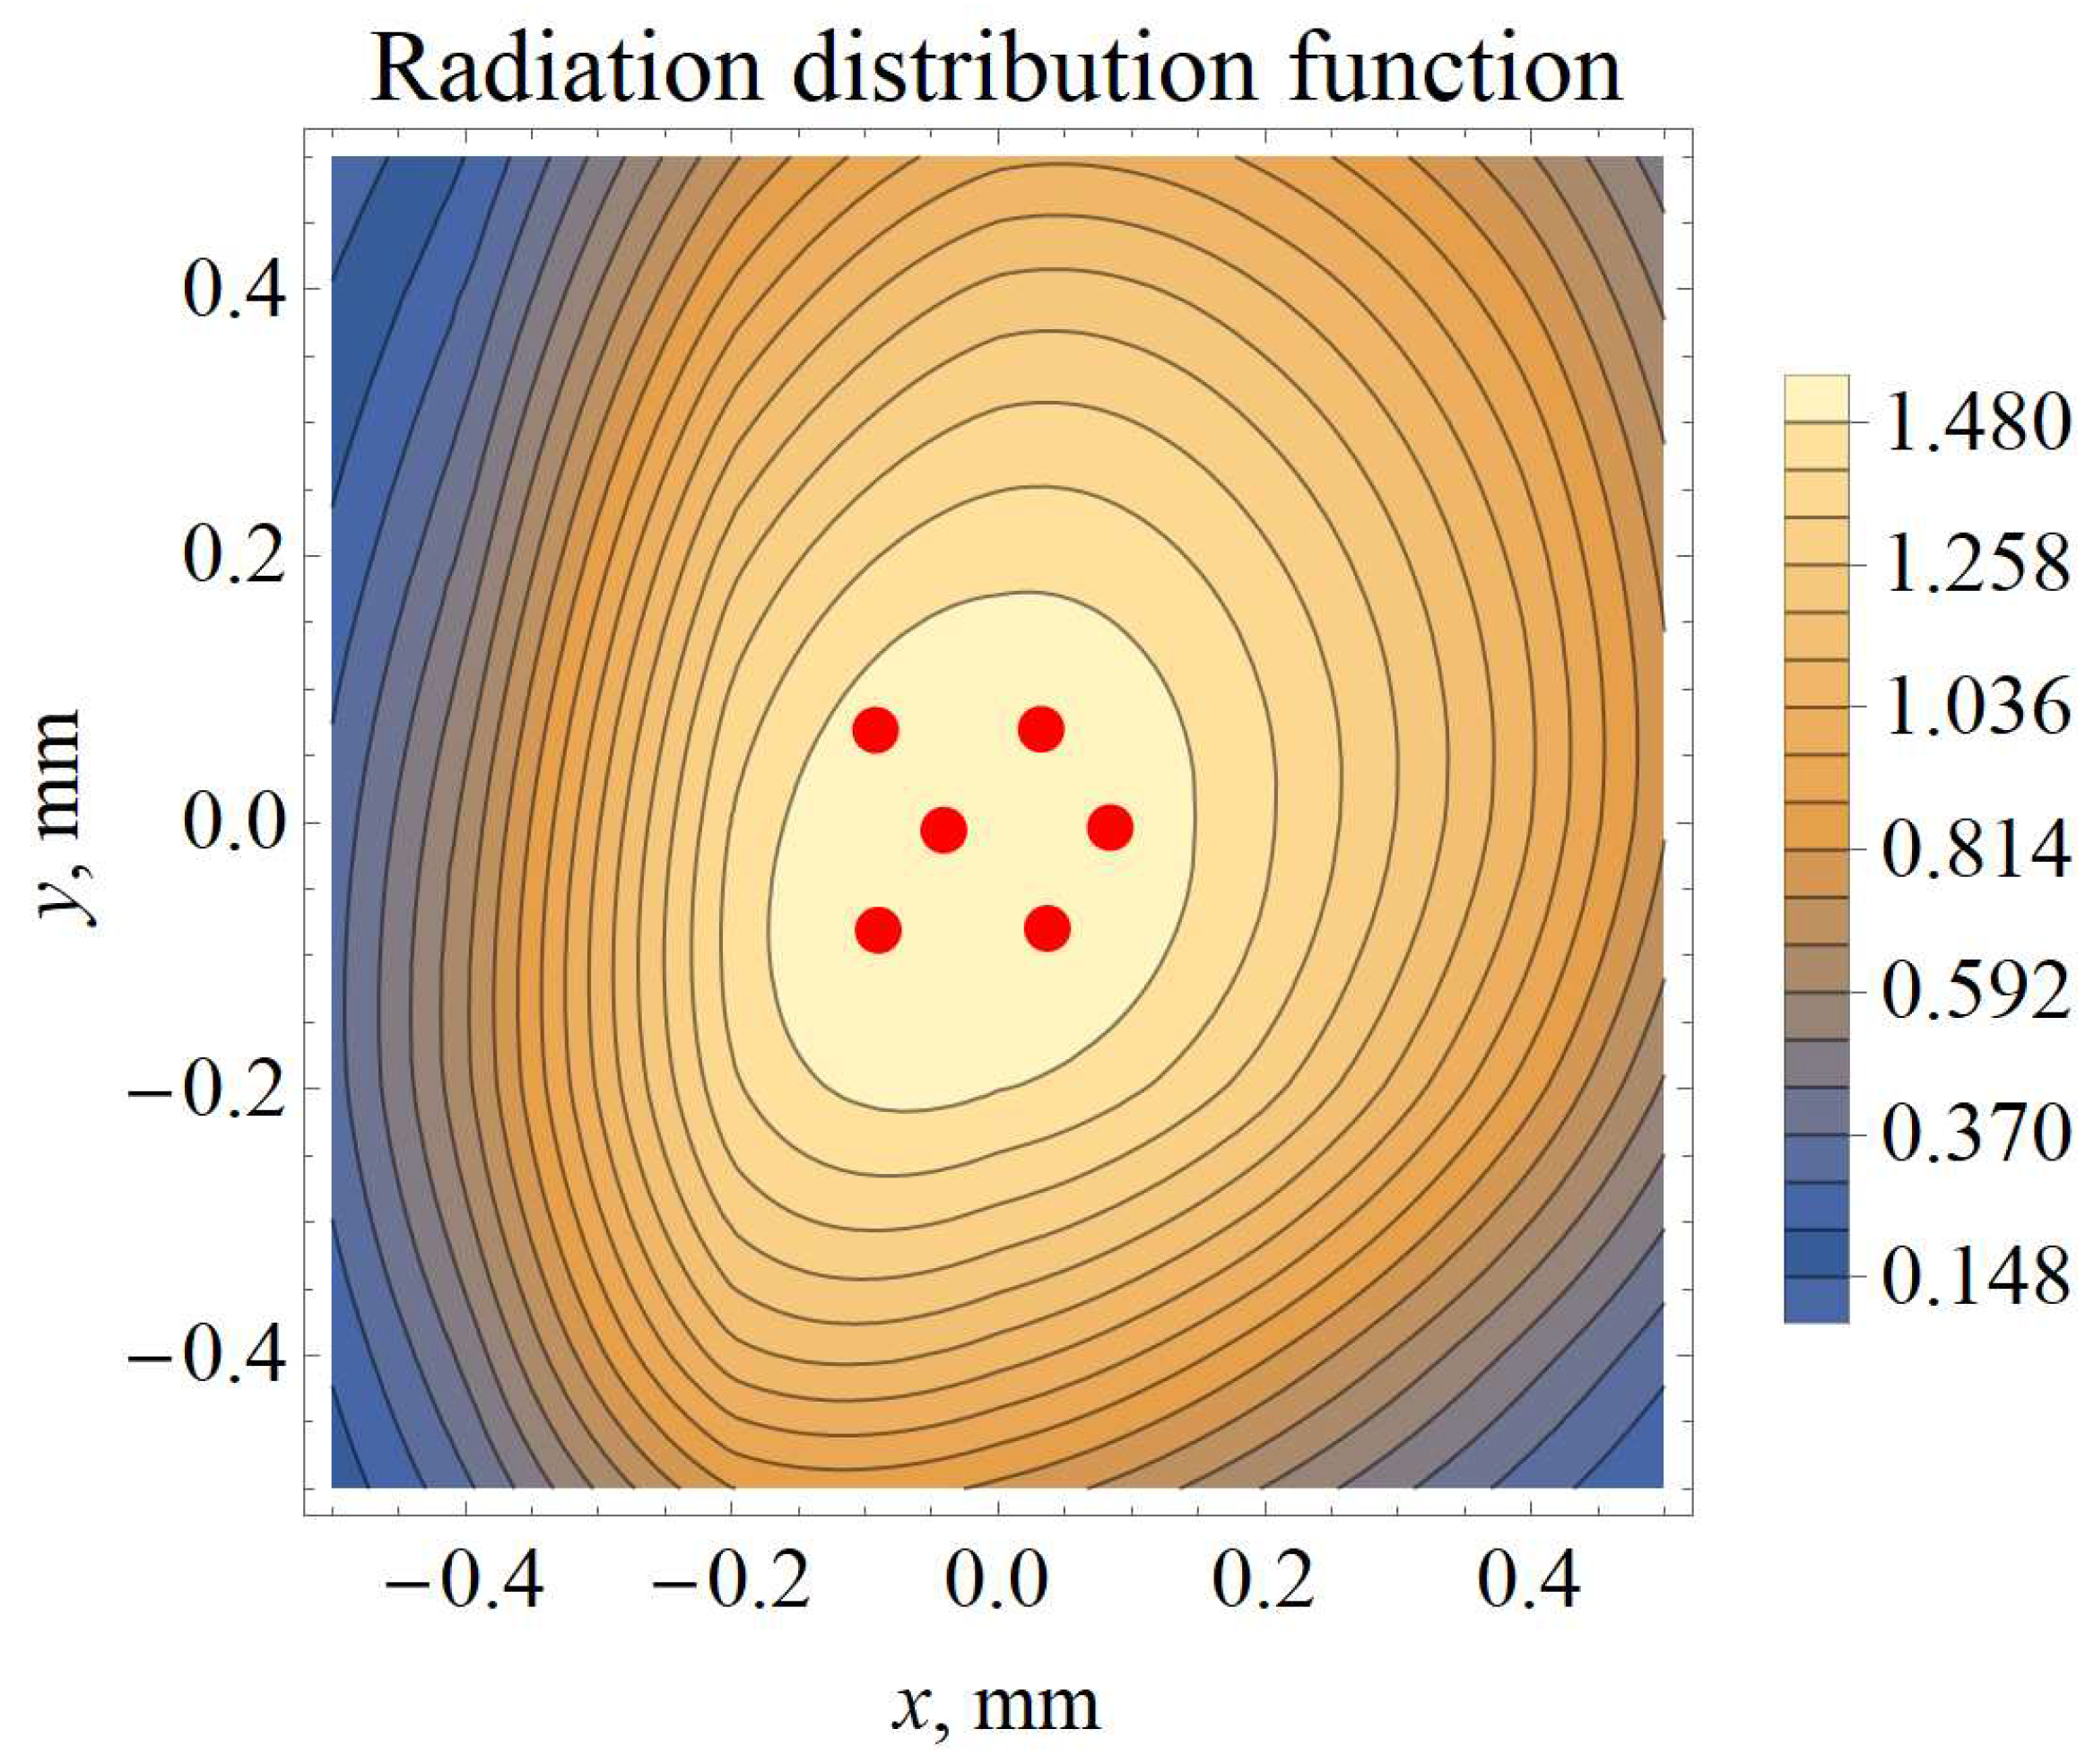
Figure 3.
TLD-800 ceramic detectors view (numbers are on back sides, working front sides are blank).
Figure 3.
TLD-800 ceramic detectors view (numbers are on back sides, working front sides are blank).
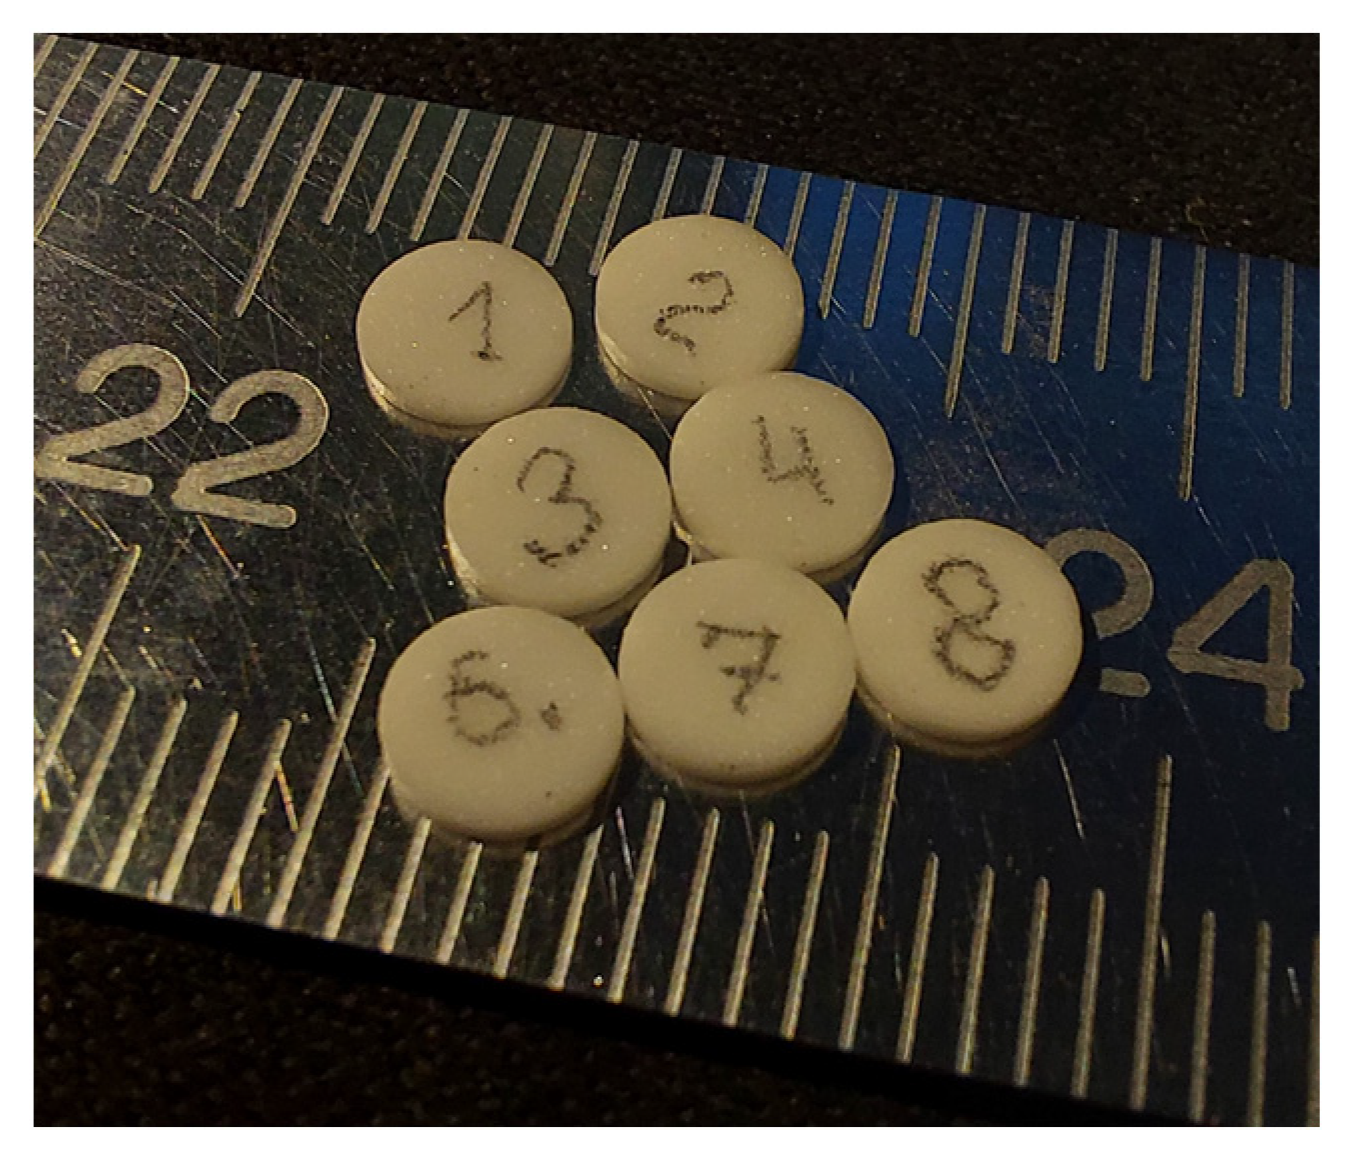
Figure 4.
TSL curve and heating profile for detector Nr. 3 dosed with 1.90 Gy.

Figure 5.
Raman spectra of the irradiated sample (upper curve, red) and non-irradiated reference sample (lower curve, black).
Figure 5.
Raman spectra of the irradiated sample (upper curve, red) and non-irradiated reference sample (lower curve, black).
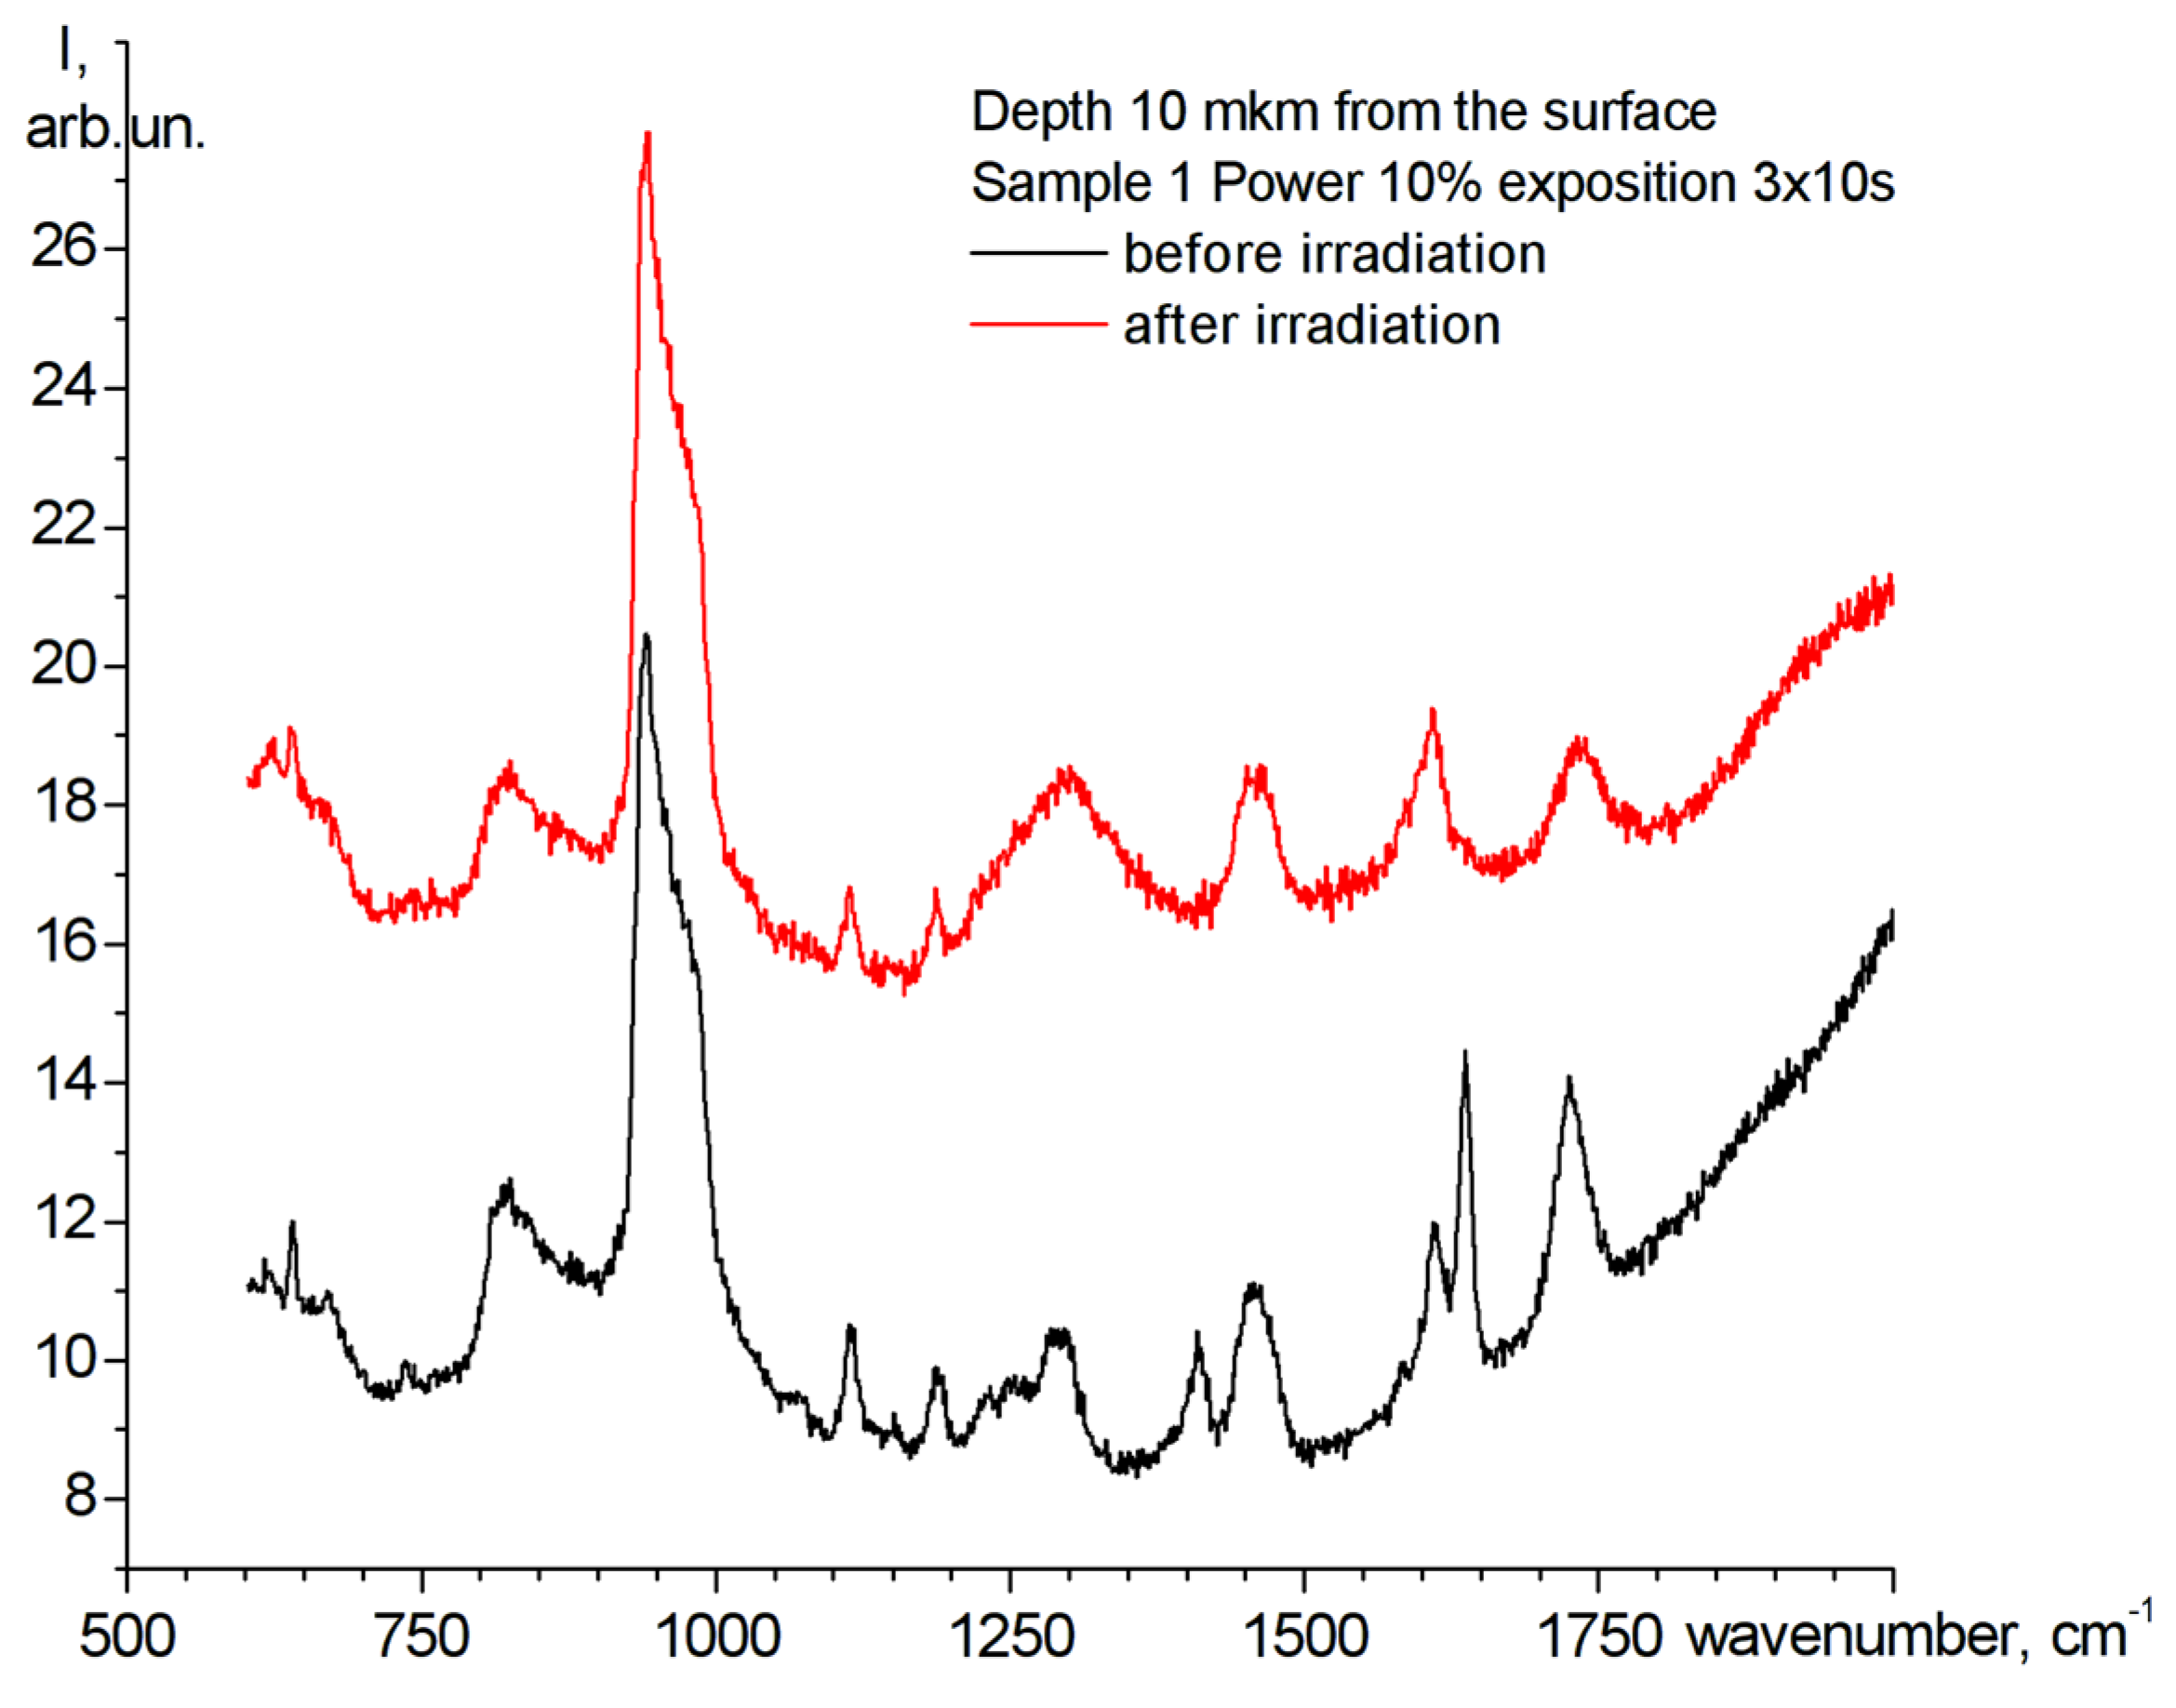
Figure 6.
The front view of the X-rayed (left side) and non-irradiated (right side) test objects.
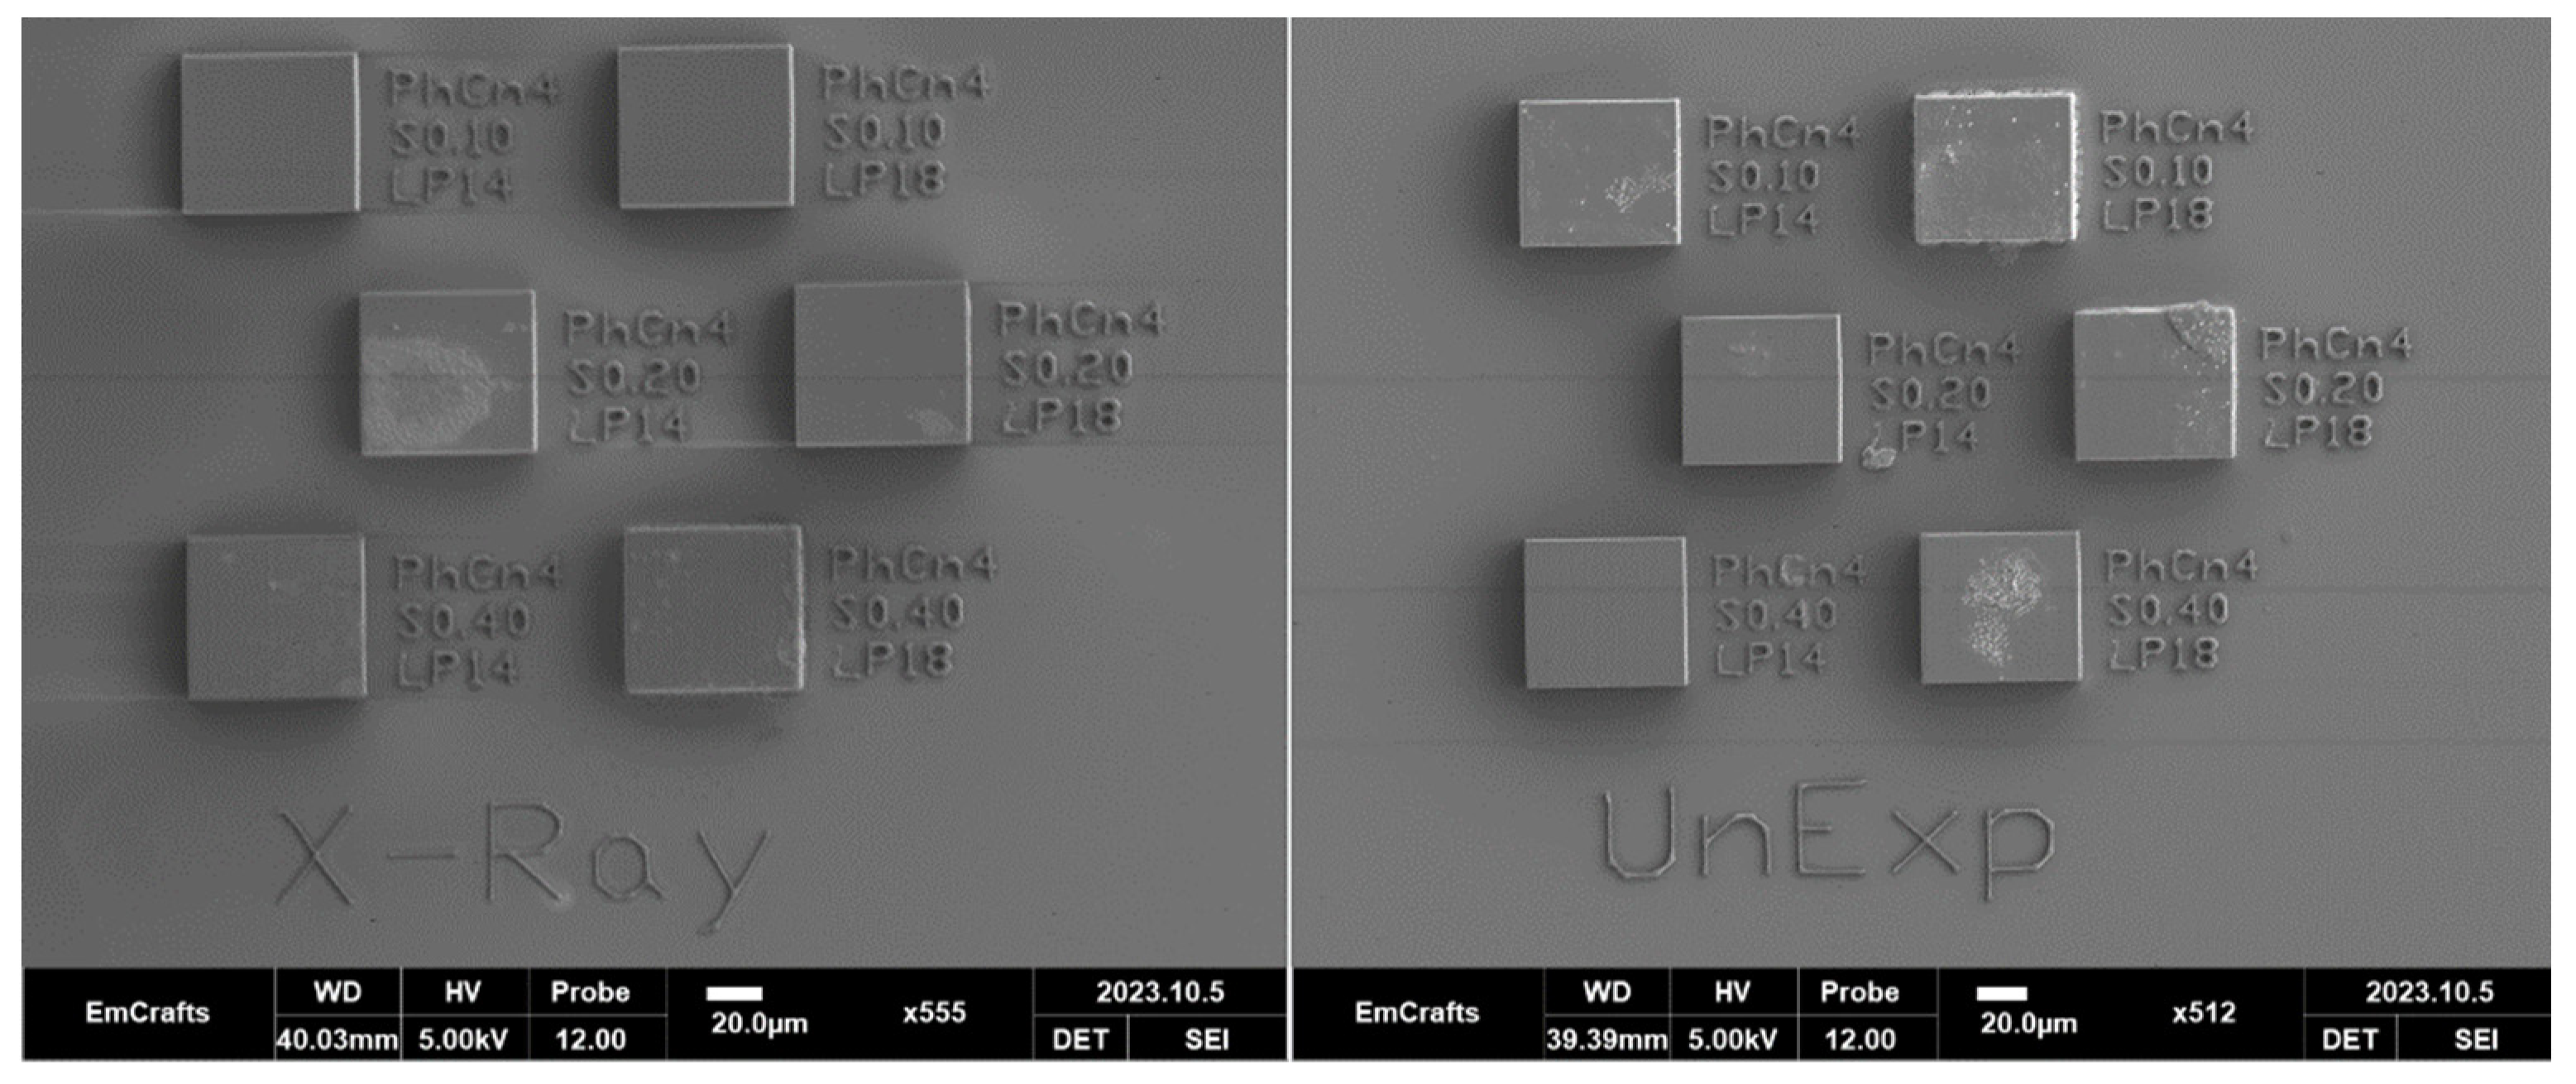
Figure 7.
Tilted view of test objects: X-rayed at the left, non-irradiated at the right. Upper row: a slope of ~40°; lower row: a slope of ~70°.
Figure 7.
Tilted view of test objects: X-rayed at the left, non-irradiated at the right. Upper row: a slope of ~40°; lower row: a slope of ~70°.
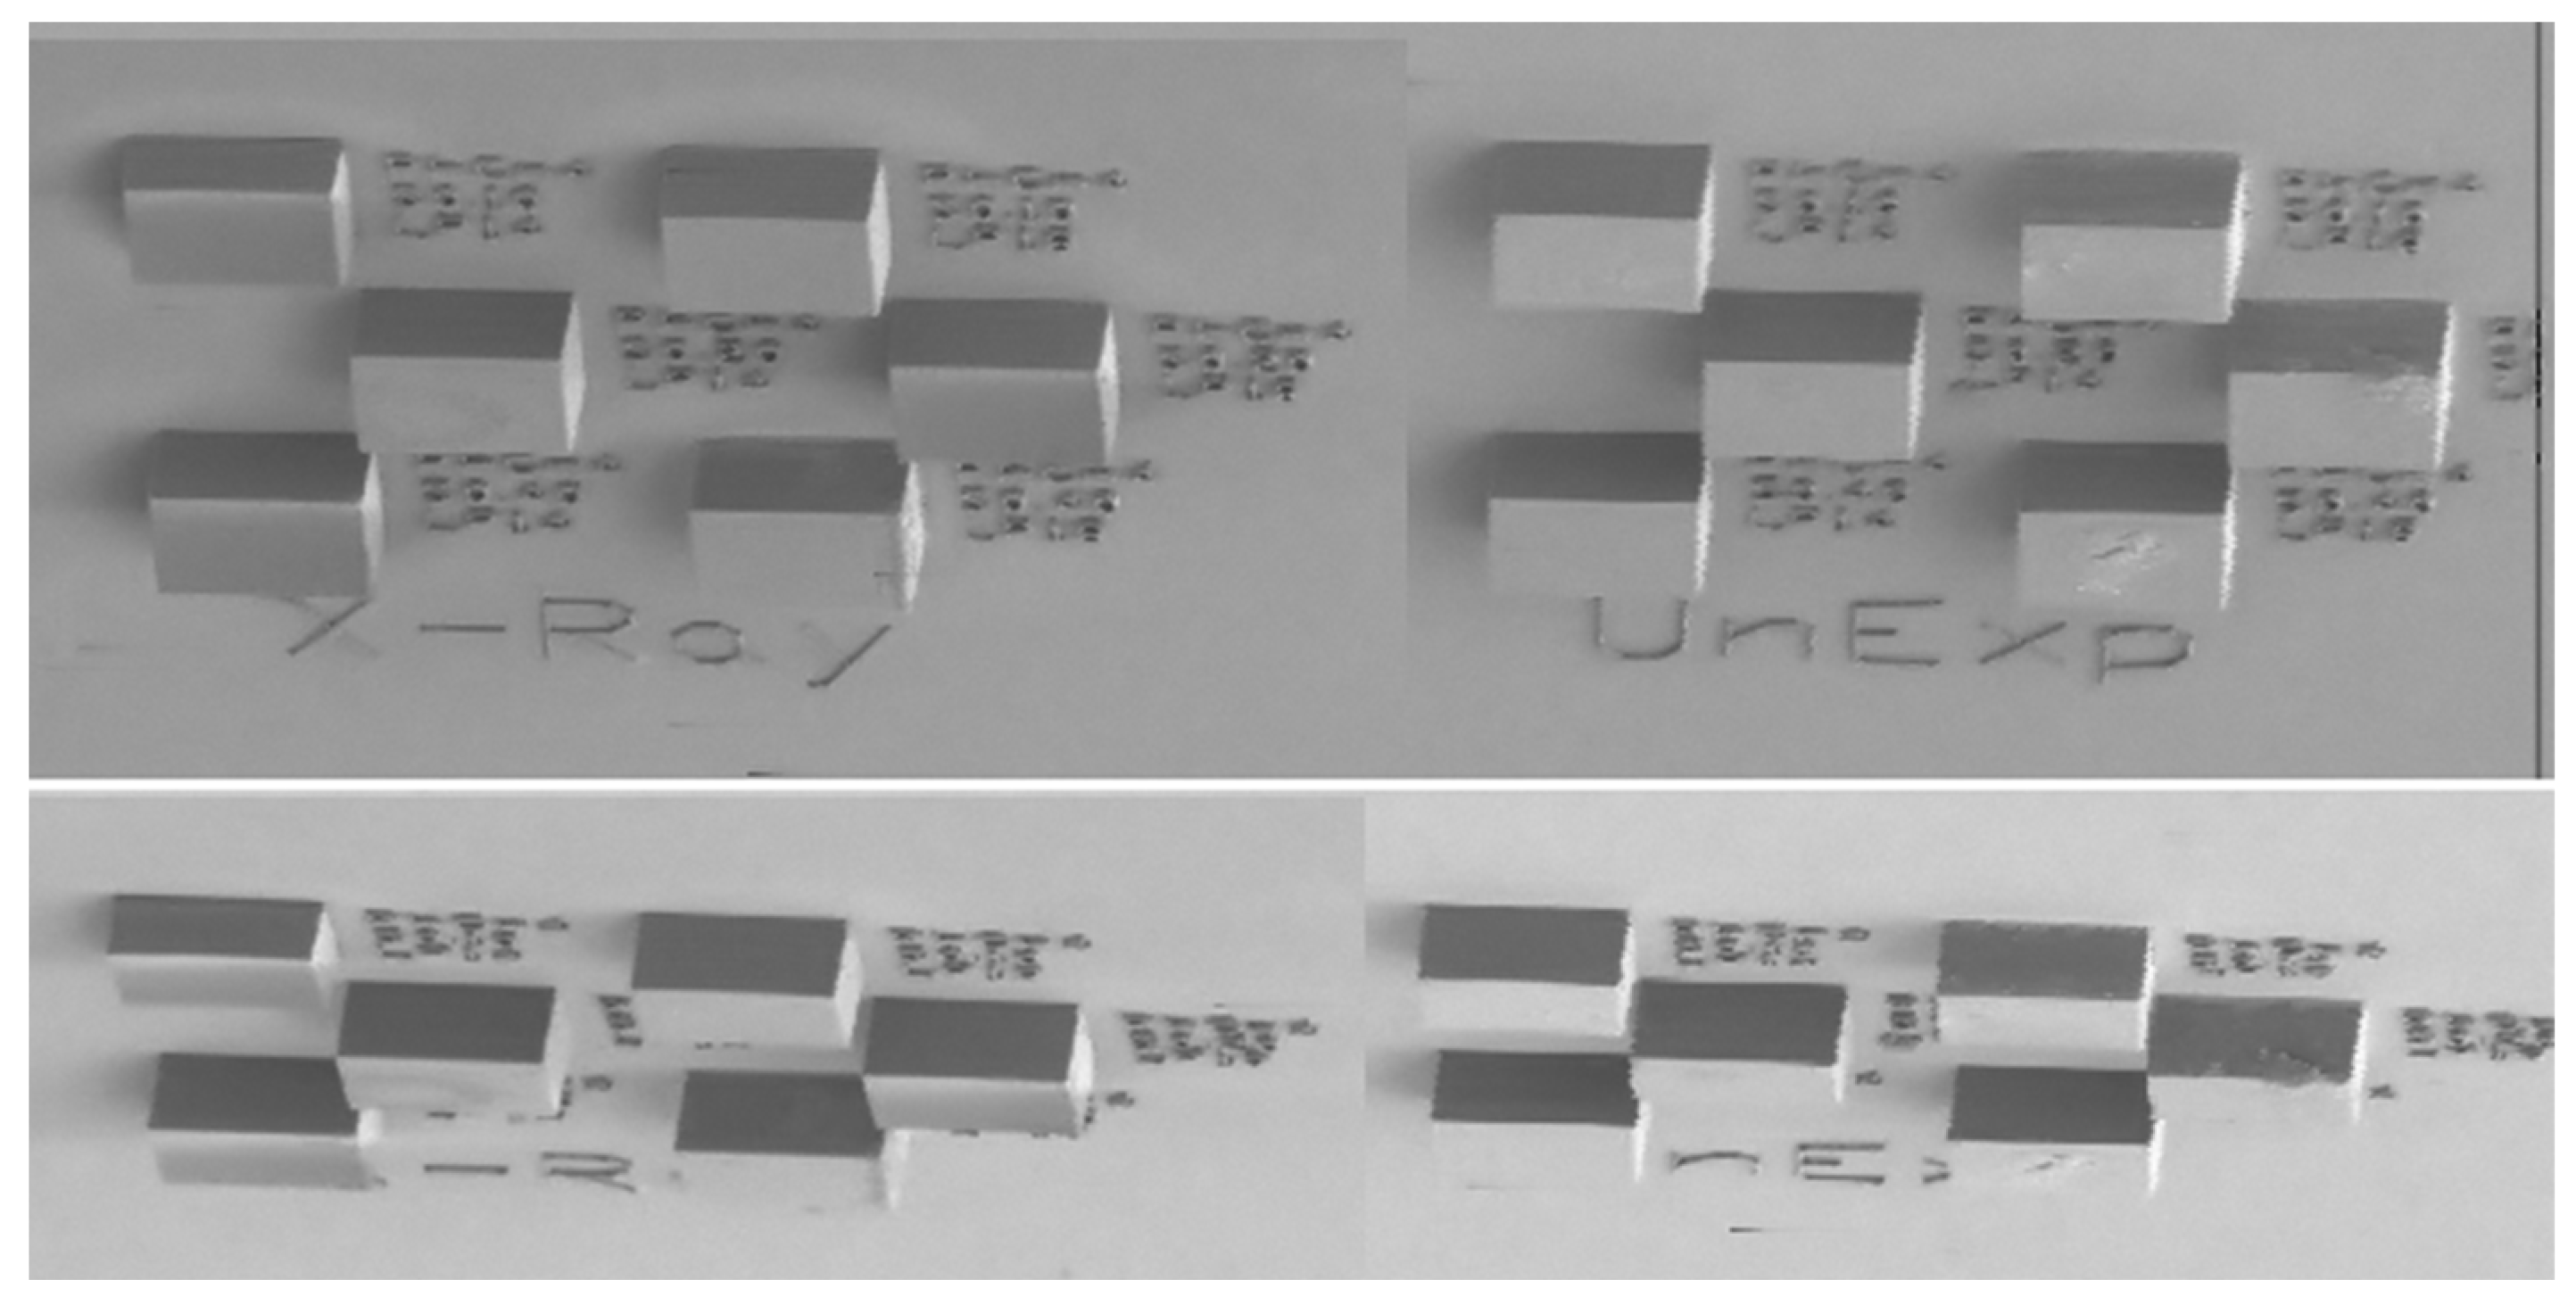
Figure 8.
Layers bending effect near the substrate: X-rayed object at the left, non-irradiated one at the right.
Figure 8.
Layers bending effect near the substrate: X-rayed object at the left, non-irradiated one at the right.
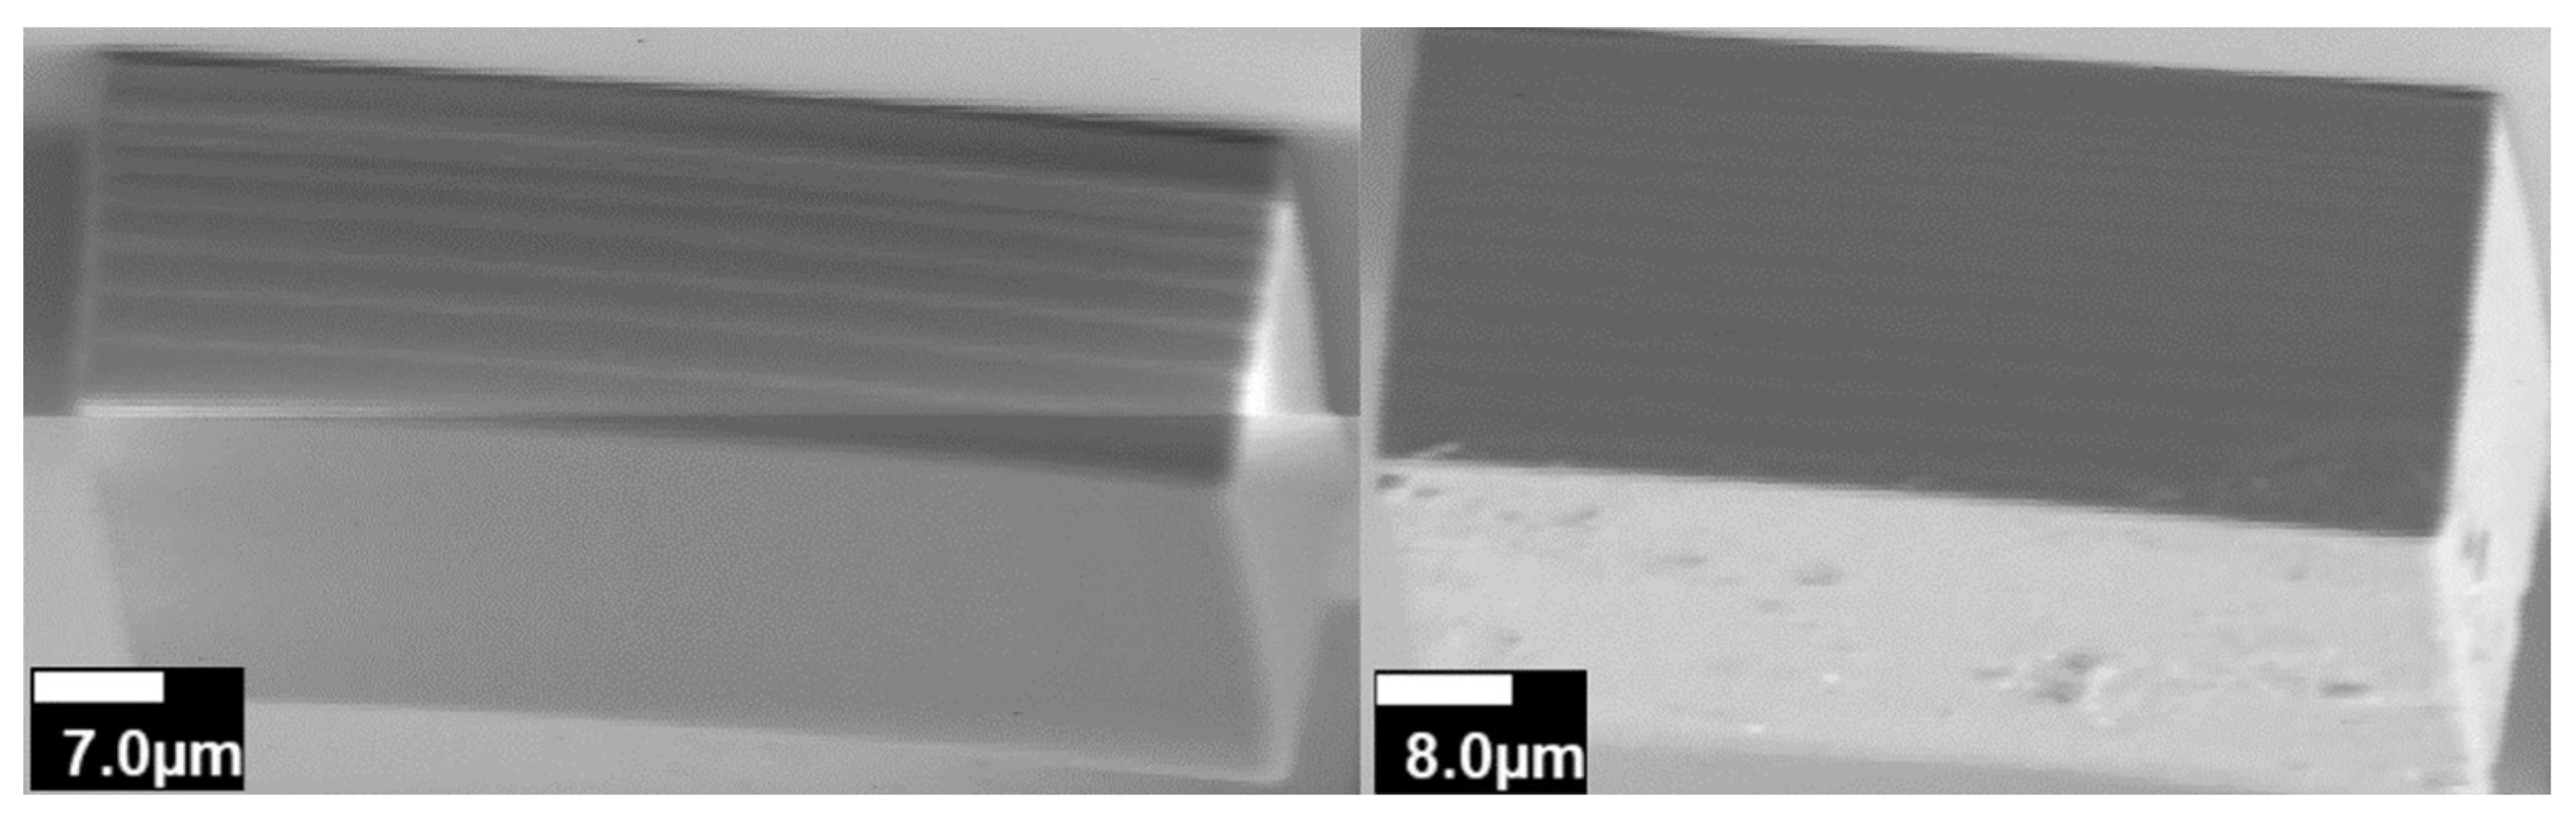
Figure 9.
The peak related to CC at 1635 cm-1 for the first (top) and the last (bottom) test objects. The spectra before irradiation (blue line) were approximated with two Lorentz-shape curves (orange). After the irradiation (red line), only one Lorentz-shape curve (black line) remains.
Figure 9.
The peak related to CC at 1635 cm-1 for the first (top) and the last (bottom) test objects. The spectra before irradiation (blue line) were approximated with two Lorentz-shape curves (orange). After the irradiation (red line), only one Lorentz-shape curve (black line) remains.
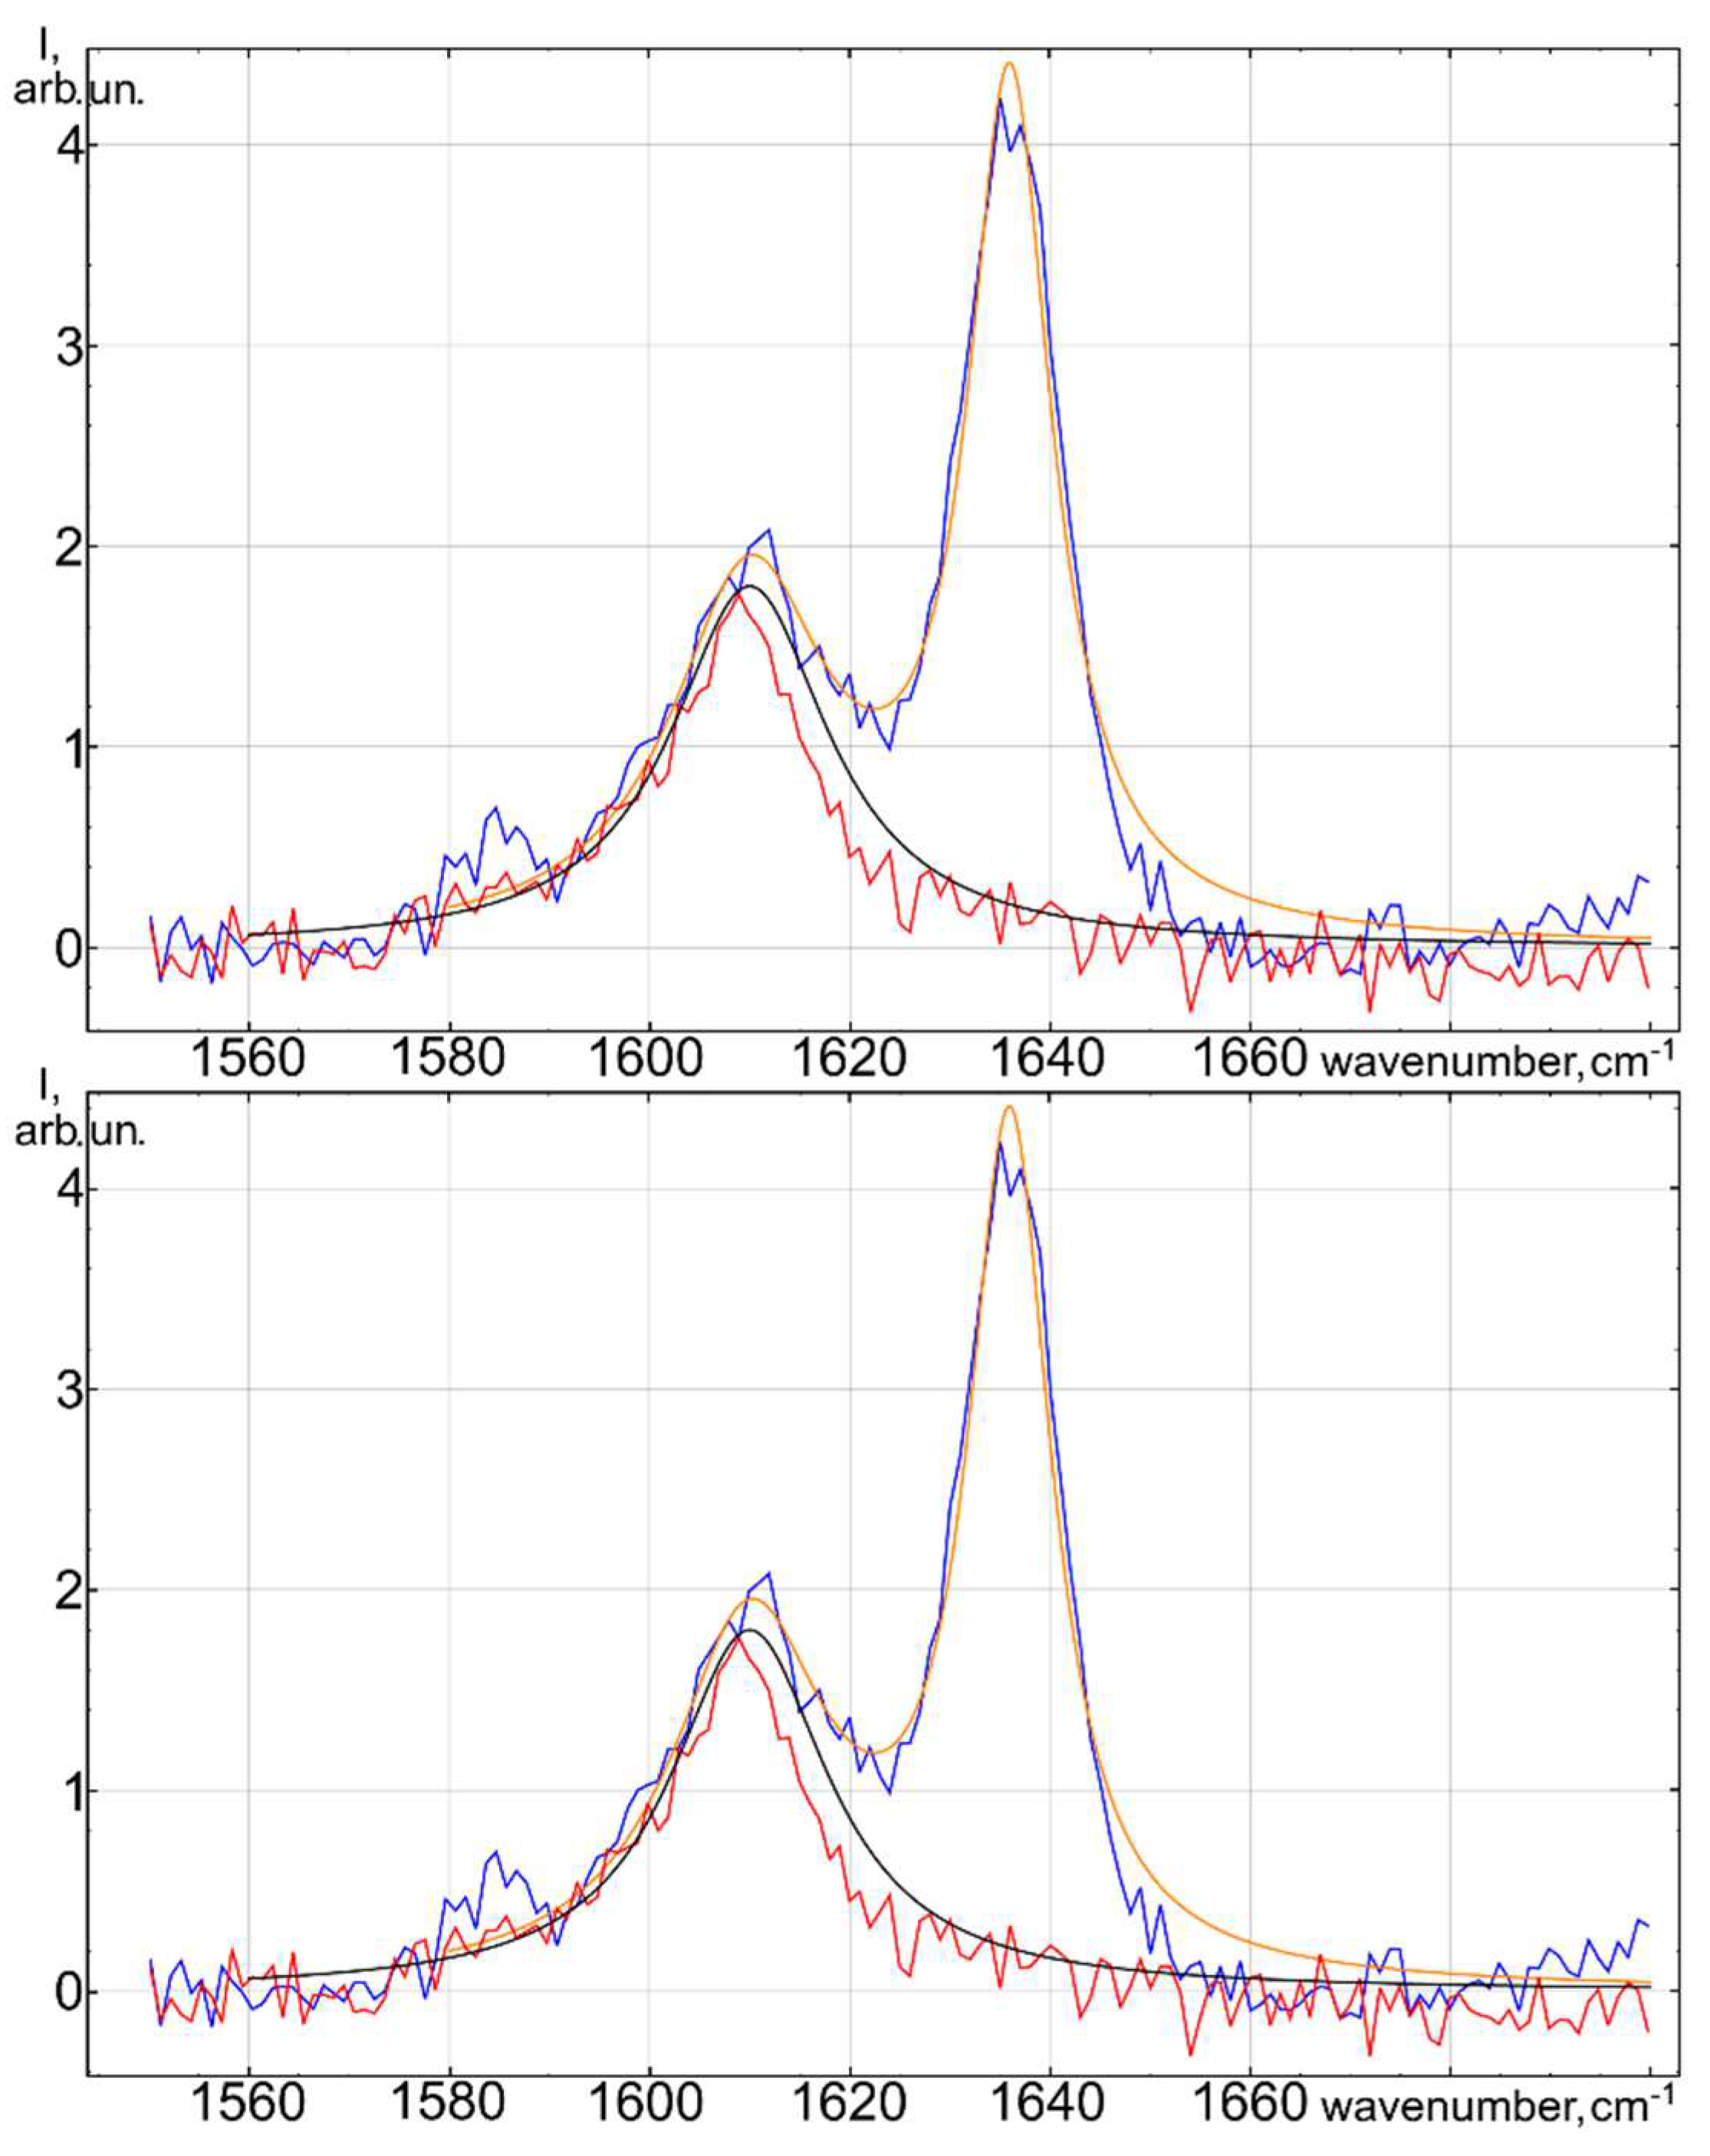

Table 1.
Laser power (mW) and slicing step (μm) for samples.*.
| 7 mW | 9 mW |
| 0.10 μm | 0.10 μm |
| 7 mW | 9 mW |
| 0.20 μm | 0.20 μm |
| 7 mW | 9 mW |
| 0.40 μm | 0.40 μm |
* The data are shifted in columns to mimic the positions of samples in Figure 1.
Table 2.
Exposition dose (X-ray photons).
| 1.018·1013 | 1.033·1013 |
| 1.051·1013 | 1.028·1013 |
| 1.046·1013 | 1.046·1013 |
Table 3.
Calibration constant .
| Storage ring current, mA | Photon count, photons/s | , photons/(mAs) | deviation |
| 129.5 | 656000 | 5065.637 | 29.579 |
| 129.3 | 652000 | 5042.537 | 6.479 |
| 129.2 | 646000 | 5000.000 | −36.058 |
| Average value and root-mean-square deviation | 5036.058 | 47.1 (0.935%) | |
*measured with the attenuator of transmittance T = 0.035.
Table 4.
The relation between the 12 keV X-ray photon number and radiological units.
| det. Nr. | Resp. (R) to Gy, rel. un. | Sensitivity , rel. un./Gy | Exposition | photon number | X-rays resp., rel. un. | X-ray dose, Gy | Transition coefficient K, photons/Gy | |
| time t, s | current j, mA | |||||||
| 1 | 371.84 | 5 | 132.3 | 107.74 | ||||
| 2 | 502.37 | 5 | 131.9 | 105.71 | ||||
| 3 | 469.94 | 10 | 131.6 | 150.54 | ||||
| 4 | 446.01 | 10 | 131.4 | 109.90 | ||||
| 6 | 468.98 | 20 | 131.2 | 253.58 | ||||
| 7 | 520.24 | 20 | 130.9 | 296.25 | ||||
| 8 | 512.21 | 40 | 130.7 | 643.71 | ||||
| K, Averaged number of 12 keV X-ray photons per Gy (by detectors 3, 4, 6, 7, 8)* | ||||||||
*Exposition of 5 s was excluded from calculations due to a large systematic uncertainty.
Table 5.
Exposition dose (Gy).
*.
Disclaimer/Publisher’s Note: The statements, opinions and data contained in all publications are solely those of the individual author(s) and contributor(s) and not of MDPI and/or the editor(s). MDPI and/or the editor(s) disclaim responsibility for any injury to people or property resulting from any ideas, methods, instructions or products referred to in the content. |
© 2023 by the authors. Licensee MDPI, Basel, Switzerland. This article is an open access article distributed under the terms and conditions of the Creative Commons Attribution (CC BY) license (http://creativecommons.org/licenses/by/4.0/).
Copyright: This open access article is published under a Creative Commons CC BY 4.0 license, which permit the free download, distribution, and reuse, provided that the author and preprint are cited in any reuse.


