
Submitted:
09 November 2023
Posted:
10 November 2023
You are already at the latest version
Abstract
Blood testing is a crucial application in the field of clinical studies for disease diagnosis and screening, biomarkers discovery, organ function assessment, and personalized medication. Therefore, it is of utmost importance to collect precise data in a short time. In this study, we utilized Raman spectroscopy to analyze blood samples and extracted comprehensive biological information, including the primary components and compositions present in the blood. We conducted short-wavelength (532 nm green light) Raman scattering spectroscopy on blood samples, plasma, and serum, and subsequently analyzed the biological characteristics detected in each sample type. Our results indicated that whole blood had high hemoglobin content, which suggests that hemoglobin is a major component of blood. The characteristic Raman peaks of hemoglobin were observed at 690, 989, 1015, 1182, 1233, 1315, and 1562–1649 cm−1. Analysis of plasma and serum samples indicated the presence of β-carotene, which exhibited characteristic peaks at 1013, 1172, and 1526 cm−1. Additionally, in the field of medical blood testing, the novel 3D Silicon micro-channel device technology holds immense potential. It can serve as a substrate and helps to detect various diseases and biomarkers, providing real-time data to help medical professionals and patients better understand their health conditions. Changes in biological data collected in this manner could potentially be used to diagnose clinical diseases.
Keywords:
blood testing
; biological information
; hemoglobin
; Raman spectroscopy
; 3D Silicon micro-channel device
1. Introduction
Conventional blood tests are performed with optical microscopes, which are time-consuming and may lesser the accuracy of blood sample analysis. Among the emerging laser-based blood testing, Raman spectroscopy is one of the methods that involves nonlinear scattering. This method is adopted in a wide range of blood tests because of its various advantages, such as a small volume of blood for testing, rapid analysis, and high-precision result interpretation. These factors simplify the process of collecting and evaluating blood-related data. The effectiveness of Raman spectroscopy in clinical applications has been verified [1,2].
In Raman spectroscopy, the wavenumber difference between incident and scattered light is compared to determine the changes in their energy levels and the sample’s lattice vibration characteristics. These observations can be used to analyze the composition and structure of the sample. Therefore, the Raman peak values can indicate a sample’s molecular structure [3,4].
Raman spectroscopy can be applied in blood testing to determine the presence of certain disease in individuals. The Raman characteristic peak positions and amplitudes exhibit distinct differences between infected and uninfected blood samples. Therefore, Raman spectroscopy serves as a valuable tool for rapid pathogens screening and identification. The prevalence of emerging viruses, such as COVID-19, will eventually overlap with that of influenza virus infection, and this trend has necessitated reliable, rapid and disease screening [5]. Moreover, the acquisition of blood information through Raman spectroscopy enables the rapid and precise diagnosis of clinical diseases, such as liver disease, diabetes, cancer, allergies, genetic disorders, anemia, and leukemia [6,7,8].
In the present study, we implemented 3D Silicon Micro-Channel Device (3D SMCD) to introduced blood and calcium coagulants for mixing. The primary Raman peaks in whole blood was attributed to hemoglobin, while other Raman peaks corresponded to amino acids and other components [9]. In contrast, the primary Raman peaks of plasma and serum corresponded to β-carotene [10]. Moreover, we conducted a prothrombin time (PT) experiment to compare the Raman spectroscopy results of blood samples with and without calcium-containing coagulant. Clinically, coagulation or clotting, in which blood turns from liquid to non-flowing gel, is a critical process in hemostasis [11,12]. This phenomenon can be confirmed using a transmission Raman spectrometer in the mixing zone of the 3D SMCD [13]. The primary objective is to determine whether patients’ intrinsic and common coagulation pathways were functioning normally.
2. Sample Preparation for 3D SMCD
2.1 Fabrication of 3D SMCD
The 3D SMCD (sandwich structure-Poly(methyl methacrylate), PMMA/Silicon/PMMA) heterogeneous structure [13] was fabricated using a low-temperature bonding technique. The blood mixing area was bonded to the lower layer of the 3D SMCD (Figure 2(A)). This helps prevent product breakage or blood leakage. This 3D SMCD design of the blood-specific automated mixing system pro-vides external systems for blood testing. As evidenced by the Raman spectroscopy signals obtained in this study’s experimental results, successful acquisition of biological component information was collected.
The results demonstrate the successful development of a novel 3D SMCD, integrated with a Raman spectroscopy system for blood clotting detection. We fabricated the 3D SMCD, featuring a sandwich structure composed of PMMA (Polymethyl Methacrylate)/silicon/PMMA, utilizing a low-temperature bonding process to achieve the bonding of heterogeneous materials while eliminating internal stresses. This helps prevent product breakage or blood leakage. We successfully achieved a maximum bonding surface energy value of 841 mJ/m2, ensuring no leakage during blood measurements. In the lower mixing zone of the 3D silicon-based microfluidic device, we integrated the Raman spectroscopy system to obtain characteristic spectra from Raman spectroscopy signals for blood clotting measurements, as shown in Figure 1.
2.2. Blood Sample Preparation
All blood samples in this study were obtained with the approval of the institutional review board from blood donors at the National Cheng Kung University Hospital in Taiwan. Three types of samples were extracted for each blood specimen. None of the normal samples used in this study were subjected to any chemical or biological treatment. Blood samples were drawn using a syringe, dropped on an upper hole of the 3D SMCD (100 μL). All the experiments were conducted on the blood samples at room temperature (RT). Whole blood, which was obtained from healthy individuals, typically had a PT of 10.0–12.5 s. By comparison, the coagulation factor required to bind to calcium (Ca++) ions in the blood, called factor IV, is known as abnormal blood, which was obtained from patients receiving anticoagulant drugs, had a clotting time of longer than 12.5 s. For experimental protocol, a calcium-containing coagulant had to be mixed with blood in a ratio of 2.8:1. To meet the requirements of clinical practice, the prepared whole blood and plasma samples were also examined as shown in Figure 2.
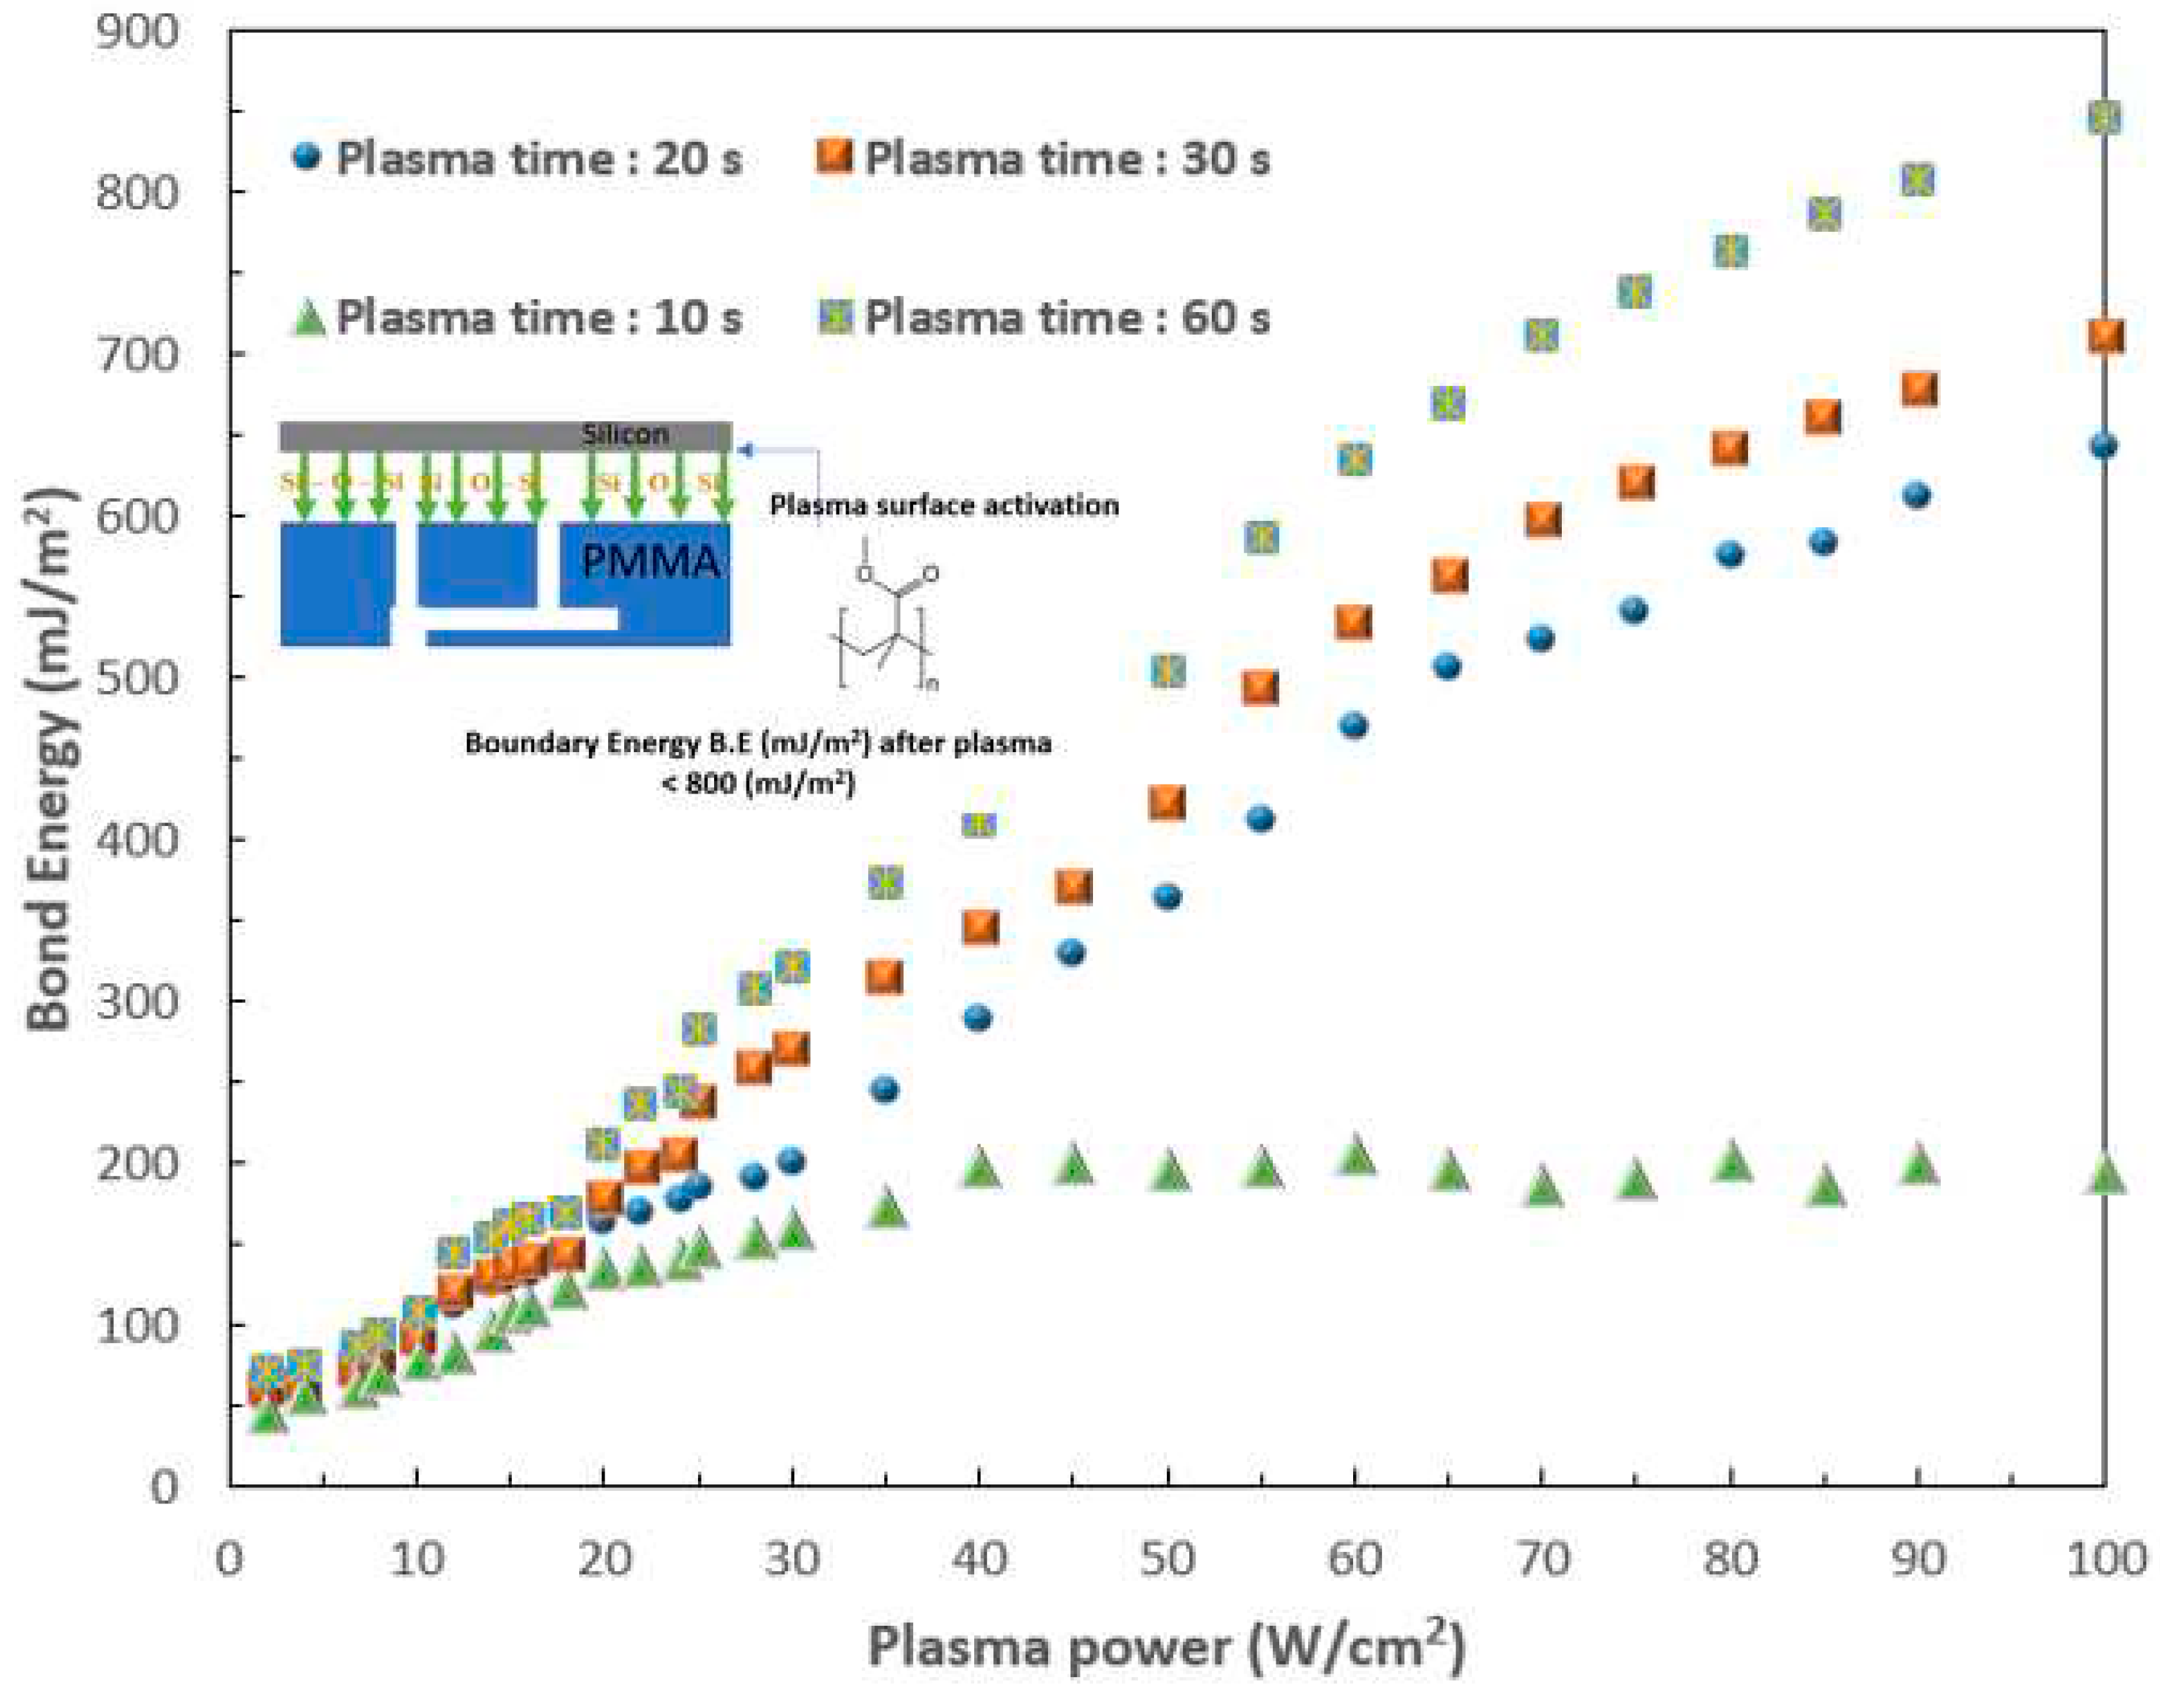
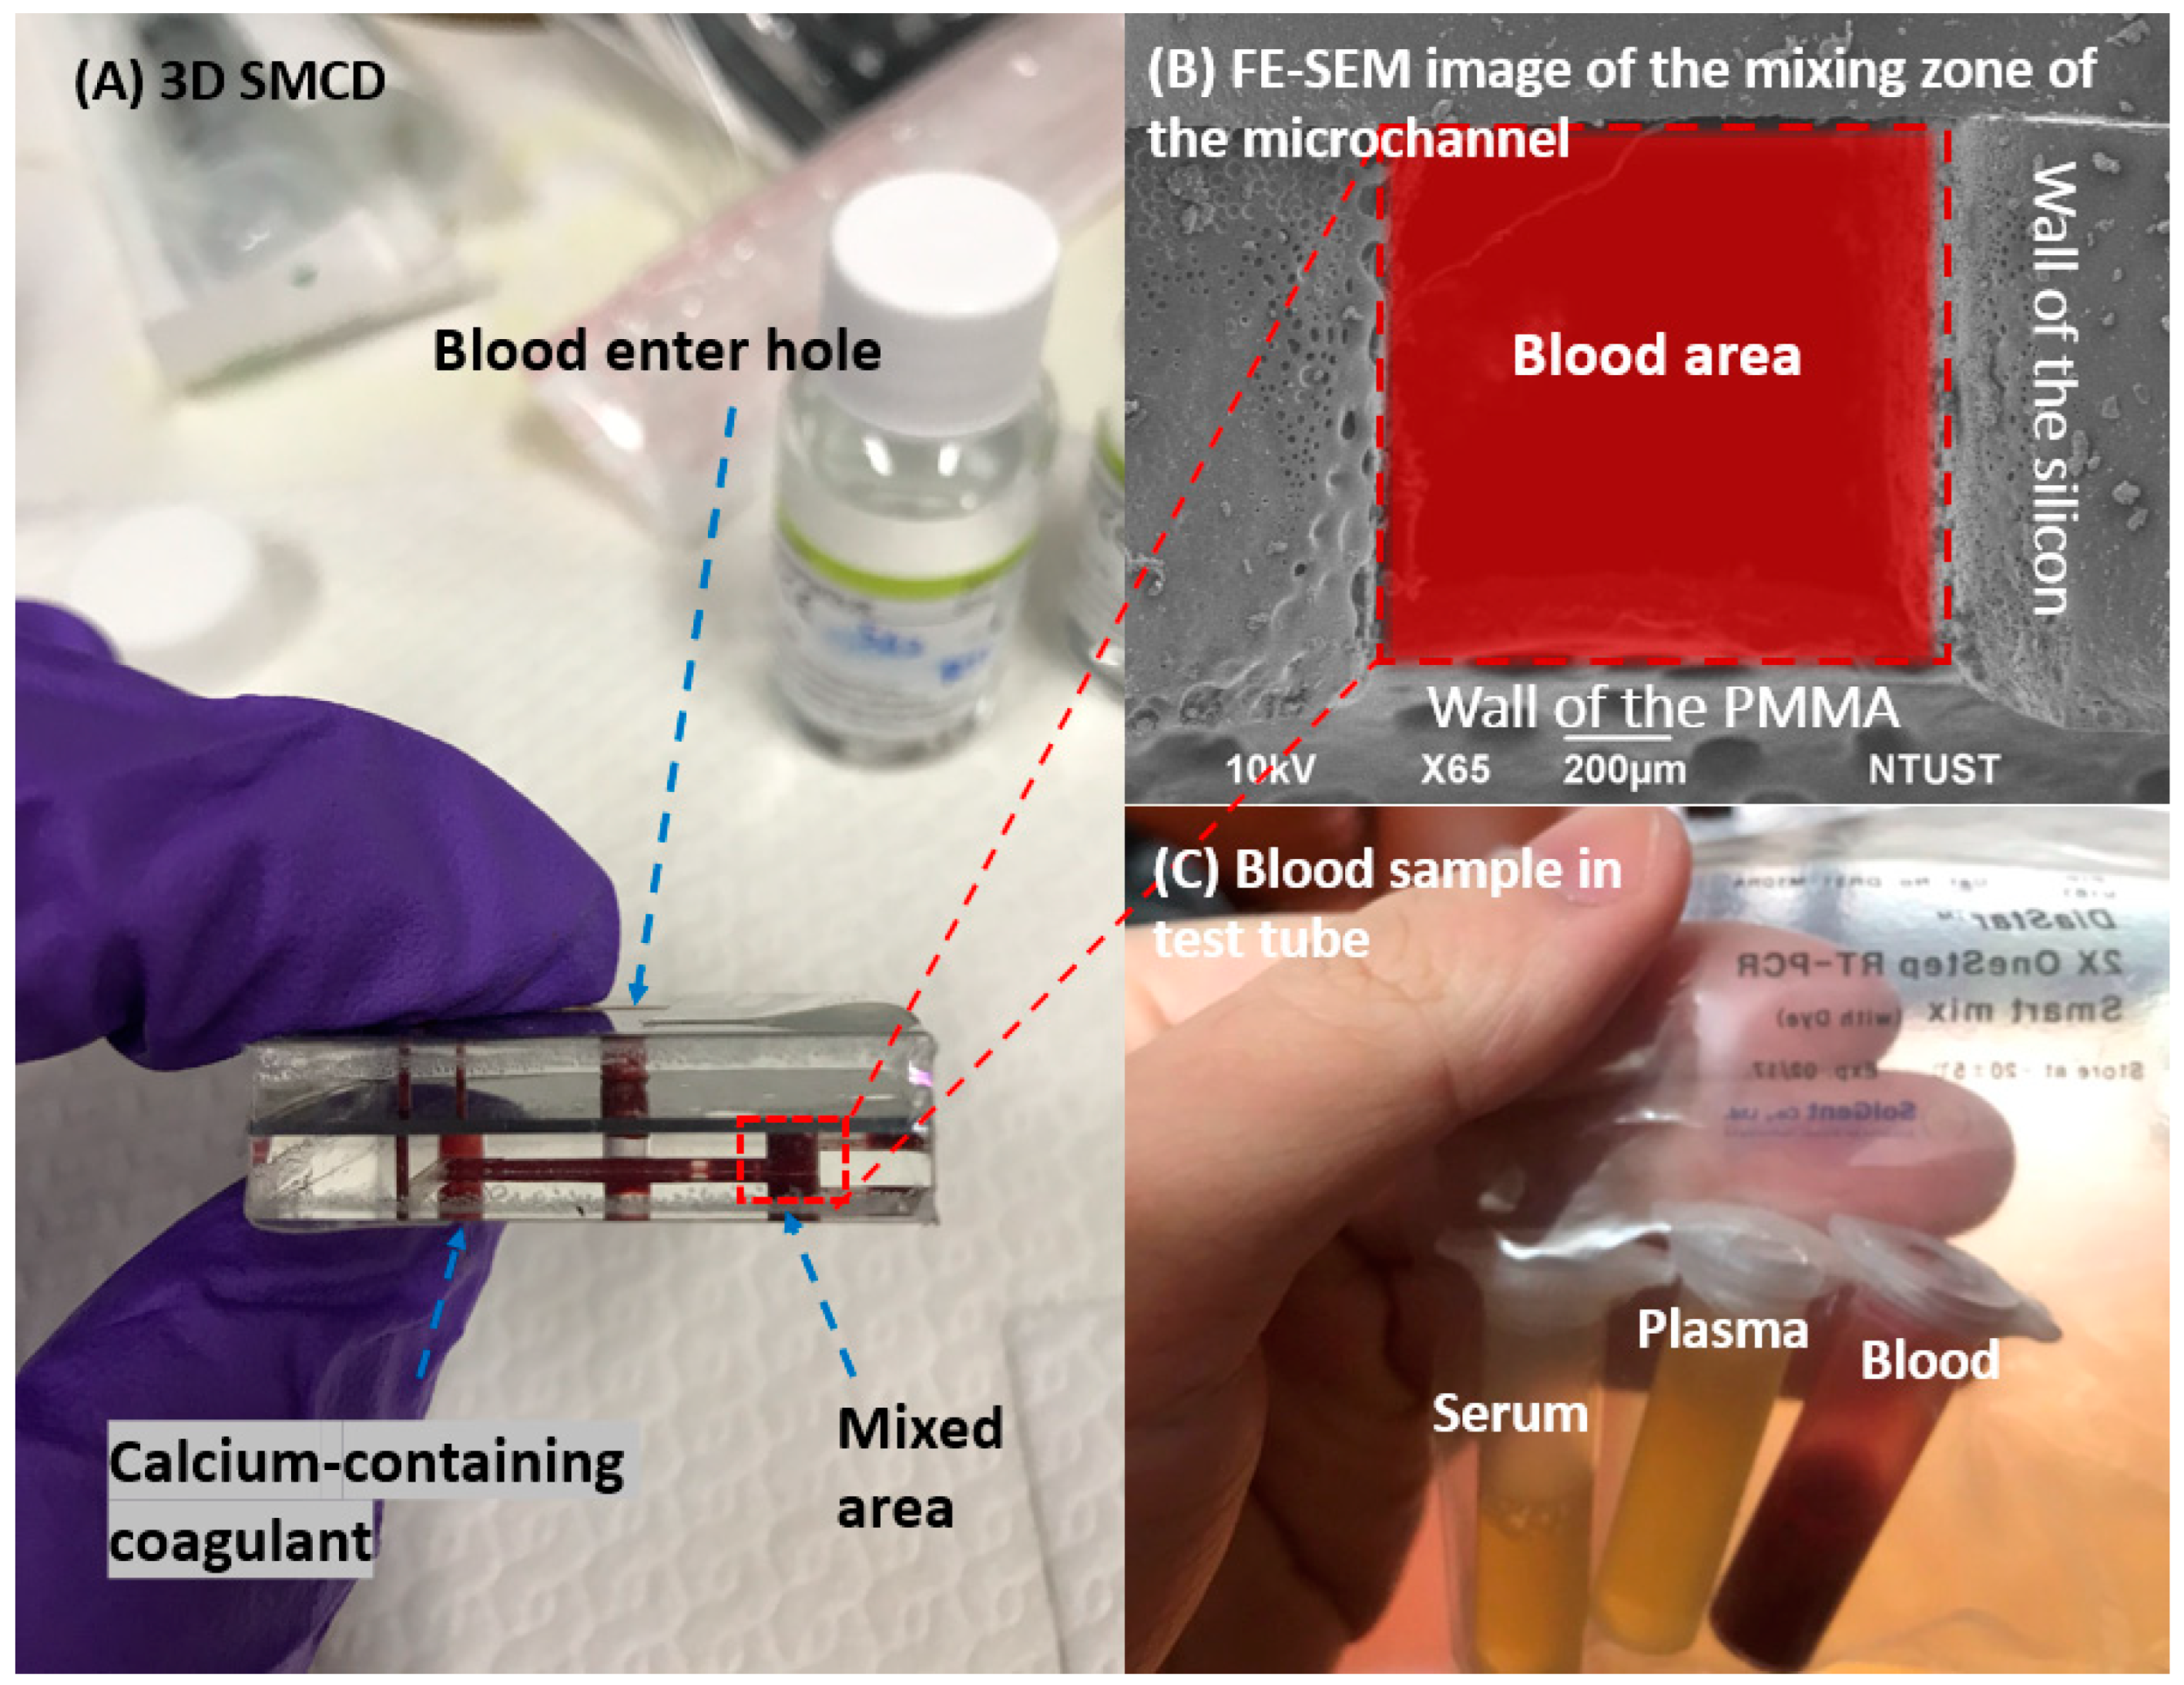
Figure 1.
Trend curve of plasma power and bonding energy of 3D SMCD.
Figure 2.
Preparation of blood samples using 3D SMCD, (A) 3D SMCD, (B) FE-SEM image of the mixing zone of the microchannel, (C) Blood sample in test tube.
Figure 2.
Preparation of blood samples using 3D SMCD, (A) 3D SMCD, (B) FE-SEM image of the mixing zone of the microchannel, (C) Blood sample in test tube.
3. Raman Spectroscopy
Raman spectroscopy was performed at RT using a custom-made micro-Raman spectroscopy system consisting of a spectrometer (Princeton Instruments Acton Spectra Pro 2500i), a liquid nitrogen cooled CCD detector (Princeton Instruments Acton 7508-0002), four objective lenses from 20x to 100x, and a solid-state green laser (wavelength of 532 nm) as its excitation light source with the laser output power of 2 mW. To avoid laser heating damage on blood samples, each Raman spectrum was recorded with the integration of 3 s, 5 times. The spectral range was set between 400 and 2000 cm−1 as shown in Figure 3. The Raman characteristic peak position was calibrated with measurements of a Si(100) substrate under the same conditions, and the background intensity was subtracted. In addition, the Raman spectra are normalized to the characteristic peak of whole blood at 1562 cm-1 [14], as shown in Figure 3.
4. Results and Discussion
4.1. Raman Spectrum for Whole Blood
On the basis of literature review and matching inquiries in the Spectral Database for Organic Compounds [15], we found that the most abundant component in the whole blood is hemoglobin [16], followed by amino acid, lactic acid, lactate, and acetate. Hemoglobin exhibits characteristic peaks at 690, 989, 1015, 1182, 1233, 1315, and 1562–1649 cm−1. Hemoglobin constitutes 95% of the weight of a red blood cell and affects the oxygen-carrying capacity [17]. In clinical practice, hemoglobin level can serve as a standard for anemia detection [18], and the severity of COVID-19 disease can be predicted using blood oxygen level [5]. Amino acid is a small molecule [19] which exhibited characteristic peaks at 770 and 1348 cm−1. Moreover, lactic acid and lactate exhibited characteristic peaks at 1092 and 1144 cm−1, respectively. Lactic acid is a metabolic product of carbohydrates, and blood lactic acid levels can serve as a standard for the diagnosis of lactic acidosis in clinical practice [20]. Lactate is a salt produced when lactic acid releases a hydron and reacts with a positively charged ion like sodium or potassium. An excessive lactate level is recognized as a potential cause of acidemia (acidosis) [21]. The main characteristic peak of acetate was located at 1441 cm−1 as shown in Figure 4. Acetate exists in animal tissues, excreta, and blood in the form of free acid. Table 1 displays the characteristic Raman peaks and vibrational modes of the components found in whole blood. [22]. These components may have lower concentrations in blood or undergo changes post-coagulation, resulting in weaker and less distinguishable peaks. Furthermore, the spectral range between 600 cm-1 and 800 cm-1 may encompass characteristic peaks of other biological information such as hormones, antibodies, and enzymes. The Raman detection results revealed that due to structural changes in platelets during low-temperature storage and potential lipid loss, some peaks were weaker and less distinguishable.
4.2. Comparison of the Raman Spectra of Whole Blood and Abnormal Blood Function of Factor IV
By comparing the Raman spectra between normal whole blood and blood with abnormal Factor IV function, the critical difference becomes apparent within the spectral range of 1562 to 1651 cm-1, as shown in Figure 5. The whole blood sample exhibited characteristic peaks at 1562 and 1613 cm−1, whereas the abnormal blood sample exhibited a characteristic peak at 1574 cm−1. This result suggests that the coagulation of hemoglobin was easier in whole blood than in abnormal blood because of the shorter time period for clotting in normal blood. Accordingly, the characteristic peaks of aromatic ring breathing, C==N antisymmetric stretching, and pyrrole ring stretching were either absent or shifted in peak position in the Raman spectrum of abnormal blood function of Factor IV [23]. Table 2 presents the characteristic Raman shifts and corresponding components for whole blood and abnormal blood function of Factor IV.
4.3. Comparison of the Raman Spectra of Abnormal Blood (Factor IV) with and without Coagulant
A comparative study of abnormal blood (Factor IV) with and without a coagulant was conducted, as shown in Figure 6. The results indicate the intrinsic pathway can be initiated by events that take place within the lumen of blood vessels. The intrinsic pathway requires only elements (coagulation factors, Ca++, platelet surface, etc.) found within or intrinsic to the vascular system. In the comparison between abnormal blood with and without coagulant, the abnormal blood (Factor IV) with coagulant had lower intensities at the characteristic peaks of 770, 1011, 1185, 1318, 1356, and 1384 cm−1 and higher intensities at 988 and 1577 cm−1. Such a change in intensity, without a shift in peak position, is attributed to a (significant) change in the clotting time of hemoglobin. The addition of coagulant shortens the clotting time, and therefore, the abnormal blood (Factor IV), originally having a long time period of clotting, became fully coagulated after the addition of coagulant. Table 3 presents the major Raman shifts and corresponding components for normal blood without coagulant and abnormal blood (Factor IV) with coagulant.
On the other hand, comparison of the Raman spectra of whole blood with coagulant and abnormal blood (Factor IV) with coagulant was performed and presented in Figure 7. The characteristic peaks of abnormal blood (Factor IV) with coagulant were similar to those of whole blood with coagulant. Thus, the addition of coagulant to abnormal blood (Factor IV) resulted in the wavenumber and intensities of its characteristic peaks gradually approaching those of the characteristic peaks of whole blood with coagulant. This indicates that the coagulation cascades were commonly shared among individuals with either whole blood or abnormal blood (Factor IV) samples, but the time required for complete coagulation varied. In addition, the presence of coagulant effectively shortened the time period of clotting for abnormal blood (Factor IV) and caused full coagulation.
Therefore, in the experiment, we placed blood samples in the 3D SMCD and treated them for approximately 15 seconds. Additionally, we measured PT, a method for assessing blood clotting ability, by adding Ca++ to the microfluidic device. To achieve rapid clotting, we automatically circulated blood within the mixing area, completing the process in about 3 seconds. These components may have lower concentrations in blood or undergo changes post-coagulation, resulting in weaker and less distinguishable peaks. Furthermore, the spectral range between 800cm-1 and 900 cm-1 may encompass characteristic peaks of other biological information such as hormones, antibodies, and enzymes. The Raman detection results revealed that, due to structural changes in platelets during low-temperature storage and potential lipid loss, some peaks were weaker and less distinguishable.
4.4. Comparison of the Raman Spectra of Whole Blood, Plasma, and Serum
The whole blood is the normal blood that contains anticoagulants to inhibit coagulation. The characteristic peaks of whole blood had lower intensities than those of whole blood because of the lack of coagulation in whole blood, which resulted in its molecules being unable to achieve resonance. However, the overall spectrum obtained for normal blood and whole blood were similar (Figure 8). By contrast, plasma and serum exhibited characteristic peaks only at 1016, 1164, and 1526 cm−1 because only some small molecules remained after the removal of blood cells. A study suggested that the characteristic peaks of plasma and serum correspond to β-carotene [24], which only exhibits molecular resonance at low frequencies. In clinical application, changes in the characteristic β-carotene peaks in the Raman spectra of serum and plasma can be used to diagnose certain diseases, such as thyroid disease and chronic renal failure. Researchers have recommended using the Raman shift of β-carotene for diagnosing chronic renal failure and thyroid disease [25]. Table 4, Table 5 and Table 6 present the major Raman shifts and corresponding components for whole blood [21], plasma [25], and serum [26].

| Raman shift (cm-1) | Vibrational blood mode | Component |
|---|---|---|
| 1016 | C-H bending | β-Carotene |
| 1164 | C-C stretching | β-Carotene |
| 1526 | C-C stretching | β-Carotene |
5. Conclusions
We conducted a study utilizing a Raman spectrometer (excitation wavelength- 532 nm) to analyze blood components using a 3D silicon-based microfluidic device with both upper and lower mixing zones [27]. The combination of Raman spectroscopy with the microfluidic device allowed for more precise analysis and information retrieval of blood components. The method proved to be effective in measuring Raman spectral signals of whole human blood, offering cost-effectiveness and simple operation compared to high-precision confocal micro-Raman systems. Additionally, short-wavelength Raman scattering spectroscopy was employed to detect samples of whole blood, abnormal blood, plasma, and serum. Analysis of the biological characteristics detected in each sample type yielded several key conclusions and new findings. Firstly, the addition of a coagulant gradually made changes in the intensities and peak position of the characteristic peaks of abnormal blood resembling those of normal blood with coagulant. This behavior suggests that blood clotting affects the locations and intensities of characteristic peaks caused by hemoglobin. Secondly, the results of abnormal blood without coagulant differed from those of whole blood without coagulant, with strong differences at low-frequency vibration modes serving as potential diagnostic fingerprints. Lastly, in serum and plasma, hemoglobin is not the main molecule that resonates in Raman spectroscopy, but β-carotene exhibits molecular resonance at low frequencies, indicating its potential importance in medical testing.
Acknowledgments
The authors thank the Ministry of Science and Technology, Taiwan, Republic of China (contract numbers: MOST 109-2224-E-011 -002), for supporting the research and publication
References
- Kong, K.; Kendall, C.; Stone, N.; Notinghera, I. Raman spectroscopy for medical diagnostics — From in-vitro biofluid assays to in-vivo cancer detection. Volume. 2015, 89, 121–134. [Google Scholar] [CrossRef] [PubMed]
- Pence, I.J.; Janse, A.M. Clinical instrumentation and applications of Raman spectroscopy. Chem. Soc. Rev. 2016, 45, 1958–1979. [Google Scholar] [CrossRef] [PubMed]
- Workman, J. Infrared and Raman spectroscopy in paper and pulp analysis. Appl. Spectrosc. Rev. 2001, 36, 139–168. [Google Scholar] [CrossRef]
- Sil, S.; Umapathy, S. Raman spectroscopy explores molecular structural signatures of hidden materials in depth: Universal Multiple Angle Raman Spectroscopy. Sci. Rep. 2014, 4, 5308. [Google Scholar] [CrossRef] [PubMed]
- Ganesh, K.V.S.S.; Bevi, A.R. Low-Cost Pulse Oximeter & Heart Rate Measurement for COVID Diagnosis. J. Phys.: Conf. Ser. 2021; 1964, 62035. [Google Scholar] [CrossRef]
- Han, H.W.; Yan, X.L.; Dong, R.X.; Ban, G.; Li, K. Analysis of serum from type II diabetes mellitus and diabetic complication using surface-enhanced Raman spectra (SERS). Appl. Phys. 2009, 94, 667–672. [Google Scholar] [CrossRef]
- Rusciano, G.; Luca, A.C.D.; Pesce, G.; Sasso, A. Raman Tweezers as a Diagnostic Tool of Hemoglobin-Related Blood Disorders. Sensor. 2008, 8, 7818–7832. [Google Scholar] [CrossRef] [PubMed]
- Han, H.; Gong, j.; Tian, Y. Analysis of Serum from Acute Leukemia Patients Using Surface-Enhanced Raman Spectroscopy (SERS). Spectroscopy, 2022; 37, 36–41. [Google Scholar]
- Atkins, C.G.; Buckley, K.; Blades, M.W.; Turner, R.F.B. Raman Spectroscopy of Blood and Blood Components. Appl. Spectrosc. 2017; 71, 767–793. [Google Scholar]
- Albanes, D. β-Carotene and lung cancer: a case study. Volume. 1999, 69, 1345–1350. [Google Scholar] [CrossRef] [PubMed]
- Huang, S.J.; Chiang, C.C.; Immanue, P.N.; Subramania, M. Point-of-Care Testing Blood Coagulation Detectors Using a Bio-Microfluidic Device Accompanied by Raman Spectroscopy. Coatings 2022, 12, 893. [Google Scholar] [CrossRef]
- Staritzbichler, R.; Hunold, P.; Lopis, I.E.-; Hildebrand, P.W.; Isermann, B.; Kaiser, T. Raman spectroscopy on blood serum samples of patients with end-stage liver disease. PLoS One. 2021, 16, 256045. [Google Scholar] [CrossRef]
- Chiang, C.-C.; Immanuel, P.; Chiu, Y.-H.; Huang, S.-J. Heterogeneous Bonding of PMMA and Double-Sided Polished Silicon Wafers through H2O Plasma Treatment for Microfluidic Devices. Coatings 2021, 11, 580. [Google Scholar] [CrossRef]
- Huang, S.-J.; Lin, M.-T.; Chiang, C.-C.; Arun Dwivedi, K.; Abbas, A. Recent Advancements in Biological Microelectromechanical Systems (BioMEMS) and Biomimetic Coatings. 2022, 12, 1800.
- Sansano, A.; Navarro, R.; Arranz, A.S.; Manrique, J.A. Development of a Spectral Data Base for Exomars’ Raman Instrument (RLS). LPSC. 2014, 45, 2803. [Google Scholar]
- Enejder, A.M.; Koo, T.W.; Oh, J.; Hunter, M.; Sasic, S.; Feld, M.S.; Horowitz, G.L. Blood analysis by Raman spectroscopy. Optics letters. 2002, 27, 2004–2006. [Google Scholar] [CrossRef] [PubMed]
- Filho, I.T.; Terner, J.; Pittman, R.N.; Somera, S.G. The Effect of Red Blood Cell Velocity on Oxygenation Measurements using Resonance Raman Spectroscopy. Am J Physiol Heart Circ Physiol. 2005, 289, 488–495. [Google Scholar] [CrossRef] [PubMed]
- Miller, J.L. Iron Deficiency Anemia: A Common and Curable Disease. Cold Spring Harb Perspect Med. 2013, 3, 11866. [Google Scholar] [CrossRef] [PubMed]
- Friedman, M. Analysis, Nutrition, and Health Benefits of Tryptophan. Int J Tryptophan Res. 2018, 11, 1178646918802282. [Google Scholar] [CrossRef] [PubMed]
- Brooks, G.A. Current concepts in lactate exchange. Med. Sci. Sports. Exerc. 1991, 23, 895–906. [Google Scholar] [CrossRef]
- Cairns, S.P. Lactic Acid and Exercise Performance. Sports Med. 2006, 36, 279–291. [Google Scholar] [CrossRef] [PubMed]
- Ahlawat, S.; Kumar, N.; Uppal, A.; Gupta, P.K. Visible Raman excitation laser induced power and exposure dependent effects in red blood cells. J of Biophotonics. 2016, 10, 1–8. [Google Scholar] [CrossRef] [PubMed]
- Bankapur, A.; Zachariah, E.; Chidangil, S.; Valiathan, M.; Mathur, D. Raman Tweezers Spectroscopy of Live, Single Red and White Blood Cells. PLoS ONE. 2010, 5, 10407. [Google Scholar] [CrossRef]
- .Long, B.; Zheng, W.; Schweitzer, M.; Hallen, H. Resonance Raman imagery of semi-fossilized soft tissues. Volume. 2018, 10753, 1075310. [Google Scholar] [CrossRef]
- Casellaa, M.; Lucotti, A.; Tommasini, M.; Bedoni, M.; Forvi, E.; Gramaticac, F.; Zerbi, G. Raman and SERS recognition of β-carotene and haemoglobin. Volume. 2011, 79, 915–919. [Google Scholar] [CrossRef] [PubMed]
- Dinesh, K.R. M.; Maguire, A.; Bryant, J.; Arm-strong, J.; Dunne, M.; . Finn, M.; Lyng, F.M.; Meade, A.D. Development of a high throughput (HT) Raman spectroscopy method for rapid screening of liquid blood plasma from prostate cancer patients. The Analyst. 2016, 142, 3763. [Google Scholar]
- Immanuel, P.N.; Chiang, C.-C.; Yang, C.-R.; Subramani, M.; Lee, T.-H.; Huang, S.-J. Surface activation of poly (methyl methacrylate) for microfluidic device bonding through a H2O plasma treatment linked with a low-temperature annealing. Journal of Micromechanics and Microengineering 2021, 31, 055004. [Google Scholar] [CrossRef]
Figure 3.
Micro-Raman spectroscopy system and 3D SMCD (sample).
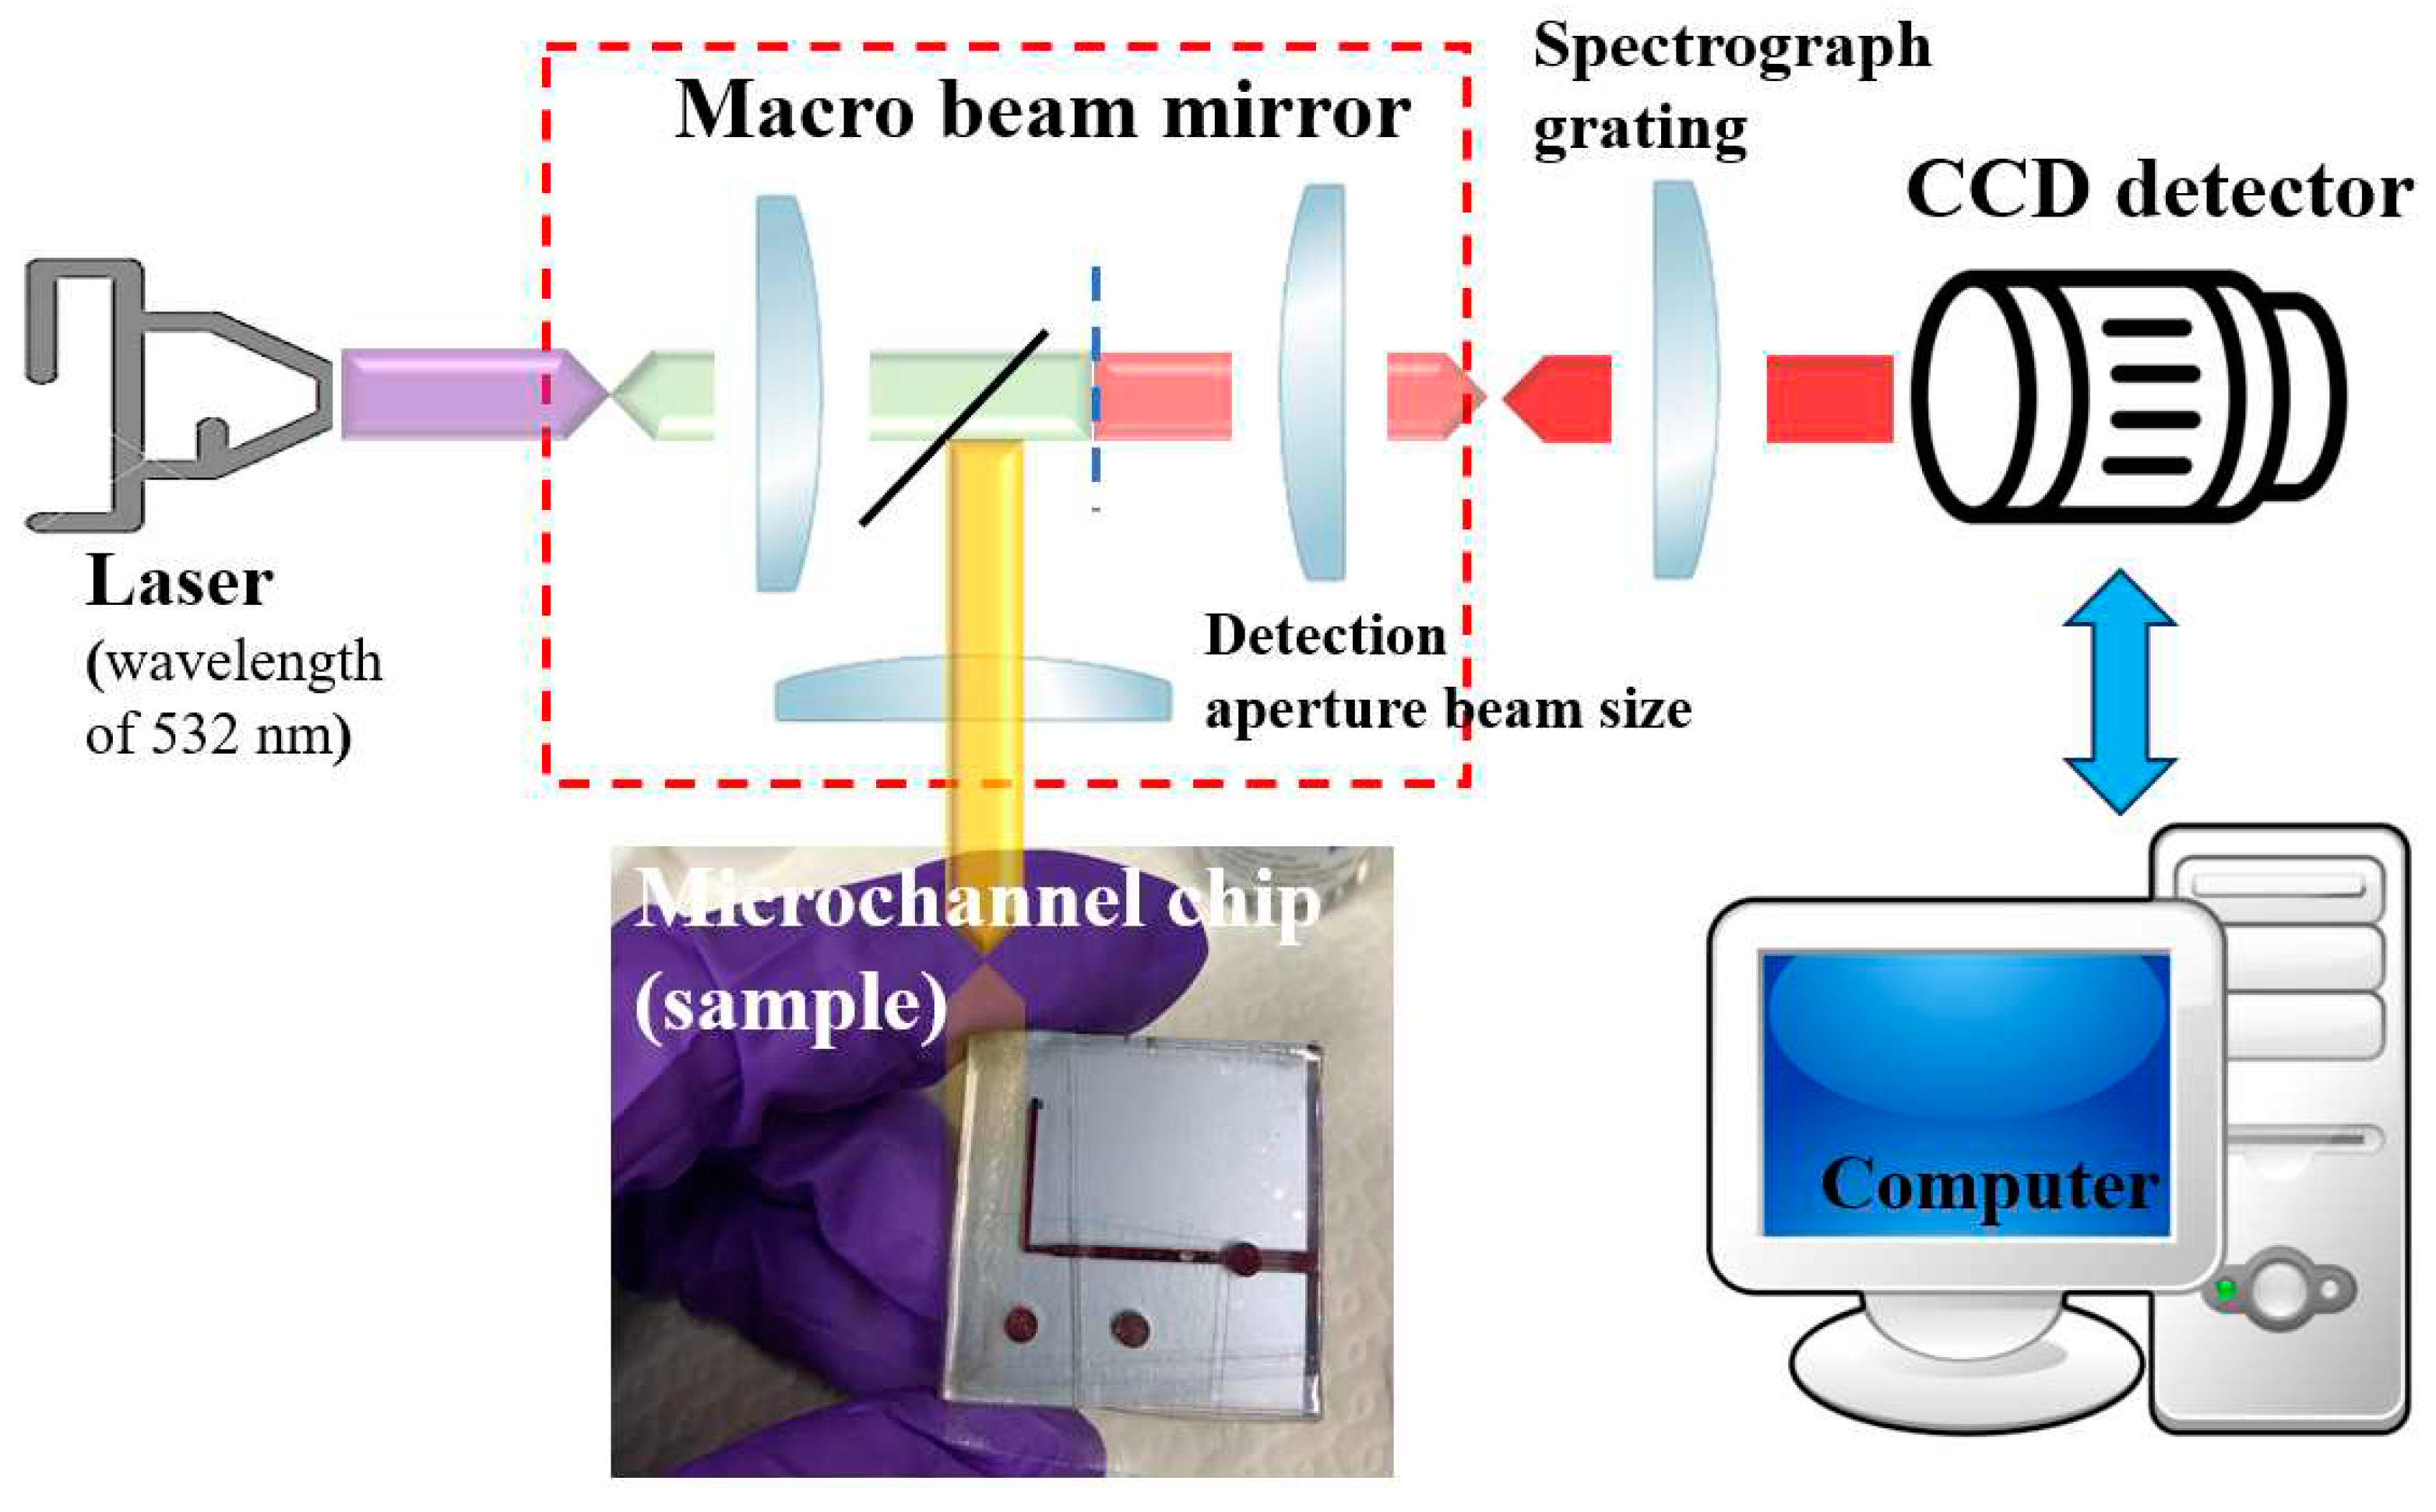
Figure 4.
Raman spectrum for whole blood at RT.
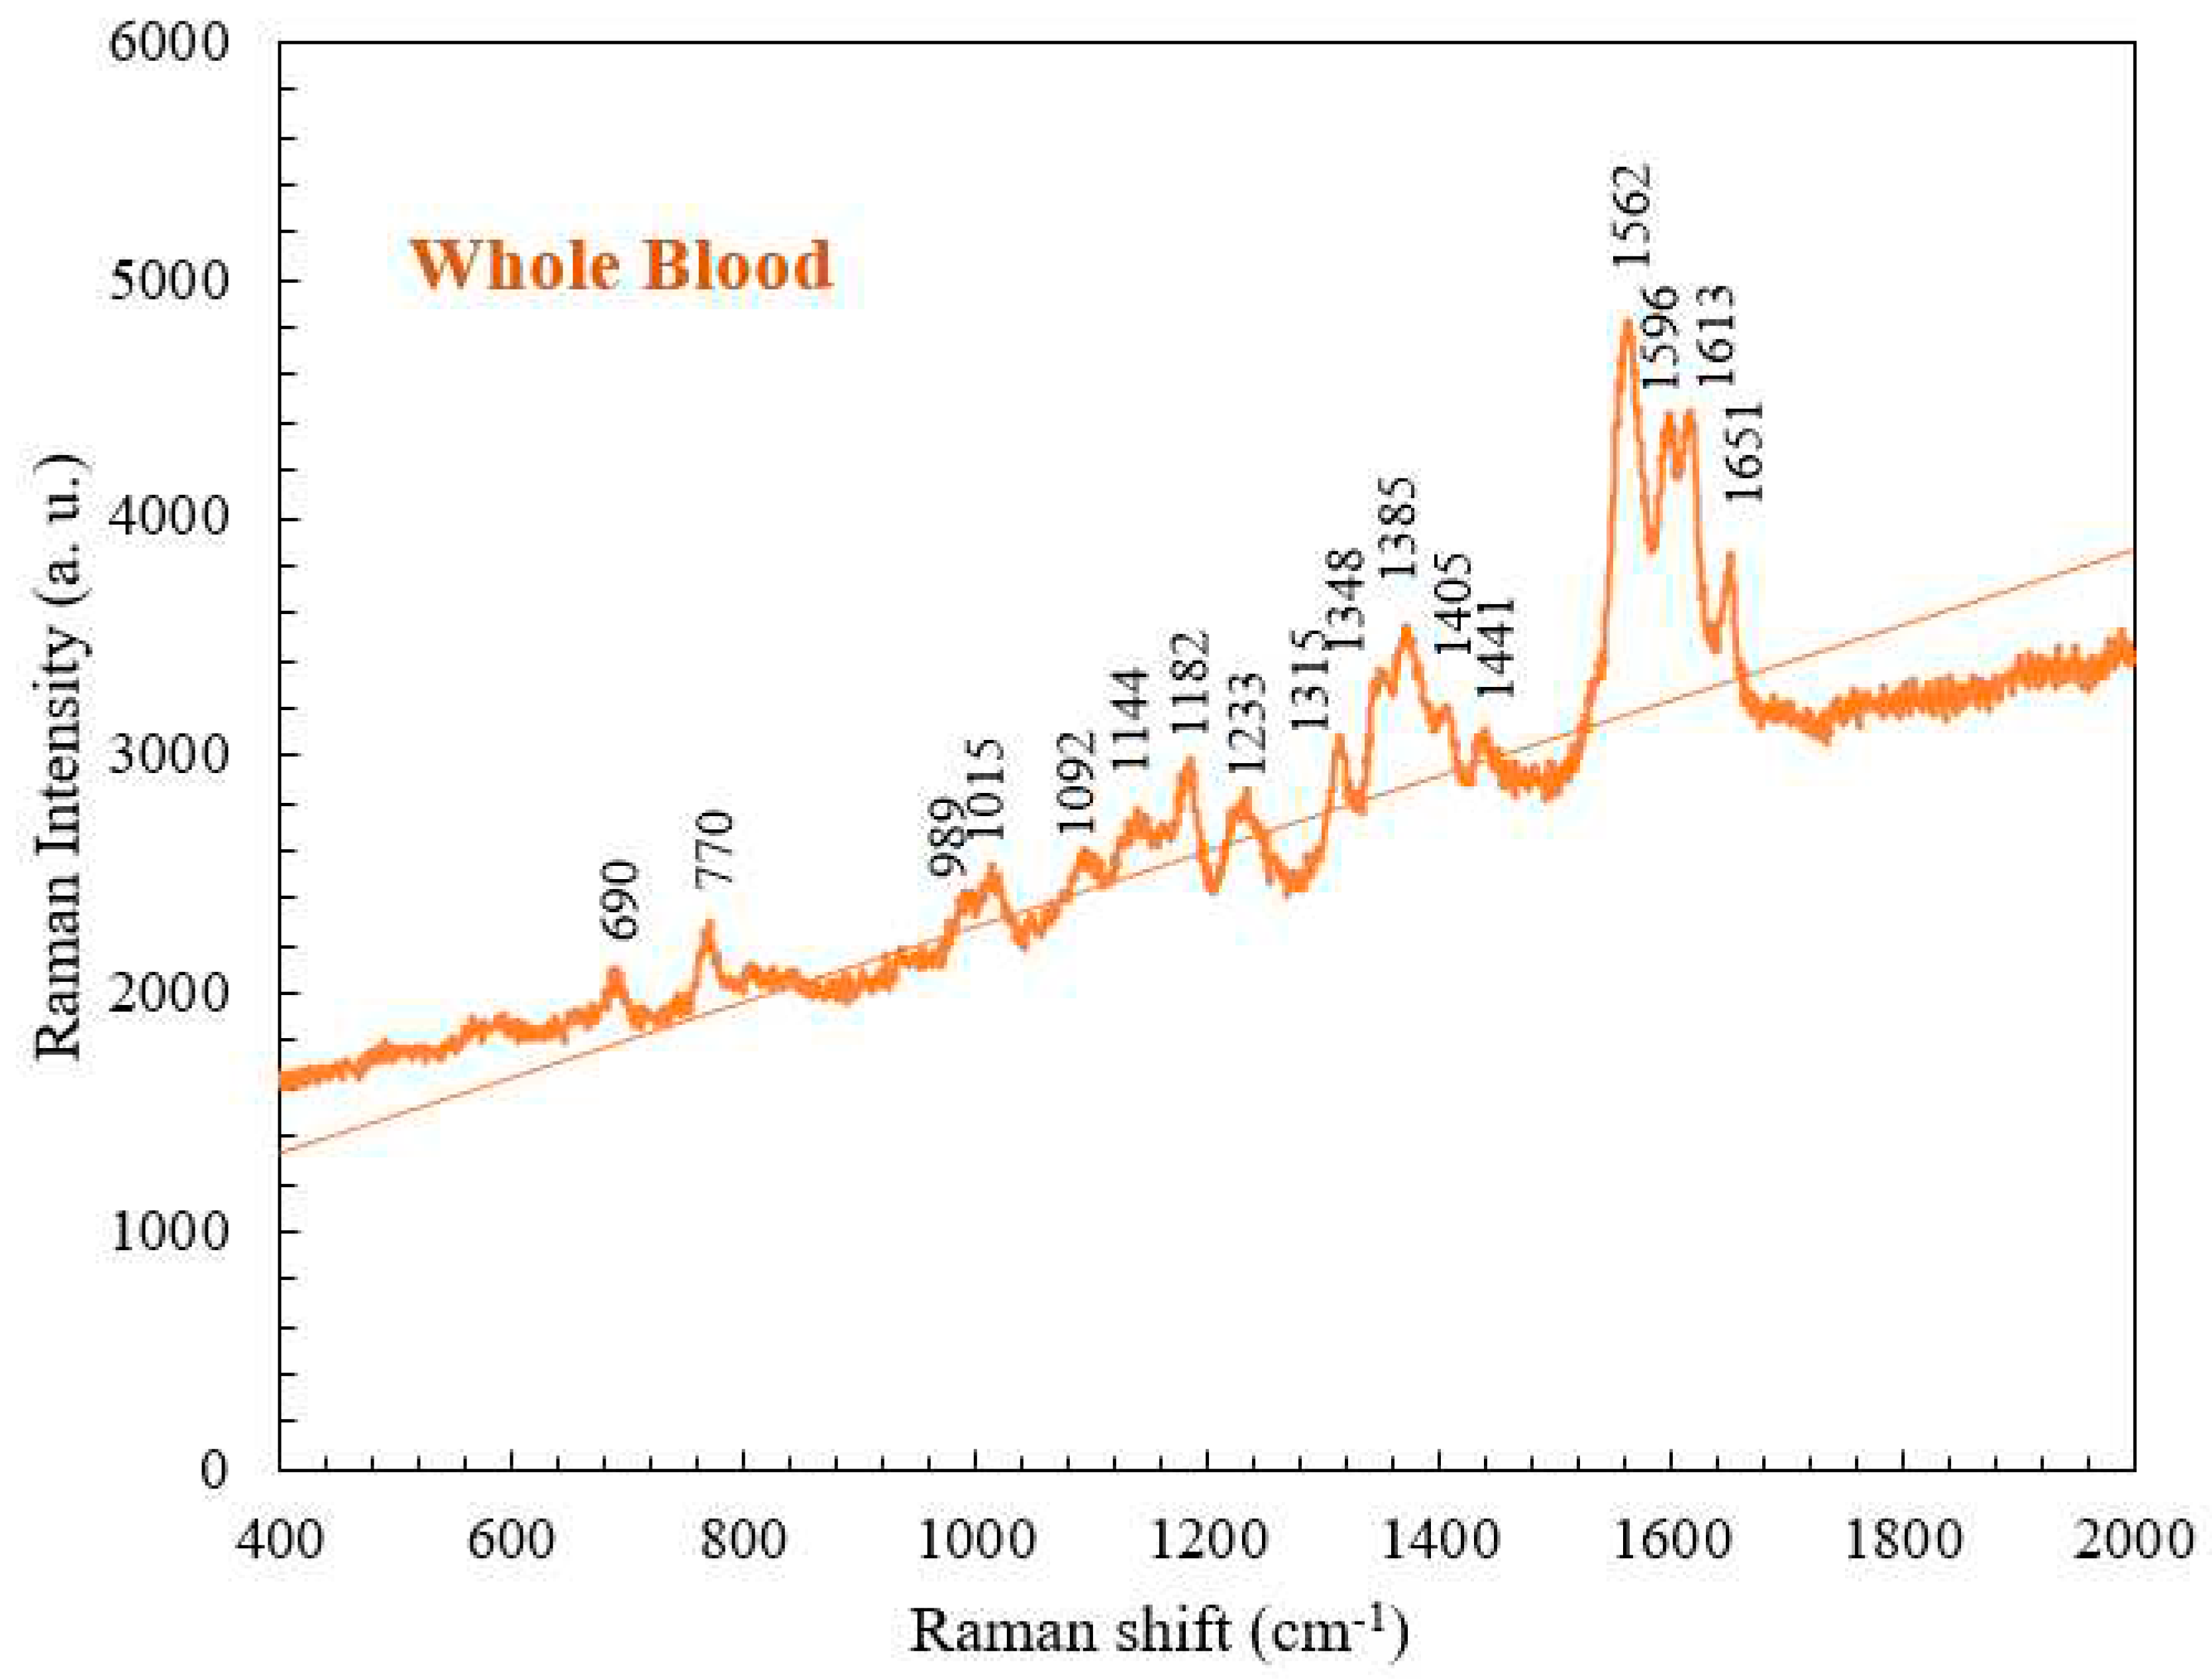
Figure 5.
Raman spectra of whole blood and abnormal blood at RT.
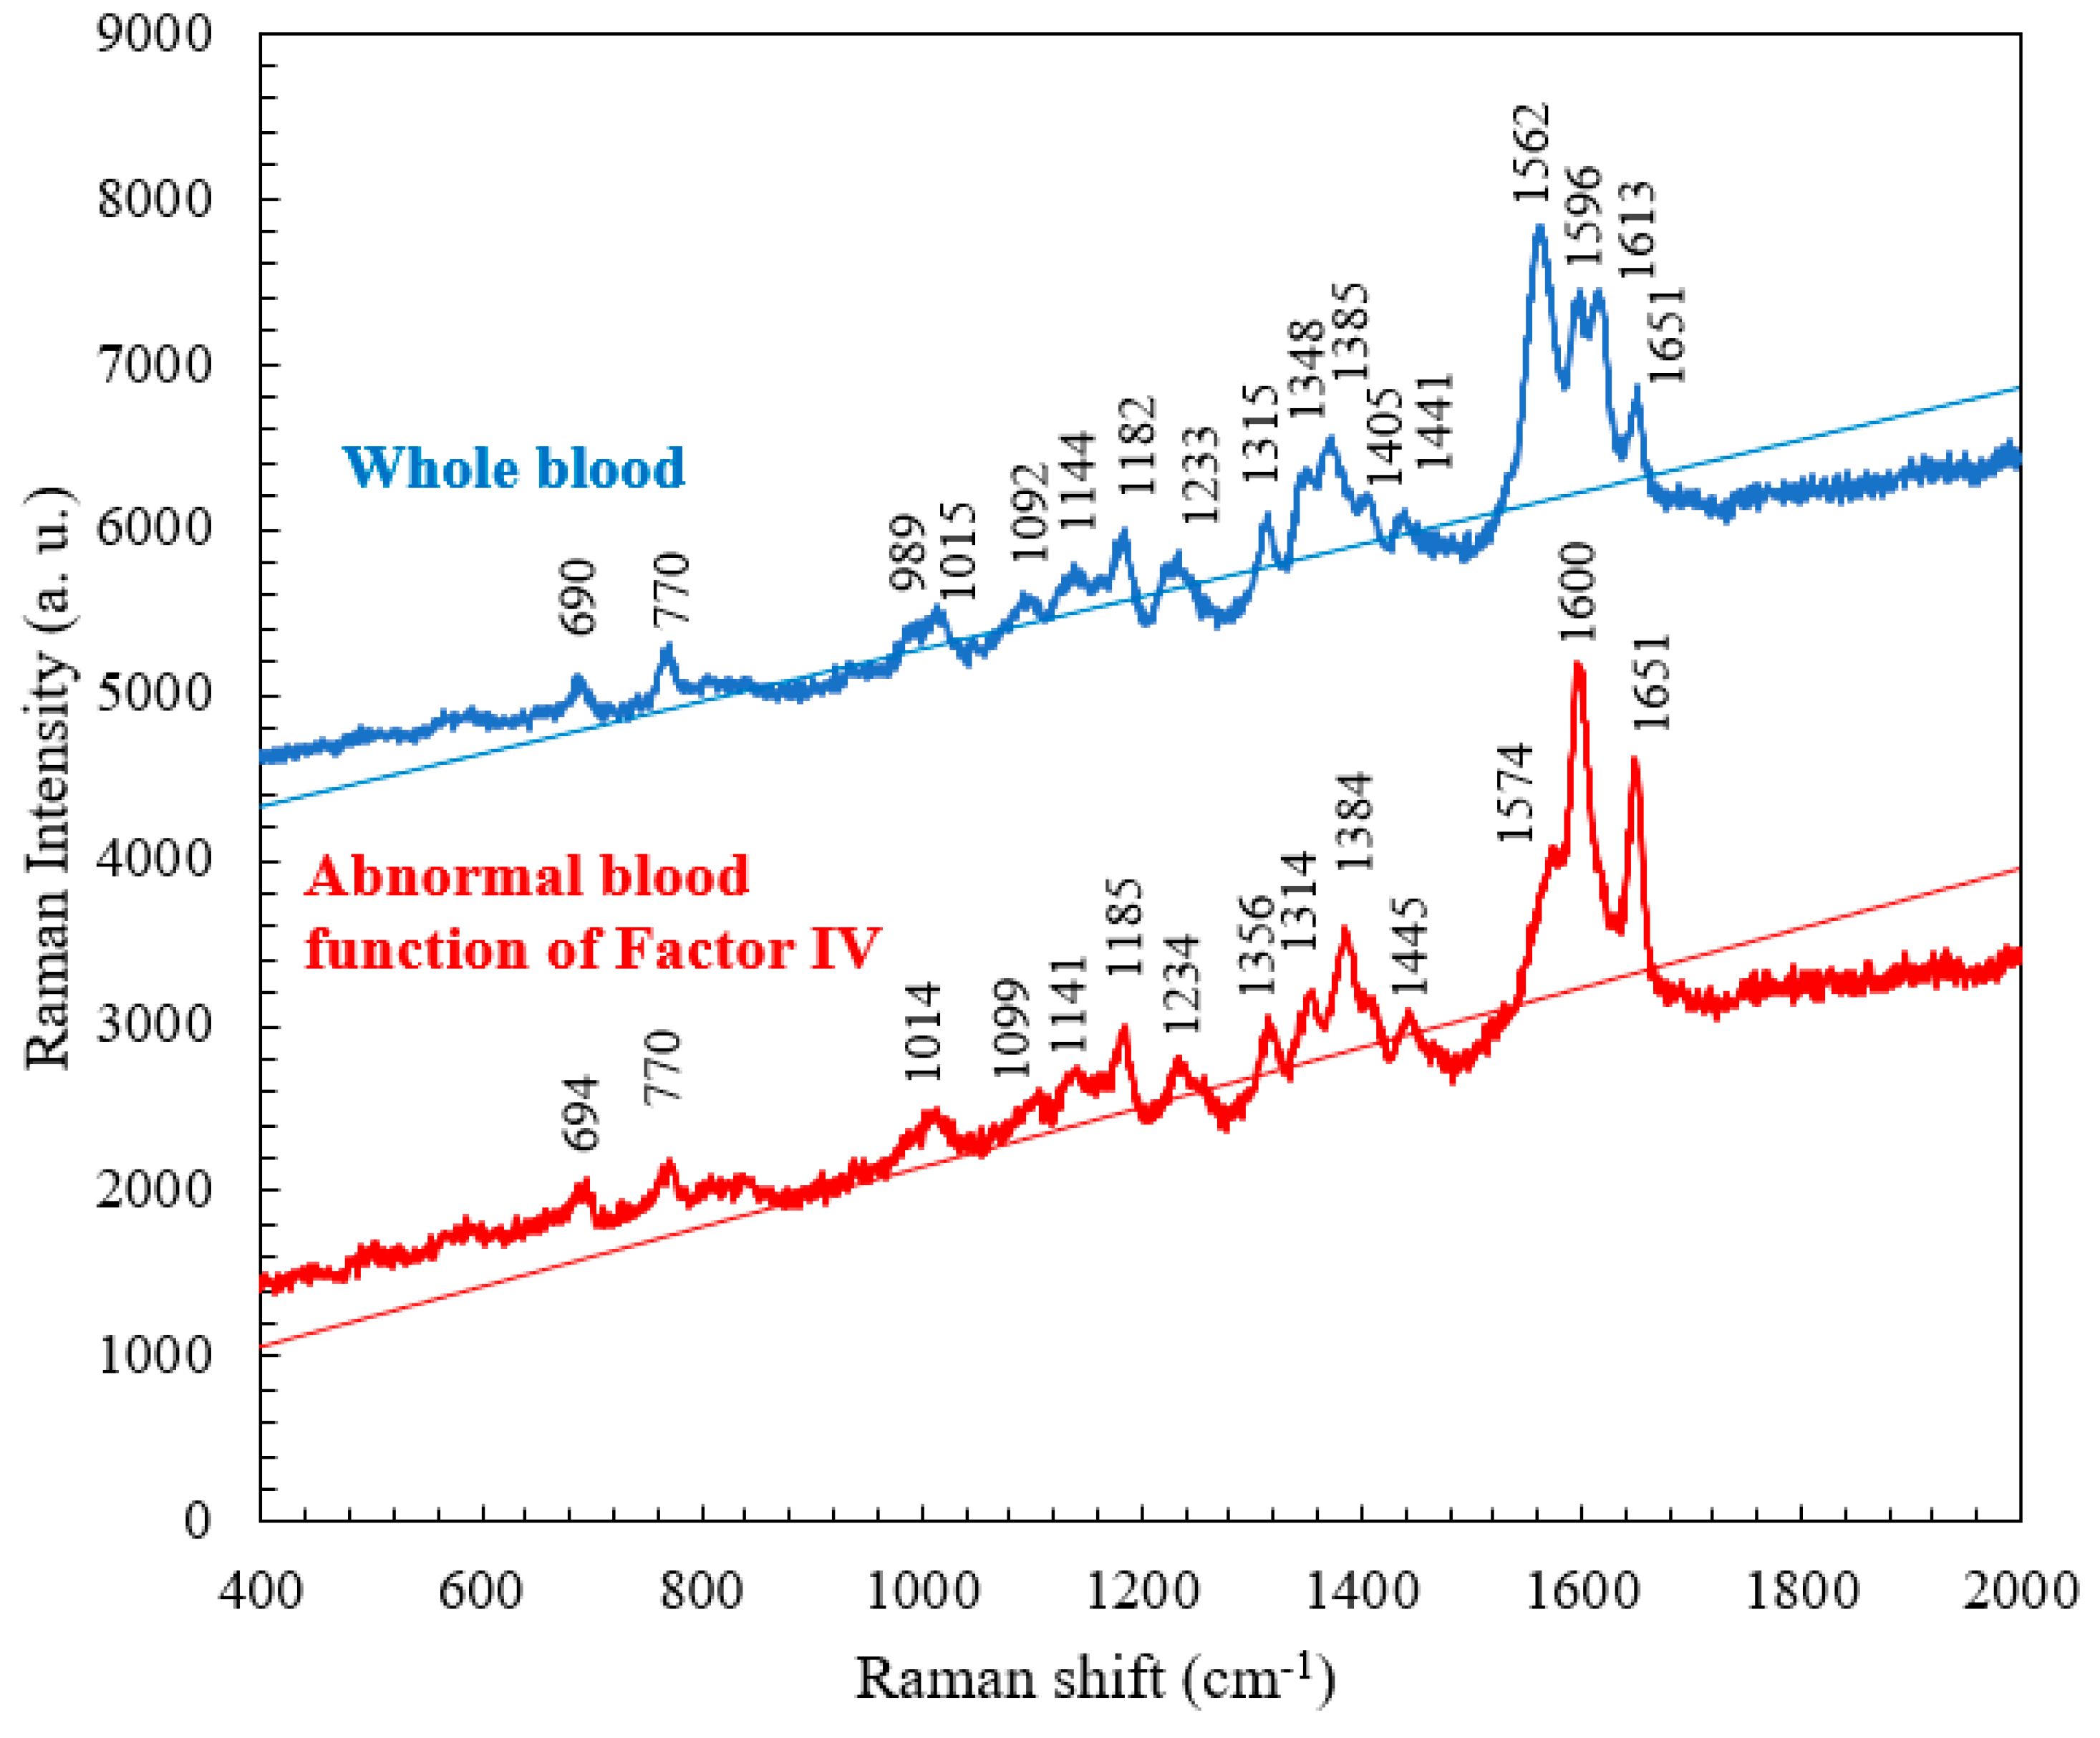
Figure 6.
Raman spectra of whole blood without coagulant and abnormal blood (Factor IV) with coagulant at RT.
Figure 6.
Raman spectra of whole blood without coagulant and abnormal blood (Factor IV) with coagulant at RT.
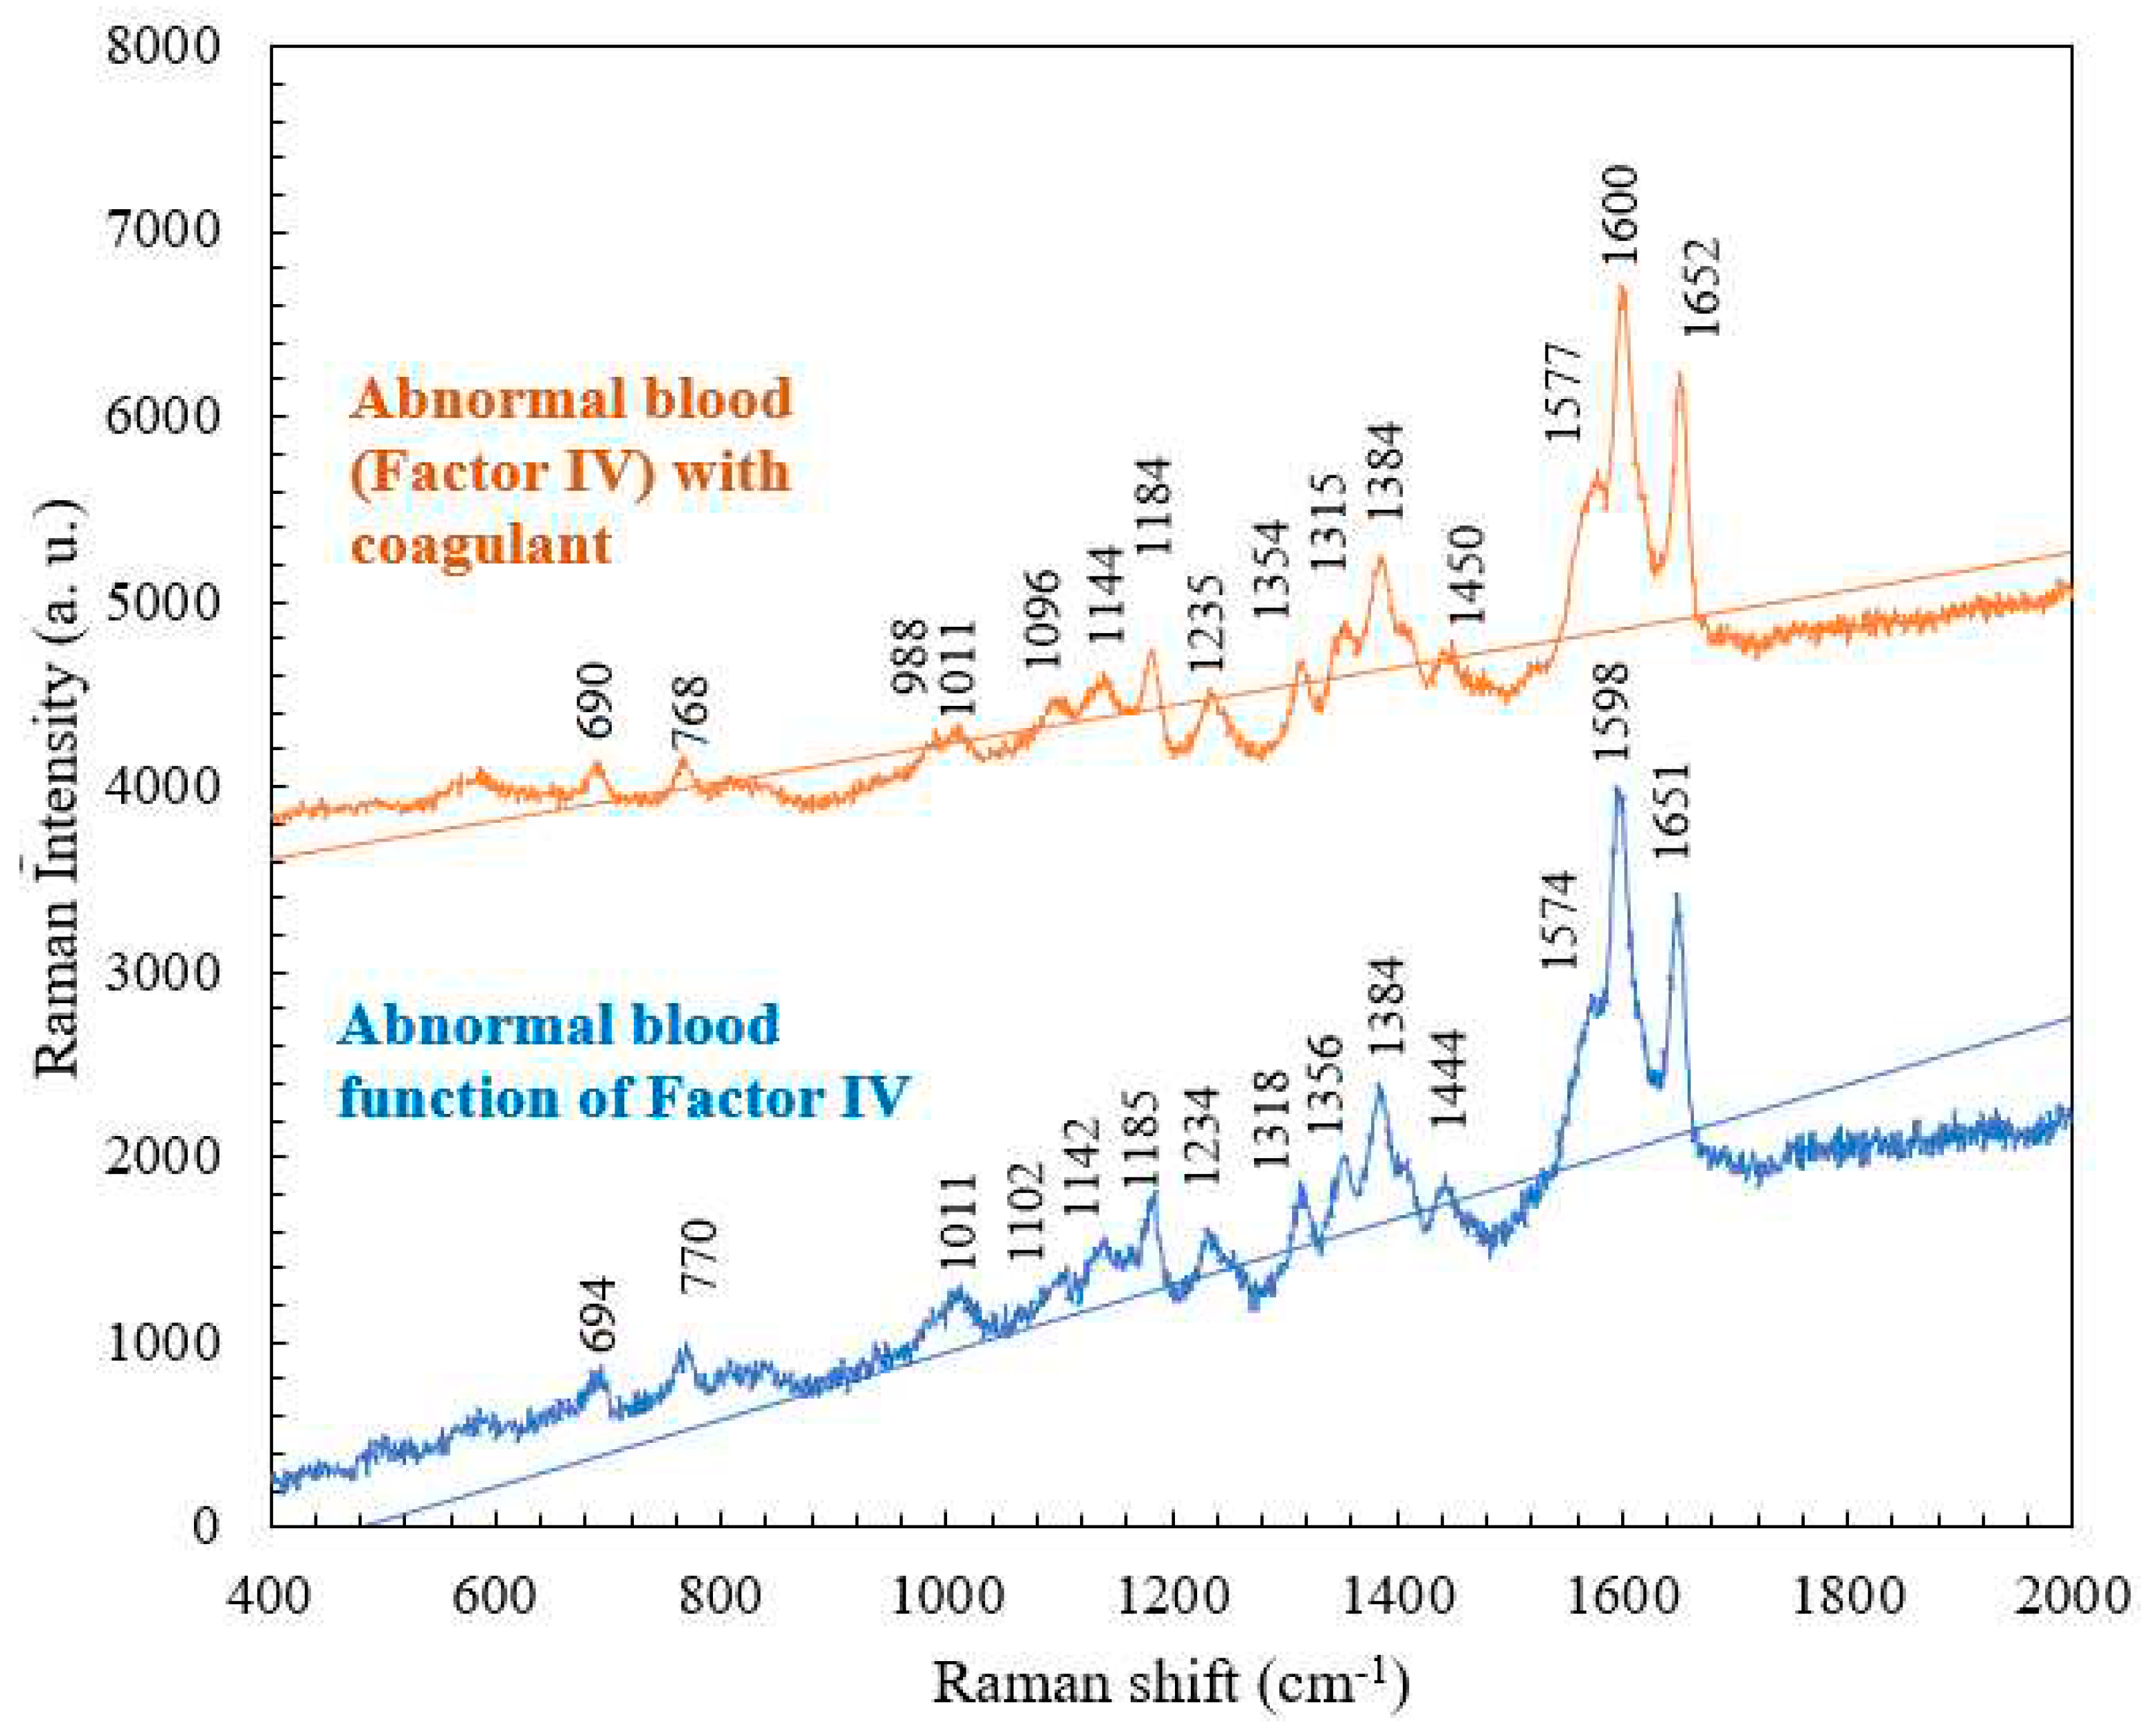
Figure 7.
Raman spectra of normal blood with coagulant and abnormal blood with coagulant at RT.
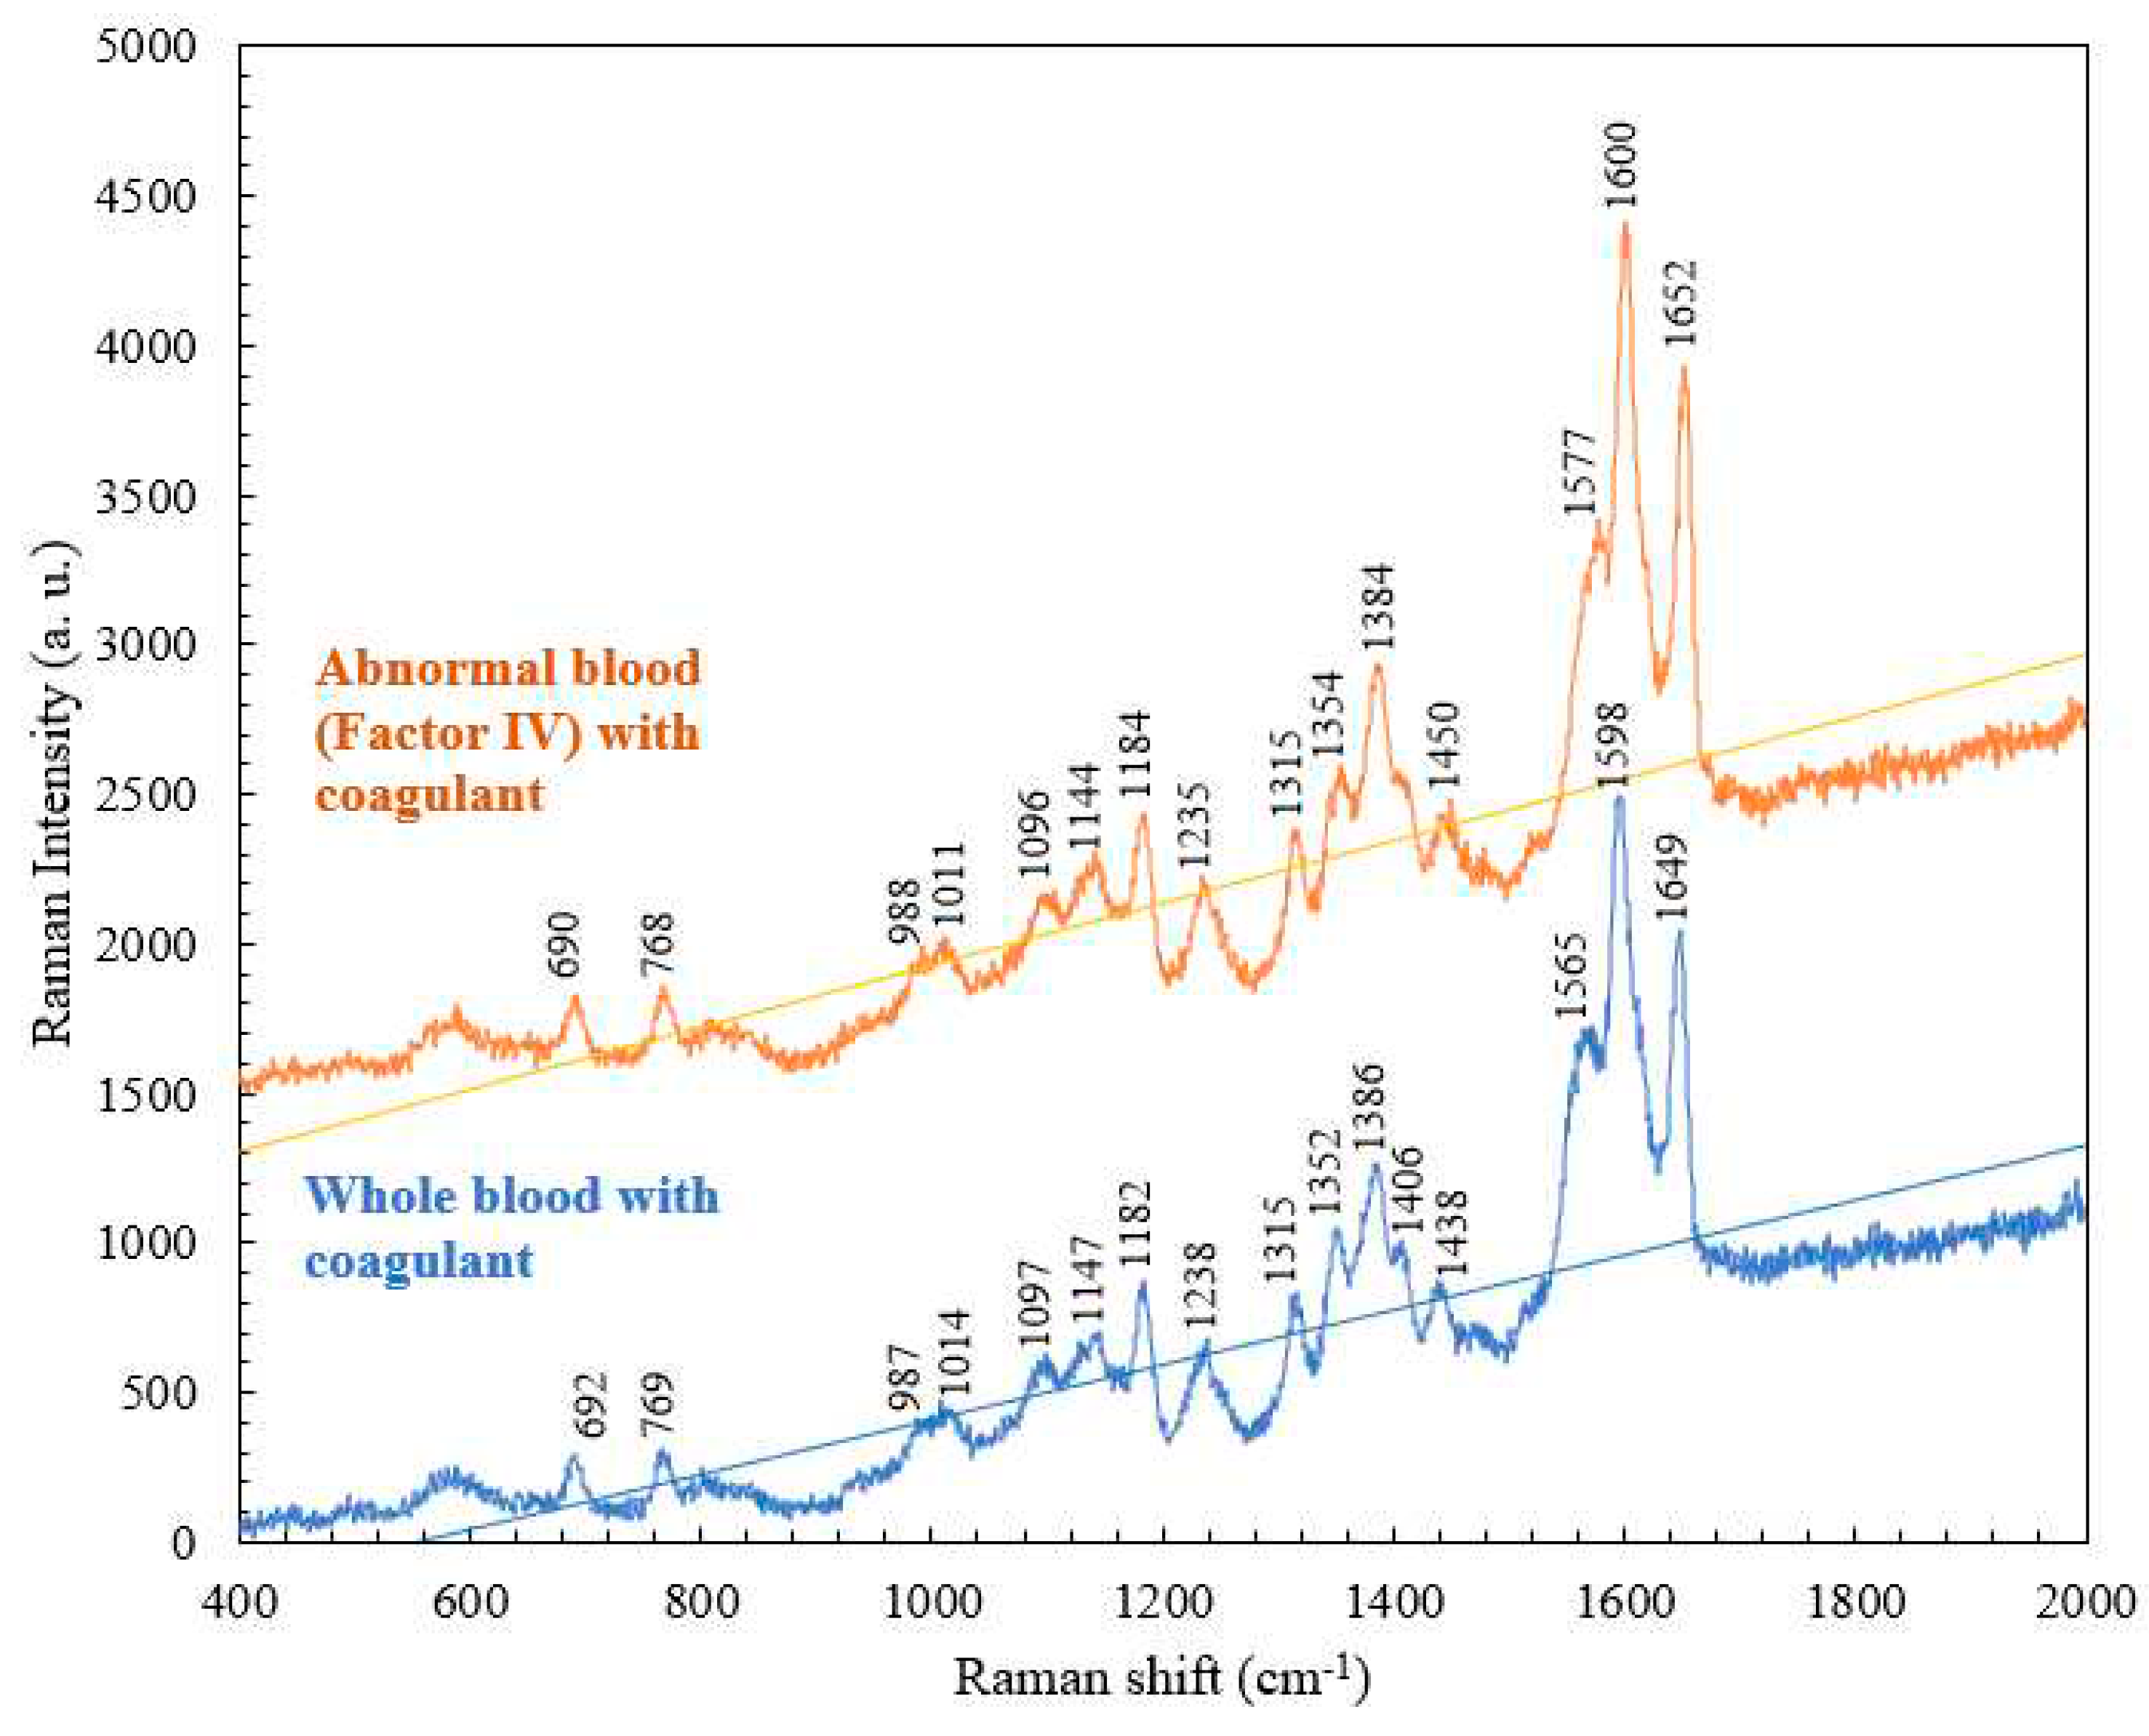
Figure 8.
Raman spectra of whole blood, plasma, and serum at RT.
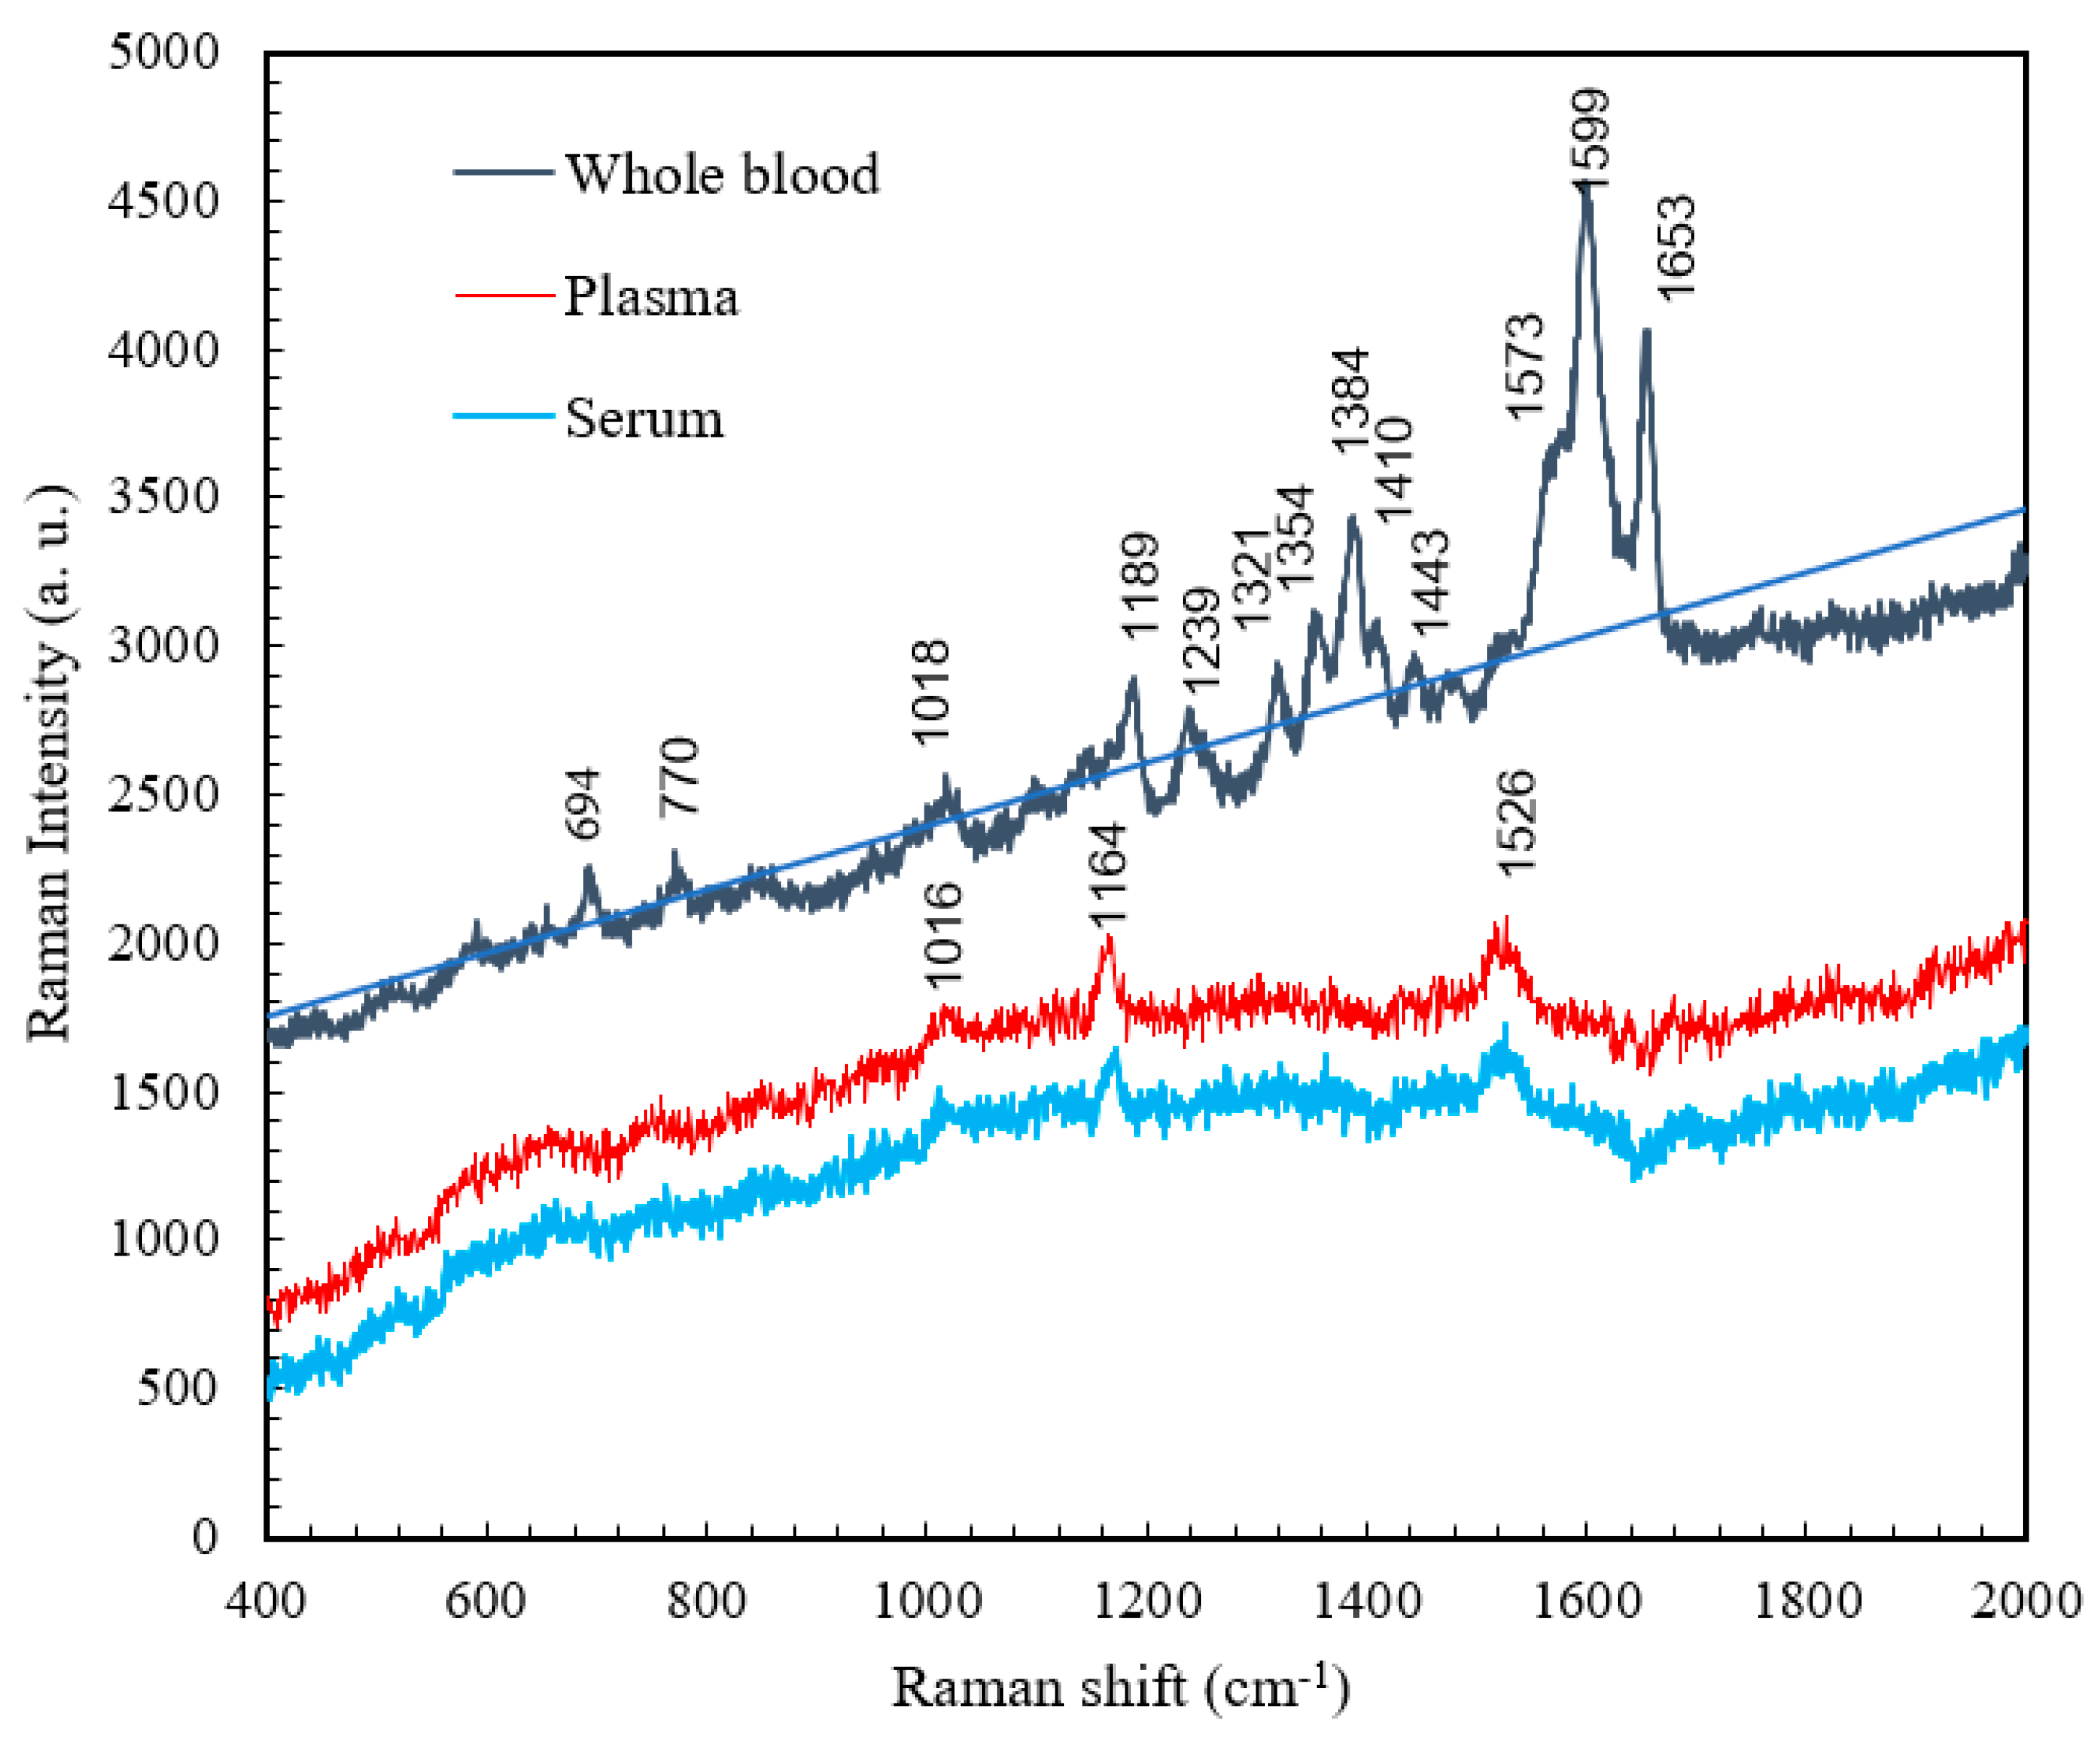
Table 1.
Characteristic peaks and corresponding vibrational modes of the components of the whole blood.
Table 1.
Characteristic peaks and corresponding vibrational modes of the components of the whole blood.
| Raman shift (cm-1) | Vibrational mode | Component |
| 690 | C-C-N bending | Hemoglobin |
| 770 | Ring vibrations | Tryptophan |
| 989 | Aromatic ring breathing | Hemoglobin |
| 1015 | Aromatic ring breathing | Hemoglobin |
| 1092 | C-O vibrations | Lactic acid |
| 1144 | CH3 rocking, C-O vibrations | Lactate |
| 1182 | C-C stretching | Hemoglobin |
| 1233 | Ferrous low spin | Hemoglobin |
| 1315 | C-C stretching | Hemoglobin |
| 1348 | C-H bending | Tryptophan |
| 1385 | CH3 symmetric stretching | Heme |
| 1405 | C==N antisymmetric stretching | Heme |
| 1441 | CH2 bending | Acetates |
| 1562 | Pyrrole ring stretching vibrations | Hemoglobin |
| 1596 | C==N antisymmetric stretching and | Hemoglobin |
| 1613 | C-H bending | Hemoglobin |
| 1651 | Ferrous low spin | Hemoglobin |
Table 2.
Major Raman shifts and corresponding components for whole blood and abnormal blood function of Factor IV.
Table 2.
Major Raman shifts and corresponding components for whole blood and abnormal blood function of Factor IV.
| Normal Raman shift (cm-1) | Abnormal blood Raman shift (cm-1) | Vibrational blood mode | Component |
|---|---|---|---|
| 989 | No | Aromatic ring breathing | Hemoglobin |
| 1315 | 1314 | C-C stretching | Hemoglobin |
| 1348 | 1356 | C-H bending | Tryptophan |
| 1562 | 1574 | Pyrrole ring stretching vibrations | Hemoglobin |
| 1596 | 1600 | C==N antisymmetric stretching | Hemoglobin |
| 1613 | No | C-H bending | Hemoglobin |
| 1651 | 1651 | Ferrous low spin | Hemoglobin |
Table 3.
Major Raman shifts and corresponding components for abnormal blood with and without coagulants.
Table 3.
Major Raman shifts and corresponding components for abnormal blood with and without coagulants.
| Abnormal blood Raman shift (cm-1) | Abnormal blood with coagulant Raman shift (cm-1) |
Vibrational mode | Component |
|---|---|---|---|
| 770 | 768 | Ring vibrations | Tryptophan |
| 1185 | 1184 | C-C stretching | Hemoglobin |
| 1318 | 1315 | C-C stretching | Hemoglobin |
| 1356 | 1354 | C-H bending | Tryptophan |
| 1574 | 1577 | Pyrrole ring stretching vibrations |
Hemoglobin |
Table 4.
Major Raman shifts and corresponding components for whole blood.
| Raman shift (cm-1) | Vibrational blood mode | Component |
|---|---|---|
| 694 | C-C-N bending | Hemoglobin |
| 770 | Ring vibrations | Tryptophan |
| 1018 | Aromatic ring breathing | Hemoglobin |
| 1189 | C-C stretching | Hemoglobin |
| 1239 | Ferrous low spin | Hemoglobin |
| 1321 | C-C stretching | Hemoglobin |
| 1354 | C-H bending | Tryptophan |
| 1384 | CH3 symmetric stretch | Heme |
| 1410 | C==N antisymmetric streching | Heme |
| 1443 | CH2 bending | Acetates |
| 1599 | C-H bending | Hemoglobin |
| 1653 | Ferrous low spin | Hemoglobin |
Table 5.
Major Raman shifts and corresponding components for plasma.
| Raman shift (cm-1) | Vibrational blood mode | Component |
|---|---|---|
| 1016 | C-H bending | β-Carotene |
| 1164 | C-C stretching | β-Carotene |
| 1526 | C-C stretching | β-Carotene |
Table 6.
Major Raman shifts and corresponding components for serum [26].
Table 6.
Major Raman shifts and corresponding components for serum [26].
| Raman shift (cm-1) | Vibrational blood mode | Component |
|---|---|---|
| 1013 | C-H bending | β-Carotene |
| 1172 | C-C stretching | β-Carotene |
| 1526 | C-C stretching | β-Carotene |
Disclaimer/Publisher’s Note: The statements, opinions and data contained in all publications are solely those of the individual author(s) and contributor(s) and not of MDPI and/or the editor(s). MDPI and/or the editor(s) disclaim responsibility for any injury to people or property resulting from any ideas, methods, instructions or products referred to in the content. |
© 2023 by the authors. Licensee MDPI, Basel, Switzerland. This article is an open access article distributed under the terms and conditions of the Creative Commons Attribution (CC BY) license (http://creativecommons.org/licenses/by/4.0/).
Copyright: This open access article is published under a Creative Commons CC BY 4.0 license, which permit the free download, distribution, and reuse, provided that the author and preprint are cited in any reuse.


