
Submitted:
06 November 2023
Posted:
07 November 2023
You are already at the latest version
Abstract
Leishmania spp. is the aetiologic agent of leishmaniasis, a disease endemic in several developing countries. The parasite expresses and secretes several virulence factors that subvert macrophage function and immune response. Extracellular vesicles (EVs) can carry molecules of the parasites that show immunomodulatory effects on macrophage activation and disease progression. In the present work, we detected a significantly higher expression of lpg3 and gp63 genes in Leishmania amazonensis promastigotes recovered after successive experimental infections (IVD-P) compared to those cultured for a long period (LT-P). In addition, we observed a significantly higher percentage of infection and internalized parasites in groups of macrophages infected with IVD-P. Macrophages previously treated with EVs from LT-P showed higher percentages of infection and production of inflammatory cytokines after challenge with the parasite compared to untreated ones. However, macrophages infected with parasites and treated with EVs did not reduce the parasite load. In addition, no synergistic effects were observed in infected macrophages treated with EVs and reference drugs. In conclusion, parasites cultured for a long period in vitro and recovered from animals’ infection differently affect the macrophage response. Furthermore, EVs produced by these parasites affected macrophage response in the early infection of these cells.
Keywords:
extracellular vesicles
; Leishmania (Leishmania) amazonensis
; virulence
; macrophages
1. Introduction
Leishmaniasis belongs to a neglected group of diseases caused by several protozoa species of the Leishmania genus, endemic in approximately 100 countries located mainly in tropical and subtropical regions [1]. The disease has a wide spectrum of clinical manifestations, often associated with specific species or subgenera of Leishmania [2]. However, leishmaniasis can be clinically classified into two groups: visceral leishmaniasis (VL) and cutaneous or tegumentary leishmaniasis (CL), the most prevalent clinical form [2]. Currently, disease control is based on prophylactic measures to combat the vector, control of reservoirs (mainly domestic dogs), health education activities, adequate diagnosis, and treatment of infected individuals [3]. However, therapeutic options for treating leishmaniasis are based on drugs that have problems such as cost, resistance development, side effects, and toxicity, limiting their use and effectiveness [4]. Furthermore, it is common for patients not to complete the therapeutic regimen due to toxic effects, long duration of therapy, and difficult access to the hospital environment to receive intravenous treatment [5].
Leishmania is a parasite with a heteroxenic life cycle that has two main life forms: promastigotes, present in infected female sandflies (vector), regurgitated during the blood meal of vector; amastigotes, detected mainly inside the phagocytic cells of the vertebrate host [2]. Leishmania promastigotes early interact with a complex of extracellular matrix and immune system molecules and phagocytic tissue cells [6]. The interaction between Leishmania and macrophages is one of the most studied, as these cells are important to parasite control [7]. Although macrophages and other immune cells have tools for controlling infection (phagocytosis, production of microbicidal molecules, such as nitric oxide – NO, and reactive oxygen species - ROS), Leishmania has several virulence factors capable of subverting the effector response of macrophages [8]. The zinc-dependent metalloprotease glycoprotein 63 kDa (GP63) is a protease produced by Leishmania and is considered a virulence factor as it can cleave host molecules responsible for the response against the parasite [9]. GP63 can target several transcription factors and proteins involved in macrophage activation pathways, and the degradation of these components can prevent the complete activation of macrophages, consequently impairing the destruction of the internalized parasite [10]. GP63 cleaves complement protein C3b into inactive form (iC3b), allowing the parasite to escape from the complement system [11]. Intracellularly, GP63 favors parasite survival by degrading different molecules important to cell signaling and activation, modulating the macrophage's functions [12,13,14]. Lipophosphoglycan (LPG) is another Leishmania virulence factor that participates in the initial infection process of macrophages. LPG delays lysosome-to-phagosome fusion and the assembly of NADPH oxidase [15]. The lpg3 encodes a protein that belongs to an endoplasmic reticulum chaperone (HSP90) homologous to glucose-regulated protein 94 (GRP94) [16]. In Leishmania, LPG3 protein is involved with LPG synthesis and the production of GPI-anchored molecules [16]. Although the lpg3 gene is also expressed in the non-virulent Leishmania tarentolae [17], the protein LPG3 is immunogenic [18], modulates the host immune response [19] and is considered a virulence factor in Leishmania [20,21].
Currently, several studies have shown that these and other important virulence factors may be present in extracellular vesicles (EVs) spontaneously released by several species of Leishmania [22,23,24,25]. EVs are a complex and heterogenous group of particles released into the extracellular space by prokaryotic and eukaryotic cells [26]. These particles comprise a lipid bilayer and can carry proteins, glycoproteins, lipids, nucleic acids, and secondary metabolites from one cell to another [26]. According to their origin, size, and molecular constitution, EVs can generically be classified into exosomes and ectosomes. However, each EV group can still be subclassified into size and/or markers [27]. Our group and others showed that Leishmania EVs co-injected with the parasites participate in the progression of experimental cutaneous leishmaniasis, affecting the immune response favoring the parasite infection [23,25]. However, BALB/c mice immunized with EVs released by L. amazonensis promastigotes with different virulence profiles modulated the immune response and were partially protected from the progression of infection [28].
In this work, we better characterize parasites obtained after successive infection in animals (IVD-P) and cultured for long-term in vitro (LT-P). In addition, we evaluated the EVs released by these parasites, their influence on macrophage infection, and cytokine production. In vitro experiments were also carried out to assess the potential use of EVs as an adjuvant in the treatment of cutaneous leishmaniasis.
2. Materials and Methods
2.1. Parasites
The MHOM/BR/1973/M2269 strain of L. amazonensis was used in this study. Long-term parasites (LT-P) and in vivo-derived parasites (IVD-P) were obtained as previously described [28]. The parasites (promastigotes forms) were cultured at 26 °C in 199 medium (Gibco, Life Technologies, Grand Island, NY, United States) supplemented with 4.2 mM sodium bicarbonate, 4.2 mM HEPES, 1 mM adenine (Sigma, St. Louis, MO, United States), 5 µg/ml hemin (bovine type I) (Sigma), and 10 % fetal bovine serum (FBS) (Gibco). The cultures were maintained until the parasites reached stationary growth.
2.2. RNA Extraction
L. amazonensis promastigotes with distinct virulence profiles (LT-P and IVD-P) were subjected to RNA extraction using TRIzol® reagent, following the manufacturer's recommendations. RNAs were quantified in a spectrophotometer (Nanodrop 2000c, Thermo Fisher, Scientific Brand, Grand Island, NY, United States), and samples with 260/280 nm and 260/230 nm ratios between 1.8–2.0 were analyzed to integrity using 1.5 % agarose gel. RNA samples were stored at -80 ºC to avoid degradation.
2.3. Quantitative Reverse Transcriptase-Polymerase Chain Reaction
Quantitative reverse transcriptase-polymerase chain reaction (qRT-PCR) was employed to analyze the expression of RNAs extracted from LT-P and IVD-P. The recommendations of the Minimum Information for Publication of Quantitative Real-time PCR Experiments (MIQE) guidelines [29] were followed to guarantee the quality of results. First, samples with high integrity and quality to 260/280 and 260/2030 ratios were treated with DNAse (RQ1 RNase-free DNase; Promega, Madison, WI, United States) to avoid contamination with genomic DNA. Then, the cDNA synthesis was performed with the ProtoScript M-MuL V First Strand cDNA Synthesis Kit (New England Biolabs Inc., MA, United States). The treatment with DNAse and the cDNA preparation followed the manufacturer's instructions.
The real-time PCR reactions were performed using the Sybr Green reagent (Applied Biosystems, Thermo Fisher Scientific). The reverse transcription reaction was performed using 1 μl of cDNA, 5.0 μl of SYBR Green Master Mix (Thermo Fisher), and 2.0 μl of each oligonucleotide (1.0 μM). Real-time PCR reactions were performed in StepOne Plus equipment (Applied Biosystems), and the cycle parameters were as follows: 10 min at 50 °C for enzyme activation, denaturation for 5 min at 95 °C, and 40 cycles of 95 °C for 30 seg and 60 °C for 1 min. Internal negative controls were performed using cDNA prepared with RNA samples without adding the transcriptase reverse for cDNA preparations and using the reaction mix (SYBR Green Master Mix and each oligonucleotide) without cDNA template (no template control – NTC). In both cases, no amplifications were detected.
The following target genes were used: arginase (arg), glycoprotein 63 (gp63), heat shock protein 78 (hsp78), lipophosphoglycan 3 (lpg3), elongation factor 1-alpha (ef-1α), oligopeptidase B (oligo b), cysteine protease b (cpb), cysteine protease c (cpc). In addition, the α-tubulin (α-tub) was used as a housekeeping gene. All sequences are described in the Supplementary Table 1. The reaction quality based on the dissociation curves, and the results were analyzed using the StepOne software program (Applied Biosystems). To calculate the relative gene expression, the baseline was adjusted to two or three cycles before the detection of the fluorescent signal, and the cycle threshold (CT) was determined (CT is the number in which the cycle reached the fluorescence threshold line, value above the background). The evaluated CT was always in the exponential phase of the amplification to increase the accuracy of measurement of transcripts in the sample. The CT values of the target genes and the α-tub were used to calculate ΔCT. The 2-ΔΔCT is the value representing the relative expression of the analyzed gene.
Before the gene expression assays, the efficiencies of all primers were evaluated by constructing standard curves with four or five different points of the dilution using reference samples. The CT values of each dilution point were used to build the standard curve and to calculate the efficiency of primers using the equation E = 10(-1/slope)-1 (E corresponds to the efficiency, and slope is the slope of the standard curve). Then, the efficiencies of primers of target genes and α-tub were compared.
All experiments were performed in triplicates with at least three biological samples. Differences in the relative expression levels of target genes (fold change) were determined by comparing LT-P as reference samples (control) with IVD-P. The gene expression for the reference sample was adjusted to 1.
2.4. Phagocytosis Assay
The murine macrophage lineage RAW 264.7 was cultured in Roswell Park Memorial Institute (RPMI) 1640 medium (ThermoFisher) supplemented with 2 mM L-glutamine, 25 mM 4-(2-hydroxyethyl)-1-piperazineethanesulfonic acid (HEPES) and added with 10% FBS (Gibco). Cultures were maintained in a humid atmosphere with 5% CO2 up to 90% confluence. Then, 1×10⁵ cells/well were seeded in 24-well plates. Macrophage cultures were infected with L. amazonensis LT-P or IVD-P promastigotes in the stationary phase, suspended in RPMI 1640 medium plus 10% FBS at a ratio of 10 parasites to 1 cell (multiplicity of infection - MOI 10:1). After 3 h of contact, non-internalized parasites were removed by washing with serum-free RPMI medium and cultures were incubated for 24 h in a humidified atmosphere at 33 °C in 5% CO2. Then, the supernatants were removed, the cells stained with hematoxylin and eosin (Panotic Kit), and the percentage of infection and the number of internalized parasites were evaluated by observation under the light microscope. Each experimental group was performed in triplicate, and 100 cells were counted per slide in random fields.
2.5. Obtaining Extracellular Vesicles of L. amazonensis Promastigotes
Parasites were cultured as promastigotes until the stationary phase. Then, EVs were obtained as described by [25]. Briefly, 108 parasites/mL were added to 1.5 mL microtubes containing RPMI medium added with 2% glucose and kept at 26 °C for 4 h. Afterward, the microtubes were centrifuged to separate the parasite from the supernatant containing the EVs. Next, the supernatant was subjected to several cycles of centrifugation and ultracentrifugation: 500 × g for 10 min at 4 °C, 1,500 × g for 10 min at 4 °C, 10,000 × g for 10 min at 4 °C to remove cellular debris. Then, the supernatant was ultracentrifuged at 100,000 × g for 1 h [30]. Finally, the pellet formed was diluted in phosphate-buffered saline (PBS) and centrifuged at 100,000 × g for 1 h. The pellet contains EVs that were diluted in sterile filtered PBS and stored at -20 °C.
EVs were analyzed by nanoparticle tracking analysis (NTA) and flow cytometry. NTA was performed using Nanosight NS300 equipment (Malvern Instruments Ltd., Malvern, United Kingdom). First, approximately 1 mL of PBS was injected into the equipment to eliminate interferences, and then 1 mL of each sample diluted 10- to 100-fold in sterile PBS was analyzed. Data were collected under the following conditions: images were captured in triplicate, 30 s/capture, camera level set to 14, and were used the same threshold along all analyses. NTA software version 2.3 build 0017 was used to analyze all images. EVs were also analyzed by flow cytometry. Briefly, unstained EVs were resuspended in 400 μL of washing buffer, and samples acquired on a Symphony A1 flow cytometer (BD Bioscience, San Jose, CA, USA) and FACSDiva software (BD). Then, megamix beads (BD) with sizes ranging from 160 to 500 nm were used as a parameter to evaluate the size profile in EVs released by LT-P and IVD-P parasites. All data were collected on the small particle scatter detector for the scatter channel (SP SSC). Acquired data were analyzed using FlowJo software (FlowJo, FlowJo™ Software for Mac, Ashland, OR, USA).
2.6. L. amazonensis EVs Labelling with PKH26
L. amazonensis EVs from LT-P and IVD-P parasites were stained with the cell membrane fluorescent marker PKH26 (Sigma), according to the manufacturer's instructions. Briefly, 4 × 10⁷ EVs of each sample was diluted in 1 mL PBS. Then, 2 µL of the cell membrane fluorescent marker PKH26 was diluted in 498 µL of Reagent C and added in each sample. After incubation for 30 min at 37 °C, 500 µL of sterile PBS was added. The samples were ultracentrifuged for 16 h, the supernatant was discarded, and the pellet was resuspended in 500 µL of RPMI medium plus 10 % FBS (FBS were previously ultracentrifuged for 8 h to remove FBS-EVs). The same procedure was performed using only PBS in the absence of L. amazonensis EVs (negative control). Parasites stained with PKH26 were used as positive control.
2.7. Uptake of EVs by Macrophages
RAW 264.7 cell cultures were seeded in 24-well plates at a density of 1 × 10⁵/well. After 2 h, cells were treated with a ratio of 100 EVs stained with PKH26 per macrophage. The negative control was given as macrophages without EVs, and a second control by macrophages incubated with EVs not labeled with PKH26. Cultures were incubated for 24 h at 37 °C in a 5% CO2 atmosphere. After incubation, the supernatants were removed, and 300 µL of 1 mM ethylenediaminetetraacetic acid (EDTA) was added to each well to detach the cells. After 1 min at room temperature, the wells were scraped, and their contents were transferred to 1.5 mL microtubes. Samples were centrifuged for 5 min at 1,200 × g. The supernatant was removed, and the pellet was resuspended in 500 µL of sterile PBS for flow cytometry or confocal microscopy analyses.
FACSCalibur flow cytometer (BD) was used to acquire and analyze cell percentages labeled with EVs stained with PKH26. The CellQuest software was used for data acquisition, and statistical analysis was performed using FlowJo software.
The microscopy images were obtained using a confocal microscope (SP8 Lightning, Leica Microsystems). For this proposal, RAW 264.7 treated with PKH26-labeled EVs were fixed with cold methanol for 1 minute, permeabilized with 0.05 % Triton X-100 for 10 min at room temperature (RT), and additionally stained with 300 nM 4',6'-diamino-2-phenyl-indole (DAPI) by 10 min at RT. Then, macrophages were distributed into wells of adapted slides for analysis under a confocal microscope. Images were analyzed using ImageJ analysis software (version 1.53i) through corrected total cell fluorescence (CTCF).
2.8. Cytokine Production
The cytokine production by macrophages was evaluated using a cytometric beads array (Mouse Inflammation kit - CBA, BD Bioscience). The supernatants of macrophage cultures were used to evaluate the presence of the inflammatory cytokines. Reactions were carried out according to the manufacturer's instructions. Samples were acquired in a FACSCalibur (BD) flow cytometer. Cytokine analysis was performed by calculating the standard curve for each cytokine. Data were expressed in pg/mL. All analyses were performed using the FCAPArray (BD) software.
2.9. NO Production
NO production was analyzed after incubation of macrophages with EVs from LT-P or IVD-P parasites for 24 h at 37 °C in a 5% CO2 atmosphere. The wells were washed with PBS, and the fluorescent reactive species marker 4,5-diaminofluorescein diacetate (DAF 2-DA) (Sigma) was added at a final concentration of 5 µM. The plate was protected from light and incubated at 37 °C with 5 % CO2 for 30 min. The wells were washed with PBS, and 300 µL of RPMI was distributed per well. The plate was protected from light and incubated at 37 °C with 5% CO2 for 30 min. The wells were washed with PBS, 300 µL EDTA 1 mM was added per well, and the plate was incubated for 5 min. After the period, the adhered cells were detached and centrifuged at 2,000 × g for 5 min at 4°C. The supernatants were discarded, and the pellet was resuspended in 500 µL of PBS for analysis on the FACSCalibur flow cytometer.
2.10. Macrophages Treatment with EVs
The RAW 264.7 cells were infected after the treatment with EVs. To this purpose, macrophages were treated with EVs (100 particles/cell) for 24 h, following the same conditions described above. Then, macrophages were infected with the correlate parasites MOI 10:1 (LT-P or IVD-P), and the cultures were maintained for 24 h in RPMI medium added with 10% FBS in a humidified atmosphere at 33 °C in 5 % CO2. The supernatants were collected, and the cytokine production was evaluated by CBA. Cells were stained to determine the percentage of infection and the number of internalized parasites (Figure 1). The following controls were used: (1) macrophages untreated and uninfected; (2) macrophages untreated and infected with the parasites; (3) macrophages stimulated with LPS. Each experimental group was performed in triplicate.
2.11. Treatment of RAW 264.7 Macrophages Infected with L. amazonensis Promastigotes
To assess the effect of EVs as an adjuvant in the treatment with reference drugs for leishmaniasis, macrophages were infected with LT-P or IVD-P promastigotes for 24 h. Then, cultures were treated with 3 concentrations of Amphotericin b (Sigma) or Pentamidine (Sigma) in the presence or absence of EVs from LT-P or IVD-P (100 EVs/macrophage). After 24 h, the culture supernatants were removed, and the cells were stained to assess the percentage of infection and the number of internalized parasites (Figure 2).
2.12. Statistical Analysis
Statistical analyses were performed using analysis of variance (ANOVA) followed by the Tukey test using GraphPad Prism 3.0 version 8.3.0 for Windows (GraphPad Software, La Jolla, CA, United States). In addition, the Student's t-test was used to determine the statistical significance between the two groups. All experiments were performed at least twice with triplicate groups.
3. Results
3.1. After Animal Infection, L. amazonensis Showed an Increase in lpg3 and gp63 Expression and Higher Infection in Macrophages
Real time PCR (qRT-PCR) was performed to evaluate the differential gene expression of 8 classic virulence factors in L. amazonensis submitted to 3 consecutive animal infections (IVD-P). Our results showed that IVD-P has a significantly higher expression of lpg3 and gp63 genes compared to L. amazonensis cultured for long-term in vitro LT-P (Figure 3). No statistical differences were observed in the gene expression of arg, cpc, cbp, hsp78, ef1-α, and oligo-b genes comparing LT-P and IVD-P (Figure 3).
In addition, the ability to infect macrophages was evaluated in parasites recovered after animal infection (IVD-P) and cultured for long-term in vitro (LT-P). Phagocytosis assays showed a significantly higher percentage of infection (Figure 4A) and internalized parasites (Figure 4B) in macrophages infected with IVD-P compared to those infected with LT-P. Figure 4C and Figure 4D are representative images of the RAW 264.7 macrophages infected with L. amazonensis LT-P and IVD-P, respectively.
3.2. Morphological and Functional Analysis of EVs Released by L. amazonensis Promastigotes before and after Animal Infection
EVs produced by LT-P and IVD-P were evaluated by NTA analysis for size and concentration (Figure 5A). No significant differences were observed comparing size or concentration in EVs released by LT-P and IVD-P. In addition, EVs size profile were also characterized using flow cytometry (Figure 5B). Like the results obtained by NTA, there were no significant differences on the size profile comparing EVs released by LT-P and IVD-P (Figure 5B).
The uptake of EVs by macrophages was analyzed by flow cytometry and confocal microscopy. First, EVs from LT-P and IVD-P were labeled with the fluorescent marker PKH26. Figure 5C shows a significant percentage of cells positive to PKH26 in groups incubated with stained EVs, compared to the negative control (P<0.0001). The group treated with LT-P EVs showed a significantly higher percentage of PKH26-positive cells than those treated with IVD-P (P<0.0001). Figure 5E,F show by confocal microscopy the presence of fluorescent marker PKH26 inside RAW 264.7 exposed to stained EVs, suggesting the incorporation of these particles by cells.
Macrophages stimulated with LT-P EVs showed a significant increase in IL-6, IL-10, MCP-1, and TNF-α production compared to the control (Figure 6A–D, respectively). EVs from IVD-P did not induce significant production of any of the cytokines analyzed (Figure 6A–D). The cytokines IFN-γ and IL-12p70 were not detected in the culture supernatants. Similar effects were observed in the NO production. There was a significant increase in the fluorescence intensity after adding DAF-2DA (NO fluorescence probe) in cells stimulated with LT-P EVs, compared to control. No significant increase in NO production was observed in cells stimulated with EVs from IVD-P (Figure 6E).
3.3. The Macrophage Infection and Cytokine Production after Treatment with EVs Are Influenced by Virulence
Previous stimulation with EVs led to a significant increase in macrophage infection (Figure 7A) and the number of internalized parasites in groups treated with LT-P EVs (Figure 7B). On the other hand, there was no change in the number of internalized parasites in groups treated with IVD-P EVs (Figure 7B).
The cytokines IL-6, TNF-α, and MCP-1 showed significantly higher levels in the groups treated with LT-P EVs and infected with LT-P than in untreated and uninfected groups (Figures 8A, 8B, and 8C). Macrophages previously treated with EVs from parasites recovered from animal infection (EVs from IVD-P) and infected with the cognate parasite (IVD-P) were unable to increase the production of pro- or anti-inflammatory cytokines (Figure 8A–C). The cytokines IL-10, IFN-γ, and IL-12p70 were not detected in any of the groups evaluated.
3.4. EVs Had no Synergistic Effect on RAW 264.7 Macrophages Infected with L. amazonensis Treated with Pentamidine or Amphotericin b
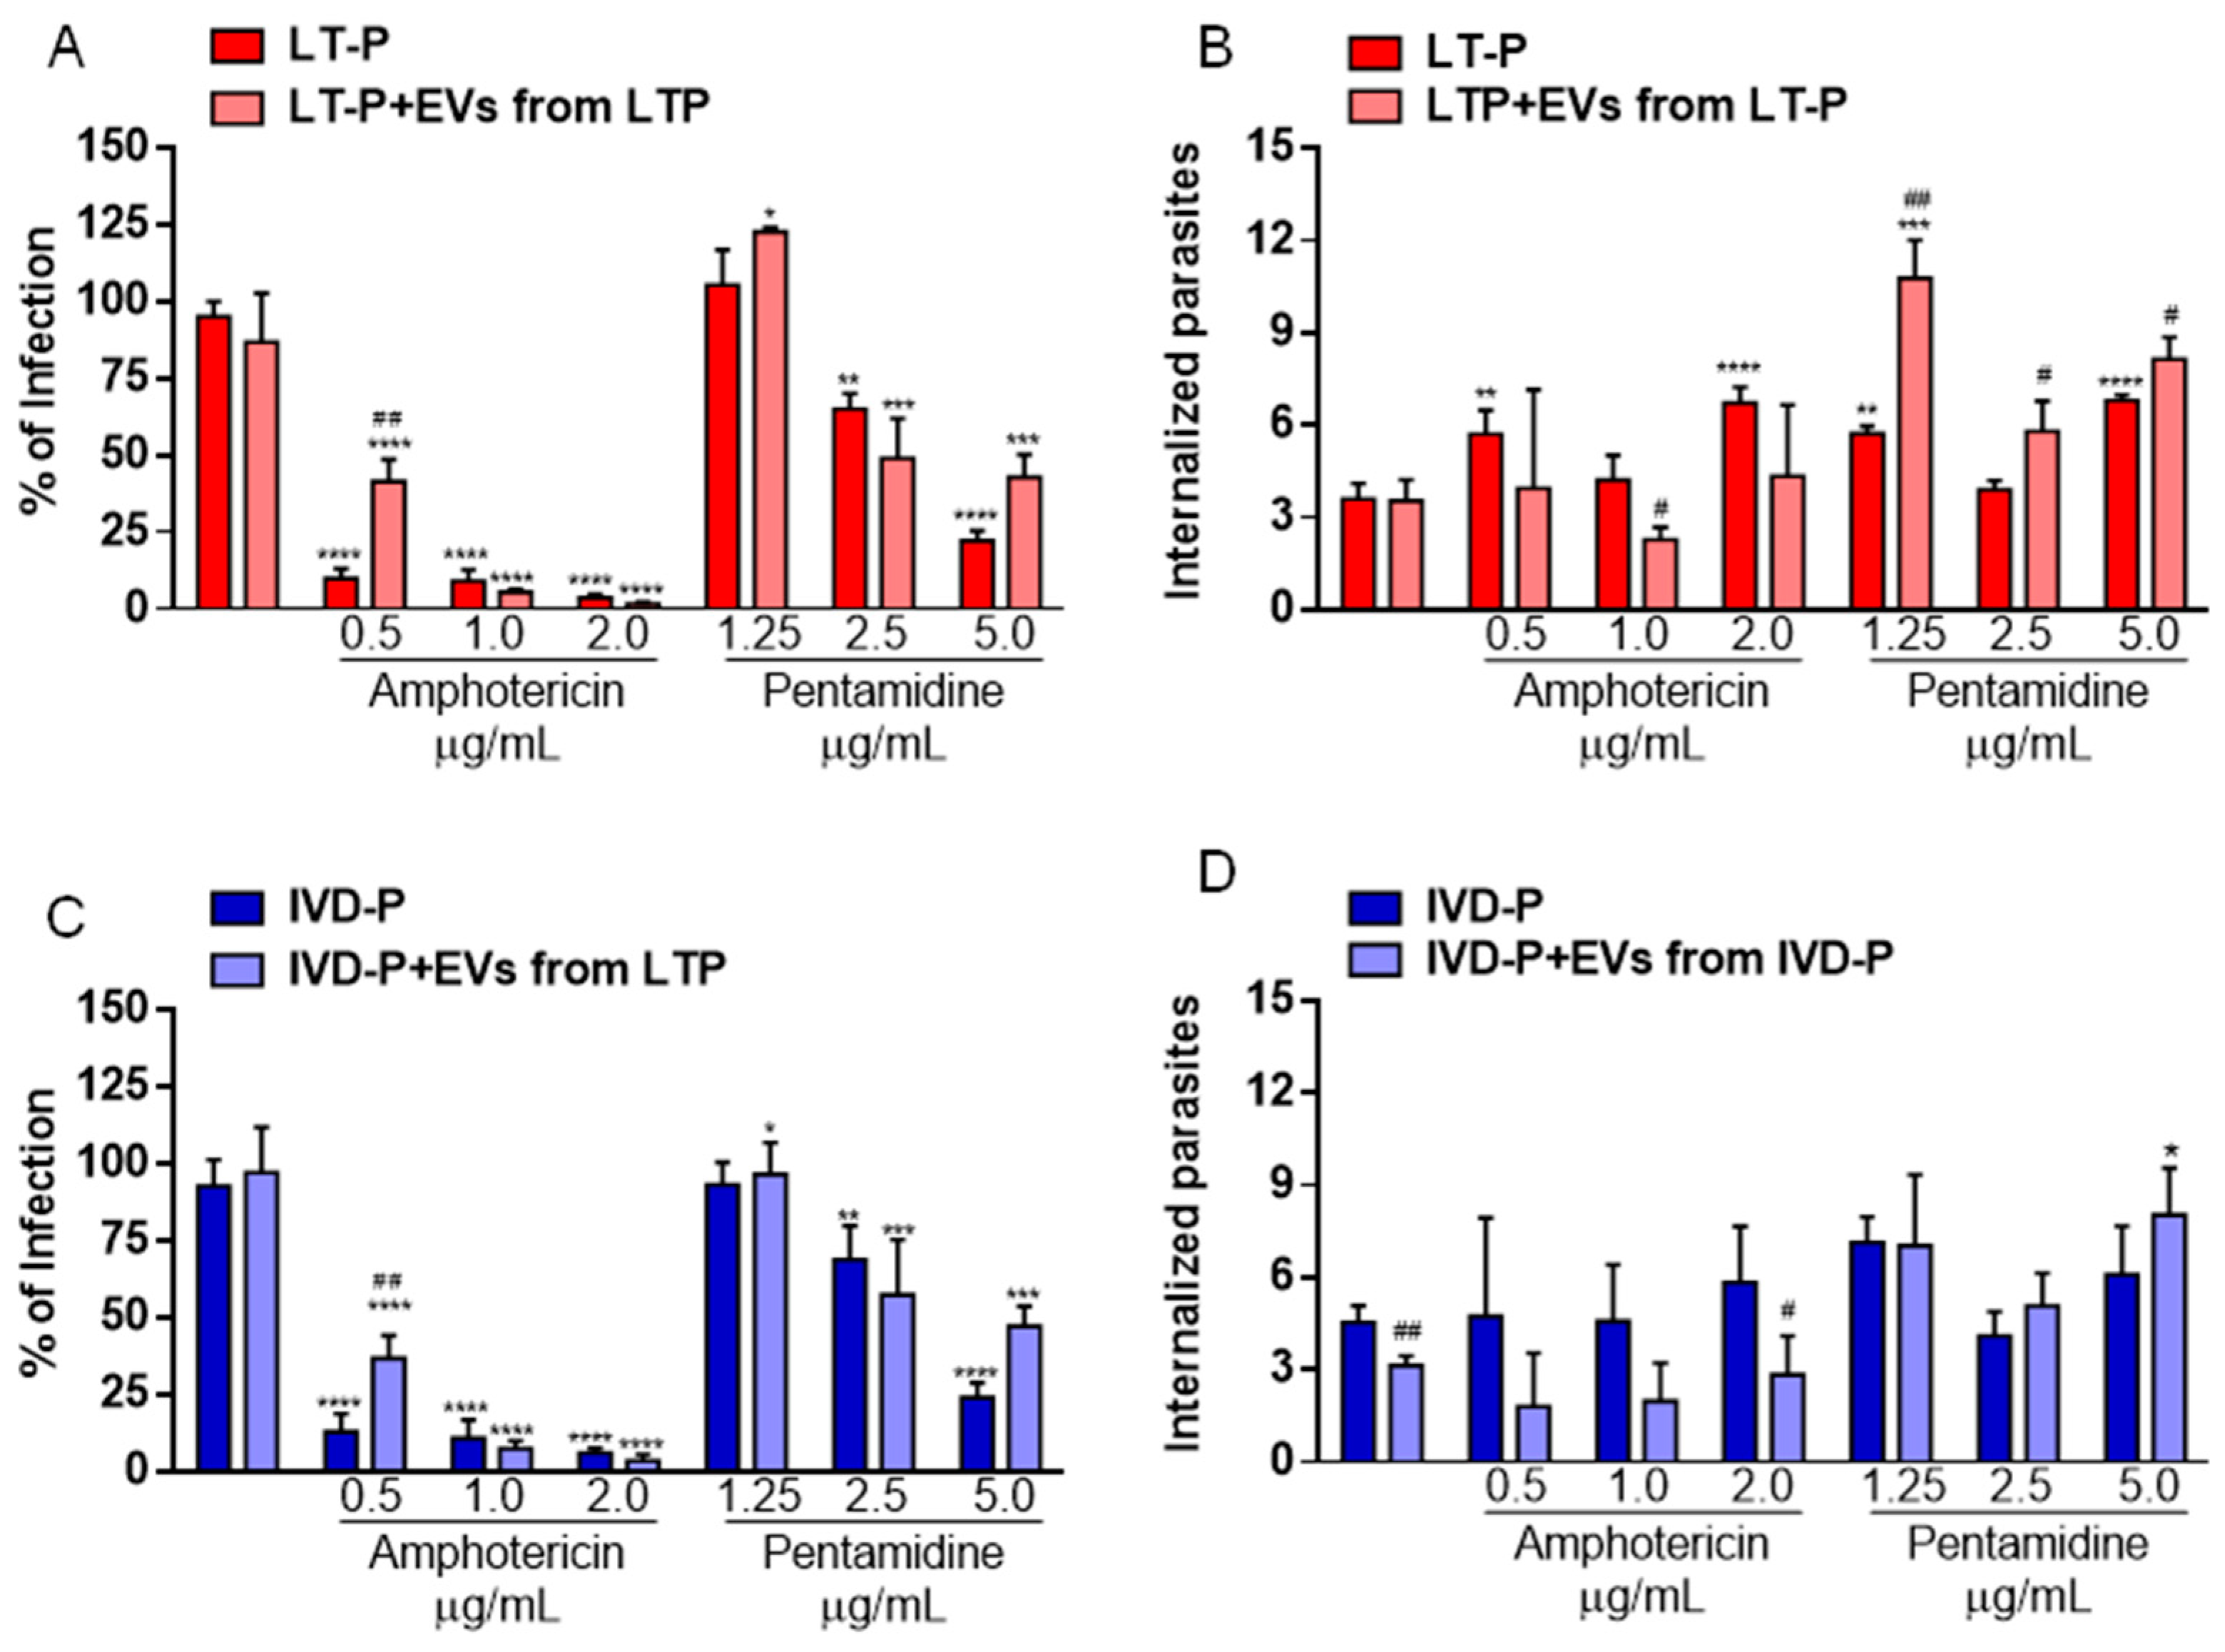
There were no changes in the percentage of infected cells and the number of internalized parasites in groups treated with EVs from LT-P alone (Figure 9A,B). However, at the concentration of 0.5 µg/mL of Amphotericin b and 5.0 µg/mL of Pentamidine, EVs increased the percentage of infection in macrophages infected with LT-P (Figure 9A). Considering the number of internalized parasites, it was observed that the presence of LT-P EVs significantly reversed the effect of Pentamidine in groups infected with LT-P parasites leading to an increase in the number of internalized parasites in groups treated with those EVs (Figure 9B).
In macrophage groups infected with IVD-P and treated with IVD-P EVs, it was observed that the percentage of infection had similar results to those observed in the groups infected with LT-P and treated with LT-P (Figure 9C). Macrophages infected with IVD-P and treated with 0.5 µg/mL of Amphotericin b in the presence of EVs from IVD-P increased the percentage of infection compared with groups not treated with EVs (Figure 9C). A similar effect was observed when cells were treated with 5.0 µg/mL of Pentamidine in the presence of IVD-P EVs (Figure 9C). Considering the number of internalized parasites, a significant reduction was observed in the group treated only with IVD-P EVs and in the group treated with 2.0 ug/mL of Amphotericin b (Figure 9D). In treatment with Pentamidine, an increase in internalized parasites was observed in the group treated with IVD-P EVs and 5.0 ug/mL of the drug.
4. Discussion
Several studies have shown that long-term culture of L. infantum, L. major, and L. amazonensis alters the expression of virulence factors, changes the parasite metabolism, and impairs their ability to infect mice [28,31,32,33,34]. Although these studies are still in their infancy, they shed light on the importance of evaluating the loss of infectivity of Leishmania after a long period of culture in vitro.
In this work, we showed that after successive passages in animals, L. amazonensis promastigotes (IVD-P) increased the expression of lpg3 and gp63 (two important virulence factors), as compared to parasites submitted to long-term in vitro culture (LT-P). In addition, macrophages infected with IVD-P showed a higher percentage of infection and the number of parasites internalized compared to cells infected with LT-P. Previous studies from our group, showed that EVs from L. infantum BA262 LPG-deficient mutant (1lpg1) (LPG-KO) did not affected NO and cytokine production by murine macrophages. However, alike EVs from the present work, EVs from L. amazonensis (Ba125 strain) were also very pro-inflammatory for murine macrophages via TLR4/TLR2 [35]. Furthermore, prolonged expression of LPG by Leishmania after infection of some cell types can have a role in the intracellular survival of the parasite [36]. Thus, it is plausible to suppose that the higher expression of lpg3 gene observed in IVD-P promastigotes is related to the increased amount of parasites observed in infected macrophages.
Besides lpg3, IVD-P also showed an increase in gp63 expression, a metalloprotease with pleiotropic functions in Leishmania infection [14]. IVD-P promastigotes infected macrophages more efficiently than LT-P promastigotes, suggesting that virulence factors can contribute to IVD-P infectivity. This hypothesis is highly speculative, but studies with parasites that lost one of these two virulence factors showed a decrease in their ability to infect macrophages and mice [37,38,39]. In addition, [34] showed that the L. amazonensis cultured for a long-term was less infective in vitro compared to parasites recently recovered from in vivo infection. Therefore, it is important to highlight the importance of carrying out studies with virulent parasites since their passage for long periods in culture can alter the phenotypic and infective characteristics of the parasites.
EVs have played an important role in the Leishmania-host relationship, but several issues remain unclear. Given that virulence factors can also be present in EVs released by Leishmania [25,28,40], we investigated the influence of EVs in early macrophage infection. First, we demonstrated that macrophages uptake EVs from LT-P and IVD-P parasites. However, RAW 264.7 cells treated with LT-P EVs showed higher labeling percentages than those treated with IVD-P EVs, suggesting that LT-P EVs may be more easily uptake by macrophages. In addition, macrophages produced higher levels of TNF-α, IL-6, IL-10, and NO after stimulation with LT-P EVs compared to the treatment with IVD-P EVs. Thus, our data suggest that EVs released by L. amazonensis with a higher virulence profile can subvert the macrophage response and impair the production of inflammatory cytokines. In fact, a study with EVs from L. donovani HSP100 KO parasite showed differences in cytokines production by macrophages compared to cells stimulated with EVs from wild-type parasites. A recent study showed that EVs from L. amazonensis expressing different levels of gp63 (high or low expression) differently induce TNF-α expression in immortalized bone marrow macrophages [40]. Thus, the protein composition of EVs can influences the response of macrophages. We hypothesize that EVs released by L. amazonensis with different virulence profiles may have qualitatively and/or quantitatively different compositions, which can influence the macrophage response (phagocytosis and cytokine production). Thus, after consecutive infections in animals, L. amazonensis increases the expression of some virulence factors and improve its capacity to infect macrophages.
A second step was to evaluate the infection by L. amazonensis in macrophages previously treated with EVs. Our data showed that pretreatment with EVs led to increased susceptibility to parasite infection, suggesting that EVs could have a role in the permissiveness of the macrophages to infection. On the other hand, high levels of inflammatory cytokines were maintained in cells treated with LT-P EVs and infected with the correspondent parasite, suggesting that LT-P EVs have a strong capacity to induce an inflammatory profile. Although the exact differences between the cargo of LT-P and IVD-P vesicles have not been characterized, our laboratory showed differences in the presence of GP63 and LPG in these EVs [28]. Furthermore, in an animal immunization model, vesicles from LT-P showed a more significant protective effect and a higher IFN-γ production, compared to animals immunized with IVD-P EVs [28]. The ability of LT-P EVs to induce a strong early inflammatory response in macrophages may partially have contributed to their protective effect in immunized animals, suggesting a possible application of these EVs in developing a vaccine for cutaneous leishmaniasis.
Considering that LT-P EVs stimulated an inflammatory profile in macrophages, we evaluated the possibility of using these EVs to treat macrophages infected with L. amazonensis. EVs carry several bioactive molecules capable of interacting with different cell types and altering their functionality, bringing their potential application in treating specific diseases [41]. There are several examples of EVs derived from mesenchymal cells that have been evaluated to the cancer treatment and other non-chronic diseases [42,43]. In parasites, it was demonstrated the potential application of Fasciola hepatica EVs for treating colitis [44] and EVs released by dendritic cells to treat Trypanosoma cruzi [45]. Our work showed that macrophages infected with L. amazonensis and subsequently treated with EVs did not alter the parasite load inside macrophages. Furthermore, the treatment of infected macrophages with both EVs and reference drugs also did not show a reduction in the parasite load. Interestingly, at some concentrations of the drug a decrease in their anti-Leishmania effect was observed, with an increase in the parasite load, compared to cells treated in the absence of EVs. These data corroborate our previous results that the co-injection of L. amazonensis EVs and parasites led to an increase in the parasite load and modulated the immune response to a Th2 profile [25]. Although cells infected with the parasite and subsequently treated with EVs did not change the parasite load, using EVs to treat of animals with an established infection (lesions) is still a point to be studied. In an in vivo infection, the role of EVs can be different and contribute to a favorable outcome since cells and molecules of the immune system can interact in a complex way, leading to different activations of the response. This point should be addressed in future studies.
5. Conclusions
In conclusion, this study showed that L. amazonensis with different virulence profiles expressed lpg3 and gp63 differently. In addition, these parasites showed different abilities to infect macrophages. EVs released by parasites improved their ability to infect macrophages, and EVs produced by attenuated parasites (LT-P) stimulated the production of inflammatory cytokines by macrophages. However, there were no synergisms between parasite EVs and reference drugs to eliminate parasites previously internalized by macrophages.
Supplementary Materials
The following supporting information can be downloaded at: www.mdpi.com/xxx/s1, Table S1: Sequences of primers used for qRT-PCR reaction.
Author Contributions
Methodology, formal analysis, investigation, visualization, R.C.Z., I.C.S.P., A.S.V.; Methodology, formal analysis, A.C.C.M., A.C.C.; resources, writing (review & editing), A.C.T., R.P.S., W.L.B.; formal analysis, resources, writing (original draft preparation) conceptualization, formal analysis, resources, writing (original draft preparation), visualization, supervision, project administration, funding acquisition, P.X.
Funding
This research was funded by FUNDAçãO DE AMPARO à PESQUISA DO ESTADO DE SãO PAULO (FAPESP), grant number 2019/21614-3, and CONSELHO NACIONAL DE DESENVOLVIMENTO CIENTÍFICO E TECNOLÓGICO (CNPq), grant number 312419/2021-0. Scholarships were provided by CNPq, AND COORDENAçãO DE APERFEIçOAMENTO DE PESSOAL DE NíVEL SUPERIOR (CAPES) - Financing Code 001.
Acknowledgments
The authors are grateful to Professor Caroline Marcantonio Ferreira for assistance with the flow cytometer and acknowledge FAPESP, multi-user equipment grant, grant number 2022/08144-0. We are indebted to Laboratório de Microscopia Confocal – UNIFESP campus Diadema for assistance with confocal microscopy images.
Conflicts of Interest
The authors declare no conflict of interest.
References
- World Health Organization (WHO), Control of the Leishmaniases. https://www.who.int/health-topics/leishmaniasis. (accessed on 30/10/2023).
- Burza, S.; Croft, S.L.; Boelaert, M. Leishmaniasis. Lancet 2018, 392, 951–970. [Google Scholar] [CrossRef] [PubMed]
- Kamhawi, S. The yin and yang of leishmaniasis control. PLoS Negl. Trop. Dis. 2017, 11, e0005529. [Google Scholar] [CrossRef] [PubMed]
- De Rycker, M.; Wyllie, S.; Horn, D.; Read, K.D.; Gilbert, I.H. Anti-trypanosomatid drug discovery: Progress and challenges. Nat. Rev. Microbiol. 2023, 21, 35–50. [Google Scholar] [CrossRef] [PubMed]
- Kumari, D.; Perveen, S.; Sharma, R.; Singh, K. Advancement in leishmaniasis diagnosis and therapeutics: An update. Eur. J. Pharmacol. 2021, 910, 174436. [Google Scholar] [CrossRef] [PubMed]
- de Menezes, J.P., E. M. Saraiva, and B. da Rocha-Azevedo, The site of the bite: Leishmania interaction with macrophages, neutrophils and the extracellular matrix in the dermis. Parasit. Vectors 2016, 9, 264. [Google Scholar] [CrossRef] [PubMed]
- Costa-da-Silva, A.C.; Nascimento, D.O.; Ferreira, J.R.M.; Guimarães-Pinto, K.; Freire-de-Lima, L.; Morrot, A.; Decote-Ricardo, D.; Filardy, A.A.; Freire-de-Lima, C.G. Immune Responses in Leishmaniasis: An Overview. Trop. Med. Infect. Dis. 2022, 7, 54. [Google Scholar] [CrossRef] [PubMed]
- Orikaza, C.M.; Pessoa, C.C.; Paladino, F.V.; Florentino, P.T.V.; Barbiéri, C.L.; Goto, H.; Ramos-Sanchez, E.M.; Franco da Silveira, J.; Rabinovitch, M.; Mortara, R.A.; et al. Dual Host-Intracellular Parasite Transcriptome of Enucleated Cells Hosting Leishmania amazonensis: Control of half-life of host cell transcripts by the parasite. Infect. Immun. 2020, 88, 11. [Google Scholar] [CrossRef] [PubMed]
- Isnard, A.; Shio, M.T.; Olivier, M. Impact of Leishmania metalloprotease GP63 on macrophage signaling. Front. Cell Infect. Microbiol. 2012, 2, 72. [Google Scholar] [CrossRef] [PubMed]
- Guay-Vincent, M.M.; Matte, C.; Berthiaume, A.M.; Olivier, M.; Jaramillo, M.; Descoteaux, A. Revisiting Leishmania GP63 host cell targets reveals a limited spectrum of substrates. PLoS Pathog. 2022, 18, e1010640. [Google Scholar] [CrossRef]
- Brittingham, A.; Morrison, C.J.; McMaster, W.R.; McGwire, B.S.; Chang, K.P.; Mosser, D.M. Role of the Leishmania surface protease gp63 in complement fixation, cell adhesion, and resistance to complement-mediated lysis. J. Immunol. 1995, 155, 3102–3111. [Google Scholar] [CrossRef]
- Gomez, M.A.; Contreras, I.; Hallé, M.; Tremblay, M.L.; McMaster, R.W.; Olivier, M. Leishmania GP63 alters host signaling through cleavage-activated protein tyrosine phosphatases. Sci. Signal 2009, 2, ra58. [Google Scholar] [CrossRef] [PubMed]
- Contreras, I.; Gómez, M.A.; Nguyen, O.; Shio, M.T.; McMaster, R.W.; Olivier, M. Leishmania-induced inactivation of the macrophage transcription factor AP-1 is mediated by the parasite metalloprotease GP63. PLoS Pathog. 2010, 6, e1001148. [Google Scholar] [CrossRef] [PubMed]
- Atayde, V.D.; Hassani, K.; da Silva Lira Filho, A.; Borges, A.R.; Adhikari, A.; Martel, C.; Olivier, M. Leishmania exosomes and other virulence factors: Impact on innate immune response and macrophage functions. Cell Immunol. 2016, 309, 7–18. [Google Scholar] [CrossRef] [PubMed]
- Lodge, R.; Diallo, T.O.; Descoteaux, A. Leishmania donovani lipophosphoglycan blocks NADPH oxidase assembly at the phagosome membrane. Cell Microbiol. 2006, 8(12), 1922–1931. [Google Scholar] [CrossRef] [PubMed]
- Descoteaux, A.; Avila, H.A.; Zhang, K.; Turco, S.J.; Beverley, S.M. Leishmania LPG3 encodes a GRP94 homolog required for phosphoglycan synthesis implicated in parasite virulence but not viability. EMBO J. 2002, 21, 4458–4469. [Google Scholar] [CrossRef] [PubMed]
- Azizi, H.; Hassani, K.; Taslimi, Y.; Najafabadi, H.S.; Papadopoulou, B.; Rafati, S. Searching for virulence factors in the non-pathogenic parasite to humans Leishmania tarentolae. Parasitology 2009, 136, 723–735. [Google Scholar] [CrossRef] [PubMed]
- Larreta, R.; Guzman, F.; Patarroyo, M.E.; Alonso, C.; Requena, J.M. Antigenic properties of the Leishmania infantum GRP94 and mapping of linear B-cell epitopes. Immunol. Lett. 2002, 80, 199–205. [Google Scholar] [CrossRef] [PubMed]
- Hosseini, M.; Haji-Fatahaliha, M.; Miahipour, A.; Yousefi, M. New insights to structure and immunological features of Leishmania lipophosphoglycan3. Biomed. Pharmacother. 2017, 95, 1369–1374. [Google Scholar] [CrossRef]
- Beverley, S.M.; Turco, S.J. Lipophosphoglycan (LPG) and the identification of virulence genes in the protozoan parasite Leishmania. Trends Microbiol. 1998, 6, 35–40. [Google Scholar] [CrossRef]
- Martins, T.V.F.; Zeraik, A.E.; Alves, N.O.; de Oliveira, L.L.; de Oliveira Mendes, T.A.; DeMarco, R.; de Almeida Marques-da-Silva, E. Lipophosphoglycan 3 from Leishmania infantum chagasi binds heparin with micromolar affinity. Bioinform. Biol. Insights 2018, 12, 1177932218763363. [Google Scholar] [CrossRef]
- Dong, G.; Wagner, V.; Minguez-Menendez, A.; Fernandez-Prada, C.; Olivier, M. Extracellular vesicles and leishmaniasis: Current knowledge and promising avenues for future development. Mol. Immunol. 2021, 135, 73–83. [Google Scholar] [CrossRef] [PubMed]
- Atayde, V.D.; Aslan, H.; Townsend, S.; Hassani, K.; Kamhawi, S.; Olivier, M. Exosome Secretion by the Parasitic Protozoan Leishmania within the Sand Fly Midgut. Cell Rep. 2015, 13, 957–967. [Google Scholar] [CrossRef] [PubMed]
- Silverman, J.M.; Clos, J.; de'Oliveira, C.C.; Shirvani, O.; Fang, Y.; Wang, C.; Foster, L.J.; Reiner, N.E. An exosome-based secretion pathway is responsible for protein export from Leishmania and communication with macrophages. J. Cell Sci. 2010, 123, 842–852. [Google Scholar] [CrossRef] [PubMed]
- Barbosa, F.M.C.; Dupin, T.V.; Toledo, M.D.S.; Reis, N.F.D.C.; Ribeiro, K.; Cronemberger-Andrade, A.; Rugani, J.N.; De Lorenzo, B.H.P.; Novaes, E.; Brito, R.R.; et al. Extracellular vesicles released by Leishmania ( Leishmania) amazonensis promote disease progression and induce the production of different cytokines in macrophages and B-1 cells. Front. Microbiol. 2018, 9, 3056. [Google Scholar] [CrossRef] [PubMed]
- Théry, C.; Witwer, K.W.; Aikawa, E.; Alcaraz, M.J.; Anderson, J.D.; Andriantsitohaina, R.; Antoniou, A.; Arab, T.; Archer, F.; Atkin-Smith, G.K.; et al. Minimal information for studies of extracellular vesicles 2018 (MISEV2018): A position statement of the International Society for Extracellular Vesicles and update of the MISEV2014 guidelines. J Extracell Vesicles 2018, 7, 1535750. [Google Scholar] [CrossRef] [PubMed]
- Kalluri, R.; LeBleu, V.S. The biology, function, and biomedical applications of exosomes. Science 2020, 367, eaau6977. [Google Scholar] [CrossRef] [PubMed]
- Dupin, T.V.; Reis, N.F.C.; Perez, E.C.; Soares, R.P.; Torrecilhas, A.C.; Xander, P. Long-term in vitro passaging had a negligible effect on extracellular vesicles released by Leishmania amazonensis and induced protective immune response in BALB/c Mice. J. Immunol. Res. 2021, 2021, 7809637. [Google Scholar] [CrossRef] [PubMed]
- Bustin, S.A.; Benes, V.; Garson, J.A.; Hellemans, J.; Huggett, J.; Kubista, M.; Mueller, R.; Nolan, T.; Pfaffl, M.W.; Shipley, G.L.; et al. The MIQE guidelines: Minimum information for publication of quantitative real-time PCR experiments. Clin. Chem. 2009, 55, 611–622. [Google Scholar] [CrossRef] [PubMed]
- Cronemberger-Andrade, A.; Aragão-França, L.; de Araujo, C.F.; Rocha, V.J.; Borges-Silva, M. a. C.; Figueira, C.P.; Figueiras, C.P.; Oliveira, P.R.; de Freitas, L.A.; Veras, P.S.; et al. Extracellular vesicles from Leishmania-infected macrophages confer an anti-infection cytokine-production profile to naïve macrophages. PLoS Negl. Trop. Dis. 2014, 8, e3161. [Google Scholar] [CrossRef]
- Grimm, F., R. Brun, and L. Jenni, Promastigote infectivity in Leishmania infantum. Parasitol. Res. 1991, 77, 185–191. [Google Scholar] [CrossRef]
- Segovia, M.; Artero, J.M.; Mellado, E.; Chance, M.L. Effects of long-term in vitro cultivation on the virulence of cloned lines of Leishmania major promastigotes. Ann. Trop. Med. Parasitol. 1992, 86, 347–354. [Google Scholar] [CrossRef] [PubMed]
- Magalhães, R.D.; Duarte, M.C.; Mattos, E.C.; Martins, V.T.; Lage, P.S.; Chávez-Fumagalli, M.A.; Lage, D.P.; Menezes-Souza, D.; Régis, W.C.; Manso Alves, M.J.; et al. Identification of differentially expressed proteins from Leishmania amazonensis associated with the loss of virulence of the parasites. PLoS Negl. Trop. Dis. 2014, 8, e2764. [Google Scholar] [CrossRef] [PubMed]
- Crepaldi, F.; de Toledo, J.S.; do Carmo, A.O.; Ferreira Marques Machado, L.; de Brito, D.D.V.; Serufo, A.V.; Almeida, A.P.M.; de Oliveira, L.G.; Ricotta, T.Q.N.; Moreira, D.S.; et al. Mapping alterations induced by long-term axenic cultivation of Leishmania amazonensis promastigotes with a multiplatform metabolomic fingerprint approach. Front. Cell Infect. Microbiol. 2019, 9, 403. [Google Scholar] [CrossRef] [PubMed]
- Nogueira, P.M.; de Menezes-Neto, A.; Borges, V.M.; Descoteaux, A.; Torrecilhas, A.C.; Xander, P.; Revach, O.Y.; Regev-Rudzki, N.; Soares, R.P. Immunomodulatory properties of Leishmania extracellular vesicles during host-parasite interaction: Differential activation of TLRs and NF-κB translocation by dermotropic and viscerotropic species. Front. Cell Infect. Microbiol. 2020, 10, 380. [Google Scholar] [CrossRef]
- Mandell, M.A.; Beatty, W.L.; Beverley, S.M. Quantitative single-cell analysis of Leishmania major amastigote differentiation demonstrates variably extended expression of the lipophosphoglycan (LPG) virulence factor in different host cell types. PLoS Negl. Trop. Dis. 2022, 16, e0010893. [Google Scholar] [CrossRef]
- Späth, G.F.; Epstein, L.; Leader, B.; Singer, S.M.; Avila, H.A.; Turco, S.J.; Beverley, S.M. Lipophosphoglycan is a virulence factor distinct from related glycoconjugates in the protozoan parasite Leishmania major. Proc. Natl. Acad. Sci. U S A 2000, 97, 9258–9263. [Google Scholar] [CrossRef]
- Joshi, P.B.; Kelly, B.L.; Kamhawi, S.; Sacks, D.L.; McMaster, W.R. Targeted gene deletion in Leishmania major identifies leishmanolysin (GP63) as a virulence factor. Mol. Biochem. Parasitol. 2002, 120, 33–40. [Google Scholar] [CrossRef]
- Chan, A.; Ayala, J.M.; Alvarez, F.; Piccirillo, C.; Dong, G.; Langlais, D.; Olivier, M. The role of Leishmania GP63 in the modulation of innate inflammatory response to Leishmania major infection. PLoS ONE 2021, 16, e0262158. [Google Scholar] [CrossRef]
- da Silva Lira Filho, A.; Fajardo, E.F.; Chang, K.P.; Clément, P.; Olivier, M. Exosomes/extracellular vesicles containing GP63 are essential for enhance cutaneous leishmaniasis development upon co-inoculation of Leishmania amazonensis and its exosomes. Front. Cell Infect. Microbiol. 2021, 11, 709258. [Google Scholar] [CrossRef]
- Ozkocak, D.C.; Phan, T.K.; Poon, I.K.H. Translating extracellular vesicle packaging into therapeutic applications. Front. Immunol. 2022, 13, 946422. [Google Scholar] [CrossRef]
- Weng, Z.; Zhang, B.; Wu, C.; Yu, F.; Han, B.; Li, B.; Li, L. Therapeutic roles of mesenchymal stem cell-derived extracellular vesicles in cancer. J. Hematol. Oncol. 2021, 14, 136. [Google Scholar] [CrossRef]
- Ding, Y.; He, L.; Zhang, Q.; Huang, Z.; Che, X.; Hou, J.; Wang, H.; Shen, H.; Qiu, L.; Li, Z.; et al. Organ distribution of severe acute respiratory syndrome (SARS) associated coronavirus (SARS-CoV) in SARS patients: Implications for pathogenesis and virus transmission pathways. J. Pathol. 2004, 203, 622–630. [Google Scholar] [CrossRef]
- Roig, J.; Saiz, M.L.; Galiano, A.; Trelis, M.; Cantalapiedra, F.; Monteagudo, C.; Giner, E.; Giner, R.M.; Recio, M.C.; Bernal, D.; et al. Extracellular vesicles from the helminth Fasciola hepatica prevent DSS-induced acute ulcerative colitis in a T-lymphocyte independent mode. Front. Microbiol. 2018, 9, 1036. [Google Scholar] [CrossRef]
- Gutierrez, B.C.; Ancarola, M.E.; Volpato-Rossi, I.; Marcilla, A.; Ramirez, M.I.; Rosenzvit, M.C.; Cucher, M.; Poncini, C.V. Extracellular vesicles from Trypanosoma cruzi-dendritic cell interaction show modulatory properties and confer resistance to lethal infection as a cell-free based therapy strategy. Front. Cell Infect. Microbiol. 2022, 12, 980817. [Google Scholar] [CrossRef]
Figure 1.
Workflow of treating RAW 264.7 macrophage lineage with EVs released by LT-P or IVD-P before macrophage infection with L. amazonensis (adapted from BioRender).
Figure 1.
Workflow of treating RAW 264.7 macrophage lineage with EVs released by LT-P or IVD-P before macrophage infection with L. amazonensis (adapted from BioRender).
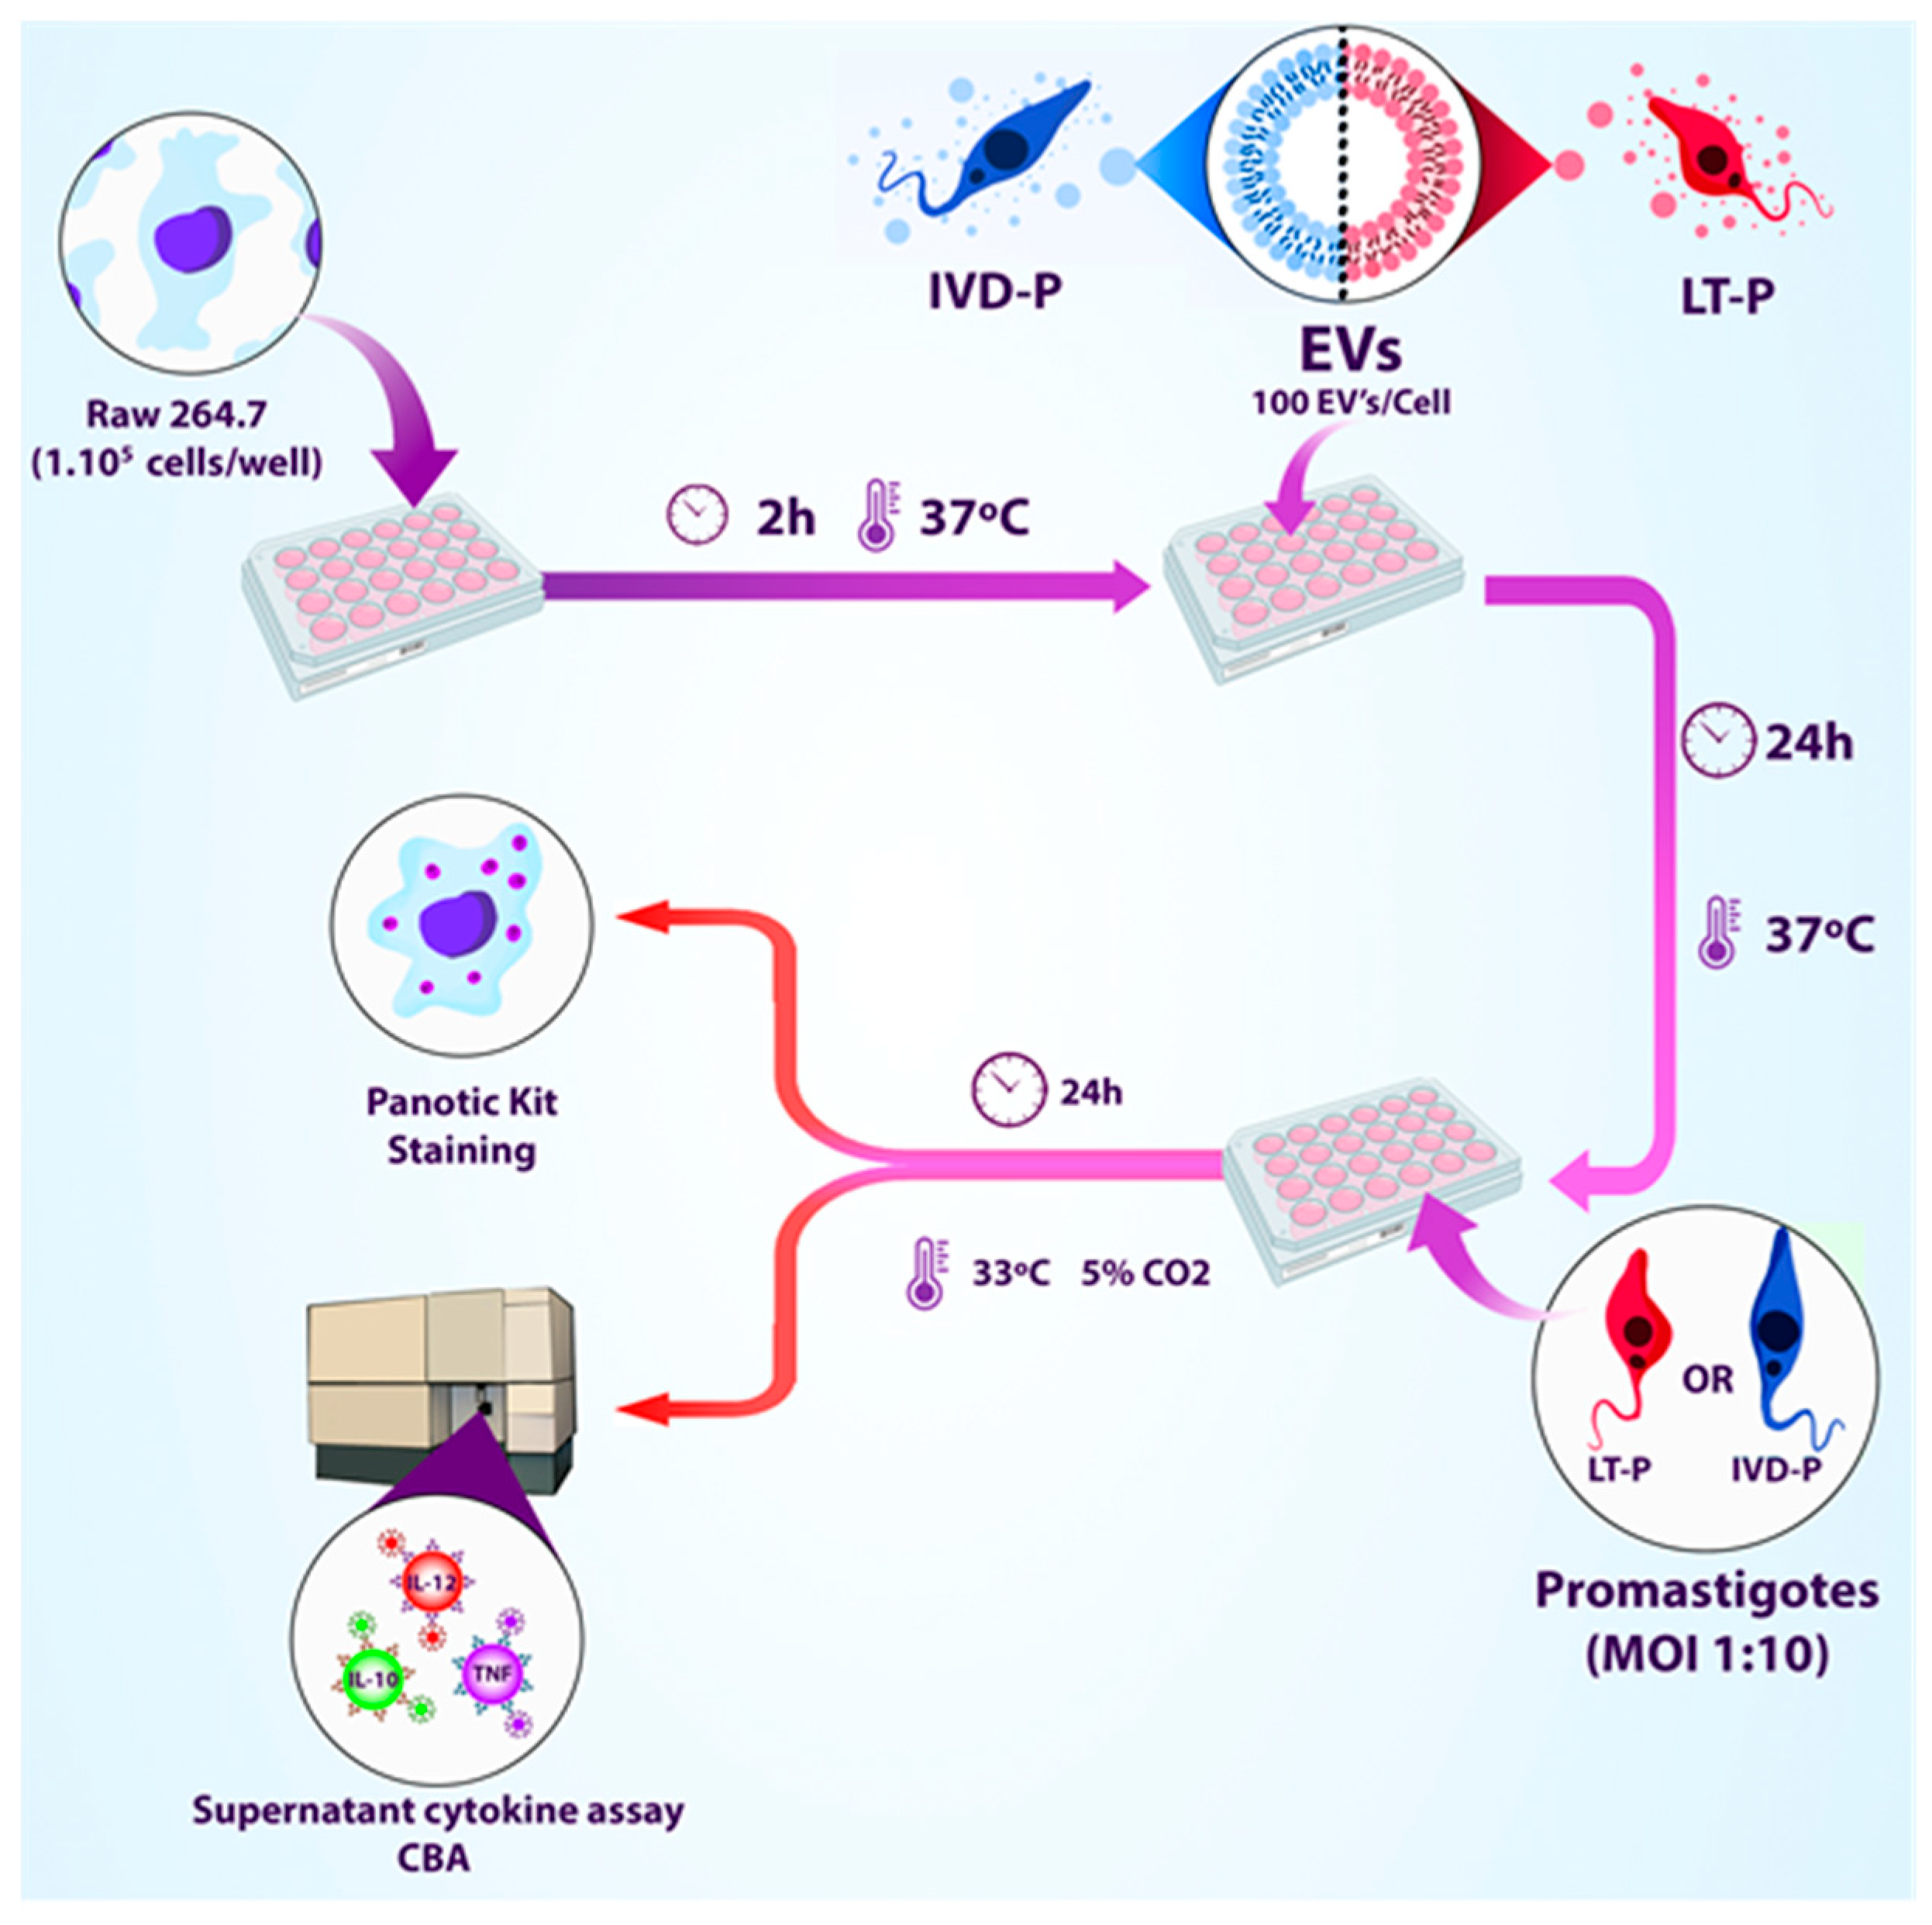
Figure 2.
Experimental design of macrophage infection (RAW 264.7) with LT-P or IVD-P followed by subsequent treatment with different concentrations of Amphotericin b or Pentamidine in the presence or absence of EVs (adapted from BioRender).
Figure 2.
Experimental design of macrophage infection (RAW 264.7) with LT-P or IVD-P followed by subsequent treatment with different concentrations of Amphotericin b or Pentamidine in the presence or absence of EVs (adapted from BioRender).
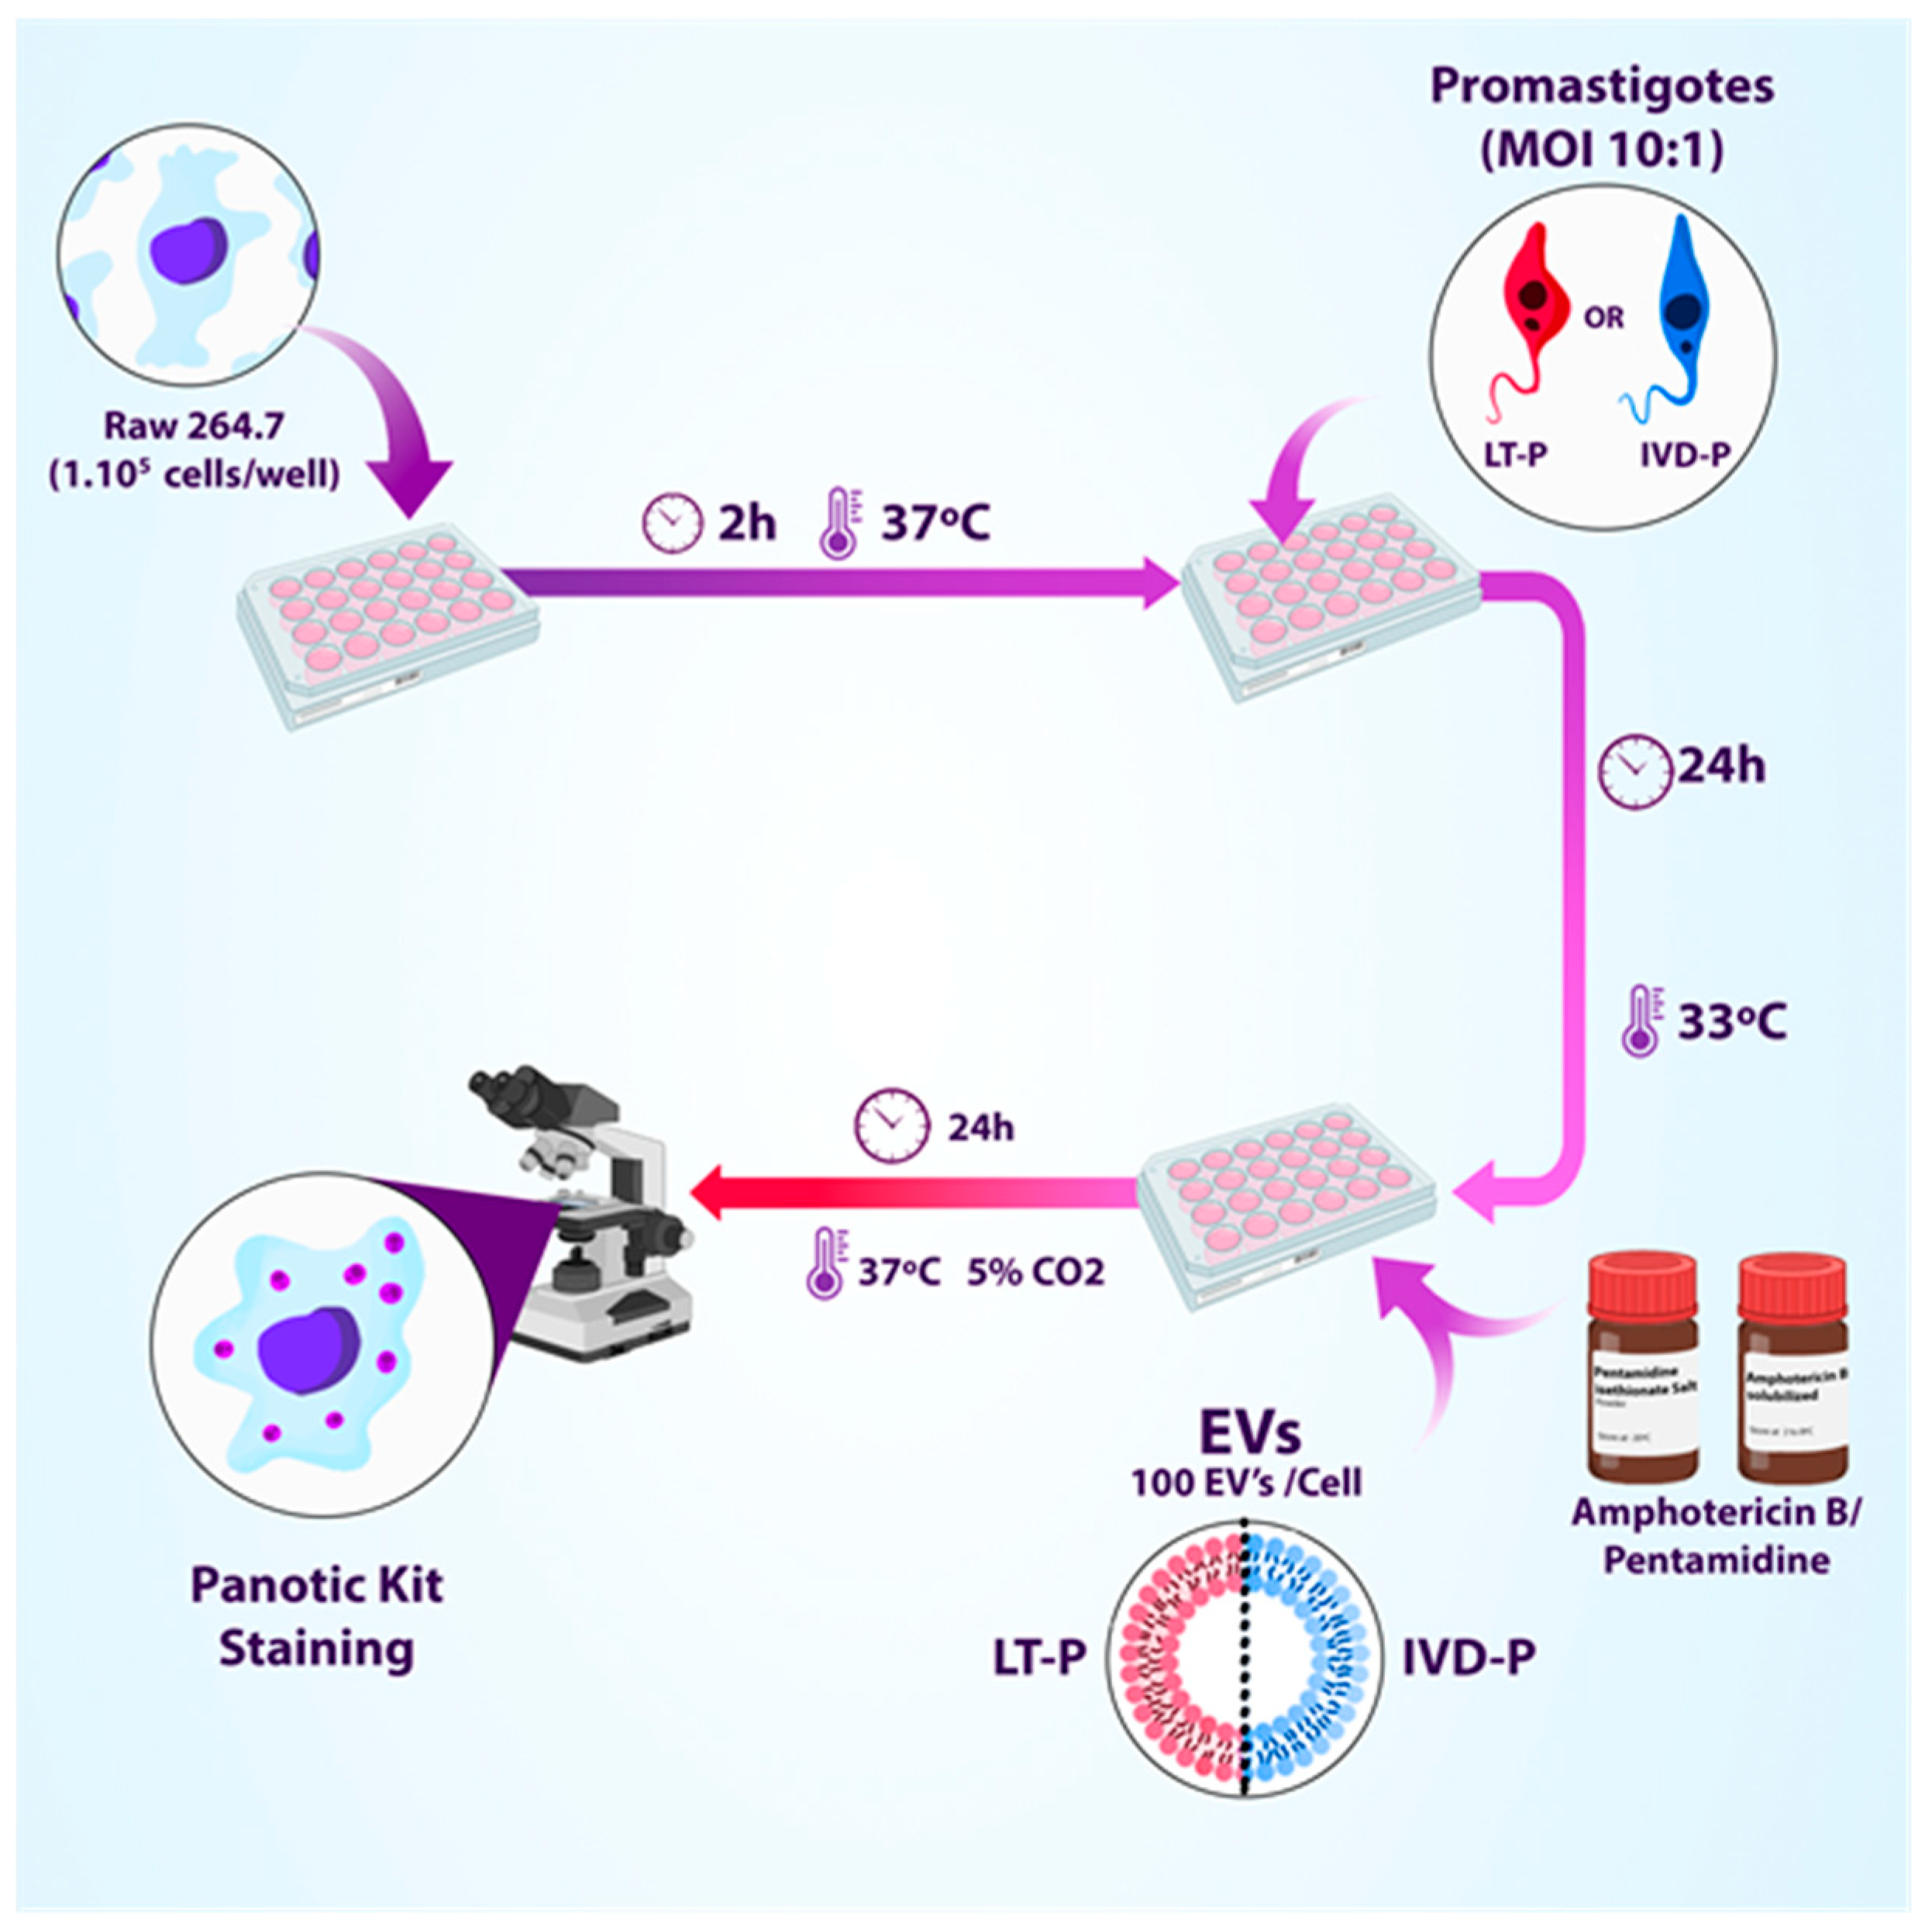
Figure 3.
Relative expression analyses of virulence genes expressed in L. amazonensis promastigotes of LT-P and IVD-P. The bars represent the mean of the triplicates, and the error bars are the standard deviation. Student t-test comparing LT-P and IVD-P, *P<0.05. The graph is representative of two independent experiments.
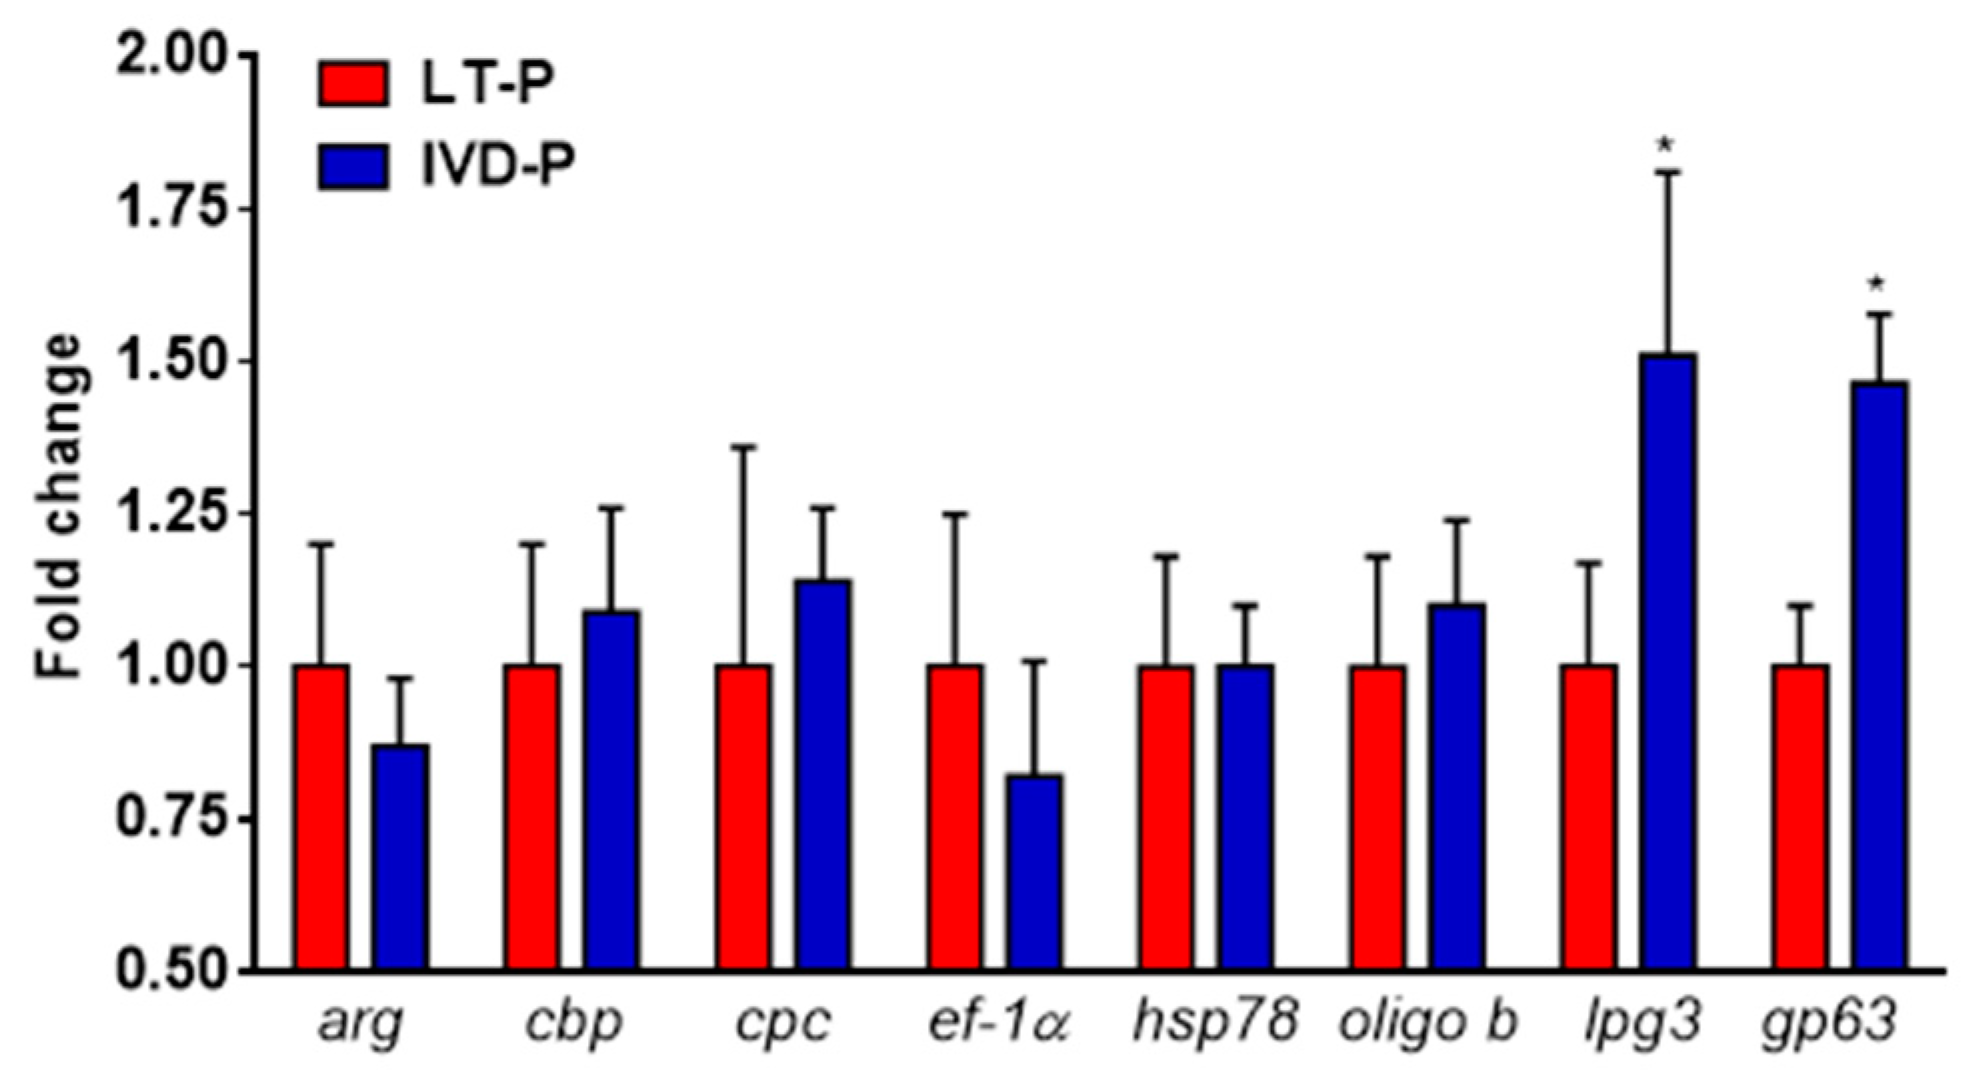
Figure 4.
Phagocytosis assay of L. amazonensis promastigotes with different virulence profiles. RAW 264.7 cell lineage were infected with LT-P or IVD-P promastigotes. (A) Percentage of macrophage infection, (B) average of internalized parasites, (C) representative microphotograph of macrophage infection with LT-P; (D) representative image of macrophage infected with IVD-P, both 1,000 × magnification. Each group was performed in triplicate. The bars represent the mean of the triplicates, and the error bars are the standard deviation. Student's t-test *P<0.05 and ***P<0.001. Representative data of 3 independent experiments.
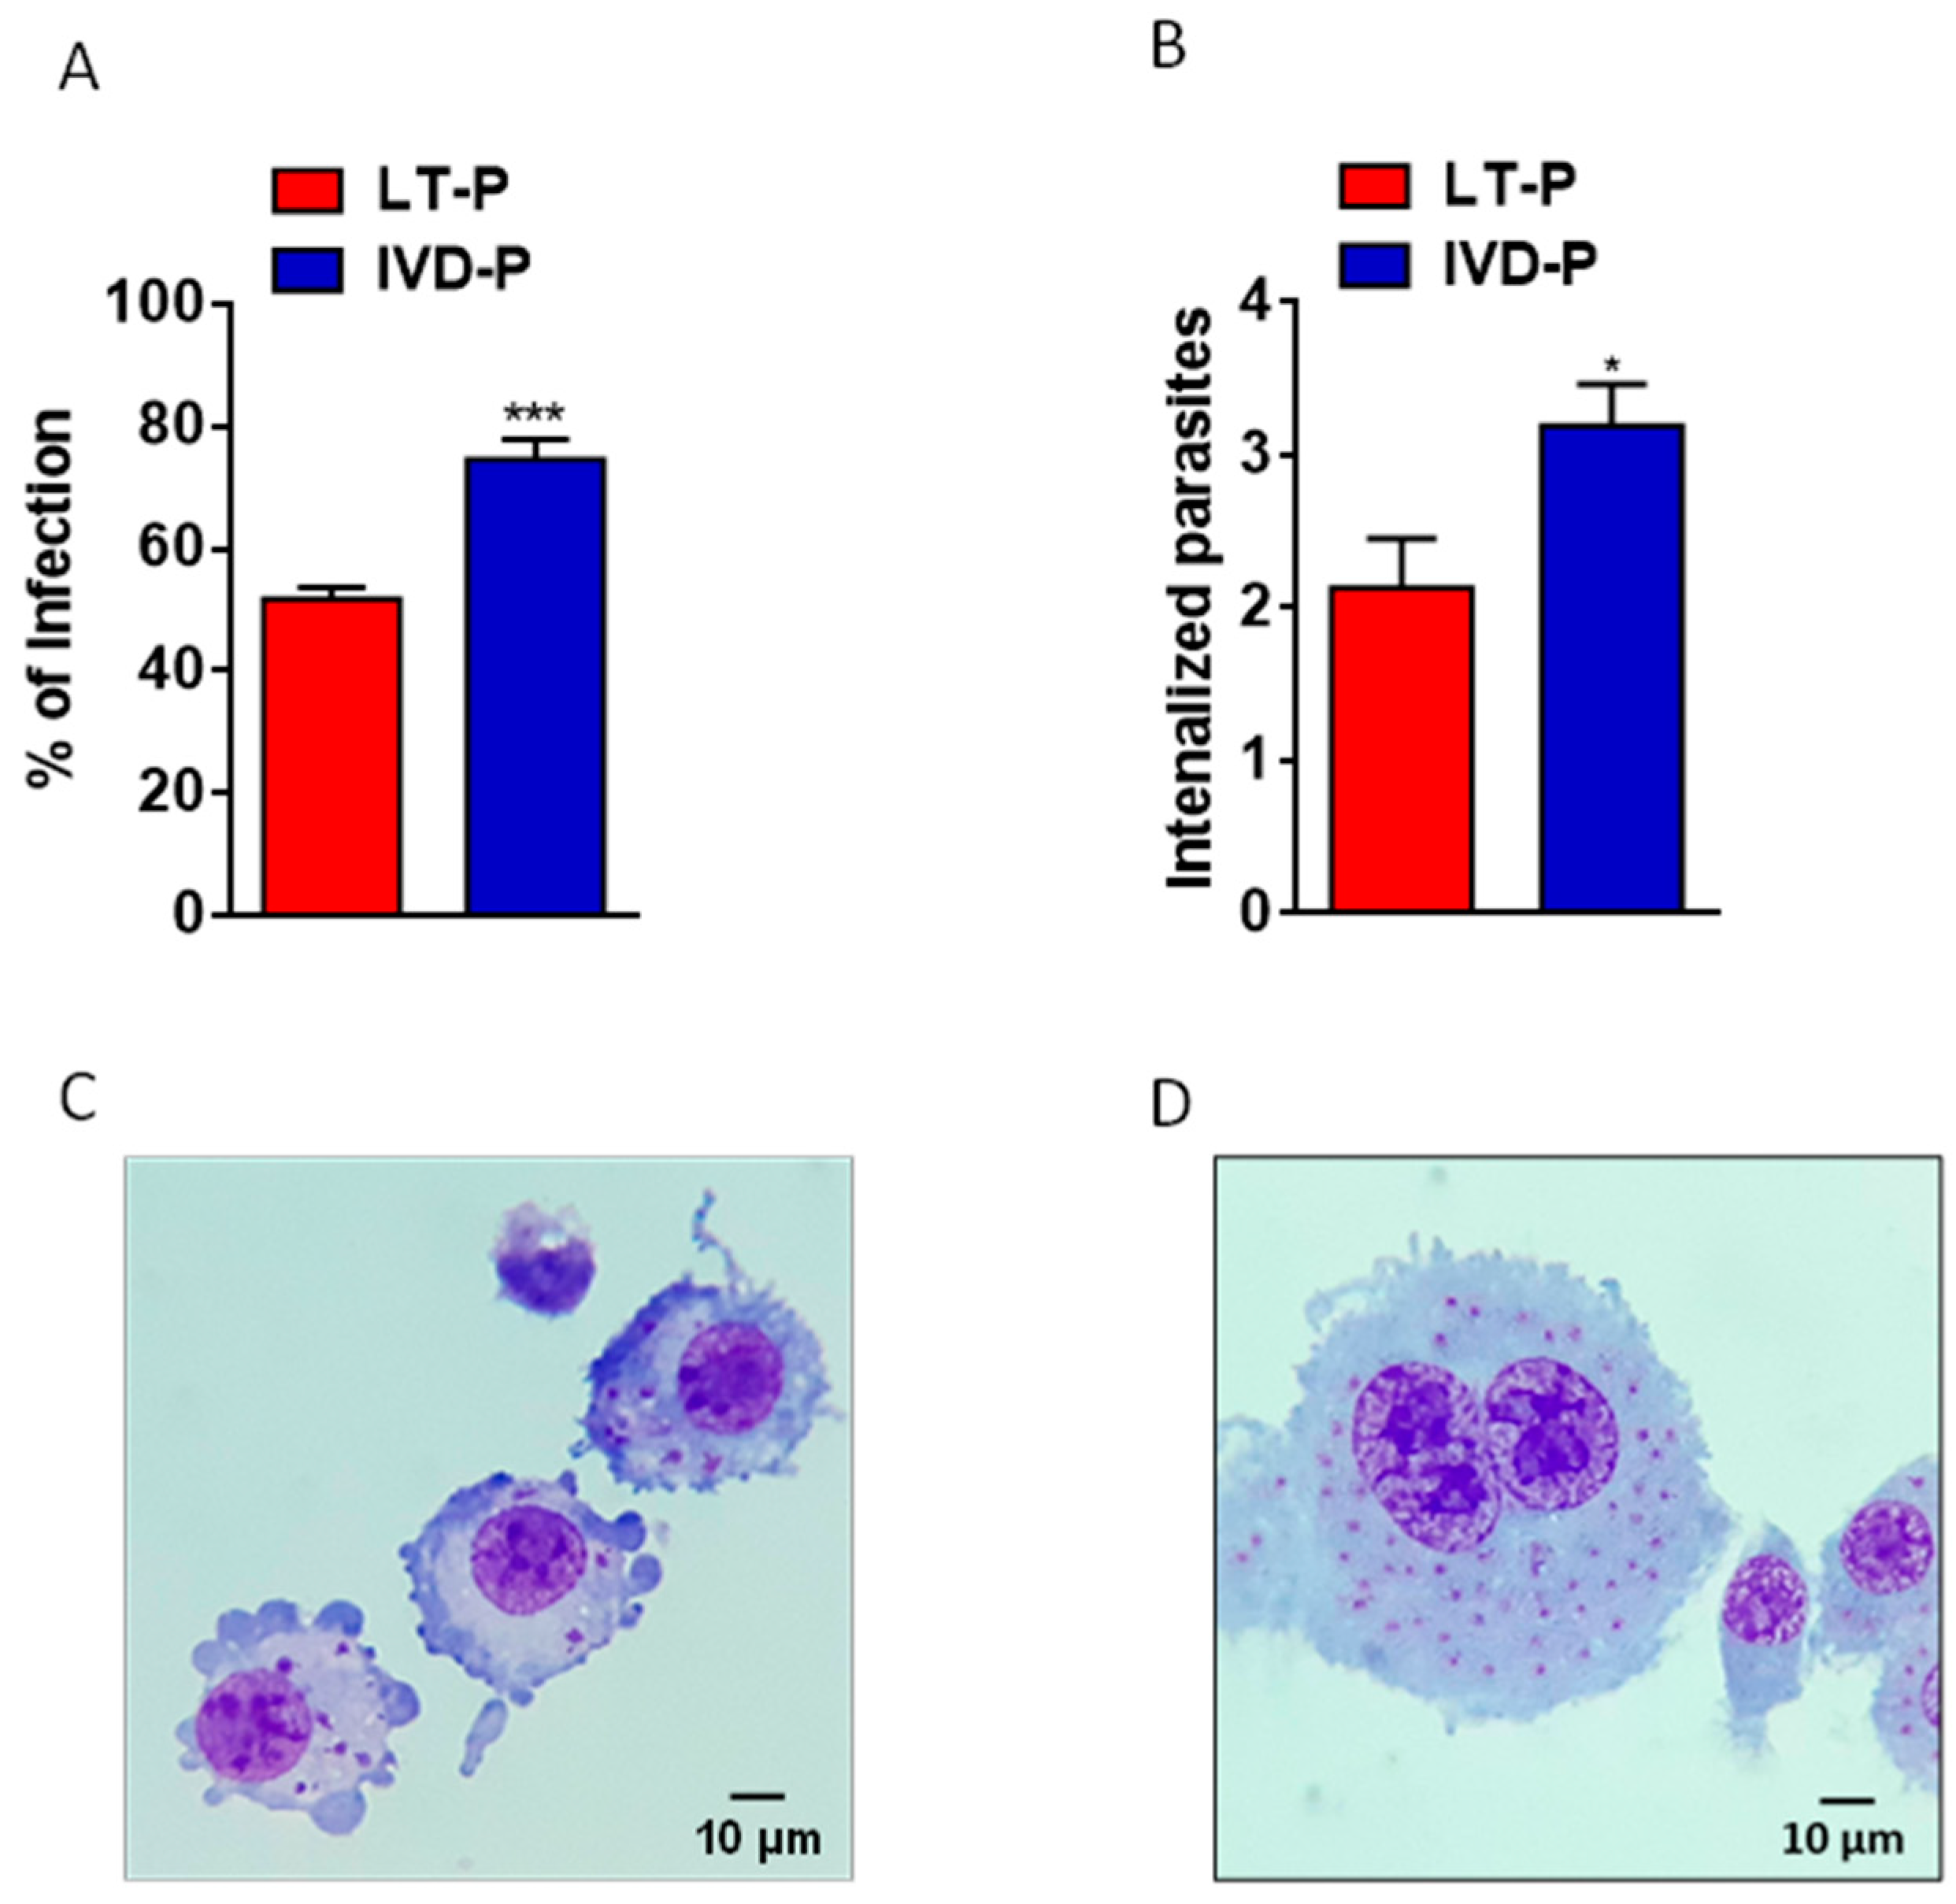
Figure 5.
EVs released by L. amazonensis promastigotes with different virulence profiles (IVD-P and LT-P). (A) Size profile and concentration (particles/mL) of EVs analyzed by NTA. (B) Flow cytometry acquisition of no stained EVs from LT-P and IVD-P parasites. (C) Flow cytometry of RAW 264.7 cells after uptake of L. amazonensis EVs stained with PKH26. Bars represent the mean percentage of positive cells after 3 measurements, and error bars show the SD. ANOVA following Tukey post-test. ****P<0.0001. (D) Representative image of macrophage cells after uptake of L. amazonensis LT-P EVs stained with PKH26 (red marker). The uptake experiments were performed twice with similar results. (E) Representative images of macrophage cells after uptake of L. amazonensis LT-P EVs (left image) and IVD-P EVs (right image) stained with PKH26 (red marker). The cell nucleus was labeled with DAPI (blue marker).
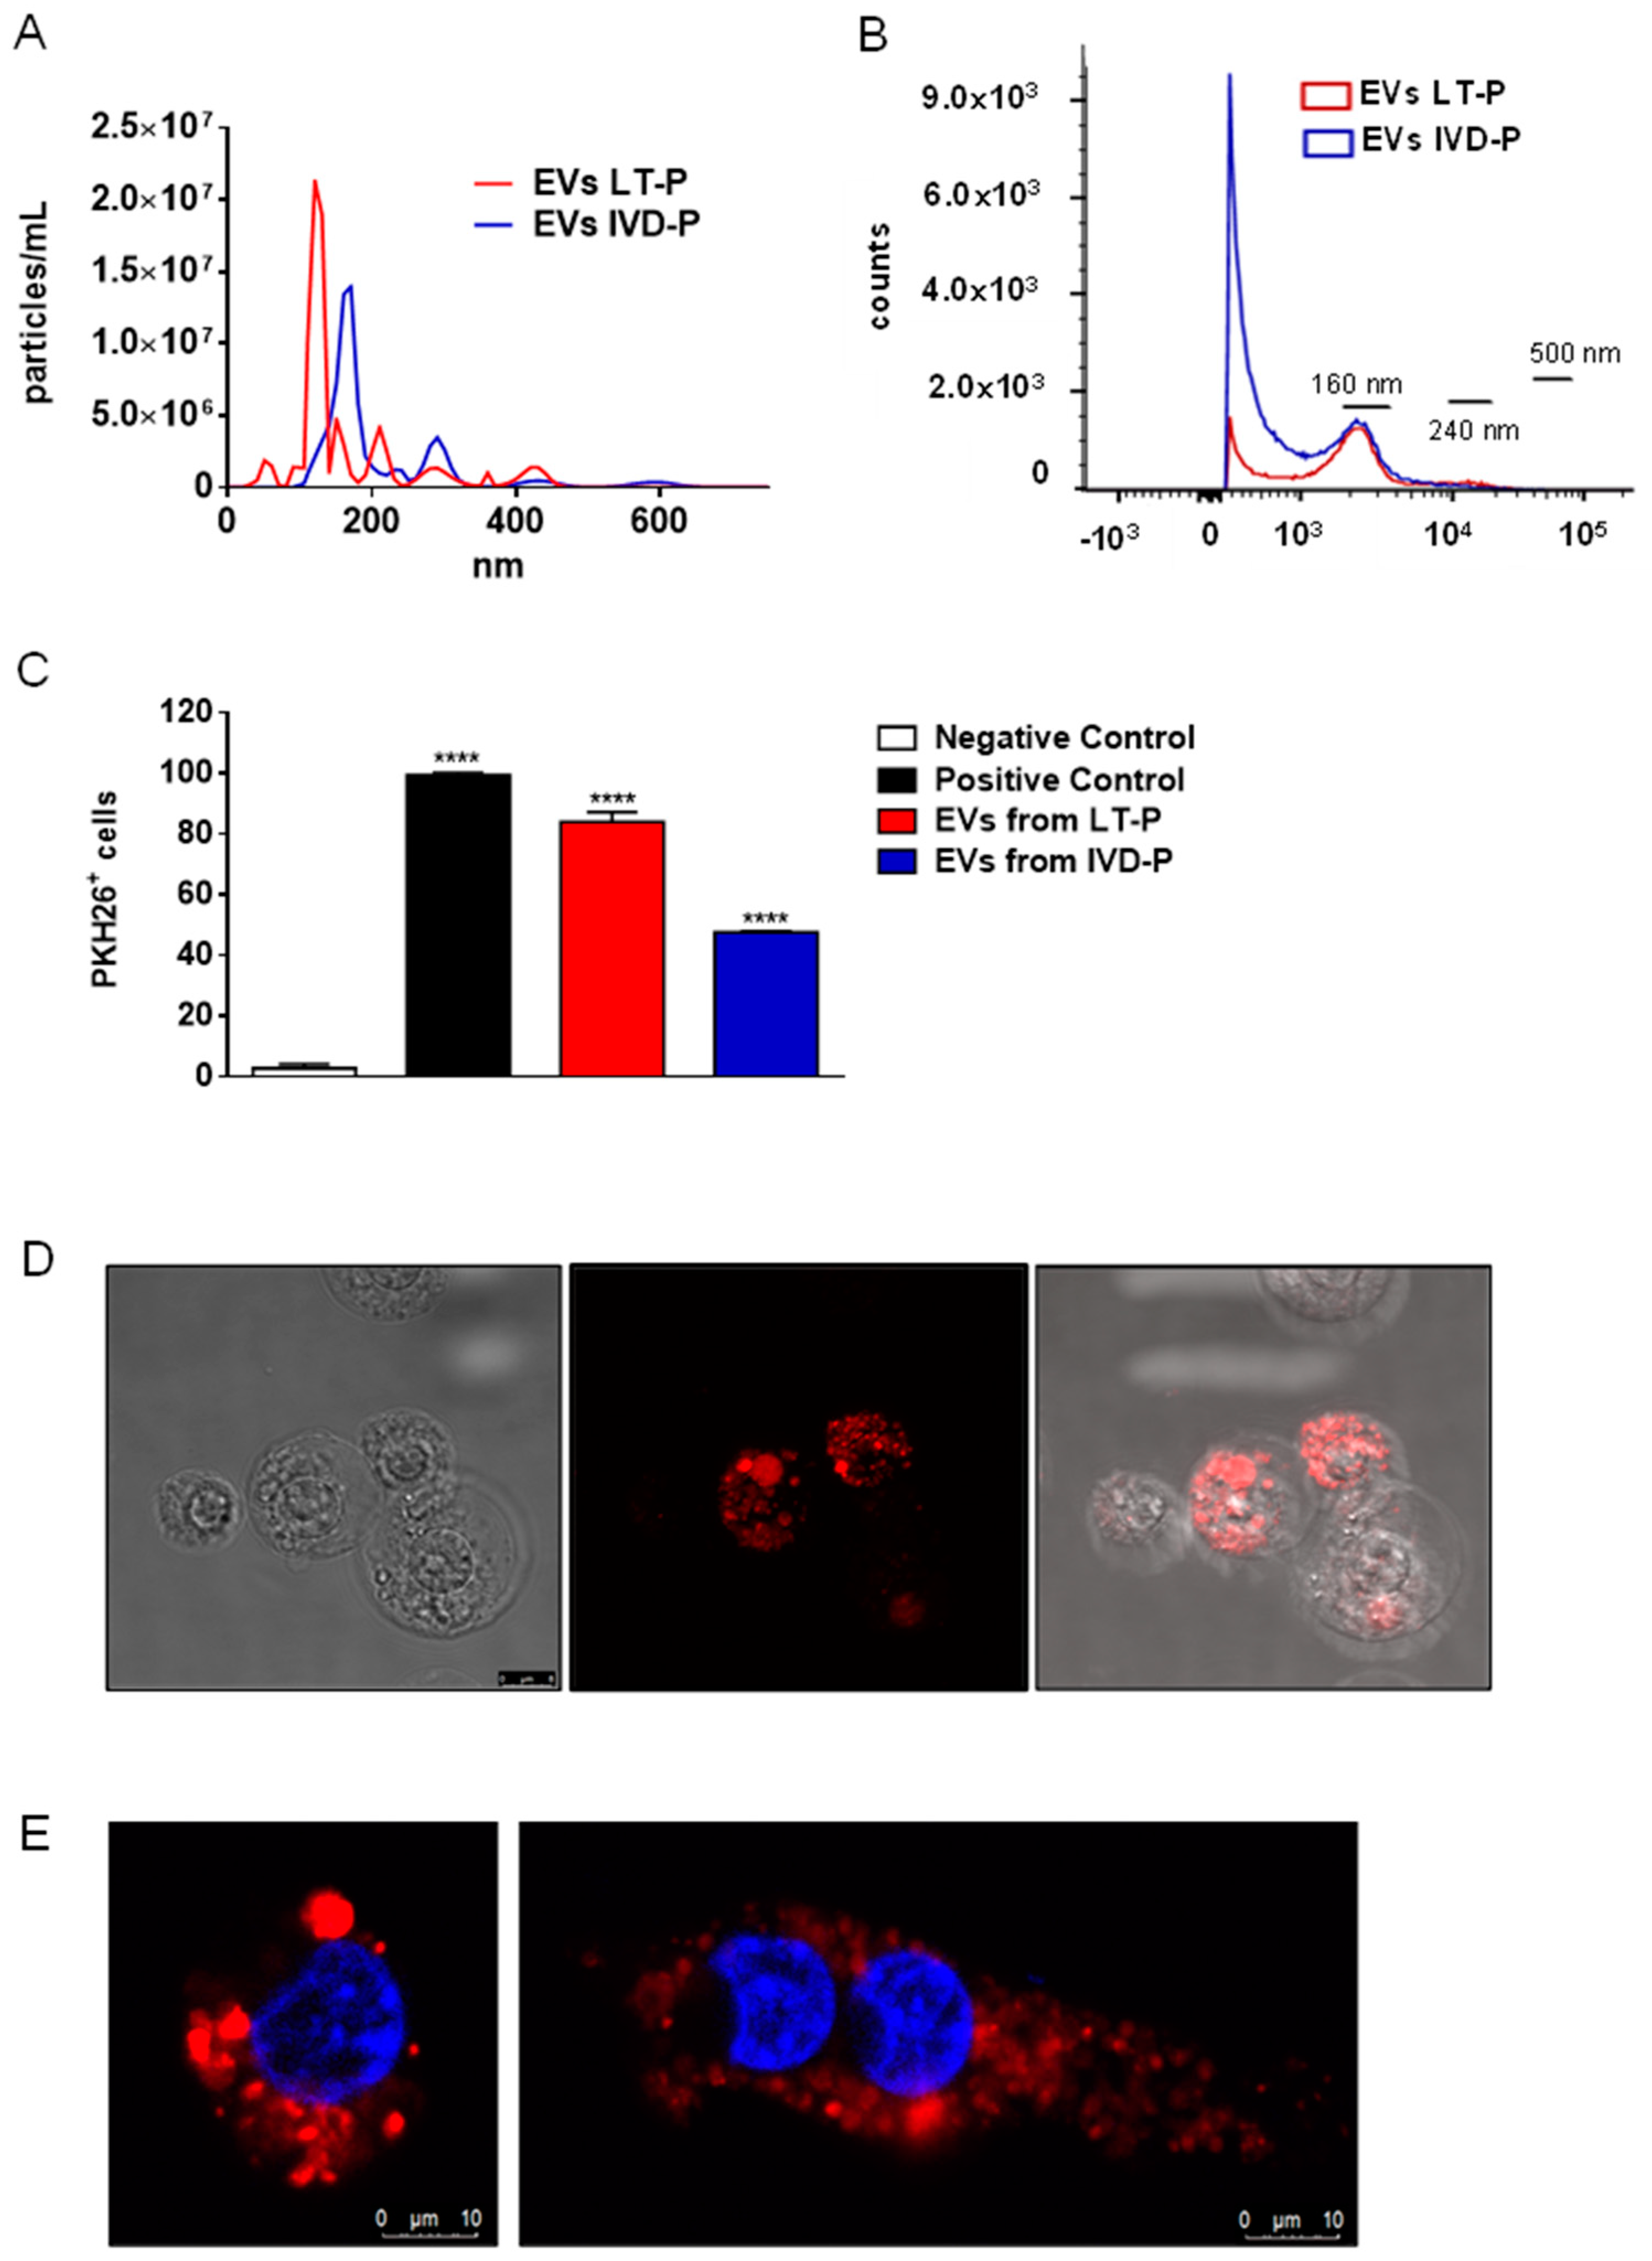
Figure 6.
Cytokine and NO production in RAW 264.7 cells treated with EVs from LT-P or IVD-P. Control received LPS. (A) Measurement of IL-6, (B) IL-10, (C) MCP-1, and (D) TNF-α cytokine levels in cell supernatants. (E) Intracellular NO production in RAW 264.7 cells after stimulation with EVs from IVD-P or LT-P. Data acquisition was performed using a FACSCalibur cytometer and subsequent analyzes were performed using the FlowJo software. The graph represents the median fluorescence intensity (MFI) for the DAF-2DA probe. The bars indicate the mean, and the error bars denote the standard deviation of the groups. Statistics were performed using ANOVA, followed by the Tukey post-test (*P<0.05, **P<0.01). The graphs are representative of two independent experiments.
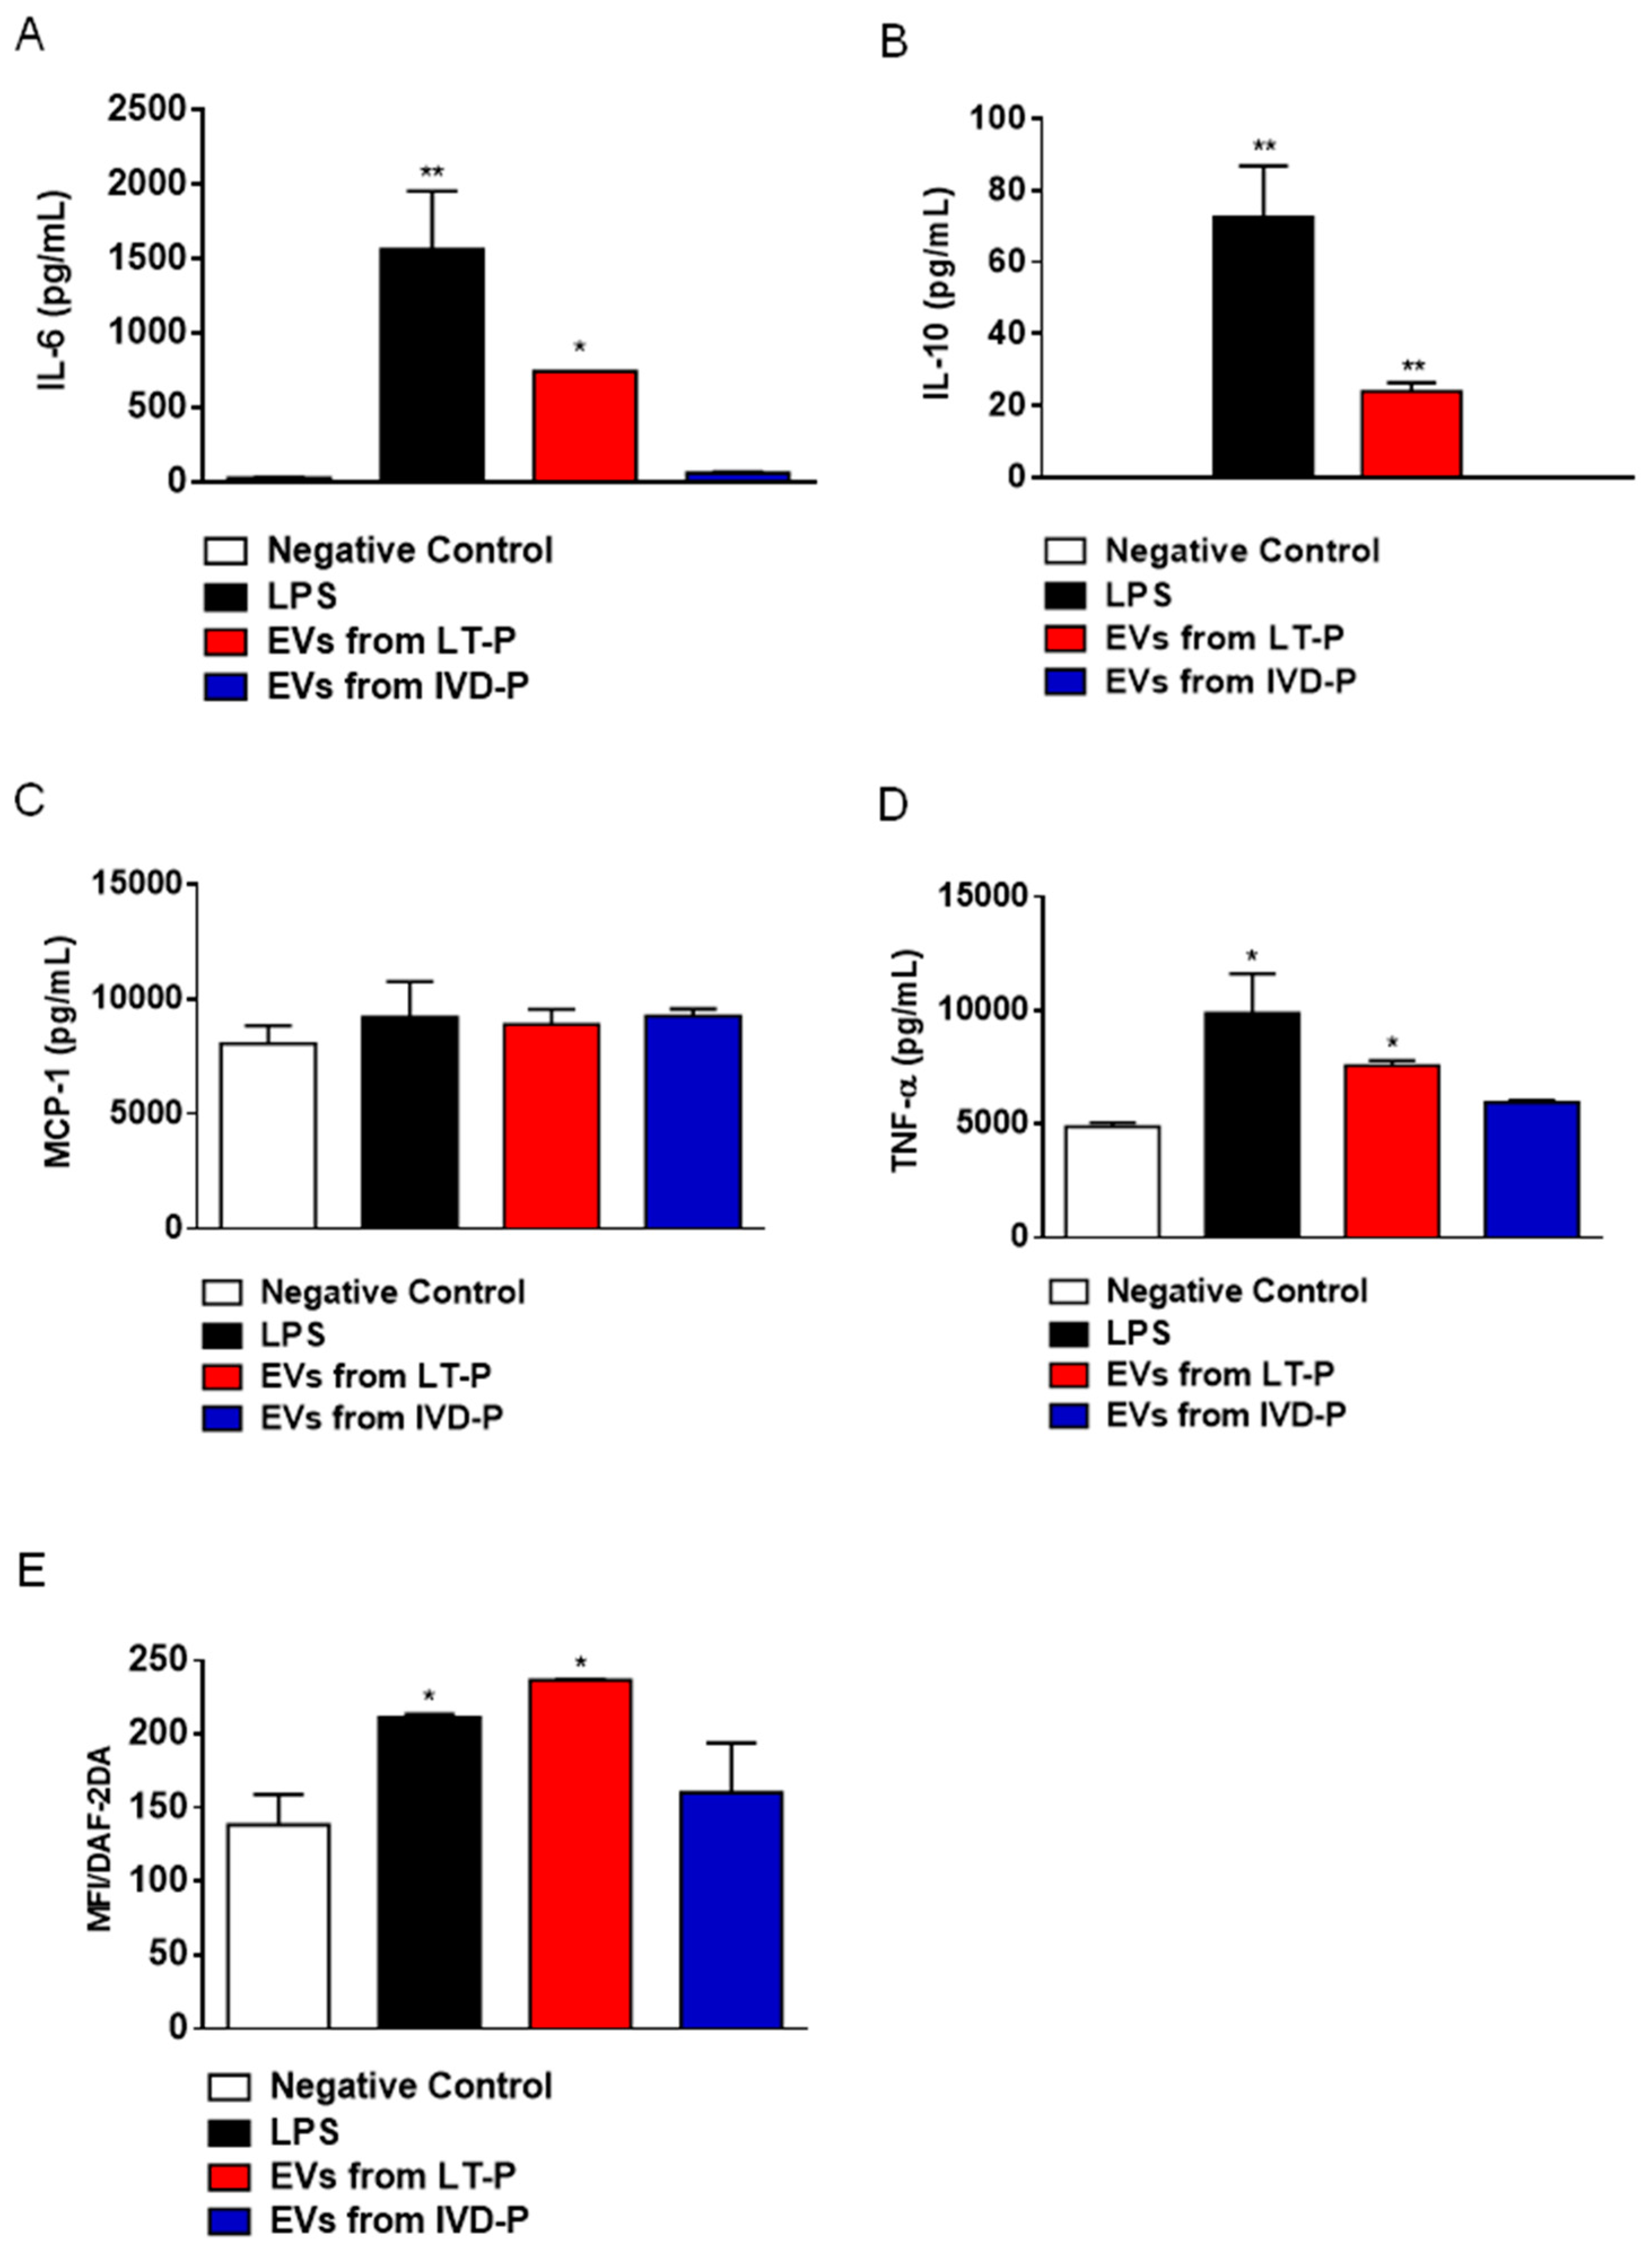
Figure 7.
Phagocytosis assay of L. amazonensis promastigotes with different virulence profiles in the presence of the respective EVs. RAW 264.7 cells were previously stimulated with the EVs released by LT-P or IVD-P promastigotes. After 24 h, macrophages were infected with correlated parasites LT-P or IVD-P (EVs from LT-P or IVD-P + LT-P or IVD-P infection). (A) Percentage of infection; (B) Average of internalized parasites. The bars represent the mean of the triplicates, and the error bars are the standard deviation. Statistics were performed using ANOVA, followed by the Tukey post-test. *P<0.05, **P<0.01, compared to groups not treated and treated with EVs (LT-P compared to EVs from LT-P+LT-P infection or IVD-P compared to EVs from IVD-P+IVD-P infection). ##P<0.01, comparison between groups not treated with EVs (LT-P and IVD-P) or treated with EVs (EVs from LT-P+LT-P infection and IVD-P+IVD-P-P infection). The graphs are representative of two independent experiments.
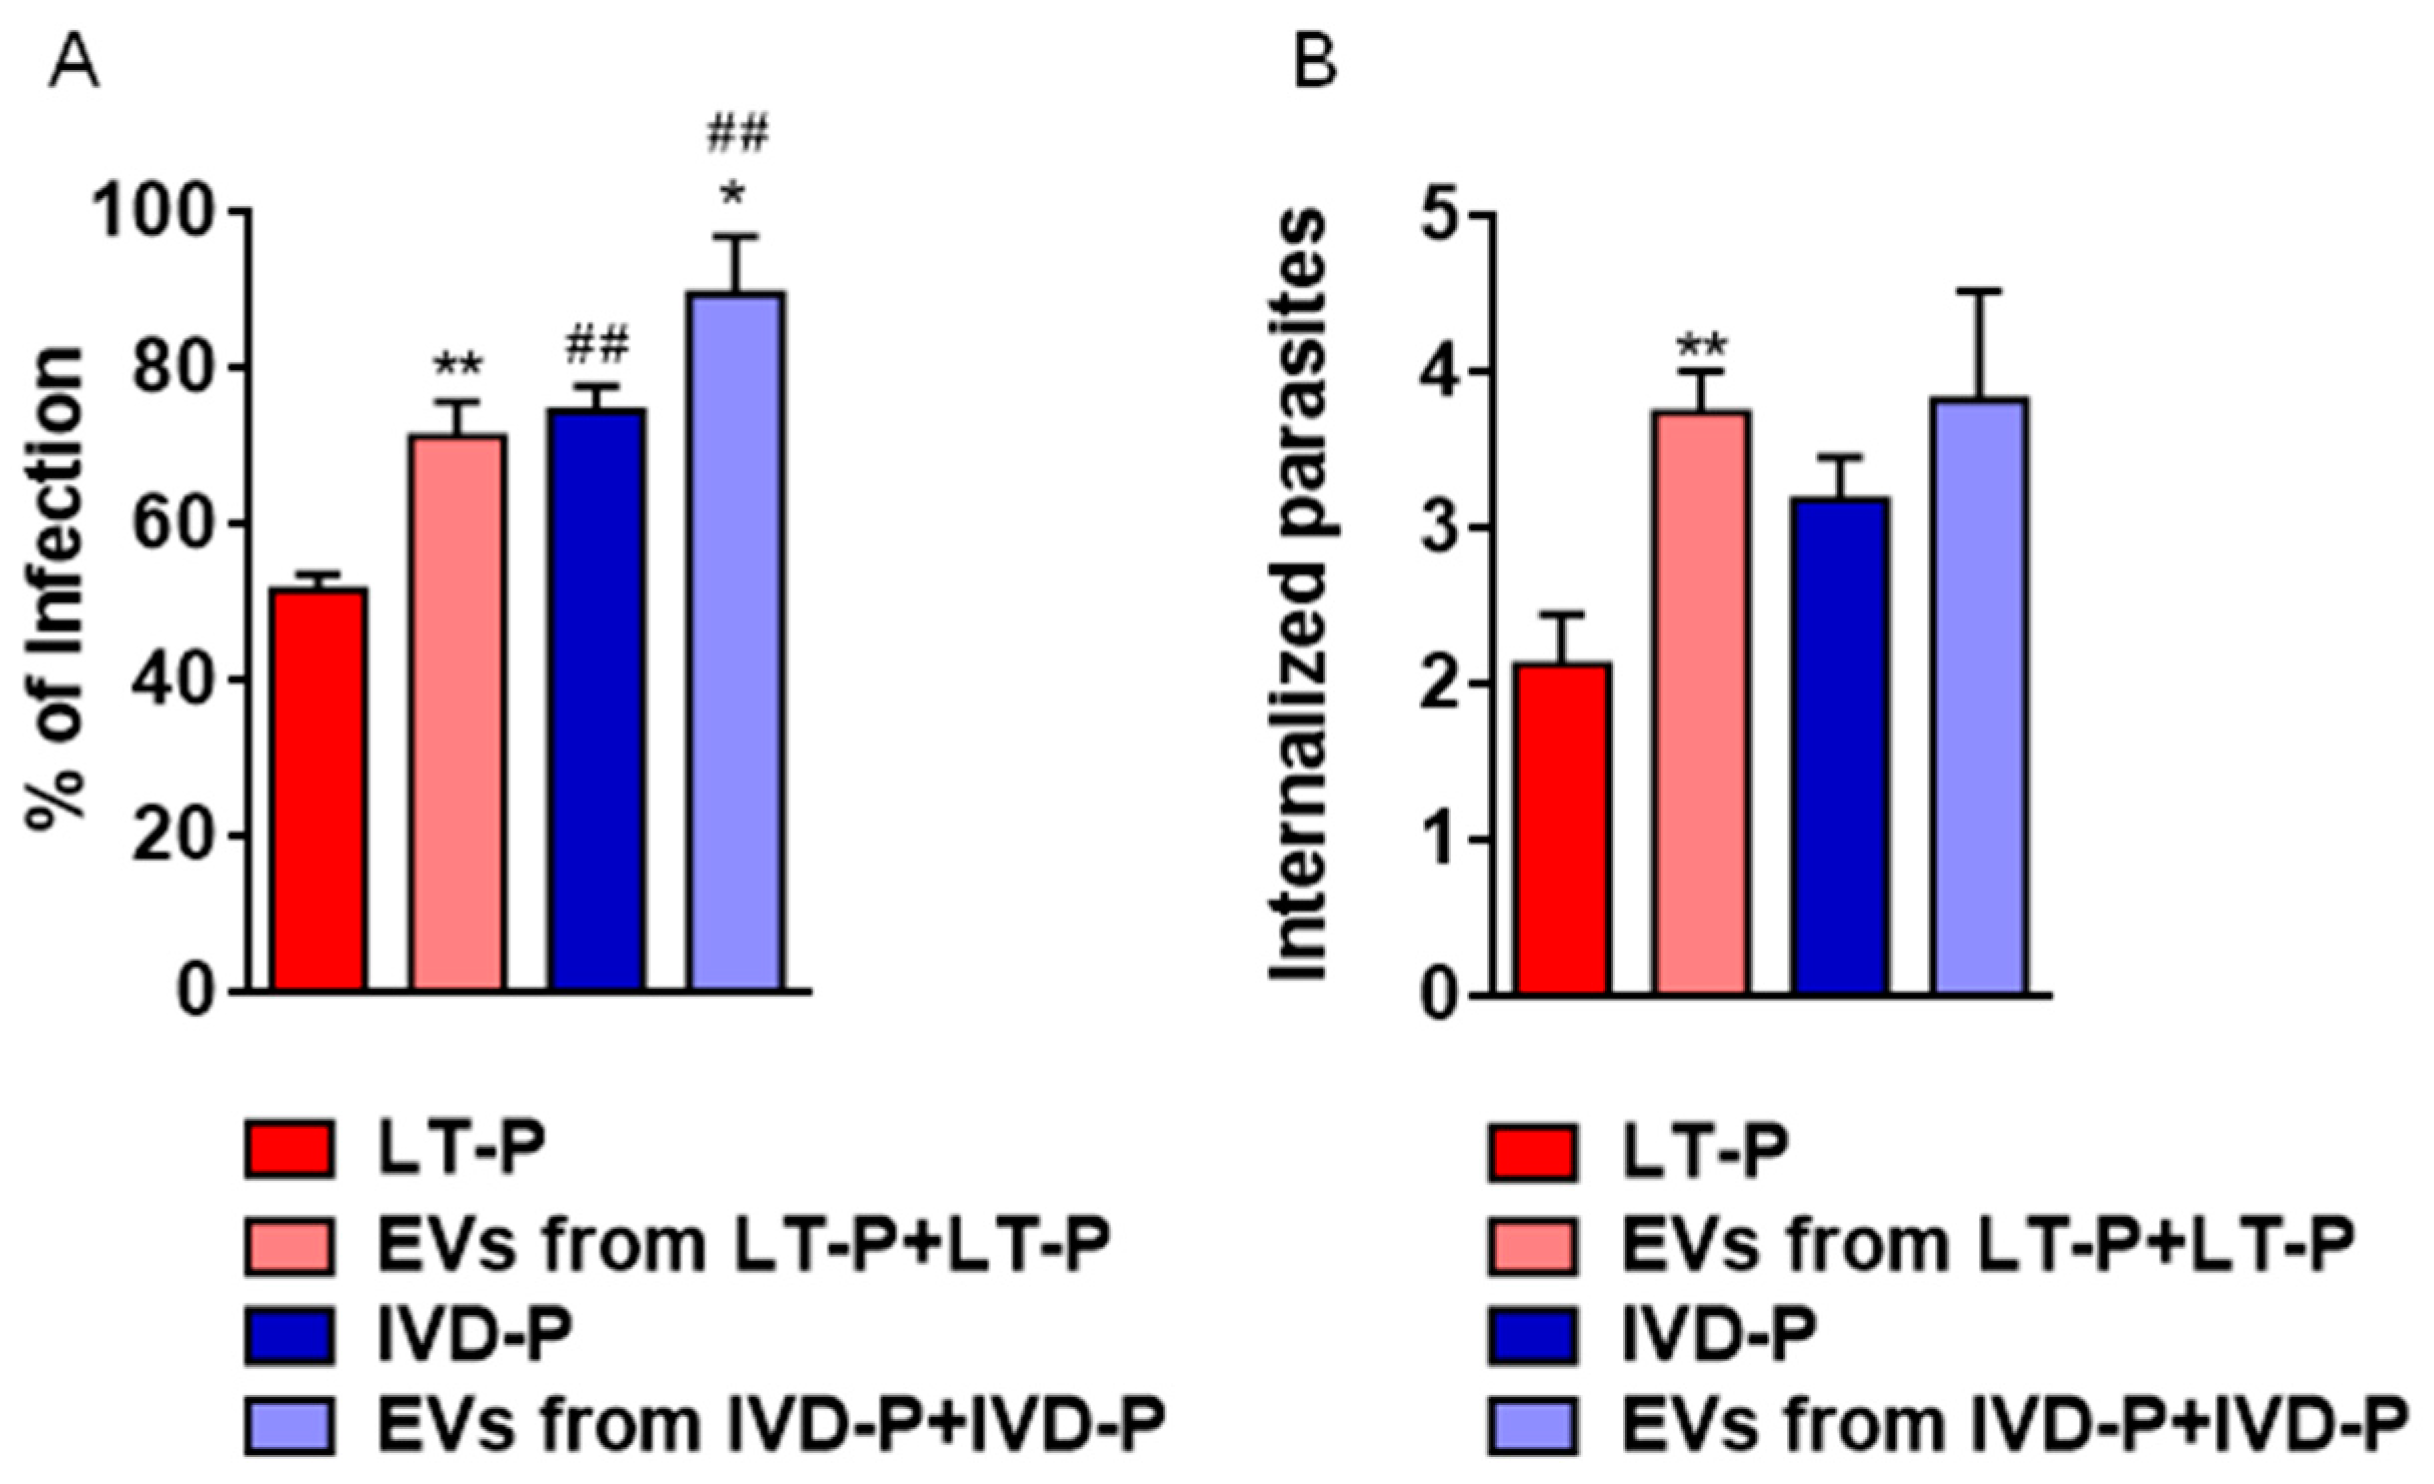
Figure 8.
Cytokine production by RAW264.7 cells infected with LT-P or IVD-P promastigotes previously treated with the related EVs. Negative control was non infected and no treated cells. Stimulation with LPS was the positive control. Supernatants were collected after 24 horas of infection. (A) Measurement of IL-6, (B) MCP-1, (C) TNF-α cytokine levels in cell supernatants. The bars indicate that the mean and the error bars denote the standard deviation of the groups. Statistics were performed using ANOVA, followed by the Tukey post-test. (*) Indicates significant difference in relation to the negative control group (*P<0.05, ***P<0.001, and ****P<0.0001). (#) Represents comparison between the groups infected with the parasites without pre-treatment with EVs and groups treated with EVs and subsequently infected with the parasites (#P<0.05, ###P<0.001, and ####P<0.0001).
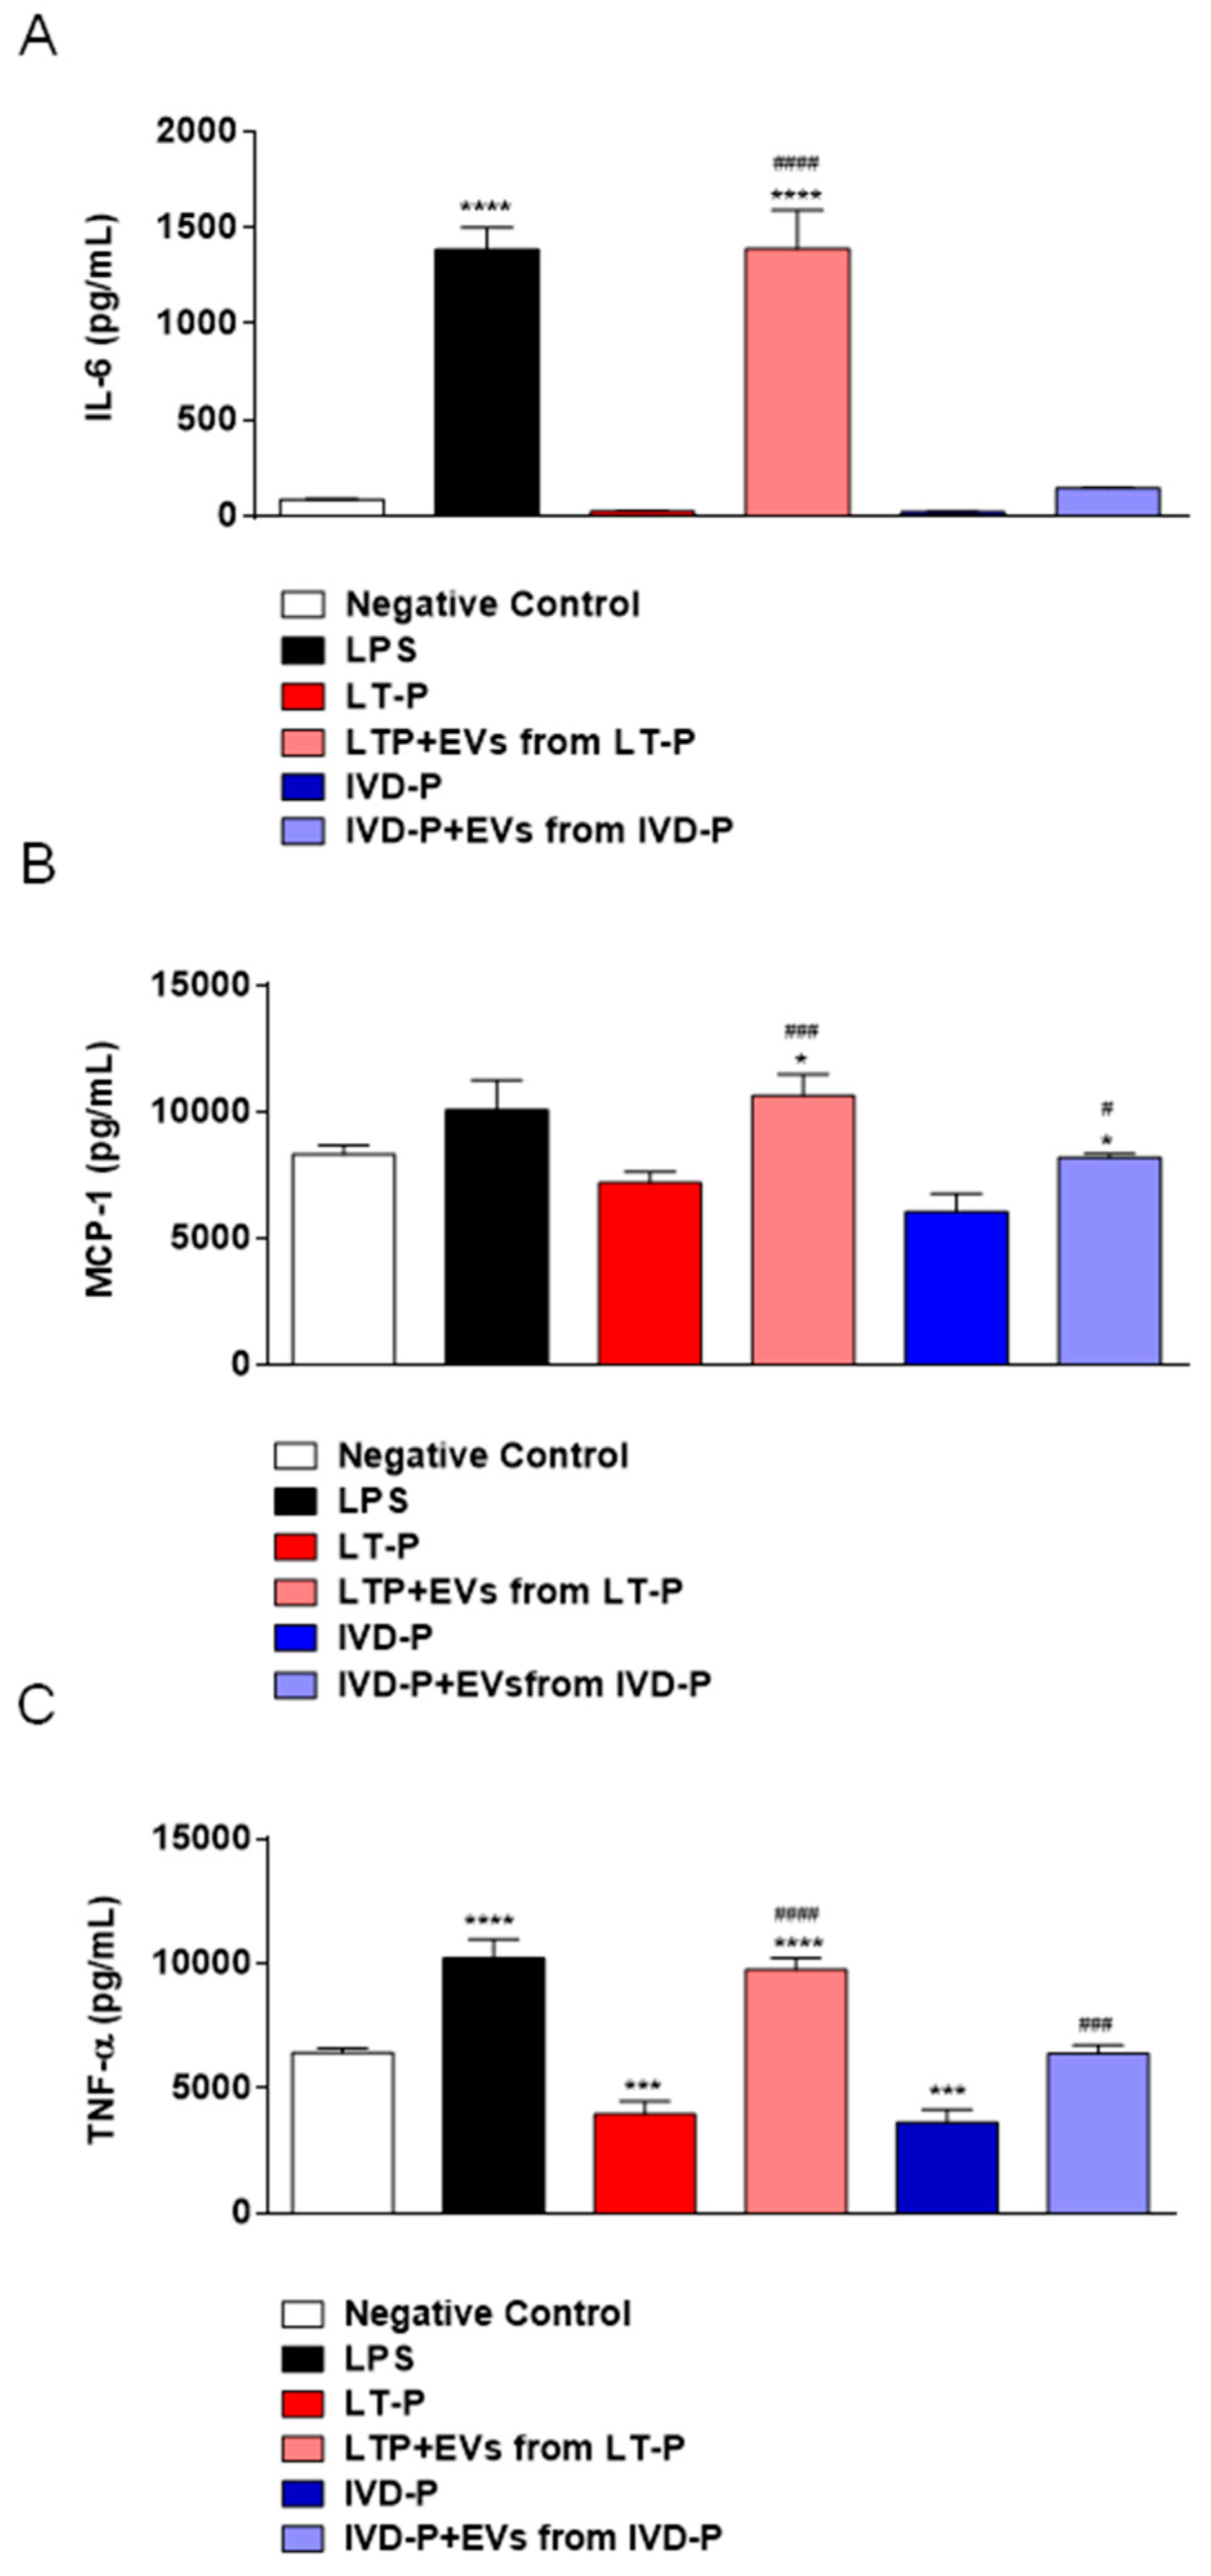
Figure 9.
Percentage of macrophage infection and number of internalized parasites in RAW 264.7 cells infected with L. amazonensis and treated with 3 concentrations of Amphotericin b or Pentamidine in the presence or absence of EVs. (A) (B) Infection with LT-P and treatment with Amphotericin b or Pentamidine and LT-P EVs, and (C) (D) infected with IVD-P and treated with Amphotericin b or Pentamidine and IVD-P EVs. The bars represent the mean of the triplicates, and the error bars are the standard deviation. Two-way ANOVA, followed by Tukey test. ****P<0.0001 compared to the control group (infected or infected and treated with the respective EV); #P<0.05, ##P<0.01 compared to group infected and treated with the same drug concentration in the absence of EVs. The experiment was performed twice with similar results.
Disclaimer/Publisher’s Note: The statements, opinions and data contained in all publications are solely those of the individual author(s) and contributor(s) and not of MDPI and/or the editor(s). MDPI and/or the editor(s) disclaim responsibility for any injury to people or property resulting from any ideas, methods, instructions or products referred to in the content. |
© 2023 by the authors. Licensee MDPI, Basel, Switzerland. This article is an open access article distributed under the terms and conditions of the Creative Commons Attribution (CC BY) license (http://creativecommons.org/licenses/by/4.0/).
Copyright: This open access article is published under a Creative Commons CC BY 4.0 license, which permit the free download, distribution, and reuse, provided that the author and preprint are cited in any reuse.


