
Submitted:
06 November 2023
Posted:
07 November 2023
You are already at the latest version
Abstract
In the natural environment, sand accumulation and desertification can influence the efficiency of photovoltaic arrays. In this study, PV module output characteristics were examined under different sand particle size, varying sand densities and inclination angles, and at wind speeds of 5m/s, 10m/s, and 15m/s. Both theoretical and experimental results showed that the output power of the module declines with increasing sand density. As the sand particle size increases, the module maximum output power rises and then stabilizes. The two control variables, namely sand density and sand particle size, influence the module temperature and light transmittance distinctly. Contrary to the impact of sand density on the module filling factor curve, the module filling factor exhibits varying trends under different sand particle sizes. Additionally, the pattern of the module filling factor as a function of sand density contrasts with that of the module temperature under analogous conditions. Specifically, when the sand density on the PV module surface increases from 0 to 40g/m², there is a 32.2% reduction in maximum output power. At a wind speed of 15m/s, this reduction was found consistent across all wind speed categories. Furthermore, the trend of the module filling factor rel-ative to sand accumulation density contrasts with the module temperature trend under analogous conditions. Notably, the filling factor reached its apex at a sand accumulation density of 35g/m², which corresponded to the module temperature's nadir during the experiment.
Keywords:
photovoltaic module
; sand accumulation density
; output characteristics
; fill factor
1. Introduction
PV power generation systems not only produce clean energy but also contribute to land restoration and ecological conservation, mitigating land degradation and water consumption. Establishing PV power stations in desertification areas enhances desert land coverage and stabilizes the soil surface layer, thereby reducing the occurrence of dust and sandstorms. It also augments land rehabilitation capacities. The Inner Mongolia region of China, characterized by expansive desert landscapes, possesses abundant solar radiation resources, making it a promising location for PV power generation bases and related industries. However, solar photovoltaic power generation is significantly influenced by various climatic factors, including solar radiation, ambient temperature, humidity, wind speed, and dust accumulation. Therefore, understanding these influencing factors is paramount to guide the subsequent construction of PV power plants.[1]
Syed A.M. Said et al. [2] conducted a study on the dust accumulation on a PV module's glass cover, which was tilted at 26° and left exposed for 45 days. Their findings indicated a 20% reduction in glass transmittance and a dust accumulation of 5 g/m². Notably, the transmittance reduction was less pronounced for the anti-reflective coated glass compared to its uncoated counterpart. The adhesion of particles to the flat surface was observed to increase with particle size, attributed to a larger contact area. Furthermore, at elevated humidity levels, an increase in vertical adhesion was noticed, resulting from the centrifugal force between the dust particles and the glass. In a separate study, Ahmed Bouraiou et al. [3] explored the performance of PV modules in desert conditions, focusing on daily weather variations. The experimental results revealed a degradation in key performance parameters, including Imax, Vmax, Pmax, Voc, Isc, and FF. Mohammed Mostefaoui et al. [4] evaluated four photovoltaic modules, particularly their current-voltage characteristics, to determine the impact of sand and dust. Their results demonstrated that sandstorms and dust accumulation diminished module performance, primarily due to decreased transmittance. They emphasized that during sandstorms, particle deposition density substantially increases. Furthermore, in Saharan conditions, PV modules that weren't cleaned showcased a significant decline in power output, with the exception of shading mismatch in partially cleaned modules. Amirpouya Hosseini et al. [6] identified that both the mass density and properties of dust play a pivotal role in dictating their effect on PV module performance. Striving to decipher a mathematical correlation between mass deposition density and its global influence on photovoltaic modules, the team introduced a novel mathematical method. This method seamlessly integrated a double diode photovoltaic model with a pre-existing mathematical relationship, serving as a predictive tool for dust effects on PV performance. Yue Gaowei et al. [7] conducted a comparison between wind tunnel experiments and theoretical simulations of wind and sand. Their findings indicate that theoretical simulations align more closely with the sand transport rate and wind speed derived from wind tunnel experiments. Zong Yumei et al. [8] observed that while ground roughness amplifies with rising wind speed, it exhibits a declining trend as humidity increases. Zhang Feng et al. [9] investigated the implications of ash accumulation on the power generation capabilities of photovoltaic (PV) modules. Their data suggests a marked decline in power at the maximum power point as dust accumulates. Zhang Yu et al. [10] assessed the impact of dust accumulation on the efficacy of rooftop PV power plants. Their findings underscore that power generation disruption due to dust is primarily a result of changes in solar transmittance at the module surface. However, a comprehensive theoretical analysis remains absent. Wu Yongxin et al. [11] measured the PV modules' output power in the Dali region, both pre and post dust accumulation. Between January and May, without rainfall interference, the decrease in PV module output power attributable to sand and dust was consistent across months, resulting in an 11.4% to 13.3% reduction in power generation efficiency. Conversely, from June to October, the seasonal rainfall in Dali substantially mitigated dust accumulation on PV module surfaces. This led to an enhancement in the PV modules' relative power generation efficiency. Nevertheless, natural cleaning processes fail to entirely eliminate the adverse effects of sand and dust particles. Wang Shengjie et al. [12] examined the dust accumulation patterns on PV modules in the Hohhot region. Their experiments revealed that for dust accumulation levels of 2.75 g/m², 4.59 g/m², and 5.86 g/m², the corresponding average daily attenuation rates were 1.29%, 3.42%, and 4.71%. Chen Y et al. [13] implemented controlled dust deposition experiments on PV modules, establishing three distinct sand and dust coverage densities: 10 g/m², 20 g/m², and 30 g/m². Their results demonstrated that a dust density of 10 g/m² led to a 34% reduction in the PV module's peak output power. As dust density increased progressively, there was a consistent decline in component output power, which eventually plateaued upon reaching a specific threshold of sand and dust accumulation; Mustapha Dida et al. [14] examined the accumulation of sand and dust on photovoltaic (PV) modules in a Sahara desert environment through experimental methods. After 8 weeks of exposure, the modules amassed approximately 4.36 g/m² of sand and dust. The maximum output power, short-circuit current, and open-circuit voltage experienced reductions of 8.41%, 6.10%, and 0.51% respectively, when compared to clean modules. Furthermore, power generation from grid-connected PV plants in the vicinity was assessed pre and post a sandstorm, revealing a 32% decline in power generation due to the sandstorm. Sara Lasfar et al. [15] embarked on an experimental investigation of the influence of sand and dust particles on the electrical performance of PV modules in the Nouakchott region. Parameters such as I-V and P-V curves, open-circuit voltage (Voc), short-circuit current (Isc), and maximum power currents and voltages (Imp and Vmp) were measured. Significant perturbations of the I-V and P-V curves were observed when the modules were covered with sand and dust. This led to reductions in the Isc and Imp values for the dusty modules in contrast to their clean counterparts. Seyyed Ali Sadat et al. [16] gathered authentic sand and dust particles from the vicinity of a power plant in an Iranian region. This collected matter was uniformly distributed on a single PV module for experimental analysis. The particle size distribution of these samples predominantly ranged from 1 μm to 30 μm, with an average size of 8 μm. As the density of sand and dust increased (from 0.1 μg/m² to 3.3 μg/m²), there was a substantial decline of about 98.0% in the output efficiency of the PV module. Elemental analysis of the local sand dust revealed a composition mainly of Si, O, Al, and Ca; Dhaouadi Rached [17] and colleagues assessed the impact of seasonal variations on dust and PV performance losses over 15 weeks in the summer of 2018 for the Sharjah region. Dust samples, obtained using a customized device from glass sheets, were predominantly carbon, oxygen, calcium, and silica-rich, suggestive of silica and calcite presence. A 30% decline in light transmission was observed after 15 weeks of dust buildup from UV tests. Various determinants influencing sand and dust particle deposition on PV module surfaces were explored to mitigate this deposition. Yang Yalin [18] and team undertook an indoor artificial dust-laying experiment to address dust accumulation in agricultural photovoltaic devices. Their findings revealed that sand and dust particles of sizes 0-38, 38-75, 75-110, and 110-150 μm curtailed the module's power output by 16.0%, 12.5%, 8.2%, and 5.4%, respectively. Yao Wanxiang [19] and associates established test stands in Tianjin with orientations in four cardinal directions, accompanied by six tilt angles (15°, 30°, 45°, 60°, 75°, and 90°) in each. Data indicated that PV modules facing south were most impacted, and the tilt angle's influence on the modules was significant. Martin Paul Ndeto [20] et al. studied the influence of mounting height, tilt angle, and southward wind on sand and dust deposition on photovoltaic modules. Under southward wind, modules mounted less than 2.0 m in height and facing north exhibited a heightened dust deposition rate compared to their southern counterparts at equivalent heights and tilts. Nearly horizontal tilts (5°) manifested increased dust particle deposition. Optimal mounting height and tilt for the Kenyan region were discerned to be 2.5 m and 15°. Amin Khodakaram-Tafti [21] and his team examined PV modules at various tilt angles (0°, 15°, 30°, and 45°) in a semi-arid setting. Their data suggested a strong correlation between dust accumulation and tilt angle. PV module output power declined by 58.2%, 27.8%, 21.7%, and 20.7% under the respective tilt angles. Incorrect tilt settings were inferred to indirectly curtail PV module output power. Moreover, external environmental conditions also influenced sand and dust particle deposition.[22]
2. Model Formulation and Boundary Conditions
In this study, a desert photovoltaic power plant located in the Inner Mongolia region serves as the backdrop. The power plant has installed fixed photovoltaic arrays, for which the computational model required for simulation is simplified, as depicted in Figure 1. For numerical simulation, the Realizable turbulence model was chosen, and the particulate matter description selected was the DPM model, which is most aligned with the actual conditions. Additionally, a random collision model was incorporated.[23,24]
In the simulation configuration, airflow is treated as an incompressible and constant stream. Numerical simulations for gas-solid two-phase flow are conducted under varying inclination angles and wind speeds. The facing surface of the PV module is designated as the flow field inlet, with a velocity inlet employed in the configuration. Conversely, the rear side of the PV module serves as the outlet, utilizing a pressure outlet as its boundary condition. Both the PV module's surface and the internal computational domain are defined as no-slip wall surfaces. A component transport model is incorporated into the solution configuration to adjust the relative humidity of the ambient air. The boundary condition specifications are detailed in Table 1.
3. Experimental Tests
3.1. Experimental Setup
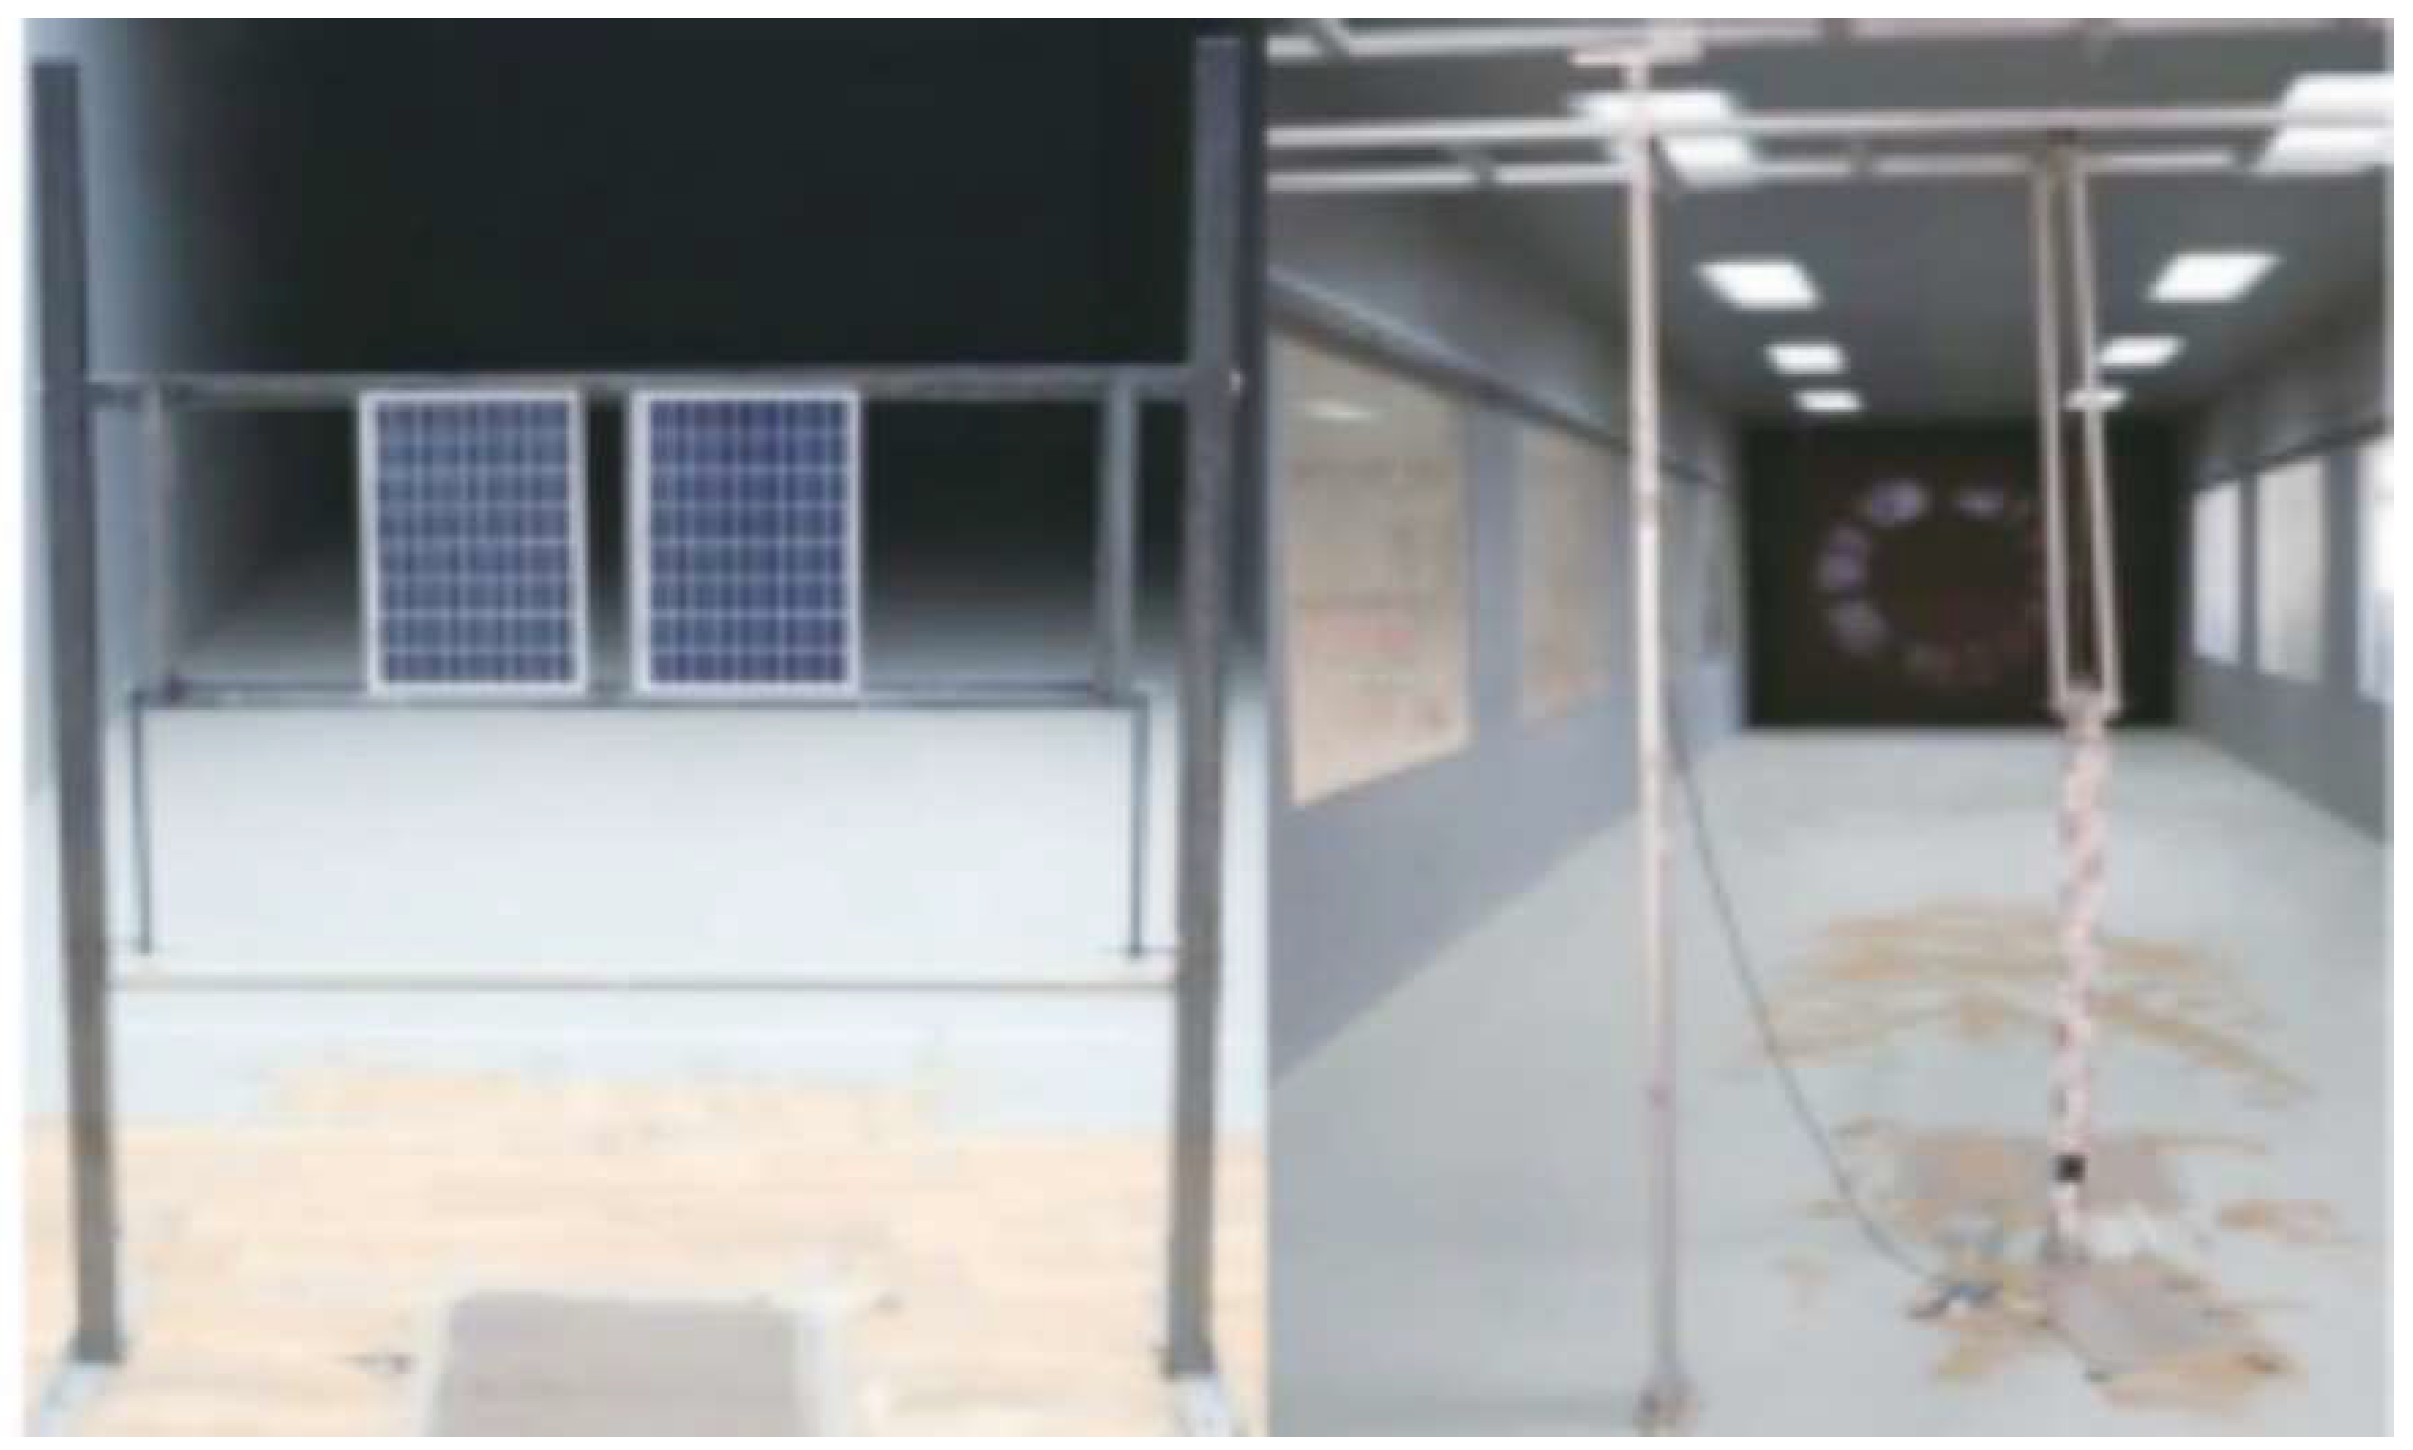
The experiment was conducted in a DC boundary layer wind tunnel located in Beijing. The photovoltaic modules employed were identical to those utilized in the field desert study. The wind tunnel's cross-section measures 3.0m × 2.5m with an overall length of 20m. The designed wind speed for the experimental section can reach up to 30m/s and is continuously adjustable. Sand utilized in the experiments, with mixed granular sizes, was sourced directly from the field experimental sites. The research focused on assessing the impact of sand and dust on the output performance and temperature of the photovoltaic system under varied sand densities, wind speeds, and inclination angles.
To simulate general weak, moderate, and strong sandstorms as described in references [25,26,27,28,29], experiments were conducted using varying sand densities at wind speeds of 5 m/s, 10 m/s, and 15 m/s to assess the influence of sand density on the transmission rate. Subsequently, for the sand accumulation study, the module tilt angle was adjusted to 0°, 15°, 30°, 45°, 60°, 75°, and 90°. Lastly, the sand density on the PV module surface was varied from 0 to 40g/m². This variation aimed to observe the alterations in the PV module's fill factor value and the sand density on its surface over time, as well as to track the module temperature's response to changing sand densities.
Figure 2.
Layout of the test site.
The particle size distribution of the dust sampled from the desert surface was determined using the Neopartek Helos particle size analyzer from Germany, boasting an accuracy of σ±1%. The findings are detailed in Table 2. The data in Table 2 indicate that the particle sizes of sand dust from this desert region predominantly fall between 0.05 mm and 0.30 mm. Consequently, for experimental analysis, sand dust samples were segregated into seven consecutive particle size intervals: <0.04 mm, 0.040.06 mm, 0.060.08 mm, 0.080.10 mm, 0.100.20 mm, 0.200.30 mm, and 0.300.40 mm.
The particle size intervals for the sand and dust particles were determined using the sieving method, which employs sieves of varying sizes. Equal masses of sand particles from each size interval were then uniformly distributed across the surfaces of the seven PV modules, as illustrated in Figure 3. The experimental setup remained consistent with that of the prior experimental phase.
For operational PV modules, the maximum output power dictates the capacity benefit, while the fill factor is pivotal in determining the energy conversion efficiency. This study aims to holistically analyze the output characteristics of PV modules, factoring in these crucial parameters and integrating the findings from experiments investigating the impact of sand and dust on the temperature performance of PV modules.[30]
3.2. Analysis of Experimental Results
3.2.1. Effect of different sand density on the maximum output power of photovoltaic modules
Figure 4 depicts the correlation between the PV module's maximum output power and the sand density on its surface over time. Evident from Figure 4, as the sand density on the PV module's surface escalates, there is a corresponding decline in its maximum output power. Beyond a certain sand density threshold, the fluctuation in the maximum output power diminishes, converging to a stable state. Notably, as the sand density on the module's surface increases from 0 to 40g/m², there is a 32.2% reduction in the maximum output power. This highlights the profound influence of sand and dust on the PV module's output capacity.[31]
Figure 5 illustrates the influence of sand accumulation on the transmittance of PV modules. When sand is present on the module surface, the light intensity, denoted as U, is scattered and absorbed by the sand particles. The absorbed light energy, ΔU₁, is converted into thermal energy. The resultant scattered light intensity is ΔU₂. A fraction of this scattered light is redirected to the module surface. The light, U₁, is scattered onto the module glass plate by the sand particles, undergoing another cycle of transmission and reflection on the glass plate. Because of the interference of sand and dust, the light intensity intended to reach the module surface through the glass cover plate, originally U, diminishes to (U-ΔU₁+ΔU₂). This decrease results in reduced power. This observation aligns with the notion that the primary effect of sand accumulation on the module output power is attributed to decreased transmittance on the module surface.
3.2.2. Effect of different sand particle sizes on the maximum output power of photovoltaic modules with the same sand quality
Figure 6 illustrates the correlation between the maximum output power of PV modules and varying sand particle sizes under consistent sand quality conditions at distinct intervals. As depicted, the maximum output power for a pristine PV module surpasses that of one contaminated with sand and dust. Moreover, there is an overall upward trend in the maximum output power with increasing particle size (excluding the clean state), which eventually plateaus. Notably, when particle size ranges between 0.04-0.06mm, the module's maximum output power dips to its lowest, declining by 0.5 W. This decline can be attributed to the shading effect caused by accumulated sand on the PV module surface. This effect diminishes the overall radiative energy received by the module, thereby decreasing its glass cover plate's transmittance by up to 6.0%, with the minimum reduction being 0.2%. This phenomenon is further explained by considering that a constant mass of sand and dust will have fewer larger particles, leading to wider inter-particle spaces and subsequently a diminished impact on PV module transmittance. Consequently, a module with particle sizes ranging from 0.06-0.10mm exhibits a relative transmittance that is 1.17% higher than that of a module with particle sizes between 0.04-0.06mm, resulting in a relative recovery in its maximum output power.
3.2.3. Experimental results and analysis of the relationship between mounting inclination and sand accumulation on the surface of photovoltaic modules
In Inner Mongolia, the optimal tilt angle for PV modules is determined to be approximately 45°. Simulations were conducted on PV modules at this 45° tilt angle under varying wind speeds. As depicted in Figure 7, the minimum dust accumulation occurs at a wind speed of 5m/s, while the maximum accumulation is observed at 15m/s.
Figure 8 illustrates the accumulation of sand on photovoltaic (PV) modules at various inclination angles under the same wind speed. With an increase in the inclination angle, the adherence of sand and dust progressively increases, peaking at 60°. Beyond 60°, the accumulation diminishes, yet the PV panel surface exhibits non-uniform distribution, with certain areas accumulating more dust than others. Three sets of experiments were performed with sand densities of 5g/m³, 10g/m³, and 15g/m³, coupled with wind speeds of 5m/s, 10m/s, and 15m/s. As presented in Figure 9, under the same wind speed but varying sand concentrations, the power generation rate generally first decreases, then ascends. At a wind speed of 5m/s and inclination angles between 0° and 90°, the relative power generation rates are comparable. This similarity arises because at 0° inclination, the PV panel surface aligns with the wind and sand flow direction, resulting in minimal sand deposition due to the negligible horizontal force acting on the sand particles. Conversely, at an inclination of 90°, the panel surface is perpendicular to the sand flow, causing the majority of sand particles to slide off due to combined gravitational and elastic forces. Between inclination angles of 0° and 60°, an increased inclination correlates with a declining power generation rate. At 60°, the relative power generation rate drops to its lowest, 94.2%, marking a 5.8% energy loss compared to the peak rate. The minimal fluctuations in the ratio can be attributed to the low wind speed, which prevents larger sand particles from adhering to the module.
At a wind speed of 10m/s with a sand and dust concentration of 15g/m³, the relative power generation rate remains relatively stable, reaching its lowest value at an inclination angle of 60°. When the inclination angle is below 30°, the influence of increased sand and dust concentration on the relative power generation rate becomes more pronounced. When the wind speed is elevated to 15m/s, the component output power across varying tilt angles demonstrates greater stability compared to wind speeds of 5m/s and 10m/s. At a 60° tilt angle, the relative power generation rate declines to its nadir of 86.5%, resulting in a 13.7% energy reduction relative to the peak generation rate. These experimental observations are consistent with simulation outcomes.
The effects of various factors on photovoltaic (PV) modules differ. Specifically, under different wind speeds, sand densities, and installation inclination angles, the impact on PV modules varies. With varying installation inclination angles, the force exerted on sand particles during their settlement process changes, leading to alterations in the amount of sand settling on the PV module's surface. Moreover, the inclination angle influences the scouring effect on the PV module surface. Given a certain precipitation level, different PV module installation tilt angles result in varying scouring intensities and rain flow diameters on the module surface, which subsequently affects the scouring outcome.
The experimental results discussed above are analyzed based on various forces acting on the sand particles on the surface of the PV module. These forces include Fv, representing the force exerted by the PV module on the sand particles; Fu, denoting the frictional resistance of the module against the sand; and G, which signifies the intrinsic gravitational force of the sand. The mounting inclination of the PV cell, represented by θ, also plays a pivotal role, as depicted in Figure 10. Here, Ga and Gb stand for the gravitational forces of the sand particles in directions parallel and perpendicular to the PV module surface, respectively, as detailed in the accompanying equation.
From Figure 10, which illustrates the force exerted by sand particles on the surface of the PV module, it becomes evident that, without accounting for intermolecular forces such as electrostatic forces, the force exerted by the sand particles on the module surface varies with the mounting inclination θ of the PV module. This variation subsequently influences the settlement of sand particles on the module surface. Consequently, the characteristics related to the quantity of sand and dust settling on the PV module surface are altered, leading to corresponding changes in the module's external output characteristics.
In the conducted experiment, it was observed that as the wind speed and the angle of the plate surface increased, more sand particles came into contact with the component. This led to an enhanced force, Fv, exerted by the component on the sand and dust. As the interaction force between sand particles intensified, it surpassed the frictional resistance between the sand and the plate pieces. Consequently, an increased upward force was noted, making sand and dust particles more likely to deposit on the component. Furthermore, due to the intrinsic gravity, G, some sand and dust particles exhibited greater sizes than others, thereby reducing the relative power generation rate. This observed behavior can be attributed to the increased elasticity of the component towards sand and dust, and the amplified interaction force among the sand particles. However, with a rising inclination angle θ, the horizontal component of gravity, Ga, increases, causing a decrease in Gb. This scenario facilitates the easier slipping of sand and dust particles, resulting in some particles accumulating on the component's edge. These particles find it challenging to adhere to the component surface, leading to an increased ratio of particles present on the surface.
3.2.4. Influence of different sand density on the filling factor of photovoltaic modules
The fill factor exhibits a relationship with the temperature of the solar cell, typically decreasing as the temperature rises. Furthermore, the deposition of sand and dust can indirectly influence the fill factor. The impact of sand deposition on the temperature of PV modules was initially investigated experimentally. Using a density gradient ranging from 30g/m² to 40g/m², with an increment of 1g/m², the corresponding density of sand accumulation was tested against module temperature changes, as presented in Figure 11. It is evident that an inflection point appears in the module temperature when the sand density is approximately 35g/m².
Figure 12 depicts the variation in the fill factor of the PV module as a function of sand accumulation density on the module surface at various instances. Within the density range where the module temperature exhibits a change correlated with the density of sand accumulation and presents an inflection point, the density value is further refined. Supplementary experiments are conducted to elucidate this relationship, and Figure 13 presents the subsequent changes in the fill factor in relation to the set sand accumulation densities from these additional experiments.[33,34]
Figure 12 illustrates that as the density of sand accumulation augments, the fill factor of the PV module initially increases and subsequently declines. For silicon solar cells, the intrinsic determinants influencing their fill factor include the module's open-circuit voltage and short-circuit current. Analysis of experimental data reveals a pronounced difference in the sensitivity of open-circuit voltage and short-circuit current to component temperature. The variation trend of the fill factor with component temperature aligns closely with that of the open-circuit voltage concerning temperature. With a sand density increase from 0 to 30g/m², the component temperature reduces in line with escalating sand density, leading to a consistent increment in the computed fill factor value. Coinciding with the inflection point in Figure 11, an abrupt alteration in the fill factor value is discerned at a sand density of 30g/m². As the sand density rises from 30g/m² to 40g/m², there is a marked reduction in the fill factor, reaching its nadir at a sand density of 40g/m². Furthermore, data from the supplementary experiment depicted in Figure 13 indicates a nadir in component temperature at a sand accumulation density of 35g/m², while the fill factor peaks at this density. Based on the trends from both datasets, it is deduced that when the sand accumulation density on PV module surfaces is ≤ 35g/m², the fill factor ascends progressively; whereas for densities > 35g/m², the fill factor for PV modules diminishes gradually. [35,36,37]
3.2.5. Influence of different sand particle sizes on the filling factor of photovoltaic modules with the same sand quality.
The decline in output power observed in Figure 6 for the particle size range of 0.08-0.10mm will be evaluated alongside the findings related to temperature characteristics of photovoltaic modules under varying particle size coverage, as depicted in Figure 14. Upon comparative analysis, the congruence between the power decline at specific particle size intervals in Figure 6 and the corresponding temperature peaks in Figure 14 becomes evident. Notably, while a slight increase in dust particle size within this range leads to enhanced relative transmittance of the glass cover plate, a concurrent temperature peak emerges for the PV module covered by dust of this particle size. As the module conversion efficiency is inversely related to its temperature, the resultant decline in combined module output power can be attributed to the significant temperature increase adversely affecting the module conversion efficiency, which becomes the predominant factor influencing power.[32]
Figure 15 illustrates the correlation between diverse particle sizes and the filling factor of PV modules across various time points, given a consistent dust mass. A comparative examination of Figure 14 and Figure 15 reveals that the trend in the module filling factor as a function of sand dust particle size is almost inversely proportional to the trend in PV module temperature with respect to particle size.
In the experiment across seven predefined sand particle size intervals, the filling factor reveals two pronounced peaks. Specifically, these peaks appear within the particle size intervals where the PV module temperature experiences its minimum values. The most elevated filling factor is discerned within the 0.04-0.06 mm particle size range, reflecting a 4% enhancement relative to a pristine module. In contrast, the most diminished filling factor arises within the 0.08-0.10 mm particle size interval, which corresponds with the zenith of the module temperature. Upon thorough analysis, it becomes evident that the filling factor exhibits a trend of nearly monotonic decrease in relation to increasing module temperature. This analytical observation underscores that the magnitude of the filling factor for PV modules, when ensconced by sand and dust of different particle sizes, hinges profoundly on the prevailing module temperature. Notably, this module temperature amplifies with the augmentation of the sand and dust particle size. This relationship unfolds as an intriguing pattern of initial ascent, followed by a descent, and culminating in a subsequent ascent. Such a dynamic can be attributed to the variations inherent in the particle sizes of the sand and dust, engendering diverse blockage areas and spacings. These disparities consequently mediate the irradiance of PV modules when they are cloaked by these particles. Predominantly, desert dust is characterized by its quartz sand composition, which intrinsically boasts low thermal conductivity coupled with a diminutive heat capacity. Such inherent properties inhibit the module's heat dissipation efficiency. Consequently, when layers of sand dust settle on the module's surface, a pronounced thermal resistance effect emerges. The distinct temperature effects induced by varying dust particle sizes upon the module manifest in differentiated magnitudes and proportions. This results in the module temperature's relationship with particle size delineating a fluctuating trajectory. Subsequently, the filling factor of the PV module, as influenced by the dust particle size, also follows a wavering trajectory, intriguingly contrasting with the aforementioned temperature trend.[38]
5. Conclusions
The output characteristics of PV modules were assessed under three distinct wind speeds: 5m/s, 10m/s, and 15m/s. These assessments were conducted at varying sand and dust densities as well as different inclination angles. Detailed simulation and experimental observations facilitated the following conclusions:
(1) As the density of sand deposition increases on the PV module's surface from 0 to 40g/m², there's a marked 32.2% decline in maximum output power. This highlights the significant influence of sand and dust on the module's output power through their impact on the transmittance rate.
(2) Wind tunnel experiments demonstrate that at a wind speed of 5 m/s, the output power for modules at each angle remains below 5%. Remarkably, when the inclination angle reaches 60°, the relative power generation rate dips to its nadir at 94.2%, representing a power loss of approximately 5.8%. In contrast, at a wind speed of 15 m/s, the output power decline is most pronounced across all angle modules. Here, with an inclination angle of 60°, the relative power generation rate plummets to its lowest at 86.5%, indicating an electricity loss of nearly 13.7%.
(3) The photovoltaic cells fill factor's trend concerning sand density inversely mirrors the component temperature trend under analogous conditions. Notably, during the experiments, the filling factor peaked at a sand density of 35g/m², coinciding with the component temperature's lowest point.
(4) With escalating sand particle size, the maximum output power of the module initially increased and then plateaued. Notably, when the particle size ranges between 0.04-0.06mm, the module's maximum output power is observed to be at its nadir, with a maximum reduction of 0.5W. Concurrently, the relative transmittance of the module is diminished by 26.7%. The alteration in the particle size directly impacts the module's transmittance and its temperature, subsequently causing a decline in the maximum output power of the PV module.
(5) The influence of the two control variables, sand density and sand particle size, varies in proportion when assessing the module temperature and light transmission rate. The trend in the module filling factor exhibits fluctuations across different sand particle sizes, diverging from the effect curve generated by sand density on the module filling factor.
Author Contributions
Conceptualization, R.Y. and M.Z.; methodology, M.Z,D.B and C.C; software, R.Y, Y.L. and N.W.; validation, R.Y., and M.Z.; formal analysis, R.Y. and A.M.; investigation, A.M.; resources, R.Y.; data curation, R.Y.; writing—original draft preparation, R.Y.; writing—review and editing, R.Y.; visualization, R.Y.; supervision, A.M. All authors have read and agreed to the published version of the manuscript.
Funding
This work was supported by project of Inner Mongolia Science and Technology Department “Key technologies for solar energy application in ecological restoration and modern agriculture in deserts and saline-alkali lands.”(2020CG0066).
Data Availability Statement
Not applicable.
Conflicts of Interest
The authors declare no conflicts of interest.
References
- Zhao, M.Z.; Wang, S.; Zhang, Z.M. Experimental study on effect of desert sand on temperature performance of photovoltaic modules. Journal of Solar Energy 2020, 41, 293–298. [Google Scholar]
- Said, S.A.M.; Walwil, H.M. Fundamental studies on dust fouling effects on PV module performance. Sol Energy 2014, 107, 328–337. [Google Scholar] [CrossRef]
- Ahmed, B.; Messaoud, H.; Abdelkader, C.; Mohammed, M.; Salah, L.; Mohammed, S.; Nadir, B.; Mourad, O.; Attoui, I. Analysis and evaluation of the impact of climatic conditions on the photovoltaic modules performance in the desert environment. Energy Conversion and Management 2015, 106, 1345–1355. [Google Scholar]
- Mohammed, M.; Abderrezzaq, Z.; Ahmed, B.; Seyfallah, K. Effect of sand dust accumulation on photovoltaic performance in the Saharan environment: southern Algeria (Adrar). Environmental Science and Pollution Research 2019, 26, 259–268. [Google Scholar]
- Xu, L.Y.; Li, S.Y.; J., J.M.; Liu, T.S.; Wu, H.Z.; Juan Wang, Li, X.C. The influence of dust deposition on the temperature of soiling photovoltaic glass under lighting and windy conditions. Solar Energy 2020, 199, 491–496. [CrossRef]
- Amirpouya Hosseini, Mojtaba Mirhosseini, Reza Dashti. Analytical study of the effects of dust on photovoltaic module performance in Tehran, capital of Iran.
- Yue, G.W.; Bei, W.; Jia, H.N. Theoretical simulation and wind tunnel experiment in wind-blown sand movement. Arid Land Geography 2014, 37, 81–88. [Google Scholar]
- Zong, Y.M.; Zu, R.P.; Wang, R. Effects of moisture content on sand flow in Hobq desert; a wind tunnel simulation. Journal of Soil and Water Conservation 2016, 30, 61–66. [Google Scholar]
- Zhang, F.; Bai, J.B.; Hao, Y.Z. Effect of surface area ash of photovo-Itaic module on its power generation performance. Power System and Clean Energy 2012, 28, 82–86. [Google Scholar]
- Zhang, Y.; Bai, J.B.; Cao, Y. Effect of ash accumulation on the performance of roofing photovoltaic power plant. Renewable Energy 2013, 31, 9–12. [Google Scholar]
- Wu, Y.X.; Wang, H.; Li, S.J. Effect of dust deposition on power generation performance of photovoltaic modules. Distributed Energy 2017, 2, 55–59. [Google Scholar]
- Wang, S.J.; Tian, R.; Guo, L. Research on the ash accumulation characteristics of photovoltaic module and its transmission attenuation law. Journal of Agricultural Engineering 2019, 35, 242–250. [Google Scholar]
- Chen, Y.; Liu, Y.; Tian, Z. Experimental Study on the Effect of Dust Deposition on Photovoltaic Panels[J]. Energy Procedia 2019, 158, 483–489. [Google Scholar] [CrossRef]
- Dida M, Boughali S, Bechki, D., et al. Output power loss of crystalline silicon photovoltaic modules due to dust accumulation in Saharan environment. Renewable and Sustainable Energy Reviews 2020, 124, 109787. [CrossRef]
- Lasfar, S.; Haidara, F.; Mayouf, C. Study of the influence of dust deposits on photovoltaic solar panels: Case of Nouakchott. Energy for Sustainable Development 2021, 63, 7–15. [Google Scholar] [CrossRef]
- Ali, S. S.; Faraji, J.; Nazififard, M. The experimental analysis of dust deposition effect on solar photovoltaic panels in Iran's desert environment. Sustainable Energy Technologies and Assessments 2021, 47, 101542. [Google Scholar]
- Dhaouadi, R.; Al-Othman, A.; Aidan, A.A. A characterization study for the properties of dust particles collected on photovoltaic (PV) panels in Sharjah, United Arab Emirates. Renewable energy 2021, 171, 133–140. [Google Scholar] [CrossRef]
- Yang, Y. ; Delan; LI, D. Effects of ash accumulation and light intensity on the output power of photovoltaic modules. Journal of Agricultural Engineering 2019, 35, 203–211.
- Yao, W.; Han, X.; Huang, Y. Analysis of the influencing factors of the dust on the surface of photovoltaic panels and its weakening law to solar radiation — A case study of Tianjin. Energy 2022, 256, 124669. [Google Scholar] [CrossRef]
- Ndeto, M.P.; Wekesa, D.W.; Njoka, F. Aeolian dust distribution, elemental concentration, characteristics and its effects on the conversion efficiency of crystalline silicon solar cells. Renewable Energy 2023, 208, 481–491. [Google Scholar] [CrossRef]
- Khodakaram-Tafti, A.; Yaghoubi, M. ;Experimental study on the effect of dust deposition on photovoltaic performance at various tilts in semi-arid environment. Sustainable Energy Technologies and Assessments 2020, 42, 100822. [Google Scholar] [CrossRef]
- Mehmood, U.; Al-Sulaiman, F.A.; Yilbas, B.S. Characterization of dust collected from PV modules in the area of Dhahran, Kingdom of Saudi Arabia, and its impact on protective transparent covers for photovoltaic applications. Solar Energy 2017, 141, 203–209. [Google Scholar] [CrossRef]
- Xia, Z.L.; Li, Y.J.; Zhang, W.; Chen, R.S.; Guo, S.C.; Zhang, P.; Du, P.J. Solar photovoltaic program helps turn deserts green in China: Evidence from satellite monitoring. Journal of Environmental Management, 2022; 324, 116338. [Google Scholar]
- Adinoyi, M.J.; Said, S.A.M. Effect of dust accumulation on the power outputs of solar photovoltaic modules. Renewable Energy 2013, 60, 633–636. [Google Scholar] [CrossRef]
- Hangan, S.A.B.A. A comparative investigation of the TTU pressure envelope. Numerical versus laboratory and full scale results. Wind & structures, 2002.
- Baetke, F.; Werner, H.; Wengle, H. Numerical simulation of turbulent flow over surface-mounted obstacles with sharp edges and corners. Journal of Wind Engineering and Industrial Aerodynamics 1990, 35, 129–147. [Google Scholar] [CrossRef]
- Green, M.A. General temperature dependence of solar cell performance and implications for device modelling. Progress in Photovoltaics: Research and Applications 2003, 11, 333–340. [Google Scholar]
- Ai-Hasan, A.Y. A new correlation between photovoltaic panels efficiency and amount of sand dust accumulated on their surface. Renewable Energy 2001, 22, 525–540. [Google Scholar]
- Alonso -Garcia, M.C.; Ruiz, J.M. Experimental study of mismatch and shading effects in the I -V characteristic of a photovoltaic module. Solar Energy Materials 2006, 90, 329–340. [Google Scholar] [CrossRef]
- Evans, D.L.; Florschuetz, L.W. Cost studies on terrestrial photovoltaic power systems with sunlight concentration. Solar Energy 2019, 255–262. [Google Scholar] [CrossRef]
- Schill, C.; Brachmann, S.; Koehl, M. Impact of soiling on IV curves and efficiency of PV-modules. Sol. Energy 2015, 112, 259–262. [Google Scholar] [CrossRef]
- Skoplakie; Palyvos, J.A. On the temperature dependence of photovoltaic module electrical performance: A review of efficiency/power correlations. Solar Energy 2009, 83, 614–624. [CrossRef]
- Evans, D.L.; Florschuetz, L.W. Cost studies on terrestrial photovoltaic power systems with sunlight concentration. Solar Energy 2019, 255–262. [Google Scholar] [CrossRef]
- Sayyah, A.; Horenstein, M.N.; Mazumder, M.K. Energy yield loss caused by dust deposition on photovoltaic panels. Sol. Energy 2014, 107, 576–604. [Google Scholar] [CrossRef]
- Kaldellis, J.K.; Kapsali, M.; Kavadias, K.A. Temperature and wind speed impact on the efficiency of PV installations. Experience obtained from outdoor measurements in Greece. Renew. Energy 2014, 66, 612–624. [Google Scholar] [CrossRef]
- Wang, C.; Yang, A.; Li, J.; Wang, L.; Si, Z. Experimental study on the influence of multi-factor coupling on the surface temperature of photovoltaic modules. J. Solar Energy 2019, 40, 112–118. [Google Scholar]
- Maghami, M.R.; Hizam, H.; Gomes, C.; Radzi, M.A.; Rezadad, M.I.; Hajighorbani, S. Power loss due to soiling on solar panel: A review. Renew. Sustain. Energy Rev 2016, 59, 1307–1316. [Google Scholar] [CrossRef]
- Yuan, X.L.; Wang, X.J.; Zuo, J. Renewable energy in buildings in China –a review. Renew Sustain Energy Rev 2013, 24, 1–8. [Google Scholar] [CrossRef]
Figure 1.
Geometric model of photovoltaic array.
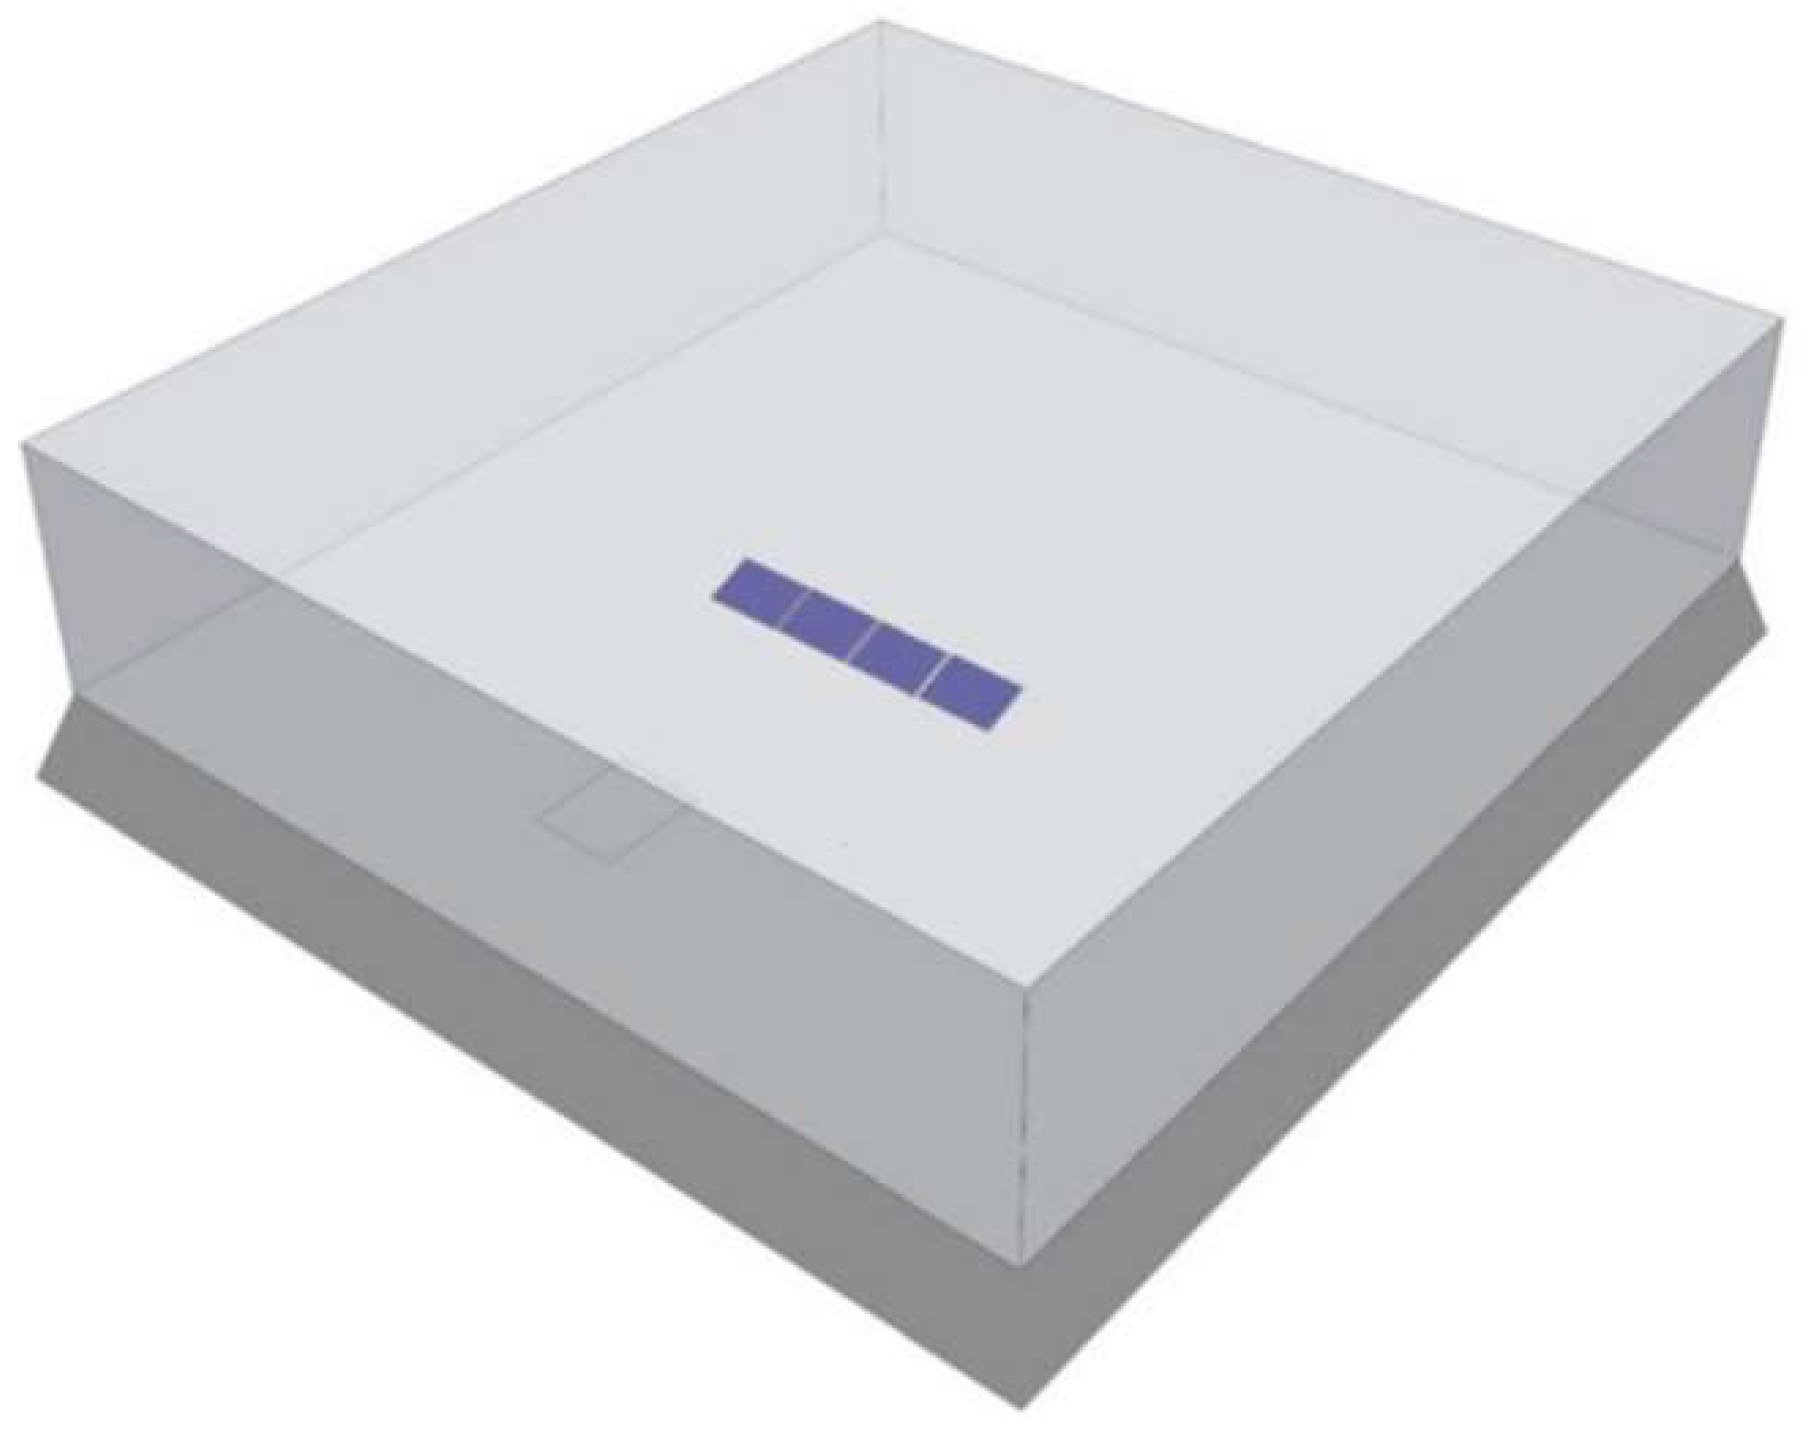
Figure 3.
Photovoltaic modules attached to different sand particle sizes.
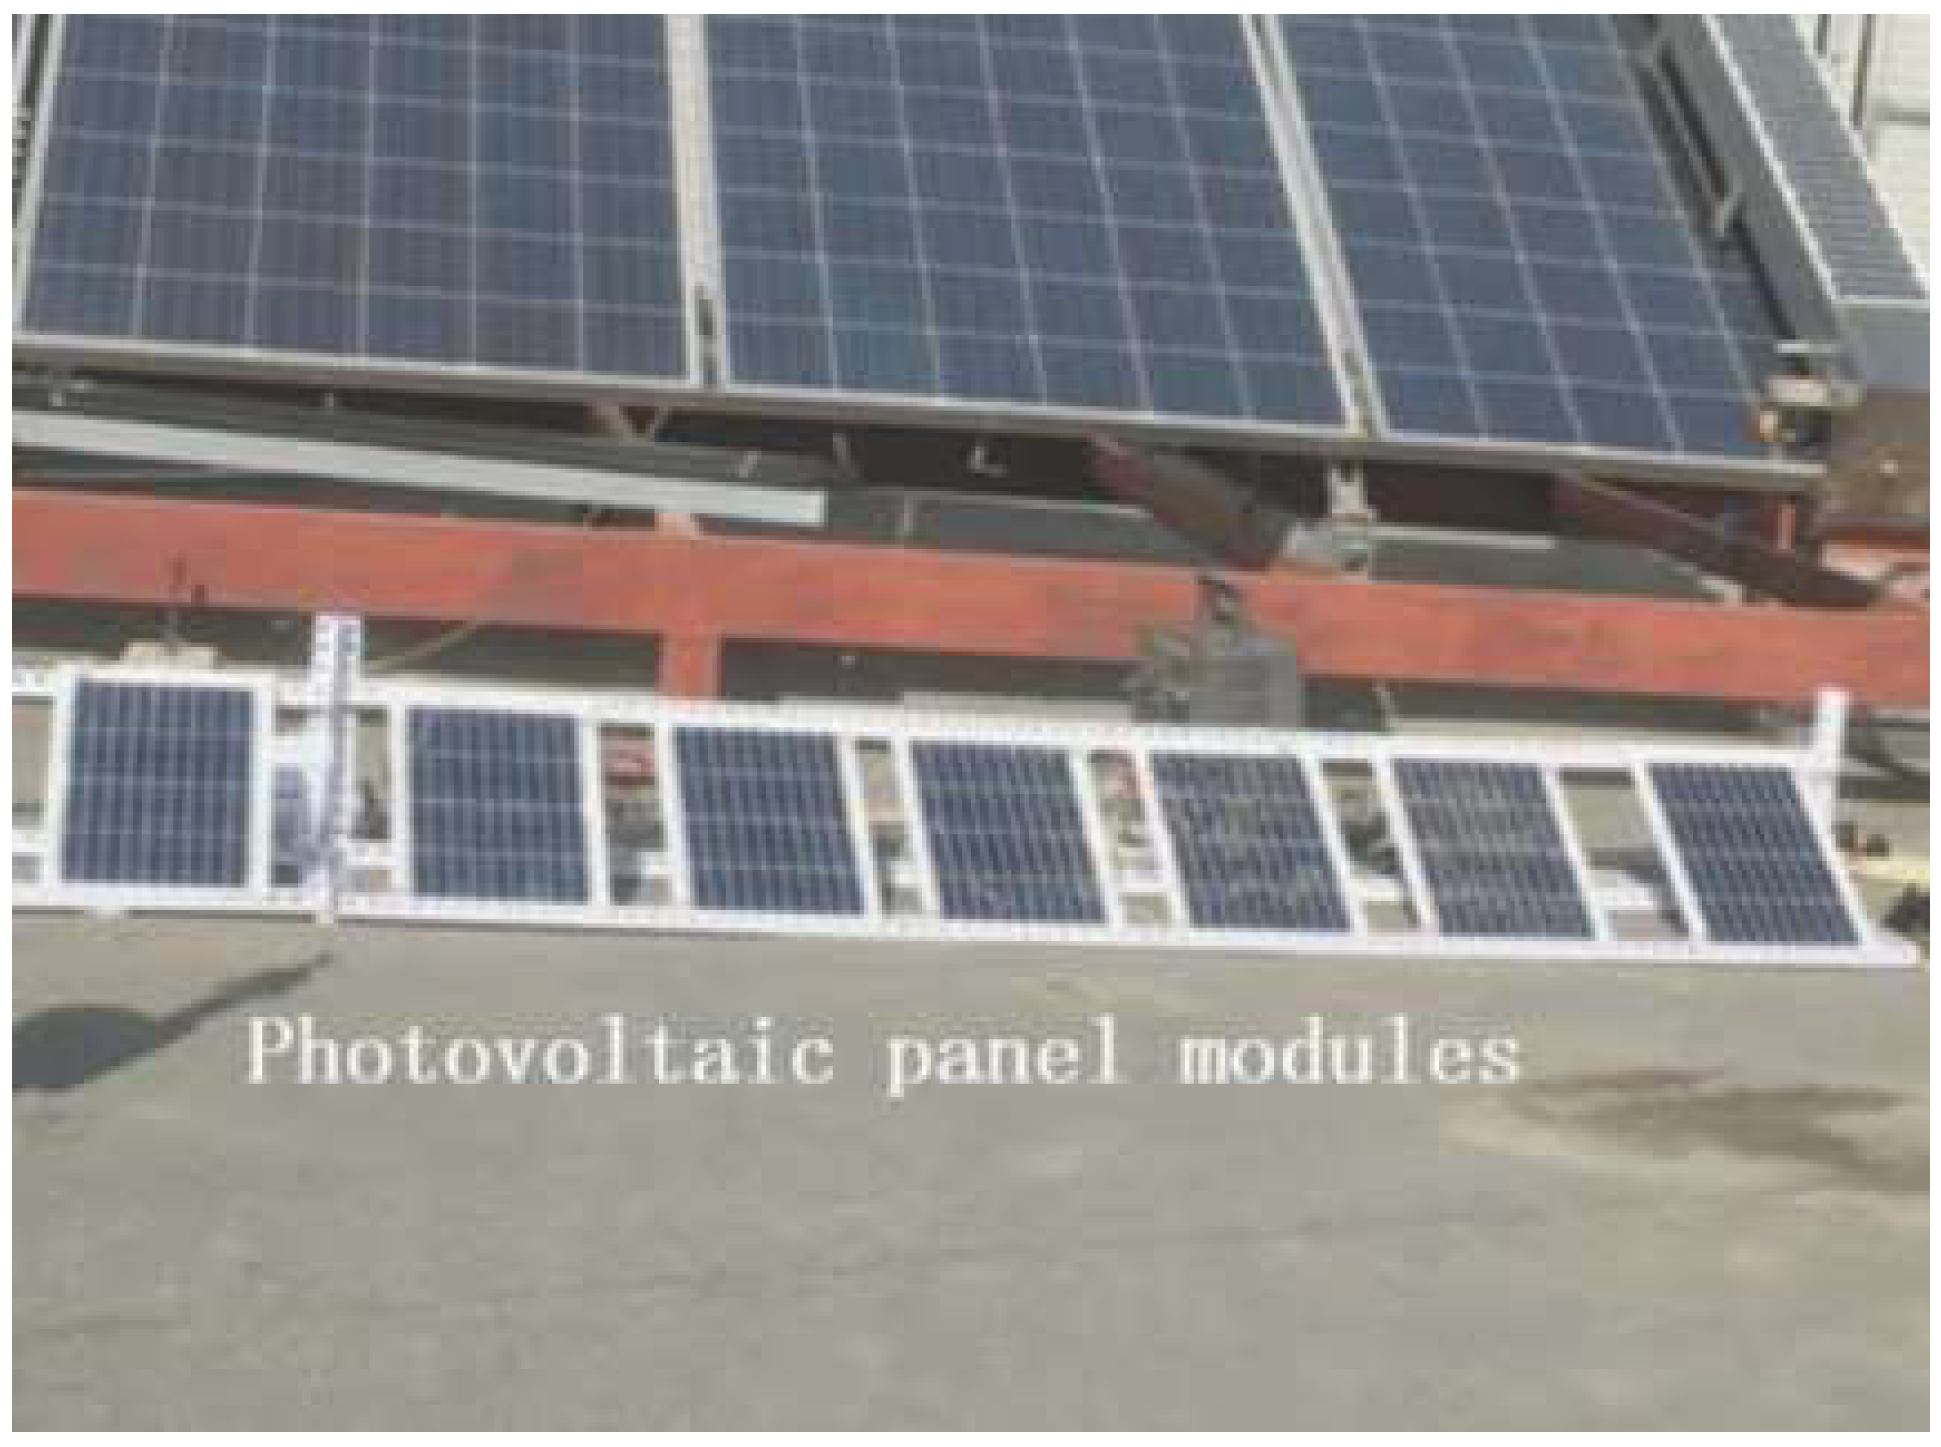
Figure 4.
The relationship between the sediment density (S) and the output power of (P) photovoltaic modules.
Figure 4.
The relationship between the sediment density (S) and the output power of (P) photovoltaic modules.
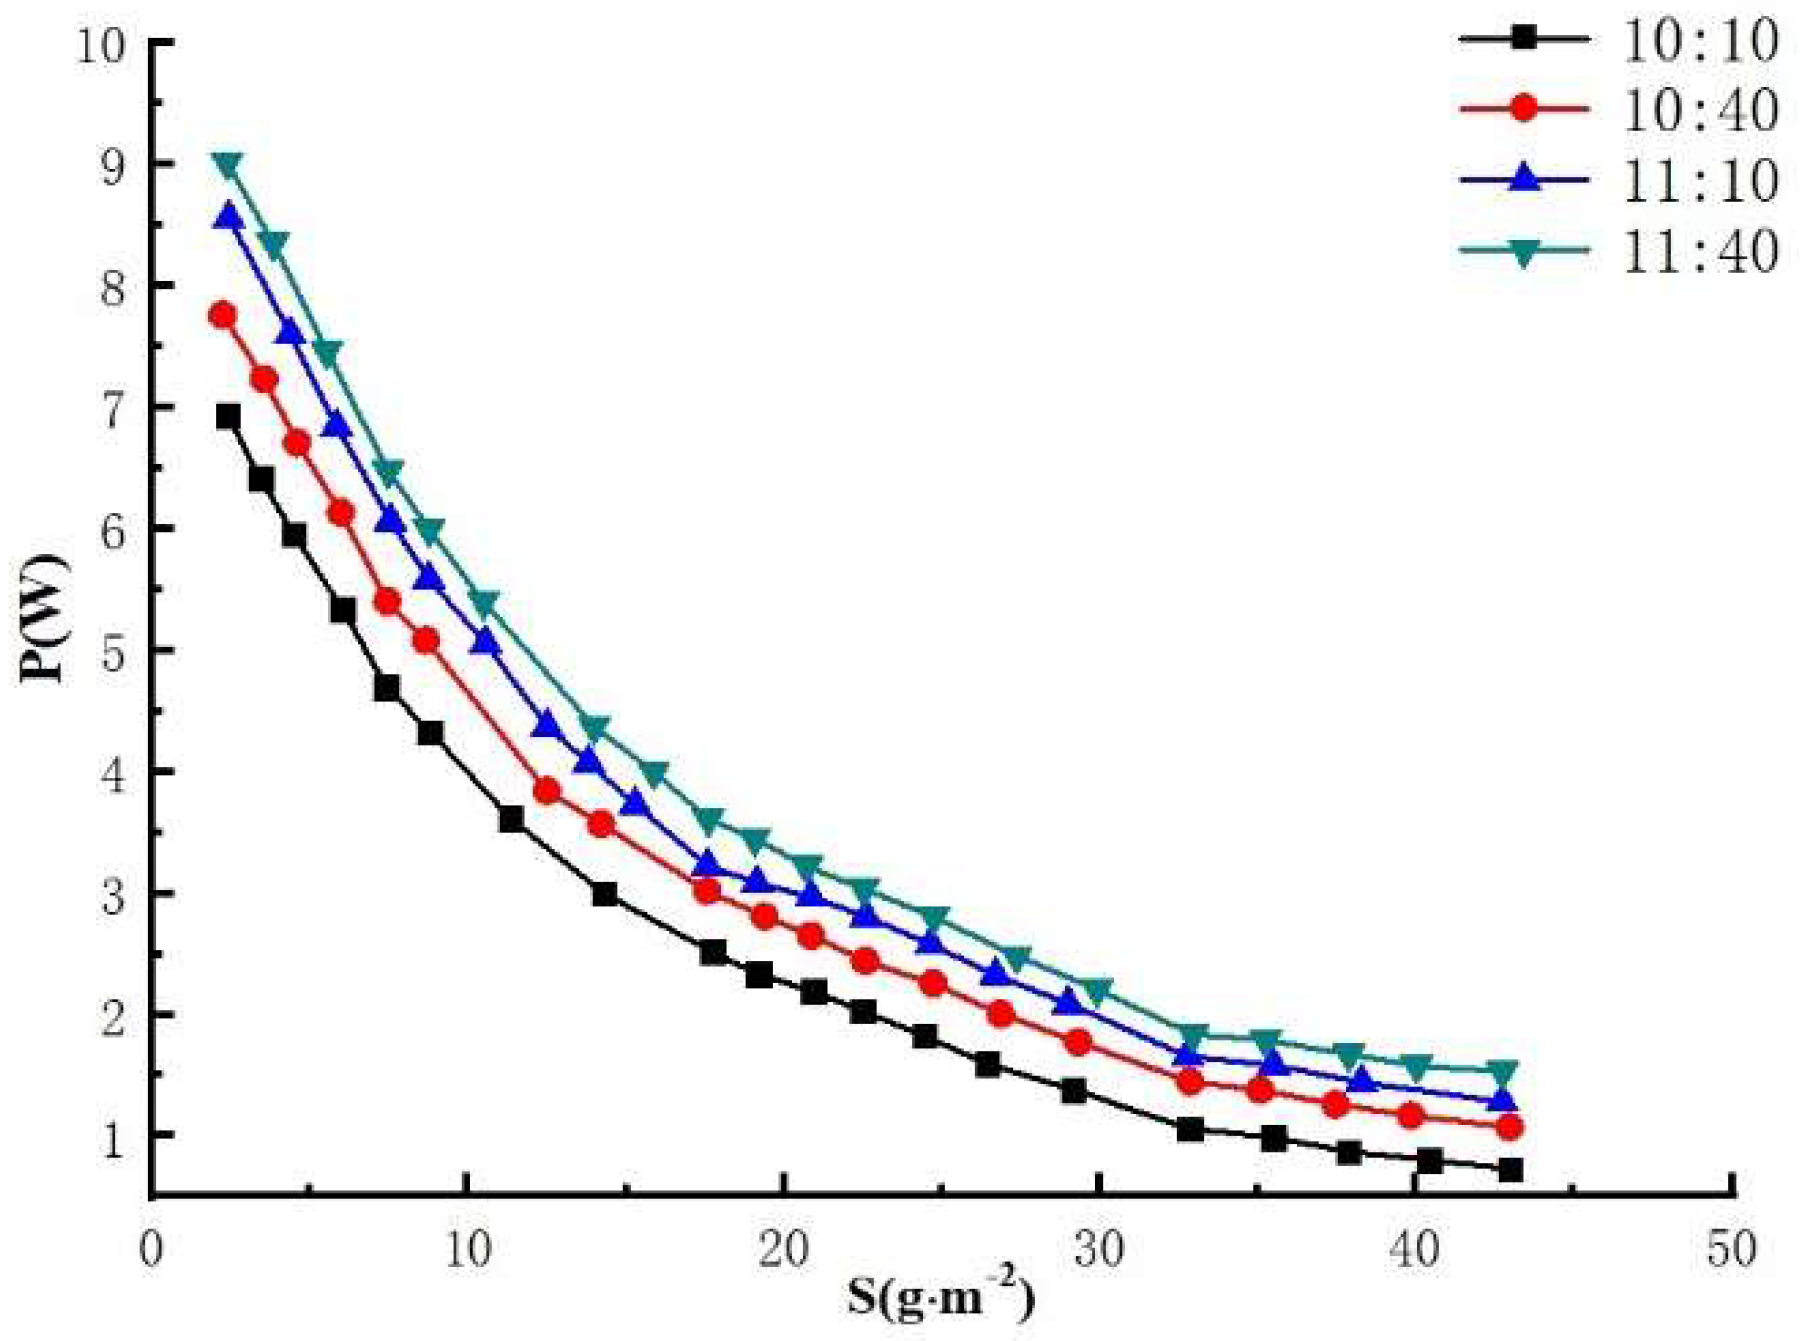
Figure 5.
Influence of sand particles on light occlusion.
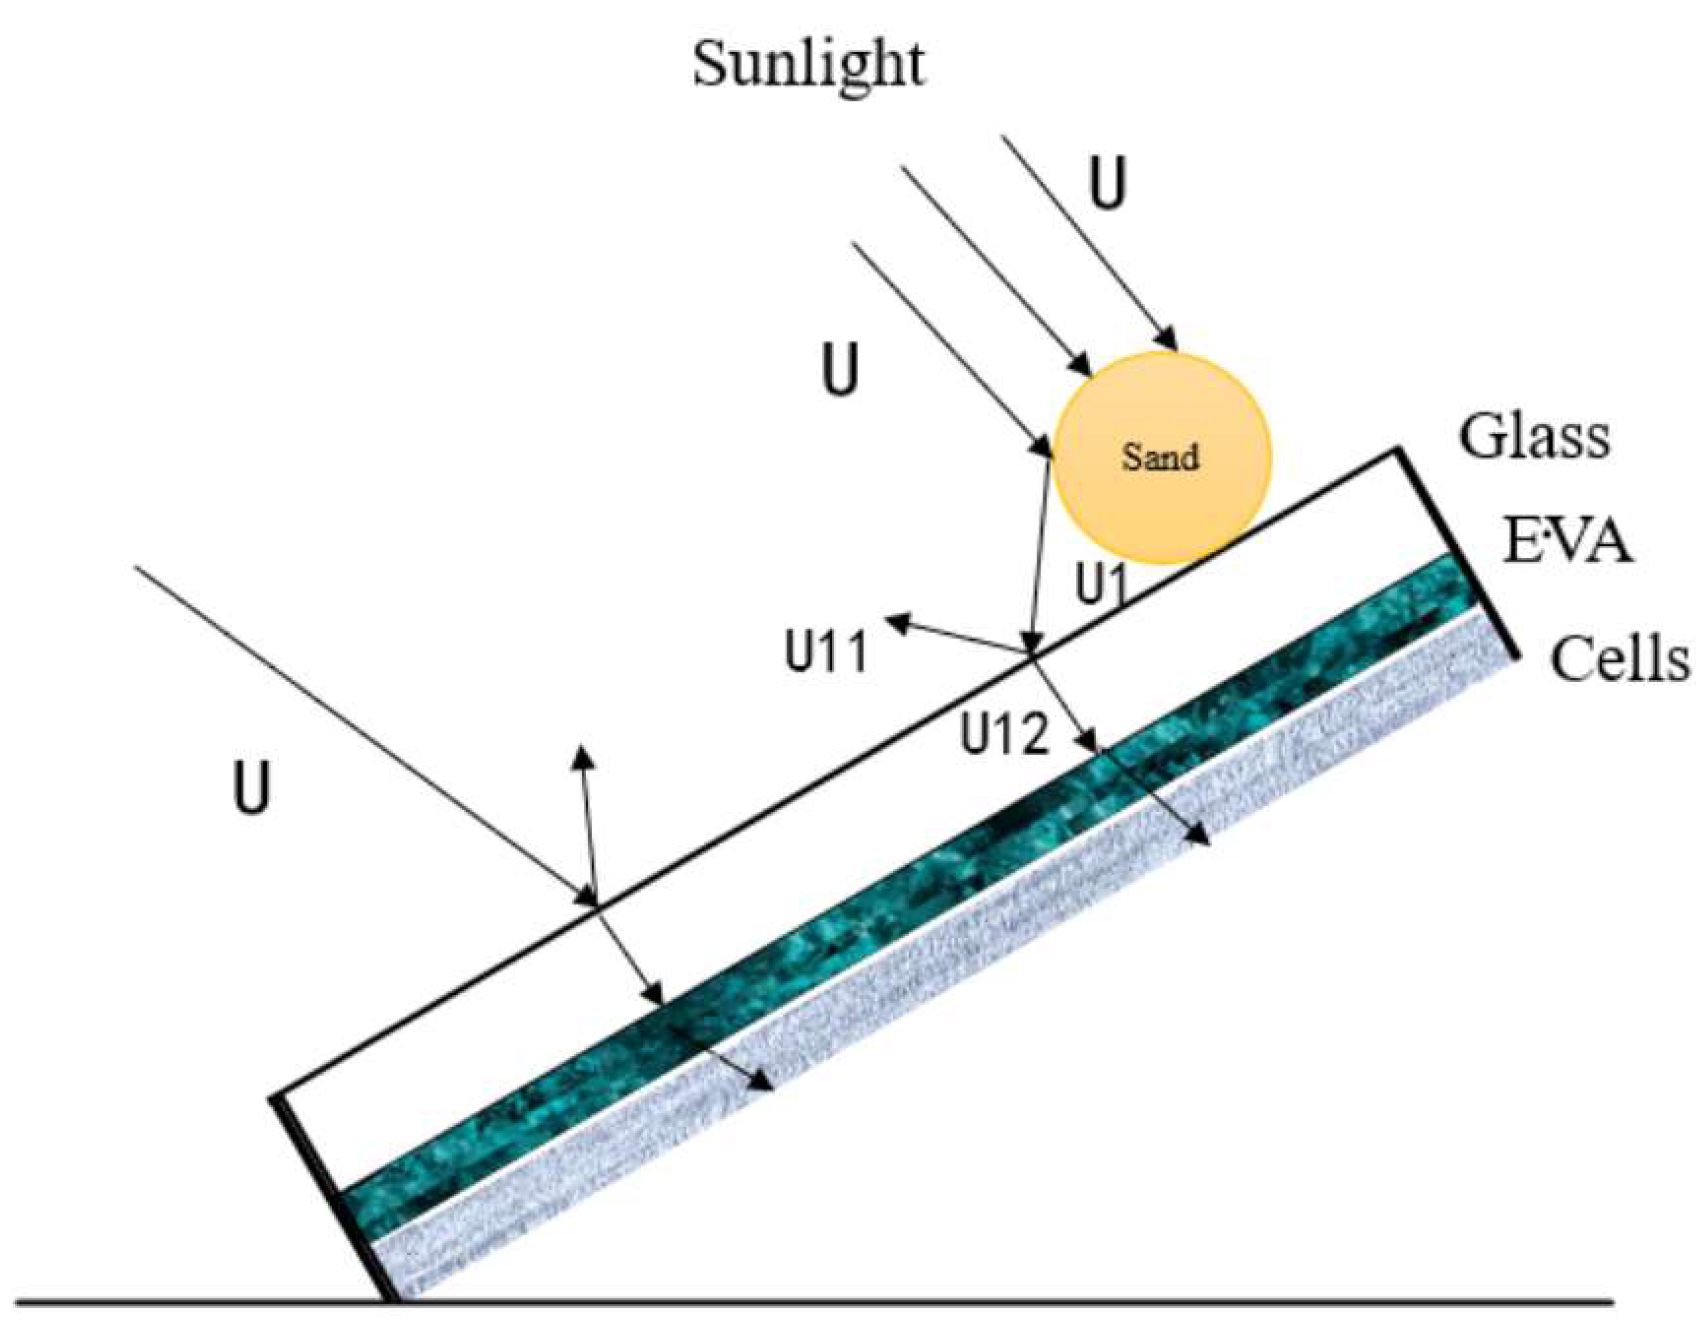
Figure 6.
Relationship between particle size of dust and output power of photovoltaic modules.
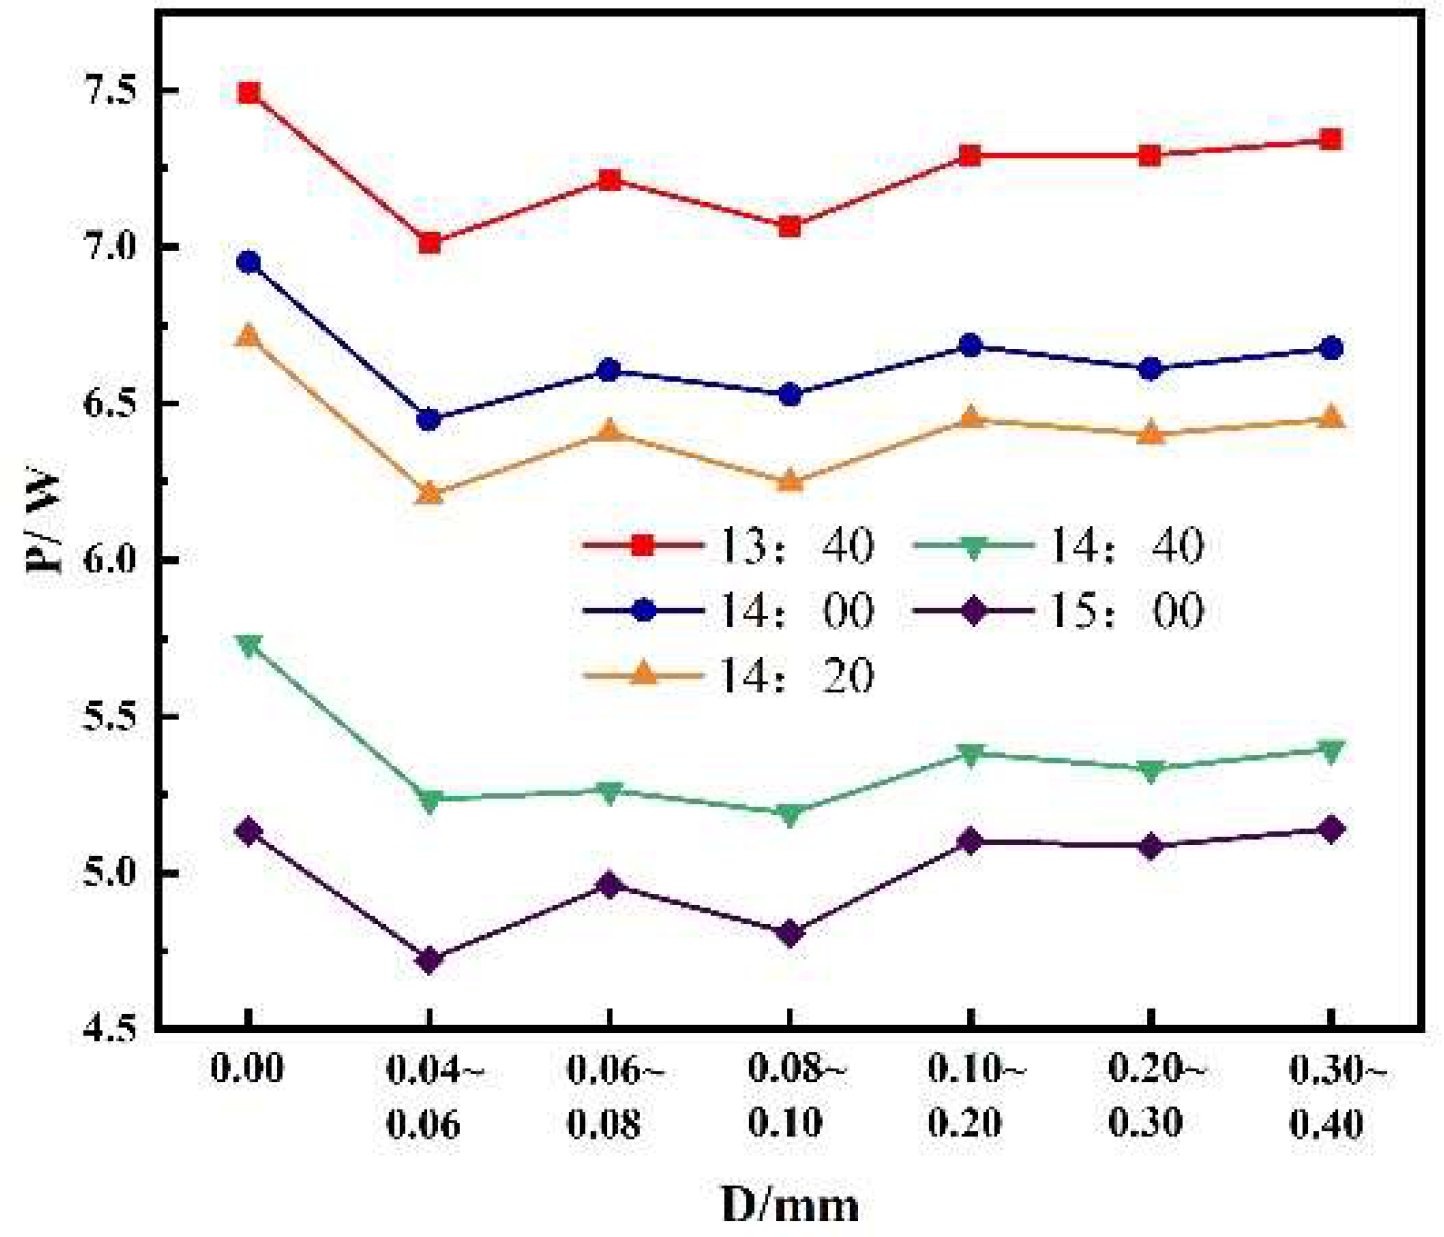
Figure 7.
Dust accumulation at different wind speeds at 45° inclination angle.
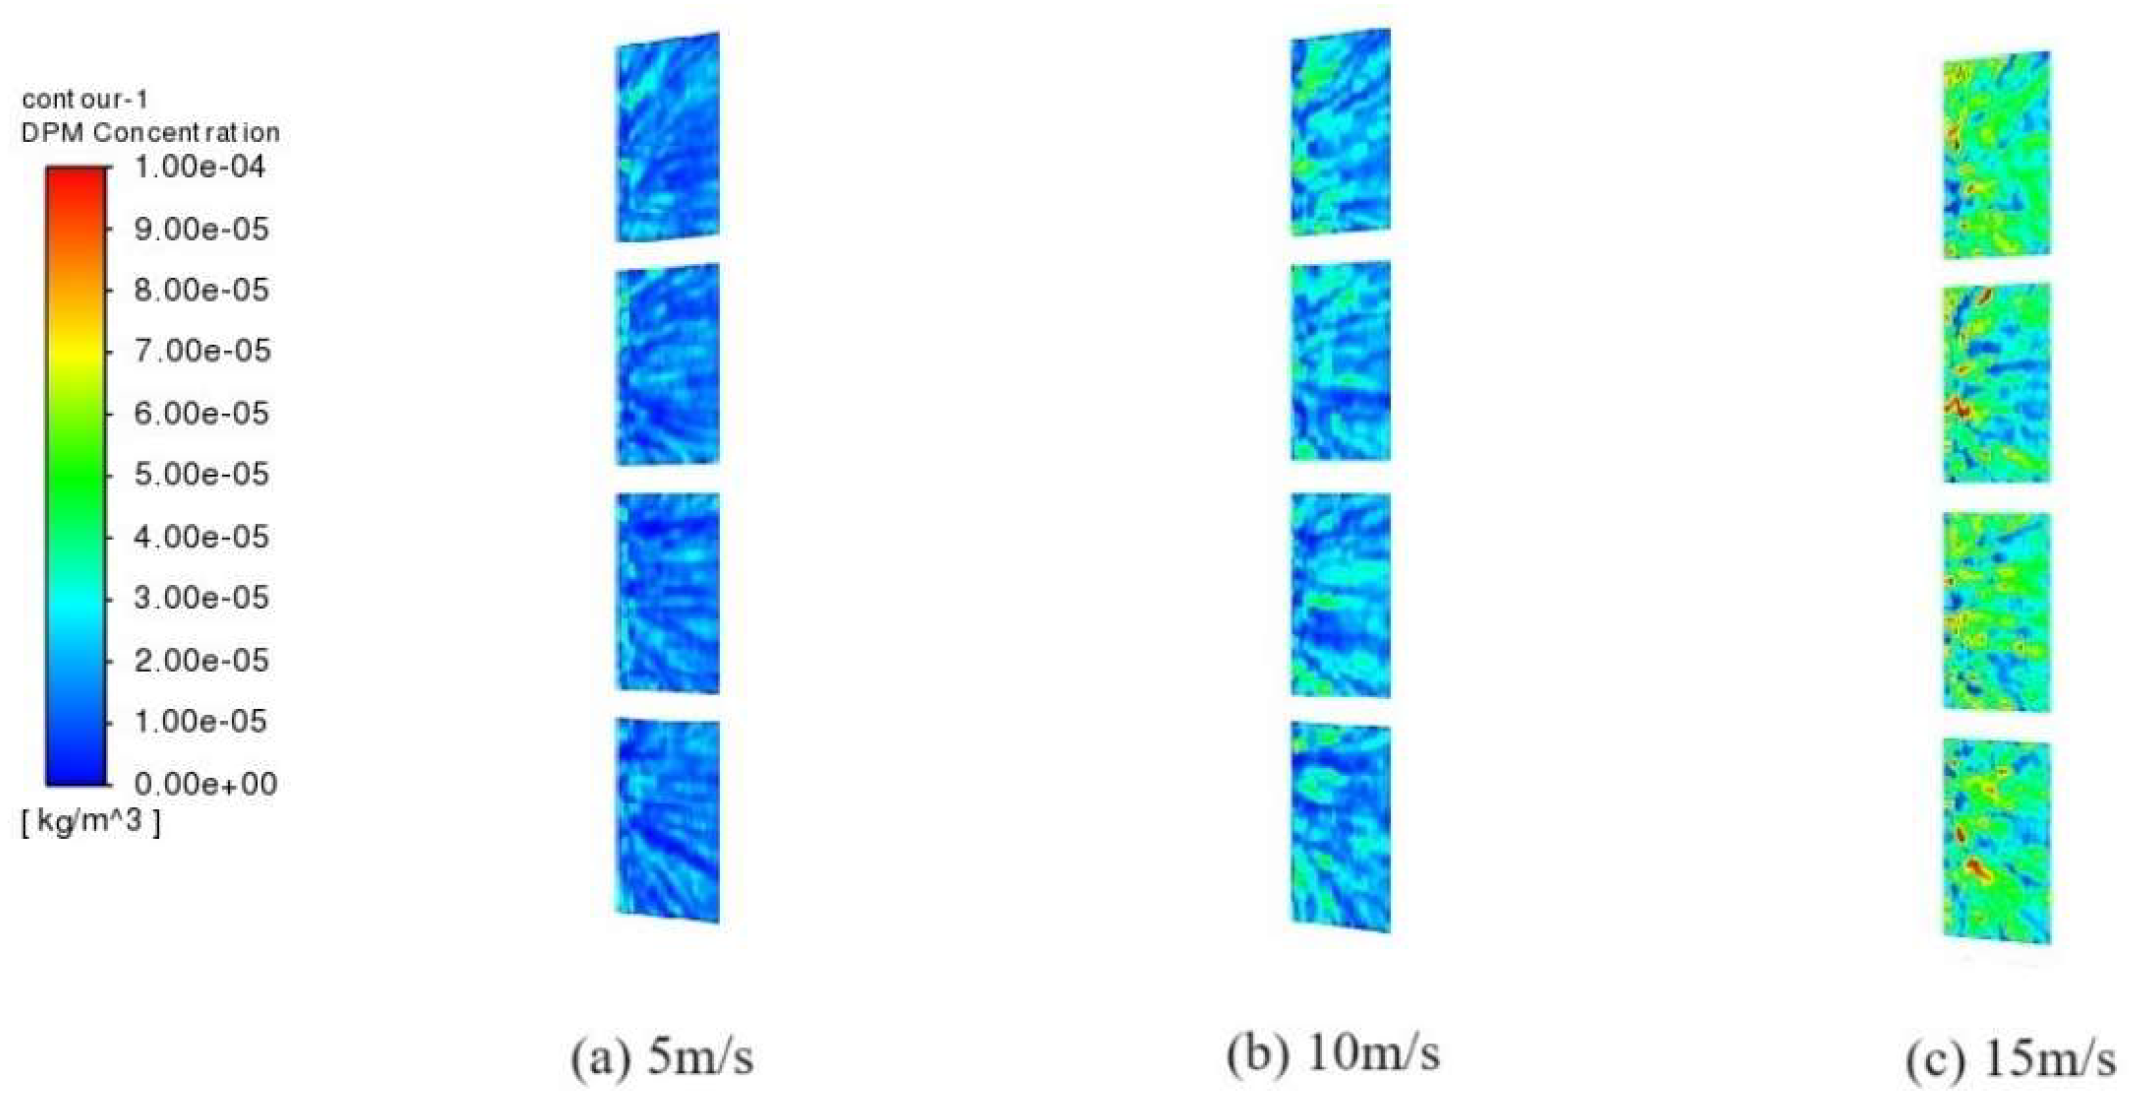
Figure 8.
Dust accumulation under the same wind speed at different inclination angles.
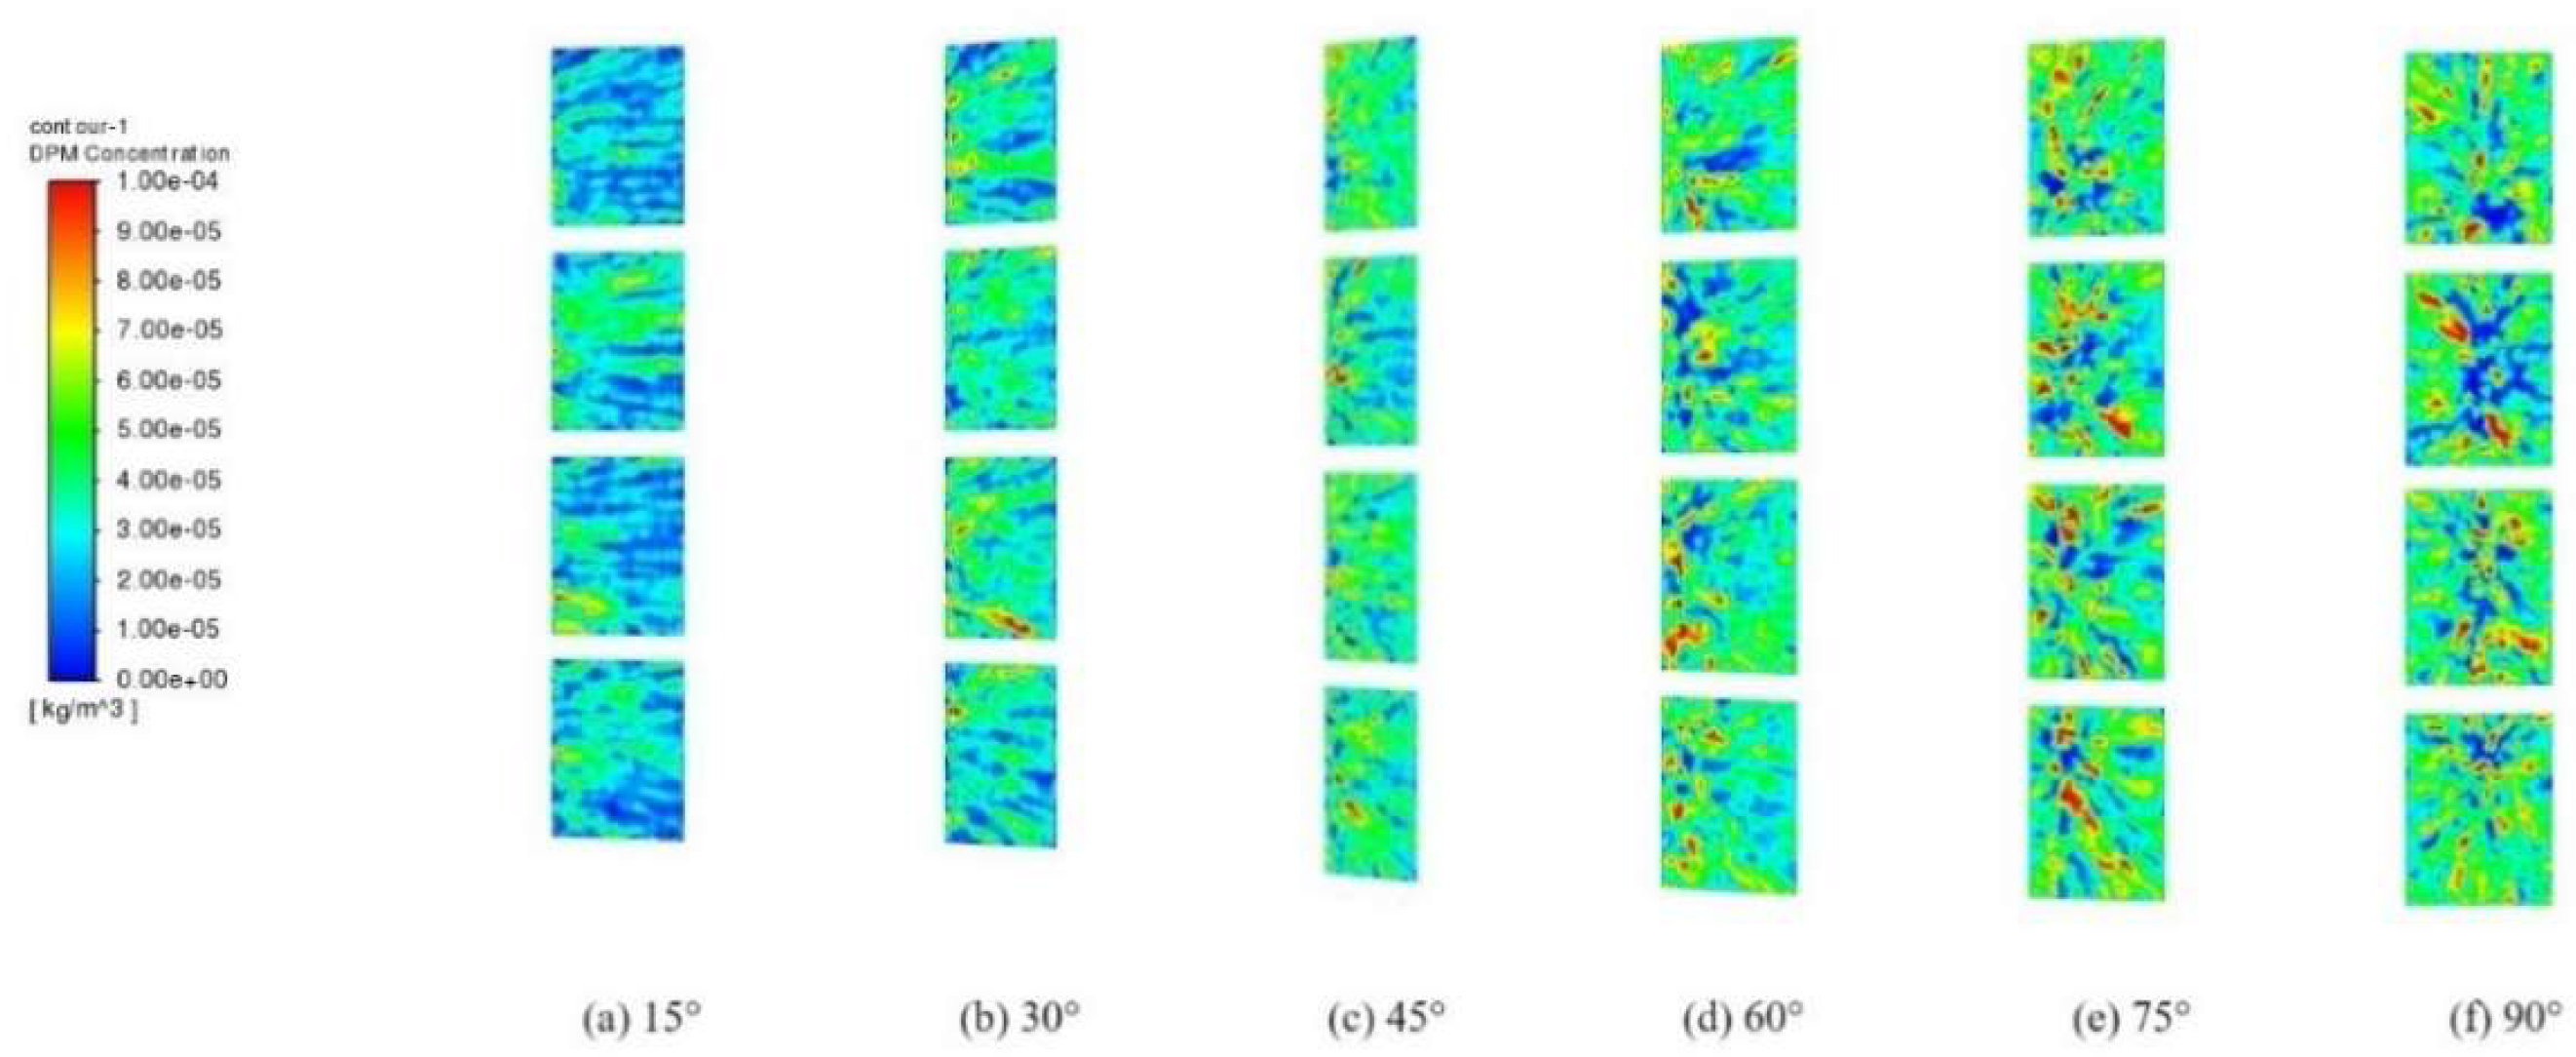
Figure 9.
Relationship between installation inclination and relative power generation under different conditions.
Figure 9.
Relationship between installation inclination and relative power generation under different conditions.
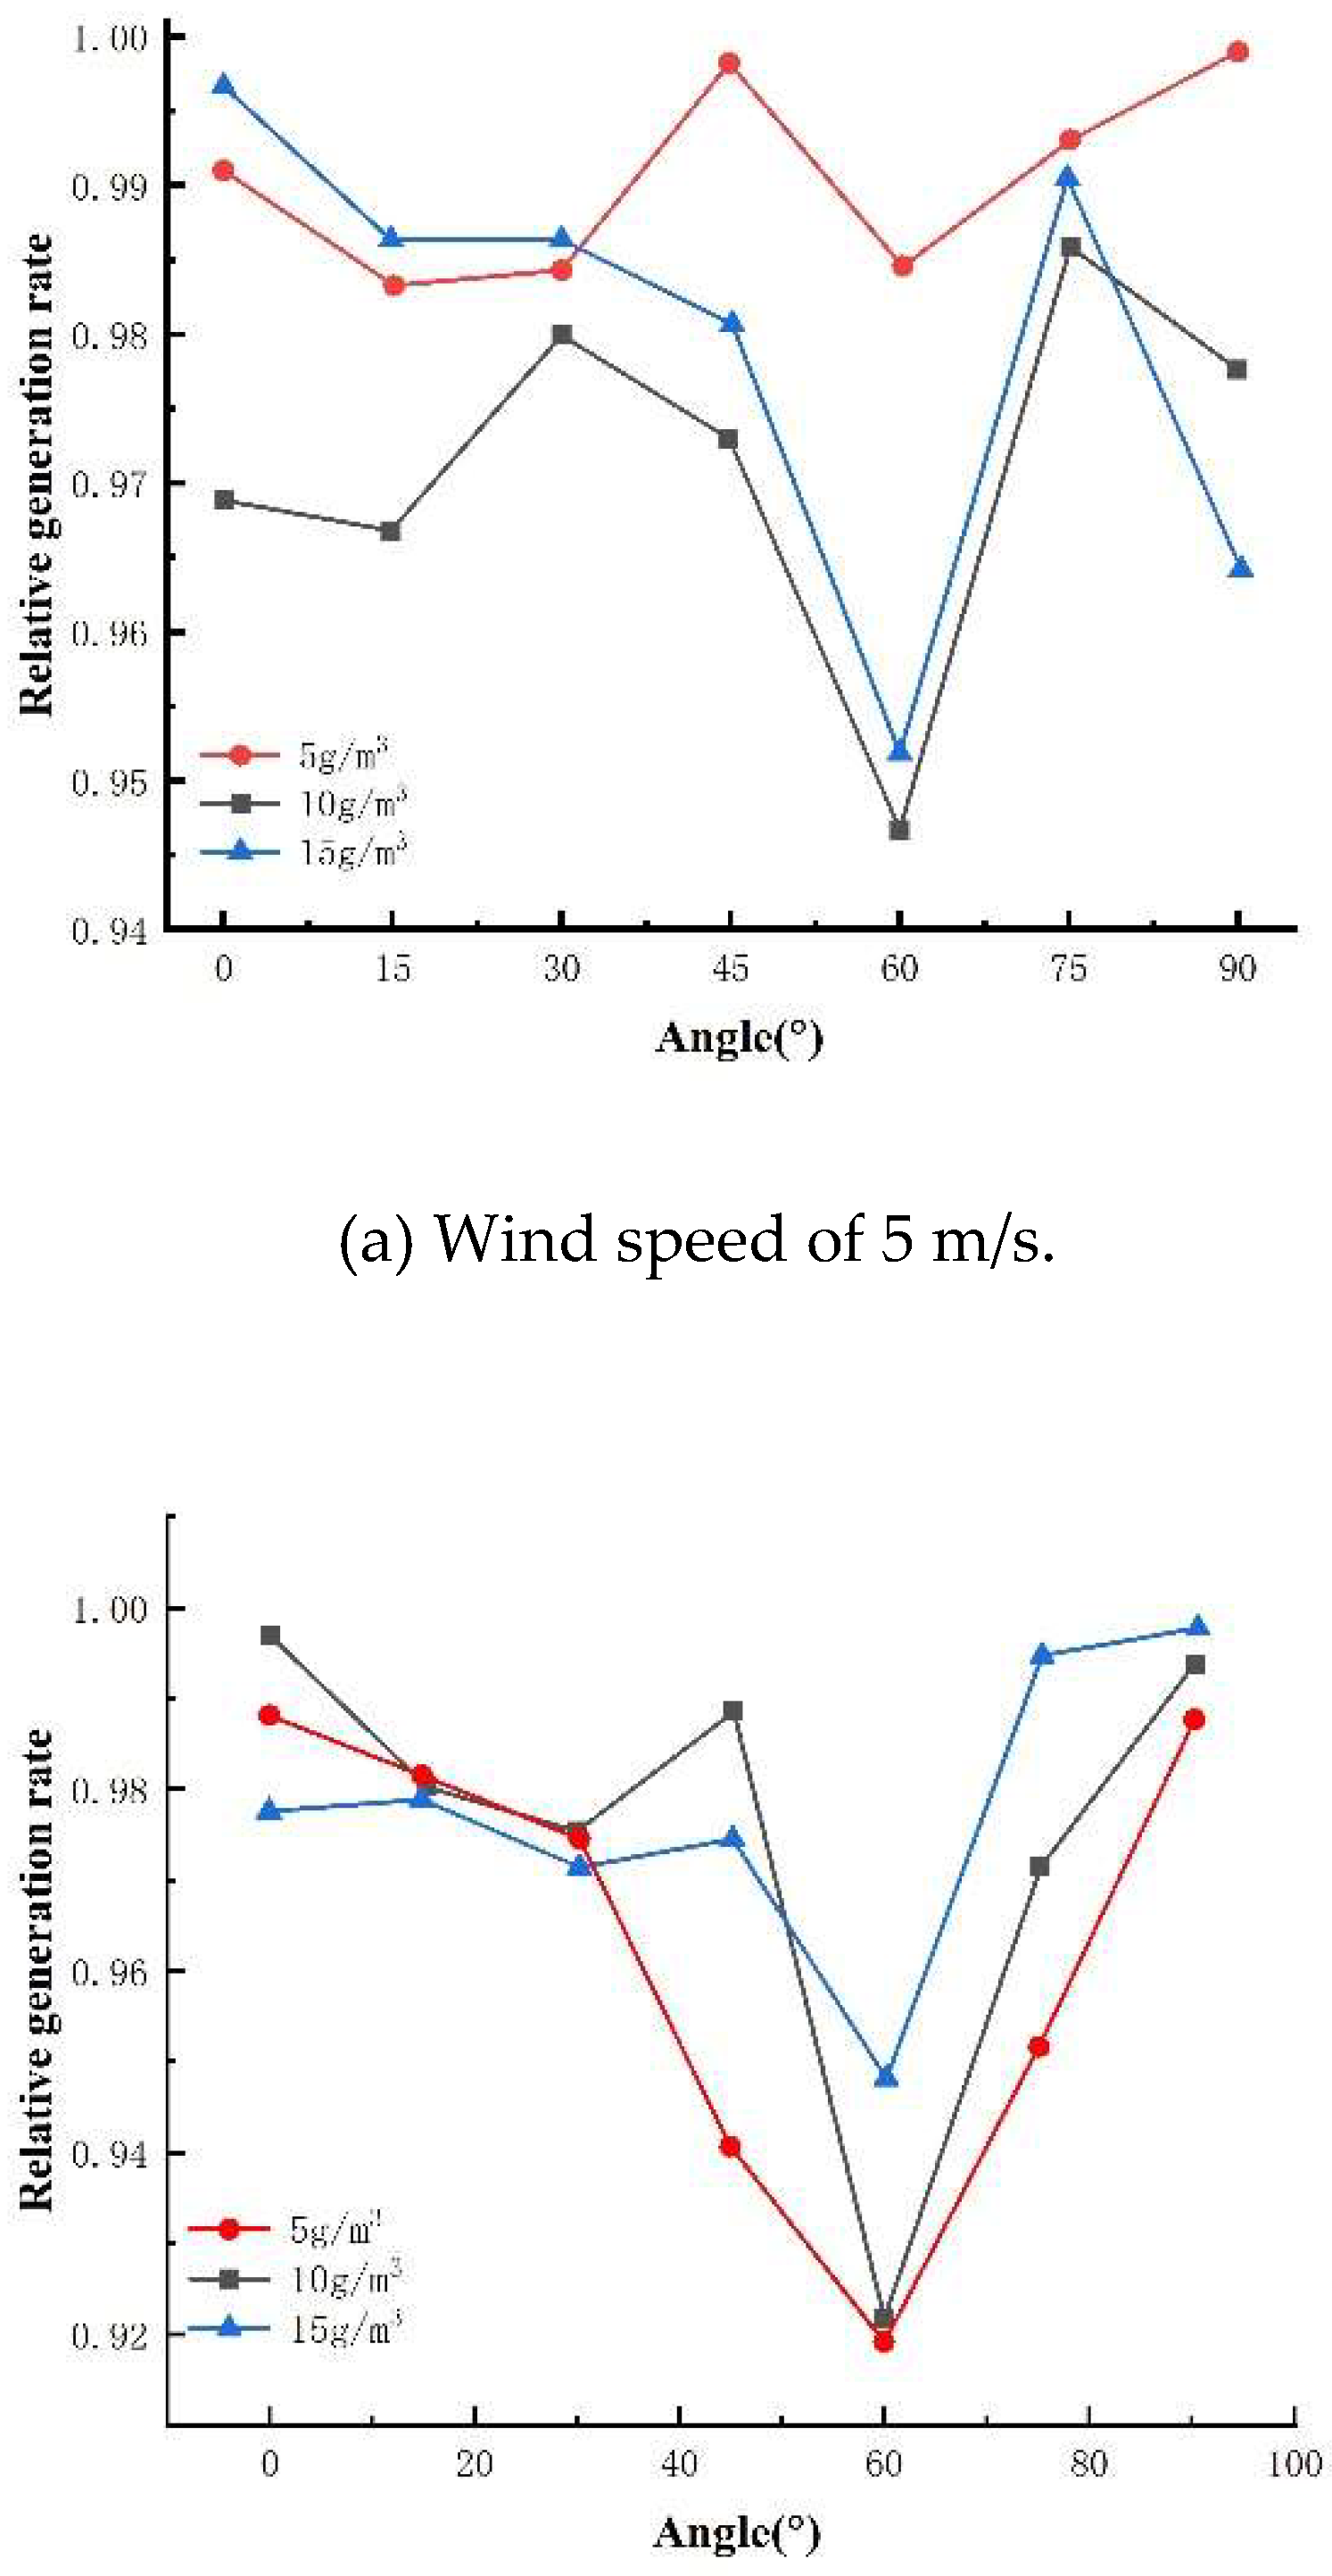
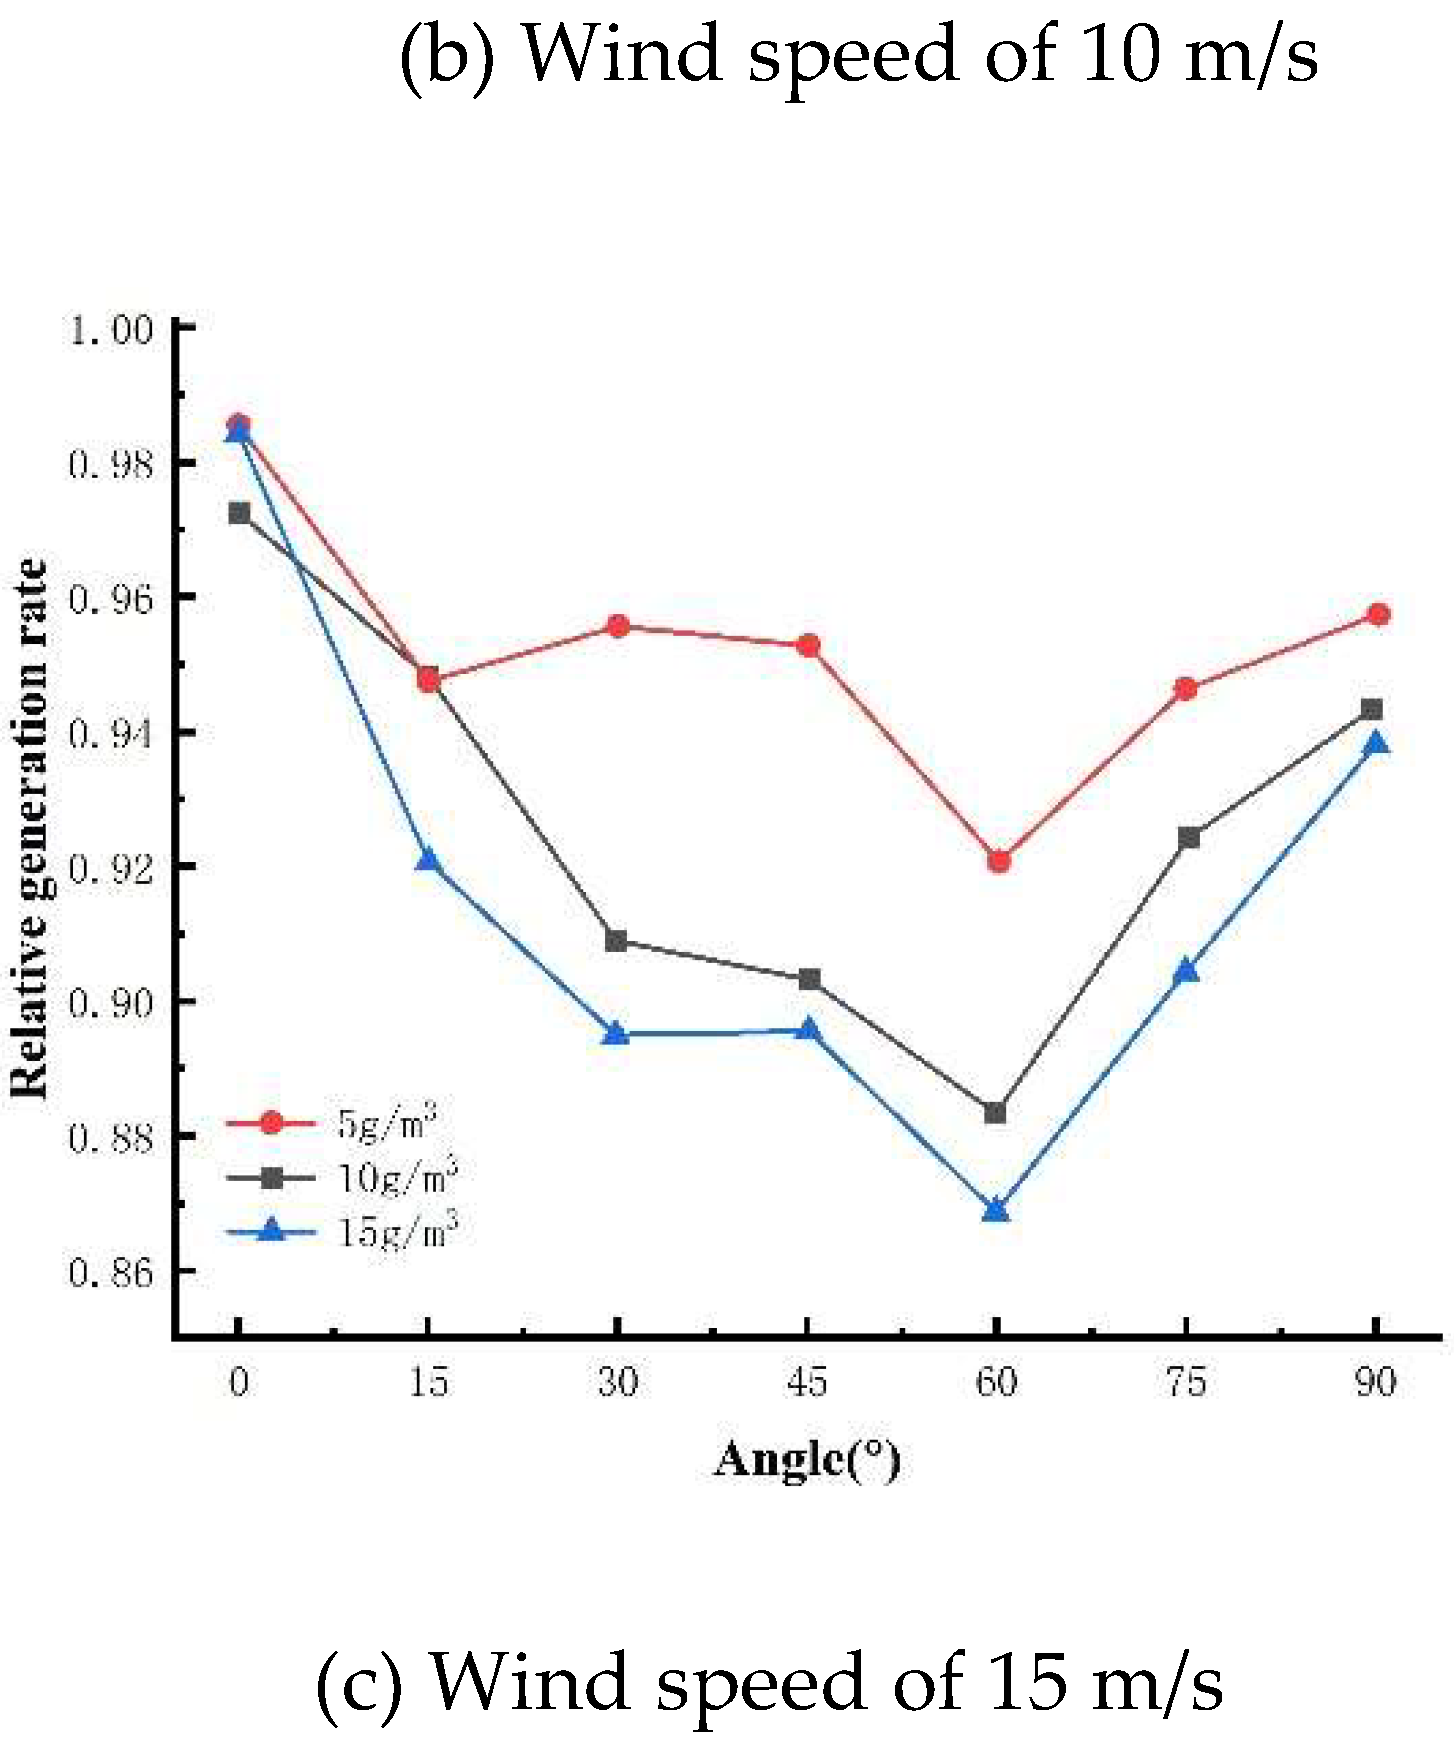
Figure 10.
Force on sand particles.
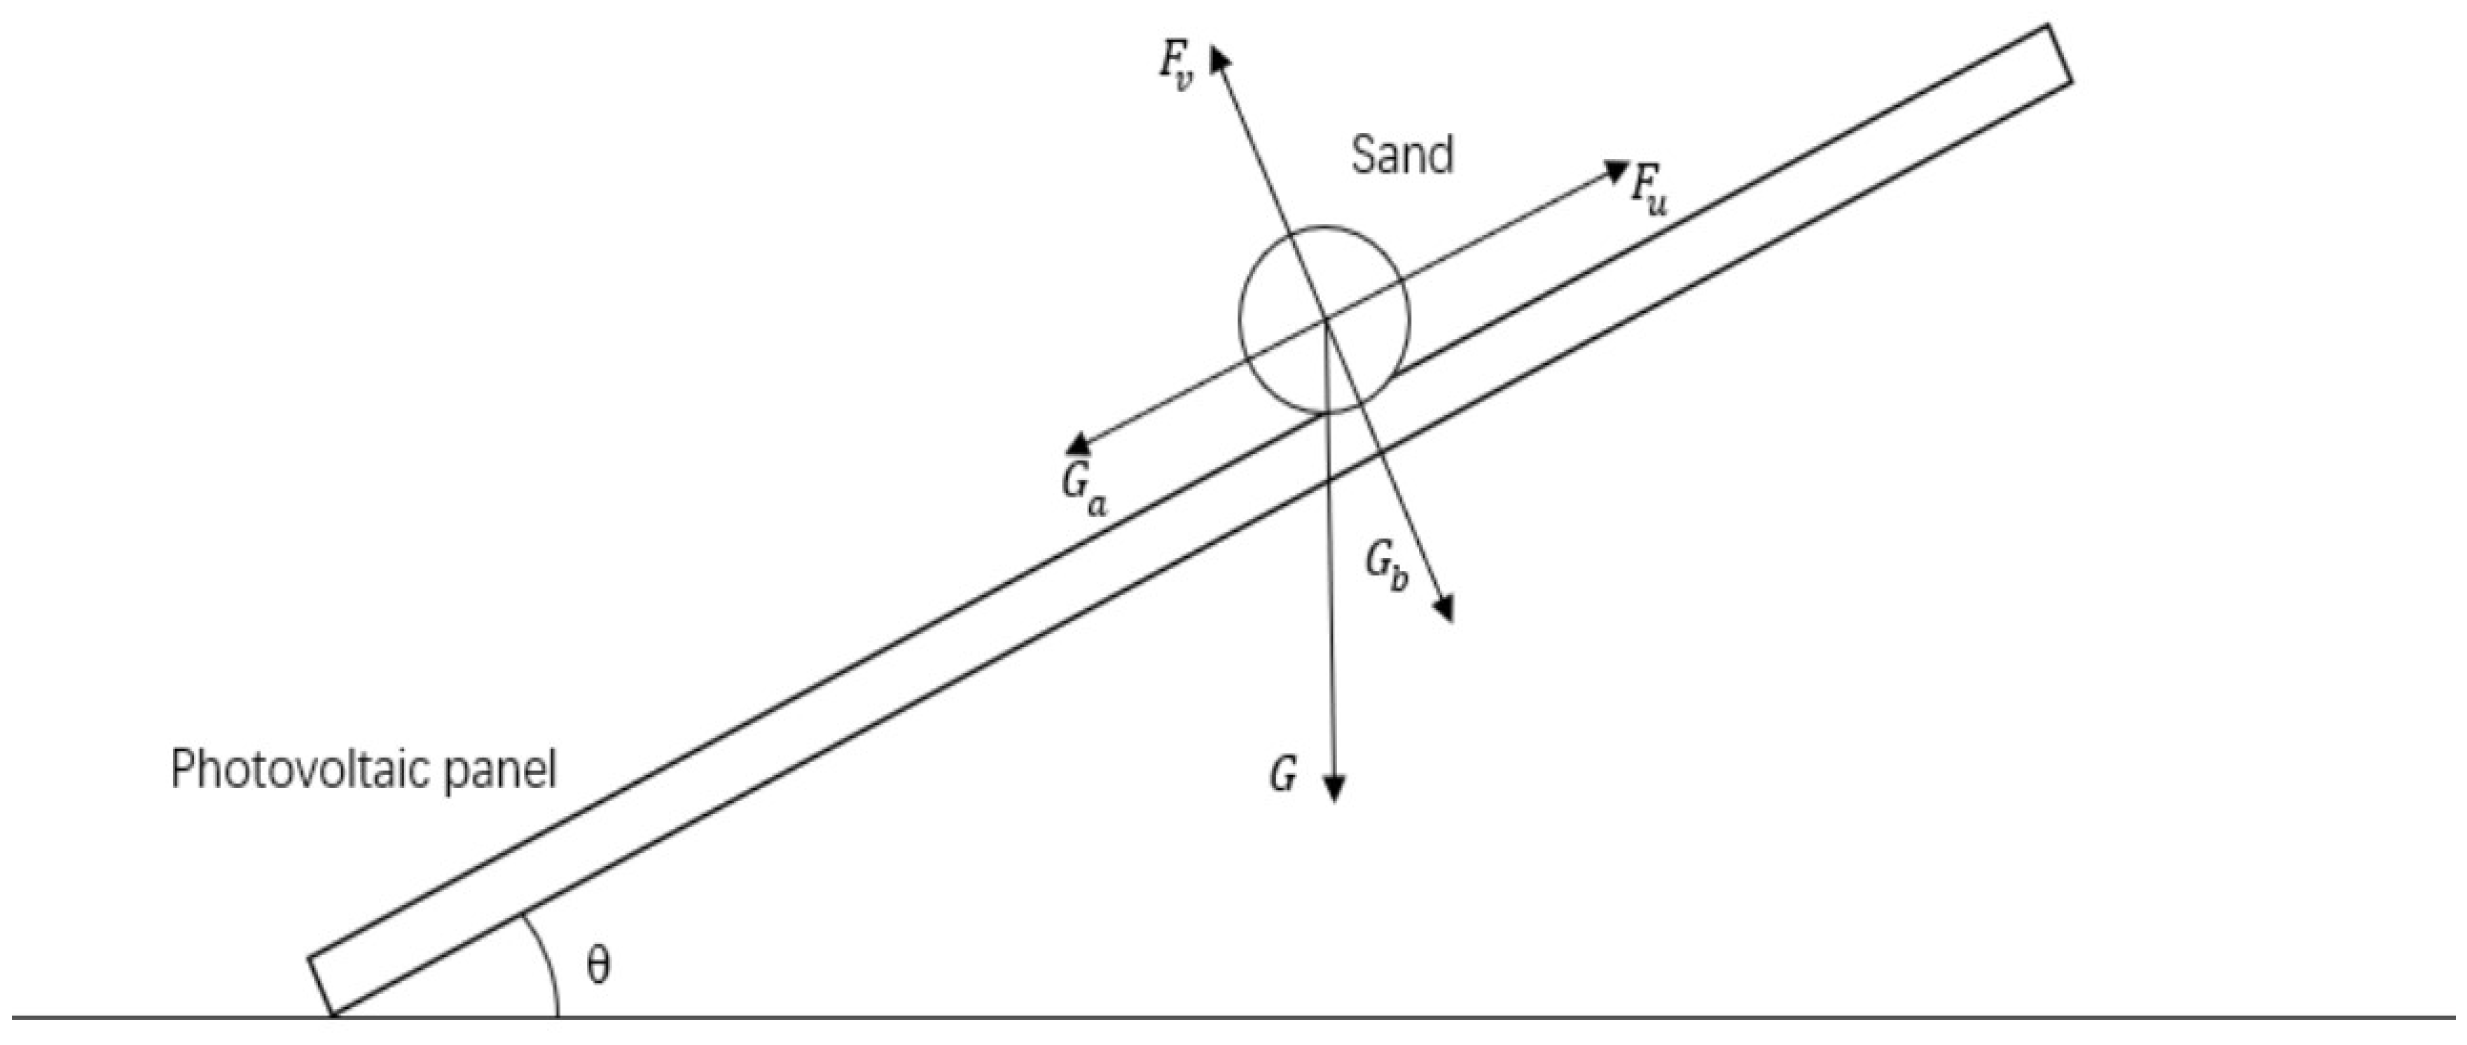
Figure 11.
Relationship between sand sediment density and photovoltaic module temperature at certain time.
Figure 11.
Relationship between sand sediment density and photovoltaic module temperature at certain time.
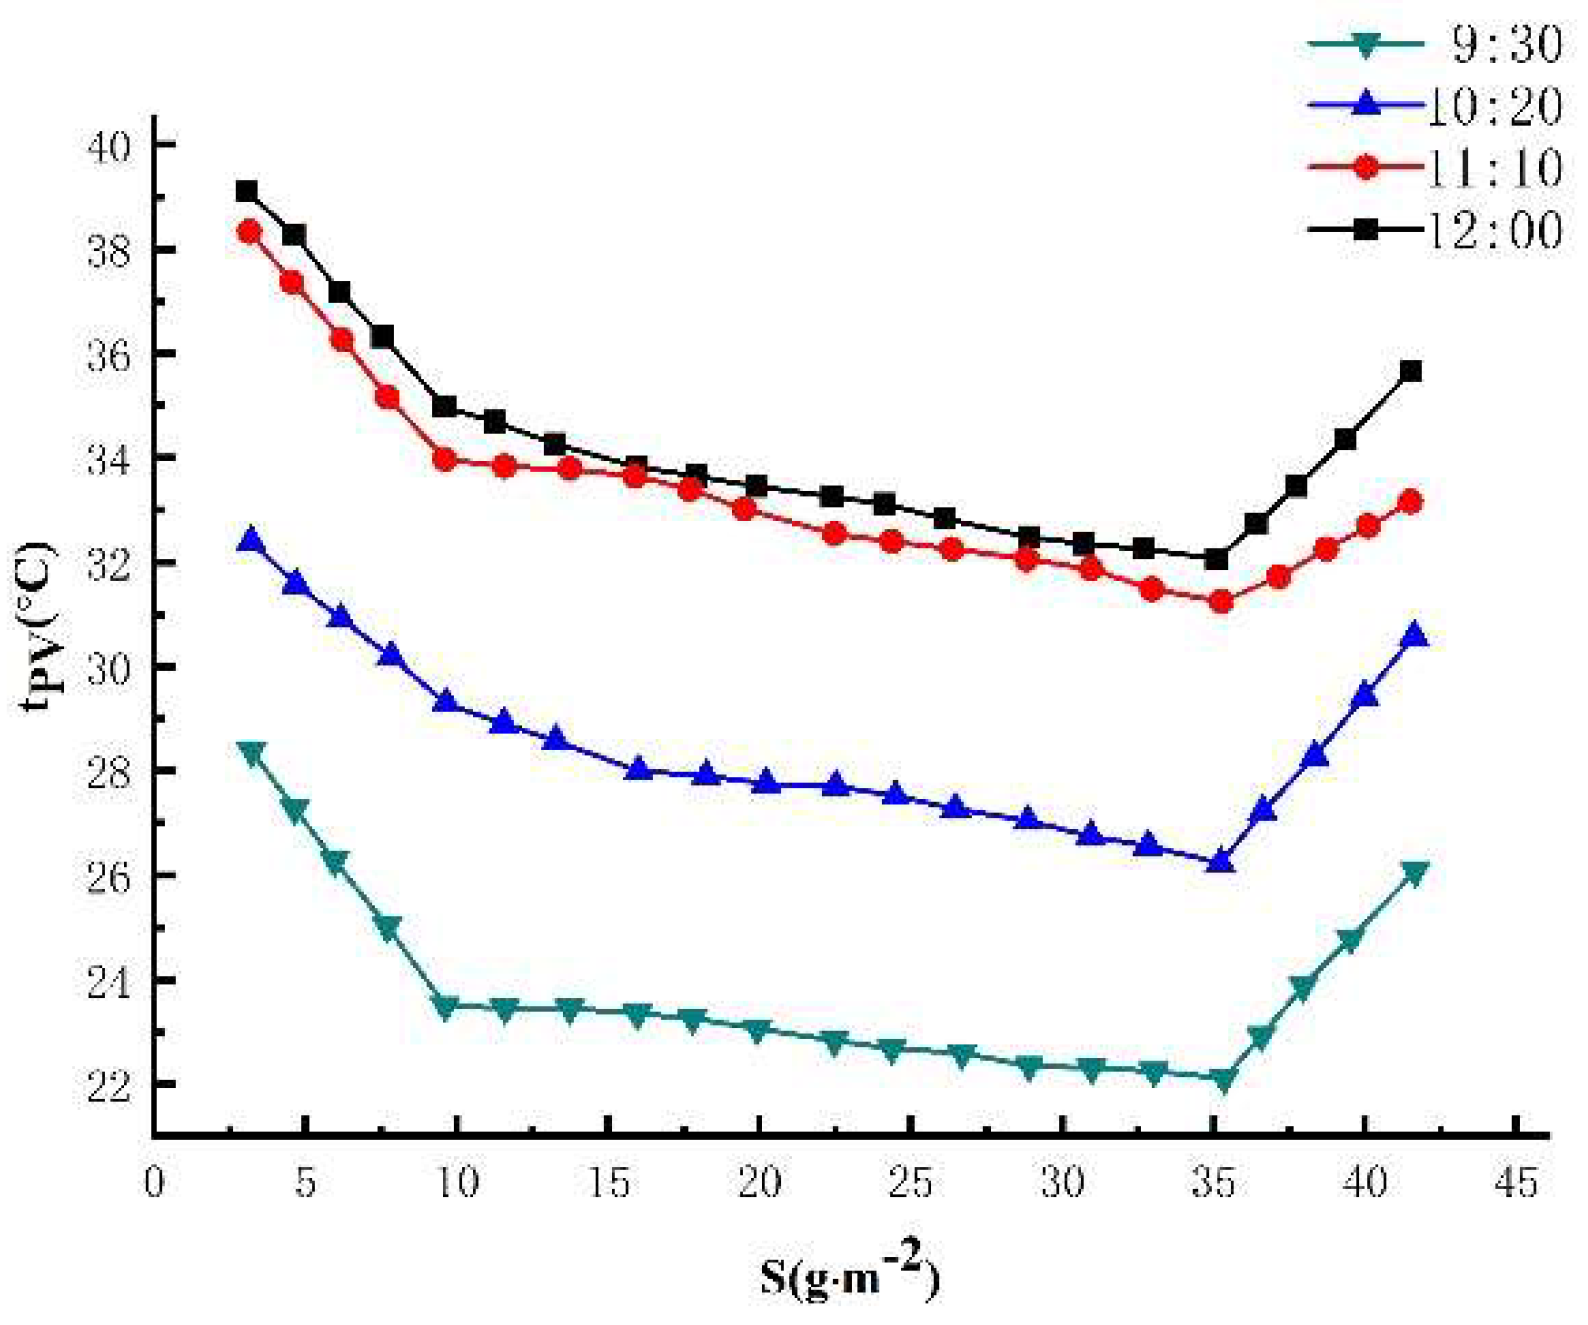
Figure 12.
Relationship between sediment density and fill factor of photovoltaic modules.
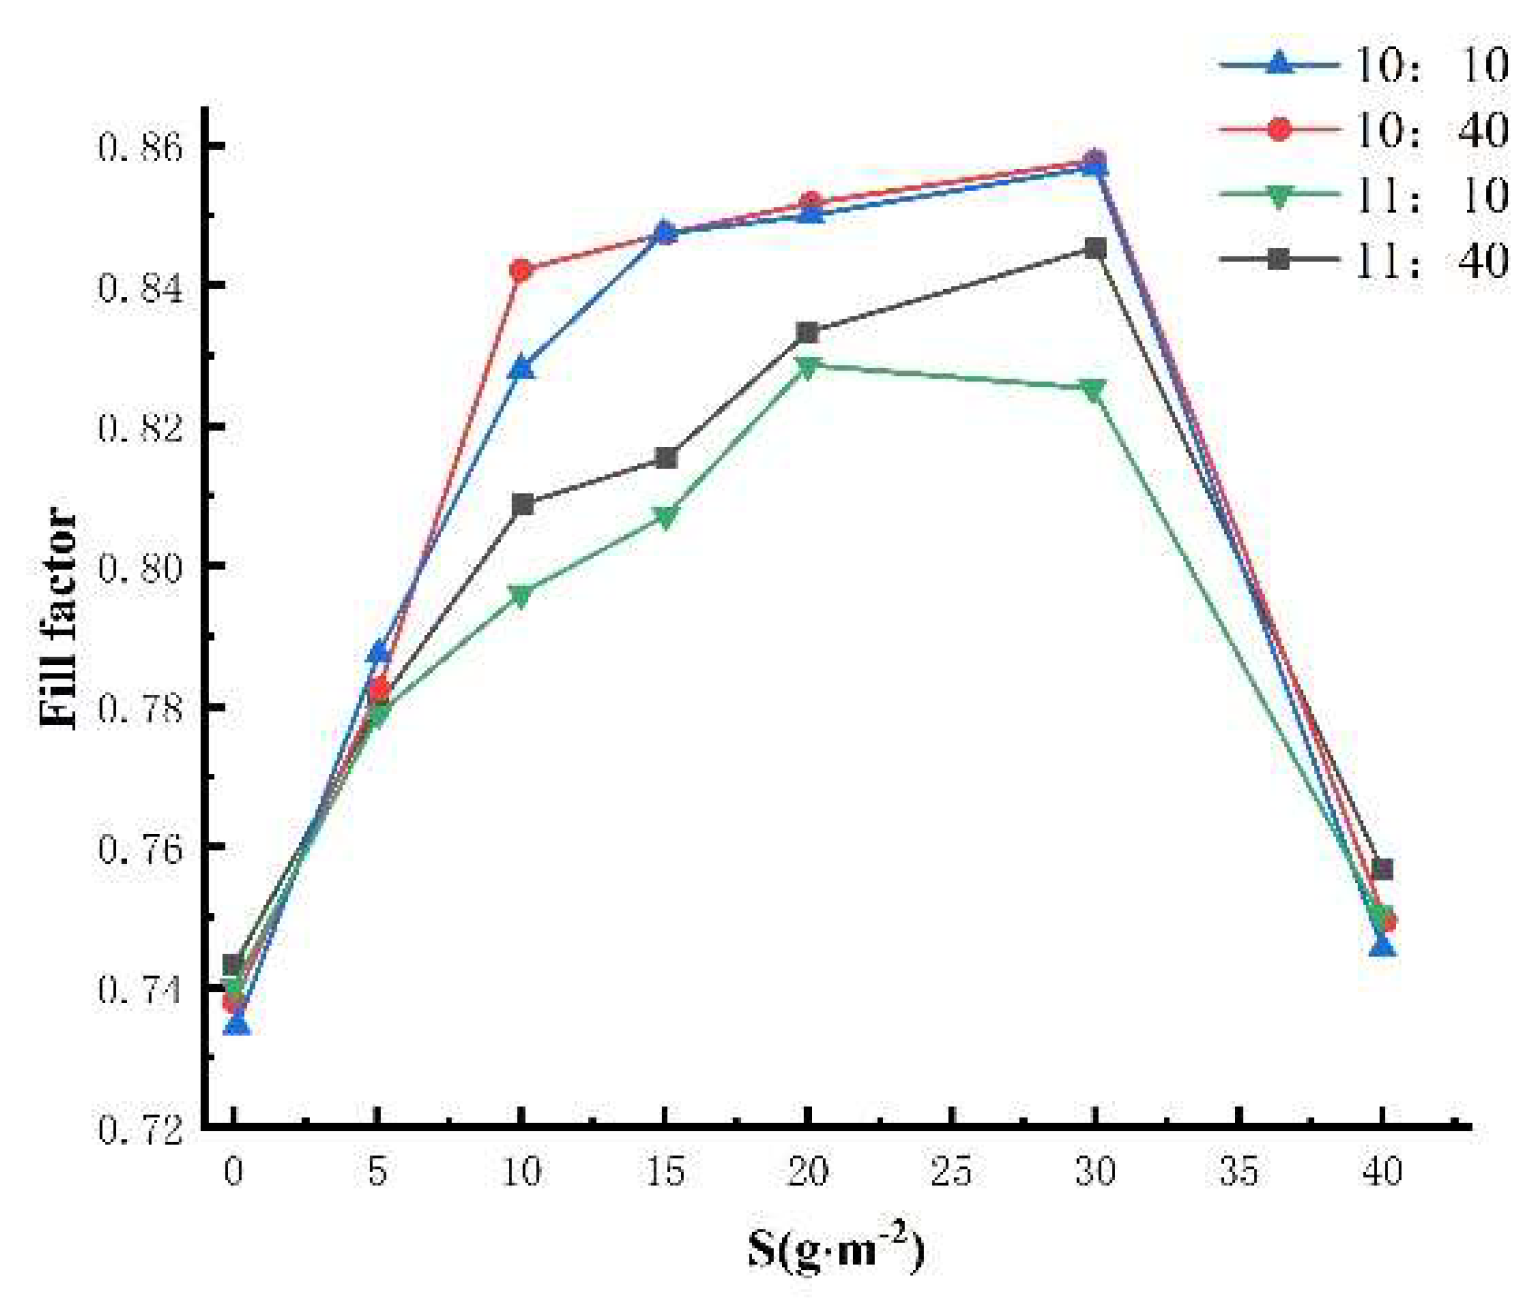
Figure 13.
Relationship between sediment density (31-39g/m2) and fill factor of photovoltaic modules.
Figure 13.
Relationship between sediment density (31-39g/m2) and fill factor of photovoltaic modules.
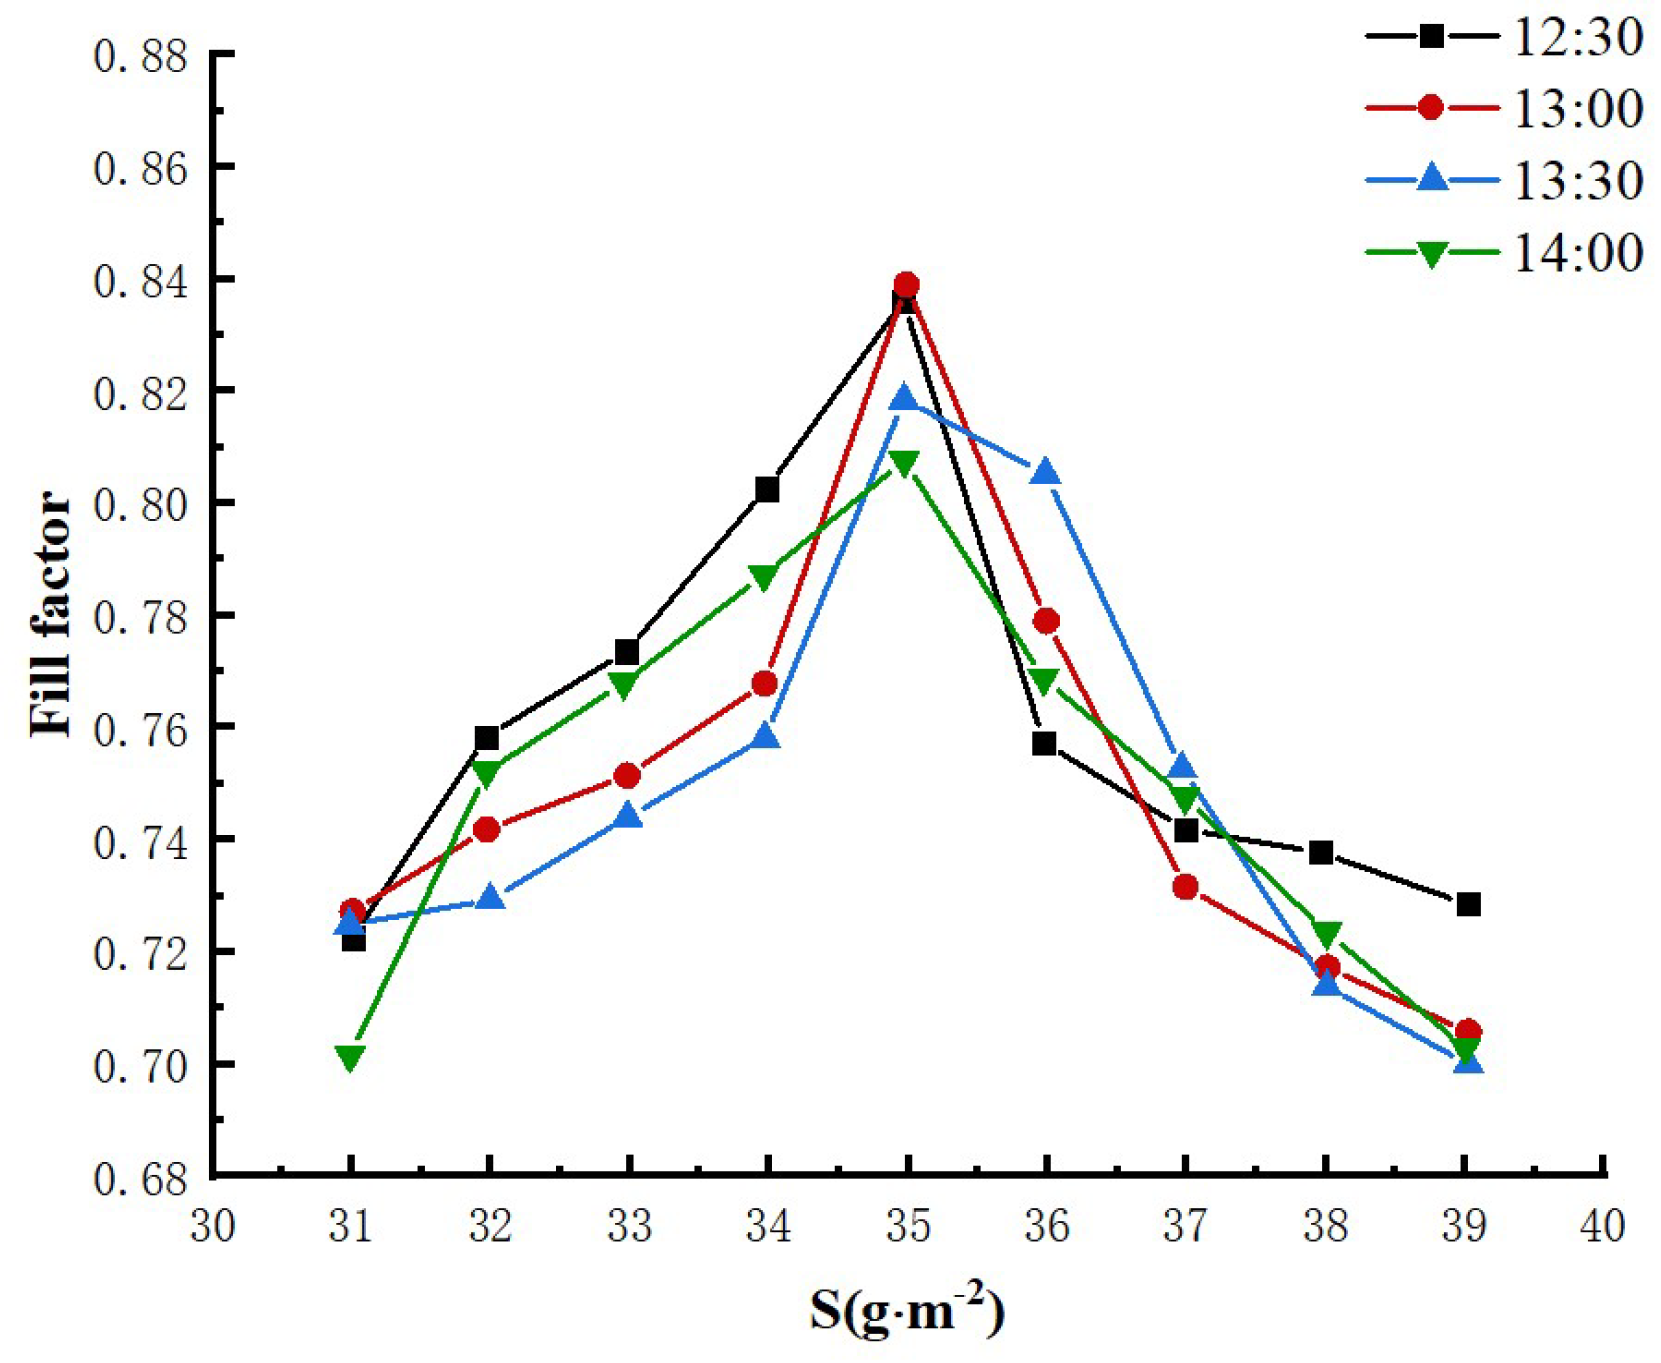
Figure 14.
Relationship between sand particle size and temperature of photovoltaic modules at certain time.
Figure 14.
Relationship between sand particle size and temperature of photovoltaic modules at certain time.
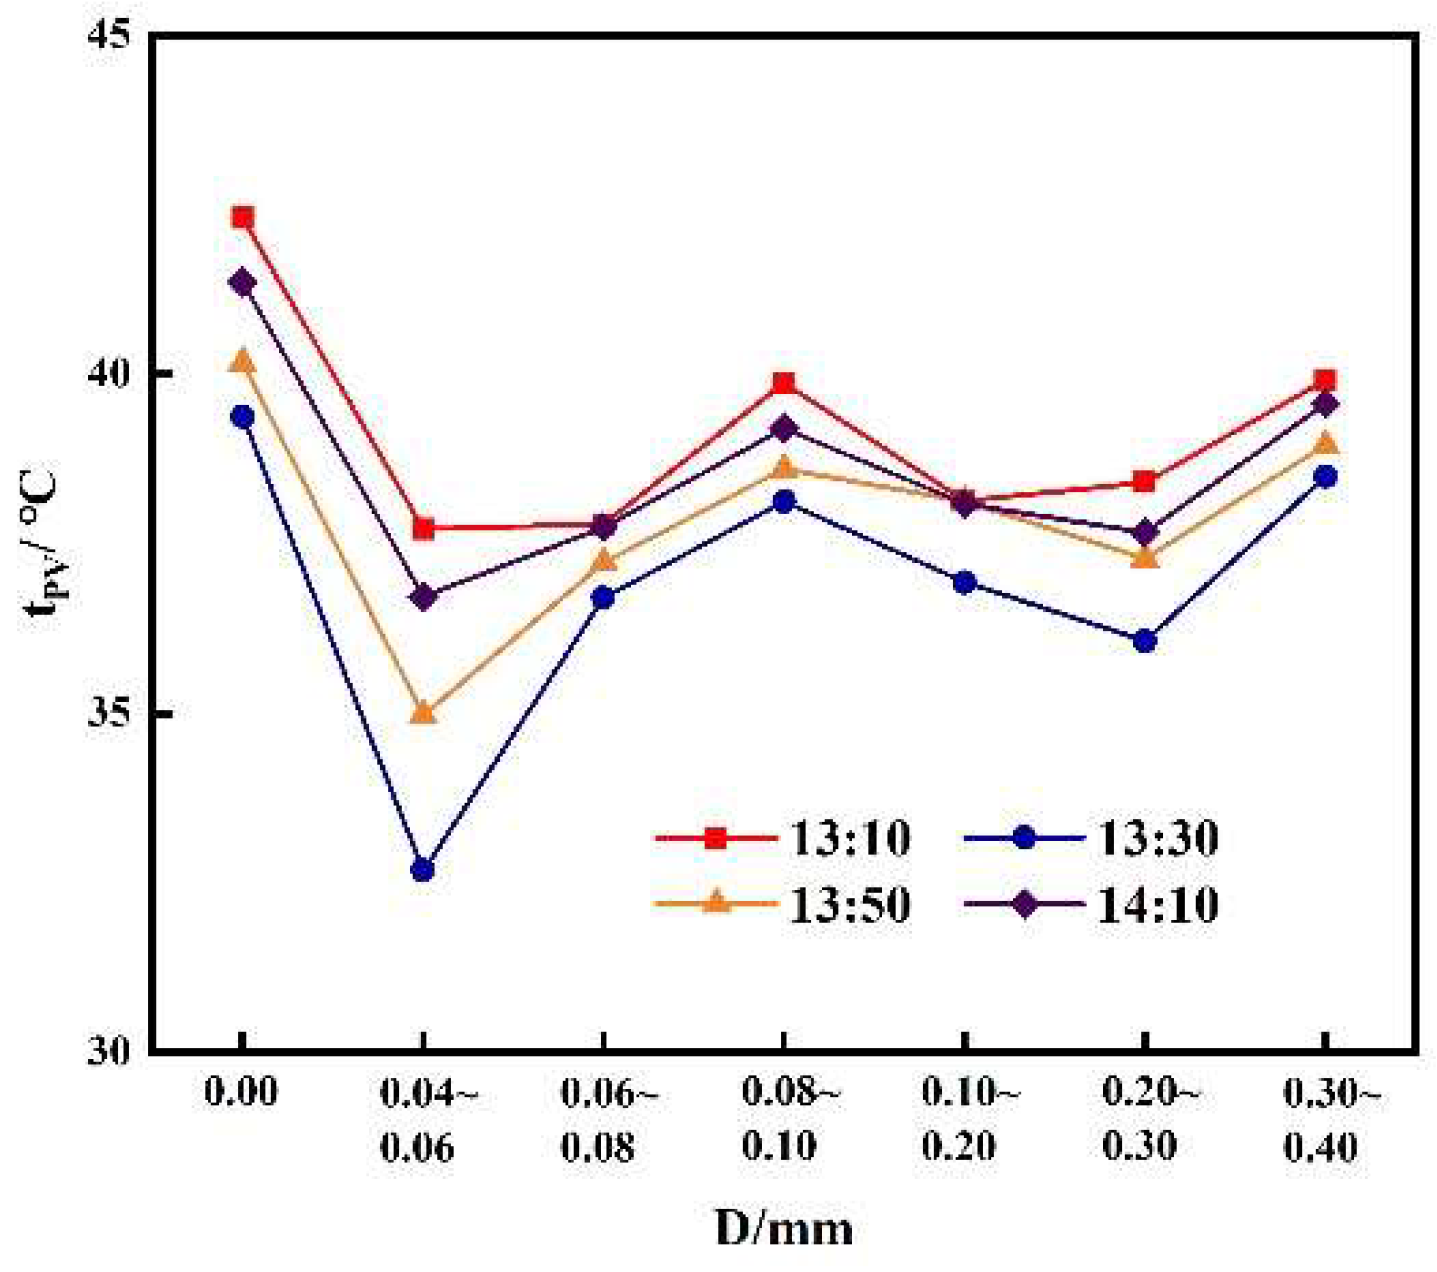
Figure 15.
Relationship between the particle size of sand and the filling factor of photovoltaic modules.
Figure 15.
Relationship between the particle size of sand and the filling factor of photovoltaic modules.
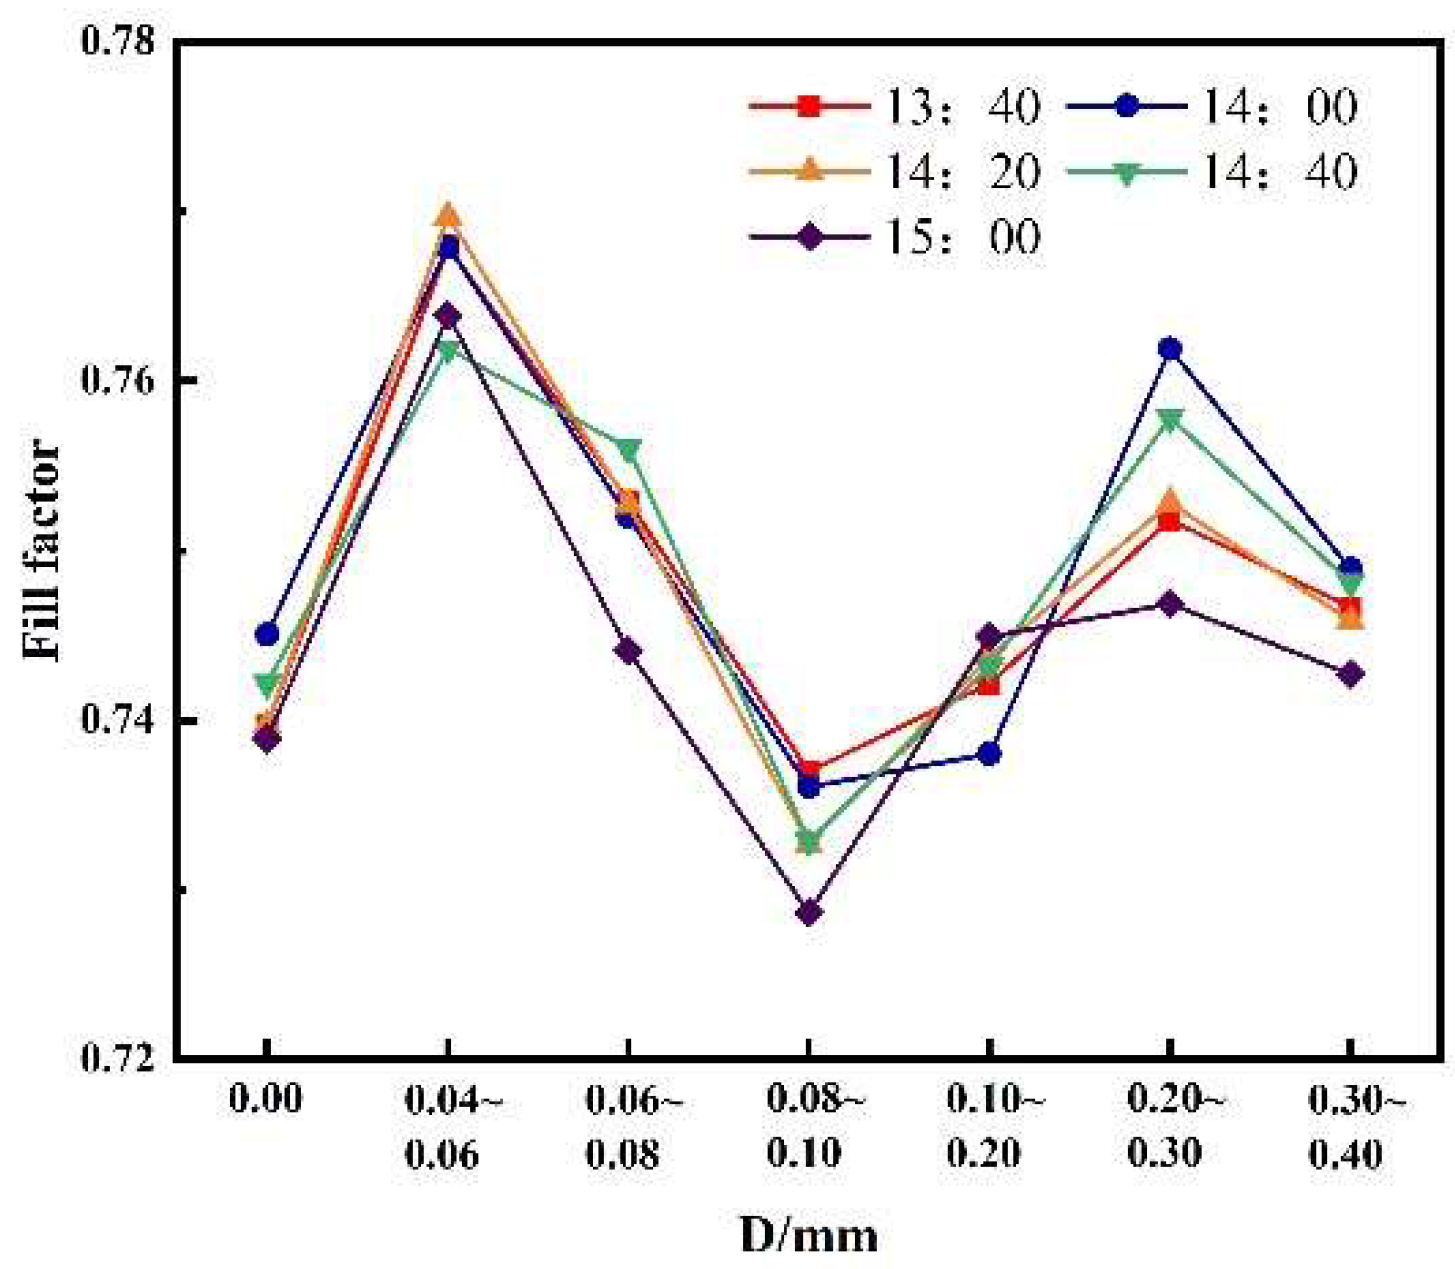

Table 1.
Boundary Condition Settings.
| Boundary condition setting | |
|---|---|
| Sand particles incidence mode | Surface |
| PV module surface particle deposition method | Trap |
| Inlet speed | 5m/s、10m/s、15m/s |
| Gravity acceleration | 9.81kg/m3 |
Table 2.
Particle size parameters of sand and dust samples.
| Particle Size D/mm | Percentage % | Particle Size D/mm | Percentage /% |
|---|---|---|---|
| 0.00~0.02 0.02~0.04 0.04~0.06 0.06~0.08 0.08~0.10 0.10~0.20 0.20~0.30 0.30~0.40 |
0.00 0.05 0.36 1.01 13.90 82.51 1.92 0.15 |
0.40~0.50 0.50~0.60 0.60~0.70 0.70~0.80 0.80~0.90 0.90~1.00 >1.00 |
0.02 0.02 0.02 0.02 0.01 0.01 0.00 |
Disclaimer/Publisher’s Note: The statements, opinions and data contained in all publications are solely those of the individual author(s) and contributor(s) and not of MDPI and/or the editor(s). MDPI and/or the editor(s) disclaim responsibility for any injury to people or property resulting from any ideas, methods, instructions or products referred to in the content. |
© 2023 by the authors. Licensee MDPI, Basel, Switzerland. This article is an open access article distributed under the terms and conditions of the Creative Commons Attribution (CC BY) license (http://creativecommons.org/licenses/by/4.0/).
Copyright: This open access article is published under a Creative Commons CC BY 4.0 license, which permit the free download, distribution, and reuse, provided that the author and preprint are cited in any reuse.


