
Submitted:
31 October 2023
Posted:
03 November 2023
You are already at the latest version
Preprints on COVID-19 and SARS-CoV-2
Abstract
Tamm Plasmon Polariton (TPP) is a nanophotonic phenomenon that has attracted much attention due to its spatial strong field confinement, ease of mode excitation and polarization independence. TPP has applications in sensing, storage, lasing, perfect absorber, solar cell, nonlinear optics, and many others. In this work, we demonstrate a biosensing platform based on TPP resonant mode. Both theoretical analyses based on Transfer Matrix Method and experimental validation through nonspecific detection of liquids of different refractive indices and specific detection of SARS-CoV-2 nucleocapsid protein (N-protein) are presented. Results show that TPP biosensor has high sensitivity and good specificity. For N-protein detection, the sensitivity is 1.5 nm/(µg/ml) and the limit of detection can reach down to below 7 ng/ml with spectrometer of 0.01 nm resolution of wavelength shift. This work paves the way for design, optimization, fabrication, characterization, and performance analysis of TPP based biosensors
Keywords:
Tamm Plasmon Polariton
; Optical Biosensor
; Porous Silicon
; Nucleocapsid Protein
; SARS-CoV-2
Introduction
Biosensors have wide applications in biomedicine [1], food safety [2], environment protection [3], and biosafety [4]. Optical biosensors have the advantages of high sensitivity, good specificity, fast response, and low cost [5]. Researchers have proposed optical biosensors based on optic fiber [6], optical waveguide [7], ring resonator [8], optical interferometer [9], photonic crystal [10], surface plasmon resonance (SPR) [11] and localized surface plasmon resonance (LSPR) [12]. Optical biosensors have been demonstrated for the detection of bacteria [13], virus [14], DNA [15], proteins [16], and small molecules [17].
Tamm Plasmon Polariton (TPP) is an electromagnetic surface state confined at the interface between plasmonic material and one-dimensional photonic crystal or Distributed Bragg Reflector (DBR) [18]. It can be excited by incident light in air without the need for wave vector boosting [19]. Such boosting is required for SPR and Guided Mode Resonance (GMR) excitation, through either prism or periodic grating which are not always convenient in practical applications. TPP is also polarization independent. Unlike SPR that only supports transverse magnetic (TM) wave, TPP can support both transverse electric (TE) and TM waves [18]. This allows the usage of unpolarized light source in signal interrogation. TPP resonance can be interrogated by reflection, transmission, absorption spectroscopy, intensity interrogation or phase measurement [20]. Due to its prominent characteristics, TPP has wide applications in sensing [21], lasing [22, 23], perfect absorber [24], solar cell [25], optical filtering [26], and nonlinear optics [27]. In particular, TPP sensing has been demonstrated for detection of temperature [28], pressure [29], surface deformation [30], refractive index (R.I.) [31], organic vapor [32], greenhouse gases [33], liquids [34], fat concentration in milk [35], blood components [36] and theoretically predicted to be suitable for biosensing [37]. On the other hand, porous silicon (PSi) is an outstanding material for biosensing due to its high surface area of more than 100 m2 per 1 cm2 of planar surface area of etched silicon [38, 39], versatile biofunctionalization chemistry and CMOS compatible fabrication process [40]. Researchers have proposed TPP sensors based on porous silicon distributed Bragg reflector [41, 42] and porous silicon resonant microcavity [33]. TPP based on 1D photonic crystal consisting of porous silicon membrane has also been demonstrated for nonspecific detection of organic solvents [43].
In this work, we demonstrate TPP device based on porous silicon DBR as a biosensing platform for detection of viral protein-the N-protein of SARS-CoV-2. A TPP biosensor can be constructed by depositing noble metal thin film on porous silicon based DBR [44]. Incident white light can excite TPP resonance which has its resonant field energy confined near the interface between metal and DBR. The filed strength decays exponentially further away from the interface into both the metal and the DBR. Further, due to the porous structure of porous silicon, a nanocomposite layer wherein metal nanoparticles are randomly distributed, can form in the top porous silicon layer of the porous silicon DBR [44]. As a result, the biomolecules infiltrate into the top porous silicon layer and interact with strongest electrical field. This guarantees highest sensitivity of detection. Another advantage of porous silicon based TPP biosensor is that, as will be demonstrated later, due to fast decaying profile of field strength inside and beyond thin metal film, refractive index (RI) changes beyond the first porous silicon layer of DBR has negligible effect on the TPP mode [45]. Thus, TPP is not sensitive to R.I. changes around the surface of the thin metal film. As will be demonstrated later through experiment, this is advantageous in that it dispenses the rinsing procedure often required of biosensors to remove non-specific species absorbed on biosensor surface.
Structural optimization of TPP device has been carried out both theoretically based on temporal coupled mode theory [44], and experimentally based on optical characterization of fabricated TPP devices [46]. The goal is to achieve highest coupling efficiency of incident light into TPP mode, and the best possible field confinement. Adopting these results from the previous works, we design and optimize the structure of the porous silicon based TPP^ biosensor. Then we use the optimized TPP biosensor to demonstrate nonspecific detection of RI liquids and sensitive and specific detection of SARS-CoV-2 N-protein.
Materials and Methods
Porous silicon DBR was fabricated by electrochemical anodization of 6-inch single crystalline silicon wafer (Boron doped p-type, 0.01 Ω∙cm resistivity, <100>crystal orientation) in 15% aqueous ethanoic hydrofluoric acid (HF) consisting of 3:7 v/v 50% aqueous HF and >98% ethanol. The designed central wavelength of the DBR bandgap is at 650 nm.
The electrochemical etch conditions and the resulting porous silicon optical parameters, including the thickness and the effective refractive index of porous silicon based on Bruggeman effective medium theory [47], are listed in Table 1. The DBR has the structural configuration of [(LP PSi )/(HP PSi)]10, as shown in Figure 1 (a).
Afterwards, porous silicon was thermally oxidized in ambient air under 800°C for 30 minutes to make porous silicon stable and hydrophilic. Then, 5nm Ti and 30 nm Au was consecutively deposited on the porous silicon DBR through magnetic controlled sputtering. Ti serves as adhesion layer between porous silicon and Au. The thickness of Au was optimized according to temporal coupled mode theory [44] and previous experimental results [46]. Finally, the 6-inch wafer was diced into 7 mm×7mm chip by dice saw equipment. Each chip serves as a TPP biosensor device.
The measurement of the biosensor is by reflection spectroscopy. As shown in Figure 1(a), a white light source provides incident light which is guided by six circumferential fibers in a Y-shape fiber to be incident on the TPP biosensor surface. Light reflected from the TPP biosensor surface is collected by the central fiber of the Y-shape fiber and guided to a spectrometer for spectrum analysis.
For non-specific detection, liquids of various RIs consisting of 5% sucrose in deionized water (RI=1.3648) and its serial dilutions, are used as detection targets. The operation of RI sensing is as follows. First, the liquidous specimen is dropped on the biosensor surface, then a cover glass is placed on top of the specimen to flatten the liquid surface and facilitate spectral measurement as shown in Figure 1(a). After cover glass is placed, the reflection spectrum is collected. Then the biosensor is rinsed with DI water and dried with nitrogen gas. Next, liquid specimen of different RIs is applied on the biosensor surface, cover glass placed on top and reflection spectrum taken.
For specific detection of N-protein, the biosensors need functionalization with specific antibodies. The site where the antibody binds to the antigen is the Fab segment. ProteinA protein modified TPP biosensor chips can be used to immobilize the antibody in a targeted manner, ensuring that the antibody binding site fixed on the chip faces upwards, reducing spatial hindrance, and improving the efficiency of N-protein antigen binding. The antibodies are immobilized on the TPP biosensor surface by the following procedure shown in Table 2:
The operation of biosensing is as follows. First, the liquidous specimen is dropped on the biosensor surface, then a cover glass is placed on top of the specimen to flatten the liquid surface and facilitate spectral measurement. After cover glass is placed, the first reflection spectrum is collected. After binding reaction between viral proteins and antibodies completes which is about 10 minutes, the second reflection spectrum is collected. The two spectra of before and after reaction are compared and analyzed to determine the detection result. Note that rinsing the biosensor surface after binding reaction completes is not necessary, since any non-specific adsorption of bio species on thin metal film or even inside nanopores of thin metal film has little effect on the TPP resonance. This is because the electrical field in the thin metal film and beyond the metal thin film in specimen reaction region is negligible. For real time detection of N-protein binding with antibodies, the reflection spectrum of the TPP biosensor is automatically collected every 10 seconds in a ten-minute reaction process, without any disturbance of the biosensor or the cover glass.
For theoretical analysis, Transfer Matrix Method (TMM) [48] is used to simulate reflection spectrum of the TPP biosensor. For non-specific R.I. sensing, the liquids diffuse into the nanopores of gold thin film and porous silicon, causes changes in effective refractive index of porous silicon, and thus shifts TPP characteristic resonant valley to longer wavelength (redshift). Liquids of different R.I. show different TPP resonant wavelength. For specific biosensing, N-proteins bind with antibodies immobilized on biosensor beforehand and causes changes in effective refractive index of porous silicon, and thus shifts TPP characteristic resonant valley. Different N-protein concentrations correspond to different amount of N-protein binding with antibodies, causing different shift of TPP resonant valley. In all cases, more changes in effective R.I. of porous silicon generates more spectral shift.
Simulation of electrical field distribution inside the TPP device was carried out in COMSOL. The resonance shift of the biosensor due to filling of the nanopores of porous silicon by liquid of various refractive indices was calculated in a MATLAB program based on TMM. The refractive index of porous silicon was calculated based on Bruggeman effective medium theory, with refractive index of nanopores being that of the liquid instead of air after pore filling by liquid. For simulation of biosensing, we model the first porous silicon layer as a nanocomposite layer with 30% filling of nanopores with Au nanoparticles [44]. To avoid steric effects, the antibody immobilization is estimated to be 50% maximum coverage of pore surface [13, 15]. The effective refractive index of porous silicon nanocomposite layer is also obtained by Bruggeman effective medium theory. Different amount of N-protein binding with immobilized antibodies causes different amount of redshift. Both antibody and N-protein are estimated to have refractive index of 1.45 [13, 15].
Results and Discussion
Figure 1(b) shows the cross-sectional SEM image of the fabricated TPP device. The porous silicon DBR has 10 periods, and the 30 nm gold thin film is deposited on top with 5 nm Ti thin film as the adhesion layer between gold and porous silicon. Figure 2 shows the calculated reflection spectra of the TPP biosensor and DBR reflector, and the measured reflection spectrum of the TPP biosensor. The calculation is based on Transfer Matrix Method (TMM). We can see a salient resonant feature in spectrum of fabricated TPP which is due to coupling of light energy into TPP resonance at the resonant wavelength. Figure 3 shows the electric filed distribution pattern of the TPP biosensor simulated by COMSOL. The field strength reaches its highest peak level inside the first porous silicon layer (the first LP PSi, the nanocomposite layer as will be discussed later) and decays in both DBR and gold thin film.
Due to porous nature of porous silicon, the conformally deposited Au thin film is also porous and the first LP PSi layer has Au nanoparticles infiltrating into nanopores. Thus, a nanocomposite layer forms with estimated filling ratio of 30% [44]. The nanocomposite is available for liquid or analyte infiltration. Any liquid infiltration or biomolecular binding inside the nanocomposite layer will cause an increase in refractive index and a perturbation of the electrical field.
This is the advantage of the PSi TPP biosensor since the analyte can interact with peak electrical field and result in high sensitivity of detection. Figure 4(a) shows an example of TPP biosensor resonance redshift due to analyte binding in the nanocomposite layer. Figure 4(b) shows the simulated and experimental detection of liquids of varying R.I. Theoretical analysis agrees with experiment very well.
We also carried out detection of nucleocapsid protein (N-protein) of SARS-CoV-2 with the TPP biosensor. As a key structural protein of SARS-CoV-2 with good immunogenicity, N-protein is a good target to detect for COVID-19 diagnosis [49]. To guarantee specificity in biosensing, the TPP biosensor is first biofunctionalized with specific antibodies (see Supplementary Information). Afterwards, varying concentrations of N-protein was detected by the TPP biosensor.
Figure 5(a) shows the response of the biosensor, which is the redshift of the TPP resonance, as a function of the N-protein concentration. The dots represent experimental data. The curve represents simulation through Transfer Matrix Method (TMM) method with calculations carried out in MATLAB. The top porous silicon layer of the DBR is modeled as a nanocomposite consisting of porous silicon matrix and gold nanoparticles distributed randomly in the matrix with estimated 30% filling ratio. The antibodies as well as the N-proteins can infiltrate into this nanocomposite layer and interact with the strong electric field confined within the nanocomposite, resulting in high sensitivity biosensing. From Figure 5(a), it can be seen that the experimental data matches TMM modeling very well, which demonstrates that we have obtained a good structural modeling of the nanocomposite as well as the porous silicon DBR.
Author Contributions
Conceptualization, G.R. and M.S.; methodology, G.R. and M.S.; software, G.R.; writing—original draft preparation, G.R.; writing—review and editing, M.S.; supervision, M.S.; funding acquisition, M.S. All authors have read and agreed to the published version of the manuscript.
Funding
This research was funded by the Leading Innovative and Entrepreneur Team Introduction Program of Zhejiang grant number 2020R01005, Westlake University grant number 10318A992001, Tencent Foundation grant number XHTX202003001, and Zhejiang Key R&D Program grant number 2021C03002, The APC was funded by the Leading Innovative and Entrepreneur Team Introduction Program of Zhejiang.
Institutional Review Board Statement
Not applicable.
Informed Consent Statement
Not applicable.
Data Availability Statement
The data presented in this study are available on request from the corresponding author. The data are not publicly available due to privacy.
Conflicts of Interest
The authors declare no conflict of interest.
References
- Bahavarnia, F., M. Hasanzadeh, D. Sadighbayan and F. Seidi, Recent Progress and Challenges on the Microfluidic Assay of Pathogenic Bacteria Using Biosensor Technology. Biomimetics, 2022, 7.
- Singh, P., V.K. Pandey, S. Srivastava and R. Singh, A systematic review on recent trends and perspectives of biosensors in food industries. Journal of Food Safety, 2023.
- Herrera-Dominguez, M., G. Morales-Luna, J. Mahlknecht, Q. Cheng, I. Aguilar-Hernandez and N. Ornelas-Soto, Optical Biosensors and Their Applications for the Detection of Water Pollutants. Biosensors-Basel, 2023, 13.
- Uhuo, O.V., T.T. Waryo, K.C. Januarie, K.C. Nwambaekwe, M.M. Ndipingwi, P. Ekwere and E.I. Iwuoha, Bioanalytical methods encompassing label-free and labeled tuberculosis aptasensors: A review. Analytica Chimica Acta, 2022, 1234.
- Uniyal, A., G. Srivastava, A. Pal, S. Taya and A. Muduli, Recent Advances in Optical Biosensors for Sensing Applications: a Review. Plasmonics 2023, 18, 735–750. [CrossRef]
- Li, B.C., R.C. Zhang, R.Z. Bi and M. Olivo, Applications of Optical Fiber in Label-Free Biosensors and Bioimaging: A Review. Biosensors-Basel, 2023, 13.
- Khonina, S.N., G.S. Voronkov, E.P. Grakhova, N.L. Kazanskiy, R.V. Kutluyarov and M.A. Butt, Polymer Waveguide-Based Optical Sensors-Interest in Bio, Gas, Temperature, and Mechanical Sensing Applications. Coatings, 2023, 13.
- Ning, S.P., H.C. Chang, K.C. Fan, P.Y. Hsiao, C.H. Feng, D. Shoemaker and R.T. Chen, A point-of-care biosensor for rapid detection and differentiation of COVID-19 virus (SARS-CoV-2) and influenza virus using subwavelength grating micro-ring resonator. Applied Physics Reviews, 2023, 10.
- Wang, R.D., M.L. Yan, M. Jiang, Y. Li, X. Kang, M.X. Hu, B.B. Liu, Z.Q. He and D.P. Kong, Label-free and selective cholesterol detection based on multilayer functional structure coated fiber fabry-perot interferometer probe. Analytica Chimica Acta, 2023, 1252.
- Miyan, H., R. Agrahari, S.K. Gowre, P.K. Jain and M. Mahto, Computational study of 2D photonic crystal based biosensor for SARS-COV-2 detection. Measurement Science and Technology, 2023, 34.
- Taya, S.A., N. Doghmosh, A.H.M. Almawgani, A.T. Hindi, I. Colak, A.A.M. Alqanoo, S.K. Patel and A. Pal, Surface Plasmon Resonance Biosensor Based on STO and Graphene Sheets for Detecting Two Commonly Used Buffers: TRIS-Borate-EDTA and Dulbecco Phosphate Buffered Saline. Plasmonics, 2023.
- Coco, A.S., F.V. Campos, C.A.R. Diaz, M.C.C. Guimaraes, A.R. Prado and J.P. de Oliveira, Localized Surface Plasmon Resonance-Based Nanosensor for Rapid Detection of Glyphosate in Food Samples. Biosensors-Basel, 2023, 13.
- Wu, B., G.G. Rong, J.W. Zhao, S.L. Zhang, Y.X. Zhu and B.Y. He, A Nanoscale Porous Silicon Microcavity Biosensor for Novel Label-Free Tuberculosis Antigen-Antibody Detection. Nano, 2012, 7.
- Rong, G.G., Y. Q. Zheng, X.Q. Li, M.Z. Guo, Y. Su, S.M. Bian, B.B. Dang, Y. Chen, Y.J. Zhang, L.H. Shen, et al., A high-throughput fully automatic biosensing platform for efficient COVID-19 detection. Biosensors & Bioelectronics, 2023, 220.
- Rong, G., A. Najmaie, J.E. Sipe and S.M. Weiss, Nanoscale porous silicon waveguide for label-free DNA sensing. Biosensors & Bioelectronics 2008, 23, 1572–1576. [CrossRef] [PubMed]
- Rong, G.G., Y.Q. Zheng, X. Yang, K.J. Bao, F. Xia, H.H. Ren, S.M. Bian, L. Li, B.W. Zhu and M. Sawan, A Closed-Loop Approach to Fight Coronavirus: Early Detection and Subsequent Treatment. Biosensors-Basel, 2022, 12.
- Weiss, S.M. and G.G. Rong, Porous Silicon Waveguides for Small Molecule Detection. Nanoscience and Nanotechnology for Chemical and Biological Defense, 2009, 1016, 185-+.
- Kaliteevski, M., I. Iorsh, S. Brand, R.A. Abram, J.M. Chamberlain, A.V. Kavokin and I.A. Shelykh, Tamm plasmon-polaritons: Possible electromagnetic states at the interface of a metal and a dielectric Bragg mirror. Physical Review B, 2007, 76.
- Sasin, M.E., R.P. Seisyan, M.A. Kalitteevski, S. Brand, R.A. Abram, J.M. Chamberlain, A.Y. Egorov, A.P. Vasil'ev, V.S. Mikhrin and A.V. Kavokin, Tamm plasmon polaritons: Slow and spatially compact light. Applied Physics Letters, 2008, 92.
- Lu, H., Y.W. Li, H. Jia, Z.W. Li, D. Ma and J.L. Zhao, Induced reflection in Tamm plasmon systems. Optics Express, 2019, 27, 5383–5392. [CrossRef]
- Normani, S., F.F. Carboni, G. Lanzani, F. Scotognella and G.M. Paterno, The impact of Tamm plasmons on photonic crystals technology. Physica B-Condensed Matter, 2022; 645.
- Toanen, V., C. Symonds, J.M. Benoit, A. Gassenq, A. Lemaitre and J. Bellessa, Room-Temperature Lasing in a Low-Loss Tamm Plasmon Cavity. Acs Photonics, 2020, 7, 2952–2957. [CrossRef]
- Pyatnov, M.V., R.G. Bikbaev, I.V. Timofeev and S.Y. Vetrov, Model of a tunable hybrid Tamm mode-liquid crystal device. Applied Optics, 2020, 59, 6347–6351. [CrossRef] [PubMed]
- Zhong, Y.J., Y. Huang, S.C. Zhong, T.L. Lin, Z.H. Zhang, Q.M. Zeng, L.G. Yao, Y.J. Yu and Z.K. Peng, Tamm plasmon polaritons induced active terahertz ultra-narrowband absorbing with MoS2. Optics and Laser Technology, 2022; 156.
- Zhang, X.L., J.F. Song, X.B. Li, J. Feng and H.B. Sun, Optical Tamm states enhanced broad-band absorption of organic solar cells. Applied Physics Letters, 2012, 101.
- Elsayed, H.A., T.A. Taha, S.A. Algarni, A.M. Ahmed and A. Mehaney, Evolution of optical Tamm states in a 1D photonic crystal comprising a nanocomposite layer for optical filtering and reflecting purposes. Optical and Quantum Electronics, 2022, 54.
- Ruan, B.X., M. Li, C. Liu, E.D. Gao, Z.B. Zhang, X. Chang, B.H. Zhang and H.J. Li, Slow-light effects based on the tunable Fano resonance in a Tamm state coupled graphene surface plasmon system. Physical Chemistry Chemical Physics, 2023, 25, 1685–1689. [CrossRef]
- Ahmed, A.M., H.A. Elsayed and A. Mehaney, High-Performance Temperature Sensor Based on One-dimensional Pyroelectric Photonic Crystals Comprising Tamm/Fano Resonances. Plasmonics, 2021, 16, 547–557. [CrossRef]
- Sabra, W., H.A. Elsayed, A. Mehaney and A.H. Aly, Numerical optimization of 1D superconductor photonic crystals pressure sensor for low temperatures applications. Solid State Communications, 2022, 343.
- Hao, H.Y., F. Xing and L. Li, Plasmon-based optical sensors for high-sensitivity surface deformation detection of silver and gold. Applied Nanoscience, 2020, 10, 3939–3944.
- Zaky, Z.A., M. Al-Dossari, E.I. Zohny and A.H. Aly, Refractive index sensor using Fibonacci sequence of gyroidal graphene and porous silicon based on Tamm plasmon polariton. Optical and Quantum Electronics, 2023, 55.
- Sansierra, M.C., J. Morrone, F. Cornacchiulo, M.C. Fuertes and P.C. Angelome, Detection of Organic Vapors Using Tamm Mode Based Devices Built from Mesoporous Oxide Thin Films. Chemnanomat, 2019, 5, 1289–1295. [CrossRef]
- Zaky, Z.A., H. Hanafy, A. Panda, P.D. Pukhrambam and A.H. Aly, Design and Analysis of Gas Sensor Using Tailorable Fano Resonance by Coupling Between Tamm and Defected Mode Resonance. Plasmonics, 2022, 17, 2103–2111. [CrossRef]
- Liu, Y.M., Q. W. Zheng, H.X. Yuan, S.P. Wang, K.Q. Yin, X.Y. Dai, X. Zou and L.Y. Jiang, High Sensitivity Terahertz Biosensor Based on Mode Coupling of a Graphene/Bragg Reflector Hybrid Structure. Biosensors-Basel, 2021, 11.
- Panda, A. and P. D. Pukhrambam, Study of Metal-Porous GaN-Based 1D Photonic Crystal Tamm Plasmon Sensor for Detection of Fat Concentrations in Milk. Micro and Nanoelectronics Devices, Circuits and Systems, 2023, 904, 415–425. [Google Scholar]
- Maji, P.S., M. K. Shukla and R. Das, Blood component detection based on miniaturized self-referenced hybrid Tamm-plasmon-polariton sensor. Sensors and Actuators B-Chemical, 2018, 255, 729–734. [Google Scholar]
- Su, M.Y., K.S. Li, C.F. Wang, L.M. Wu, S. Yang, Q.W. Lin, Y. Li, L.P. Tang and R.L. Zhou, Tamm-plasmon-polariton biosensor based on one-dimensional topological photonic crystal. Results in Physics, 2023, 48.
- Hou, Q.R. and N. Chi, Calculation of surface areas for porous silicon. Modern Physics Letters B, 1999, 13, 1005–1009. [CrossRef]
- Northen, T.R., H.K. Woo, M.T. Northen, A. Nordström, W. Uritboonthail, K.L. Turner and G. Siuzdak, High surface area of porous silicon drives desorption of intact molecules. Journal of the American Society for Mass Spectrometry, 2007, 18, 1945–1949. [CrossRef]
- Li, C., H.L. Liao, R. Huang and Y.Y. Wang, A CMOS-compatible silicon substrate optimization technique and its application in radio frequency crosstalk isolation. Chinese Physics B, 2008, 17, 2730–2738. [CrossRef]
- Juneau-Fecteau, A. and L.G. Frechette, Tamm plasmon-polaritons in a metal coated porous silicon photonic crystal. Optical Materials Express, 2018, 8, 2774–2781. [CrossRef]
- Ahmed, A.M. and A. Mehaney, Ultra-high sensitive 1D porous silicon photonic crystal sensor based on the coupling of Tamm/Fano resonances in the mid-infrared region. Scientific Reports, 2019, 9.
- Juneau-Fecteau, A., R. Savin, A. Boucherif and L.G. Frechette, A practical Tamm plasmon sensor based on porous Si. Aip Advances, 2021, 11.
- Vyunishev, A.M., R.G. Bikbaev, S.E. Svyakhovskiy, I.V. Timofeev, P.S. Pankin, S.A. Evlashin, S.Y. Vetrov, S.A. Myslivets and V.G. Arkhipkin, Broadband Tamm plasmon polariton. Journal of the Optical Society of America B-Optical Physics, 2019, 36, 2299–2305.
- Jeng, S.C., Applications of Tamm plasmon-liquid crystal devices. Liquid Crystals, 2020, 47, 1223–1231. [CrossRef]
- Kumari, A., S. Kumar, M.K. Shukla, G. Kumar, P.S. Maji, R. Vijaya and R. Das, Coupling to Tamm-plasmon-polaritons: dependence on structural parameters. Journal of Physics D-Applied Physics, 2018, 51.
- Khardani, M., M. Bouaicha and B. Bessais, Bruggeman effective medium approach for modelling optical properties of porous silicon: comparison with experiment. Physica Status Solidi C - Current Topics in Solid State Physics 2007, 4, 1986.
- Khardani, M., M. Bouaicha and B. Bessais, Bruggeman effective medium approach for modelling optical properties of porous silicon: comparison with experiment. Journal of the Optical Society of America B-Optical Physics, 2017, 34, 2128–2139.
- Li, X.W., M.Y. Xiong, Q.L. Deng, X.B. Guo and Y.R. Li, The utility of SARS-CoV-2 nucleocapsid protein in laboratory diagnosis. Journal of Clinical Laboratory Analysis, 2022; 36.
- Litchfield, M., P. Brookes, A. Ojrzynska, J. Kavi and R. Dawood, Comparison of the clinical sensitivity and specificity of two commercial RNA SARS-CoV-2 assays. International Journal of Infectious Diseases, 2022, 118, 194–196. [CrossRef] [PubMed]
- Mistry, D.A., J.Y. Wang, M.E. Moeser, T. Starkey and L.Y.W. Lee, A systematic review of the sensitivity and specificity of lateral flow devices in the detection of SARS-CoV-2. Bmc Infectious Diseases, 2021; 21.
- Fox, T., J. Geppert, J. Dinnes, K. Scandrett, J. Bigio, G. Sulis, D. Hettiarachchi, Y. Mathangasinghe, P. Weeratunga, D. Wickramasinghe, et al., Antibody tests for identification of current and past infection with SARSCoV-2. Cochrane Database of Systematic Reviews, 2022.
Figure 1.
(a) Structural diagram and measurement setup of the TPP biosensor; (b) cross-sectional SEM image of the fabricated TPP biosensor. The periodic porous silicon DBR of ten periods is clearly visible, and the Au layer is the bright region on top of DBR.
Figure 1.
(a) Structural diagram and measurement setup of the TPP biosensor; (b) cross-sectional SEM image of the fabricated TPP biosensor. The periodic porous silicon DBR of ten periods is clearly visible, and the Au layer is the bright region on top of DBR.
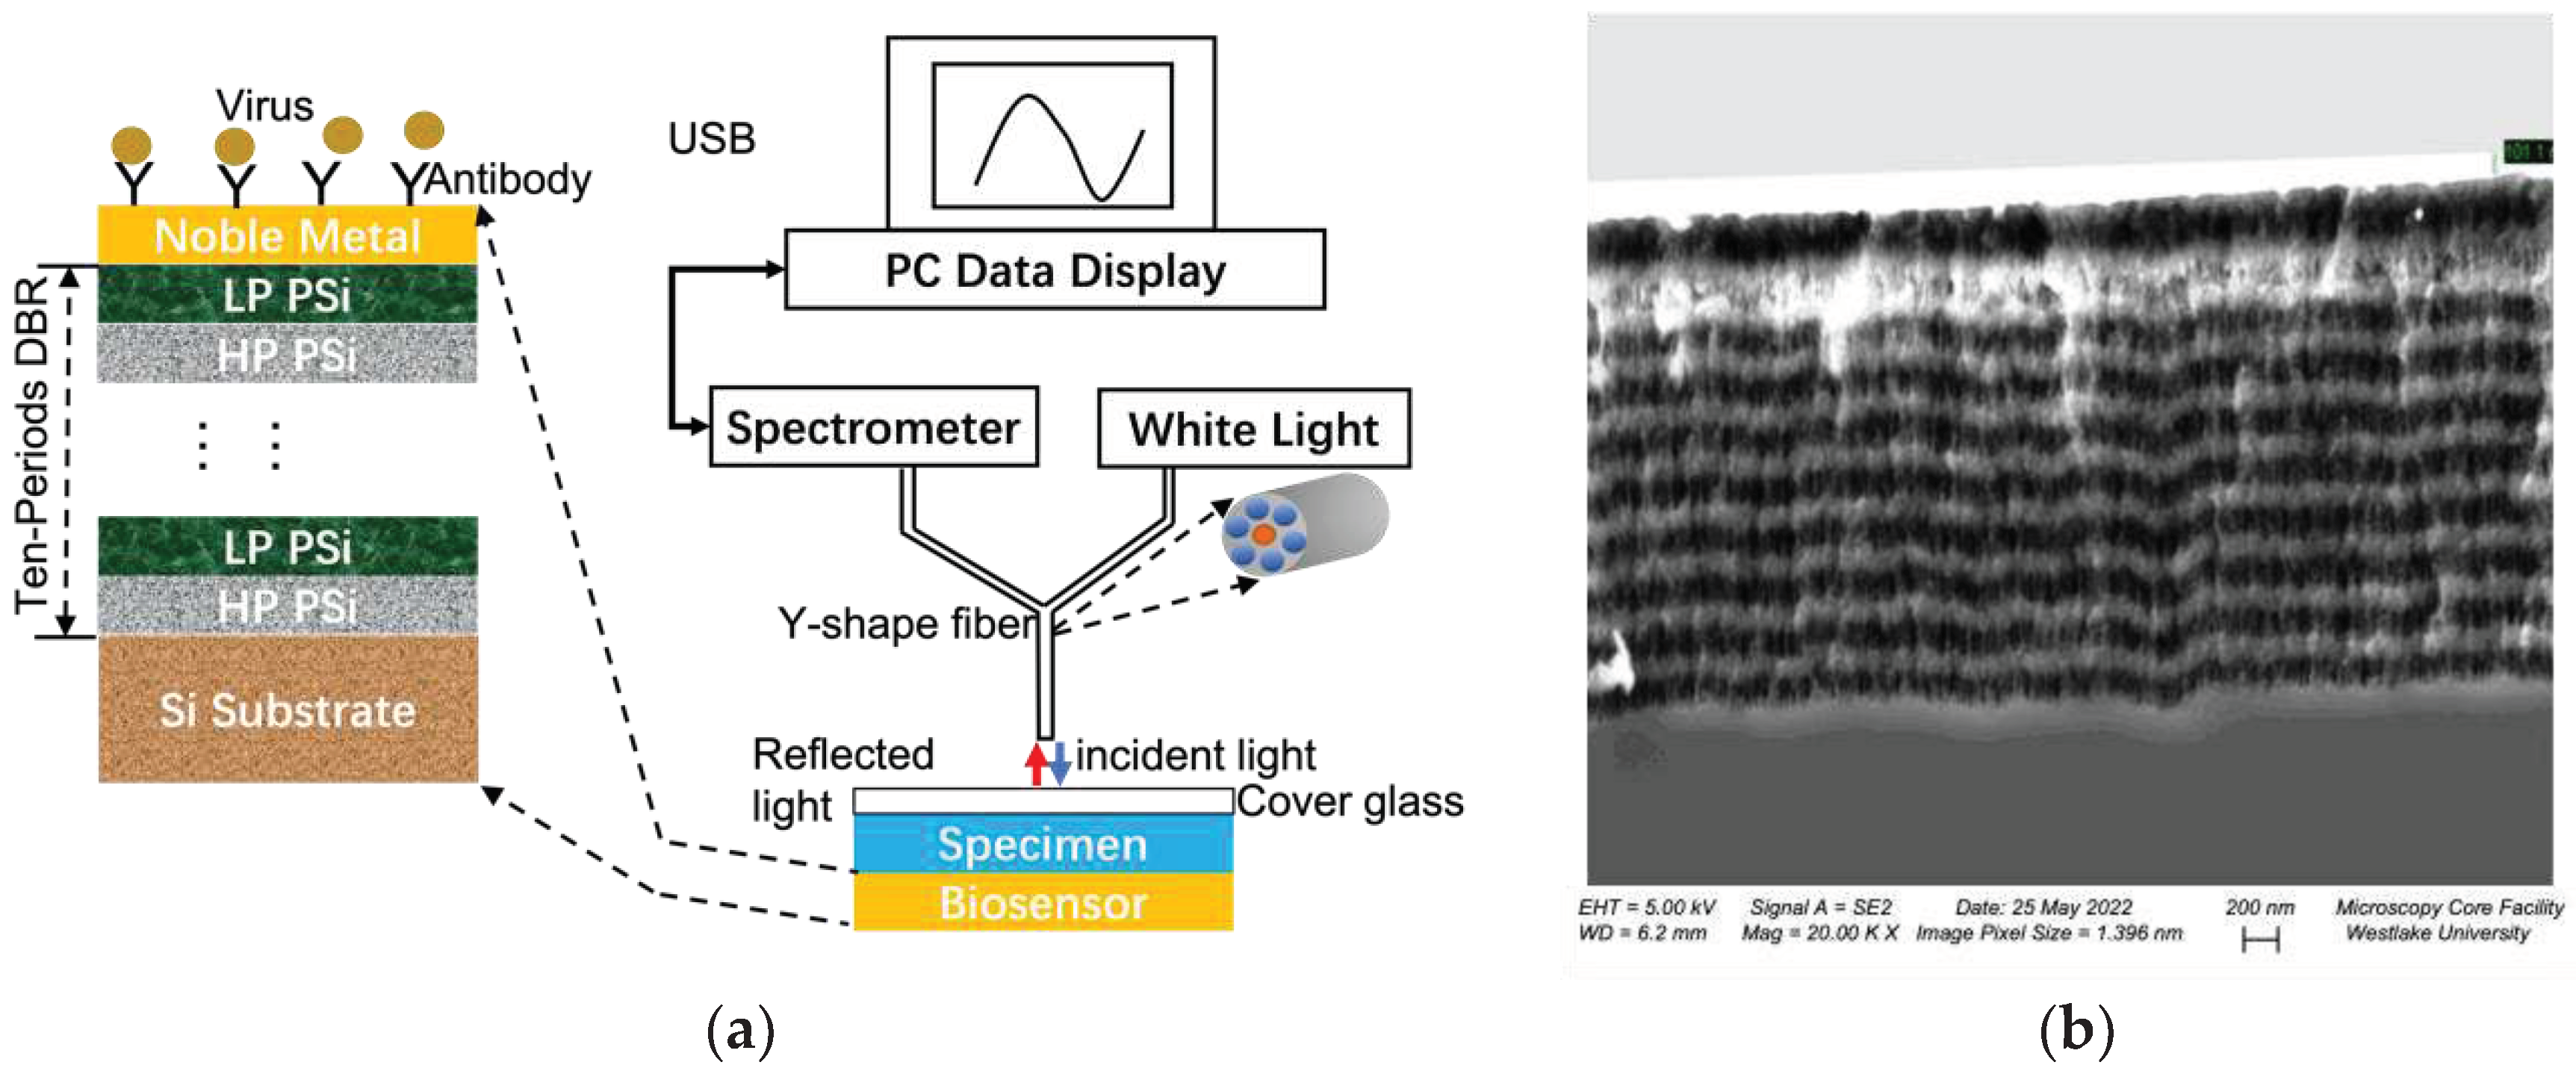
Figure 2.
TMM calculated reflection spectra of the DBR and TPP, and measured reflection spectrum of the fabricated porous silicon TPP. Theoretical TPP resonance wavelength is inside the DBR bandgap and close to the band edge on the right. Fabricated device shows clear TPP resonance, with longer resonance wavelength than calculated. The discrepancies between measurement and TMM calculation are due to nonidealities of porous silicon and Au thin film thicknesses, and the fact that scattering and absorption losses of porous silicon are not modeled in TMM calculation.
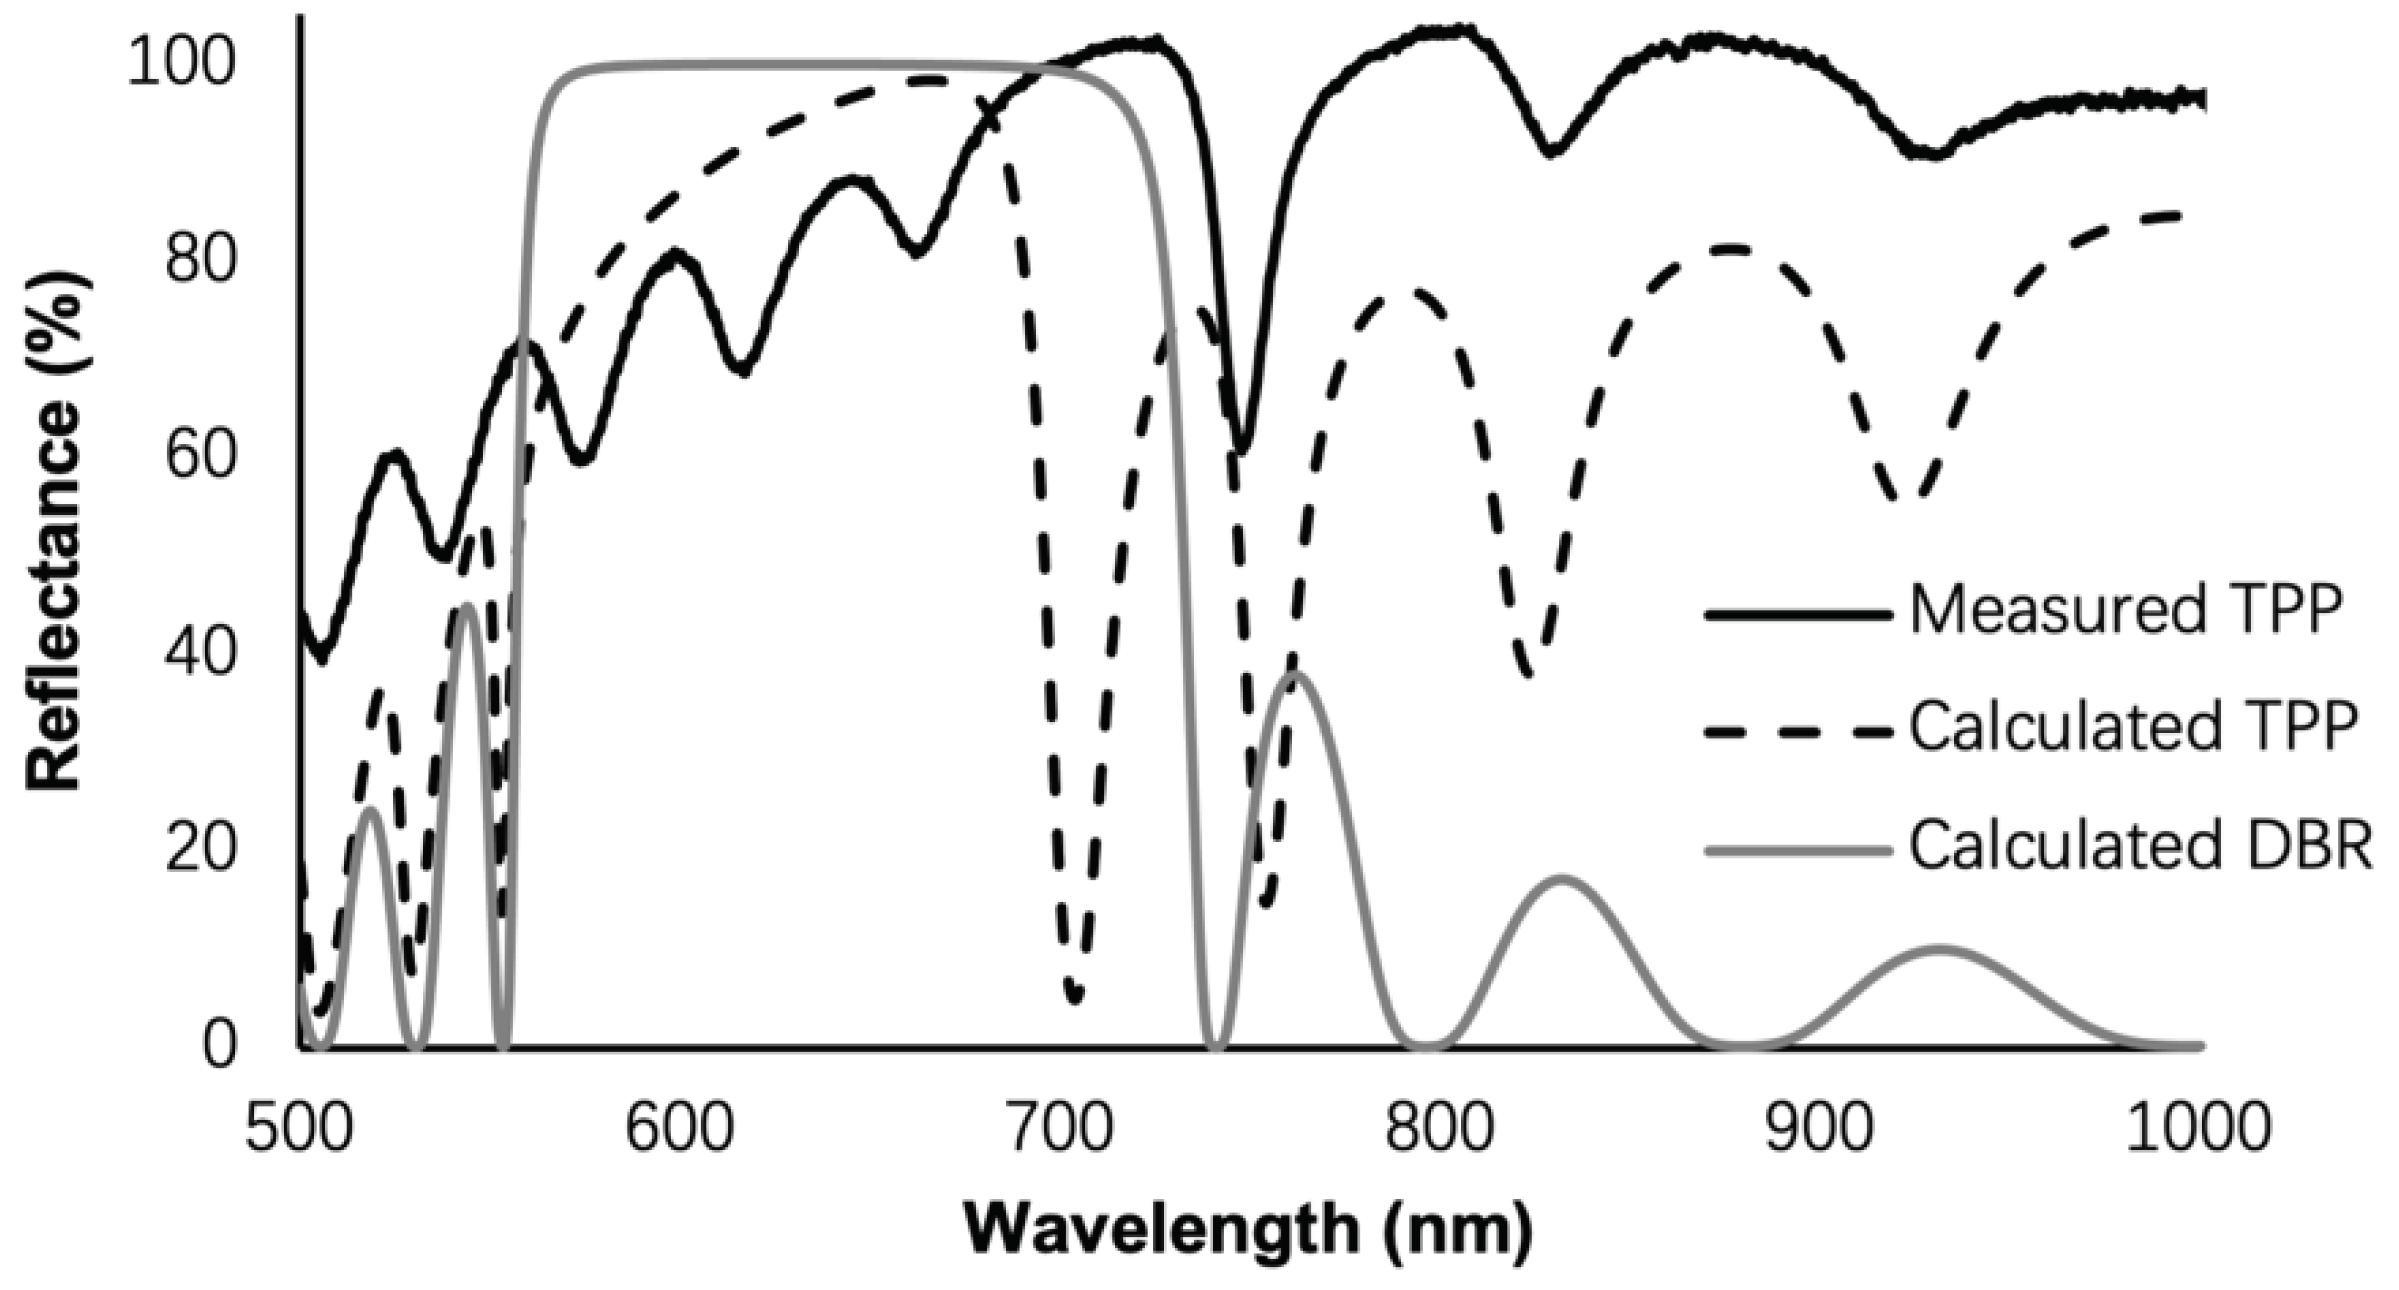
Figure 3.
COMSOL simulated distribution of electrical field intensity of TPP biosensor based on ten-period porous silicon DBR. The polarization is transverse electric (TE), with red arrow at the left side indicating light of 1W/m incident vertically from air. The highest peak of electrical field intensity resides in the first LP PSi layer. Au nanoparticles infiltrate into the first LP PSi layer to form a nanocomposite layer, which is displayed in the cartoon on the lower left of the figure.
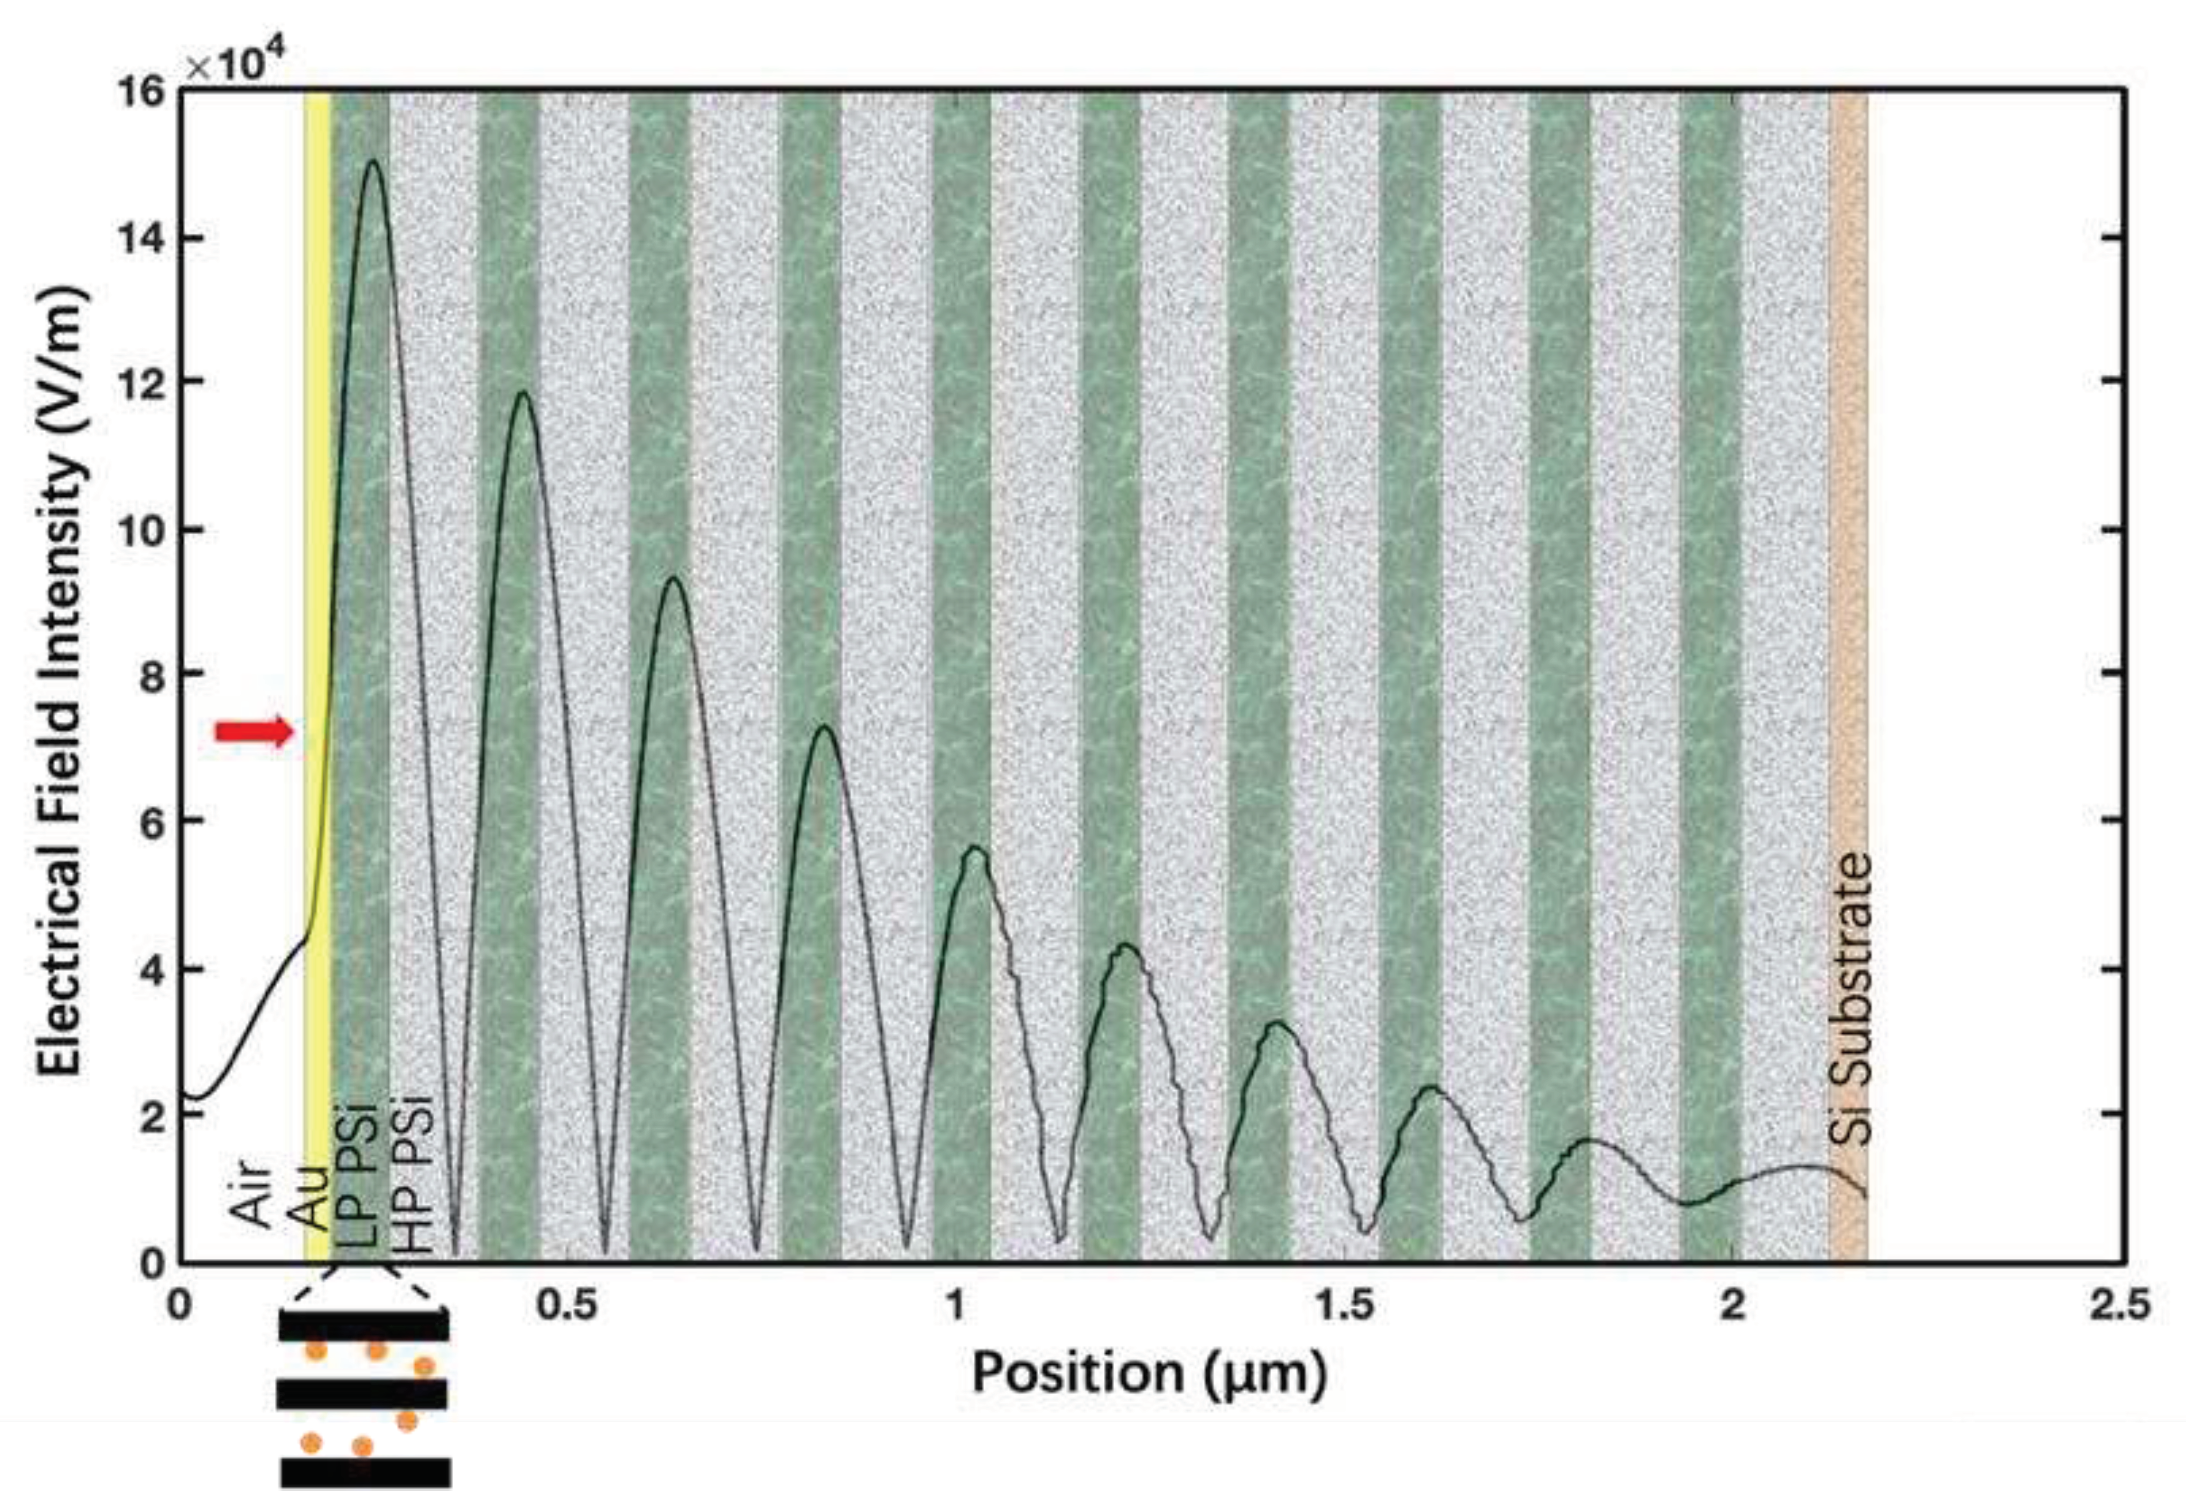
Figure 4.
(a) Example of a redshift of the TPP resonance as a response to the perturbation of refractive index in the nanocomposite layer; (b) simulated (solid curve) and experimental (black circle) response curve of the TPP biosensor as liquids of varying refractive indices are applied on the biosensor surface.
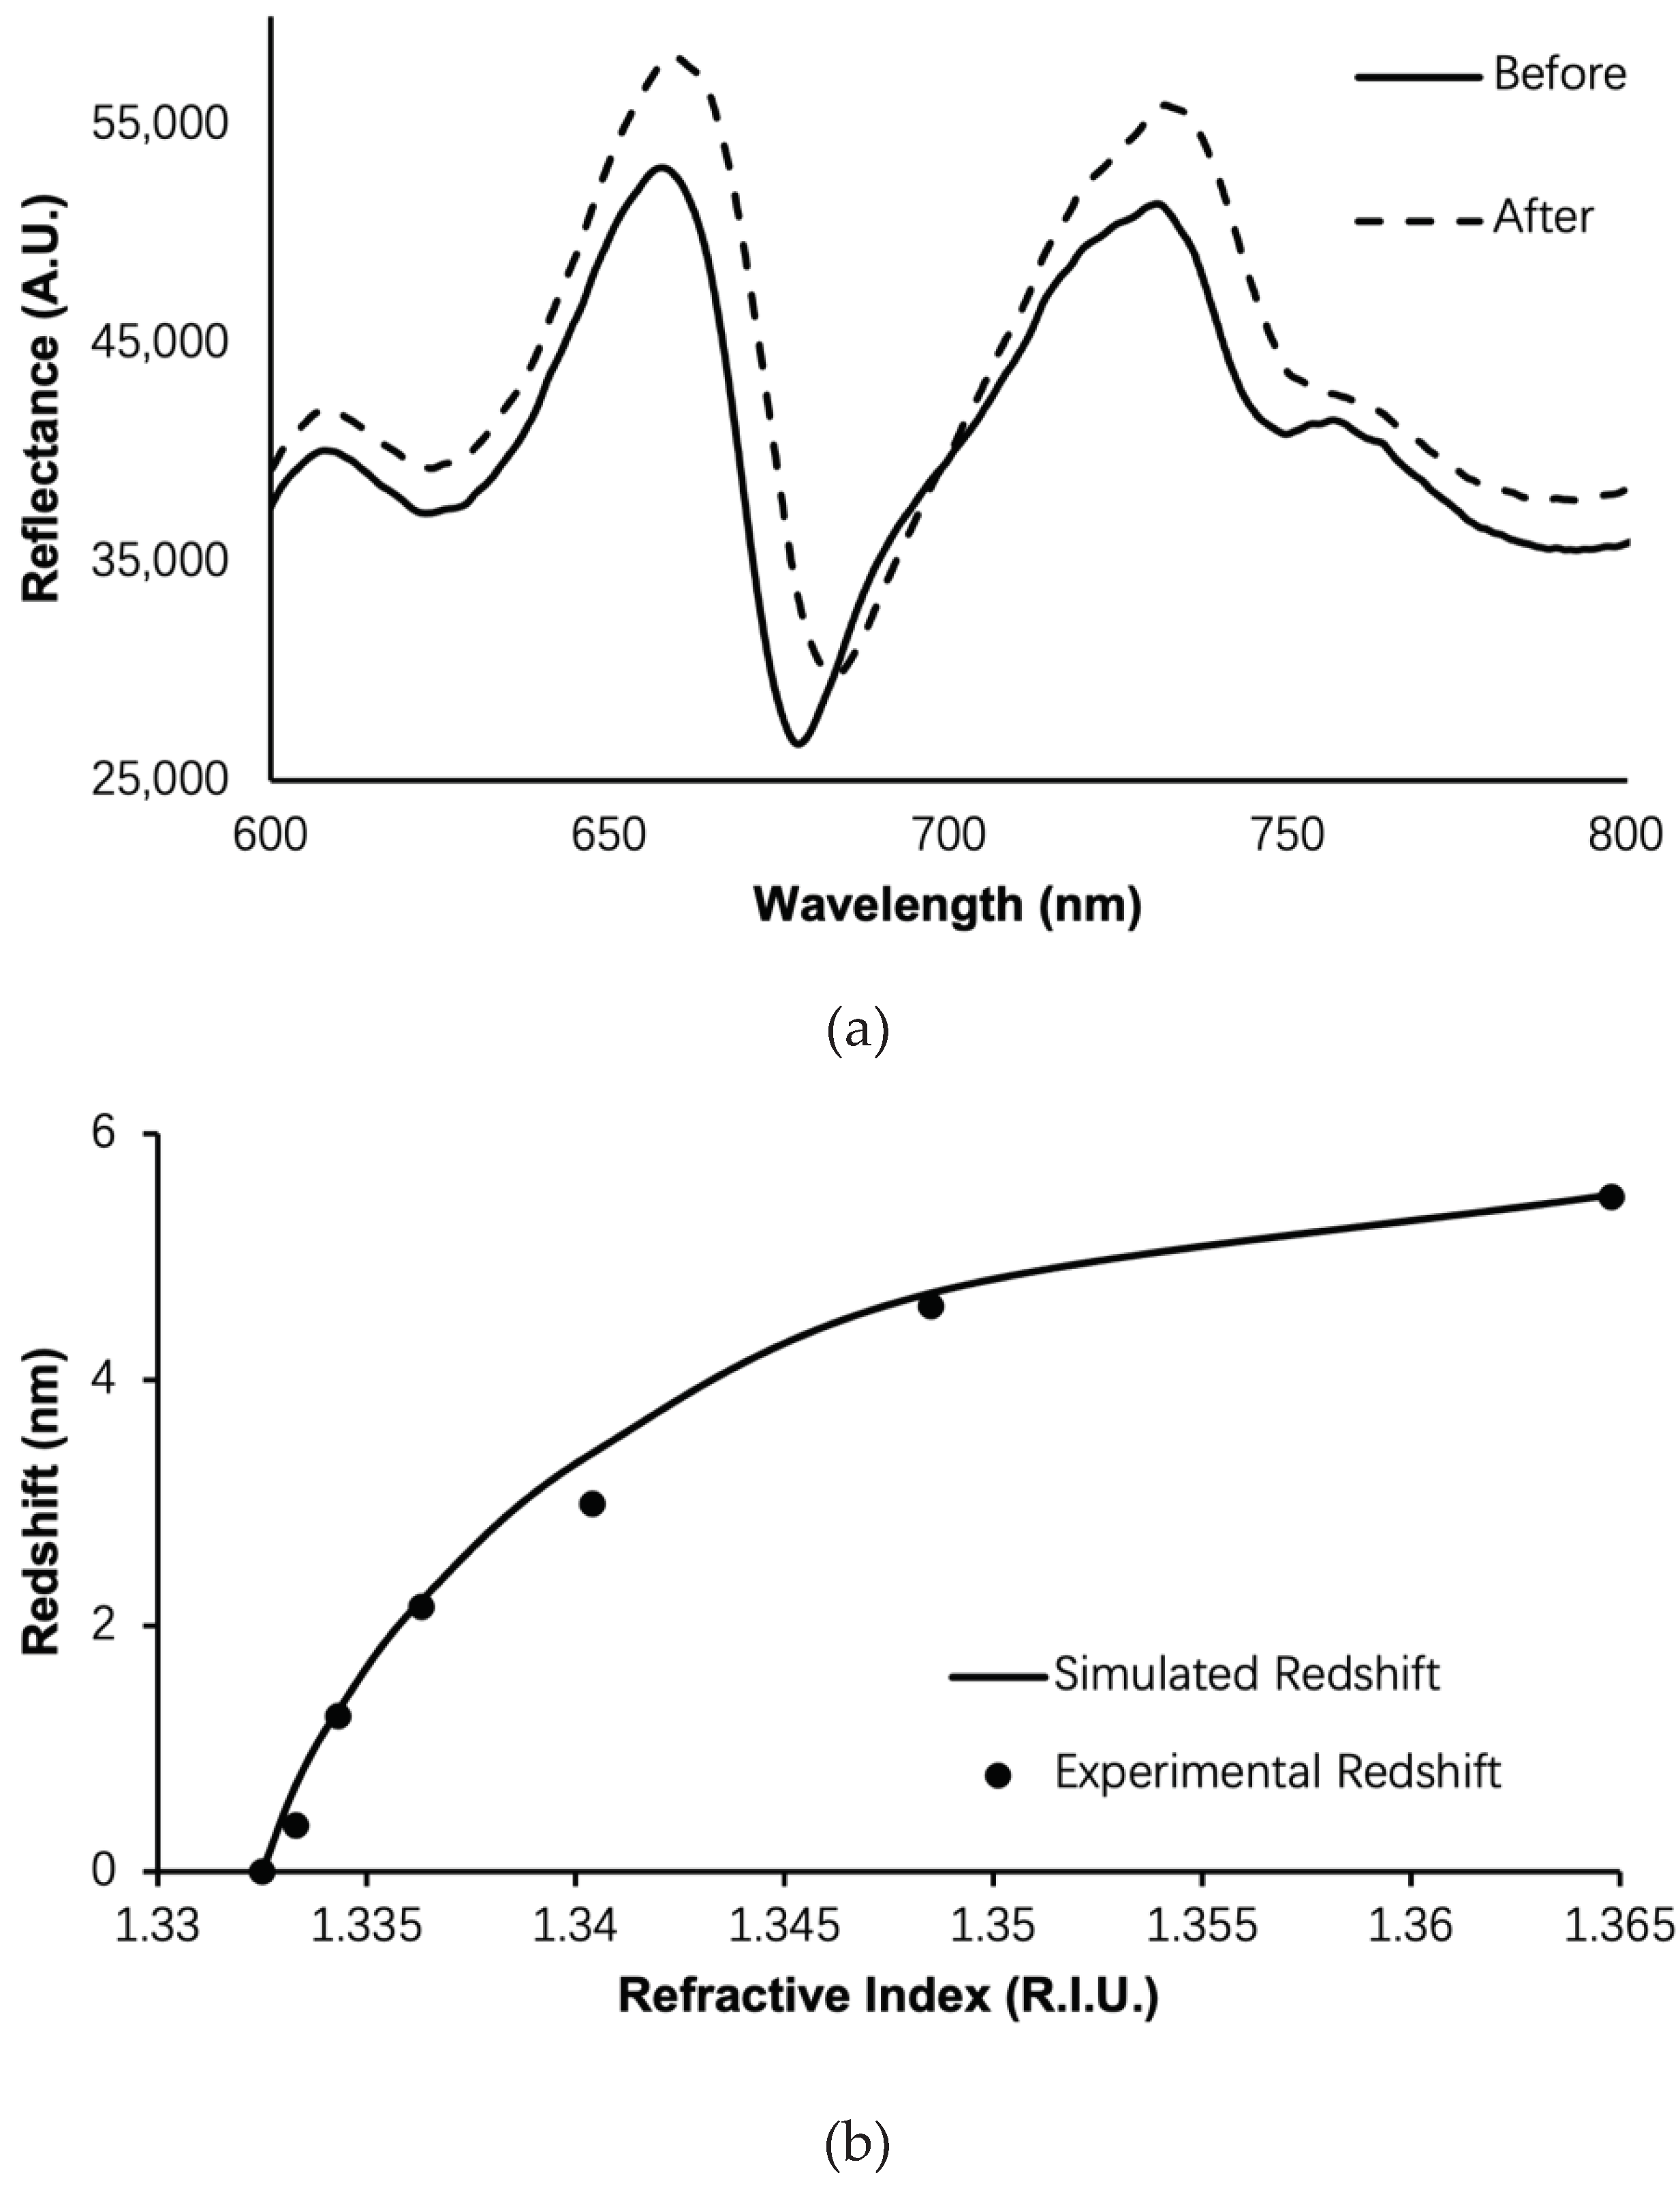
Figure 5.
(a) Experimental (circle) and TMM calculated (solid curve) response of the TPP biosensor, that is, the amount of redshift of TPP resonance as function of N-protein concentrations with error bars showing standard error from five experiments; (b) real-time response of TPP biosensor for detection of 8 µg/ml of N-protein, in which the reflection spectrum of TPP biosensor is collected every ten seconds in a ten-minute detection process and the total redshift at the end is up to 5.2 nm.
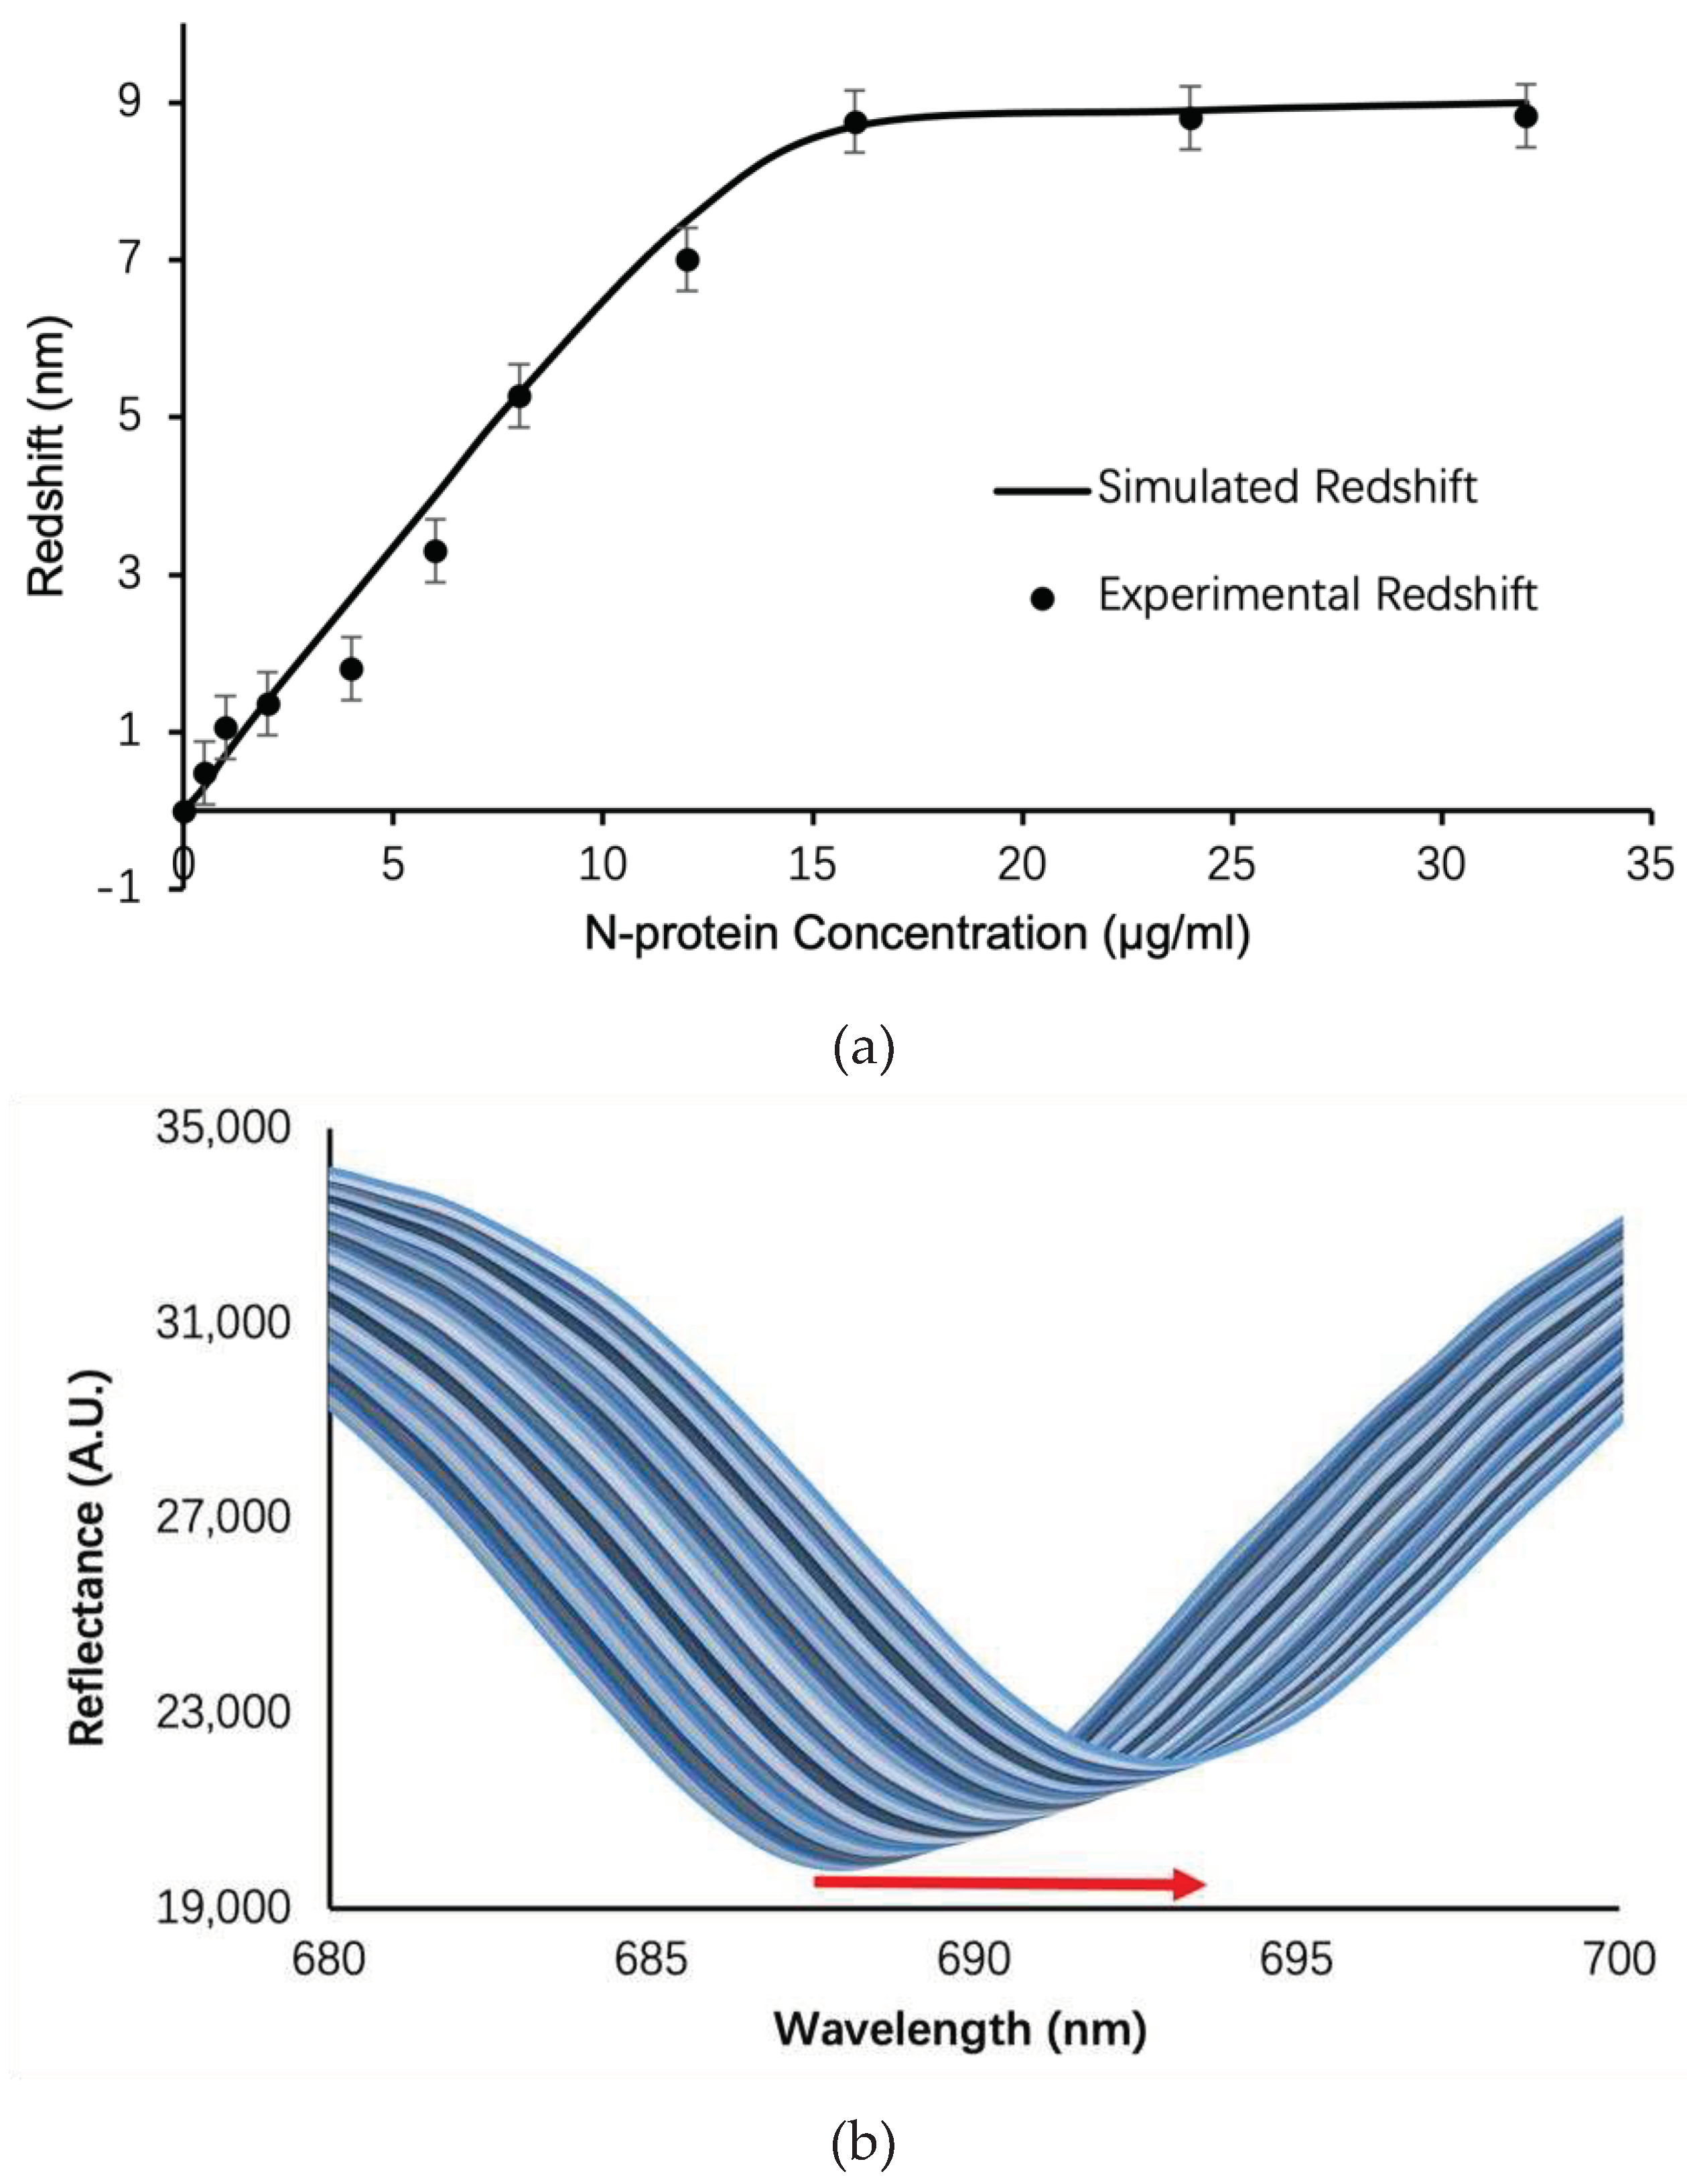

Table 1.
Porous silicon etch conditions and optical parameters.
| Structure | Porosity | Current Density | Etch Time | Bruggeman Effective R.I. | Thickness |
| LP PSi | 52% | 5mA/cm2 | 20 seconds | 2.08 | 100 nm |
| HP PSi | 76% | 48mA/cm2 | 6 seconds | 1.41 | 150 nm |
LP: Low Porosity; HP: High Porosity.
Table 2.
Procedure for antibody immobilization on TPP biosensor.
| No. | Step Name | Step Operation |
| 1 | Chip cleaning | Clean the chips using a plasma cleaning machine, ethanol, isopropanol, and ultrapure water, and then place them in a 96 well plate container for later use. |
| 2 | Sulfhydryl proteinA modified chip | Dilute mercapto proteinA (Xlement Cat. No. G60001) with ultrapure water to a working concentration of 50ug/mL, take an appropriate amount of mercapto proteinA solution and add it to the chip surface. Leave at 4°C overnight or 37 ℃ for 2 hours. |
| 3 | Preparation of coating antibody solution | Take COVID-19 N-protein antibody (Xlement Cat. No. C10002), use coupling buffer solution (Xlement Cat. No. S20029) to prepare 50 μg/mL of coating antibody solution. |
| 4 | Chip directed immobilization of antibodies | Take an appropriate amount of 50 μg/mL of coating antibody solution and apply on the surface of the chip and react at 37°C (with shaking) for 20-30 minutes. After reaction, clean the chip twice with Phosphate-buffered saline (PBS) buffer solution (pH ~7.4). |
| 5 | Closure | Take an appropriate amount of sealing solution (Xlement Cat. No. G30004) and add it to the surface of the chip. Leave it at 37°C for 30 minutes. After removing and drying the sealing solution, the chips can be used directly for detection assay. Alternatively, perform the following steps before storing chips for future use. |
| 6 | Protection | Take an appropriate amount of protective solution (Xlement Cat. No. G30006) and add it to the surface of the chip. Place it at 37°C for 30 minutes, then remove and dry the protective solution. |
| 7 | Chip drying | Place the modified chip in a 37°C oven and dry for 5 minutes. |
| 8 | Plastic sealing | Use a sealing machine to vacuum seal the wrapped chips and refrigerate them for storage. |
Table 3.
A comparison of the TPP biosensor technology proposed in this work with state-of-the-art COVID-19 diagnostic techniques reported in literature.
Table 3.
A comparison of the TPP biosensor technology proposed in this work with state-of-the-art COVID-19 diagnostic techniques reported in literature.
| Technologies | Target | Sensitivity | Specificity | Advantages | Disadvantages |
| Reverse transcription polymerase chain reaction (RT-PCR) [50] | Specific gene sequence, such as ORF1ab | >90% | Nearly 100% | Accurate result, current gold standard, high throughput. | Need clean environment, complex equipment, and staff training, slow turnaround |
| Antigen detection by lateral flow [51] | Viral proteins such as N-proteinOr S-protein | 37.7%-99.2% | 92.4%-100% | Rapid and onsite detection, no need for equipment. | Accurate only in the 1st week of disease onset, low throughput. |
| Antibody detection by lateral flow [52] | Immune globulin such as IgG or IgM | 41.1%-95% | 98.6-99.8% | Rapid and onsite detection, no need for equipment. | Antibody cross-relation with other infections, low throughput. |
| TPP biosensor(this work) | N-protein | >90% | >95% | Rapid and onsite detection, high throughput. | Need handheld or desktopequipment |
Disclaimer/Publisher’s Note: The statements, opinions and data contained in all publications are solely those of the individual author(s) and contributor(s) and not of MDPI and/or the editor(s). MDPI and/or the editor(s) disclaim responsibility for any injury to people or property resulting from any ideas, methods, instructions or products referred to in the content. |
© 2023 by the authors. Licensee MDPI, Basel, Switzerland. This article is an open access article distributed under the terms and conditions of the Creative Commons Attribution (CC BY) license (http://creativecommons.org/licenses/by/4.0/).
Copyright: This open access article is published under a Creative Commons CC BY 4.0 license, which permit the free download, distribution, and reuse, provided that the author and preprint are cited in any reuse.


