
Submitted:
27 June 2023
Posted:
28 June 2023
You are already at the latest version
Abstract
This study reports the design of a dielectric resonator (DR) metasurface-based terahertz biosensor for rapid and accurate detection of different kinds of viruses (H1N1, SARA-COV-2, etc.). The characterization of the sensor is done by analyzing its absorbance properties with and without the presence of the H1N1 virus layer of different concentrations and electrical properties in the frequency range of 2.4 THz to 3 THz. A full-wave EM model of the sensor is designed using CST MWS software. The geometrical parameters of the proposed biosensor, as well as its dielectric constant of the virus swab, are varied to achieve good performance with an absorption level close to 1 (100%). A significant change in the resonating pick-up frequency owing to the variation in the effective refractive index of the realized sensor ensures the detection and classification of the different concentrations of the same or different viruses. The presented design could be used for the rapid detection of viruses with the added advantages of contactless, label-free, and accurate identification of different concentrations of viruses.
Keywords:
Metasurface
; Corona Virus
; Dielectric resonator
; Virus Detection
1. Introduction
There has been a profound impact of the Coronavirus pandemic on the global economy, resulting in widespread contraction, job losses, and disruptions in a variety of sectors. The pandemic has exposed vulnerabilities in supply chains, tourism, and global trade because of the inaccurate and faster detection procedures at the start of the pandemic [1,2]. The global economy's fallout is recovering steadily but still, many counties are far behind their pre-COVID economy status.
The rapid, inexpensive, and accurate detection and identification of the viruses such as corona (COVID-19), server acute respiratory syndrome (SARS), Zika, middle east respiratory syndrome (MERS), Avian Influenza (AI), etc. could help us to minimize their adverse impact on the population and eventually on world economy [3,4,5,6,7]. The conventional widely used techniques of polymerase chain reaction (PCR) and the branched-chain DNA (bDNA) took more time and are labor-intensive [8,9,10]. Also, their detection speed and sensitivity are lower [3,4,9,11,12].
Terahertz (THz) technique, particularly THz time-domain spectroscopy (THz-TDs), for the analysis of biomaterials, has gained a lot of interest in recent times [13,14]. THz spectroscopy offers the advantages of label-free, non-contact, and non-destructive biosensing of viruses [4,13,15]. It has been proven that the binding energy and vibration-rotational levels of biomaterial molecules lie in the THz spectrum [11,14,15,16]. The analysis of the transmission and absorption characteristics of microorganisms of biomaterial in the THz range can be used for rapid and accurate detection [11,15].
Done et al. [11] developed a metamaterial-based biosensor based on spoof surface plasmon polaritons (SPSS) technique for the detection of Influenza viruses (HN5N2, H1N1, H9N2) by analyzing the level of proteins in them. The authors in [4] developed a THz split-ring resonator for the detection and analysis of PRD1 and MS2 viruses using the THz-TDs method. A metamaterial sensing chip is reported in [15] for ultrasensitive THz biosensing.
Dolai et al. [6] used THz spectroscopy for the detection of the Zika virus by placing its samples on graphene. The study of Keshavarz [3] shows that different avian influenza viruses (H1N1, H5N2, and H9N2) can be detected by observing the change in their resonance frequency with the change in virus type. A plasmonic metamaterial-based biosensor was proposed in [17] for the detection and identification of Zika virus. The findings of [18] revealed that the detection sensitivity of the PRDI virus can be increased by employing the nanowire structure in a metasurface-based biosensor. The authors in [16] suggested that metallic mesh-based biosensors boost the sensitivity of the detection of proteins in biomaterials.
This study reports the design of a DR-based metasurface biosensor for the rapid detection of the virus. Figure 1 shows the design of the proposed biosensor and the virus detection methodology. The realized biosensor constitutes circular DR having a radius ‘r’ and is made of silicon material (εr= 11.9). The DR is placed on a quartz substrate having a relative permittivity of 3.75 and a loss tangent of 0.0001. The quartz substrate is backed by a gold (Au) ground plane. The absorbance characteristics of the investigating sensor are analyzed in CST MWS using a Floquet port in the frequency range of 2.4 THz to 3 THz. Firstly, the absorbance of the biosensor is obtained without virus and its resonance (pick-up) frequency (f1) and absorbance level (A1) are recorded. Then the H1N1 virus swab is placed around the DR on the top of the quartz substrate as shown in Figure 2. To our best knowledge, until now we don't have any reported permittivity value of the COVID-19 virus. As the COVID-19 virus is classified close to the family/behavior of the Influenza viruses (H5N2, H1N1, H9N2), we have decided to work with H1N1 virus permittivity. We can use any other values with small optimization in the structure dimensions. The analysis shows that the absorbance level (A2) of the presented sensor increases, and its pick-up frequency (f2) reduces with the placement of the virus swab around DR. The difference in the pick-up frequencies (∆f) and absorbance level (∆A) is used for the detection of the virus as per the concentration of the virus swab (hvirus). The study includes the parametric analysis of the virus swab concentration (hvirus), DR radius (r), thickness of the DR (hDRA), and dielectric constant of the virus swab for the sensitivity and selectivity analysis of the presented biosensor. %). A significant change in the resonating pick-up frequency owing to the variation in the effective refractive index of the realized sensor ensures the detection and classification of the different concentrations of the same or different viruses.
2. Biosensor Structure Design
Figure 1 and Figure 2 show the structure of the proposed biosensor. In this work, employing the CST software package we have designed a metasurface using a circular dielectric resonator (DR) for operation in the frequency band 2.4 THz to 3 THz. The metallic ground of the designed DR-metasurface is composed of Gold (Au) whereas the substrate is made of quartz with a permittivity equal to 3.78 and we have used silicon for the circular DR with a permittivity equal to 11.9. The Drude model is used for the modeling of the gold permittivity in the analyzed frequency band of 2.4 to 3 THz. To excite the proposed structures, we have used the Floquet port placed in the z-direction with periodic boundary conditions in the x- and y- directions as illustrated in Figure 2b. Table 1 lists the details of the geometrical parameters of the realized biosensor.
A parametric analysis was performed to obtain the optimized design parameters with high absorption level characteristics after adding different H1N1 virus layers. The H1N1 virus swab is modeled using relative permittivity of 2.2. We have studied the different geometrical parameters to achieve good performance with an absorption level close to 1 and a frequency shift between the maximum absorption of the structure with and without H1N1 virus layers.
3. Parametric Analysis
3.1. Variations of DR radius (r) with fixed DR thickness for different swab layers without virus
The analysis is started by analyzing the absorbance characteristics of the realized biosensor for the fixed thickness of DR (hDR) and varying its radius (r) and concentration of the H1N1 virus swab layer (hvirus). The thickness of the DR is fixed at 4 µm and its radius is varied from 9 µm to 19 µm with a step size of 2 µm. The variations in the absorbance characteristics of the proposed sensor are investigated for both with and without virus cases.
Absorption (A) = 1 – T(transmission) – R(reflection)
Figure 3 depicts the absorbance results of the sensor without the H1N1 virus for 6 different samples of DR radius. The absorbance level of the waveforms is computed using (1).
The resonance (pick-up) frequency and absorbance level of the absorbance waveform for the DR radius of 9 µm are 2.95 THz and 0.84 respectively. The frequency and absorbance level decreases to 2.92 THz and 0.82 with the increase in the DR radius to 11 µm. A similar pattern of decrease in resonance frequency and absorbance level can be noticed for the other radii values of DR in Figure 3. The lowest value of absorbance (0.13) is noted for the largest radius (19 µm) of DR. The increase in the radius of the DR covers more area on the top surface of the quartz dielectric which results in the reduction of its absorbance level of the biosensor and shifting of its resonance frequency to a lower range. Table 2 summarizes the obtained resonance frequencies and absorbance levels for each waveform in Figure 3.
3.2. Variations of DR radius (r) with fixed DR thickness for different swab layers with the virus
Different layers of the H1N1 virus are placed on the quartz substrate around the DR. The DR thickness is kept the same i.e., 4 µm as in Section 3.1. Its radii are varied from 9 µm to 19 µm and its impact is analyzed on the absorbance of the biosensor with the different swab layers of the H1N1 virus.
Figure 4 depicts the variations in the absorbance attributes of the sensor when DR is changed from 9 µm to 19 µm with a fixed swab layer of 1 µm. The resonance frequency of the waveform with a DR radius of 9 µm is 2.91 THz while the corresponding absorbance level is 0.98. We note that the absorbance level of the detection waveforms has been increased by 0.14 (0.98 from 0.84 for the radius of 9 µm) with the insertion of the virus swab layer on the substrate as compared to the same case without virus results of Figure 3. The increase in the absorbance level is due to the presence of microorganisms of the virus. Also, the resonance frequency for this case has been shifted to the lower level of 2.91 THz as compared to the 2.95 THz frequency of the waveform with a DR radius of 9 µm in Figure 3.
Overall comparison of Figure 4 results with Figure 3 reveals that the presence of the virus increases the absorbance level while reducing the resonance frequency for all cases of different DR radii.
The absorption variations are also investigated by increasing the virus swab layer thickness (hvirus) to 2 µm, 4 µm, 6 µm, 8 µm, and 10 µm respectively. The characteristic waveforms for the cases of hvirus = 2 µm, hvirus = 4 µm, and hvirus = 10 µm are shown in Figure 5, Figure 6, and Figure 7 respectively. The results for the other cases of hvirus (6 µm and 8 µm) are not reported here for brevity. Table 3 lists the absorption levels and corresponding resonance frequencies of each waveform for all analyzed different thicknesses of the virus swab. As the thickness of the DR is fixed here i.e., 4 µm, the virus swab layer completely covers the DR and quartz substrate when its thickness is increased beyond 4 µm. For a fixed DR radius (r) of 9 µm, we can note from Table 3 and Figure 4, Figure 5, Figure 6 and Figure 7 that as the thickness of the virus swab layer enhances, the pick of frequency levels continuously shifts to lower levels. We note from Figure 7 that no absorbance waveform is obtained with a DR radius of 9 µm when the thickness of the virus level is increased to its maximum analyzed level of 10 µm. The absorption waveforms for hvirus = 10 µm appear as we move toward the higher DR radii. The change in the DR radius to 11 µm decreases both pick-up frequencies and absorbance levels. We note that the pick-up frequency decreases to 2.88 THz, 2.83 THz, and 2.75 THz for the virus swab layers of 1 µm, 2 µm, and 4 µm respectively as compared to the same case values with DR radius of 9 µm. Also, the absorbance level reduces to the values of 0.83, 0.844, and 0.90 for these frequencies while the level of 0.98, 0.87, and 0.91 was observed for the same frequencies when the DR radius was 9 µm. Contrary to the biosensor detection results with r = 9 µm, DR with a radius of 11 µm can detect the virus swab layer of 10 µm with detection frequency and absorbance levels of 2.55 THz and 0.89 respectively. This shows that we notice that the absorbance level for this case (r = 11 µm) is comparatively lower than the noted levels of the biosensor with a radius of 9 µm. However, still, the sensor is detecting the different virus swab layers with more than 83% absorbance levels which shows good performance of the realized sensor.
The further increase of the proposed biosensor DR radius to 13 µm brings the reduction in both pick-up resonance frequencies and absorbance levels. We observe the pick-up frequencies of 2.84 THz (hVirus = 1 µm), 2.80 THz (hVirus = 2 µm), 2.73 THz (hVirus = 4 µm), 2.65 THz (hVirus = 6 µm), 2.59 THz (hVirus = 8 µm), and 2.53 THz (hVirus = 10 µm) respectively. These observed frequencies have significant variations from the observed frequencies with virus layers which show the good sensitivity of the realized sensor with different swab layers. The minimum and maximum absorbance levels for this case are 52% and 79% respectively for the virus swab layers of 1 µm and 10 µm. These absorbance levels are in a very good range for the essay and rapid detection of various virus layers.
For a fixed layer of a virus, e.g., 1 µm, the increase in the DR radius also reduces the resonance frequency and absorbance levels. We can notice in Table 3 that the resonance frequency decreases to the levels of 2.88 THz, 2.84 THz, 2.79 THz, 2.74 THz, and 2.69 THz from 2.91 THz with the increase in the radius of DR for the virus thickness of 1 µm. The same pattern is observed for the reduction in the absorption properties where the absorption values reduce to 0.83 (r = 11 µm), 0.52 (r = 13 µm), 0.37 (r = 15 µm), and 0.14 (r = 19 µm) when compared with the value of 0.98 (r = 9 µm) for the same 1 µm thickness of virus swab. Similar observations can be made for other thicknesses of the virus in Table 3.
The increase of the DR radius to 15 µm, 17 µm, and 19 µm reduces the absorbance levels. The minimum and absorbance levels for 15 µm cases are 37 % (hVirus = 1 µm) and 61% (hVirus = 10 µm). These level changes to 21 % (hVirus = 1 µm) and 45 % (hVirus = 10 µm) for the DR radius of 17 µm. The lowest absorbance level is noted for the case of 19 µm DR radius case which is 14 % and 32 % for the virus layers of 1 µm and 10 µm respectively. This shows that although the absorbance level reduces to 32 % for the maximum DR radius of 19 µm, it is in an acceptable range for the rapid detection of the virus layer of 10 µm. The detection sensitivity of the realized sensor could be lower for the thinner virus swab layers with the increase in the DR radii. The DR covers more area on the substrate layer with the increase in its radius for the fixed virus thickness and thus results in lowering of the pick of frequency of absorption waveform.
The change in the resonance frequency (∆f) and absorbance level (∆A) with and without the presence of a virus swab is computed using (2) and (3) respectively.
Table 4 presents the ∆f and ∆A values for the analyzed cases of Table 1 and Table 2. The change in resonance frequencies and absorbance levels with a swab layer of 1 µm are 0.04 THz/0.14 (r = 9 µm), 0.04 THz/0.01 (r = 11 µm), 0.04 THz/0.02 (r = 13 µm), 0.04 THz/0.08 (r = 15 µm), and 0.04 THz/0.02 (r = 17 µm) and 0.03 THz/0.01 (r = 19 µm) respectively. The overall change in absorption levels (∆A) and resonance frequencies (∆f) for the biosensor with a DR radius of 11 µm with and without virus swab layers are 0.04/0.01, 0.09/0.024, 0.17/0.08, 0.25/0.06, 0.32/0.09, and 0.37/0.07 respectively (see Table 4). This change in the pick of frequencies and absorbance level could be used for the detection of the different concentrations of the virus with fixed DR radius or the same concertation of the virus with different DR radii.
While comparing the results of Table 2 and Table 3, we notice that the overall better absorbance levels are obtained with a DR radius of 11 µm for all concentrations of the virus swab. The observed absorption values for these cases are 0.83 (hvirus = 1 µm), 0.844 (hvirus = 2 µm), 0.90 (hvirus = 4 µm), 0.88 (hvirus = 6 µm), 0.91 (hvirus = 8 µm), and 0.89 (hvirus = 10 µm) respectively. The higher absorption values provide better sensitivity for the early, rapid, and accurate detection of the virus. These values are higher than all other cases of DR radii except for a couple of values for the 9 µm DR radius case. Although the absorbance levels are comparatively higher for certain concentrations of virus with a lower DR radius of 9 µm, it fails to detect the virus concentration of more than its radius value i.e., 10 µm.
3.3. Impact of varying DR thickness (hDR) with different DR radii and virus swab layers
Section 3.1 and 3.2 have described the impact of the changing DR radii and concentrations of the virus swab on the absorption levels and resonance frequencies with a fixed DR thickness i.e., hDR = 4 µm. This section presents the analysis of the change in hDR on the absorption properties of the realized biosensor.
The numerical analysis is performed by varying the DR thickness to 4.5 µm and 5 µm with all different levels of DR radii (r) and hvirus as done in Section 3.1 and 3.2.
Figure 8 and Figure 9 illustrate the results of biosensors without viruses for the DR thicknesses of 4.5 µm and 5 µm respectively. We note that the absorbance (A) levels are 0.99 (hDR = 4.5 µm) and 0.98 (hDR = 5 µm) for the case of a DR radius of 9 µm. The observed absorption of the same case with a DR thickness of 4 µm was 0.84 without the virus. This reflects that the enhancement of the DR thickness increases the absorption level when no virus is placed on the biosensor. The impact of the placement of the virus swab with different concentration layers (hvirus) of 1 µm, 2 µm, 4 µm, 6 µm, 8 µm, and 10 µm is analyzed for the DR thickness of 4.5 µm and 5 µm respectively.
Figure 10 and Figure 11 show the change in the waveform properties when the quartz substrate is covered with a virus swab layer of 1 µm. Similar results were obtained for the aforementioned concentrations of viruses but are not reported here for brevity. However, the tabular comparison of the variations in absorbance and resonance frequency levels is shown in Tables 5, 6, 7, and 8 respectively. Similar analysis observations can be made for the individual cases of 4.5 µm and 5 µm DR thicknesses as was made for the 4 µm case. The sensing capabilities of the realized sensor with a DR thickness of 4.5 µm vary with the change in the virus swab layers too. The observed resonance frequencies and absorbance levels are 2.90 THz/0.96 (hvirus = 1 µm), 2.85 THz/0.84 (hvirus = 2 µm), 2.74 THz/0.94 (hvirus = 4 µm), 2.68/0.79 (hvirus = 6 µm), and 2.55 THz/0.73 (hvirus = 10 µm) respectively. These values are different than the observed values for the DR thickness of 4 µm for the same radius of 9 µm which depicts the sensitive nature of the realized sensor. As in the earlier case of DR thickness of 4 µm, the increase in the radii of DR decreases the absorbance levels. The maximum absorbance levels for radii of 11 µm, 13 µm, 15 µm, 17 µm, and 19 µm are 91 %, 82 %, 53 %, 36 %, and 26 % respectively which shows the good detection attributes of the proposed sensor even with the larger radii sensor.
The observed resonance frequencies and absorption levels for the DR thickness of 4.5 µm and 5 µm are 2.86 THz/0.73 (r = 11 µm) and 2.85 THz/0.69 (r = 11 µm) which are lower than the observed levels of 2.88 THz/0.83 (r = 11 µm) for the same case of the sensor with DR thickness of 4 µm. The comparison of Table 3, Table 5 and Table 7 shows that the increase of the hDR decreases the resonance frequency and absorption attributes of the sensor for the fixed DR radius and virus swab layer. Also, we note from Table 3, Table 5 and Table 7 that better results in terms of the sensitivity and selectivity of the biosensor are obtained for the DR radius of 11 µm for all three cases of different DR and virus thicknesses.
4. Optimized Biosensor Results
The findings of Section 3 suggest that the optimal results of the realized biosensor are obtained with the DR radius of 11 µm. The comparative analysis of the biosensor performance with the obtained optimal value of DR radius is discussed here.
Figure 12, Figure 13 and Figure 14 illustrate the comparison of obtained results without the virus and with the variations in the different virus thicknesses for the optimal design of the proposed sensor for the three different cases of hDR. For these results, the thickness of the virus swab is varied from 1 µm to 10 µm with a step size of 1 µm. The without virus waveform is shown with dotted red color while the obtained results with different virus concentrations are shown with solid lines of different colors.
We observe from Figure 12, Figure 13 and Figure 14 that the placement of the virus swab concertation varies the detection sensitivity of the optimized biosensor. The continual shift of resonance frequency towards the lower range is evident with the increase in the concentration of the virus. The absorption levels of the sensor are higher than the no-virus case with overall values of more than 0.83, 0.73, and 0.69 for all cases of virus concentration with hDR = 4 µm, hDR = 4.5 µm, and hDR = 5 µm respectively. Table 9 presents the summary of Figure 12, Figure 13 and Figure 14 waveforms. The changes in ∆A and ∆f for the waveforms of Figure 12, Figure 13 and Figure 14 are listed in Table 10.
We observe that the highest sensitivity of the optimized sensor is achieved with the lower value of the DR thickness i.e., hDR = 4 µm. For this case, maximum levels of absorption are recorded which shows the higher sensitivity of the sensor. Also, the change in the pick-of frequencies is significant for all cases of hDR with different layers of viruses as illustrated in Table 10. This shows the sensor can easily detect viruses with different concentrations.
5. Sensitivity Analysis for Change in Virus Type
The variation in the virus type can impact the detection and characterization performance of the realized biosensor. This has been demonstrated by changing the relativity permittivity of the virus swab as this is a key parameter that reflects the variation in the virus under test. A comprehensive analysis is conducted to investigate the impact of DR and virus thickness as well on the reflection properties of the designed biosensor by varying the relative permittivity in the range of 2 µm to 3.4 µm with a step size of 0.1 µm.
Figure 15 reflects the change in the absorption properties of the biosensor when the relative permittivity of the virus swab is varied from 2 µm to 3.4 µm with hDR = 4 µm and hvirus = 9 µm. A very low reflection (A = 0.97) is observed for the pickup frequency of 2.61 THz when the virus swab is investigated with a relative permittivity of 2 µm. The sensor resonating frequency changes to 2.59 THz, 2.57 THz, 2.55 THz, 2.54 THz, 2.52 THz, and 2.49 THz when virus swab layer permittivity is increased to 2.1, 2.2, 2.3, 2.4, 2.5, 2.6, and 2.7 respectively as depicted in Figure 15. It can be observed from the Figure 15 curves that the increase of relative permittivity of the virus layer from 2 to 3.4 brings a continual decrease in the resonating frequency of realized biosensor with relatively lesser variations in its absorption characteristics. The lowest level of absorption (0.7) is recorded for the dielectric constant of 3.4 of the virus.
A similar trend for the change in resonating absorption frequency of the biosensor with the increase in the DR and swab layers thickness is noted as shown in Figure 16 and Figure 17. Table 11 lists all the pickup frequencies and their corresponding absorption levels of Figure 15, Figure 16 and Figure 17 curves. It is noted from Figure 16 and Table 11 that the increase of DR thickness and decrease of the virus swab layer for the same range of the virus dielectric constant brings a relative increase in the pickup frequencies. These frequency levels decrease further with the increase in the virus thickness as illustrated in Figure 17 and Table 11.
The dielectric constant of the DR Silicon material is fixed to 11.9 for all the analyzed cases of Figure 15, Figure 16 and Figure 17. The enhancement of the relative permittivity of the surrounding material (virus swab layer in this case) increases the effective refractive index of the biosensor. This attributes to the decrease in the resonance frequency of the DR sensor as illustrated in Figure 15, Figure 16 and Figure 17 waveforms. Another reason for the continual decrease in the resonance frequencies of the designed biosensor with the increase in the dielectric constant of the virus swab is the decrease in the speed of penetrating EM waves. On the other hand, the relatively smaller change in the absorption characteristics can be attributed to the low absorption coefficient of the silicon in the THz range.
Nevertheless, the sensitivity analysis of Figure 15, Figure 16 and Figure 17 and Table 11 reflects that the realized biosensor can easily distinguish between the different types of viruses because of the significant changes in its resonating frequency even with a small change in the virus's electrical or structural properties.
6. Conclusions
The study has detailed a design of the THz biosensor based on a dielectric resonator-(DR) metasurface structure for the rapid detection of viruses. The parametric analysis of the different critical design parameters of the presented sensor was performed for the identification of the optimized parameters with higher sensitivity and selectivity of the investigated sensor. The proposed sensor performs the rapid detection of the virus layer by analyzing its sensor absorption properties (magnitude and frequency shift). The performed parametric analysis of the presented biosensor reveals that metasurface-based DR sensors produce good performance with fast detection of different virus swab layers (with thickness ranging from 1 µm to 10 µm) with a DR radius of 11 µm. The variation in the effective refractive index of the optimized sensor ensures the detection and classification of different concentrations of the same or different viruses due to a change in its resonating pick-up frequency with lower reflection. The realized THz sensor could be used for the fast and accurate detection of different kinds of viruses (H1N1, corona, etc.) by quickly analyzing the variations in its reflective properties.
Author Contributions
Conceptualization, simulations, and writing, H. R, A. Y, and J. Y; methodology H. R, A. Y, and J. Y; Visualization, revision, and correction, A. H, N. S, and B. H; Validation, H. R and A. Y. All authors have read and agreed to the submitted version of the manuscript.
Funding
Deanship of Scientific Research (DSR) - King Abdulaziz University -Kingdom of Saudi Arabia - award number (GCV19-1-1441). Federation of Arab Scientific Research Councils (FASRC)- award for Corona Research Program (2020).
Institutional Review Board Statement
Not applicable.
Informed Consent Statement
Not applicable.
Data Availability Statement
Not applicable.
Acknowledgments
The authors are pleased to acknowledge the financial supports from the Deanship of Scientific Research (DSR), King Abdulaziz University and from the Federation of Arab Scientific Research Councils (FASRC), Khartoum, Republic of Sudan.
Conflicts of Interest
The authors declare no conflict of interest.
References
- Ozili, P.K.; Arun, T. Spillover of COVID-19: impact on the Global Economy. In Managing Inflation and Supply Chain Disruptions in the Global Economy, IGI Global: 2023; pp. 41-61.
- Zhao, L.; Rasoulinezhad, E.; Sarker, T.; Taghizadeh-Hesary, F. Effects of COVID-19 on global financial markets: evidence from qualitative research for developed and developing economies. The European Journal of Development Research 2023, 35, 148–166. [Google Scholar] [CrossRef] [PubMed]
- Keshavarz, A.; Vafapour, Z. Sensing Avian Influenza Viruses Using Terahertz Metamaterial Reflector. IEEE Sensors Journal 2019, 19, 5161–5166. [Google Scholar] [CrossRef]
- Park, S.J.; Cha, S.H.; Shin, G.A.; Ahn, Y.H. Sensing viruses using terahertz nano-gap metamaterials. Biomed. Opt. Express 2017, 8, 3551–3558. [Google Scholar] [CrossRef] [PubMed]
- Traxler, S.; Barkowsky, G.; Saß, R.; Klemenz, A.-C.; Patenge, N.; Kreikemeyer, B.; Schubert, J.K.; Miekisch, W. Volatile scents of influenza A and S. pyogenes (co-)infected cells. Scientific Reports 2019, 9, 18894. [Google Scholar] [CrossRef] [PubMed]
- Dolai, S.; Tabib-Azar, M. Terahertz Detection of Zika Viruses. 2020.
- Gonchar, K.A.; Agafilushkina, S.N.; Moiseev, D.V.; Bozhev, I.V.; Manykin, A.A.; Kropotkina, E.A.; Gambaryan, A.S.; Osminkina, L.A. H1N1 influenza virus interaction with a porous layer of silicon nanowires. Materials Research Express 2020, 7, 035002. [Google Scholar] [CrossRef]
- Lynch, J. PCR Technology: Principles and Applications for DNA Amplification. J Med Genet 1990, 27, 536–536. [Google Scholar] [CrossRef]
- Vinjé, J. Advances in Laboratory Methods for Detection and Typing of Norovirus. Journal of Clinical Microbiology 2015, 53, 373. [Google Scholar] [CrossRef] [PubMed]
- Xu, M.; Li, Y.; Lin, C.; Peng, Y.; Zhao, S.; Yang, X.; Yang, Y. Recent Advances of Representative Optical Biosensors for Rapid and Sensitive Diagnostics of SARS-CoV-2. Biosensors 2022, 12, 862. [Google Scholar] [CrossRef] [PubMed]
- Cheng, D.; He, X.; Huang, X.; Zhang, B.; Liu, G.; Shu, G.; Fang, C.; Wang, J.; Luo, Y. Terahertz biosensing metamaterial absorber for virus detection based on spoof surface plasmon polaritons. International Journal of RF and Microwave Computer-Aided Engineering 2018, 28, e21448. [Google Scholar] [CrossRef]
- Pahlow, S.; Richard-Lacroix, M.; Hornung, F.; Köse-Vogel, N.; Mayerhöfer, T.G.; Hniopek, J.; Ryabchykov, O.; Bocklitz, T.; Weber, K.; Ehricht, R.; et al. Simple, Fast and Convenient Magnetic Bead-Based Sample Preparation for Detecting Viruses via Raman-Spectroscopy. Biosensors 2023, 13, 594. [Google Scholar] [CrossRef] [PubMed]
- Zhou, R.; Wang, C.; Xu, W.; Xie, L. Biological applications of terahertz technology based on nanomaterials and nanostructures. Nanoscale 2019, 11, 3445–3457. [Google Scholar] [CrossRef] [PubMed]
- Ramundo Orlando, A.; Gallerano, G.P. Terahertz Radiation Effects and Biological Applications. Journal of Infrared, Millimeter, and Terahertz Waves 2009, 30, 1308–1318. [Google Scholar] [CrossRef]
- Lee, D.-K.; Kang, J.-H.; Kwon, J.; Lee, J.-S.; Lee, S.; Woo, D.H.; Kim, J.H.; Song, C.-S.; Park, Q.H.; Seo, M. Nano metamaterials for ultrasensitive Terahertz biosensing. Scientific Reports 2017, 7, 8146. [Google Scholar] [CrossRef] [PubMed]
- Yoshida, H.; Ogawa, Y.; Kawai, Y.; Hayashi, S.; Hayashi, A.; Otani, C.; Kato, E.; Miyamaru, F.; Kawase, K. Terahertz sensing method for protein detection using a thin metallic mesh. Applied Physics Letters 2007, 91, 253901. [Google Scholar] [CrossRef]
- Ahmadivand, A.; Gerislioglu, B.; Tomitaka, A.; Manickam, P.; Kaushik, A.; Bhansali, S.; Nair, M.; Pala, N. Extreme sensitive metasensor for targeted biomarkers identification using colloidal nanoparticles-integrated plasmonic unit cells. Biomed. Opt. Express 2018, 9, 373–386. [Google Scholar] [CrossRef]
- Hong, J.T.; Jun, S.W.; Cha, S.H.; Park, J.Y.; Lee, S.; Shin, G.A.; Ahn, Y.H. Enhanced sensitivity in THz plasmonic sensors with silver nanowires. Scientific Reports 2018, 8, 15536. [Google Scholar] [CrossRef]
Figure 1.
Proposed DRA-based biosensor structure and detection methodology.
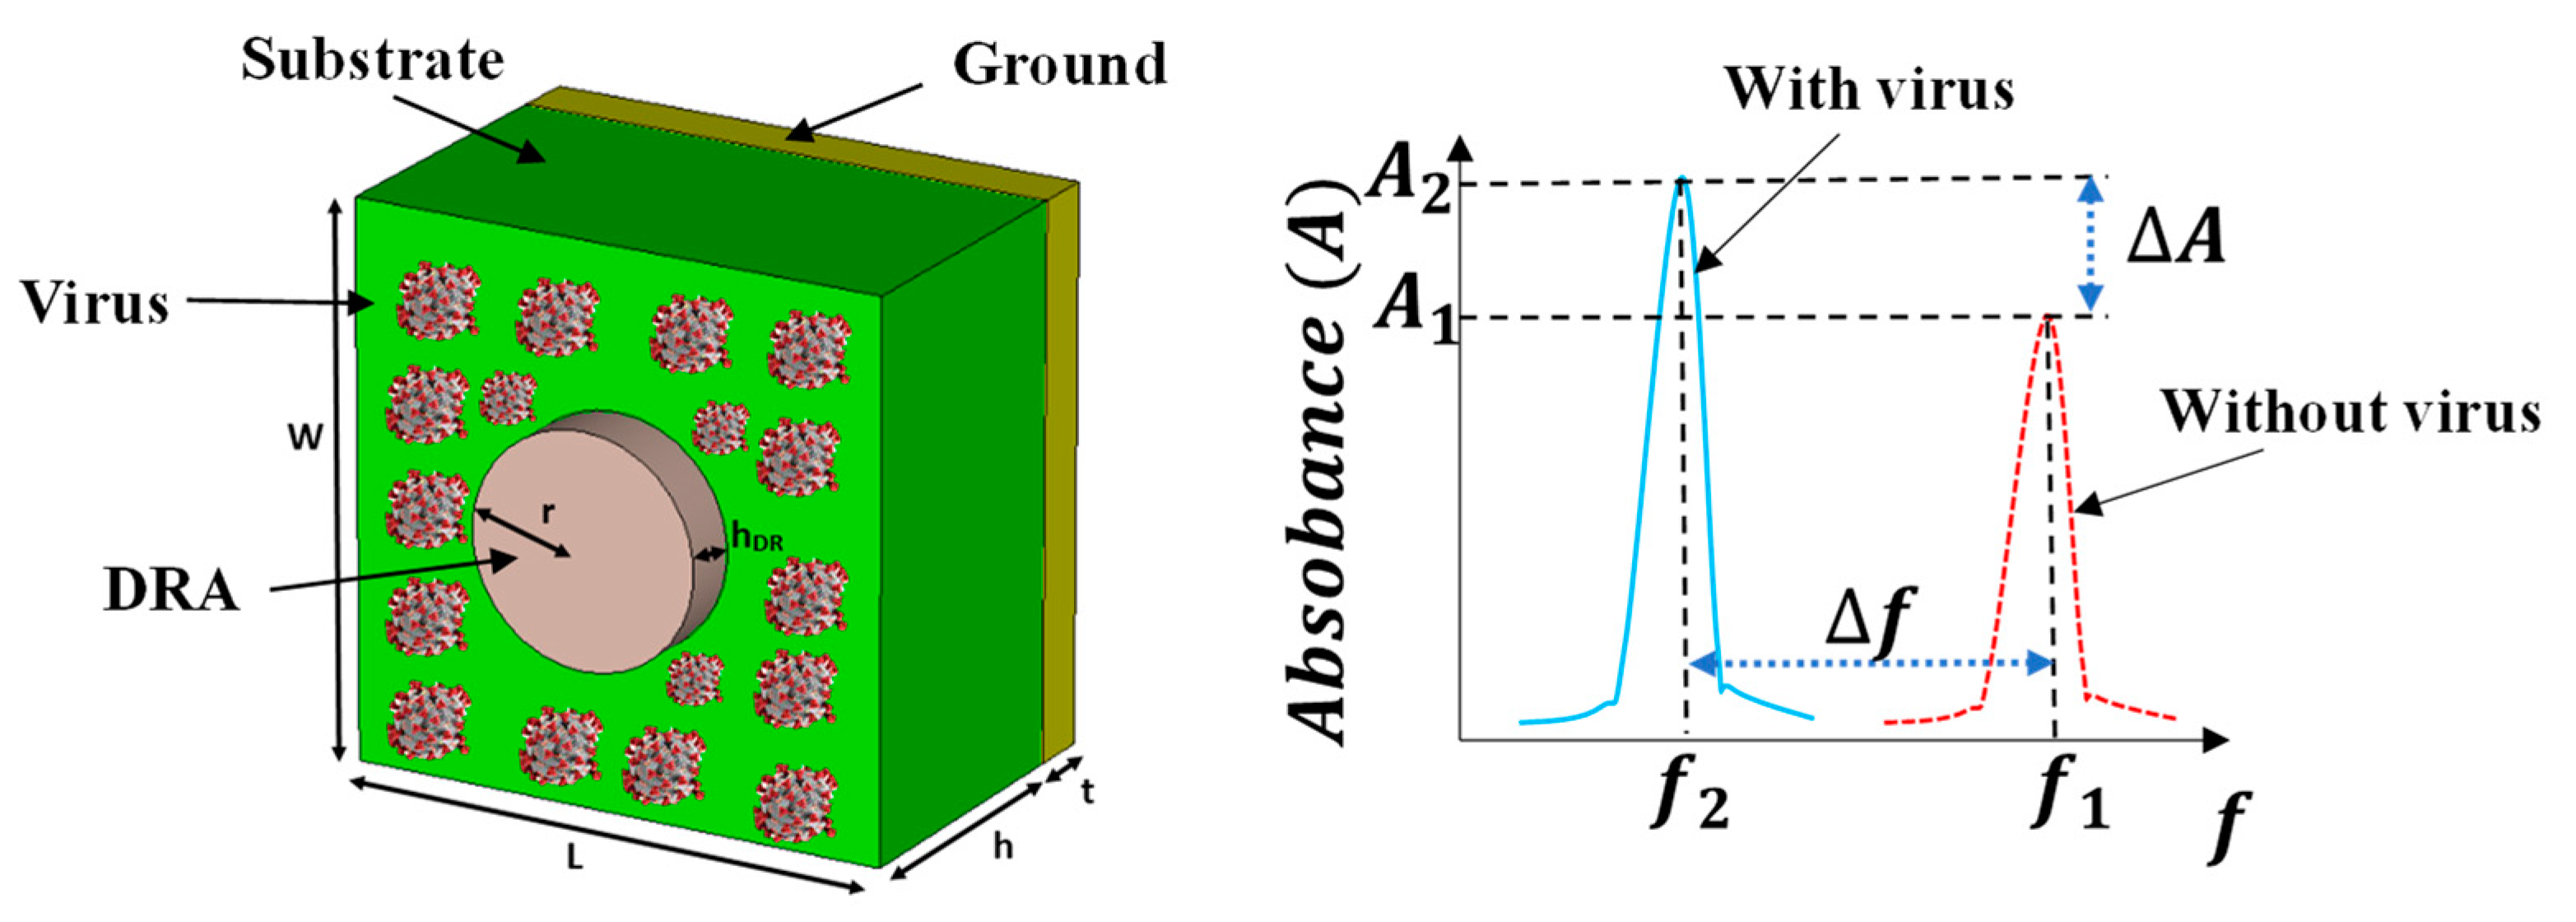
Figure 2.
Proposed DRA-based biosensor structure (a) with virus swab (b) with source excitation.
Figure 3.
Absorption characteristics of the biosensor with virus (H1NI) thickness of 1 µm.
Figure 4.
Absorption characteristics of biosensor without virus (H1NI).
Figure 5.
Absorption characteristics of the biosensor with the virus (H1NI) thickness of 2 µm.
Figure 6.
Absorption characteristics of the biosensor with virus (H1NI) thickness of 4 µm.
Figure 7.
Absorption characteristics of the biosensor with the virus (H1NI) thickness of 10 µm.
Figure 8.
Absorption characteristics of biosensor without virus (H1NI) with hDR = 4.5 µm.
Figure 9.
Absorption characteristics of biosensor without virus (H1NI) with hDR = 5 µm.
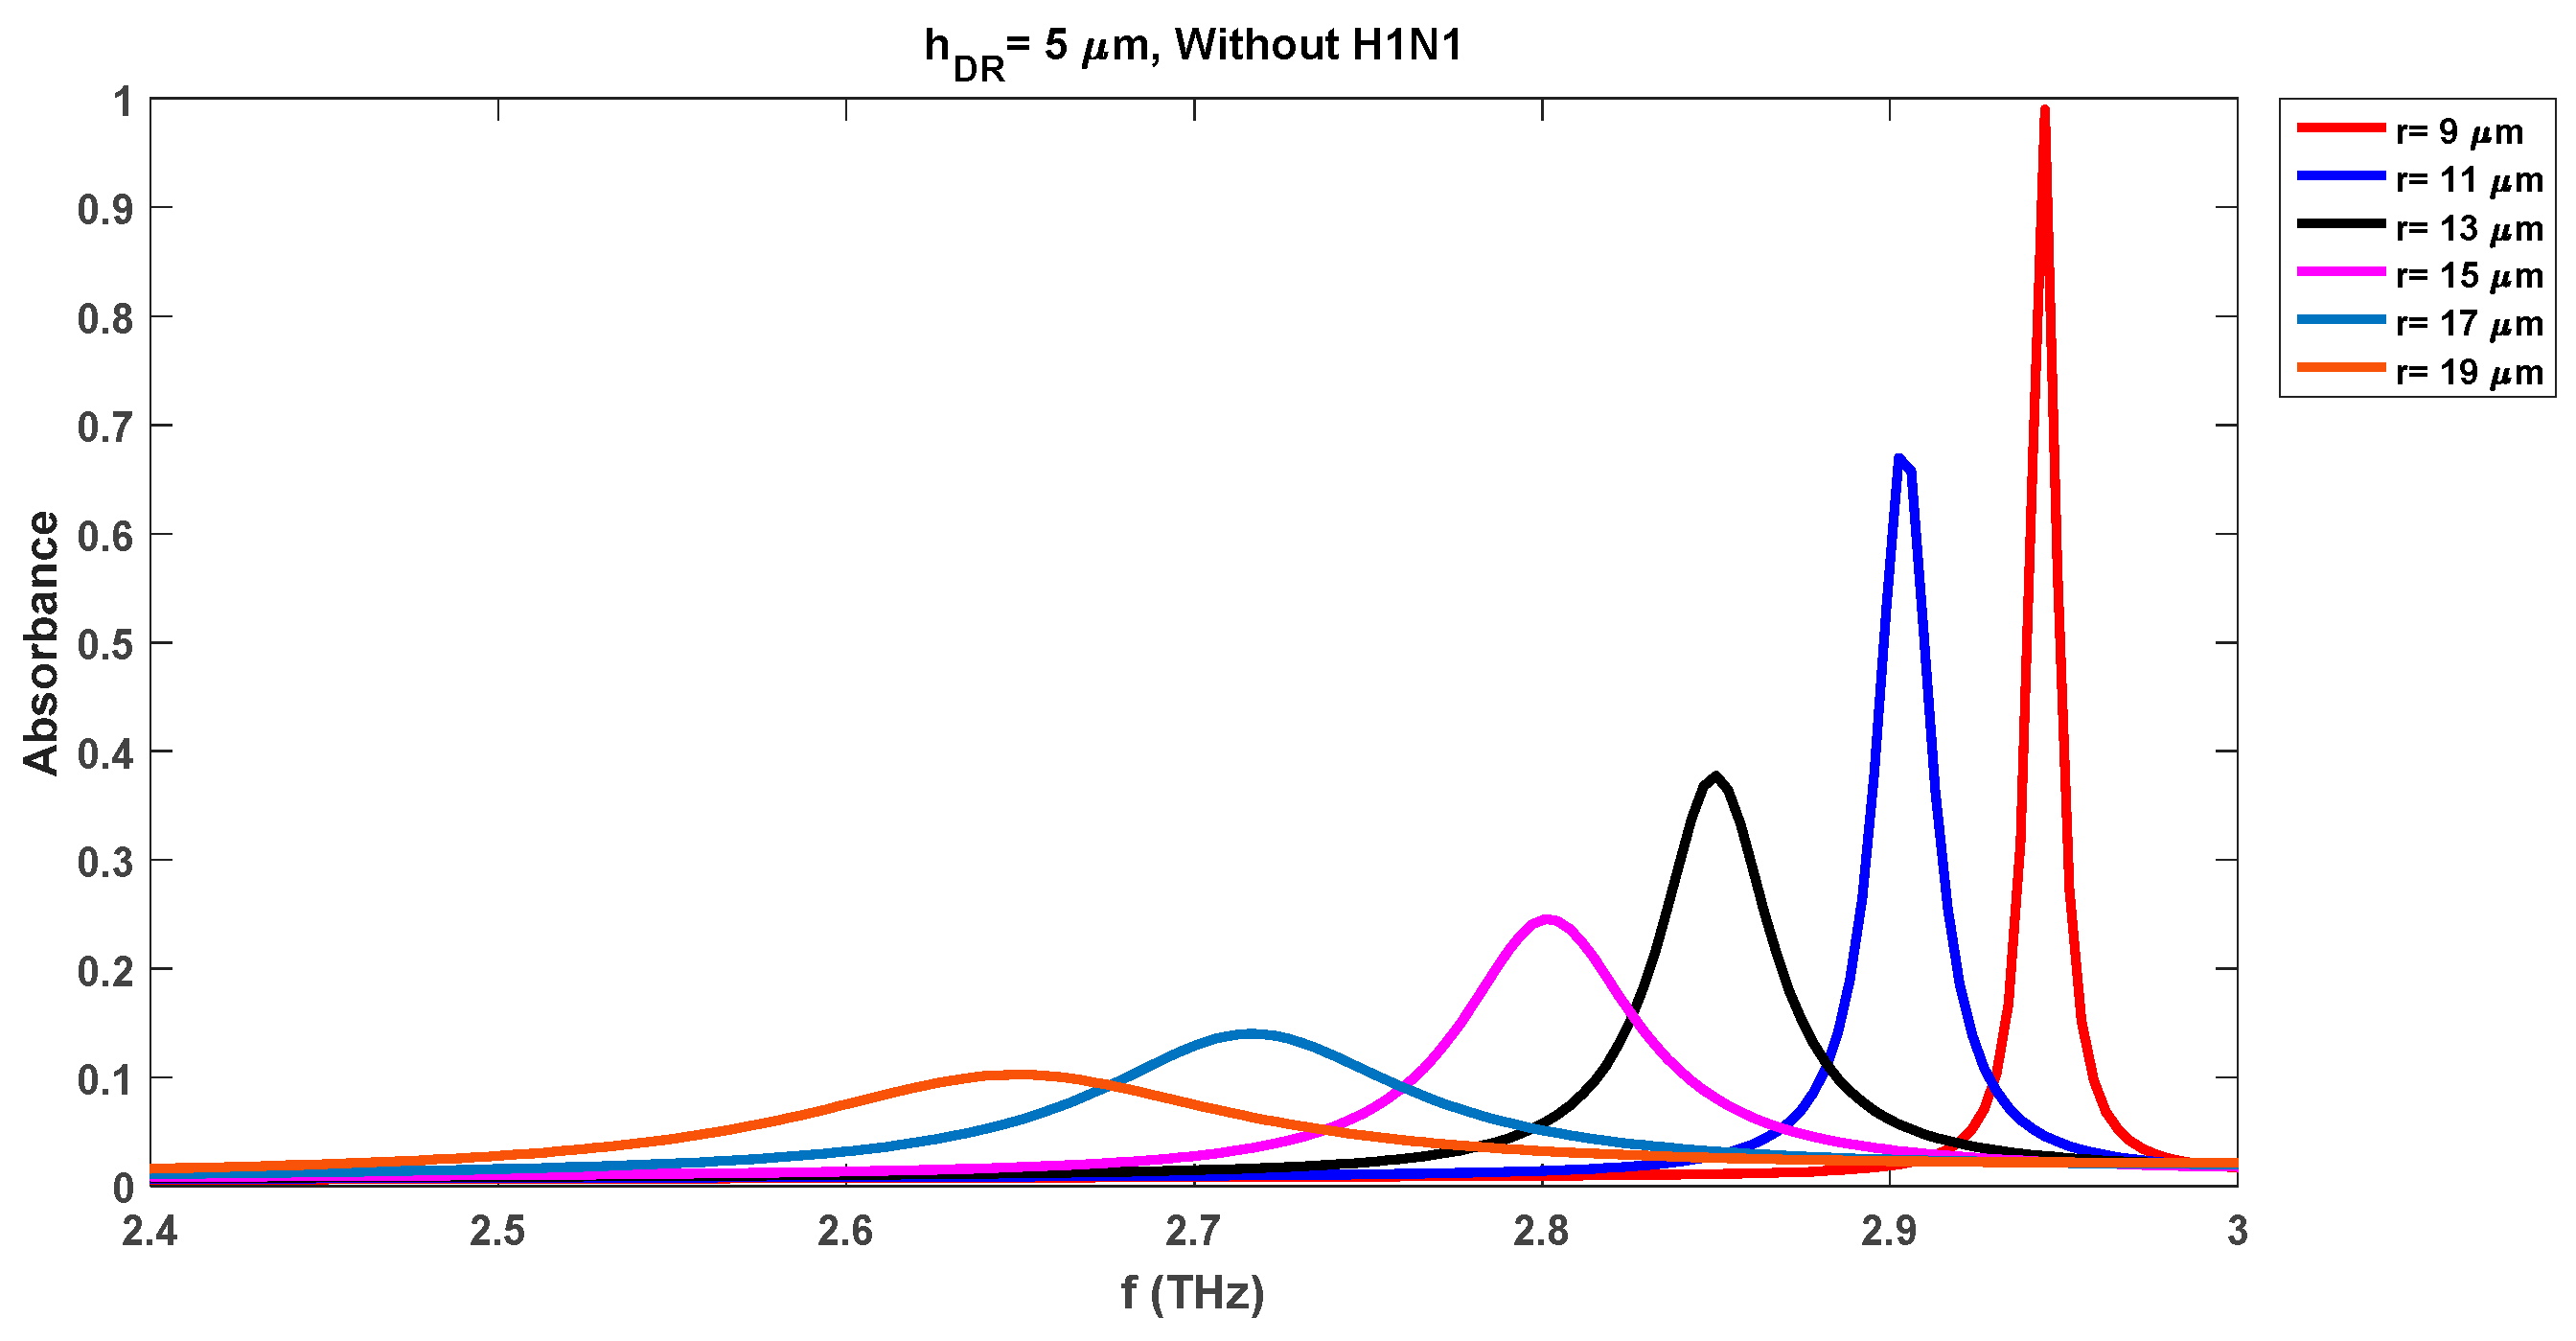
Figure 10.
Absorption characteristics of the biosensor with the virus (H1NI) layer of 1µm with hDR = 4.5 µm.
Figure 10.
Absorption characteristics of the biosensor with the virus (H1NI) layer of 1µm with hDR = 4.5 µm.
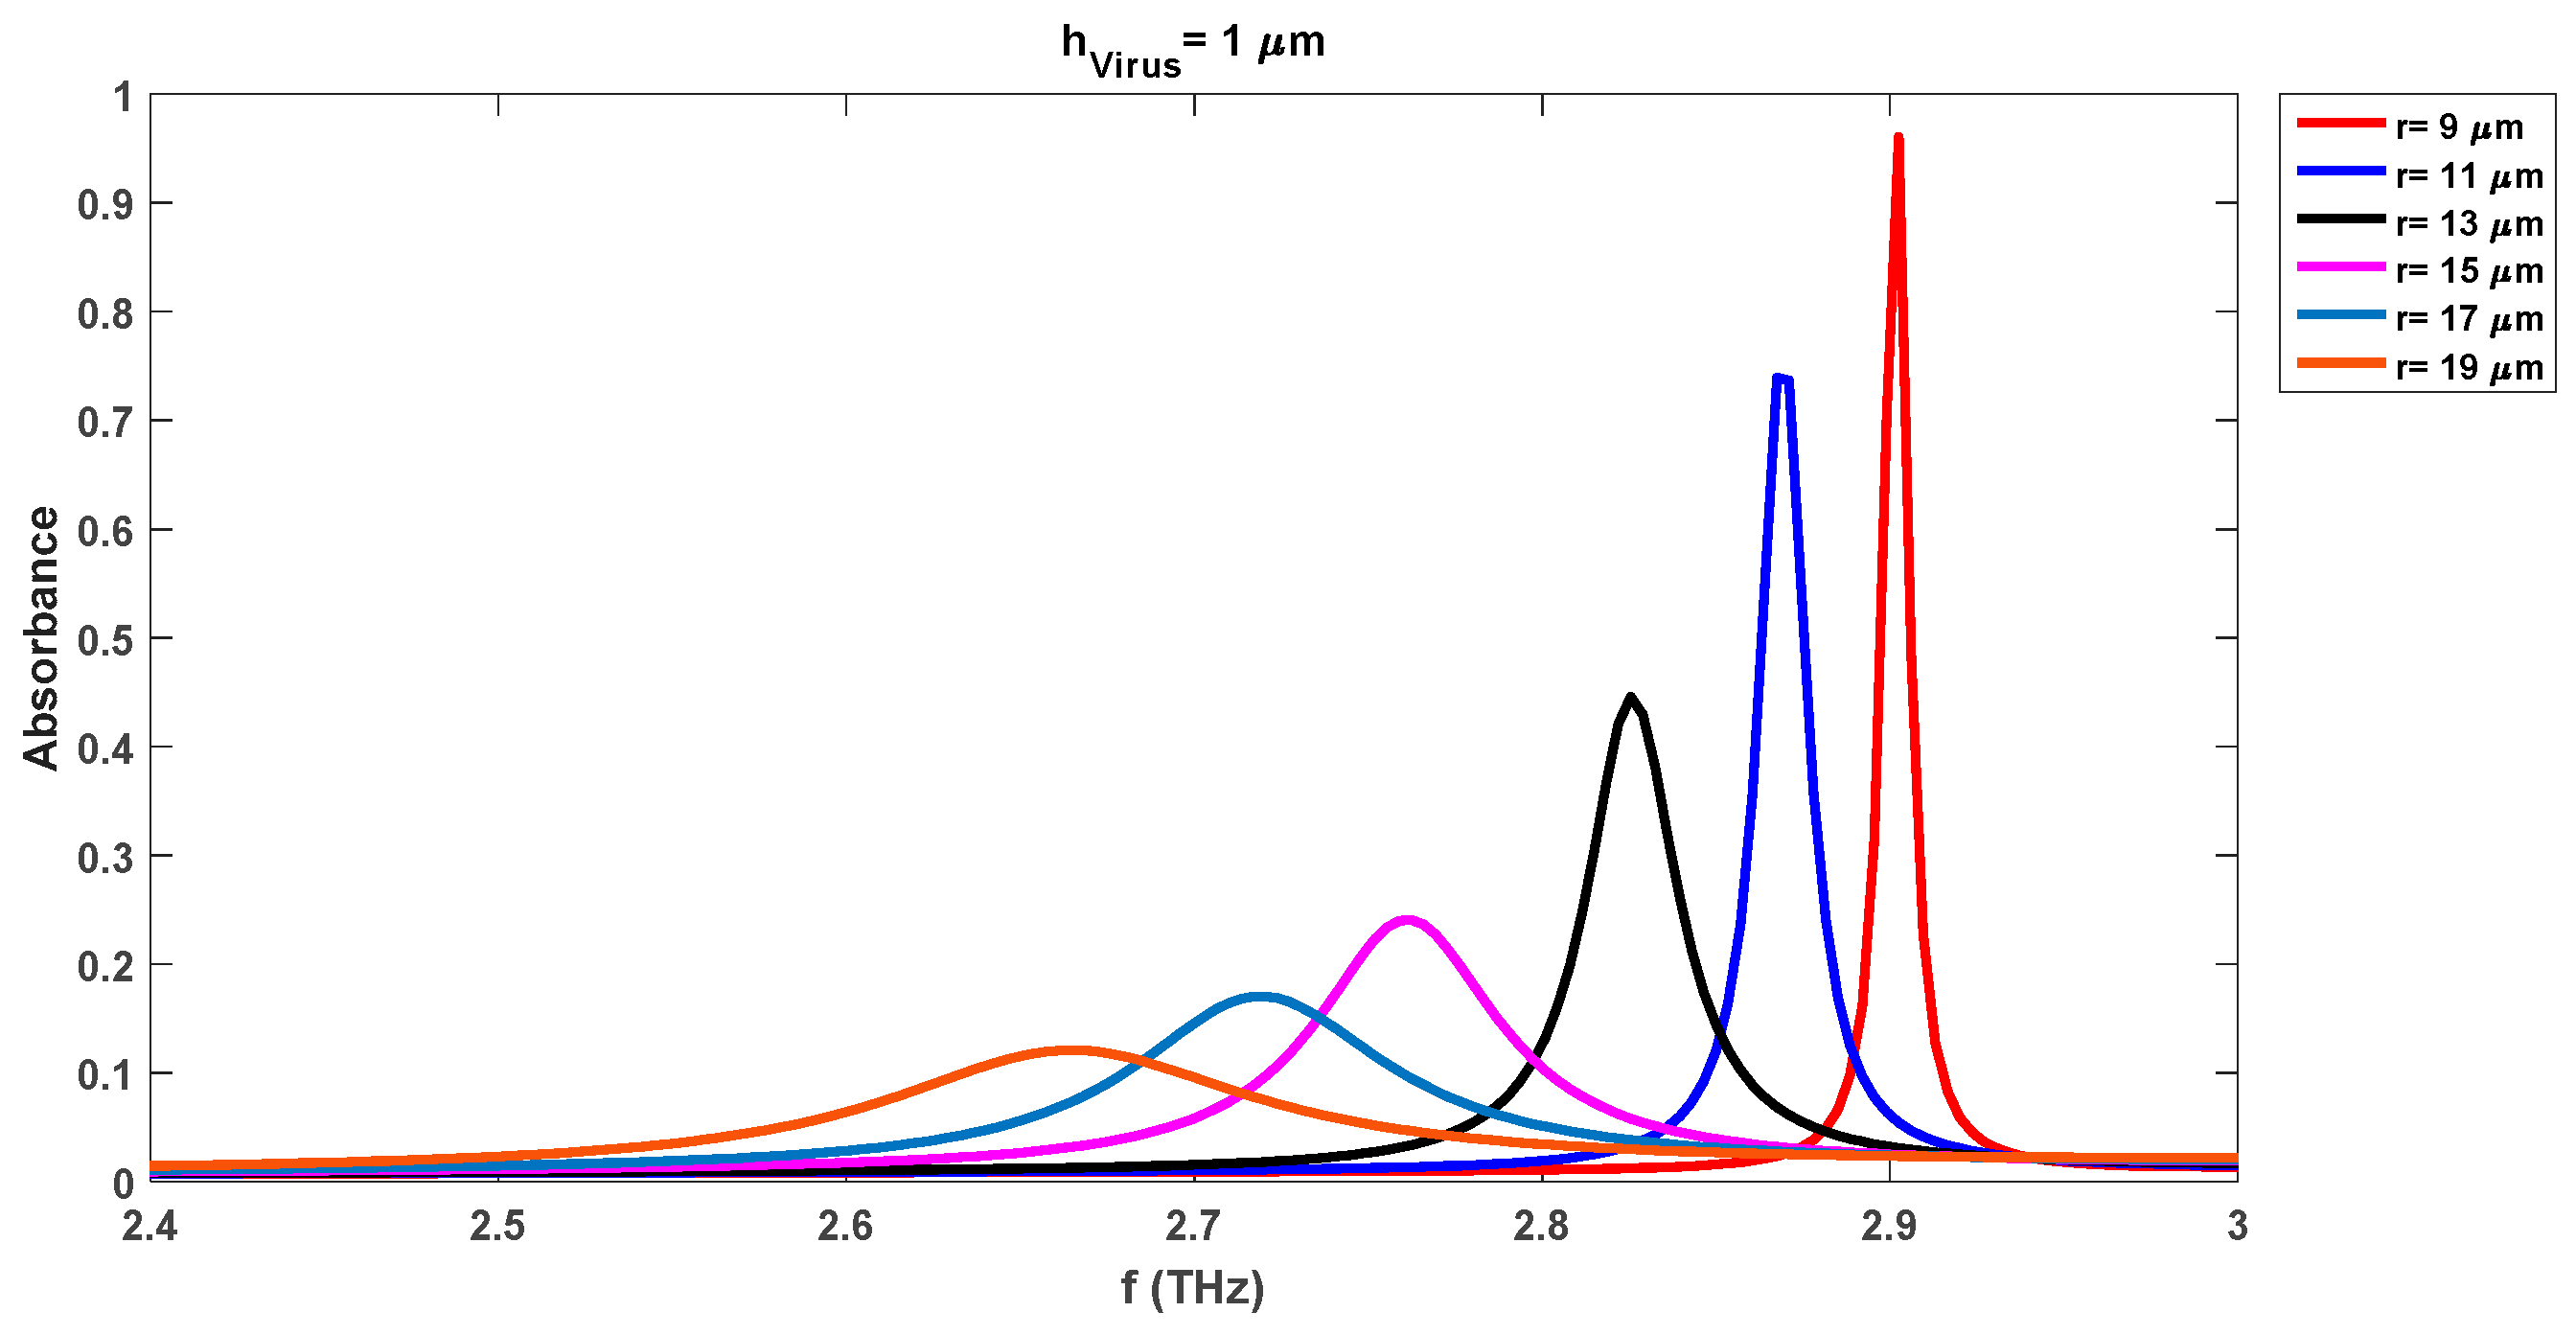
Figure 11.
Absorption characteristics of biosensor with virus (H1NI) layer of 1µm with hDR = 5 µm.
Figure 12.
Absorption characteristics of biosensor without and with different virus (H1NI) layers for hDR = 4 µm.
Figure 12.
Absorption characteristics of biosensor without and with different virus (H1NI) layers for hDR = 4 µm.
Figure 13.
Absorption characteristics of biosensor without and with different virus (H1NI) layers for hDR = 4.5 µm.
Figure 13.
Absorption characteristics of biosensor without and with different virus (H1NI) layers for hDR = 4.5 µm.
Figure 14.
Absorption characteristics of biosensor without and with different virus (H1NI) layers for hDR = 5 µm.
Figure 14.
Absorption characteristics of biosensor without and with different virus (H1NI) layers for hDR = 5 µm.
Figure 15.
Impact of change in virus type on the absorption characteristics of the biosensor with DR thickness of 4 µm and virus swab layer of 9 µm.
Figure 15.
Impact of change in virus type on the absorption characteristics of the biosensor with DR thickness of 4 µm and virus swab layer of 9 µm.
Figure 16.
Impact of change in virus type on the absorption characteristics of the biosensor with DR thickness of 4.5 µm and virus swab layer of 8 µm.
Figure 16.
Impact of change in virus type on the absorption characteristics of the biosensor with DR thickness of 4.5 µm and virus swab layer of 8 µm.
Figure 17.
Impact of change in virus type on the absorption characteristics of the biosensor with DR thickness of 5 µm and virus swab layer of 10 µm.
Figure 17.
Impact of change in virus type on the absorption characteristics of the biosensor with DR thickness of 5 µm and virus swab layer of 10 µm.
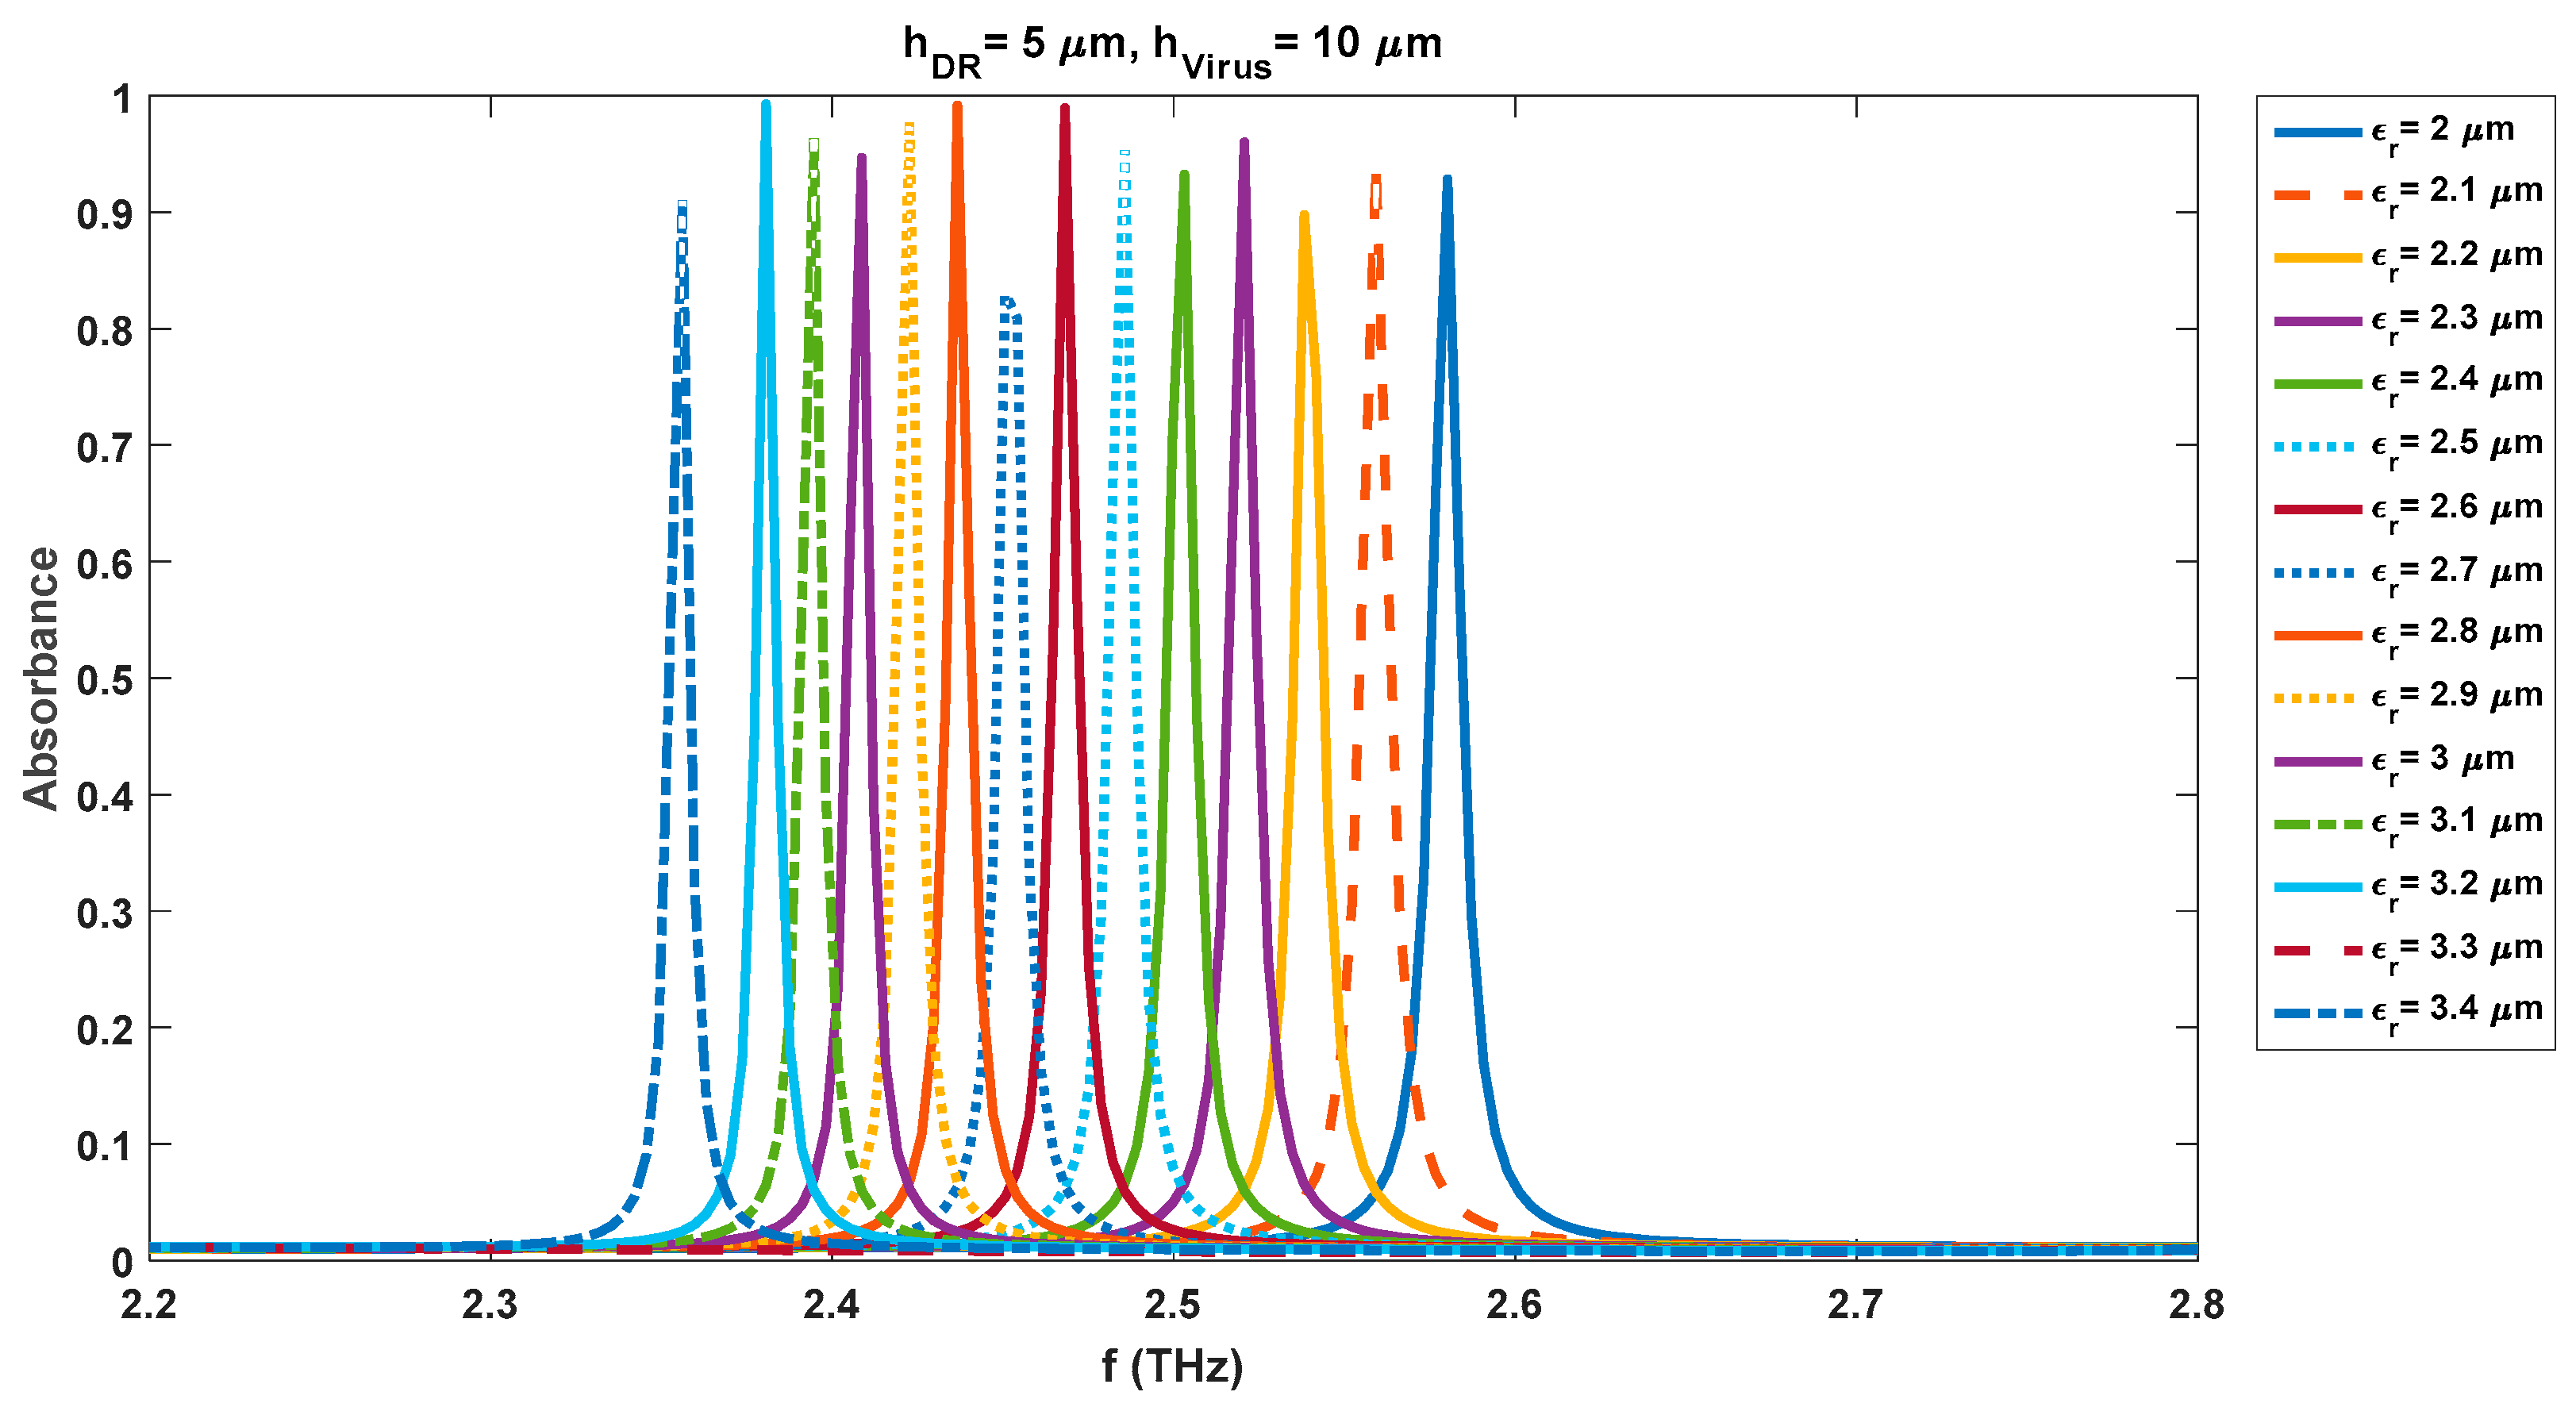

Table 1.
Geometrical details of the proposed biosensor.
| Parameter | Values (µm) |
|---|---|
| L (substrate length) | 90 |
| W (substrate width) | 90 |
| h (substrate thickness) | 10 |
| hDR (thickness of the Dielectric Resonator DR) | Parametric study |
| hVirus (thickness of the virus layer) | Parametric study |
| t (ground gold thickness) | 1 |
| r (radius of the Dielectric Resonator DR) | Parametric study |
Table 2.
Comparison of resonance frequencies (in THz) and absorbance (A) levels of biosensor for different radii of DR without virus for fixed DR thickness of 4 μm.
Table 2.
Comparison of resonance frequencies (in THz) and absorbance (A) levels of biosensor for different radii of DR without virus for fixed DR thickness of 4 μm.
| hDR = 4 μm | ||||||||||||
| Without Virus |
r = 9 μm | r = 11 μm | r = 13 μm | r = 15 μm | r = 17 μm | r = 19 μm | ||||||
| f | A | f | A | f | A | f | A | f | A | f | A | |
| 2.95 | 0.84 | 2.92 | 0.82 | 2.88 | 0.50 | 2.83 | 0.29 | 2.78 | 0.19 | 2.72 | 0.13 | |
Table 3.
Comparison of resonance frequencies (in THz) and absorbance (A) levels of biosensor for different radii of DR and different layers of H1N1 virus swab for fixed DR thickness of 4 μm.
Table 3.
Comparison of resonance frequencies (in THz) and absorbance (A) levels of biosensor for different radii of DR and different layers of H1N1 virus swab for fixed DR thickness of 4 μm.
| hDR=4 μm | ||||||||||||
| With Virus | r = 9 μm | r = 11 μm | r = 13 μm | r = 15 μm | r = 17 μm | r =19 μm | ||||||
| hVirus | f | A | f | A | f | A | f | A | f | A | f | A |
| 1 μm | 2.91 | 0.98 | 2.88 | 0.83 | 2.84 | 0.52 | 2.79 | 0.37 | 2.74 | 0.21 | 2.69 | 0.14 |
| 2 μm | 2.86 | 0.87 | 2.83 | 0.844 | 2.80 | 0.54 | 2.76 | 0.34 | 2.72 | 0.22 | 2.67 | 0.15 |
| 4 μm | 2.78 | 0.91 | 2.75 | 0.90 | 2.73 | 0.62 | 2.70 | 0.39 | 2.66 | 0.25 | 2.63 | 0.18 |
| 6 μm | 2.69 | 0.77 | 2.67 | 0.88 | 2.65 | 0.67 | 2.62 | 0.46 | 2.60 | 0.31 | 2.56 | 0.19 |
| 8 μm | 2.62 | 0.68 | 2.60 | 0.91 | 2.59 | 0.77 | 2.57 | 0.54 | 2.54 | 0.37 | 2.52 | 0.26 |
| 10 μm | No pic | No pic | 2.55 | 0.89 | 2.53 | 0.79 | 2.51 | 0.61 | 2.49 | 0.45 | 2.47 | 0.32 |
Table 4.
Analysis of change in absorption levels (∆A) and resonance frequencies (∆f) (in THz) for different radii of DR and different layers of H1N1 virus swab for fixed DR thickness of 4 μm.
Table 4.
Analysis of change in absorption levels (∆A) and resonance frequencies (∆f) (in THz) for different radii of DR and different layers of H1N1 virus swab for fixed DR thickness of 4 μm.
| hDR=4 μm | ||||||||||||
| With Virus | r = 9 μm | r = 11 μm | r = 13 μm | r = 15 μm | r = 17 μm | r =19 μm | ||||||
| hVirus | ∆f | ∆A | ∆f | ∆A | ∆f | ∆A | ∆f | ∆A | ∆f | ∆A | ∆f | ∆A |
| 1 μm | 0.04 | 0.14 | 0.04 | 0.01 | 0.04 | 0.02 | 0.04 | 0.08 | 0.04 | 0.02 | 0.03 | 0.01 |
| 2 μm | 0.09 | 0.03 | 0.09 | 0.024 | 0.08 | 0.04 | 0.07 | 0.05 | 0.06 | 0.03 | 0.05 | 0.02 |
| 4 μm | 0.17 | 0.07 | 0.17 | 0.08 | 0.15 | 0.12 | 0.13 | 0.1 | 0.12 | 0.06 | 0.09 | 0.05 |
| 6 μm | 0.26 | -0.07 | 0.25 | 0.06 | 0.23 | 0.17 | 0.21 | 0.17 | 0.18 | 0.12 | 0.16 | 0.06 |
| 8 μm | 0.33 | -0.16 | 0.32 | 0.09 | 0.29 | 0.27 | 0.26 | 0.25 | 0.24 | 0.18 | 0.2 | 0.13 |
| 10 μm | No pic | No pic | 0.37 | 0.07 | 0.35 | 0.29 | 0.32 | 0.32 | 0.29 | 0.26 | 0.25 | 0.19 |
Table 5.
Comparison of resonance frequencies (in THz) and absorbance (A) levels of biosensor for different radii of DR and different layers of H1N1 virus swab for DR thickness of 4.5 μm.
Table 5.
Comparison of resonance frequencies (in THz) and absorbance (A) levels of biosensor for different radii of DR and different layers of H1N1 virus swab for DR thickness of 4.5 μm.
| hDR=4.5 μm | ||||||||||||
| With Virus | r = 9 μm | r = 11 μm | r = 13 μm | r = 15 μm | r = 17 μm | r =19 μm | ||||||
| hVirus | f | A | f | A | f | A | f | A | f | A | f | A |
| 1 μm | 2.90 | 0.96 | 2.86 | 0.73 | 2.82 | 0.44 | 2.76 | 0.24 | 2.72 | 0.17 | 2.66 | 0.12 |
| 2 μm | 2.85 | 0.84 | 2.82 | 0.78 | 2.78 | 0.46 | 2.74 | 0.28 | 2.69 | 0.18 | 2.64 | 0.12 |
| 4 μm | 2.74 | 0.94 | 2.73 | 0.83 | 2.69 | 0.53 | 2.66 | 0.33 | 2.63 | 0.22 | 2.59 | 0.15 |
| 6 μm | 2.68 | 0.79 | 2.67 | 0.89 | 2.64 | 0.60 | 2.61 | 0.38 | 2.58 | 0.30 | 2.55 | 0.17 |
| 8 μm | No pic | No pic | 2.60 | 0.91 | 2.58 | 0.67 | 2.55 | 0.45 | 2.52 | 0.25 | 2.50 | 0.25 |
| 10 μm | 2.55 | 0.73 | 2.54 | 0.83 | 2.52 | 0.82 | 2.50 | 0.53 | 2.48 | 0.36 | 2.46 | 0.26 |
Table 6.
Analysis of change in absorption levels (∆A) and resonance frequencies (∆f) (in THz) for different radii of DR and different layers of H1N1 virus swab for fixed DR thickness of 4.5 μm.
Table 6.
Analysis of change in absorption levels (∆A) and resonance frequencies (∆f) (in THz) for different radii of DR and different layers of H1N1 virus swab for fixed DR thickness of 4.5 μm.
| hDR=4.5 μm | ||||||||||||
| With Virus | r = 9 μm | r = 11 μm | r = 13 μm | r = 15 μm | r = 17 μm | r =19 μm | ||||||
| hVirus | ∆f | ∆A | ∆f | ∆A | ∆f | ∆A | ∆f | ∆A | ∆f | ∆A | ∆f | ∆A |
| 1 μm | 0.05 | -0.03 | 0.05 | 0 | 0.04 | 0.01 | 0.04 | -0.01 | 0.02 | 0.01 | 0.02 | 0.01 |
| 2 μm | 0.1 | -0.15 | 0.09 | 0.05 | 0.08 | 0.03 | 0.06 | 0.03 | 0.05 | 0.02 | 0.04 | 0.01 |
| 4 μm | 0.21 | -0.05 | 0.18 | 0.1 | 0.17 | 0.1 | 0.14 | 0.08 | 0.11 | 0.06 | 0.09 | 0.04 |
| 6 μm | 0.27 | -0.2 | 0.24 | 0.16 | 0.22 | 0.17 | 0.19 | 0.13 | 0.16 | 0.14 | 0.13 | 0.06 |
| 8 μm | No pic | No pic | 0.31 | 0.18 | 0.28 | 0.24 | 0.25 | 0.2 | 0.22 | 0.09 | 0.18 | 0.14 |
| 10 μm | 0.4 | -0.26 | 0.37 | 0.1 | 0.34 | 0.39 | 0.3 | 0.28 | 0.26 | 0.2 | 0.22 | 0.15 |
Table 7.
Comparison of resonance frequencies (in THz) and absorbance (A) levels of biosensor for different radii of DR and different layers of H1N1 virus swab for DR thickness of 5 μm.
Table 7.
Comparison of resonance frequencies (in THz) and absorbance (A) levels of biosensor for different radii of DR and different layers of H1N1 virus swab for DR thickness of 5 μm.
| hDR=5 μm | ||||||||||||
| With Virus | r = 9 μm | r = 11 μm | r = 13 μm | r = 15 μm | r = 17 μm | r =19 μm | ||||||
| hVirus | f | A | f | A | f | A | f | A | f | A | f | A |
| 1 μm | 2.89 | 0.93 | 2.85 | 0.69 | 2.80 | 0.38 | 2.75 | 0.23 | 2.70 | 0.16 | 2.62 | 0.10 |
| 2 μm | 2.80 | 0.99 | 2.77 | 0.70 | 2.73 | 0.42 | 2.68 | 0.25 | 2.65 | 0.17 | 2.59 | 0.11 |
| 4 μm | 2.72 | 0.99 | 2.70 | 0.79 | 2.67 | 0.48 | 2.63 | 0.29 | 2.60 | 0.21 | 2.55 | 0.19 |
| 6 μm | 2.68 | 0.81 | 2.66 | 0.82 | 2.63 | 0.52 | 2.60 | 0.32 | 2.57 | 0.27 | No pic | No pic |
| 8 μm | 2.61 | 0.96 | 2.59 | 0.89 | 2.57 | 0.61 | 2.54 | 0.38 | 2.51 | 0.28 | 2.48 | 0.20 |
| 10 μm | 2.55 | 0.75 | 2.53 | 0.89 | 2.52 | 0.69 | 2.49 | 0.45 | 2.47 | 0.33 | 2.44 | 0.21 |
Table 8.
Analysis of change in absorption levels (∆A) and resonance frequencies (∆f) (in THz) for different radii of DR and different layers of H1N1 virus swab for fixed DR thickness of 5 μm.
Table 8.
Analysis of change in absorption levels (∆A) and resonance frequencies (∆f) (in THz) for different radii of DR and different layers of H1N1 virus swab for fixed DR thickness of 5 μm.
| hDR=5 μm | ||||||||||||
| With Virus | r = 9 μm | r = 11 μm | r = 13 μm | r = 15 μm | r = 17 μm | r =19 μm | ||||||
| hVirus | ∆f | ∆A | ∆f | ∆A | ∆f | ∆A | ∆f | ∆A | ∆f | ∆A | ∆f | ∆A |
| 1 μm | 0.05 | -0.05 | 0.05 | 0.03 | 0.05 | 0.01 | 0.05 | -0.01 | 0.01 | 0.02 | 0.03 | 0 |
| 2 μm | 0.14 | 0.01 | 0.13 | 0.04 | 0.12 | 0.05 | 0.12 | 0.01 | 0.06 | 0.03 | 0.06 | 0.01 |
| 4 μm | 0.22 | 0.01 | 0.2 | 0.13 | 0.18 | 0.11 | 0.17 | 0.05 | 0.11 | 0.07 | 0.1 | 0.09 |
| 6 μm | 0.26 | -0.17 | 0.24 | 0.16 | 0.22 | 0.15 | 0.2 | 0.08 | 0.14 | 0.13 | No pic | No pic |
| 8 μm | 0.33 | -0.02 | 0.31 | 0.23 | 0.28 | 0.24 | 0.26 | 0.14 | 0.2 | 0.14 | 0.17 | 0.1 |
| 10 μm | 0.39 | -0.23 | 0.37 | 0.23 | 0.33 | 0.32 | 0.31 | 0.21 | 0.24 | 0.19 | 0.21 | 0.11 |
Table 9.
Comparison of resonance frequencies (in THz) and absorbance (A) levels of optimized biosensor for different thicknesses and layers of H1N1 virus swab for DR radius of 11 μm.
Table 9.
Comparison of resonance frequencies (in THz) and absorbance (A) levels of optimized biosensor for different thicknesses and layers of H1N1 virus swab for DR radius of 11 μm.
| r =11 μm | ||||||
| hDR | 4 μm | 4.5 μm | 5 μm | |||
| Without Virus | f | A | f | A | f | A |
| 2.93 | 0.82 | 2.91 | 0.73 | 2.9 | 0.66 | |
| With VirushVirus | f | A | f | A | f | A |
| 1 μm | 2.88 | 0.83 | 2.86 | 0.73 | 2.857 | 0.69 |
| 2 μm | 2.83 | 0.84 | 2.82 | 0.78 | 2.81 | 0.71 |
| 3 μm | 2.79 | 0.86 | 2.78 | 0.76 | 2.77 | 0.71 |
| 4 μm | 2.75 | 0.90 | - | - | 2.73 | 0.76 |
| 4.5 μm | - | - | 2.73 | 0.83 | - | - |
| 5 μm | 2.71 | 0.90 | 2.71 | 0.85 | 2.70 | 0.79 |
| 6 μm | 2.67 | 0.88 | 2.67 | 0.89 | 2.66 | 0.82 |
| 7 μm | 2.64 | 0.93 | 2.61 | 0.93 | 2.61 | 0.83 |
| 8 μm | 2.60 | 0.91 | 2.60 | 0.91 | 2.59 | 0.89 |
| 9 μm | 2.57 | 0.97 | 2.57 | 0.86 | 2.56 | 0.90 |
| 10 μm | 2.54 | 0.89 | 2.54 | 0.83 | 2.53 | 0.90 |
Table 10.
Comparison of change in absorption levels (∆A) and resonance frequencies (∆f) (in THz) of optimized biosensors for different thicknesses and layers of H1N1 virus swabs for DR radius of 11 μm.
Table 10.
Comparison of change in absorption levels (∆A) and resonance frequencies (∆f) (in THz) of optimized biosensors for different thicknesses and layers of H1N1 virus swabs for DR radius of 11 μm.
| r =11 μm | ||||||
| hDR | 4 μm | 4.5 μm | 5 μm | |||
| With VirushVirus | ∆f | ∆A | ∆f | ∆A | ∆f | ∆A |
| 1 μm | 0.05 | 0.01 | 0.05 | 0 | 0.043 | 0.03 |
| 2 μm | 0.1 | 0.02 | 0.09 | 0.05 | 0.09 | 0.05 |
| 3 μm | 0.14 | 0.04 | 0.13 | 0.03 | 0.13 | 0.05 |
| 4 μm | 0.18 | 0.08 | - | - | 0.17 | 0.1 |
| 4.5 μm | - | - | 0.18 | 0.1 | - | - |
| 5 μm | 0.22 | 0.08 | 0.2 | 0.12 | 0.2 | 0.13 |
| 6 μm | 0.26 | 0.06 | 0.24 | 0.16 | 0.24 | 0.16 |
| 7 μm | 0.29 | 0.11 | 0.3 | 0.2 | 0.29 | 0.17 |
| 8 μm | 0.33 | 0.09 | 0.31 | 0.18 | 0.31 | 0.23 |
| 9 μm | 0.36 | 0.15 | 0.34 | 0.13 | 0.34 | 0.24 |
| 10 μm | 0.39 | 0.07 | 0.37 | 0.1 | 0.37 | 0.24 |
Table 11.
Comparison of change in absorption levels and resonance frequencies (in THz) of realized biosensor for different thicknesses and layers of H1N1 virus swab with different dielectric constants.
Table 11.
Comparison of change in absorption levels and resonance frequencies (in THz) of realized biosensor for different thicknesses and layers of H1N1 virus swab with different dielectric constants.
| hDR= 4 μm, hVirus= 9 μm | hDR= 4.5 μm, hVirus= 8 μm | hDR= 5 μm, hVirus= 10 μm | ||||
|---|---|---|---|---|---|---|
| 2 | 2.61 | 0.97 | 2.63 | 0.95 | 2.58 | 0.92 |
| 2.1 | 2.59 | 0.96 | 2.61 | 0.92 | 2.55 | 0.94 |
| 2.2 | 2.57 | 0.97 | 2.6 | 0.91 | 2.53 | 0.89 |
| 2.3 | 2.55 | 0.91 | 2.58 | 0.86 | 2.52 | 0.95 |
| 2.4 | 2.54 | 0.95 | 2.57 | 0.96 | 2.5 | 0.93 |
| 2.5 | 2.52 | 0.99 | 2.55 | 0.94 | 2.48 | 0.95 |
| 2.6 | 2.51 | 0.8 | 2.54 | 0.87 | 2.46 | 0.98 |
| 2.7 | 2.49 | 0.95 | 2.52 | 0.86 | 2.45 | 0.82 |
| 2.8 | NO PEAK | NO PEAK | 2.51 | 0.91 | 2.43 | 0.99 |
| 2.9 | 2.46 | 0.98 | 2.5 | 0.99 | 2.42 | 0.97 |
| 3 | 2.45 | 0.96 | 2.48 | 0.91 | 2.4 | 0.94 |
| 3.1 | 2.43 | 0.89 | NO PEAK | NO PEAK | 2.39 | 0.96 |
| 3.2 | 2.42 | 0.73 | 2.46 | 0.86 | 2.38 | 0.99 |
| 3.3 | 2.41 | 0.93 | 2.45 | 0.98 | NO PEAK | NO PEAK |
| 3.4 | 2.4 | 0.7 | 2.44 | 0.98 | 2.35 | 0.91 |
Disclaimer/Publisher’s Note: The statements, opinions and data contained in all publications are solely those of the individual author(s) and contributor(s) and not of MDPI and/or the editor(s). MDPI and/or the editor(s) disclaim responsibility for any injury to people or property resulting from any ideas, methods, instructions or products referred to in the content. |
© 2023 by the authors. Licensee MDPI, Basel, Switzerland. This article is an open access article distributed under the terms and conditions of the Creative Commons Attribution (CC BY) license (http://creativecommons.org/licenses/by/4.0/).
Copyright: This open access article is published under a Creative Commons CC BY 4.0 license, which permit the free download, distribution, and reuse, provided that the author and preprint are cited in any reuse.


