
Submitted:
02 November 2023
Posted:
03 November 2023
You are already at the latest version
Abstract
This paper aims to present the method of producing visual media for communicating the Asinara Island National Park plan. These products are landscape visualizations able to foster landscape preservation both from the point of view of the management of the landscape and of the citizen's involvement in the communication of the historical and environmental values of the landscape. Starting from landscape information gathering, the research has experimented with an operative method for processing different graphic representations from the same geographic database, calibrating the outputs to different audiences, their needs, objectives, and literacy skills. Three different types of products are presented: the first is a digital, dynamic and multisectoral decision-making GIS tool for park management. The second is a 3D model, aimed to the virtual fruition. The third is a map of the zoning park plan drawn to be easily readable to the non-expert public. This case study emerges as a replicable method to process the landscape information to make different visualization tools from a single geographic model, to meet the different requirements that arise from a complex landscape planning process.
Keywords:
maps
; 3D visualizations
; landscape
0. Introduction
This article presents the communication project of the planning process of a natural park, the Asinara Island National Park, which has investigated the role of communication actions to support preserving a national natural park's historical and cultural heritage. In the course of this experience, the representations of the plan were not only aimed at the visualization of the planned zoning, as the traditional approach requires, but also investigated an operational process capable of bringing together all the different forms of visualization, which, in addition to representing zoning, could also become a tool for the management of the park's resources, for virtual enjoyment, and for the communication even to the public without specialist knowledge or high levels of graphicacy and digital literacy.
Cultural heritage communication is nowadays considered a fundamental action to preserve the heritage itself as it fosters education, information, awareness, enjoyment, perception, knowledge, and the involvement of the citizens, that, in these ways, can take care of it, thus enhancing and supporting the process of protection [1]. Therefore, following national and international guidelines, recommendations, and regulations, landscape preservation, as part of the cultural heritage, must be linked to communicating their values to the citizens [2,3,4]. Furthermore, the relationship between conservation and communication actions has become mandatory in light of the new role in landscape transformation processes of public opinion [5,6], which is increasingly becoming a key player thanks to the spread of new digital communication media. The effectiveness and success of landscape transformation projects are increasingly connected to the behavior and perceptions of the citizens, which can lead to the success or failure of transformation design actions. For this reason, visualizations aimed at strengthening the awareness of the public and the knowledge of landscape communication have gained centrality in recent decades and have become an essential area of scientific experimentation at the architectural scale, as in the case of place narration [7,8,9] or of the architectural and historic heritage [10,11], at the urban scale with the studies about virtual city models [12,13].
However, the research appears to be less deep at the landscape scale. Indeed, at this scale, research on visualization focuses mainly on the production of single images aimed at fostering awareness of environmental issues throughout the rendering of landscape transformations by the elaboration of scenarios [14] in the fields of climatic changes [15,16], coastal floodings [17], ecosystems evolution [18], and infrastructures localization [19]. These kinds of visualizations are also used within plan processes to foster communication with the public, to facilitate citizen participation [20,21], to support collaborative design processes [22,23], and to evaluate the environmental impact [24,25].
Although covering numerous application areas, a gap emerges from the debate on landscape visualization regarding the potential of digital technologies and the use of 3D digital visualizations within the design process [26,27] and in the stakeholder engagement [28,29], that is the field of experimentation of the research presented in this article.
1. Background
Visual communication of landscape has a long tradition in landscape architecture and planning [30,31]. Remarkably, visual landscape research has its roots in the research on the representation of the perception of the urban environment studied by Lynch [32], Cullen [33], and Appleyard et al. [34]. Starting from these studies, in the 1960s, in the Netherlands developed an approach to the visual landscape research studied by De Veer and Burrough [35], which continues until today. In the last decade, landscape visualizations have spread mainly in the communication field aimed at the environmental impact assessment to involve local populations in the decision-making on landscape transformations and the communication of environmental changes [36].
Indeed, landscape visualizations are used to communicate both existing conditions and alternative landscape scenarios [37,38]. Views of scenarios are important engagement media for communication within the broader context of participatory decision-making [39]. In fact, the results of the planning and forecasting processes and the representations of the landscapes often need to be more abstract to give a clear vision of the future for the non-specialist public. For this reason, new forms of representation were experimented with by applying digital technologies [40].
The 3D modelling digital technologies have been thus widely applied in architectural and urban cultural heritage fields because it is an excellent means of giving access to cultural content and being a hub for collecting information [40,41,42].
Although visualization has a long tradition in design communication at the architectural scale, the research differs from the landscape scale. In past centuries, three-dimensional physical models played this role in the architectural field, particularly in the Renaissance. At the same time, at the landscape scale, visualization of scenarios was based mainly on freehand sketches and, from the last century, on photomontages. In the past, landscape representations took instead a different variety of forms like drawings, photomontages, and paintings. Nowadays, these representation forms can include diagrams, infographics, maps, sections, renderings, digital models, and animations [43,44]. Since the 1990s, the use of digital techniques for landscape visualization has increased dramatically [45,46]. These possibilities for digital representation have been substantially enhanced by the improved capabilities to link CAD, GIS, and landscape visualization software. Today's typical approach is to compile information in a CAD or GIS database and then generate outputs of different types like maps, rendered images, animated sequences and real-time models where the user can freely navigate a landscape [47]. However, these kinds of landscape representations are not always accessible to users without the linguistic tools necessary for their understanding. Generally, images are produced regardless of the user's cultural level, preventing their actual involvement in decision-making. As the members of the public have become more involved in decision-making on the landscape, the need for visualization has increased, privileging forms of expression more ductile and explicit as virtual reality [48,49]. Another answer to this need has been given by applying computer game technologies to landscape visualization. Games offer a familiar context to unfamiliar issues and allow people without expertise entry into multidisciplinary environments backed by the best available data and modelling [50,51].
The development of these forms of digital access to visualizations poses the problem of including different audiences with different visual and digital literacy levels. Thus, there is a need to integrate different forms of communication in order to make information more accessible for all.
2. Tools and method
The aim of this work is to present the creation process of graphic-visual products for the communication of the Asinara Island National Park, in the northern part of Sardinia Island, in Italy (Figure 1).
The workflow experimented is part of an agreement to support the communication of the update of the Asinara Island National Park plan, required by legislation after ten years since its inauguration. The proposal put forward in response to this request envisaged a wide-ranging plan of activities extended to different media aimed at engaging and reaching different audiences in terms of belonging to different demographic and socio-cultural categories (Figure 2).
The research was aimed to produce different types of visualizations for different audiences. Among the different visualisations proposed to the park authority, this research presents the workflow related to the production of three specific forms of visualization. The first one is designed to be used by an expert audience involved in the management of the natural park and consists of a digital, dynamic, and interactive tool that would facilitate the simultaneous and georeferenced reading of environmental features through the interpolation of different territorial levels of information. The second and the third aim for a non-expert public and consist of more traditional cartographic representation to communicate the new plan to the citizens. These parts of the research are strictly connected in one production process in four steps: the first step aims to develop the GIS platform from which are exported the geospatial layers that are after rendered and photoedited to produce the visualizations (Figure 3).
2.1. The GIS for the National Park management
The first step led to the development of a Geographical Information System (GIS) that systematically and organically collects all the information from experts of different disciplines who have collaborated in the studies aimed to the plan of Asinara Island National Park. To obtain all the valuable information for describing the two of the most authoritative databases to produce geographic-territorial data area were considered: The Regional Geoportal and the Asinara National Park Authority - Marine Protected Area Asinara Island.
In the Regional Geoportal, the territorial layers of the island were identified and used to reproduce its geographical features in vector and raster formats. The use of the regional database ensured that the downloaded data were updated and in compliance with the current regulations on data reprojection (IGM Geodetic Directorate, January 2022). The vector layer was used to describe the coastal boundaries at a scale of 1: 2000; the existing built-up area, containing not only the footprint of the built-up area on the ground but also its intended use; the road and footpath network, with the attribution of the type of road surface; the river network, with the description relating to the presence of perennial or seasonal water of the watercourse, the Strahler grade identifying the complexity of the branching of the hydrographic network and the length of each rod; lakes and reservoirs, to represent the systems of water bodies present in the territory. The Regional Geoportal database has also provided raster data. The Digital Elevation Model (DTM), which highlights the reliefs and landforms that the Region of Sardinia elaborates to the definition of 10 meters; the Digital Surface Model (DSM), a datum with a similar appearance to the previous one but is constituted with a much higher resolution both in terms of the size of the single cell, of 1 meter and in terms of the data collected since the DSM was born. The DSM aims to implement the DTM by highlighting the quantitative characteristics of the objects present on the surface, such as vegetation and buildings (Figure 4).
Furthermore, the GIS platform has been implemented with the Web Map Service (WMS) to display the historical series of satellite images related to the region of Sardinia. Implementing the WMS allows various comparative analyses regarding anthropogenic and natural changes. The regional catalog provides orthophotos from 1955 to 2020.
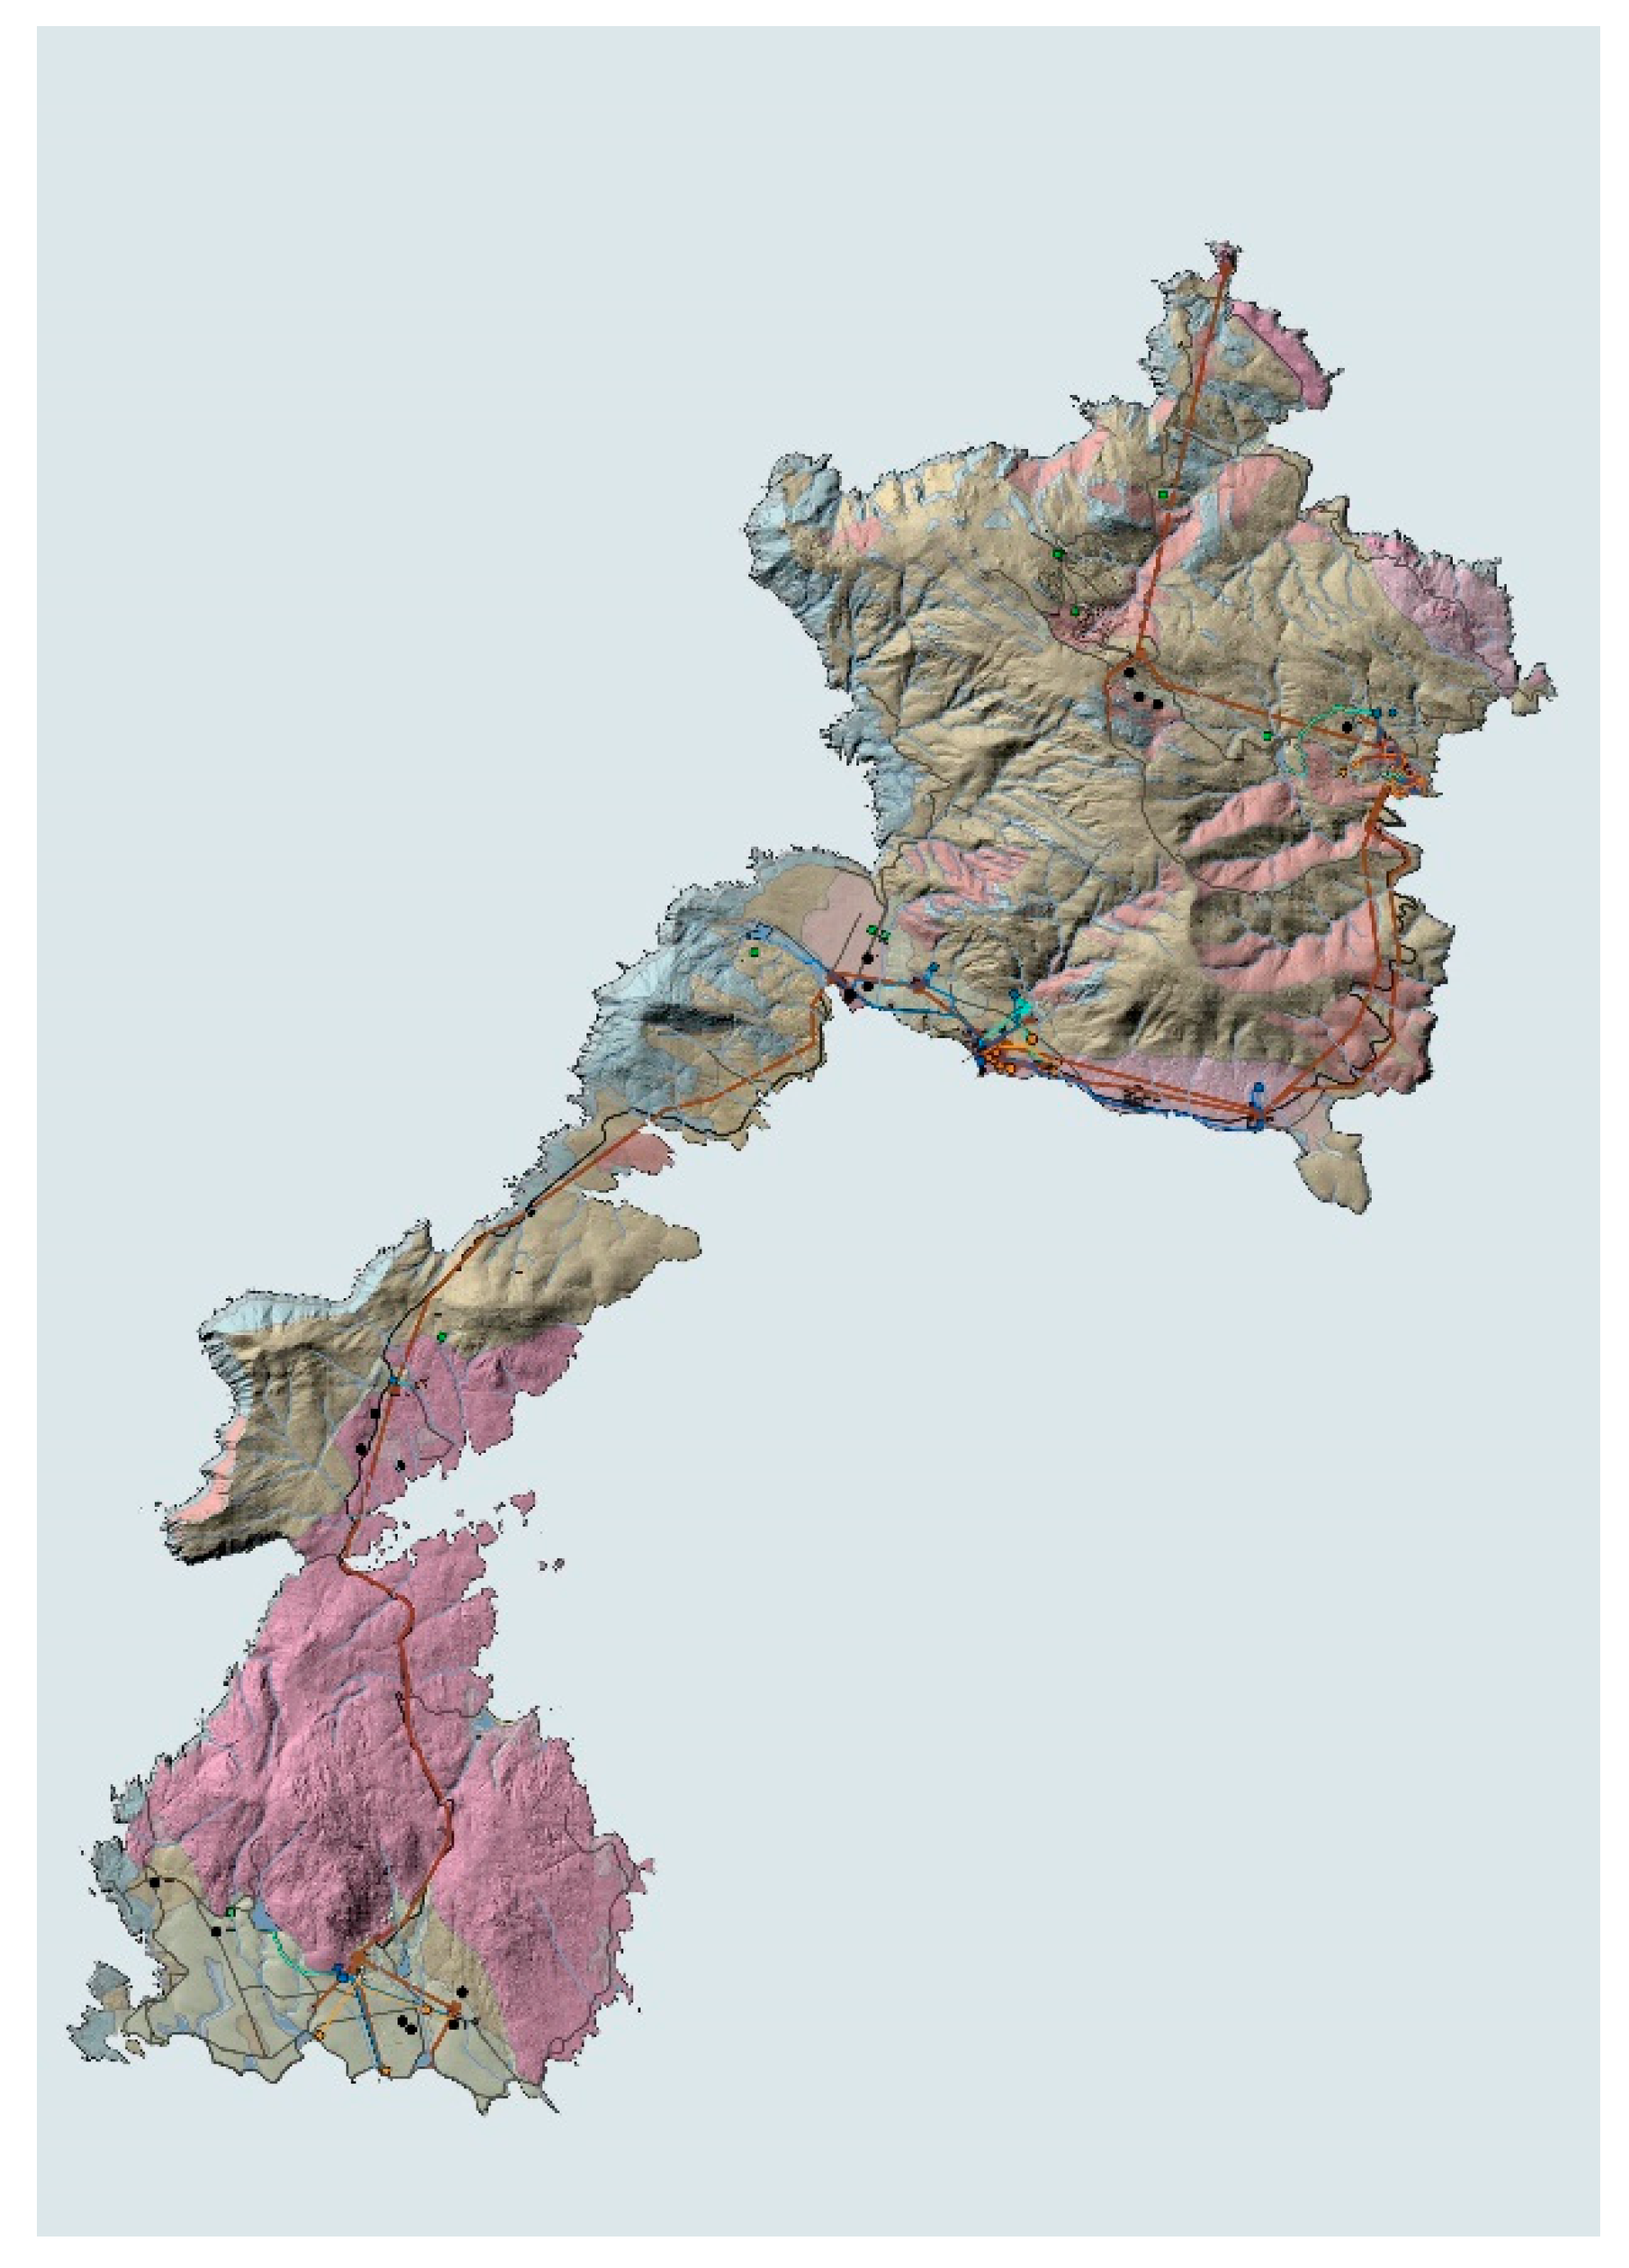
These layers formed the updated cartographic base for the plan maps, on which the sectorial technical information developed by the Park Authority was presented. The cartographic data owned and processed by the Asinara National Park Authority and Protected Marine Area were subsequently processed. Both cartographic and textual data related to the analyses carried out during the preparation of the Park Plan, published in 2005, were received. A total of 52 maps were processed to represent and describe the environmental system: geology, pedology, land capability, potential vegetation, land use, fishery biology, marine and terrestrial biocoenosis, settlement system, historical, cultural heritage, the previous plan zoning, and the geographic and socio-economic region to which Asinara Island belongs. The available documentation was limited to virtual printouts of information in PDF and text format. This involved converting the information into editable formats and their subsequent correction. Specifically, the corrections were carried out both from the point of view of data typology and information completion, but also from the point of view of updating geometric-spatial reprojections. These operations involved exporting the editable drawing to vector drawing environments, where the first corrections were made to the elements, and then importing them into QGIS to ensure correct overlap with the data taken from the Geoportal.
The geometry correction work done in CAD included operations to subdivide the geometry into point, linear and areal elements in context with the reorganization of the layers in CAD. The operations performed on the point elements consisted mainly of replacing the geometric shapes used in the printed map visualization with simple points so that the attributes needed to describe the element could be uniquely assigned. This procedure was carried out in the cartographies that identified water sources, wells and springs, the location of electrical substations and poles, and the point location of historical cultural assets. The latter were located as point elements to facilitate the construction of the attribute table containing the textual description of each asset. Next, corrections were made to the linear elements, which consisted mainly of joining the various broken polylines resulting from the conversion of the file from PDF to DWG format. These operations were carried out in the information layers of the road and path network, correlating the information related to the type of road surface, the type of walkability and the total length of the path and the water supply or sewerage network, implementing the graphical information with the textual information related to the type of pipeline, the length, and the date. As can be easily guessed, the most significant amount of information was related to areal elements. For this type of geometry, corrections were made by verifying individual perimeters. After the conversion, the initial raster contributed with CAD tools on the pdf had been transformed into linear elements rather than as fills.
Consequently, it was necessary to extrapolate only the perimeters, converting them into regions to allow the new spanning. Once the graphic information was converted and corrected, the geometries were imported into the Qgis open-source application Figure 5, where the work of creating and compiling the attribute table began. The features shown in both the reports and the legends were inserted into the datasets to implement the graphical component with the textual one, making the platform queryable.
This was done by creating Excel sheets containing the information from the individual descriptions associated with the cartographic elements, then integrated with the information available from the technical implementation rules of the National Park Plan. The sheets were then uniquely linked to the single geometries in the digital platform through a "join" operation within the GIS environment.
2.2. The 3Dmodelling for the landscape visualization
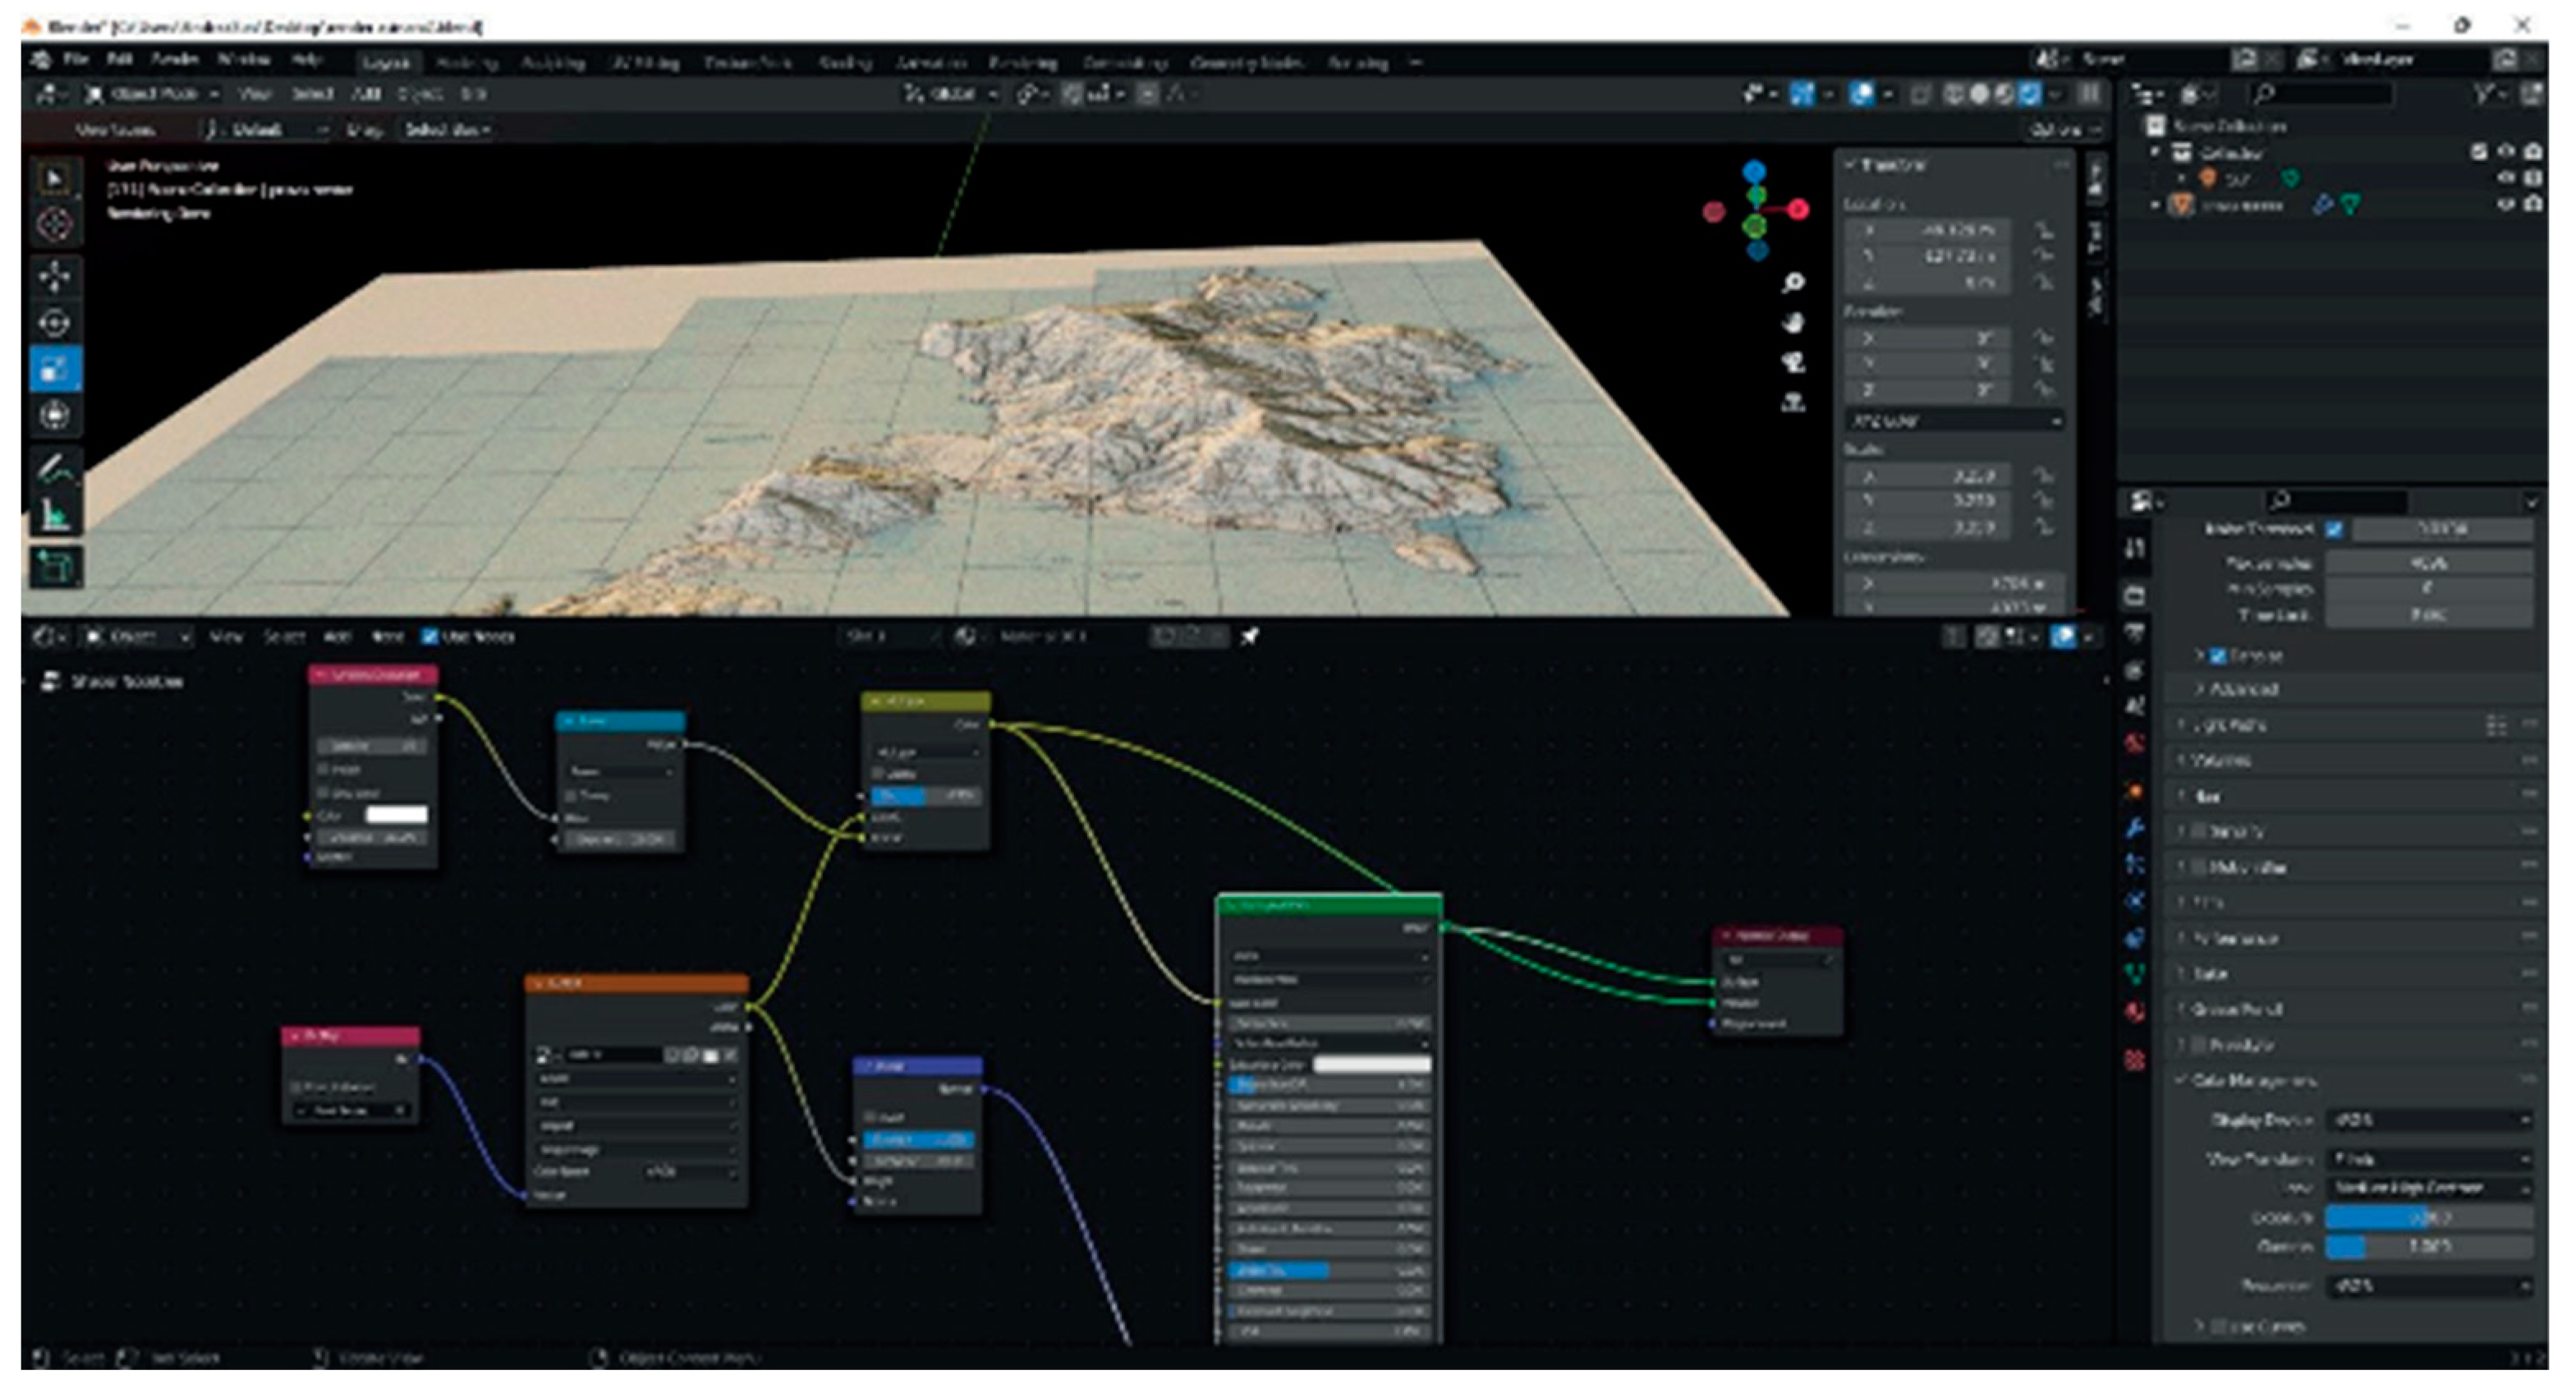
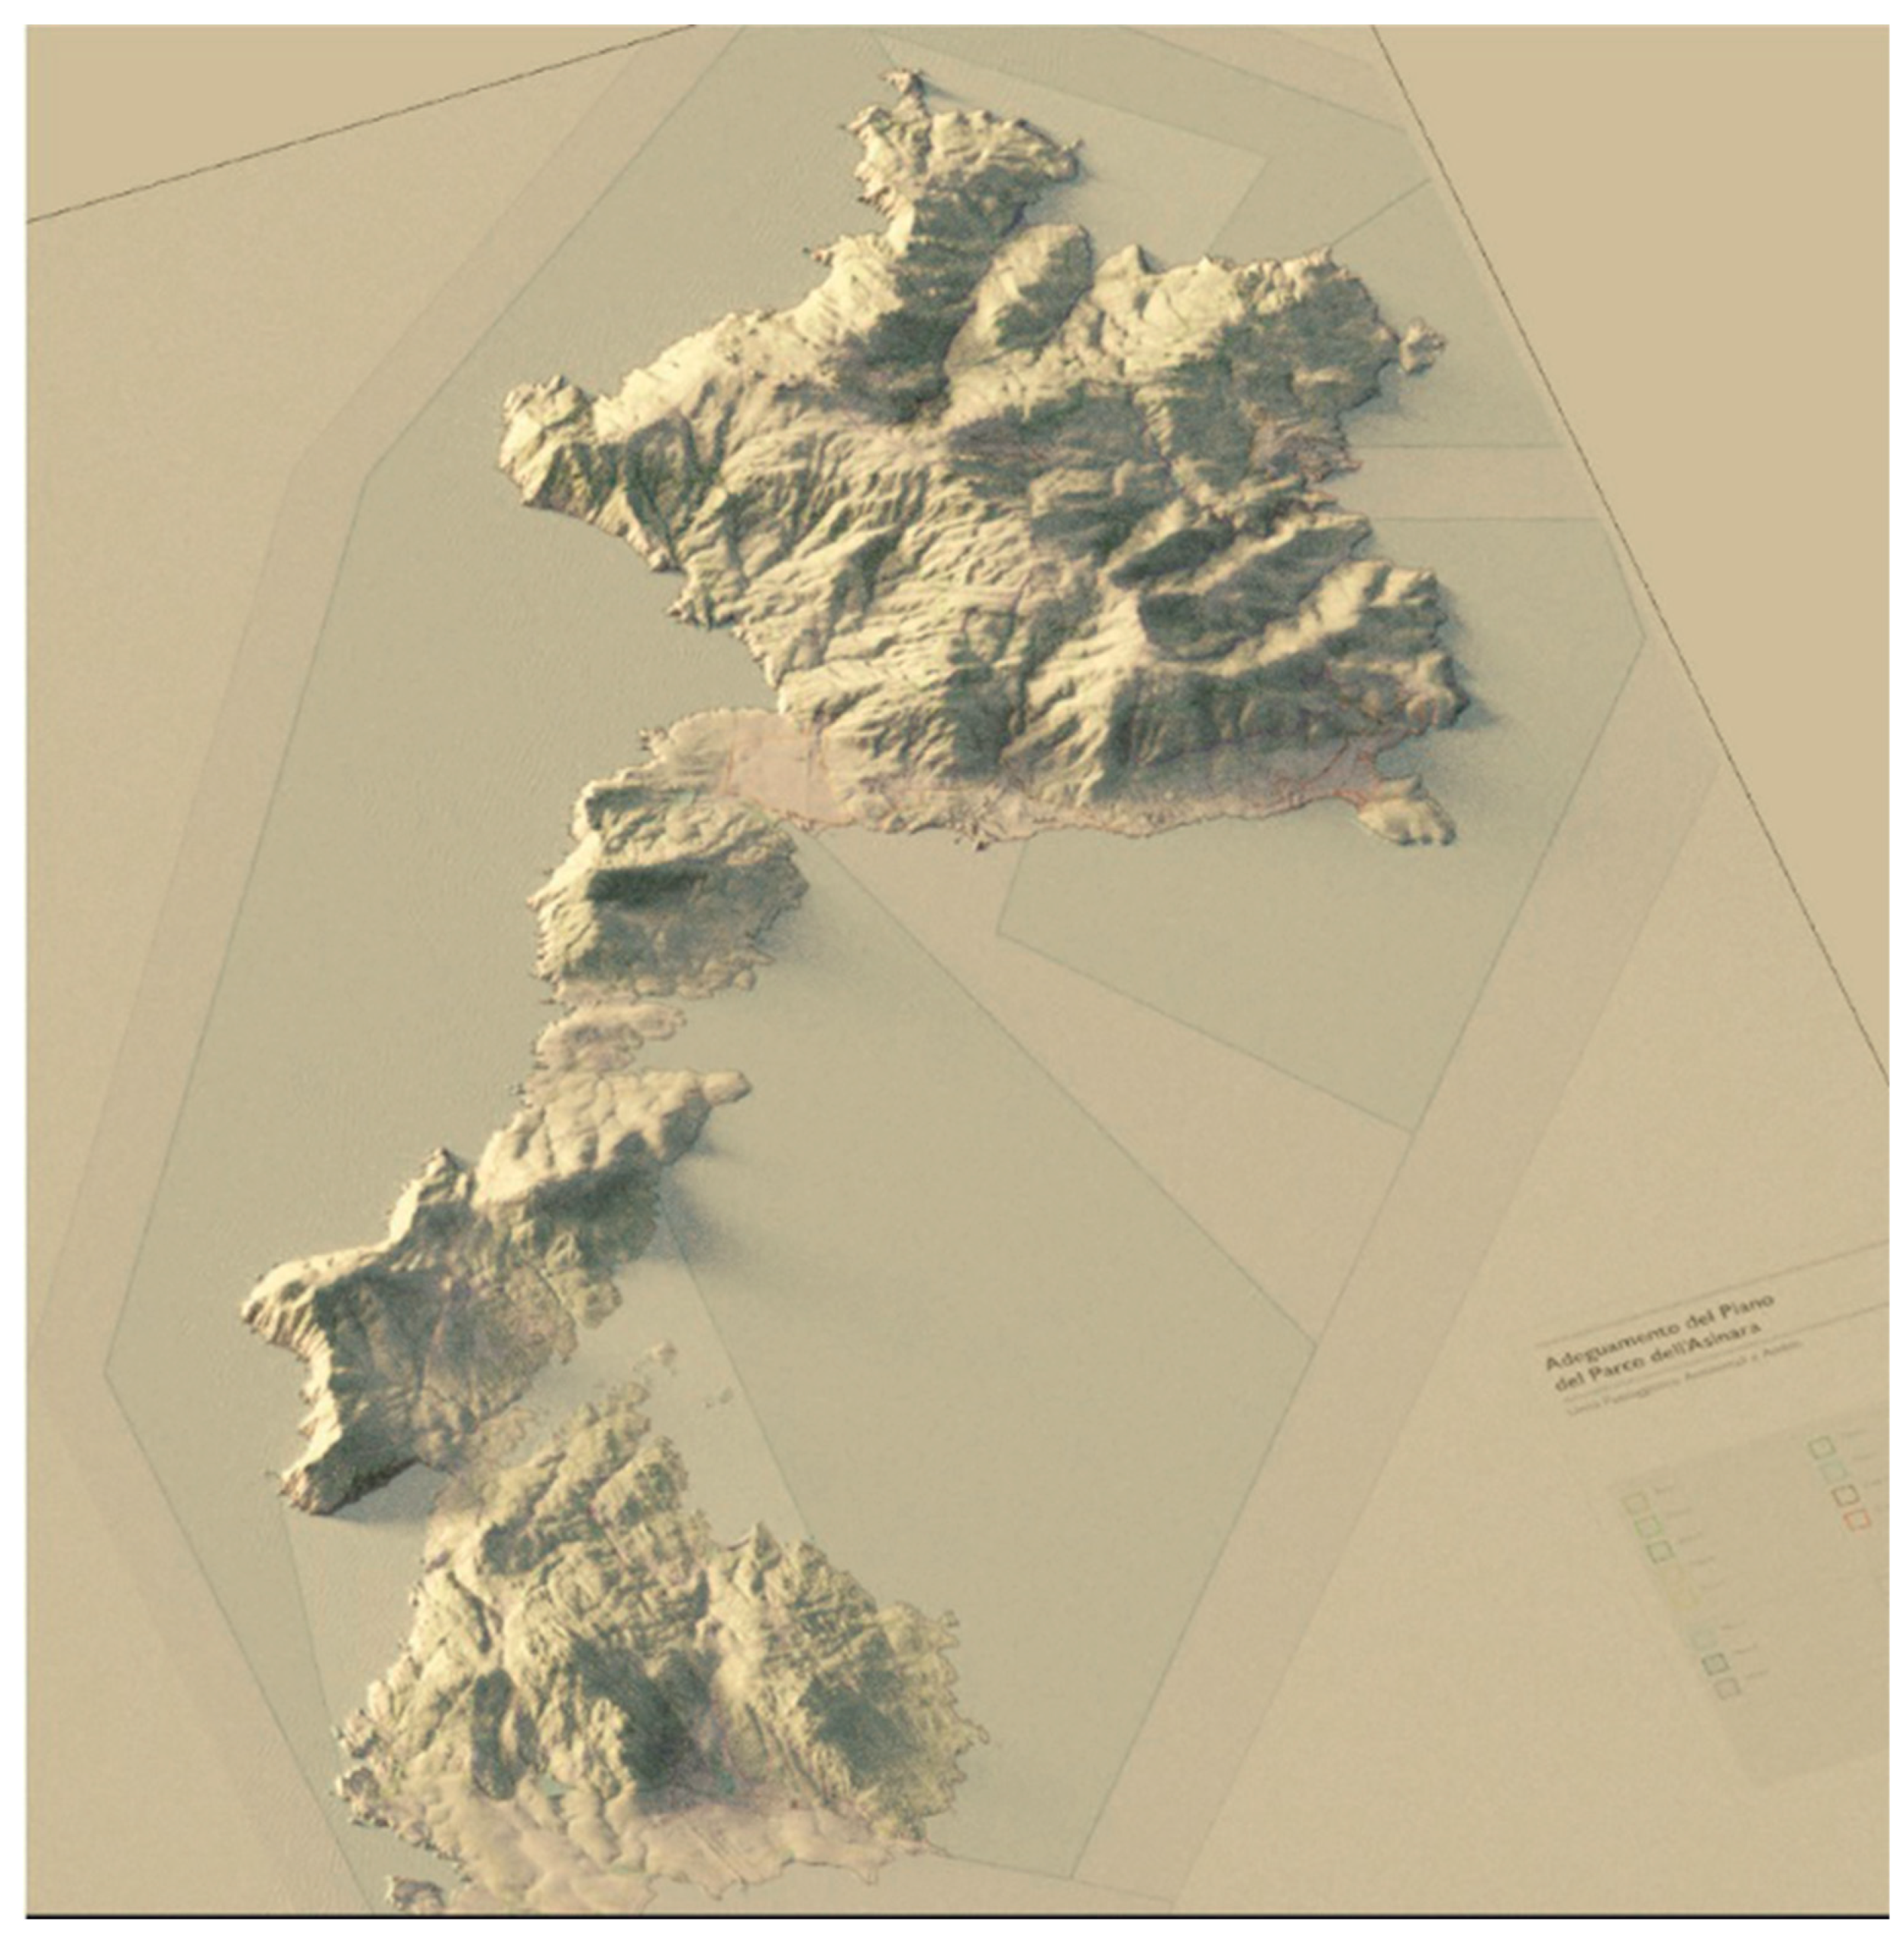
Several representations were experimented with to facilitate the communication of the Park Plan, even to the less experienced people. Firstly, a representation was experimented with by using a rendered mesh model. This type of processing was achieved by exporting the mesh model generated by the Digital Surface Model (DSM) from the GIS platform and then processing it with the Blender rendering engine. Using the "Blender-Gis" plug-in, the mesh, georeferenced at a scale of 1:1, was imported into the rendering software, which was processed by applying the material constructed from the orthophoto to the model (Figure 6 and Figure 7).
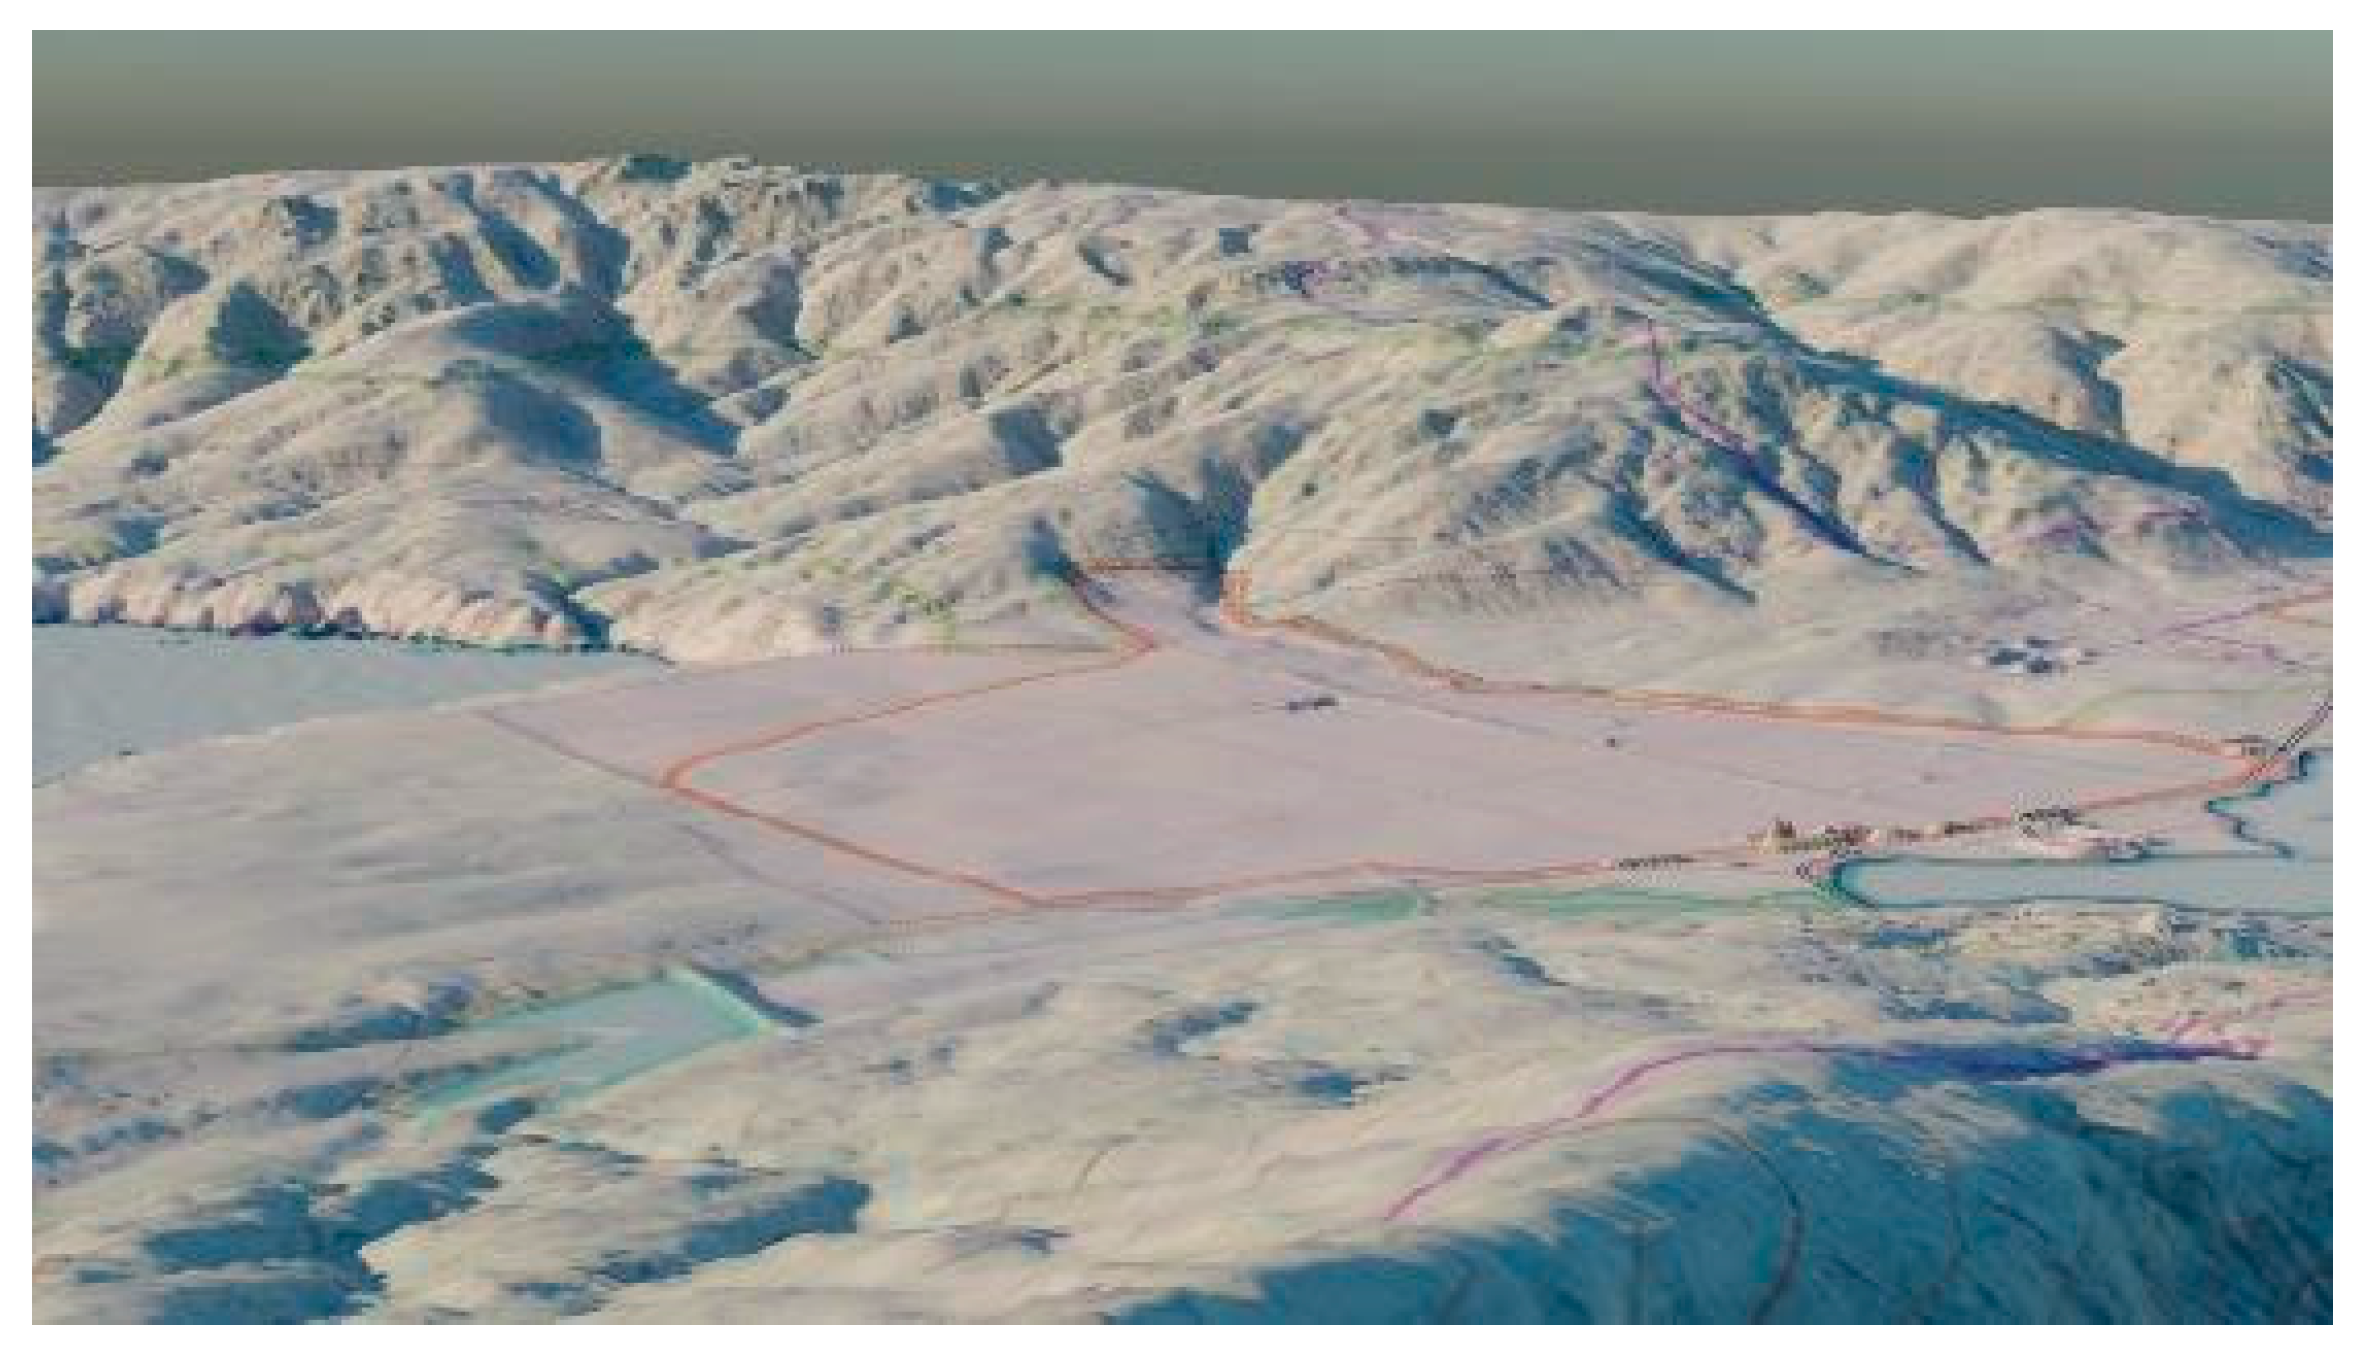
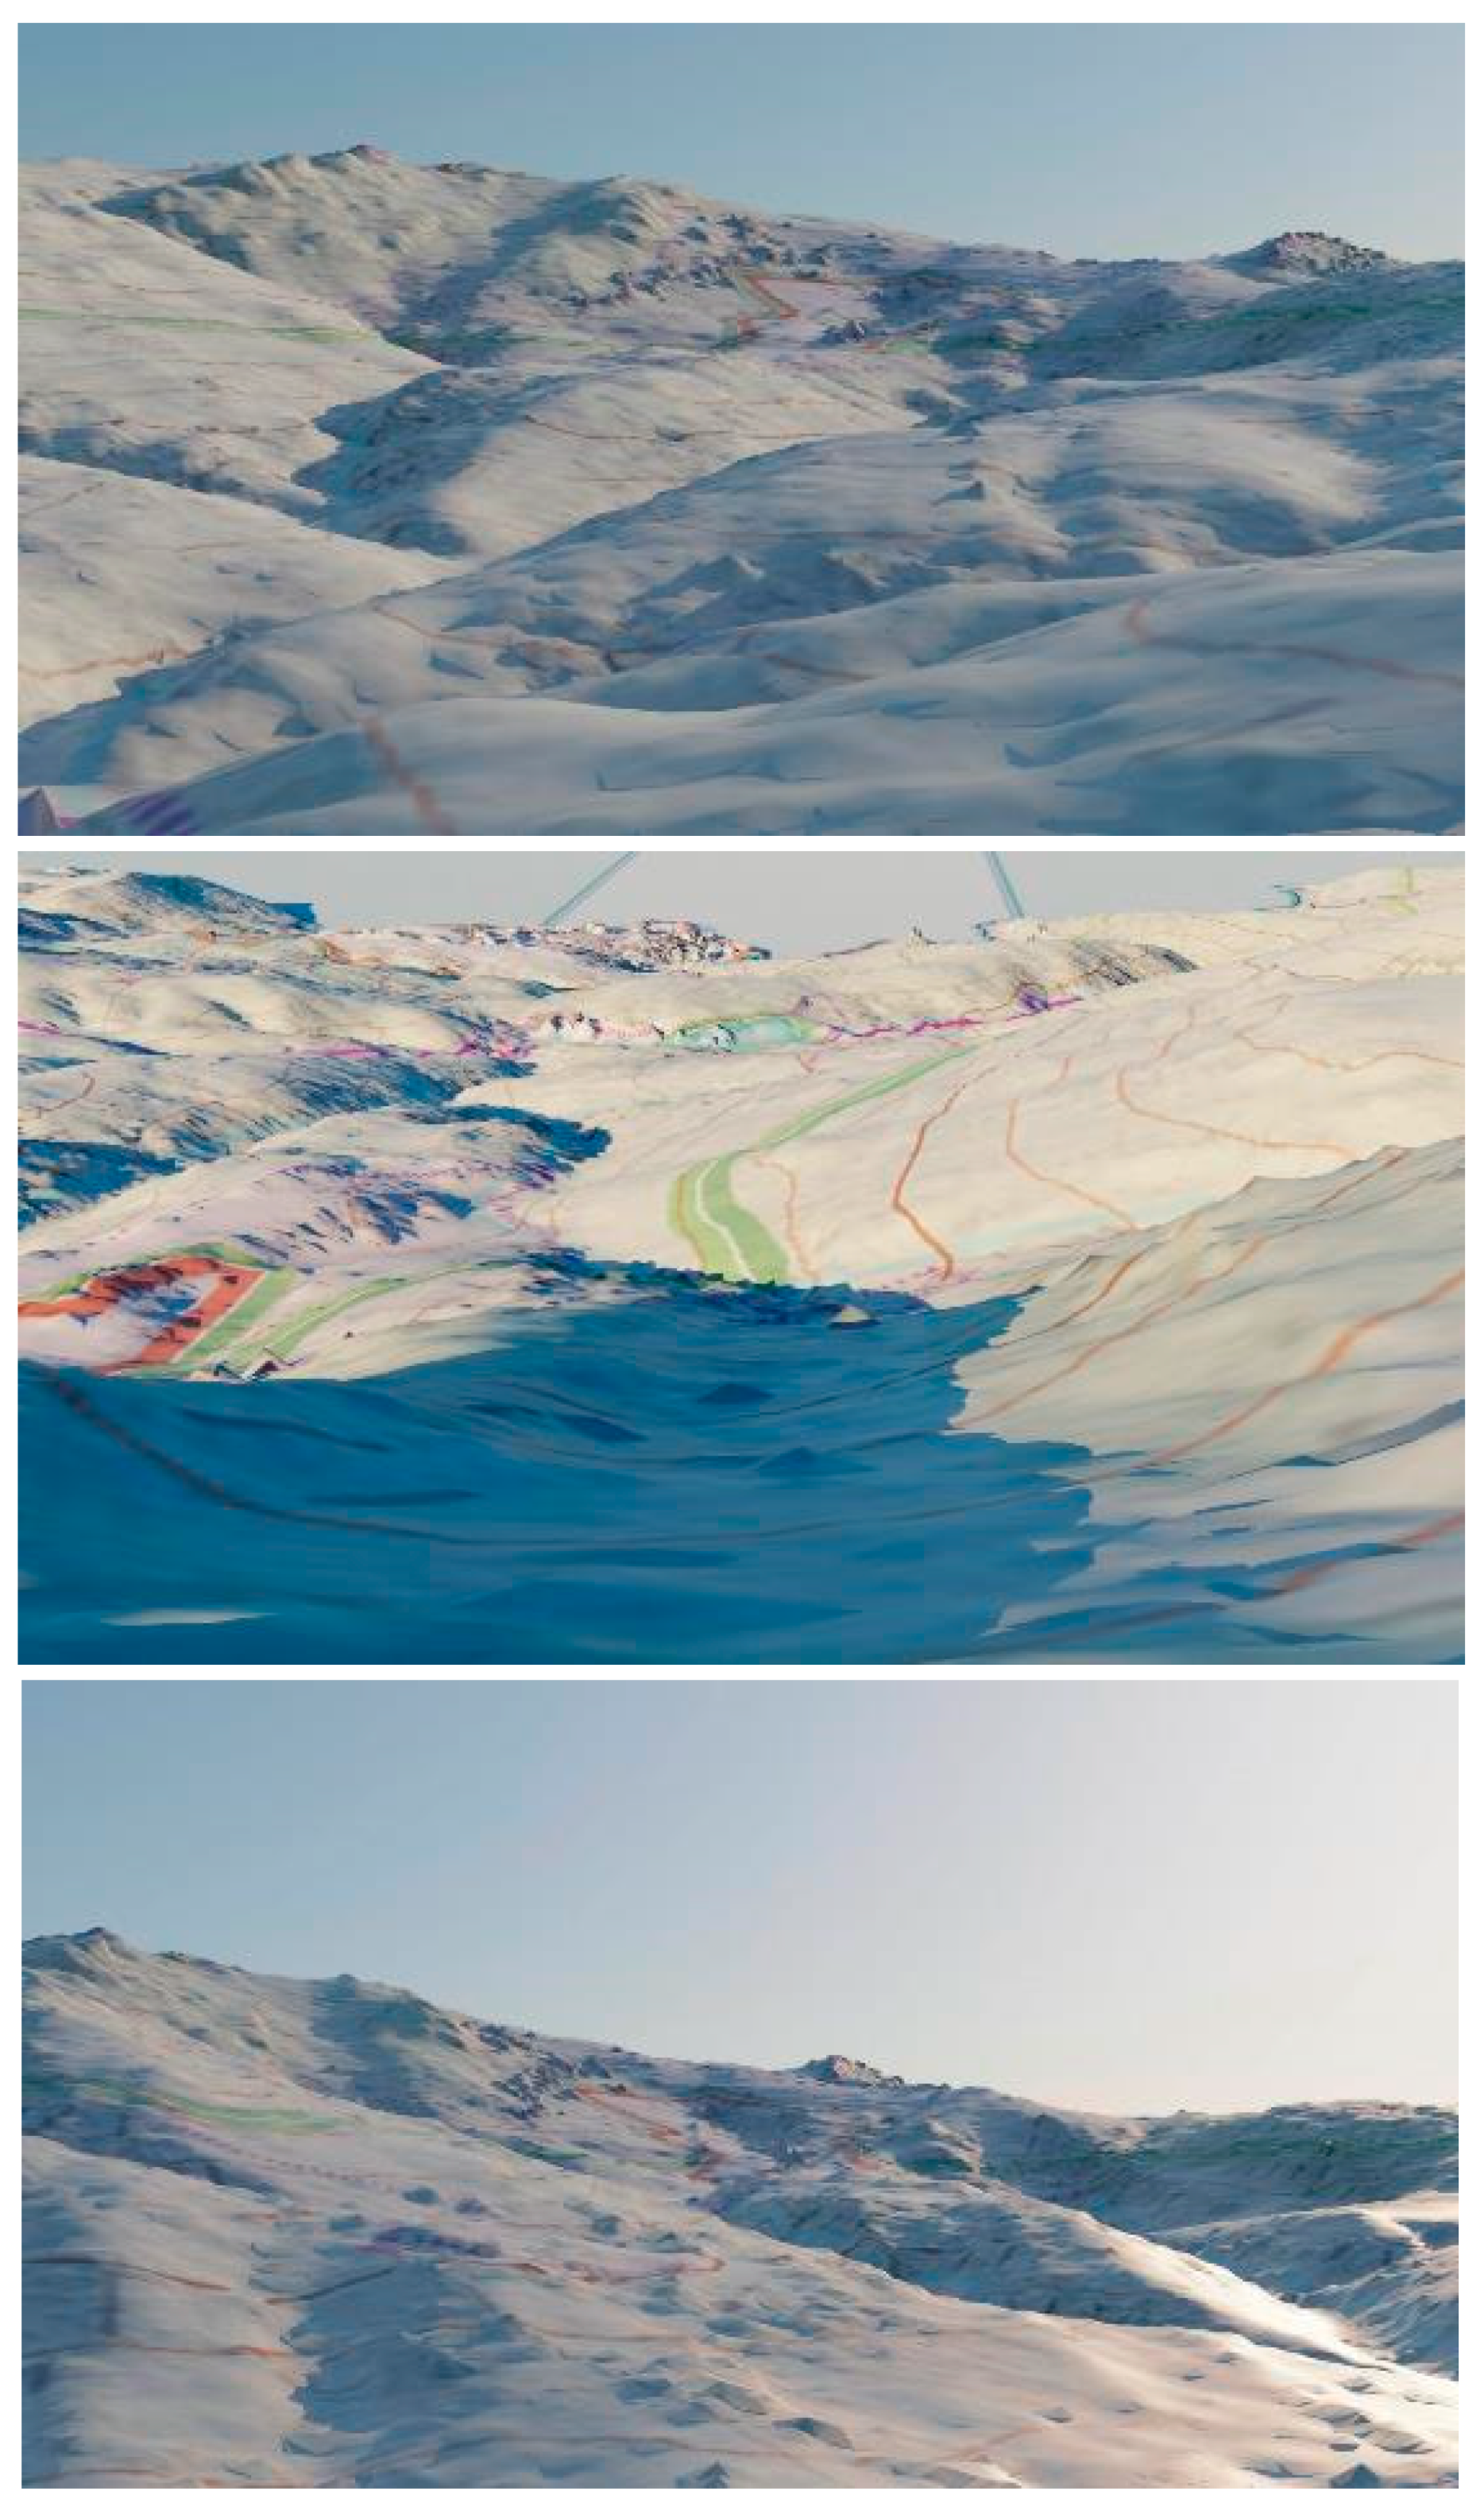
Next, information on all natural and anthropogenic features was placed on top of the rendered model, which was used for the perimeter of the land areas. The model produced in this way provides the basis for an immersive experience of the park plan zoning (Figures 8, 9, 10 and 11). and allows the interpretation of the relationships between the project and the morphological, historical, and environmental characteristics of the island. The navigable model of the park plan zoning constitutes an innovation in relation to the traditional graphic products typically used to communicate the results of territorial plans. However, this experimentation resulted in a product that was difficult to use because the file size did not allow for easy visualization of the document, and, more importantly, it was not possible to export the graphic product to scale. Furthermore, not all audiences can enjoy this form of communication due to inadequate digital alphabetization and scarce digital tools availability. As a result, it was necessary to rethink the type of graphic product to be developed to meet the need to communicate the plan to a non-expert audience.
2.3. The cartographic representation of the plan zoning
In order to elaborate a graphic media easily understandable by the non-expert audience, a semantic approach was adopted to represent graphical spatial information emphasizing the structural aspects of spatial areas. Especially for the raster information, conducting a preliminary analysis in a GIS environment was necessary to preserve the three-dimensional aspect of the territory as much as possible. To this aim, three different analyses were carried out on the digital terrain model imported into the GIS: shading calculation, slope analysis and the study of shadows cast on the terrain.
In the first case, Qgis' native hillshade symbology was used for the shading calculation to display the correct shadows. The direction of the light coming from the northwest was set to a light source height of 45 degrees, resulting in a black-and-white visualization of the DTM. The slope analysis was created as a vector layer using hatching. The processing was carried out through various analyses performed on the DTM: the hillshade was created, the slope analysis, and, at the same time, the contour layer was created, on which the series of equidistant points were subsequently placed. The 'geometry generator' operation performed on the points made it possible to transform each point into a segment, always perpendicular to the curve that generated it, of variable length depending on the percentage of slope closest to the point.
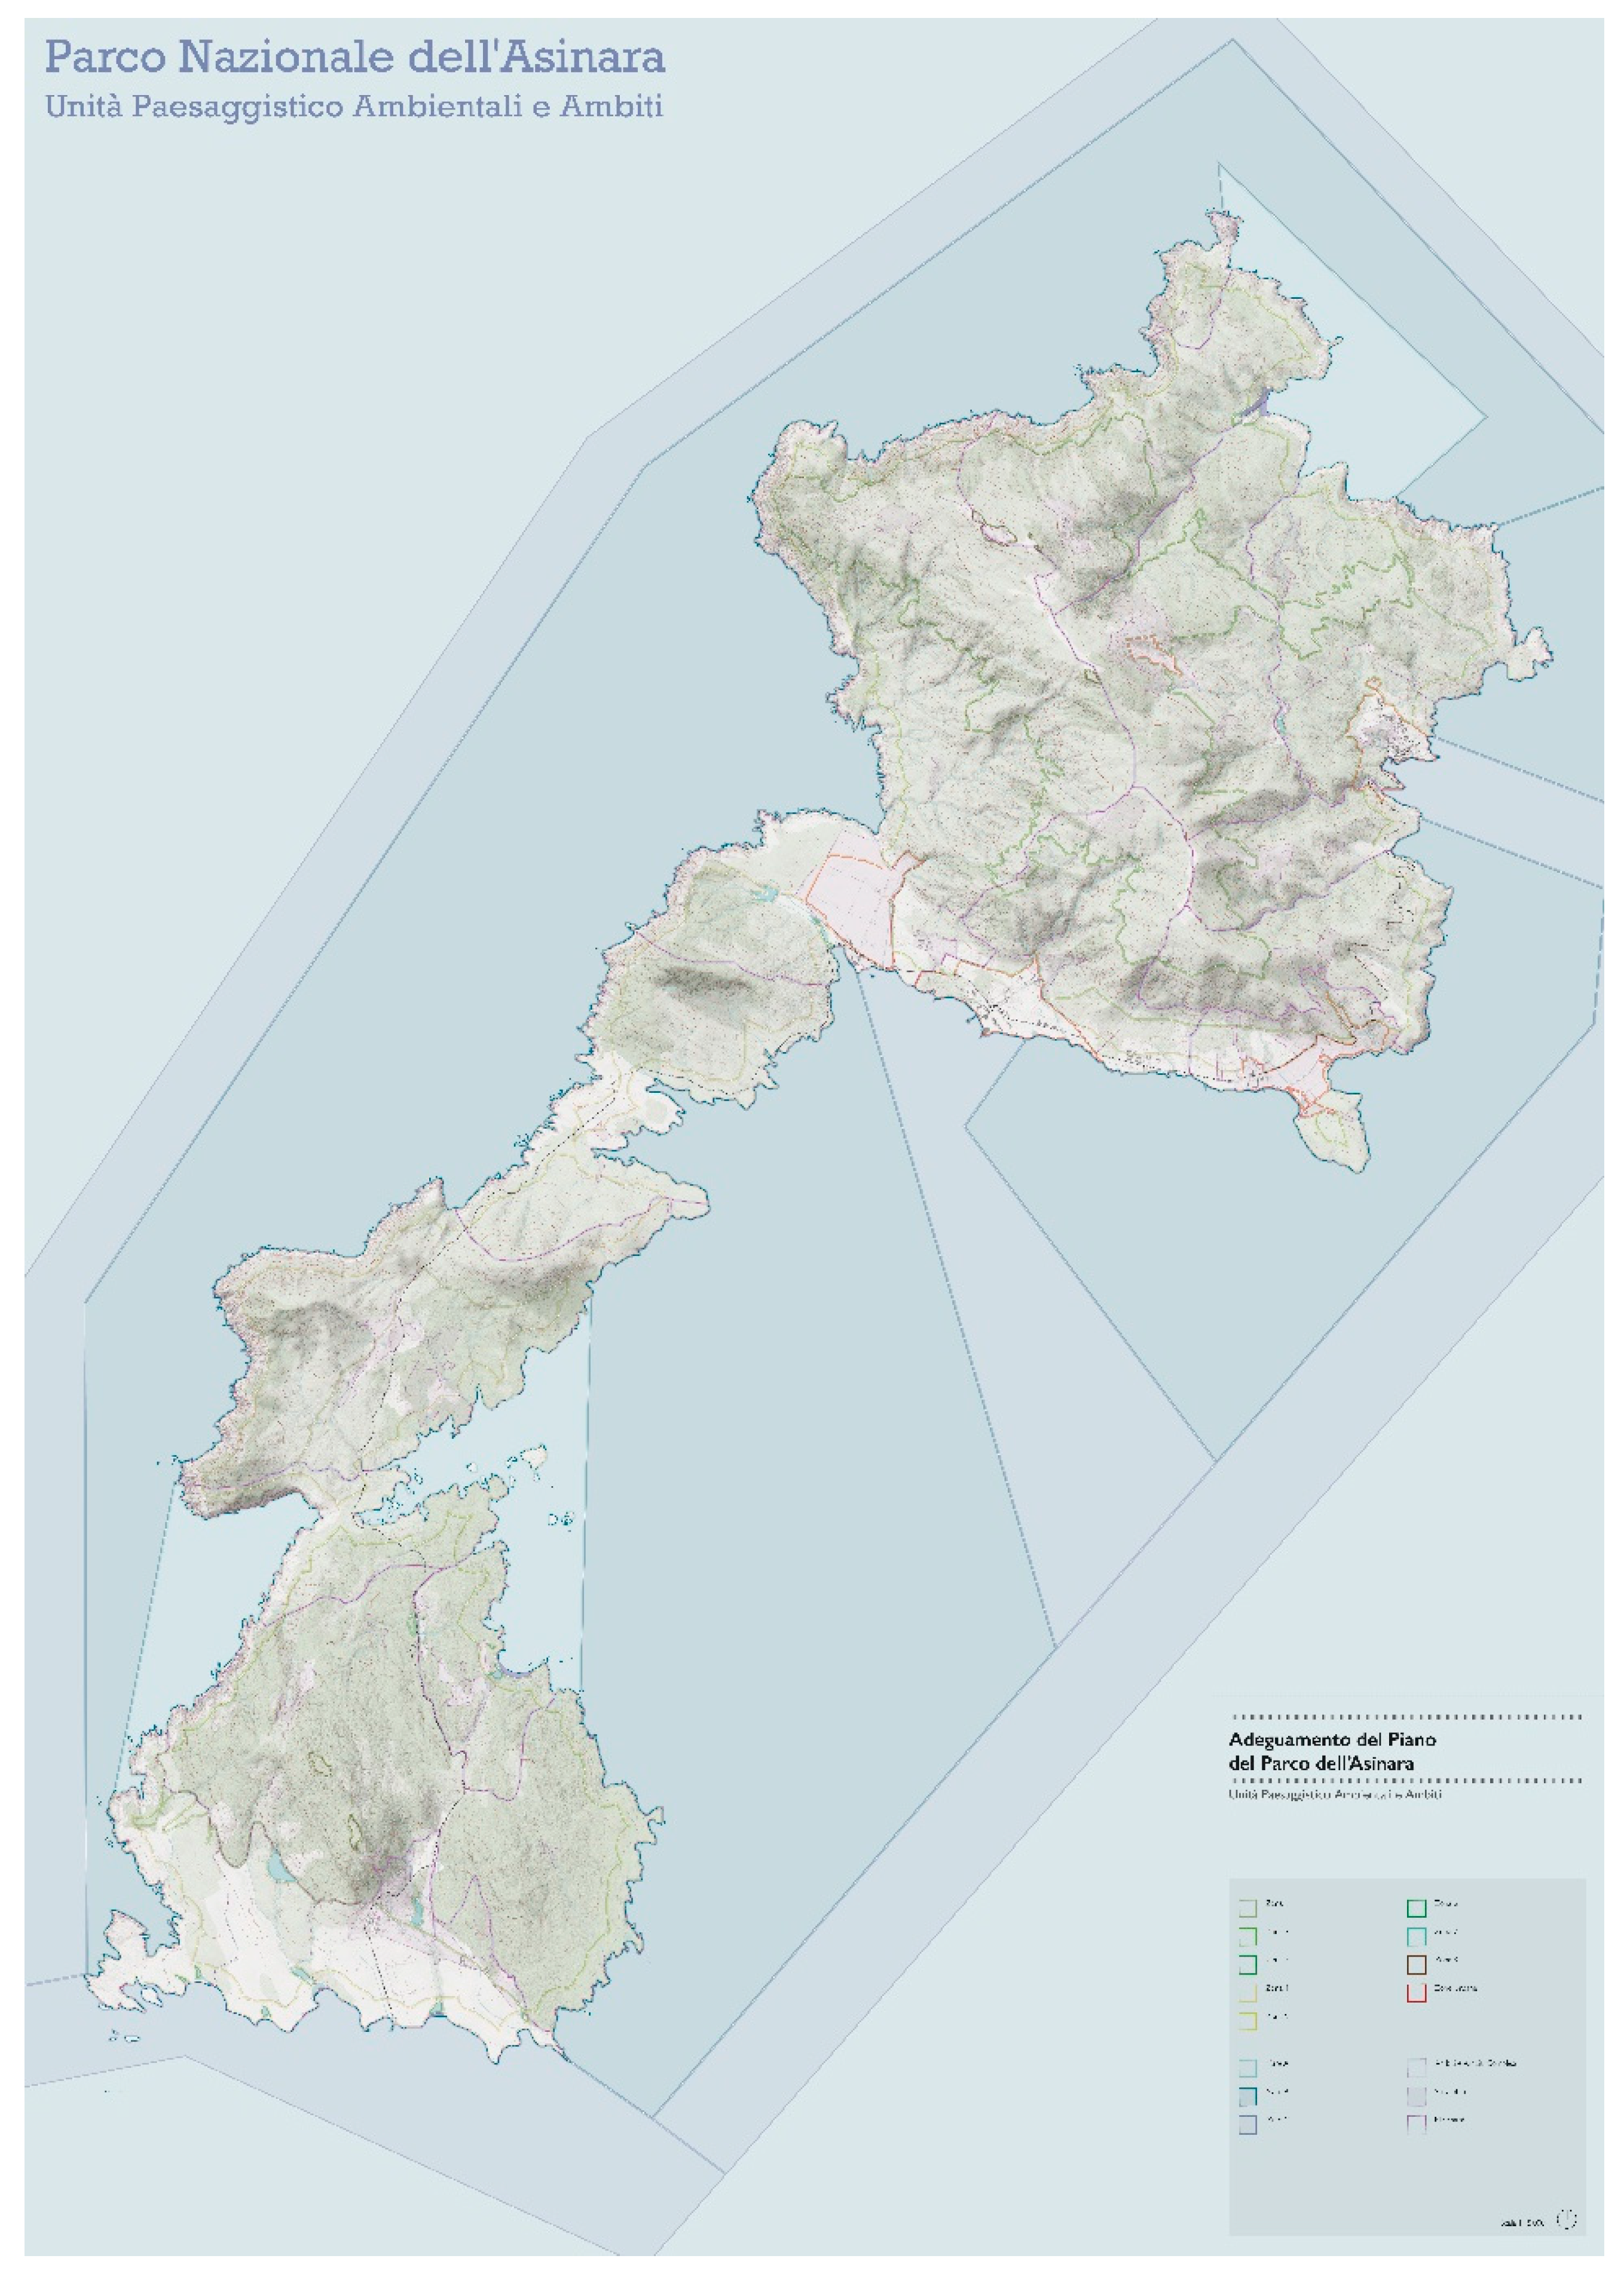
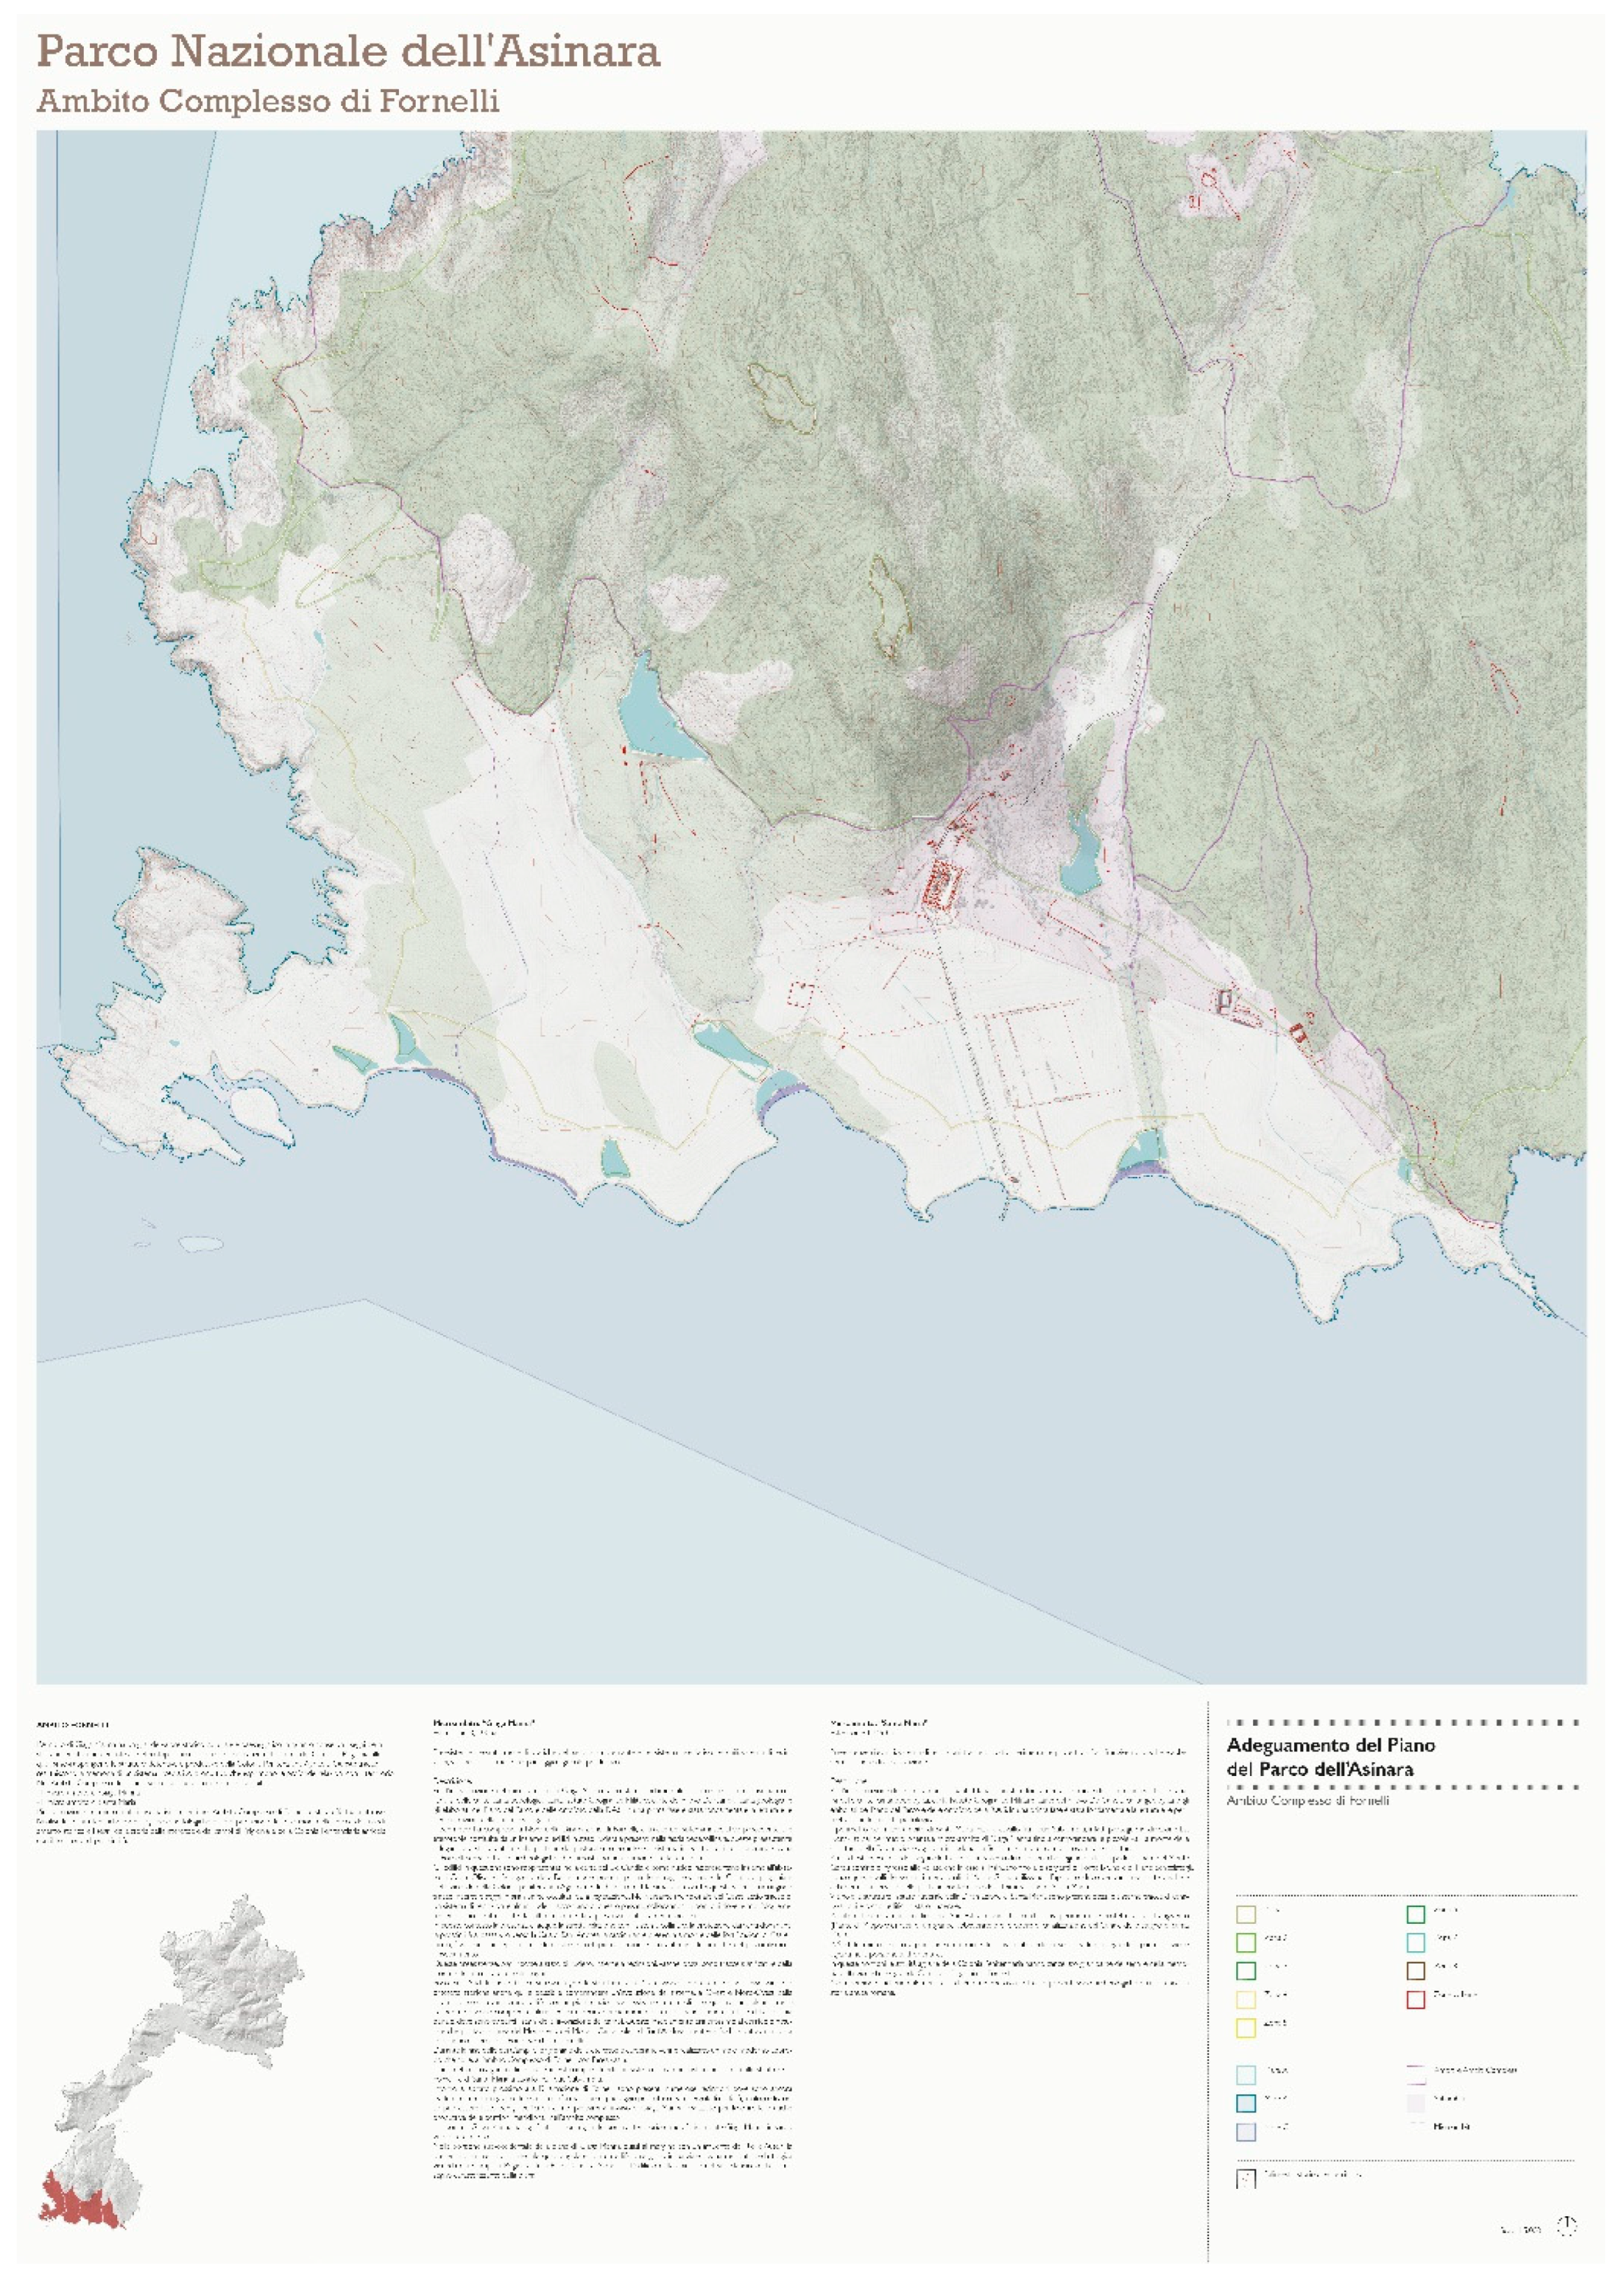
The last phase of information collection and systematization concerned the implementation of the platform of the spatial zoning used by the Park Authority to describe and regulate activities in the various areas of the Island of Asinara. It was necessary to propose a new graphic language to give these representations a semantics capable of communicating the peculiarities of the territory and the characteristics of the new regulations. Within the Illustrator software, it was possible to rework the data generated by facilitating the reading of the environmental and anthropogenic characteristics that generated the territorial scopes.
This visualization aimed to facilitate the reading of the information using a graphic code familiar to the audience with non-specialistic background. The choice was to refer to the traditional graphic languages of the cartographies inspired by the maps of the Italian Geographic Military Institute IGM (Figure 12 and Figure 13).
3. Results
The graphic products previously described made it possible to achieve two different objectives: the first was to provide the Asinara Island National Park - Marine Protected Area with a digital, dynamic and multisectoral decision-making tool; the second was to create visualizations that could best communicate to the public the park plan and its environmental and historical-cultural references.
Starting with the systematization of various types of information from twenty years of the history of the park and their implementation within a single territorial information system, it was possible to develop the basis on which to build a digital model of the island's landscape from which to derive various possible forms of visualization.
Therefore, the research has resulted in an operational workflow that proposes the construction of a single spatial model for the processing of multiple forms of visualization capable of reaching different audiences with different skills and abilities to read and understand information. The GIS system for park management, the immersive digital environment for the virtual use of the spatial device of the park, and the traditional cartography of the park plan constitute the different possible forms of visualization derived from the same geographical database.
4. Discussion
The research developed only a part of the initially hypothesized workflow. The managing authority was more interested in responding to national regulations prescribing management tools and less willing to experiment with new forms of involvement and interaction with citizens. For this reason, the part of the workflow developed was only made possible by the GIS for park management, which was, however, also exploited for the elaboration of traditional maps that are easily readable even by the non-expert public and to suggest new forms of information use such as immersive environments.
The urgency of responding to regulatory requirements overshadowed the experimental part of the communication on digital channels via the web and social media, which remained to be explored and which is configured as the most compelling part of the communication process, especially if it is connected to and based on the forms of visualization produced.
5. Conclusions
The experimentation presented in this article demonstrates that focusing on different audiences can lead to the full potential of the work required by park authorities to respond to regulatory requirements. The same information system can be used to communicate territorial information and knowledge to different audiences by calibrating the visualizations to different levels of alphabetization and different objectives, be they those of expert knowledge (GIS platform) or those of non-expert audiences, be they with a high level of digital literacy (immersive 3D virtual environments) or images using traditional graphic languages (maps). The difference in terms of the effectiveness of communication is, therefore, the ability to prefigure a valorization of the database built for purely normative purposes, the ability to manage technological tools and to hybridize different forms of visualization by crossing disciplinary traditions, approaches, tools, and techniques creatively and experimentally.
References
- Cong, G. Value Construction and Interpretation. On Cultural Heritage Conservation Based on Communication Idea. Ph.D. Thesis, Tsinghua University, Beijing, China, 2013. [Google Scholar]
- UNESCO. Convention Concerning the Protection of the World Cultural and Natural Heritage; UNESCO World Heritage Centre: Paris, France, 1972. [Google Scholar]
- Council of Europe. European Landscape Convention and Explanatory Report; Strasbourg 19 July 2000, T-LAND 2000, 6; Council of Europe: Strasbourg, France, 2000. [Google Scholar]
- ICOMOS. The ICOMOS Charter for the Interpretation and Presentation of Cultural Heritage Sites; ICOMOS International Scientific Committee on Interpretation and Presentation: Quebec, QC, Canada, 2008. [Google Scholar]
- Arler, F. A true landscape democracy. In Humans in the Land: The Ethics and Aesthetics of the Cultural Landscape; Arntzen, S., Brady, E., Eds.; Unipub Forlag: Oslo, Norway, 2008; pp. 75–99. [Google Scholar]
- Arler, F.; Mellqvist, H. Landscape democracy, three sets of values, and the connoisseur method. Environ. Values 2015, 24, pp. 271–298. [CrossRef]
- Diao, J.; Lu, S. The Culture-Oriented Urban Regeneration: Place Narrative in the Case of the Inner City of Haiyan (Zhejiang, China). Sustainability 2022, 14, 1992. [Google Scholar] [CrossRef]
- Frenchman, D. Narrative places and the new practice of urban design. In Imaging the City; Routledge: London, UK, 2021; pp. 257–282. [Google Scholar]
- Ameel, L. The Narrative Turn in Urban Planning: Plotting the Helsinki Waterfront; Routledge: London, UK, 2020. [Google Scholar]
- De Luca, L. Methods, formalisms and tools for the semantic-based surveying and representation of architectural heritage. Appl Geomat 2014, 6, pp. 115–139. [CrossRef]
- Bruno Jr, A. , & Spallone, R. Cultural heritage conservation and communication by digital modeling tools. Case studies: minor architectures of the thirties in the Turin area. ISPRS Annals of the Photogrammetry, Remote Sensing and Spatial Information Sciences 2015, 2, pp. 25-32. [CrossRef]
- Giordano, A. Mapping Venice. From visualizing Venice to visualizing cities. In Urban Design and Representation: A Multidisciplinary and Multisensory Approach. Cham: Springer International Publishing, 2017, pp. 143-151. [CrossRef]
- Fiorini, G.; Friso, I.; Balletti, C. A Geomatic Approach to the Preservation and 3D Communication of Urban Cultural Heritage for the History of the City: The Journey of Napoleon in Venice. Remote Sens. 2022, 14, 3242. [Google Scholar] [CrossRef]
- O'Neill, S. J. , & Smith, N. Climate change and visual imagery. Wiley Interdisciplinary Reviews: Climate Change 2014, 5(1), pp. 73-87. [CrossRef]
- Ghadirian, P. , & Bishop, I. D. Integration of augmented reality and GIS: A new approach to realistic landscape visualisation. Landscape and Urban Planning 2008, 86(3-4), pp. 226-232. [CrossRef]
- Sheppard, S. R. Making climate change visible: A critical role for landscape professionals. Landscape and Urban Planning 2015, 142, pp. 95-105. [CrossRef]
- Yang, B. GIS based 3-D landscape visualization for promoting citizen's awareness of coastal hazard scenarios in flood prone tourism towns. Applied Geography 2016, 76, pp. 85-97. [CrossRef]
- Hadar, L. , Orenstein, D. E., Carmel, Y., Mulder, J., Kirchhoff, A., Perevolotsky, A., & Osem, Y. Envisioning future landscapes: A data-based visualization model for ecosystems under alternative management scenarios. Landscape and Urban Planning 2021, 215, 104214. [CrossRef]
- Takacs, B. , & Goulden, M. C. Accuracy of wind farm visualisations: The effect of focal length on perceived accuracy. Environmental Impact Assessment Review 2019, 76, pp. 1-9. [CrossRef]
- Al-Kodmany, K. Using visualization techniques for enhancing public participation in planning and design: process, implementation, and evaluation. Landscape and urban planning 1999, 45(1), pp. 37-45. [CrossRef]
- Raaphorst, K. , van der Knaap, W., van den Brink, A., & Roeleveld, G. Visualization, participation and rhetoric: The discursive power of landscape design representations in participatory processes. Journal of Landscape Architecture 2019, 14(2), pp. 42-53. [CrossRef]
- Tyrväinen, L. , Gustavsson, R., Konijnendijk, C., & Ode, Å. Visualization and landscape laboratories in planning, design and management of urban woodlands. Forest policy and economics 2006, 8(8), pp. 811-823. [CrossRef]
- Karrasch, L. , Maier, M., Kleyer, M., & Klenke, T. Collaborative landscape planning: Co-design of ecosystem-based land management scenarios. Sustainability 2017, 9(9), 1668. [CrossRef]
- de Oliveira, A. R. , & Partidário, M. You see what I mean? A review of visual tools for inclusive public participation in EIA decision-making processes. Environmental Impact Assessment Review 2020, 83, 106413. [CrossRef]
- Getzner M, Färber B, Yamu C. 2D Versus 3D: The Relevance of the Mode of Presentation for the Economic Valuation of an Alpine Landscape. Sustainability 2016; 8(6):591. [CrossRef]
- Lovett, A. , Appleton, K., Warren-Kretzschmar, B., & Von Haaren, C. Using 3D visualization methods in landscape planning: An evaluation of options and practical issues. Landscape and Urban Planning 2015, 142, pp. 85-94. [CrossRef]
- Eilola, S. , Jaalama, K. , Kangassalo, P., Nummi, P., Staffans, A., & Fagerholm, N. 3D visualisations for communicative urban and landscape planning: What systematic mapping of academic literature can tell us of their potential? Landscape and Urban Planning 2023, 234, 104716. [Google Scholar] [CrossRef]
- Pettit, C. J. , Raymond, C. M., Bryan, B. A., & Lewis, H. Identifying strengths and weaknesses of landscape visualisation for effective communication of future alternatives. Landscape and Urban Planning 2011, 100(3), pp. 231-241. [CrossRef]
- Voinov, A. , Kolagani, N., McCall, M. K., Glynn, P. D., Kragt, M. E., Ostermann, F. O.,... & Ramu, P. Modelling with stakeholders–next generation. Environmental Modelling & Software 2016, 77, pp. 196-220. [CrossRef]
- Zube E., H. , Simcox D. E., Law C. S. Perceptual landscape simulations: History and prospect. In Landscape Journal 1987, 6, pp. 62-80. [CrossRef]
- Metze, T. Visualization in environmental policy and planning: A systematic review and research agenda. Journal of Environmental Policy & Planning 2020, 22(5), pp. 745-760. [CrossRef]
- Lynch, K. The Image of the City. Cambridge, MIT Press, 1960.
- Cullen, G. Townscape. London, The Architectural Press, 1961.
- Appleyard, D. , Lynch K., and Myer J. R. The View from the Road. Cambridge, Massachusetts, Massachusetts Institute of Technology, 1964.
- De Veer, A. A. , & Burrough, P. A. Physiognomic landscape mapping in the Netherlands. Landscape planning 1978, 5(1), pp. 45-62. [CrossRef]
- Sheppard, S.R.J. Visualizing climate change: A guide to visual communication of climate change and developing local solutions. Abingdon, Earthscan/Routledge, 2012.
- Tress, B. , & Tress, G. Communicating landscape development plans through scenario visualization techniques. In Landscape Interfaces: Cultural Heritage in Changing Landscapes Dordrecht: Springer Netherlands, 2003, pp, 185-219.
- Pettit, C. J. , Raymond, C. M., Bryan, B. A., & Lewis, H. Identifying strengths and weaknesses of landscape visualisation for effective communication of future alternatives. Landscape and Urban Planning 2011, 100(3), pp. 231-241. [CrossRef]
- Cronan, D. , Trammell, E. J., & Kliskey, A. Images to evoke decision-making: Building compelling representations for stakeholder-driven futures. Sustainability 2022, 14(5), 2980. [CrossRef]
- Economou, M. Heritage in the digital age. A companion to heritage studies, 2015, pp. 215-228.
- Centofanti, M. , Brusaporci, S., & Lucchese, V. Architectural heritage and 3D models. Computational Modeling of Objects Presented in Images: Fundamentals, Methods and Applications, 2014, pp. 31-49.
- Apollonio, F. I. , Gaiani, M., & Sun, Z. 3D modeling and data enrichment in digital reconstruction of architectural heritage. The International Archives of the Photogrammetry, Remote Sensing and Spatial Information Sciences 2013, 40, pp. 43-48. [CrossRef]
- Bevilacqua, M. G. , Russo, M., Giordano, A., & Spallone, R. (3D reconstruction, digital twinning, and virtual reality: Architectural heritage applications. In 2022 IEEE Conference on Virtual Reality and 3D User Interfaces Abstracts and Workshops (VRW), 2002, pp. 92-96.
- Amoroso, N. , (Ed.). Representing landscapes: Digital. London and New York, Routledge, 2015.
- Ervin Stephen, Hasbrouck Hope. Landscape modeling. Digital Technologies for Landscape Visualization. New York, McGrawHill, 2001.
- Bishop Ian, D. , Lange Eckart, (Eds.). Visualization in landscape and environmental planning. Technology and Applications. London and New York, Taylor & Francis, 2005.
- Lovett, A. A. , Appleton, K. J., & Jones, A. P. GIS-based landscape visualization: The state of the art. Representing, Modeling and Visualizing the Natural Environment: Innovations in GIS, CRC Press, Boca Raton, Florida, 2009, pp. 287-309.
- Griffon, S. , Nespoulous, A., Cheylan, J. P., Marty, P., & Auclair, D. Virtual reality for cultural landscape visualization. Virtual Reality 2011, 15, pp. 279-294. [CrossRef]
- Vetter, M. Technical potentials for the visualization in virtual reality. Modern approaches to the visualization of landscapes, Springer, 2020, pp. 307-317.
- Appleton, K. , Lovett, A., Sünnenberg, G., & Dockerty, T. Rural landscape visualisation from GIS databases: a comparison of approaches, options and problems. Computers, Environment and Urban Systems 2002, 26 (2-3), pp. 141-162. [CrossRef]
- Bishop Ian, D. 2011. Landscape planning is not a game: Should it be? Landscape and Urban Planning 2011, 100, pp. 390–392. [CrossRef]
- Swetnam, R. D. , & Korenko, J. Can computer game landscapes target new audiences for landscape quality assessment? Applied Geography 2019, 10, 2102. [Google Scholar] [CrossRef]
Figure 1.
The Asinara Island.
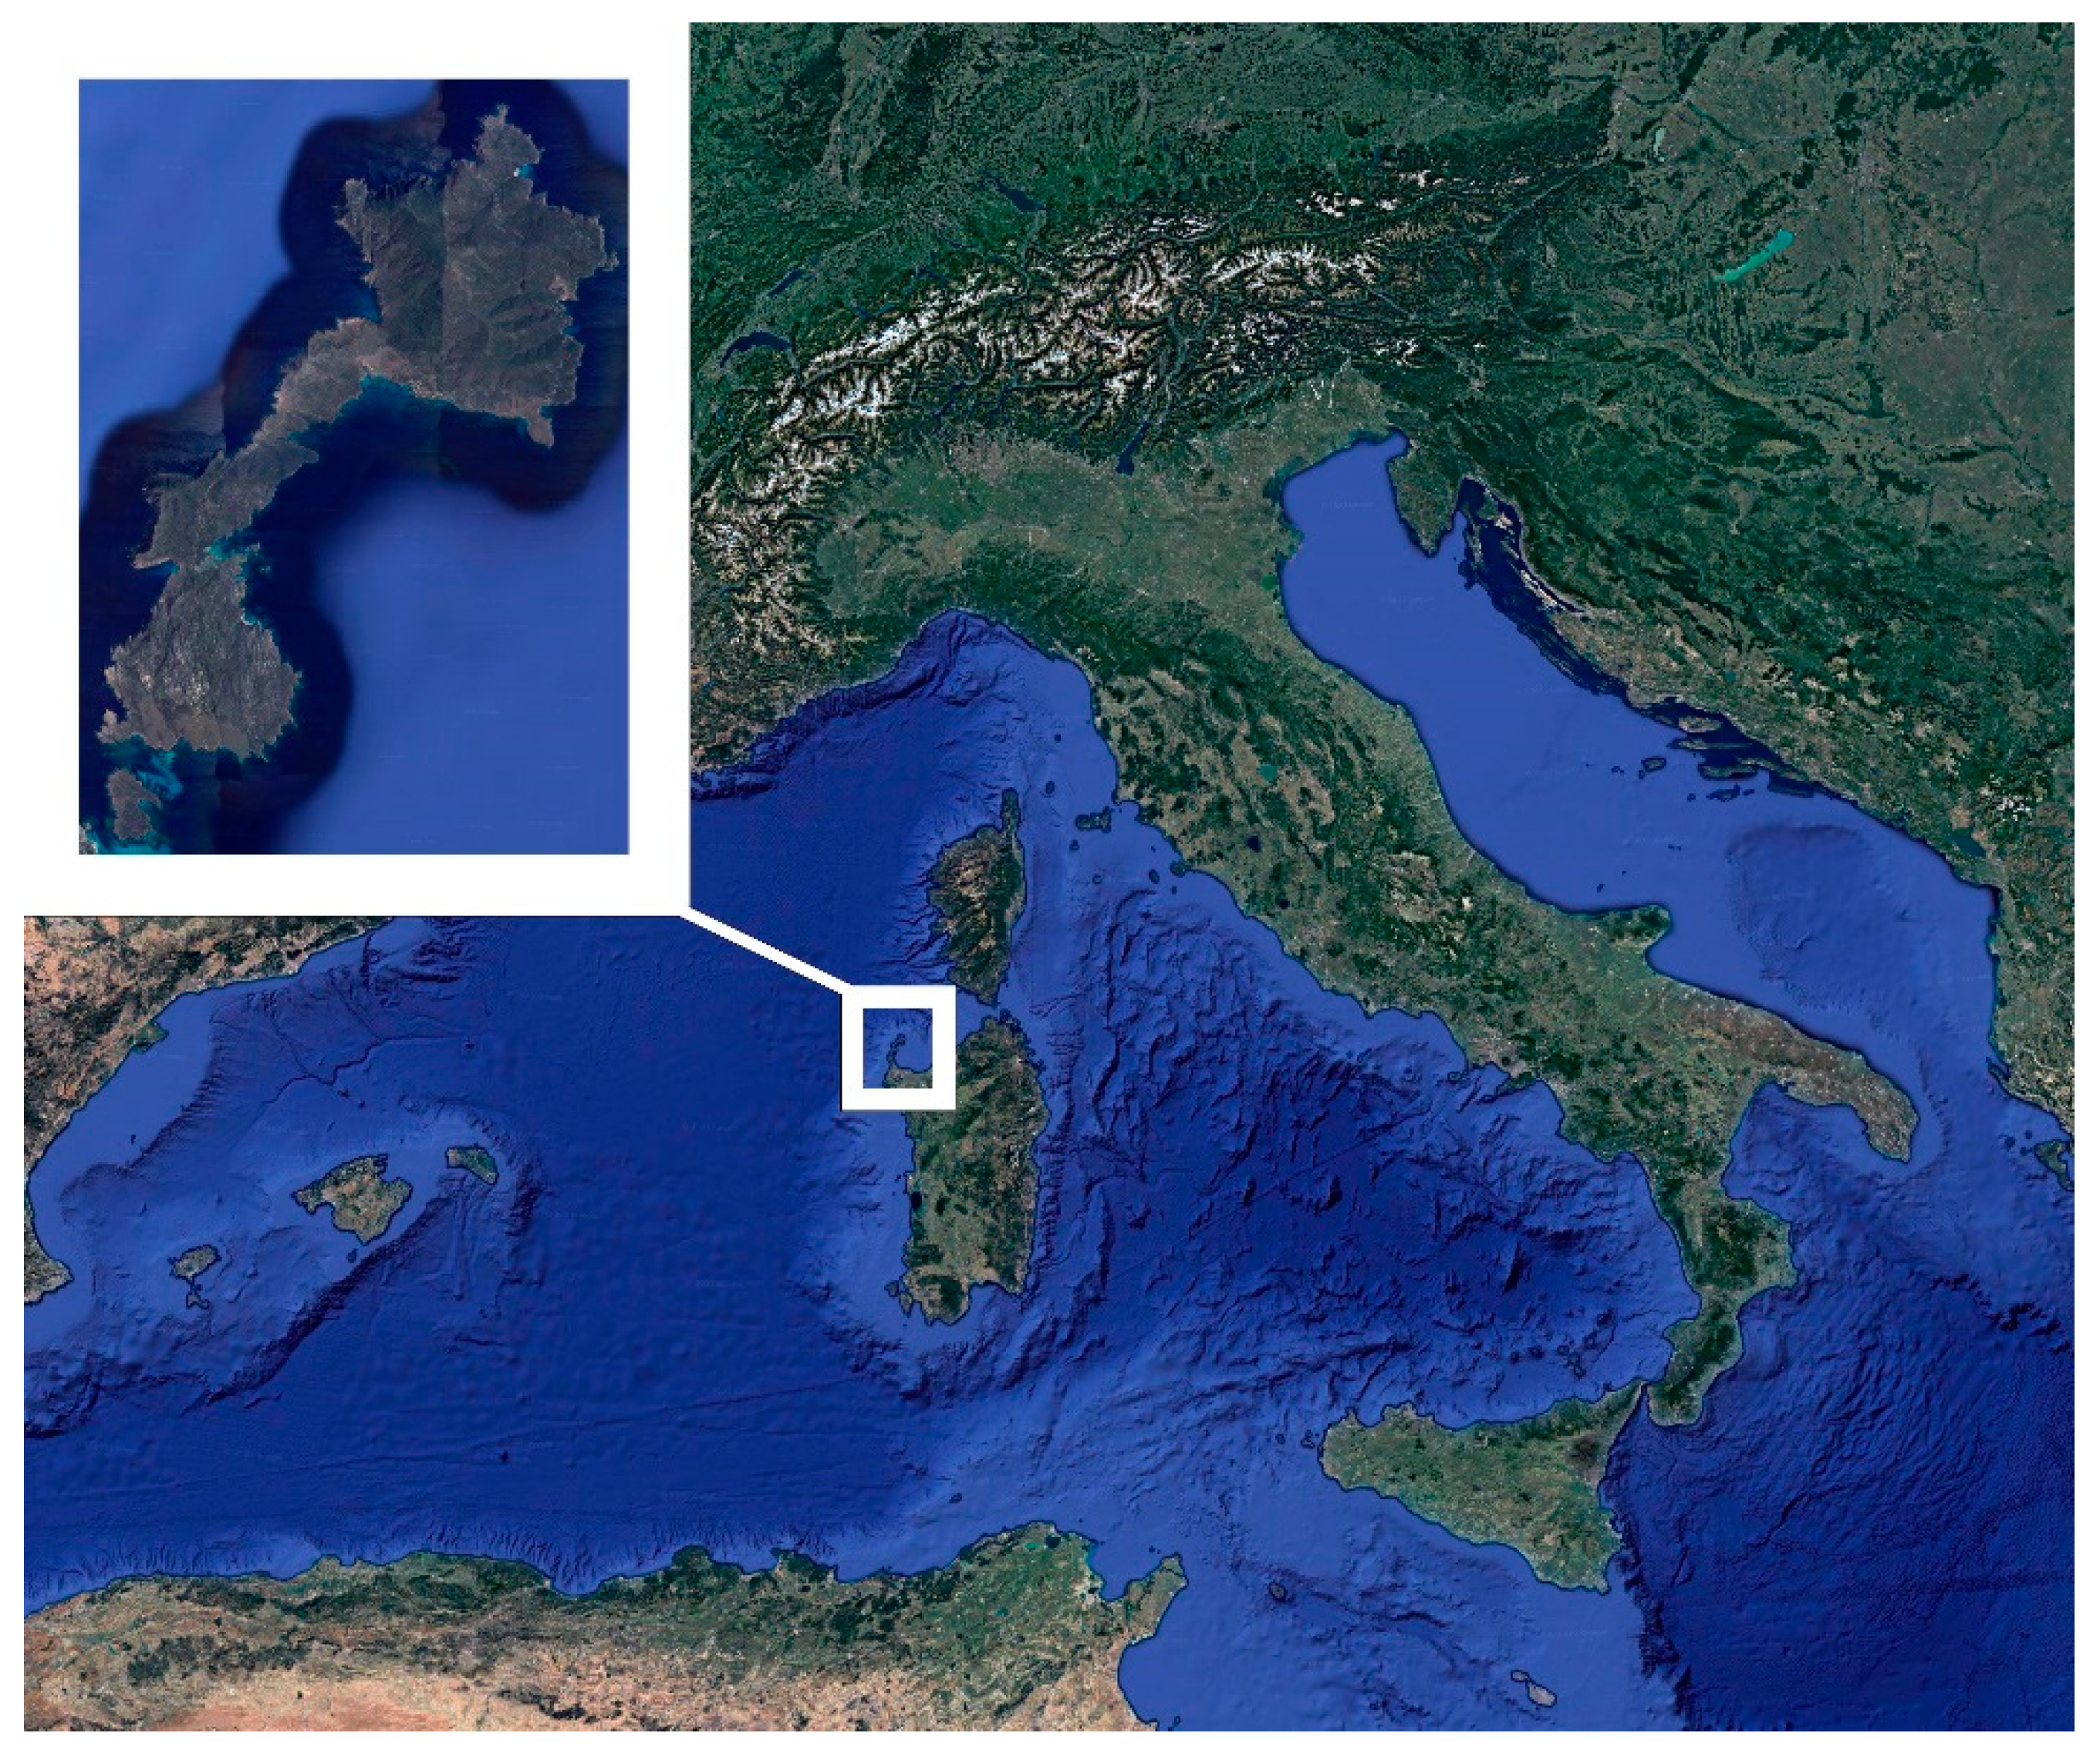
Figure 2.
Workflow diagram of the communication project of the Asinara Island Park Plan.
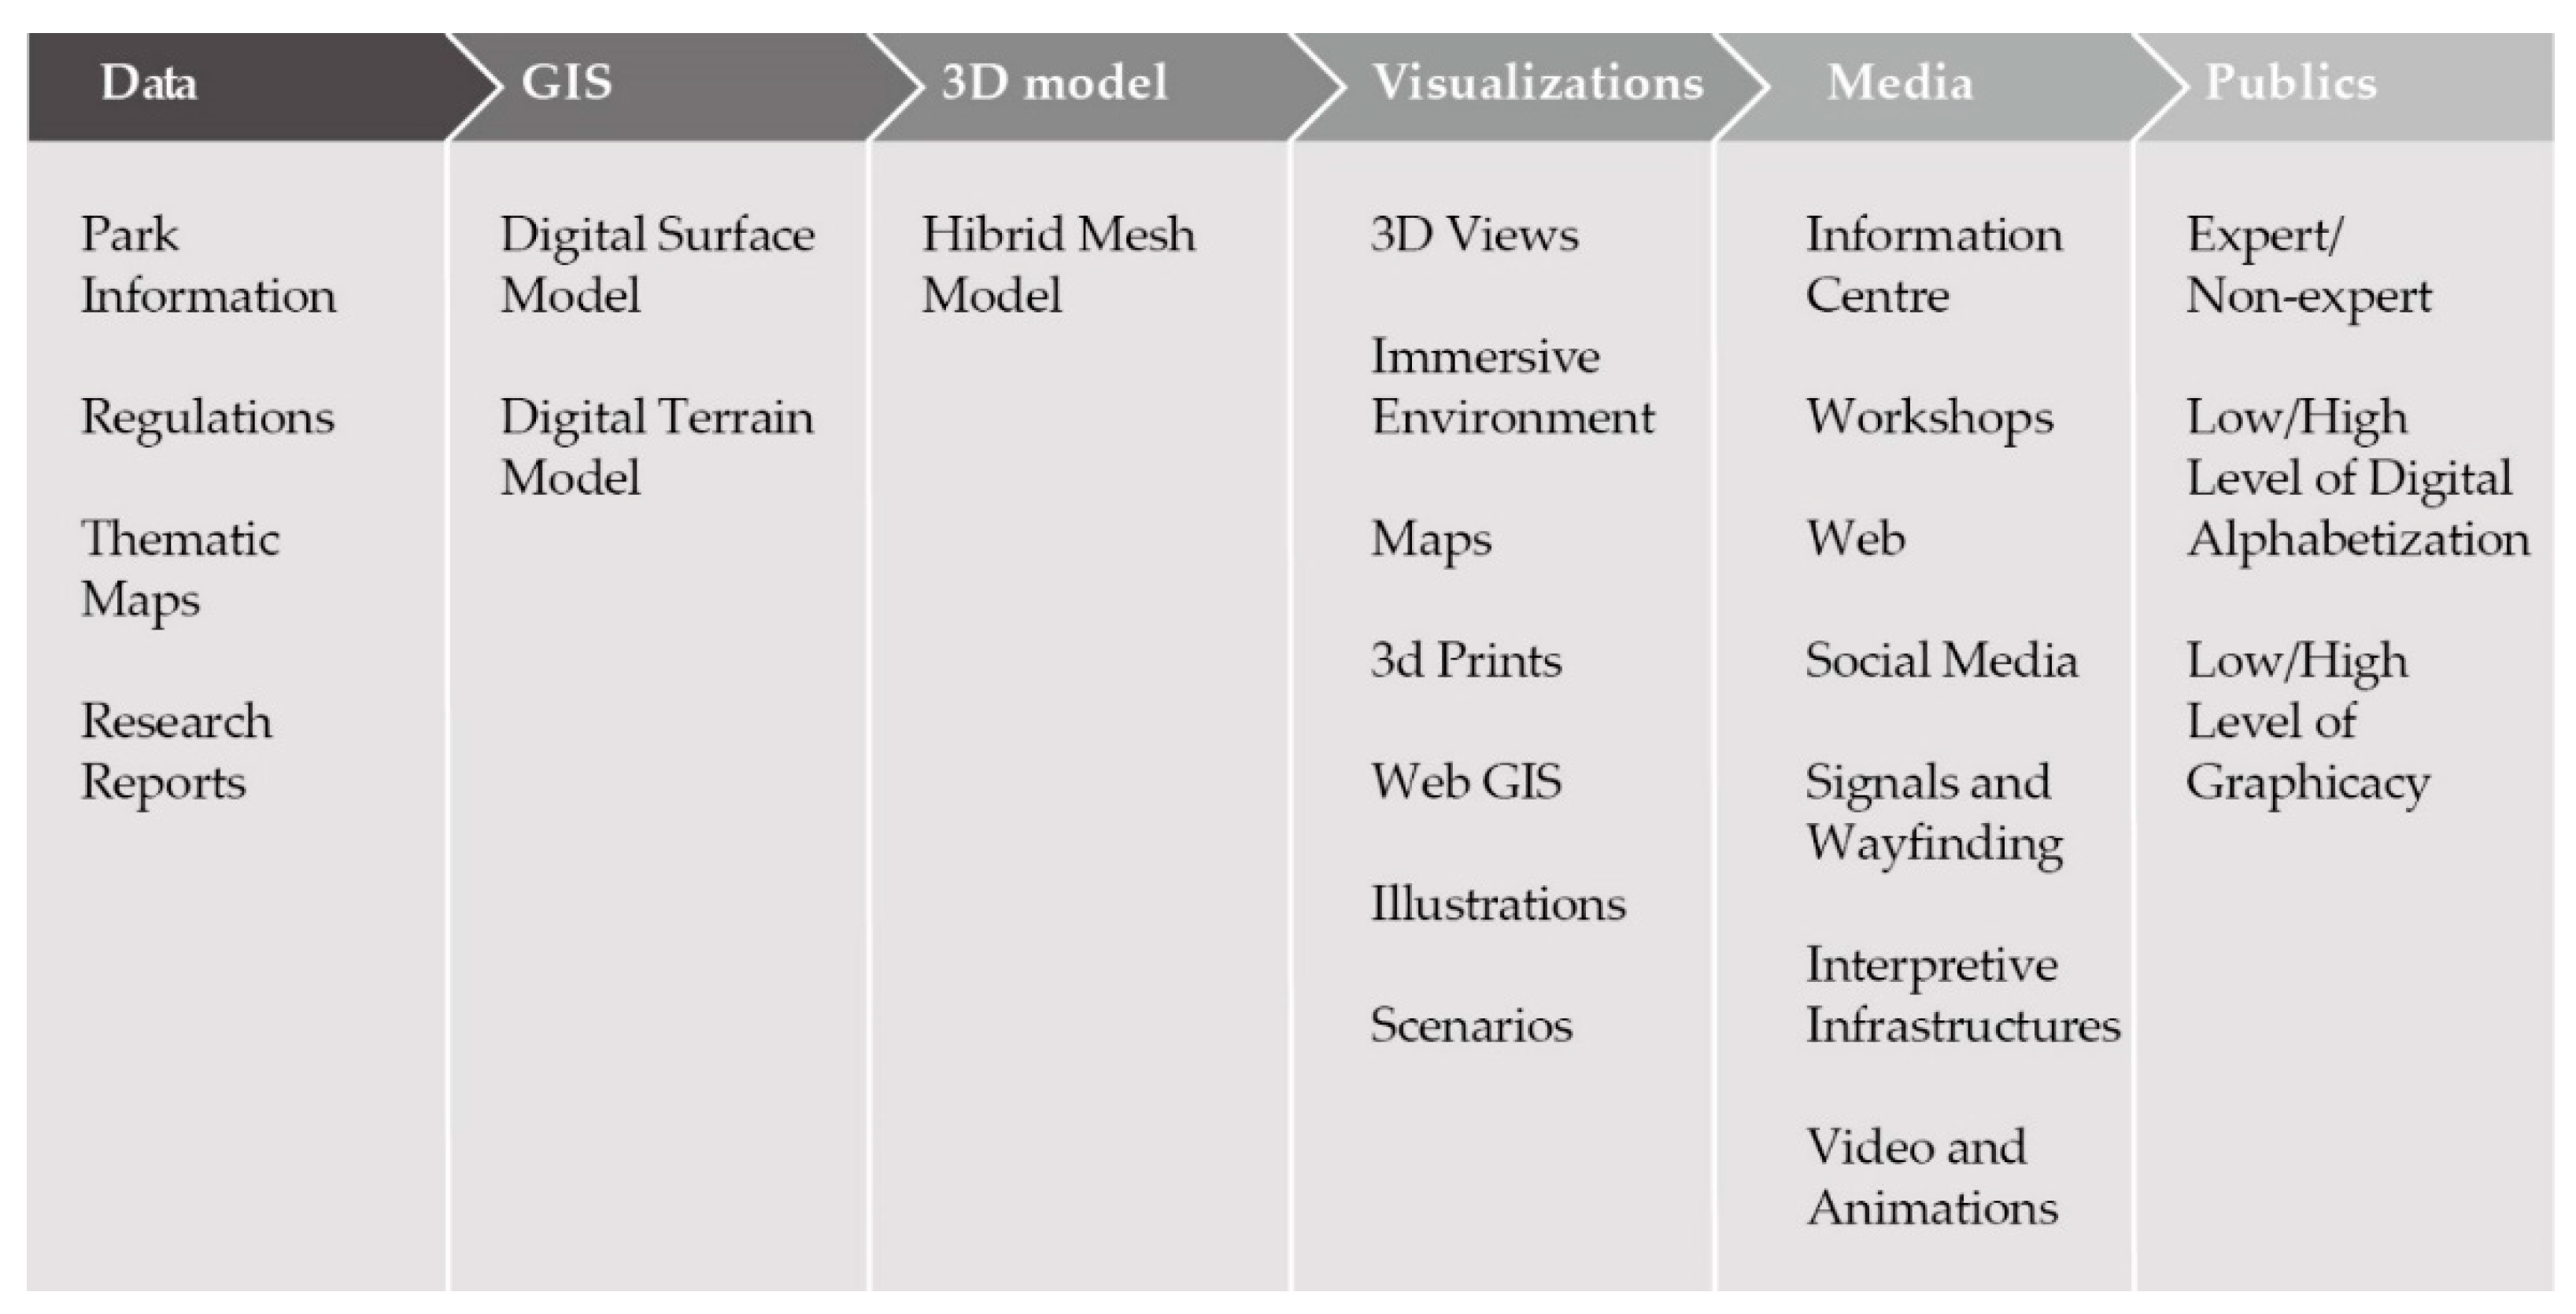
Figure 3.
Workflow diagram of the production of the visualizations starting from the GIS platform.
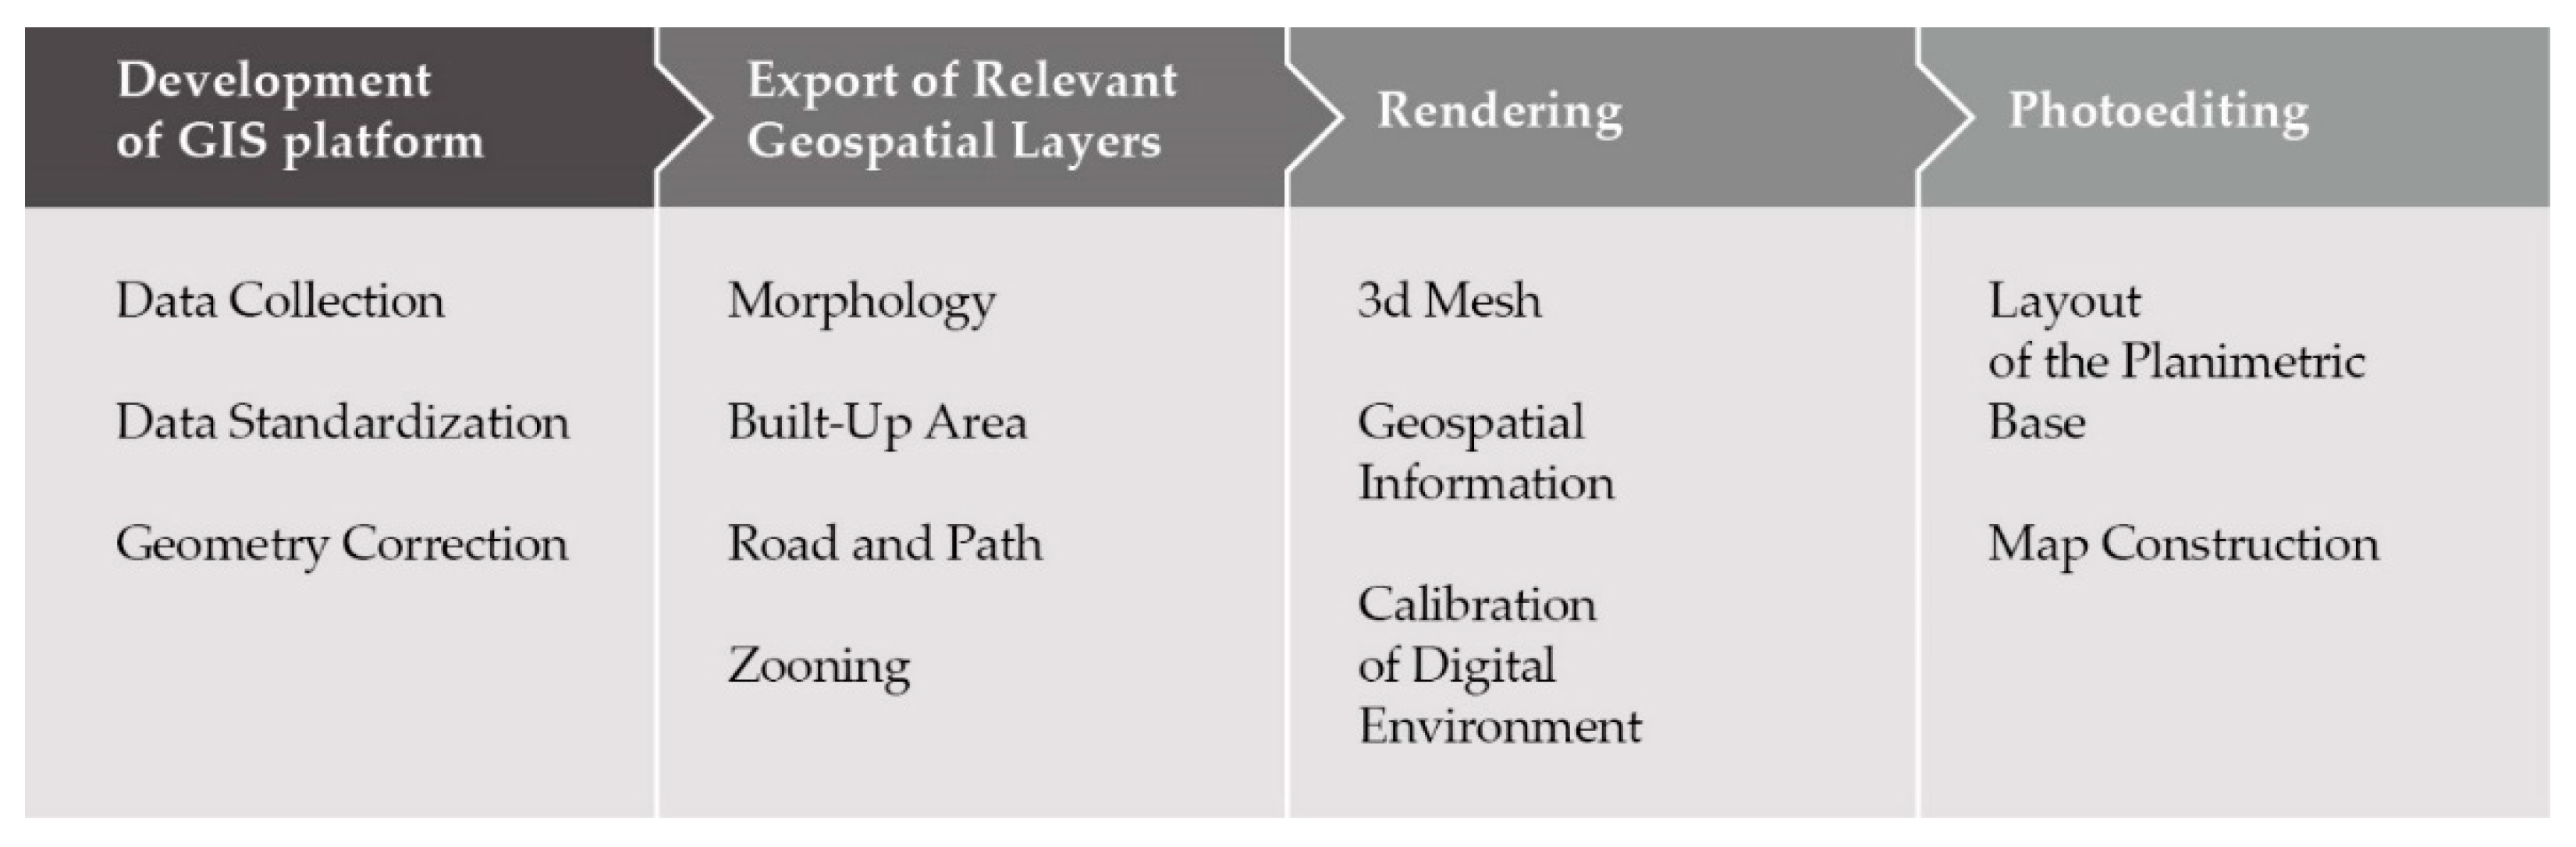
Figure 4.
GIS representation of the island of Asinara through the layers downloaded from the Regional Geoportal. Image processed by the authors.
Figure 4.
GIS representation of the island of Asinara through the layers downloaded from the Regional Geoportal. Image processed by the authors.
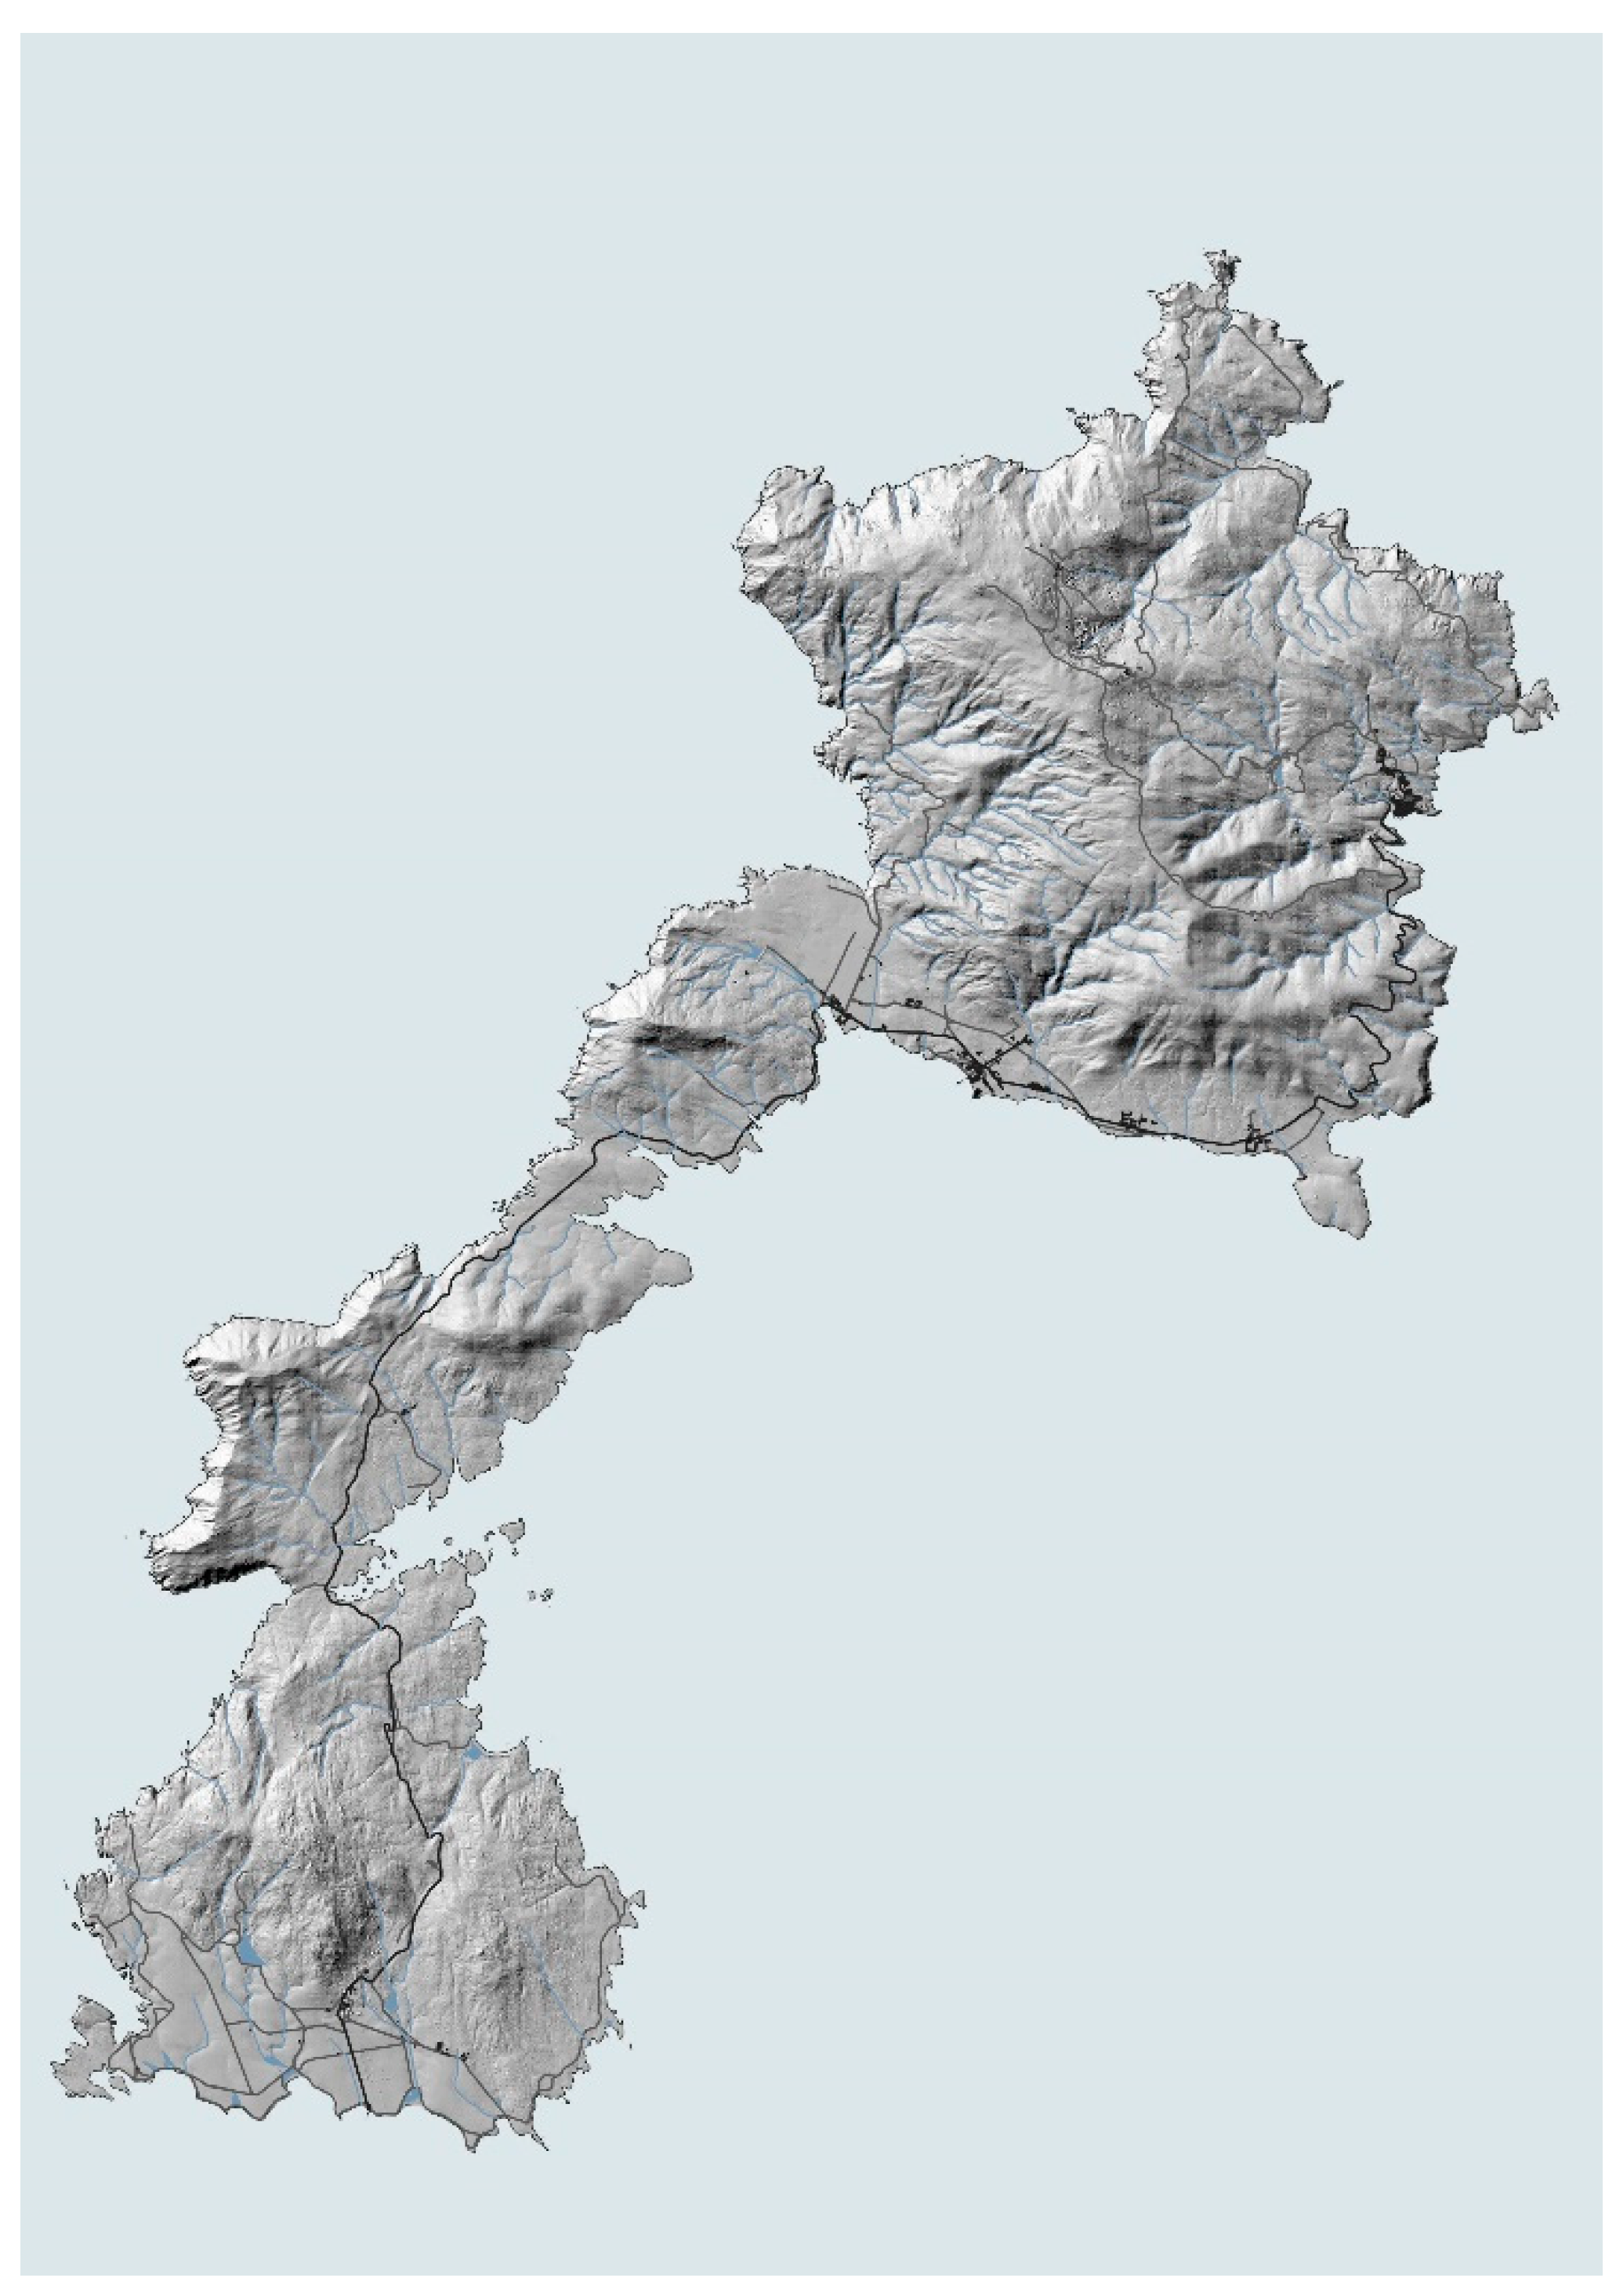
Figure 5.
GIS representation of Asinara Island through the corrected layers from the Asinara Island Park Authority. Elaborated by the authors.
Figure 5.
GIS representation of Asinara Island through the corrected layers from the Asinara Island Park Authority. Elaborated by the authors.
Figures 6 and 7. Rendered representation of the Asinara Island National Nature Park. Elaborated by the authors.
Figures 6 and 7. Rendered representation of the Asinara Island National Nature Park. Elaborated by the authors.
Figures 8, 9, 10 and 11. Visualization of plan zoning through virtual navigation of the tridimensional model. Graphic elaborations by the authors.
Figures 8, 9, 10 and 11. Visualization of plan zoning through virtual navigation of the tridimensional model. Graphic elaborations by the authors.
Figures 12 and 13. Final graphic elaboration for the representation of territorial ambits. Elaborated by the authors.
Figures 12 and 13. Final graphic elaboration for the representation of territorial ambits. Elaborated by the authors.
Disclaimer/Publisher’s Note: The statements, opinions and data contained in all publications are solely those of the individual author(s) and contributor(s) and not of MDPI and/or the editor(s). MDPI and/or the editor(s) disclaim responsibility for any injury to people or property resulting from any ideas, methods, instructions or products referred to in the content. |
© 2023 by the authors. Licensee MDPI, Basel, Switzerland. This article is an open access article distributed under the terms and conditions of the Creative Commons Attribution (CC BY) license (http://creativecommons.org/licenses/by/4.0/).
Copyright: This open access article is published under a Creative Commons CC BY 4.0 license, which permit the free download, distribution, and reuse, provided that the author and preprint are cited in any reuse.


