
Submitted:
24 October 2023
Posted:
02 November 2023
You are already at the latest version
Abstract
. Manufacturers are increasingly adopting mixed-flow manufacturing models to meet the growing customized, diverse, and dynamic customer demand. In such an environment, material distribution scheduling optimization is vital for smooth operations and is integral to production management. However, manufacturers frequently encounter problems like disordered and delayed material distribution. Traditional scheduling methods suffer from problems like inadequate transparency, delayed decision directives, and suboptimal results, impacting performance. To this end, this study proposes a dynamic material distribution scheduling optimization model and strategy based on digital twin (DT) to address these problems. Firstly, we introduce workstation satisfaction and establish a material distribution path optimization model minimizing total distribution cost while maximizing workstation satisfaction. Subsequently, we present a cloud-edge computing-based decision framework and explain the DT-based material distribution system's components and operation. Furthermore, a dynamic material distribution scheduling optimization mechanism based on DT is designed. By incorporating a savings method and incentive, penalty strategies, improvements are made to the path node selection probabilities and the information pheromone update rules of the traditional ant colony optimization (ACO) algorithm. Finally, a numerical case study, using real data from collaborating enterprises, validates the proposed algorithm and strategy. This research offers valuable insights into logistics management and algorithm design in smart manufacturing environments.
Keywords:
material distribution
; digital twin
; scheduling model
; scheduling mechanism
; improved ACO
1. Introduction
As global manufacturing continues to evolve, customer demands are becoming increasingly diverse, personalized, and dynamic. This trend presents manufacturers with significant challenges, demanding increased flexibility and sustainability in their production and logistics processes to establish a sustainable manufacturing system [1]. Today, sustainability has become the focal point of the global manufacturing industry. Manufacturers must continuously optimize their production and logistics operations to achieve economic, environmental, and social sustainability goals [2]. Material distribution scheduling plays a pivotal role in achieving a sustainable manufacturing system, directly impacting production efficiency and sustainability. The integration of sustainability principles into material distribution systems has garnered significant attention from both academia and the industry [3]. Sustainable material distribution systems emphasize the use of intelligent logistics scheduling systems developed through digital technologies. Manufacturers can efficiently meet customer demands while simultaneously enhancing production efficiency, optimizing resource utilization, reducing energy consumption, and minimizing waste generation. This not only helps manufacturers maintain their core competitiveness but also contributes to the achievement of sustainability objectives, thus propelling the manufacturing industry forward.
In response to the ever-increasing demand for personalization, diversity, and dynamism, a growing number of manufacturers are embracing a new generation of industrial internet technologies such as the Internet of Things (IoT) [4], digital twin (DT) [5], and big data (BD) [6]. These technologies are deeply integrated with the manufacturing sector, fundamentally altering the production organization of manufacturers [6]. Manufacturers are actively adopting flexible and dynamic mixed-model assembly production modes to reevaluate their current production scheduling and control strategies, aiming to maintain their core competitive advantage. However, in this production mode, traditional material distribution scheduling faces a series of problems primarily stemming from the lack of appropriate information technology and control strategies. This results in inadequate manufacturing information, imprecise decision directives, and subsequently, material distribution problems such as disorderliness, vehicle waiting times, and workstation hunger/overload, thereby prolonging the overall logistics distribution timeline. Furthermore, uncertainties during execution (e.g., new demands, and equipment failures) inevitably disrupt the distribution system, further deteriorating the performance of the logistics system. Therefore, achieving comprehensive real-time state information awareness, real-time dynamic decision-making, and control over the material distribution system is of paramount importance.
One of the most pressing challenges faced by traditional material distribution scheduling and control strategies is the difficulty in collecting and sharing real-time operational data of the logistics system [Error! Reference source not found.]. The IoT technology has transformed traditional manufacturing resources, granting them the capabilities of identification, perception, and communication, thus rendering real-time information visibility achievable. Recent efforts have seen the development of an information-sharing model based on DT to facilitate real-time information exchange between production and logistics processes [7].
While real-time information visibility technologies are lauded for enhancing the transparency of manufacturing systems, they alone cannot achieve dynamic material distribution scheduling and control. Therefore, innovative methods are required to incorporate real-time information visibility into dynamic decision-making for dynamic material distribution to take place. Pioneering research has begun to explore DT-driven real-time information-driven dynamic distribution scheduling optimization and recognized the potential advantages of DT-driven dynamic decision-making [7,17], yet there has been limited exploration of its theoretical foundation. Therefore, the following problems need further investigation to better achieve dynamic material distribution scheduling optimization:
First, previous material distribution scheduling optimization models considered fixed departure costs and variable travel costs for material distribution scheduling, while overlooking workstation satisfaction as a core factor. Hence, a more comprehensive consideration of workstation satisfaction and the construction of a more reasonable material distribution scheduling optimization model require further research.
Second, the real-time and comprehensive collection of heterogeneous data related to the material distribution system and the establishment of multiscale twin models supporting distribution scheduling decisions are of utmost importance. Without real-time data and twin model support, precise dynamic decisions cannot be made.
Third, the speed, quality, and stability of intelligent algorithms in traditional material distribution scheduling systems still require improvement. Therefore, the improvement of existing intelligent optimization algorithms to enhance the quality, speed, and stability of problem solving is essential.
The above problems have motivated this study, where we propose a material distribution scheduling optimization method based on DT to address these challenges. This dynamic material distribution scheduling optimization is achieved through emerging Industry 4.0 technologies and innovative management concepts. Firstly, we consider workstation satisfaction in the material distribution scheduling optimization model. The model accurately reflects the degree of workstation satisfaction. Secondly, based on the DT standard architecture, we further design a DT-based material distribution scheduling optimization decision framework and dynamic scheduling optimization strategy, achieving intelligent and adaptive scheduling in complex and dynamic environments. Additionally, the proposed ant colony algorithm is an improved version. Compared to the existing traditional ant colony optimization (ACO), improvements have been made in the algorithm, specifically in the path node selection probabilities and information pheromone update rules, enhancing the quality and speed of optimal solution finding. The effectiveness of the proposed model and strategy is validated using real data from collaborating assembly manufacturers.
The rest of this paper is organized as follows: Section 2 introduces the related work on enabling technologies for production logistics management and material distribution scheduling models and algorithms. Section 3 describes the problem under consideration and the corresponding material distribution scheduling models. Section 4 presents the proposed solutions, including a DT-based material distribution scheduling optimization decision framework, the composition and operation mechanism of the DT-based material distribution system, a DT-based dynamic material distribution scheduling optimization strategy, and an improved intelligent scheduling optimization algorithm. Section 5 provides a numerical case study to validate the proposed methods. Finally, Section 6 offers the main conclusions and limitations of this research.
2. Literature Review
This section provides a review of the relevant work, primarily encompassing enabling technologies in production logistics management, material distribution scheduling optimization problems, and related algorithms.
With the advancement of industrial internet technologies, the role of the IoT and DT in intelligent production logistics management continues to grow [5]. By connecting various IoT devices to physical resources, and creating smart objects with sensing, positioning, and communication capabilities, inter-object communication and data exchange have become possible, offering new opportunities for production logistics management [10]. For example, Li et al. [11] proposed an intelligent logistics management system based on IoT technology, offering significant advantages in addressing the complexity, inefficiency, and chaotic vehicle management that plague logistics enterprises. Lei et al. [12] introduced an IoT-based intelligent distribution model, tackling the issue of logistics decision-making time and speed within a large-scale information interaction environment. Qing et al. [13] developed an IoT-based emergency logistics vehicle scheduling model, addressing vehicle scheduling problems in post-disaster emergency logistics. Ren and associates [14] established an IoT-based recycling logistics information management system, resolving integrated management and operational control problems in recycling logistics.
Concurrently, Digital Twins, as an effective control method, are utilized to address planning and scheduling optimization problems in manufacturing enterprises under dynamic disturbances. Wang et al. [15] have developed a material distribution system based on digital twin technology to optimize in-factory material distribution decisions. Fang et al. [16] introduced an innovative job shop scheduling method based on digital twins to reduce scheduling deviations. Zhang et al. [17] introduced an optimal control approach based on DT to tackle real-time objective formulation and optimal execution control in a collaborative production operation system.
Material distribution scheduling optimization is a significant concern in production logistics management, as it directly impacts the operational costs and service levels of the production logistics system [18]22. Typically, this problem involves finding the optimal vehicle routing plan that satisfies customer demands and optimizes the objective function under given material distribution network and constraints [20]. Depending on complexity and practical characteristics, this problem can be categorized into different types, such as the vehicle routing problem (VRP), the VRP with time windows, and the pickup and delivery VRP with Time Windows [Error! Reference source not found.]. For instance, Klenk et al. [21] addressed real-time material distribution needs for multiple assembly workstations, introducing a multi-frequency, small-batch milk-run material transport scheduling model to cope with optimization problems under dynamic disturbances. Further onwards, Klenk et al. [22] designed three decision strategies to determine real-time, optimal milk-run material distribution cycles based on fluctuations in order quantities. To solve these optimization problems, various intelligent algorithms have emerged, such as particle swarm optimization, simulated annealing, and ant colony algorithms, each with their advantages in different application scenarios. Tao et al. [23] improved the particle swarm optimization algorithm for solving AGV path planning problems on the shop floor production line. Wang et al. [24] introduced a self-adaptive non-dominated sorting genetic algorithm II (SNSGA-II) to address path optimization problems with combined pickup and delivery. Chen et al. [25] proposed an enhanced ant colony hybrid algorithm, improving path search accuracy and reducing the frequency of path selection decisions.
In summary, the literature review reveals several key problems. Firstly, material distribution models often overlook workstation satisfaction. Secondly, most material distribution problems focus on static distribution planning within workshops, with relatively limited research on dynamic material distribution scheduling optimization based on DT. This includes a lack of a unified DT-based scheduling decision framework incorporating various scheduling rules and its operational mechanism, as well as room for improvement in the quality and speed of material distribution scheduling solutions produced by traditional ant colony algorithms. Therefore, this study introduces a dynamic material distribution scheduling optimization model, strategy, and related algorithms based on DT.
3. Problem Analysis and Description
3.1. Material Distribution Operational Process and Operational Problems
3.1.1. Material Distribution Operational Process
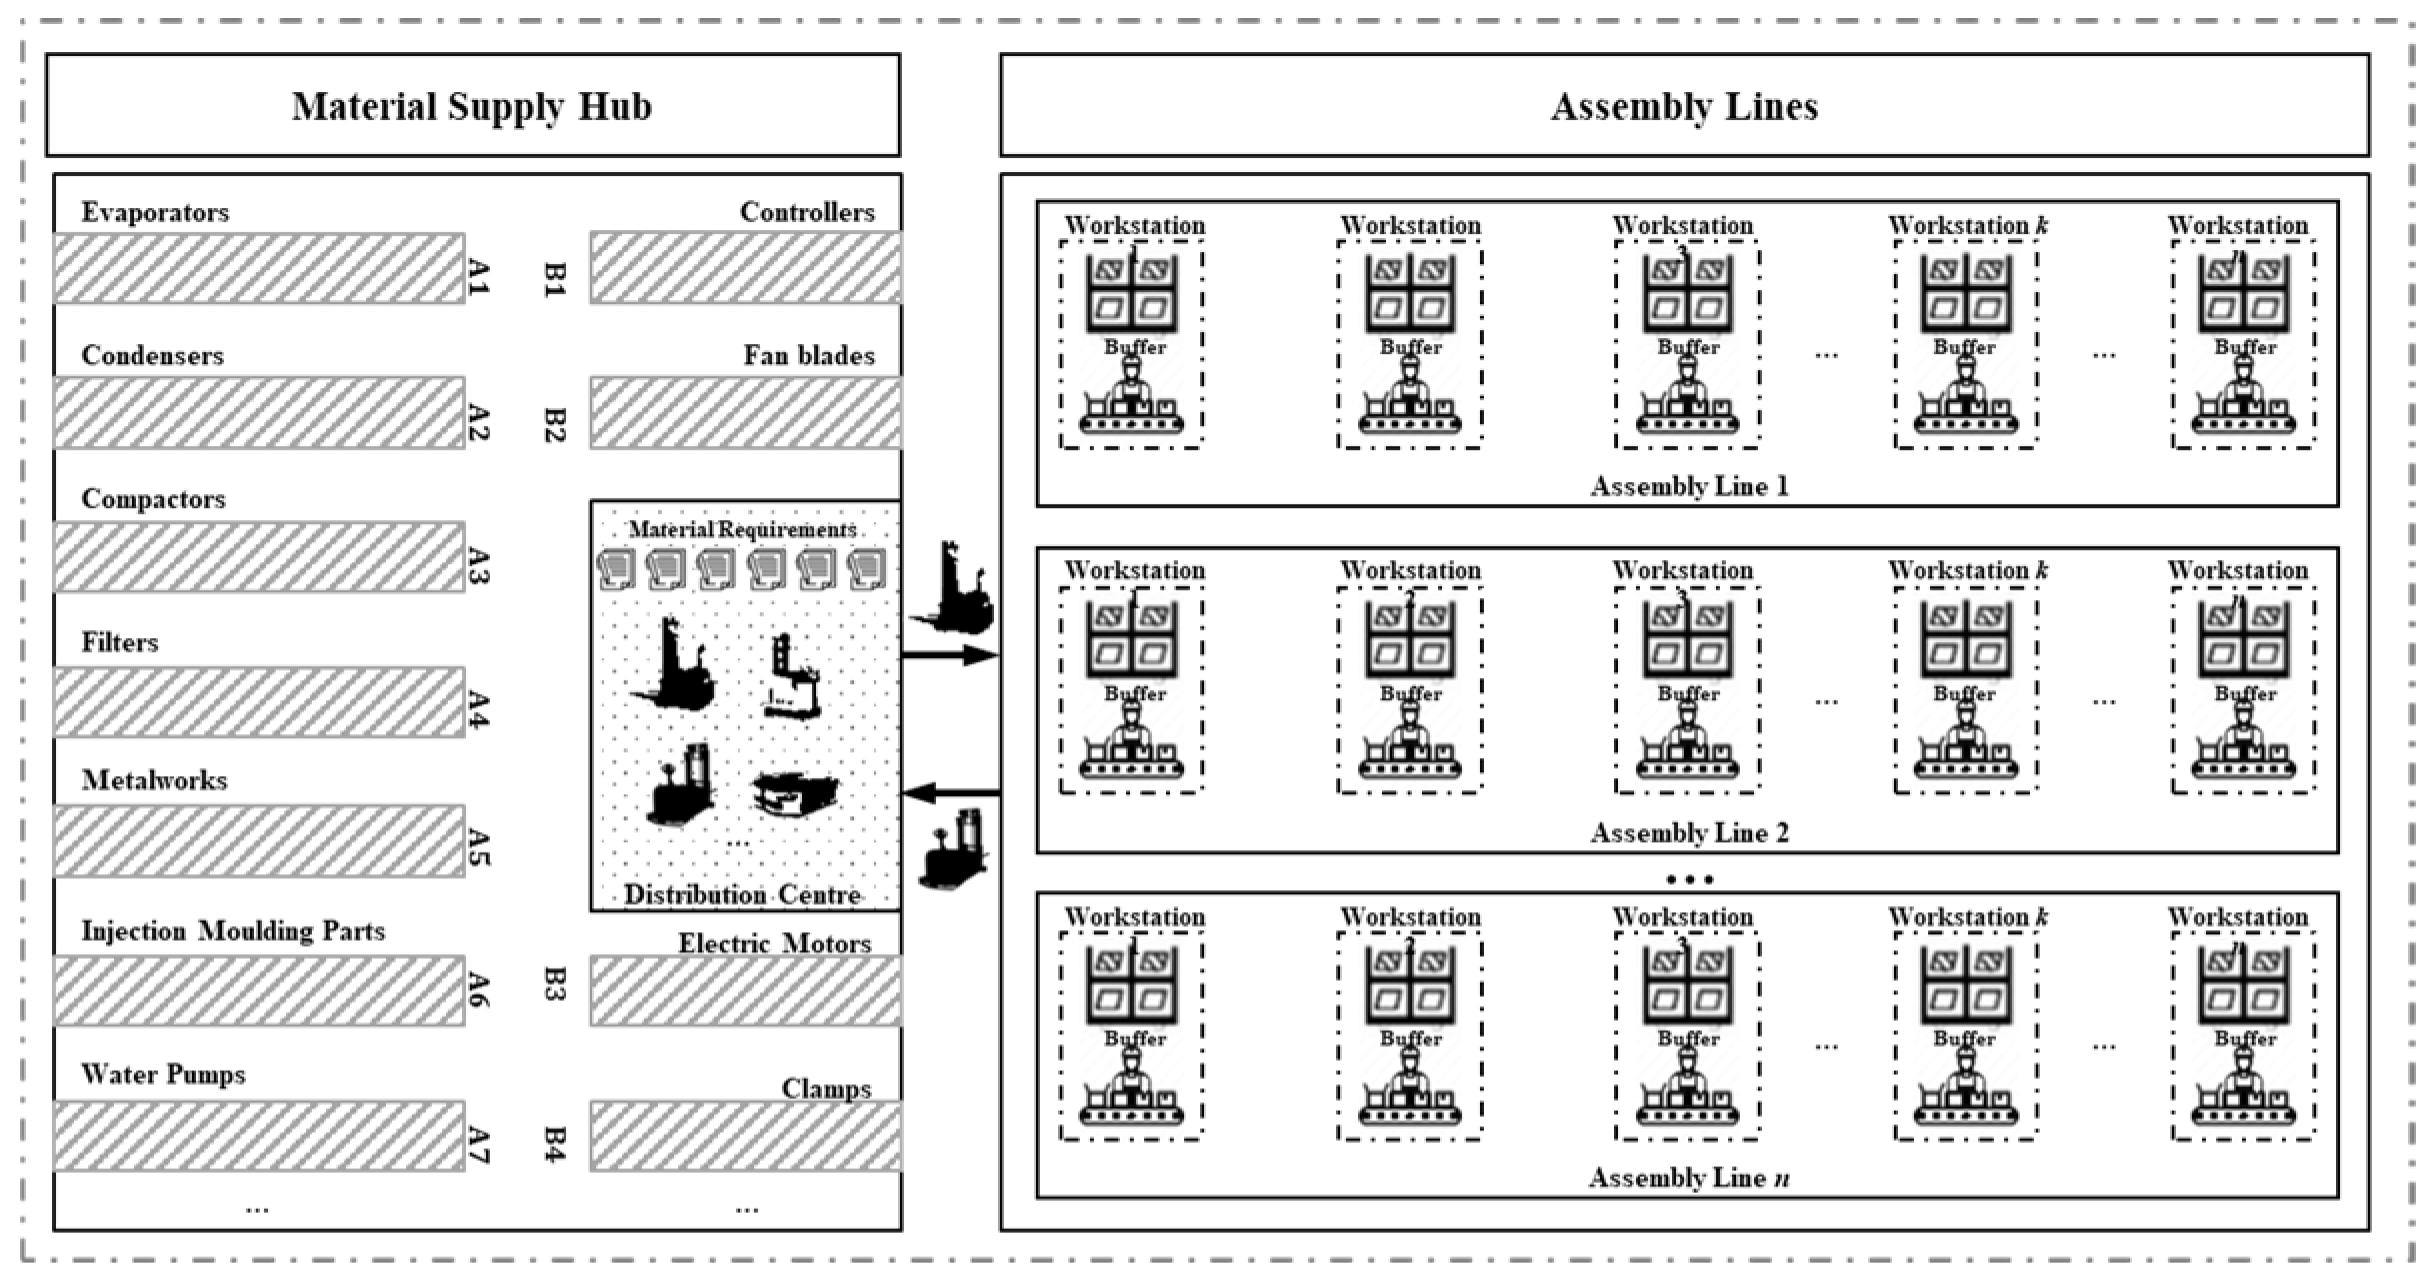
This work was motivated by collaboration with a well-known home appliance company. The company manufactures hundreds of different products, each with varying order quantities. Different product categories may have distinct production processes. To meet the demand for high product variety and small batch production, they have implemented a mixed-model production approach in the air conditioning final assembly workshop. Currently, the company’s workshop is gradually transitioning to smart manufacturing and has deployed automated guided vehicles (AGVs) in the assembly workshop to handle material transport and distribution tasks within the assembly line workstations. These AGVs are coordinated by an automatic guidance system for the material distribution across the assembly lines.
The study focuses on the dynamic material distribution scheduling optimization within the mixed-model assembly workshop. As illustrated in Figure 1, the principle of material demand-driven distribution involves workstations continuously consuming materials from their workstation buffer areas. When the inventory level drops below a trigger reorder threshold, material replenishment orders are generated and sent to the material distribution system. Within each specific production cycle, the material distribution system aggregates material demands from each workstation buffer area, creating a material distribution task list. These tasks are then grouped into a material distribution batch order and sent to the material supply center to arrange available logistics resources for the required distribution tasks. Consequently, the material distribution process can be divided into two main phases:
Planning Phase. The production planning department generates daily production distribution schedules and daily material demand order lists based on customer orders and scheduling rules. These schedules and order lists are transmitted to the material distribution management department through the material distribution system. The material distribution management department, based on this timetable and material demand order list, allocates distribution demand orders among available logistics resources (e.g., AGVs) to formulate the daily material distribution plan to ensure the timely distribution of required materials.
Execution Phase. On the day of execution, the material distribution management department assigns AGVs to carry out pre-allocated tasks and routes according to the established material distribution plan. AGVs travel to the warehouse of the material supply center to retrieve various required materials and deliver them to the workstation buffer areas. After completing the designated distribution orders, AGVs return to the warehouse of the material supply center.
The Materials and Methods should be described with sufficient details to allow others to replicate and build on the published results. Please note that the publication of your manuscript implicates that you must make all materials, data, computer code, and protocols associated with the publication available to readers. Please disclose at the submission stage any restrictions on the availability of materials or information. New methods and protocols should be described in detail while well-established methods can be briefly described and appropriately cited.
Figure 1.
Material distribution operation process.
3.1.2. Analysis of Material Distribution Operation Problems
Through the analysis of the operational processes described above, we can draw the following conclusions: in the mixed-model manufacturing mode, due to the diversity and complexity of materials, efficient, accurate, and timely material distribution is required in the workshop. However, the material distribution process is often influenced by dynamic factors such as demand, resources, and processes, which can lead to inadequate coordination between material distribution and assembly production. Through the investigation of mixed flow assembly shop (MFAS), we have identified the following research questions:
- Optimizing workstation material distribution presents certain difficulties. Handling various types and quantities of materials with limited logistics resources, without adequately considering the impact of production speed on material distribution, results in inefficient material distribution and increased costs. Additionally, with limited buffer capacity, there is a need for frequent, appropriately sized material replenishments. However, traditional material distribution strategies rely on manual experience, lacking scientific planning, often leading to early deliveries causing material accumulation, or late deliveries causing assembly line downtime, thereby reducing workstation satisfaction;
- Manufacturing companies face the challenge of comprehensive information acquisition. Due to the variety of products, material distribution becomes complex. Achieving precise and efficient material distribution requires advanced information technology support. However, the current level of enterprise informatization is relatively low, capable of collecting only certain key performance indicators of the material distribution system, but unable to acquire real-time comprehensive operational status information required for the material distribution system. Lack of transparency in production logistics information within the workshop and inefficient information transmission pose challenges to material distribution scheduling optimization;
- Designing effective dynamic distribution scheduling optimization strategies presents a challenge. Traditional material distribution schedules are typically based on static planning, without considering disruptive factors during the execution of production logistics. However, unexpected dynamic changes often occur during execution. The absence of real-time information-driven material distribution scheduling optimization strategies to effectively address these disruptions results in significant deviations between on-site execution and planned expectations, presenting a significant challenge to management.
3.2. Material Distribution Scheduling Optimization Problem Description
The scenario consists of a logistics transportation system comprising K AGVs, each capable of material distribution for N workstations on multiple assembly lines. The maximum carrying capacity of each AGV is denoted as Q, covering a range of materials, including evaporators, controllers, sheet metal parts, and both in-house and outsourced components. Since each workstation has specific time window requirements for materials, the material distribution scheduling optimization problem can be categorized as the vehicle routing problem with time windows (VRPTW). In this problem, the concept of soft time windows is introduced, incurring a penalty cost if the soft time window is exceeded.
Specifically, the problem can be summarized as follows: AGVs depart from the distribution center, deliver loaded materials to the workstation buffer areas on the assembly lines, and return to the distribution center. The material load of each AGV must not exceed its maximum carrying capacity while adhering to other constraints. The objective is to deliver materials to the workstations within soft time windows while ensuring delivery completion within hard time windows. The ultimate goal of the entire process is to minimize the number of AGVs and path lengths required for material distribution while reducing workstation dissatisfaction, thus minimizing the total material distribution cost, with the constraint of finite AGV resources. Initially, all AGVs are available for use. However, during the execution of distribution, dynamic disruptions such as rush orders and vehicle breakdowns are encountered, necessitating adjustments to the distribution plan based on the actual circumstances to achieve optimal material distribution performance. Furthermore, DT-based material distribution scheduling must meet the following requirements:
- Each workstation buffer area can only be serviced by a single AGV;
- Each AGV can serve multiple workstation buffer areas;
- All AGVs have the same priority and cannot be interrupted once they start serving a workstation buffer area unless there is a vehicle breakdown;
- The distribution capacity on each distribution path does not exceed the AGV’s maximum payload;
- Both the starting and ending points of AGVs are at the distribution center (material storage area), and AGVs travel along the planned path at a fixed speed.
Research manuscripts reporting large datasets that are deposited in a publicly available database should specify where the data have been deposited and provide the relevant accession numbers. If the accession numbers have not yet been obtained at the time of submission, please state that they will be provided during review. They must be provided prior to publication.
3.3. Formulation of Material Distribution Scheduling Optimization Problem
According to the description provided above, the relevant symbol definitions for the problem model under consideration are presented in Table 1.

Table 1.
Symbols used in the proposed model.
| Symbol | Description |
|---|---|
| The set of points representing workstation buffer areas, including N workstations and a material distribution center (0), | |
| The number of distribution AGVs, | |
| Q | Maximum load capacity of each AGV |
| F | A very large positive number |
| Distance from station to station | |
| Quantity of materials required at workstation with | |
| The earliest time materials are required at workstation | |
| The latest time materials are required at workstation | |
| Penalty cost per unit time for early arrival of materials at workstation | |
| Transport cost per unit distance for distribution AGVs | |
| Fixed start-up cost for each distribution AGV | |
| Penalty cost per unit of time for material delivered earlier than the time window | |
| Penalty cost per unit of time for material delivered later than the time window | |
| Travel time for a distribution AGV to move from workstation to | |
| Unloading time of the kth distribution AGV at workstation | |
| Moment of the arrival of the kth distribution AGV at workstation i | |
| Workstation i is serviced by the kth AGV is 1, otherwise 0 | |
| The kth distribution AGV traveling from workstation to workstation is 1, otherwise 0 |
The mathematical model for the research problem considered in this paper is represented as follows:
Equation (1) represents the three objective functions of the material distribution scheduling optimization problem; Equation (2) minimizes the number of distribution vehicles used; Equation (3) minimizes the length of distribution vehicle routes; Equation (4) maximizes workstation satisfaction, i.e., minimizes the penalty cost for delayed vehicle arrivals; Equation (5) ensures that each distribution vehicle’s load does not exceed its maximum capacity; Equation (6) specifies that each workstation can only be serviced by one distribution vehicle; Equation (7) ensures that distribution vehicles start from the distribution center, complete their deliveries, and return to the distribution center; Equation (8) dictates that distribution vehicle k must arrive at workstation j after time ; Equation (9) enforces time window constraints, incurring penalty costs if materials are delivered outside the specified time window.
The mathematical model constructed above is a multi-objective optimization model. Considering that the ultimate goal of material distribution scheduling optimization is to reduce distribution costs, the three objective functions are transformed into a single objective function using a weighted standardization method. This single objective function minimizes the total operational cost, which includes minimizing the fixed costs of distribution vehicles, minimizing the transportation costs of distribution vehicles, and minimizing the penalty costs associated with workstation time windows. The transformed objective function is represented by Equation (10).
4. Proposed Methodology
4.1. DT-Based Decision-Making Architecture for Material Distribution Scheduling Optimization
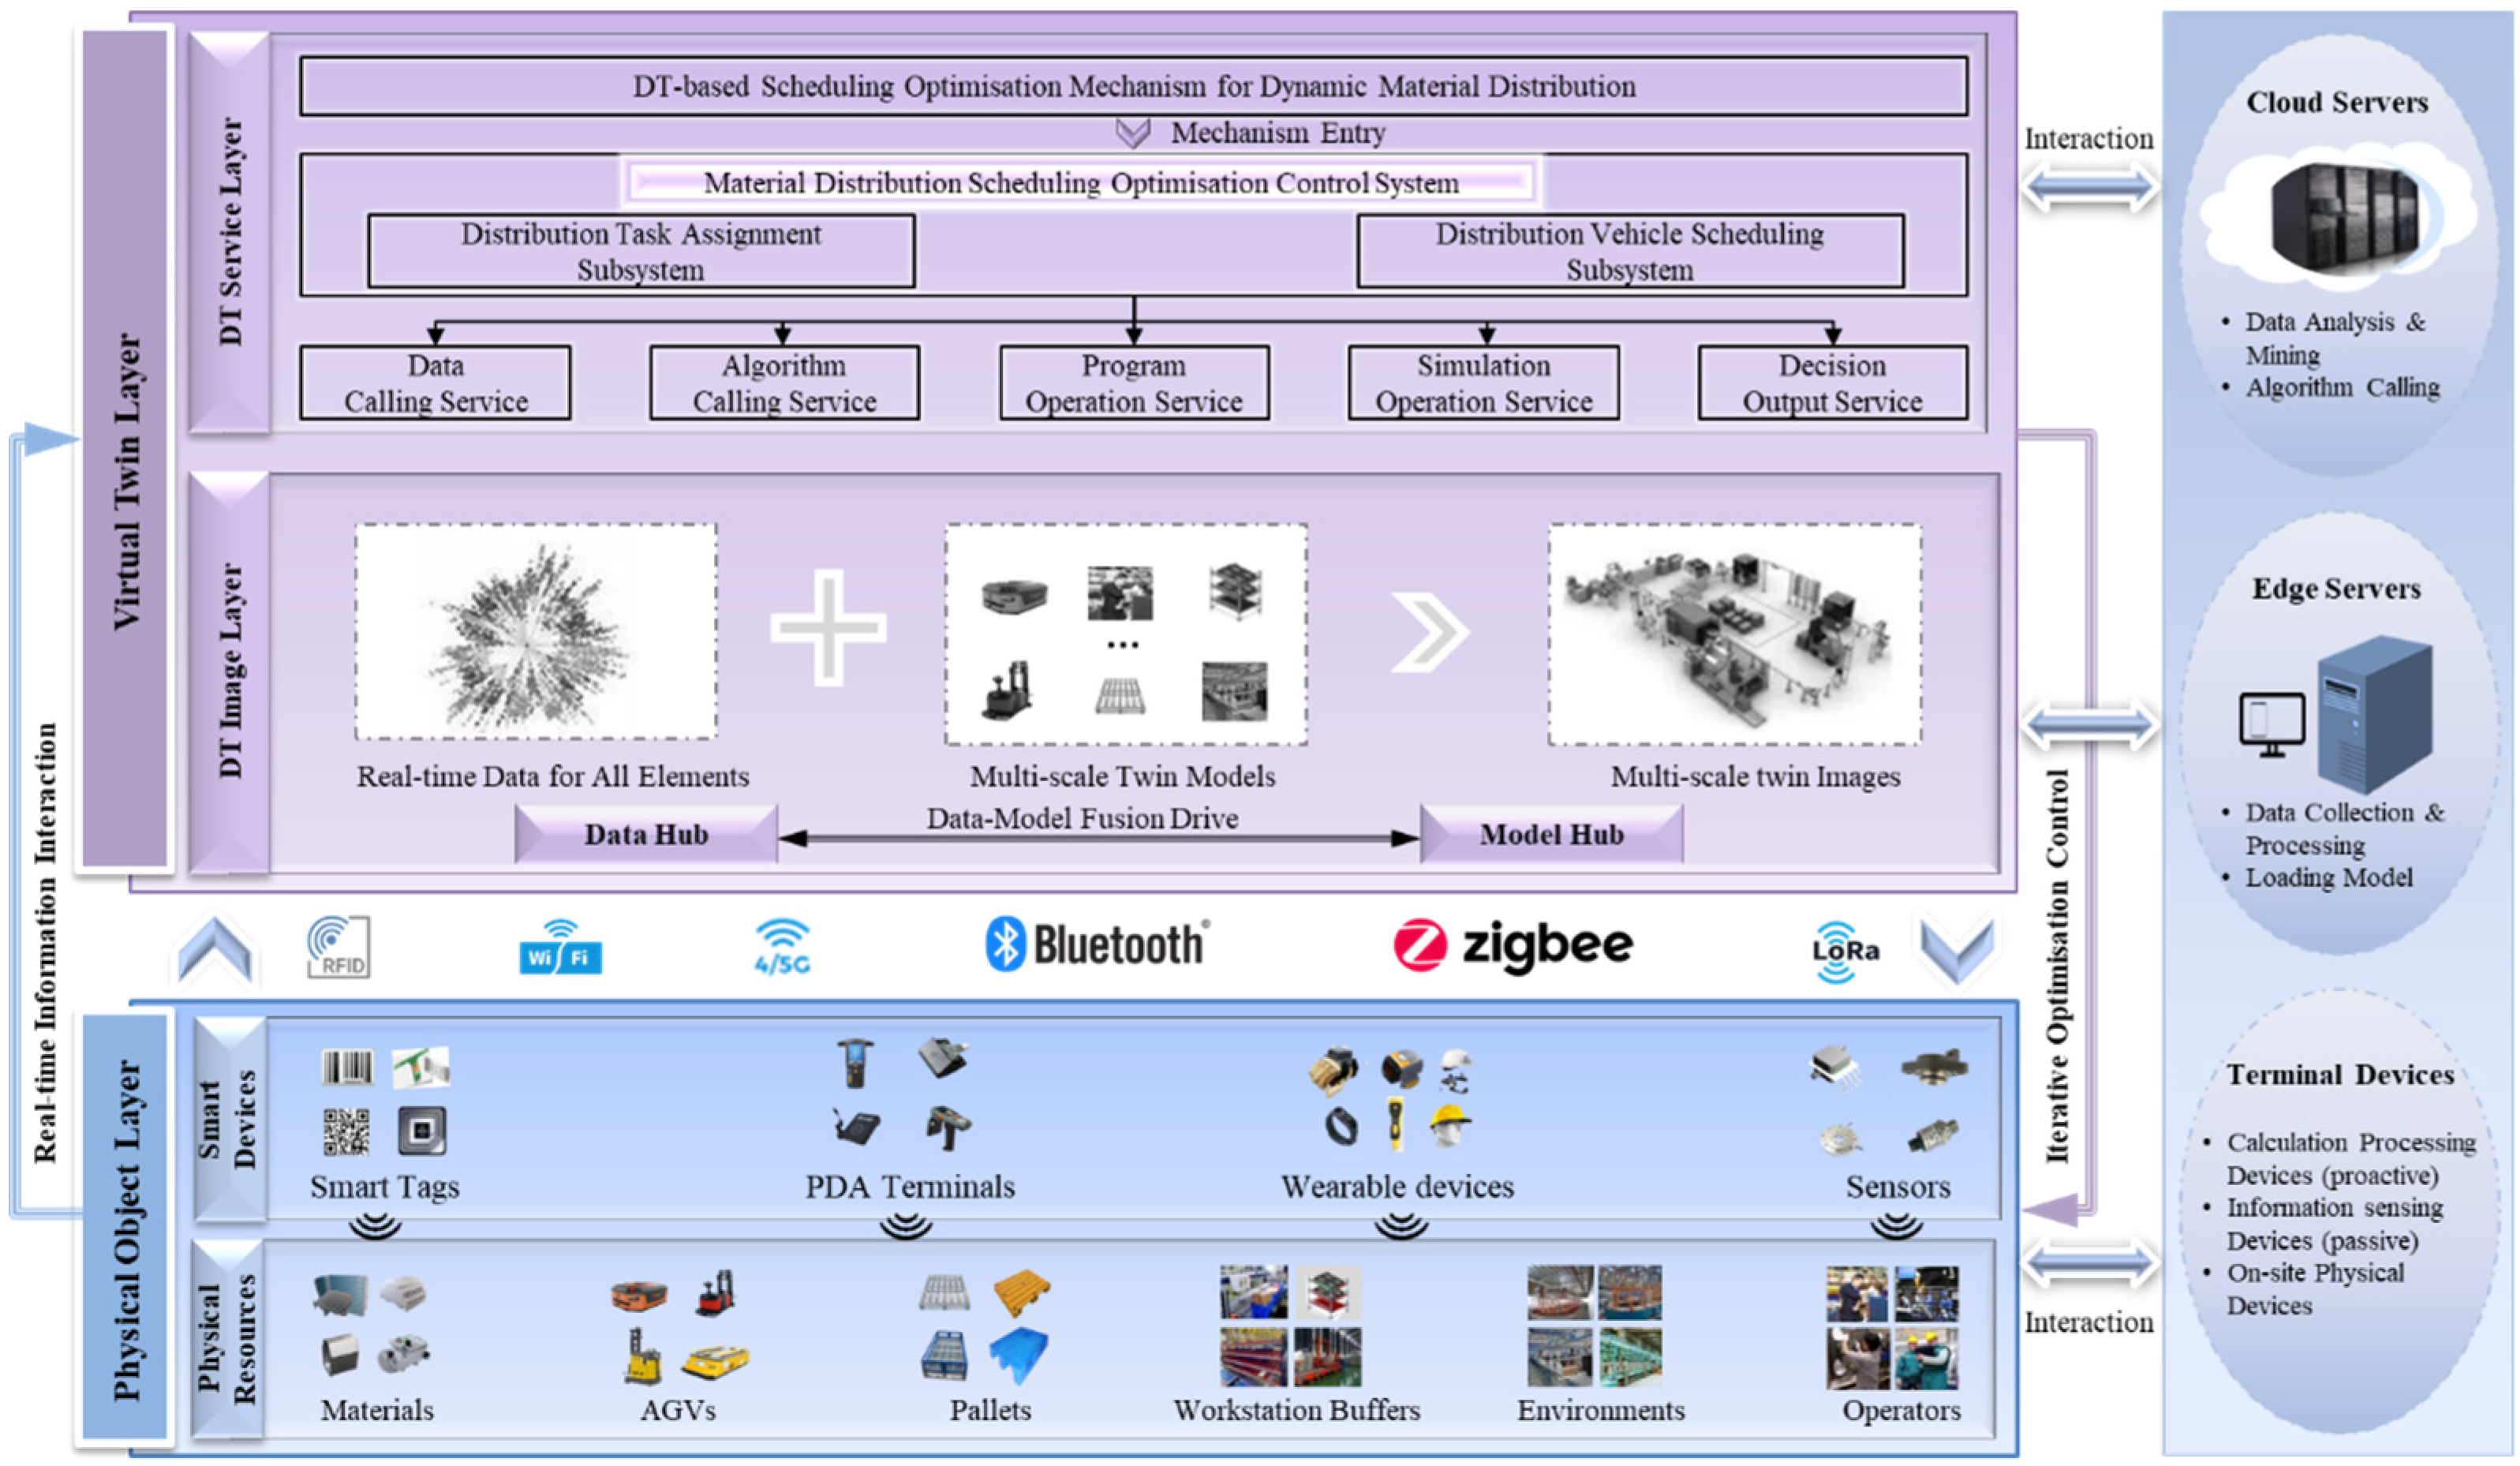
Figure 2 illustrates the decision architecture for DT-based material distribution scheduling optimization, consisting of two hierarchical layers: the physical object layer and the virtual twin layer.
The physical object layer encompasses the physical resource layer and the smart device layer. The physical resource layer covers various tangible resources within the mixed-model assembly workshop, such as materials, pallets, AGVs, workstation buffers, workshop environments, and operators. The smart device layer collects information related to materials, vehicles, task execution, orders, and the environment through active or passive smart sensing devices like handheld PDA terminals, wearable devices, a variety of sensors, 1/2D tags, RFID tags, etc. These resource and status information are transmitted through heterogeneous networks to the upper layers of the decision architecture. The heterogeneous transmission networks include RFID networks, Wi-Fi, 4/5G, Bluetooth, ZigBee, LoRa, and other wireless transmission networks.
The virtual twin layer comprises the DT imaging layer and the DT service layer. The DT imaging layer, based on data centers and model centers, integrates real-time data and multiscale static twin models to create multi-scale virtual images through digital twin technology. These virtual images reflect the physical structure, production processes, and material flow of the actual material distribution system. They accurately display key information such as the flow paths of materials, workstation layouts, and vehicle statuses. Using DT imaging, the dynamic aspects of material flow, such as material accumulation and shortages, can be continuously monitored, providing support for decision simulation within the DT service layer.
The DT service layer includes the material distribution scheduling optimization control system, material distribution scheduling optimization mechanisms, and other service modules. This control system leverages real-time, comprehensive operational information from the material distribution scheduling system. It utilizes DT’s dynamic material distribution scheduling optimization mechanisms and intelligent optimization algorithms to make collaborative decisions regarding the execution plans of the task allocation subsystem and the vehicle scheduling subsystem. These decisions are then transformed into directives for execution control. The system encompasses five functional services: data retrieval services, algorithm invocation services, program execution services, simulation execution services, and decision output services, promoting system scalability and the reuse of functional modules.
A DT-based material distribution scheduling system requires robust computing capabilities to meet real-time requirements. Thus, this system adopts a cloud-edge computing architecture, distributing computing demands to cloud servers and edge servers [26], balancing the efficient utilization of computing resources with real-time performance. Cloud servers perform extensive data analysis and mining based on historical operational data, establish decision models, invoke intelligent algorithms, generate decision solutions, and ensure the real-time, accuracy, and reliability of the decision results. Edge servers are responsible for initial data collection and processing of distribution operation data, real-time monitoring of system execution, device performance diagnosis, analysis, and forecasting. Due to their proximity to data sources, edge servers can respond more rapidly to dynamic on-site situations, meeting the real-time operational needs of the material distribution scheduling system, and ensuring efficient and smooth production in the mixed-model assembly workshop.
Figure 2.
DT-based Optimized decision-making architecture for material distribution scheduling.
4.2. DT-based Composition and Operation Mechanism for Material Distribution System
The material distribution system is a crucial component of the mixed-model assembly workshop, and the DT-based material distribution system forms the foundation of the overall scheduling optimization mechanism, significantly impacting the application of scheduling strategies.
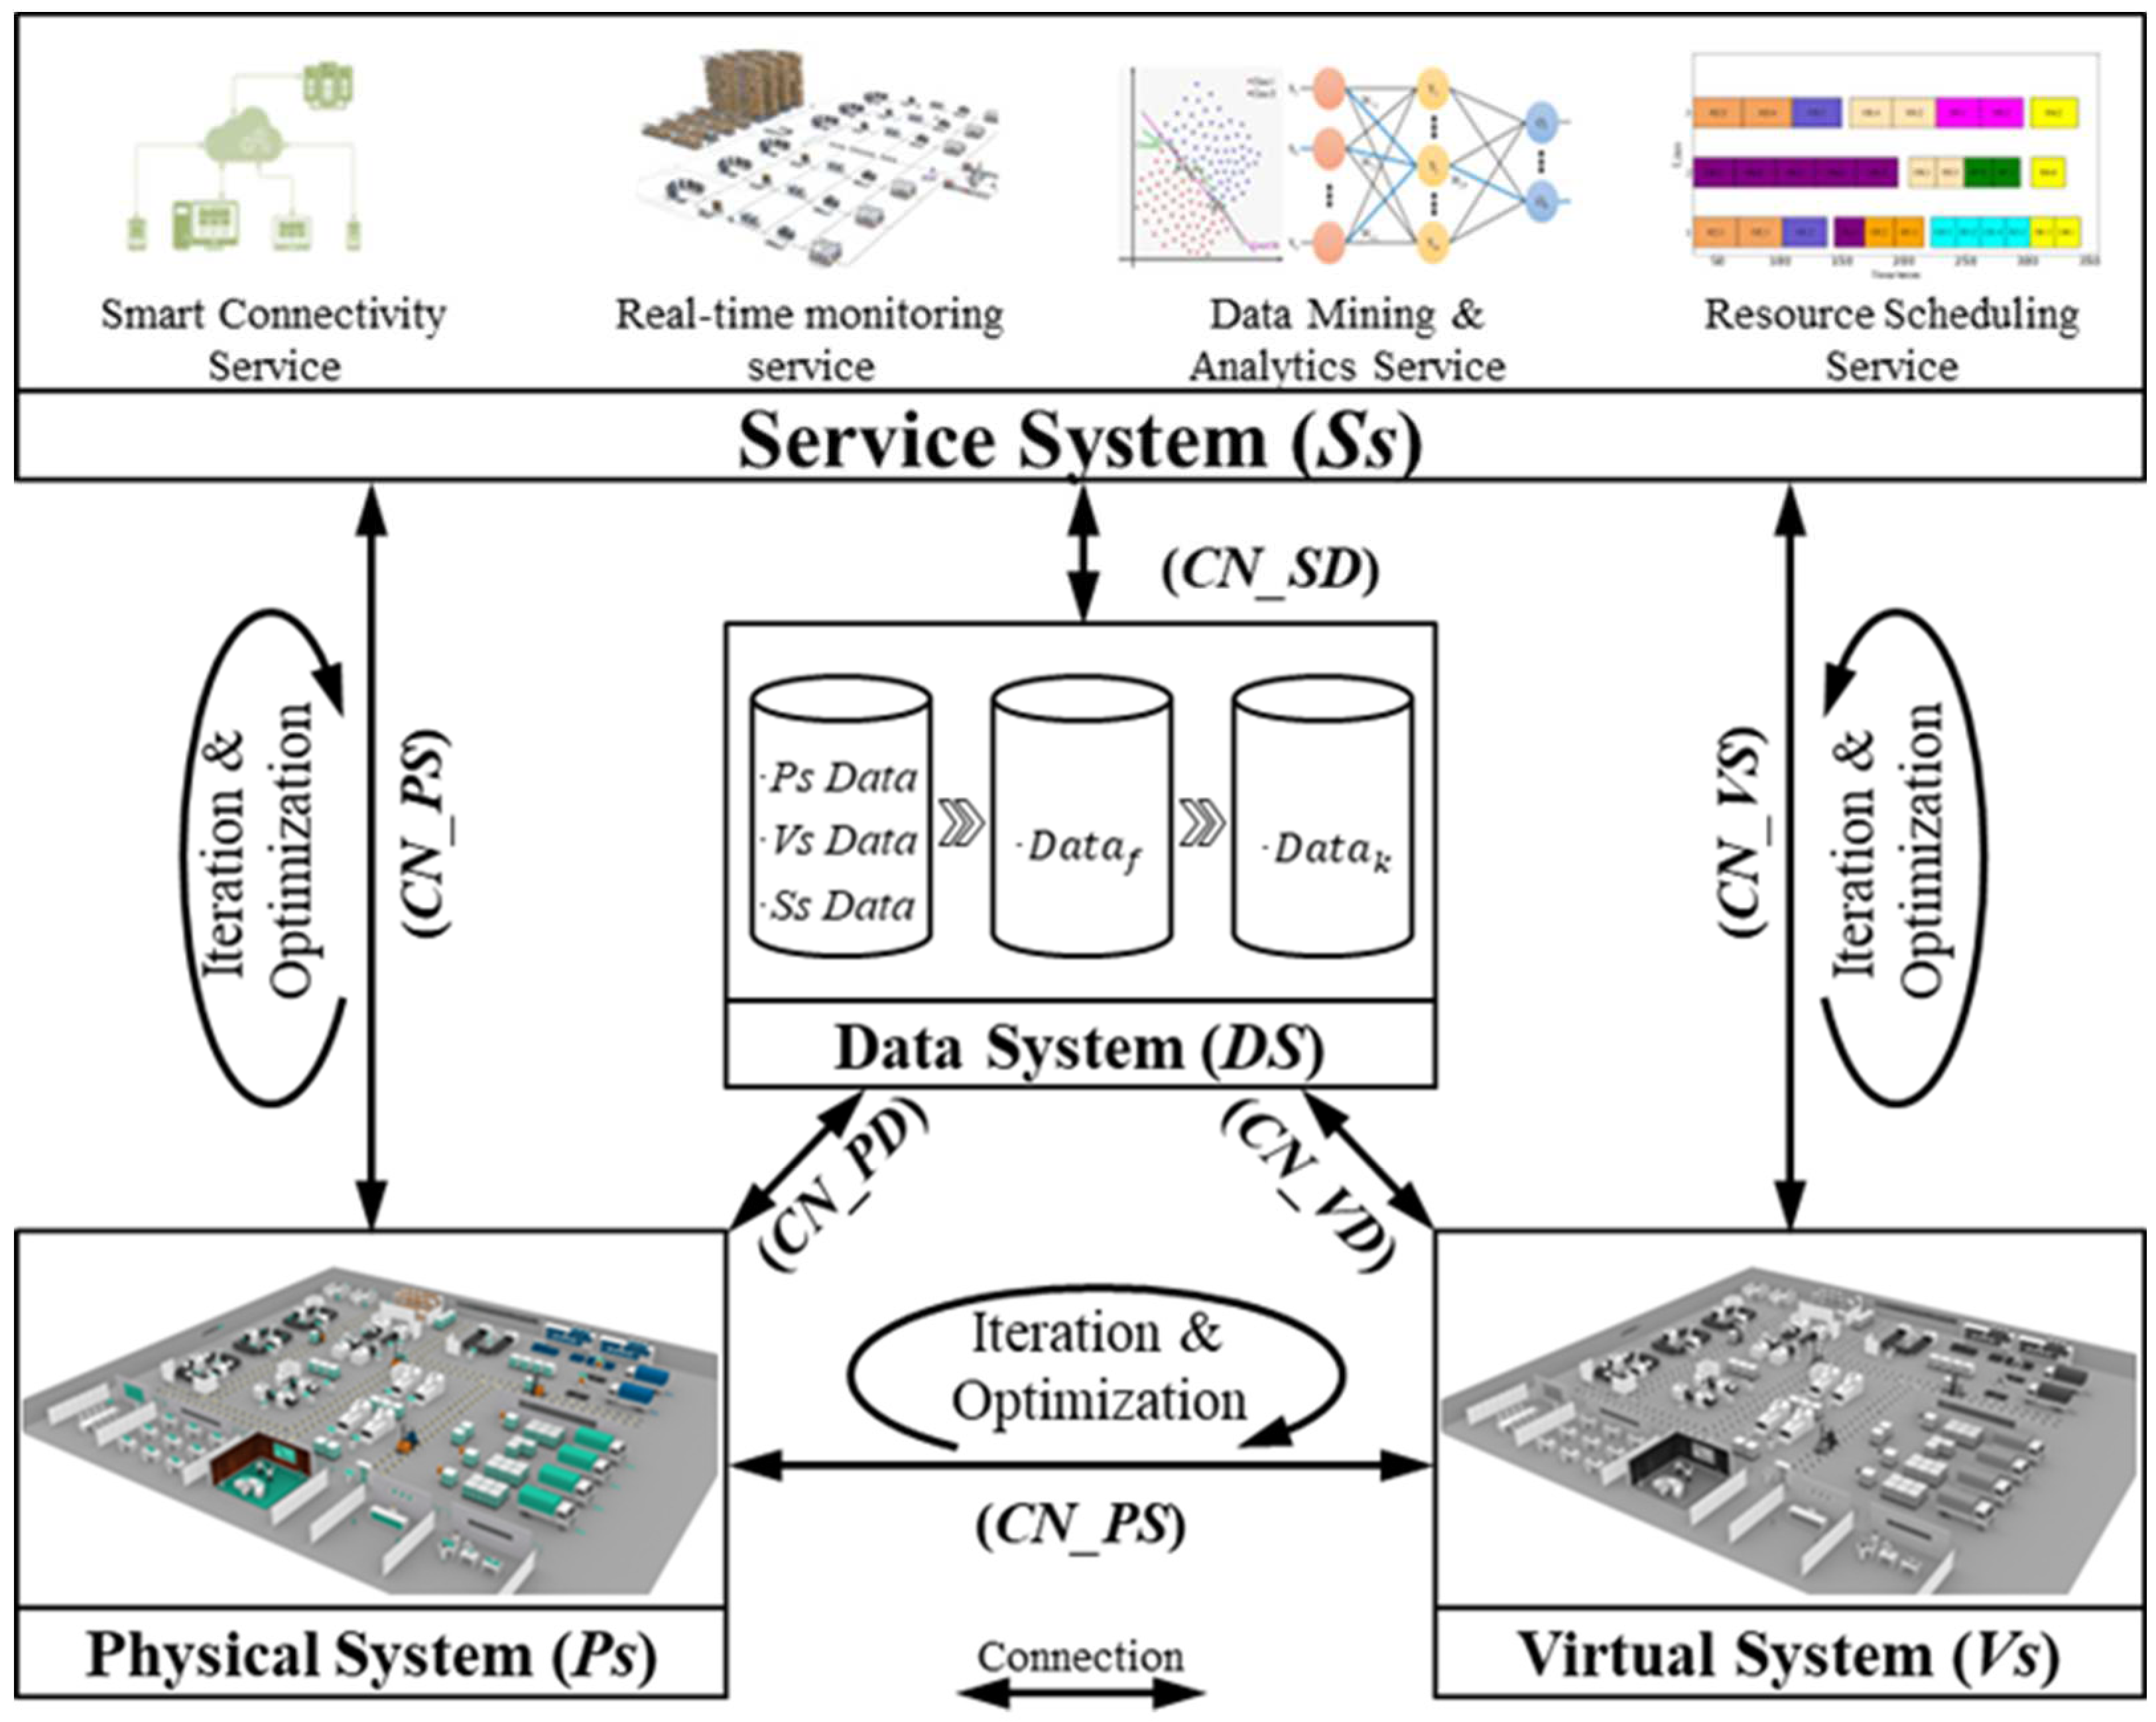
This section describes the composition and operational mechanism of the DT-based material distribution system. According to the DT five-dimensional model proposed by Tao et al. [27], the composition of the DT-based material distribution system can be described as:
where represents the physical distribution system, is the virtual distribution system, denotes the distribution service system, supports the distribution decision-making data system, and signifies their interactive connections. Figure 3 illustrates the relationships between these components.
includes AGVs, materials, operators, and smart IoT devices, primarily responsible for receiving material distribution tasks dispatched by the production plan and executing material transport based on the distribution plan. is mainly used for simulation, evaluation, prediction, and visualization, serving as a digital image of . It involves multi-dimensional “geometric-physical-behavior-rules,” multi-domain “mechanical-hydraulic-electrical,” and multi-scale “unit-subsystem-system” models.
represents a collection of various intelligent service functions that provide management and control support for the DT-based material distribution optimization system. comprises data from , , , along with fused information data () and knowledge data (). The data system also acts as a driving force for , , and . is a critical link and foundation for establishing the DT-based material distribution system, enabling interaction connections among the various components.
When distribution tasks are executed, the collaborative process among different components unfolds as follows. Initially, generates an initial plan that satisfies task requirements and constraints based on the system’s multi-dimensional fused data (). Subsequently, simulates, evaluates, and optimizes the initial plan, eliminating potential conflicts, and uploads the optimized best initial plan to . then sends the validated best initial plan to for logistics preparation.
Once the distribution begins, the validated best initial plan is transmitted to , which sends instructions to control the logistics operations of . provides real-time feedback on the status of material distribution to . During the distribution process, predicts changes in ’ performance trends and continuously simulates, evaluates, and optimizes logistics based on DT data. continues to evolve until the tasks are completed.
If discrepancies are found between the execution status of Ps and the initial plan instructions (referred to as the interference intensity, defined in Section 4.3), an interference response service is automatically triggered. rapidly identifies the cause of the interference and adjusts it based on dynamic response strategies to achieve optimal logistics operations.
Furthermore, , as the “core engine” of DT operation, is indispensable for , and , as they all rely on for driving the system.
Figure 3.
DT-based material distribution system composition.
4.3. DT-Based Dynamic Material Distribution Scheduling Optimization Strategy
With the support of DT-based decision architecture for material distribution scheduling optimization, this section proposes a DT-based dynamic material distribution scheduling optimization strategy.
Figure 4 illustrates the overall scheduling optimization strategy. Initially, material distribution task instructions are generated based on the material distribution order demands from the production plan. This entails generating a set of distribution vehicles for each material batch in , along with the collection of routes for each vehicle. defines the eligible vehicles for each type of material and employs a compression spatiotemporal ratio method [28] to determine the precise average travel speed of the distribution AGVs. Subsequently, the scheduling optimization model established in the initial scheduling phase is solved using the embedded improved ACO (IACO). Next, the solved scheduling plan is imported into for simulation and verification to mitigate potential risks within the scheduling plan. After iterative optimization, the best initial distribution plan results are transformed into decision instructions to control and guide the logistics operations of .
Figure 4.
DT-based dynamic material distribution scheduling optimization strategy.
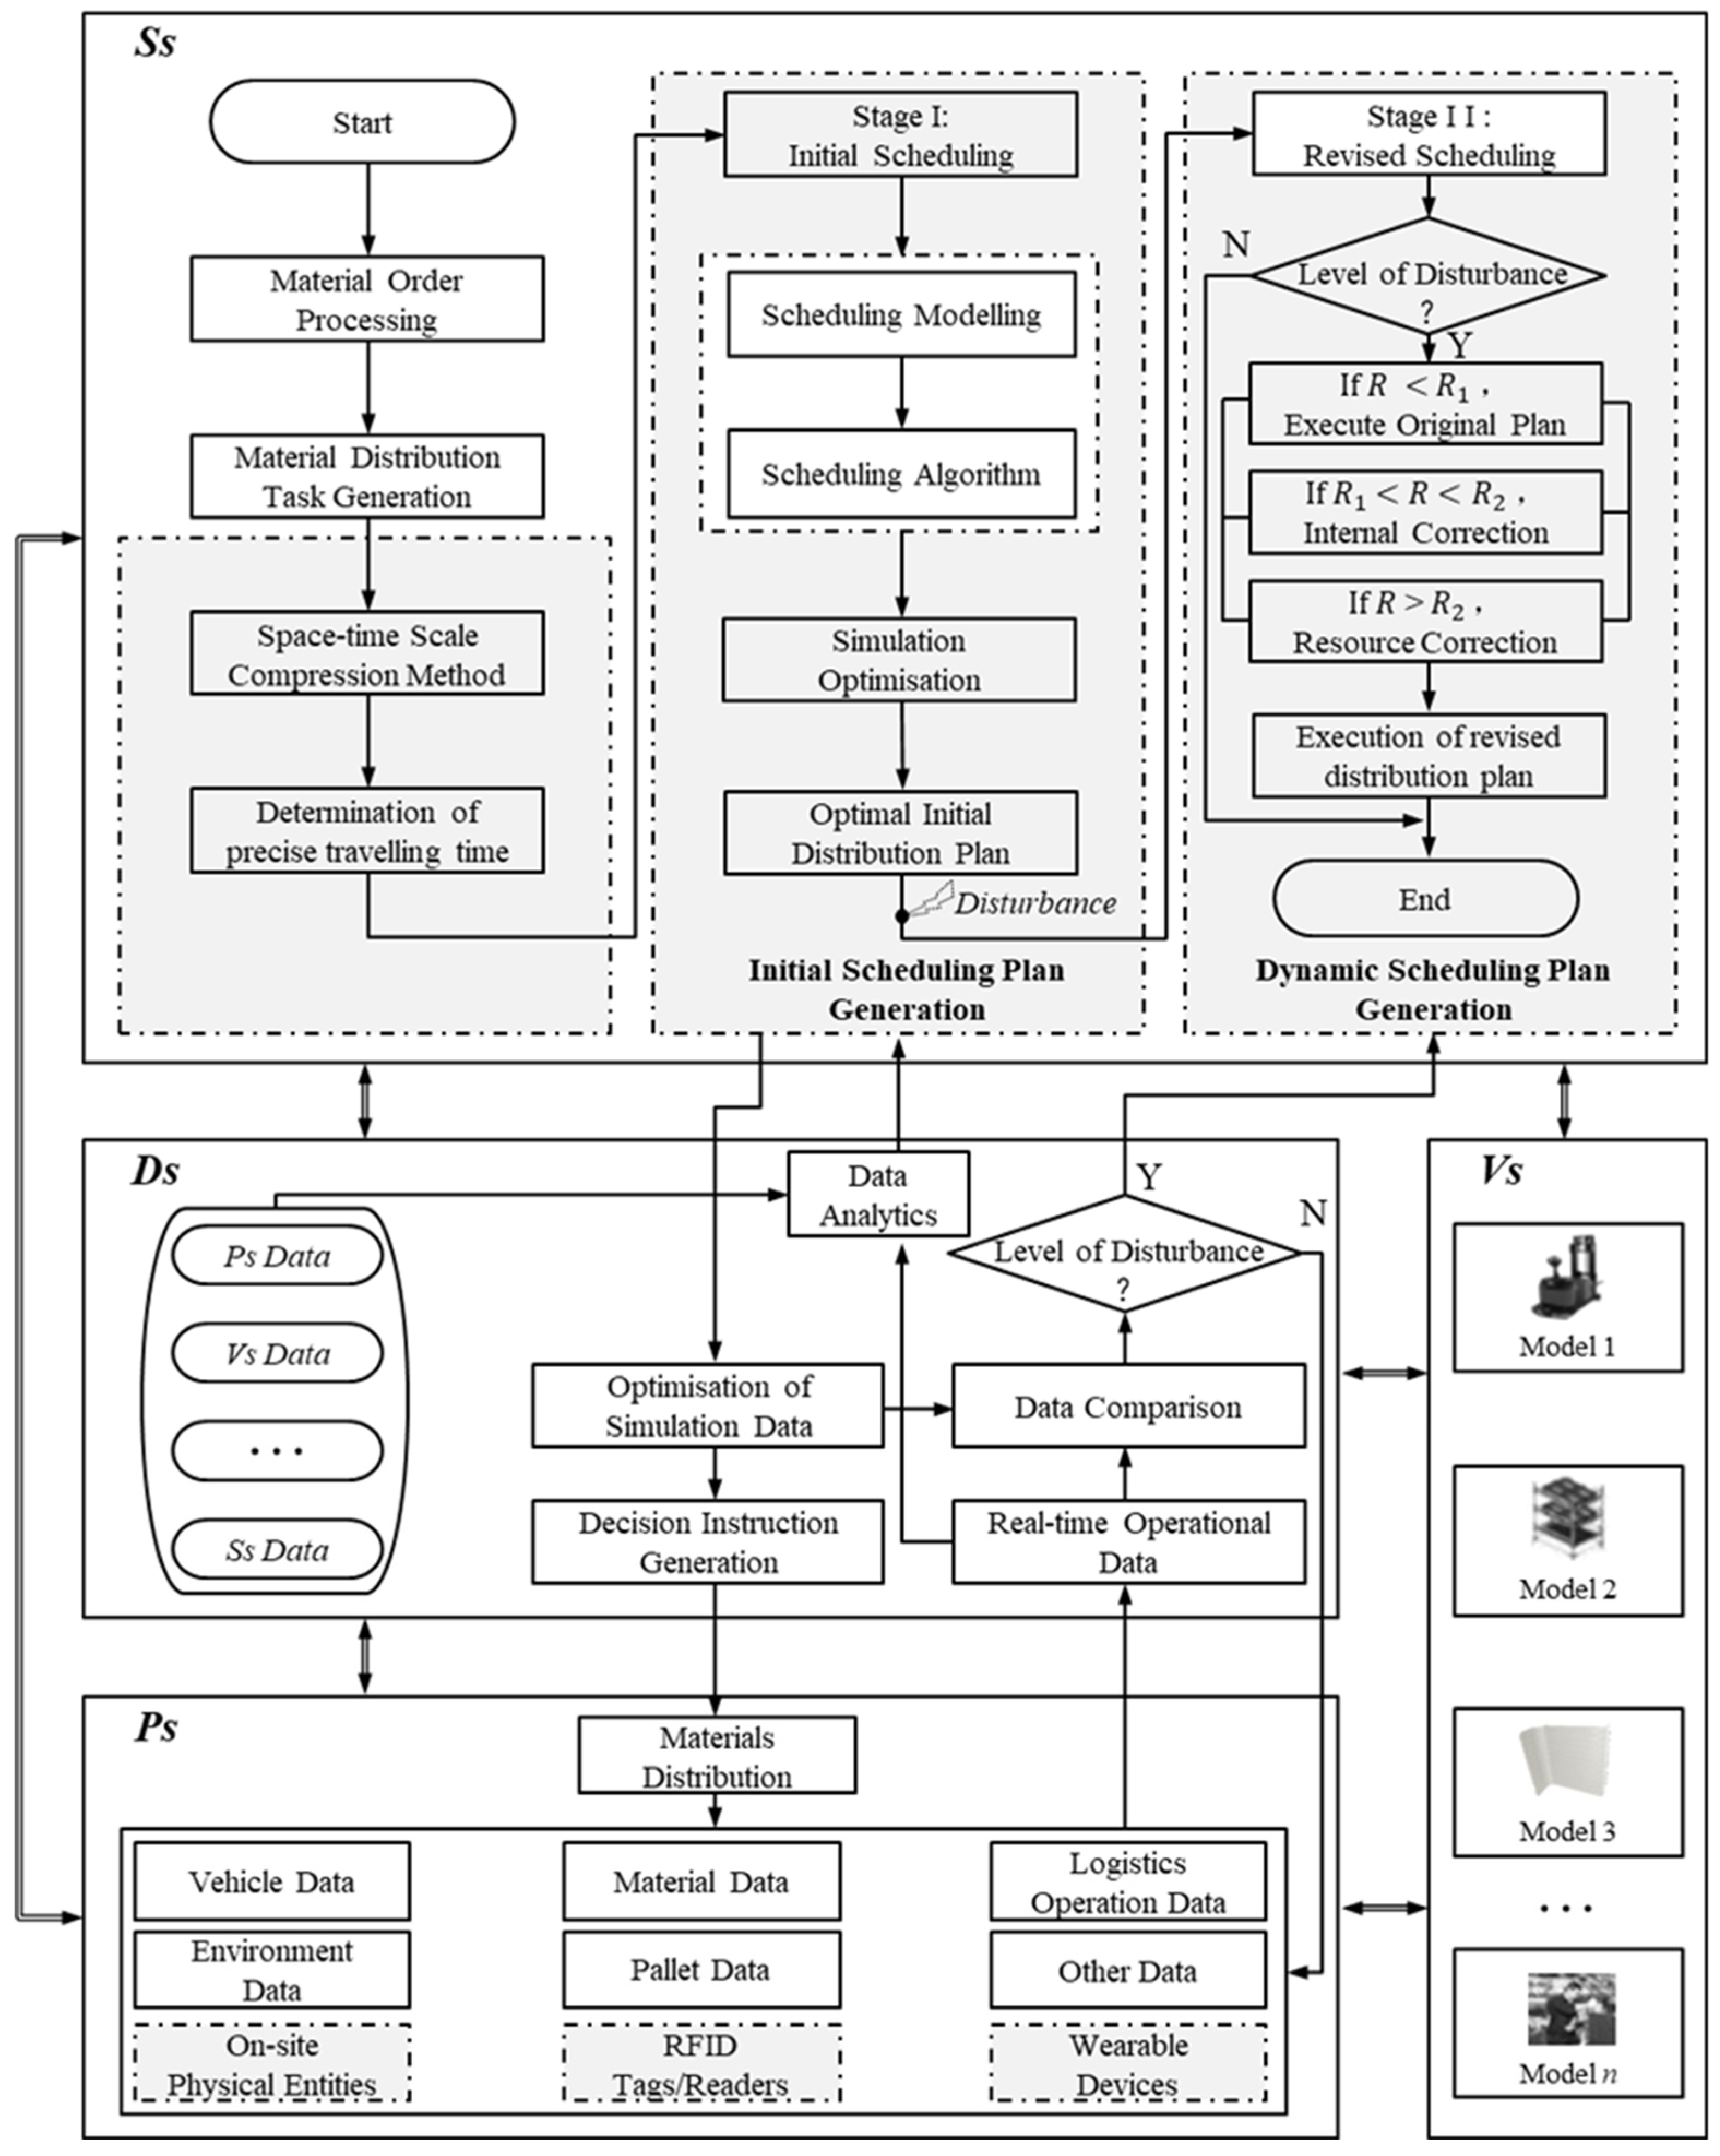
In the actual production logistics execution process, the comprehensive and robust data collection capability of the DT-based material distribution system allows for real-time operational data, including AGVs, materials, logistics operations, personnel, and environmental data, to be monitored and uploaded to . The collected real-time operational data is compared with the results simulated in to determine whether disturbances exceed predefined thresholds. If such thresholds are surpassed, dynamic corrective scheduling is employed to address the disturbances.
During the dynamic corrective scheduling phase, the material distribution system inevitably encounters various disruptive factors, such as emergency insertions, vehicle breakdowns, material shortages, etc. This study categorizes these disturbances into three levels based on their impact on system operations, denoted as and , with varying levels of intensity. The definition of disturbance intensity is as follows:
Building upon our research group’s prior work [17], different dynamic response strategies are proposed for various disturbance intensities. When , it is categorized as level one dynamic response, i.e., . In this case, although the material distribution plan for the mixed-flow workshop is affected by disturbances, the impact is not significant enough to disrupt normal execution. Therefore, deliveries can proceed according to the original plan without the need for adjustment. When , it is categorized as level two dynamic response, i.e., . At this stage, the material distribution plan can no longer meet dynamic requirements, but internal corrections can be made to adjust the material distribution plan by modifying and configuring other available distribution vehicles to meet the material distribution needs. When , it is categorized as level three dynamic response, i.e., . In this stage, the planned corrections are insufficient to meet the high dynamic requirements of the material distribution plan in the mixed-flow workshop, requiring the introduction of external logistics resources for resource adjustments. Revised material distribution planning schemes are then issued as instructions to the execution site to meet the high-dynamic production logistics requirements.
4.4. Intelligent Optimization Algorithm
In a DT-based material distribution system, the generation of scheduling plans relies on the support of intelligent optimization algorithms. These algorithms are encapsulated within and integrated with DT. The scheduling optimization algorithm, as the core technology of the DT-based material distribution system, has a direct impact on the performance of the logistics system. Therefore, this section explores an improved intelligent optimization algorithm.
The ant colony optimization (ACO) algorithm, inspired by the foraging behavior of ants in nature, has demonstrated outstanding performance in finding optimal paths. It is a probabilistic algorithm with good parallelism, robustness, and positive feedback properties. ACO algorithms have been widely applied in various fields, including machine learning, graph theory problems, logistics planning, and production scheduling. However, traditional ACO algorithms often suffer from problems such as low solution precision, slow convergence speed, and susceptibility to local optima.
In this research, we employ an improved ant colony optimization algorithm (IACO) to address the material distribution scheduling optimization problem in the DT-based framework. Compared to the conventional ACO, IACO incorporates improvements in route node transition rules and pheromone update rules to enhance its performance and efficiency.
4.4.1. Improved Route Node Selection Transition Rules
The savings technique is introduced, incorporating a quantity to enhance the ant’s transition probability selection. is introduced into the ant’s path node transition probability formula, optimizing the selection of path nodes while favoring higher vehicle load rates. The improved node selection transition probability formula is as follows:
where Equation (14) represents the improved path node selection transition probability formula, indicating the probability of ant k selecting node i to node j at time t. This probability is influenced by the pheromone concentration , the heuristic function , the pheromone increment , and whether node i belongs to the accessible node set allowed. Equation (15) represents the heuristic function, denoting the visibility between nodes and , which is usually the reciprocal of the distance between nodes. Equation (16) represents the distance function, denoting the Euclidean distance between nodes and , and Equation (17) is the savings function , which is the sum of route lengths for separate deliveries to two workstations, minus the route length when visiting both workstations simultaneously. Here, α is the pheromone factor, β is the heuristic function factor, and ρ is the pheromone evaporation factor.
4.4.2. Improved Pheromone Update Rules
The core idea behind this rule is that ants update pheromones along their path as they search, guiding them in choosing paths to find the best solutions according to specific problem constraints and objectives. The standard pheromone update formula is as follows:
where Equation (18) represents the pheromone concentration function for nodesand at time , influenced by the pheromone concentration at the previous time and the pheromone increment (as shown in Equation (20)). Pheromone concentration gradually evaporates while being influenced by rewards and penalties from ant paths. is calculated based on the traveling path length of a single ant and the pheromone constant , representing the increase in pheromone concentration from node to node .
In this study, we introduce an improved pheromone update rule that accelerates the algorithm’s convergence by using a reward and penalty strategy. Specifically, during the process of ants searching for paths, ants that fail to complete routes correctly are eliminated, and only those ants that successfully reach the target endpoint with a valid path are retained. For these qualified paths, we introduce a reward and penalty strategy for pheromone updates. Assuming there are ants in total, for the top ants with the shortest travel path lengths, we increase the pheromone concentration released by these ants, i.e., rewarding them. For the remaining m-n ants (i.e., those ranked below the top ants), we reduce the pheromone concentration on their paths, i.e., penalizing them. The specific formula for the improved pheromone update rule is shown in (22) and (23), where represents the current iteration’s best solution, and represents the worst solution of the current iteration. To ensure that the pheromone concentration fluctuates within a certain range, avoiding excessive growth or reduction, as well as preventing the algorithm from getting stuck in local optima prematurely or stagnating during the search process, we set the pheromone concentration as shown in (24).
4.4.3. The Solving Process of Improved ant Colony Algorithm
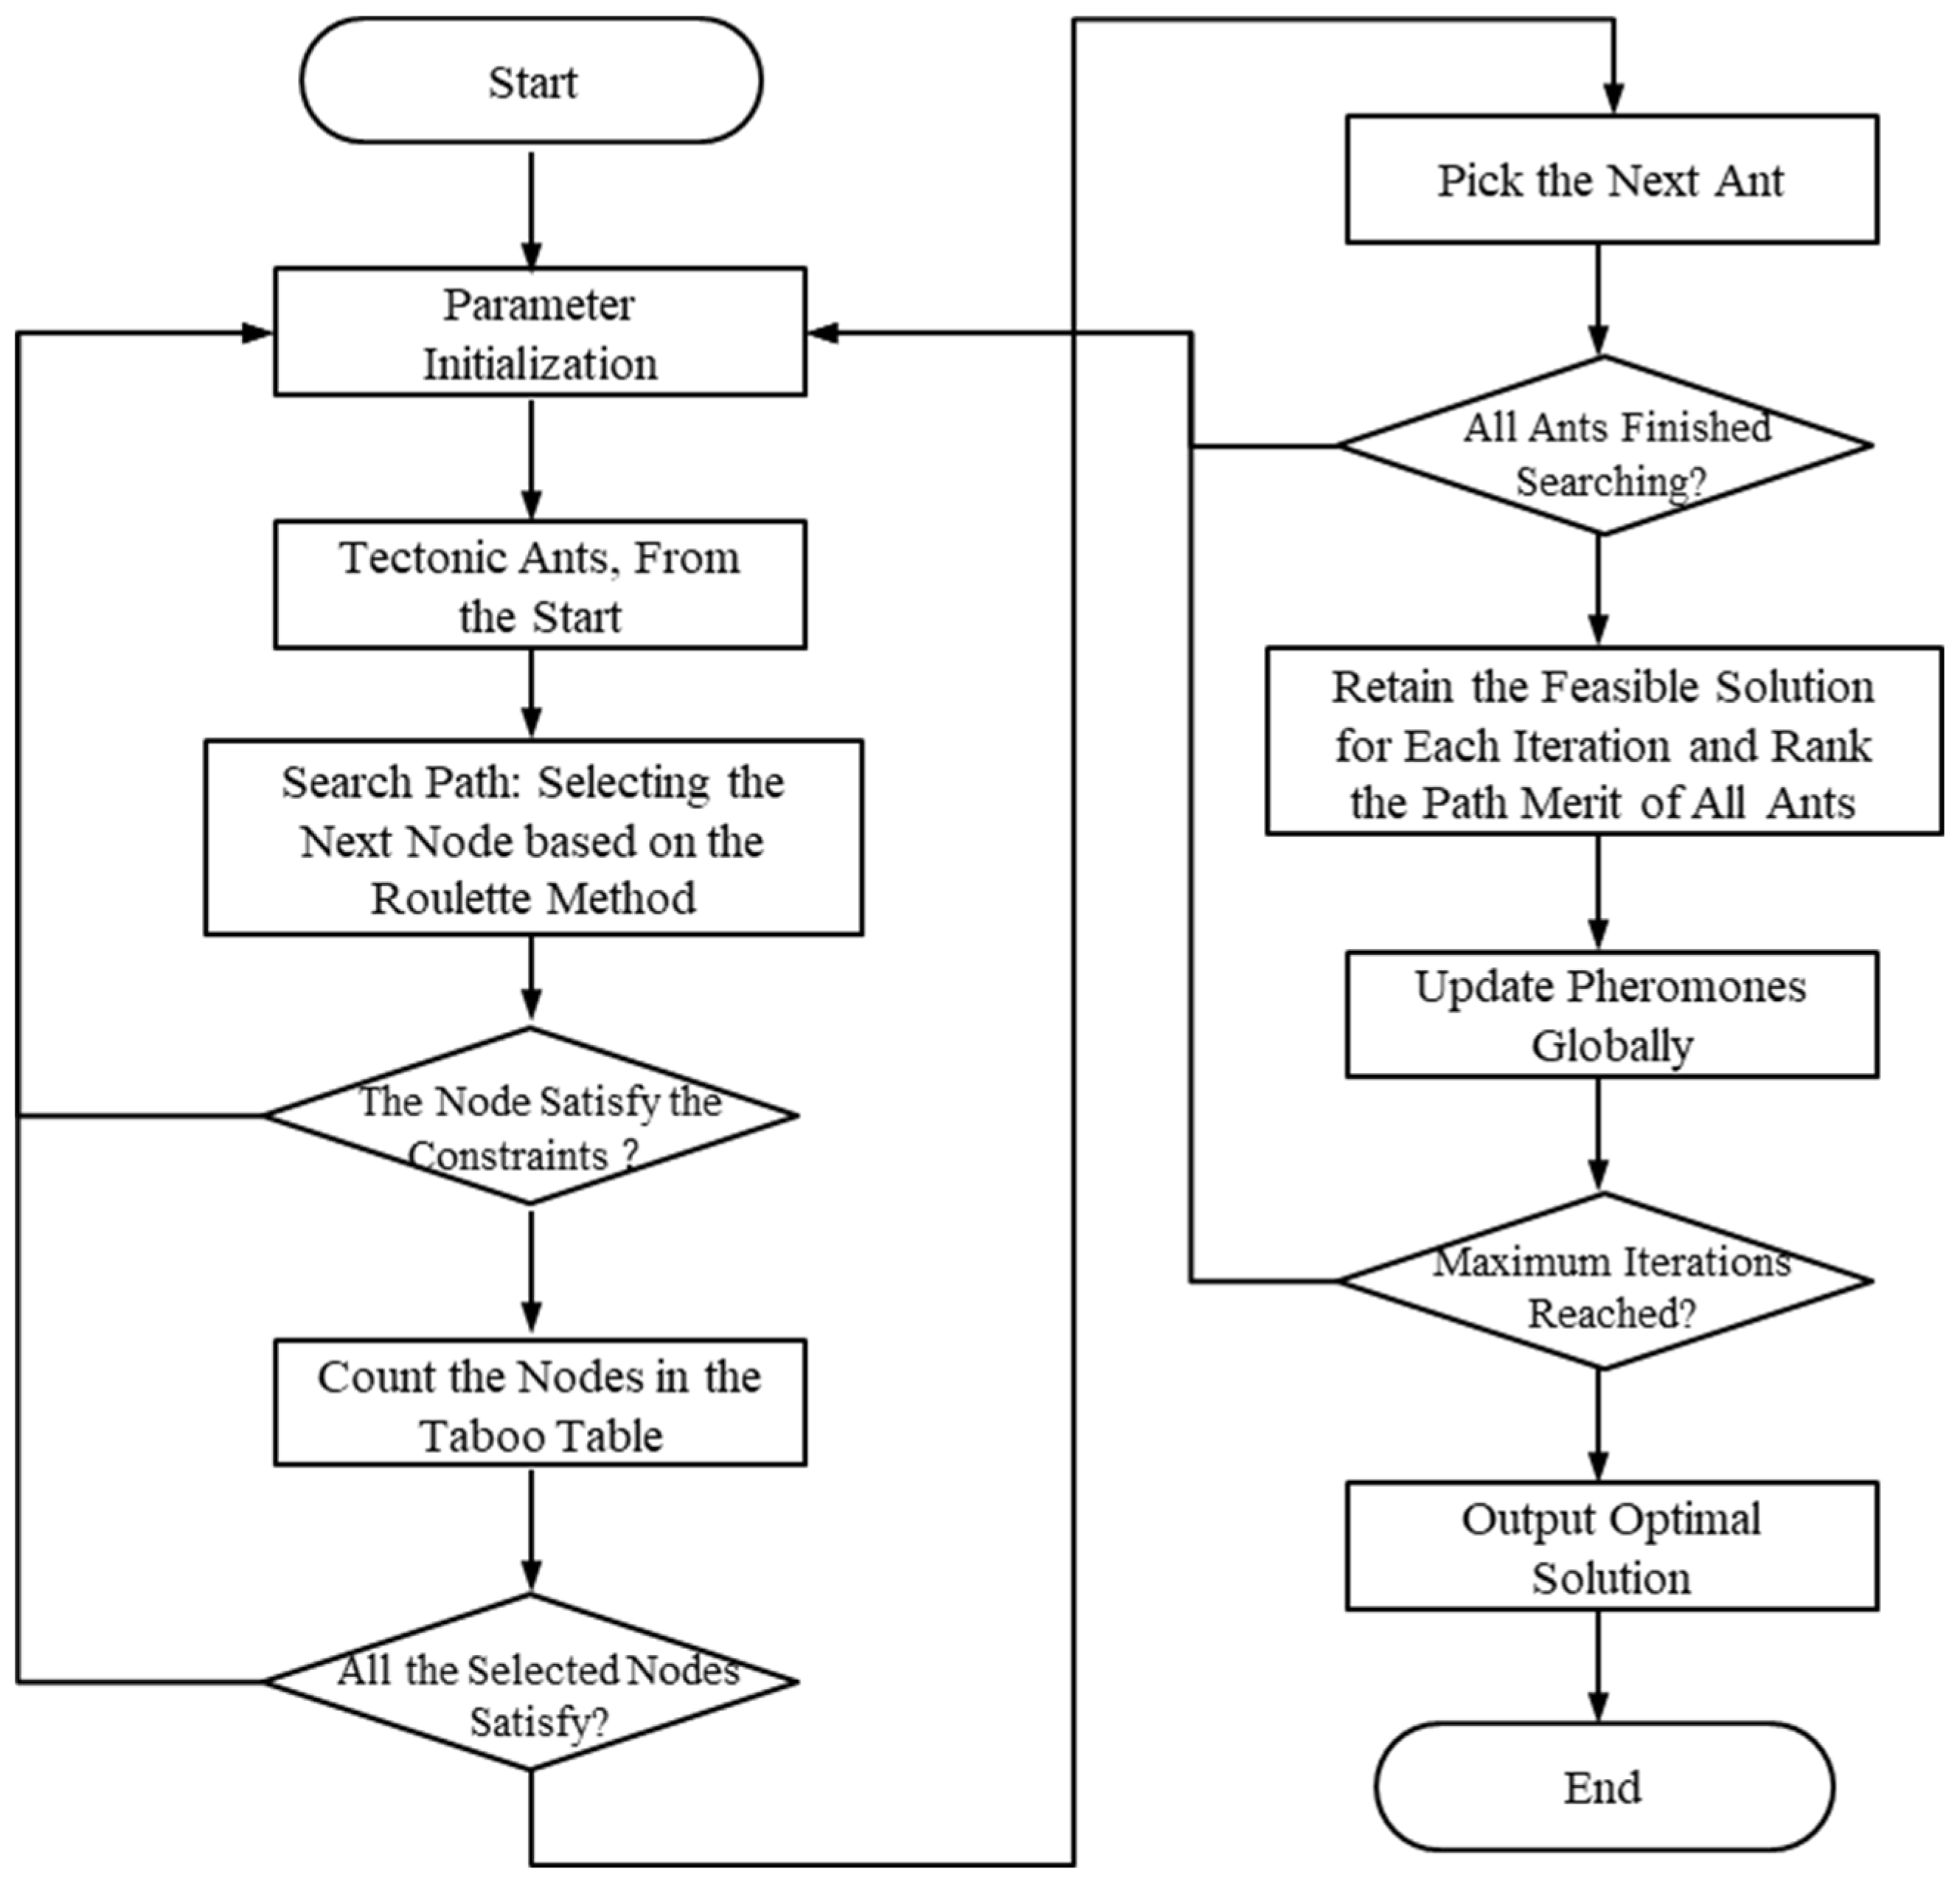
Figure 5 illustrates the steps in the solving process of the improved ant colony algorithm, which includes the following stages:
Step 1: Parameter initialization
- Set the maximum number of iterations, control the total number of iterations for the algorithm;
- Initialize the algorithm’s relevant parameters: pheromone factor α, heuristic function factor β, pheromone constant , and pheromone evaporation factor ;
- Define the number of ants (vehicles) as M, representing the quantity of ants participating in solving the problem;
- N denotes the number of stations in the material distribution problem;
- Initialize the initial pheromone concentration , where pheromone concentration signifies the concentration of pheromones on the path, and represents the current iteration number;
- Initialize the Tabu list, which records nodes that have been visited to prevent repeated visits;
- Initialize all accessible nodes (allowed), representing workstations or service points that have not been visited yet.
Step 2: Path search
- Start from the origin point () and add it to the Tabu list, indicating the current ant’s starting position;
- Calculate path node selection transition probabilities based on Equation (14) and (17). These transition probabilities determine the likelihood of the ant selecting the next node;
- Utilize a roulette wheel selection method to choose the next node for path searching and add that node to the Tabu list for the current iteration to keep track of visited nodes.
Step 3: Task completion check
- Determine if the current ant has completed the material distribution task, meaning whether all demand service points have been satisfied;
- If the ant has completed the task, it returns to the origin point () and completes one distribution task;
- If the ant has not completed the task, it returns to Step 2 to continue path searching to fulfill the remaining demands.
Step 4: Next ant selection
- Check if all ants have completed their path searches;
- If all ants have completed path searching, proceed to the next step;
- If there are ants that have not completed path searching, continue with Step 4 by selecting the next ant for path searching.
Step 5: Pheromone update and iteration termination
- Update the pheromones on the paths based on Equation (22), (23), and (24). These updates depend on the ants’ performance on the paths and problem-specific parameters;
- Check if the current iteration number exceeds the maximum iteration limit;
- If the current iteration number exceeds the maximum limit, terminate the algorithm and output the current best solution;
- If the current iteration number does not exceed the maximum limit, return to Step 2 to continue the iterative process of path searching and pheromone updates until the termination condition is met.
Figure 5.
The flowchart of the IACO algorithm.
5. Case Study
5.1. Case Background and Data Presentation
To validate the excellence and effectiveness of the DT-based material distribution scheduling strategy, we have implemented a DT-based material distribution system in a collaborative enterprise. This material distribution system fully utilizes AGVs to execute distribution tasks, with the average travel time of AGVs determined through DT simulation, an average speed of 1m/s, and a maximum vehicle load of 180kg. We calculated the fixed costs of AGVs and the distribution costs per unit transportation distance based on historical operating data within the workshop. The assembly workshop comprises three mixed-model assembly lines, and we incorporated actual site data, including the coordinates of material storage areas and various workstations. Table A1 provides relevant data for vehicle distribution costs, while Table A2 displays the coordinates of the workstations. In this study, we selected the material demand data for different workstations during one cycle of material distribution in the mixed-model assembly workshop, as shown in Table A3, the sources of which are shown in Table A1, Table A2, and Table A3 in Appendix A.
5.2. Result Analysis
5.2.1. Verification of Algorithm Superiority
Traditional material distribution scheduling schemes rely on manual experience and often fall short of achieving optimal operations, especially in highly dynamic mixed-model production environments. Hence, this study employs an IACO algorithm to address the material distribution scheduling optimization problem. Numerical simulation experiments were conducted using Matlab R2016a on Alibaba cloud servers, with real data sourced from our collaborative enterprise. Both the traditional ACO and the IACO algorithms were encoded and solved separately to evaluate the performance of the proposed algorithm. To ensure algorithm stability, each case was run 50 times, and the average of the best values obtained from 50 runs was considered as the final result for both algorithms.
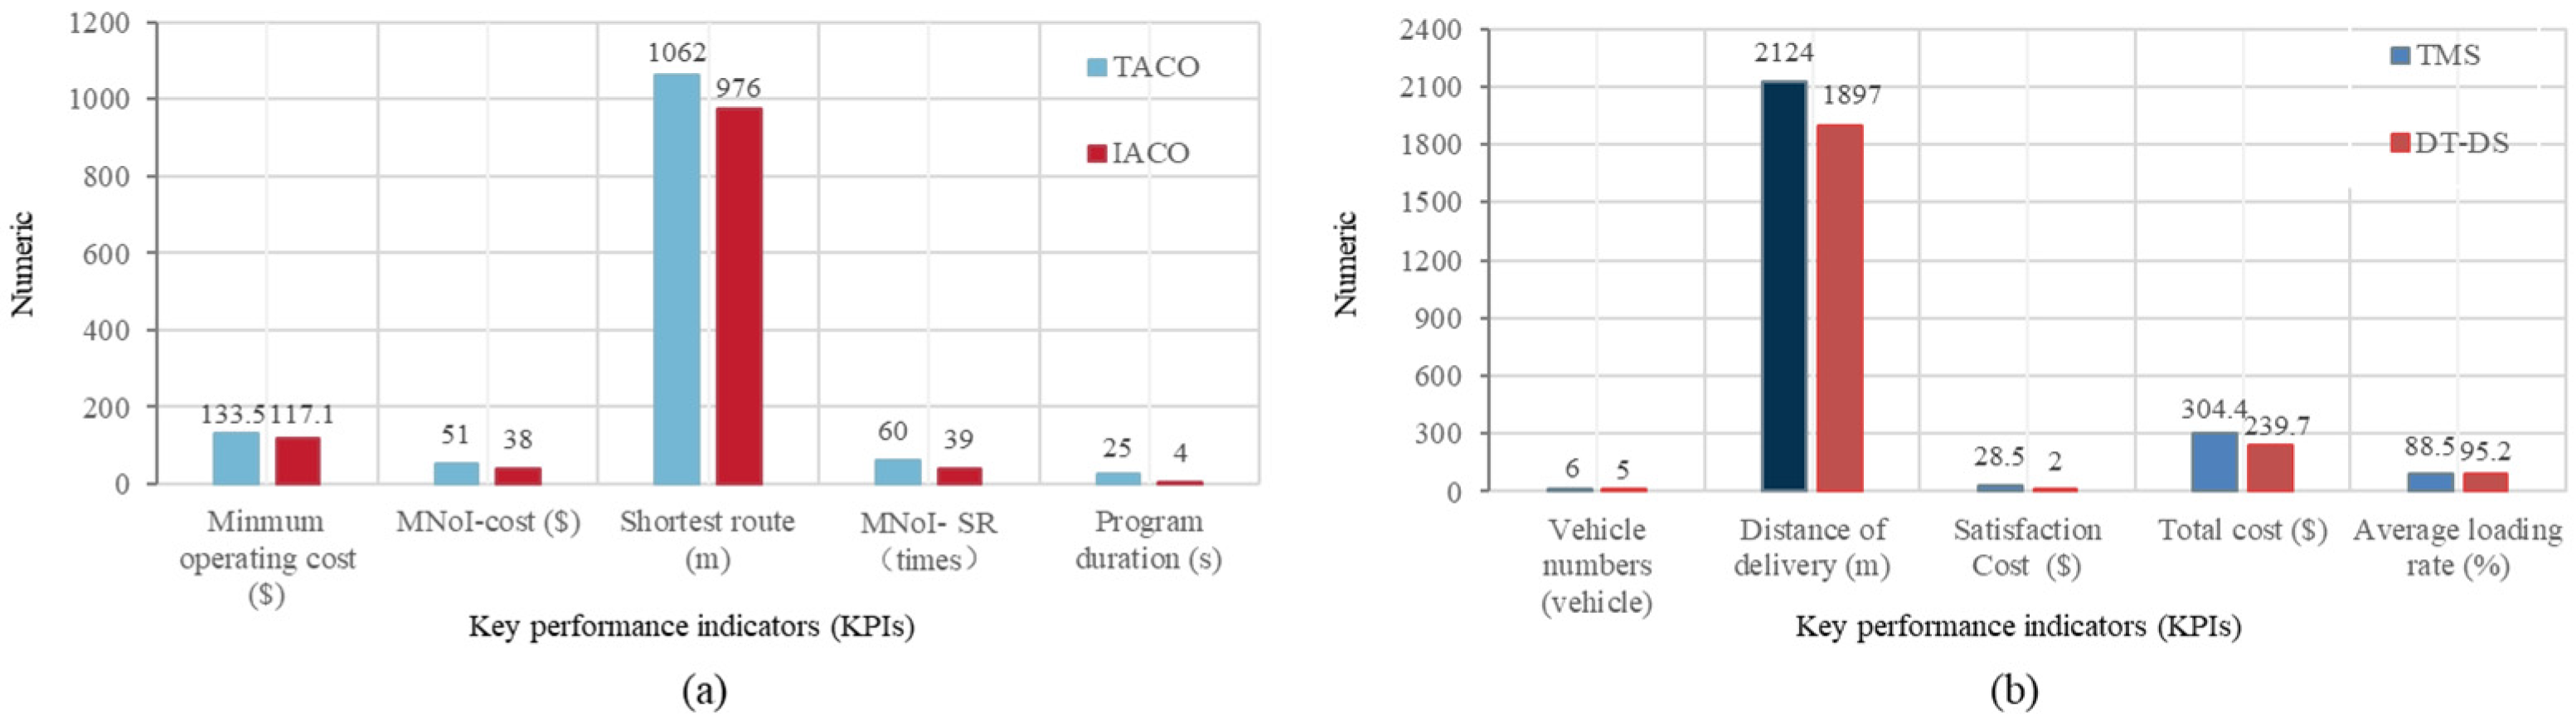
Figure 6(a) presents a comparison of the simulation results for the two algorithms. The traditional ACO algorithm and the improved ACO algorithm required 51 and 38 iterations, respectively, to converge to the optimal operational cost, resulting in 133.5 and 117.1, respectively. They needed 60 and 39 iterations to reach the optimal distribution routes, covering distances of 1062 and 976, respectively. The results indicate that the improved ACO algorithm demonstrates a significant advantage in terms of solution quality and convergence speed compared to the traditional ACO algorithm.
5.2.2. Schedule Results Comparison
To comprehensively evaluate the excellence and effectiveness of the DT-based dynamic scheduling (DT-DS) strategy proposed in this paper, we introduced a traditional manual scheduling (TMS) strategy as a comparative benchmark. Under the TMS strategy, material distribution plans are manually devised by planners based on their expertise. In contrast, the DT-DS strategy proposed in this paper makes use of an improved ACO algorithm to make decisions within the DT environment.
Figure 6(b) displays a comparison of the two scheduling optimization results. Using the TMS strategy, six AGVs were required, covering a total distance of 2124 meters, with a material distribution total cost of 304.4, and an average vehicle load rate of 88.5%. In contrast, using the DT-DS strategy, the number of AGVs reduced to five, the total travel distance decreased to 1897, the material distribution total cost was 239.7, and the average vehicle load rate improved to 95.2%. Compared to the TMS strategy, after implementing the DT-DS strategy, there was a reduction of one AGV, a 10.7% reduction in travel distance (227), an approximately 93% increase in workstation satisfaction (reducing by 26.5), and a roughly 21.3% decrease in material distribution total cost (reducing by 64.7), with a 7.6% increase in the average vehicle load rate.
Figure 6.
(a) Simulation results of two algorithms; (b) comparison of results under two scheduling strategies.
Figure 6.
(a) Simulation results of two algorithms; (b) comparison of results under two scheduling strategies.
5.3. Sensitivity Analysis
To delve into the impact of changes in logistics resources and emerging demand on the performance of material distribution scheduling systems, this study considers three relevant and typical scenarios: sensitivity analysis under different vehicle load (type) configurations, various vehicle quantity configurations, and different dynamic distribution demand volumes. These sensitivity analyses offer valuable insights for logistics management in mixed-model assembly workshops of similar enterprises.
5.3.1. Scenario 1—Sensitivity Analysis of Different Vehicle Model Configurations
Based on real distribution vehicles in a specific workshop and baseline distribution demand data for a given period, three different vehicle model configurations were considered: lightweight (140), medium-weight (180), and heavyweight (230).
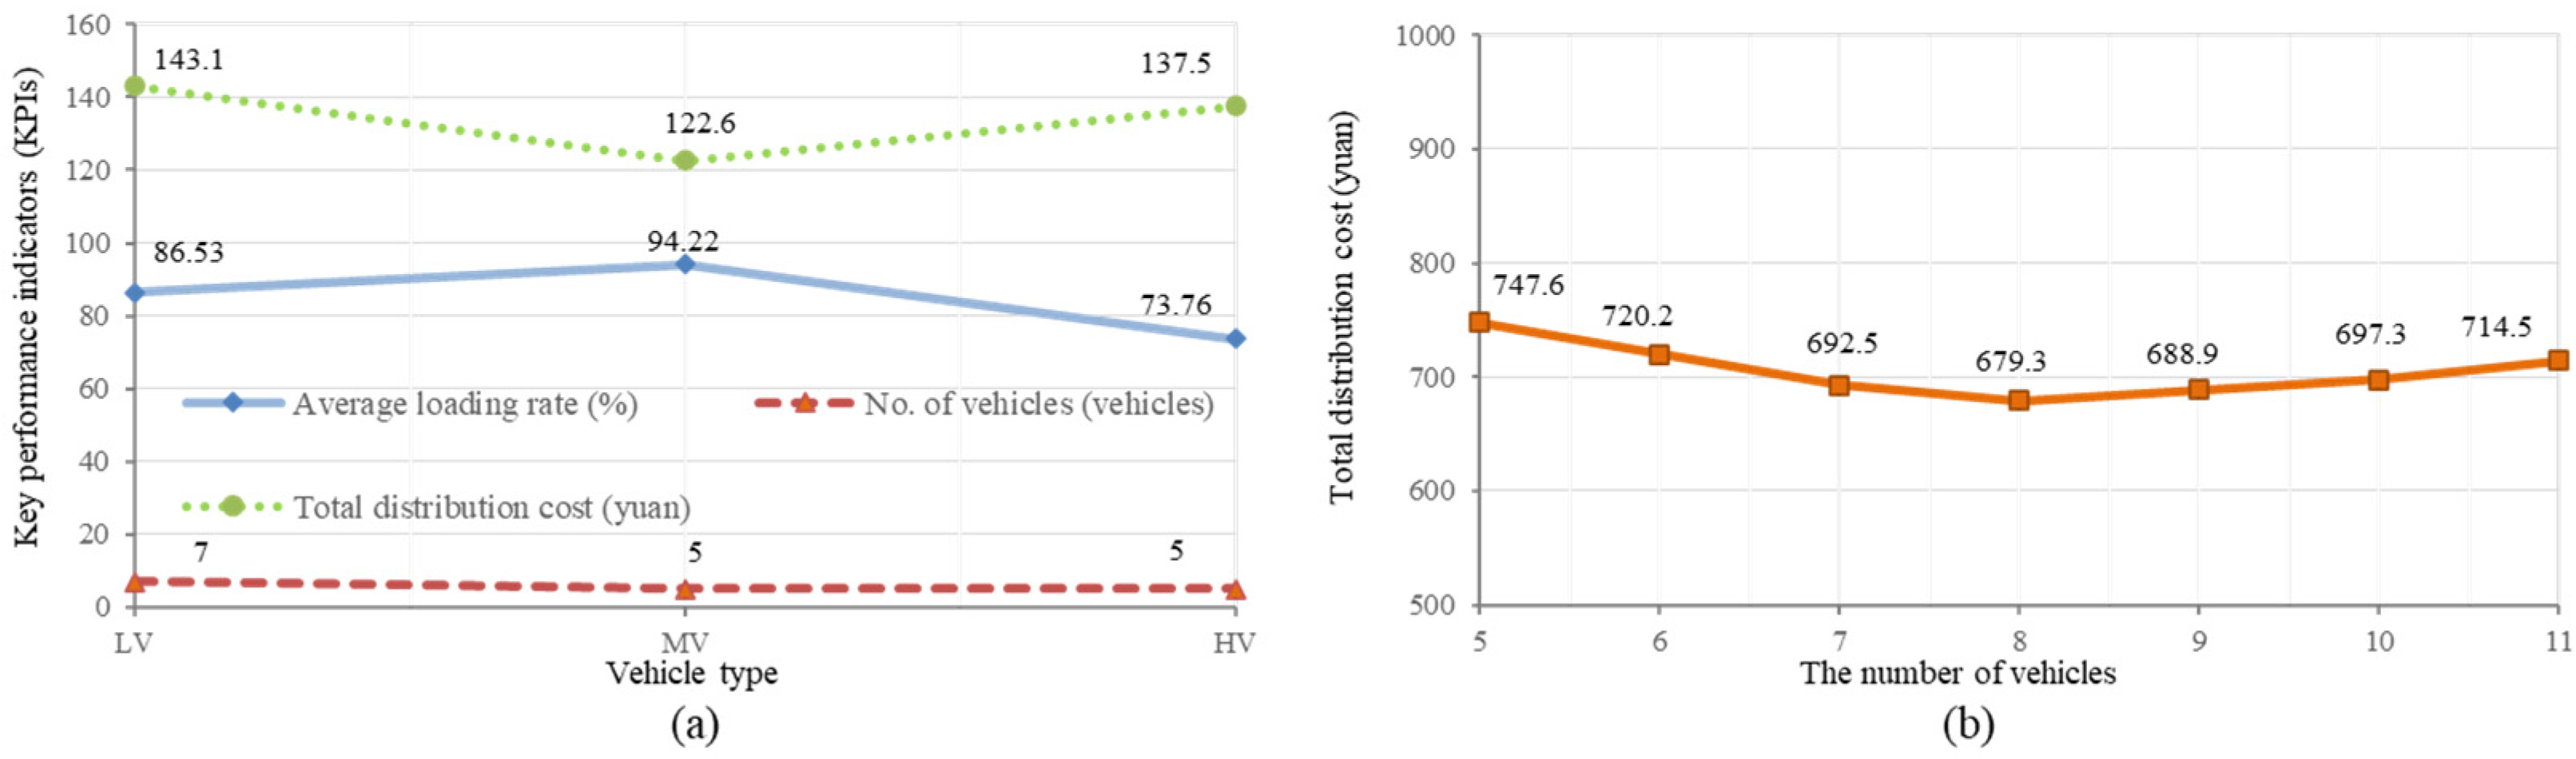
As illustrated in Figure 7 (a), the simulation results analysis for different vehicle model configurations reveals significant differences in key indicators of the material distribution scheduling system, such as average load rates and total distribution costs when other factors remain constant. The medium-weight vehicles exhibit the highest average load rate (94.22%), followed by lightweight vehicles (86.53%), and heavyweight vehicles (73.76%). The medium and heavyweight vehicles both use 5 vehicles each, while lightweight vehicles employ 7 vehicles. In terms of distribution costs, lightweight vehicles have the highest costs (143.1), and medium-weight vehicles have the lowest costs (122.6).
The explanation for these results is that the medium-weight vehicles achieve the highest average load rate, possibly because of their greater maximum payload, allowing them to accommodate more materials and thus improve the average load rate. Conversely, the higher distribution costs for lightweight vehicles could be attributed to their lower maximum payload, which requires more vehicles and trips to deliver the same quantity of materials, resulting in increased costs.
From this sensitivity analysis, valuable management insights can be derived:
- Managers need to balance distribution costs and efficiency in logistics operations. The size of a vehicle’s payload impacts the overall material distribution scheduling system’s performance when the quantity of materials remains constant. Overly large payloads can lead to lower load rates, reduced vehicle utilization, and increased total costs. Conversely, excessively small payloads, while improving average load rates, necessitate more vehicles, increasing maintenance costs. Therefore, selecting vehicles with medium payloads may help enterprises strike the right balance between cost and efficiency.
- Managers should consider the alignment of production modes with vehicle configurations. In high-volume production modes, where material demand is significant, using vehicles with larger payloads can better meet the high-volume material distribution requirements and reduce transportation costs. On the other hand, in multi-variety, low-volume production modes where materials vary but are relatively small in quantity, selecting vehicles with smaller payloads can better meet flexibility requirements and improve load rates.
- Managers need to find a balance between flexibility and efficiency. High-volume production modes often prioritize efficiency and, therefore, using larger payload vehicles can reduce costs. However, multi-variety, low-volume production modes prioritize flexibility, and thus smaller payload vehicles can better accommodate diverse material needs. In practice, managers must consider production demands, customer requirements, and the availability of logistics resources in their decision-making.
5.3.2. Scenario 2—Sensitivity Analysis of Different Vehicle Quantity Configurations
An analysis was conducted based on distribution demand data for a specific production batch, considering different quantities of medium-weight distribution vehicles, ranging from 5 to 11 vehicles.
Figure 7 (b) displays the results of the analysis for different configurations of distribution vehicle quantities. It is evident that, with other factors held constant, the total distribution costs exhibit a decreasing-then-increasing trend as the number of vehicles increases. When there are five vehicles, the total distribution costs are highest (747.6), and when the quantity increases to 8 vehicles, the costs decrease to a minimum (679.3). However, when the number further increases to 11 vehicles, the total distribution costs not only do not continue to decrease but increase to 724.5.
The interpretation of these results is that having too few vehicles may lead to high penalty costs, as each vehicle may need to work at a high load, frequently shuttling between the distribution center and workstations, leading to faster mechanical wear and battery depletion, requiring more frequent maintenance and increasing maintenance costs. Moreover, a shortage of vehicles may lead to distribution wait times or congestion during peak material demand, reducing distribution efficiency. Additionally, when materials must be delivered on time and an insufficient number of vehicles or low efficiency leads to untimely deliveries, extra high penalty costs may be incurred, significantly increasing the total distribution costs. Conversely, having too many vehicles can result in higher costs due to increased maintenance, fuel, and other fixed and variable costs, along with heightened management complexity.
Crucial management insights can be drawn from this sensitivity analysis:
- Managers need to strike a balance between penalty costs and idle costs. The number of distribution vehicles, under consistent vehicle types, affects the efficiency of the entire material distribution scheduling system. Having too few vehicles may lead to high penalty costs, while having too many vehicles can result in excess idle costs. Therefore, a balance needs to be struck between avoiding penalty costs and maximizing resource utilization. Managers should actively introduce advanced information technology and scheduling algorithms for real-time monitoring and intelligent decision-making to ensure that distribution vehicles meet demand without being underutilized.
- Managers should dynamically and adaptively allocate logistics resources. When an enterprise faces consistent production demand, optimizing the number of vehicles can improve economic efficiency. However, in actual logistics operations, disruptions such as dynamic insertions or equipment failures may require an open, flexible scheduling system that can dynamically lease external logistics resources (such as vehicles) based on real-time demand, forming a flexible logistics resource pool that optimally allocates vehicle resources to adapt to various uncertainties.
Figure 7.
(a) Performance analysis with different vehicle loads; (b) distribution efficiency analysis with different number of distribution vehicle configurations.
Figure 7.
(a) Performance analysis with different vehicle loads; (b) distribution efficiency analysis with different number of distribution vehicle configurations.
5.3.3. Scenario 3—Sensitivity Analysis of Different Dynamic Distribution Demand Volumes
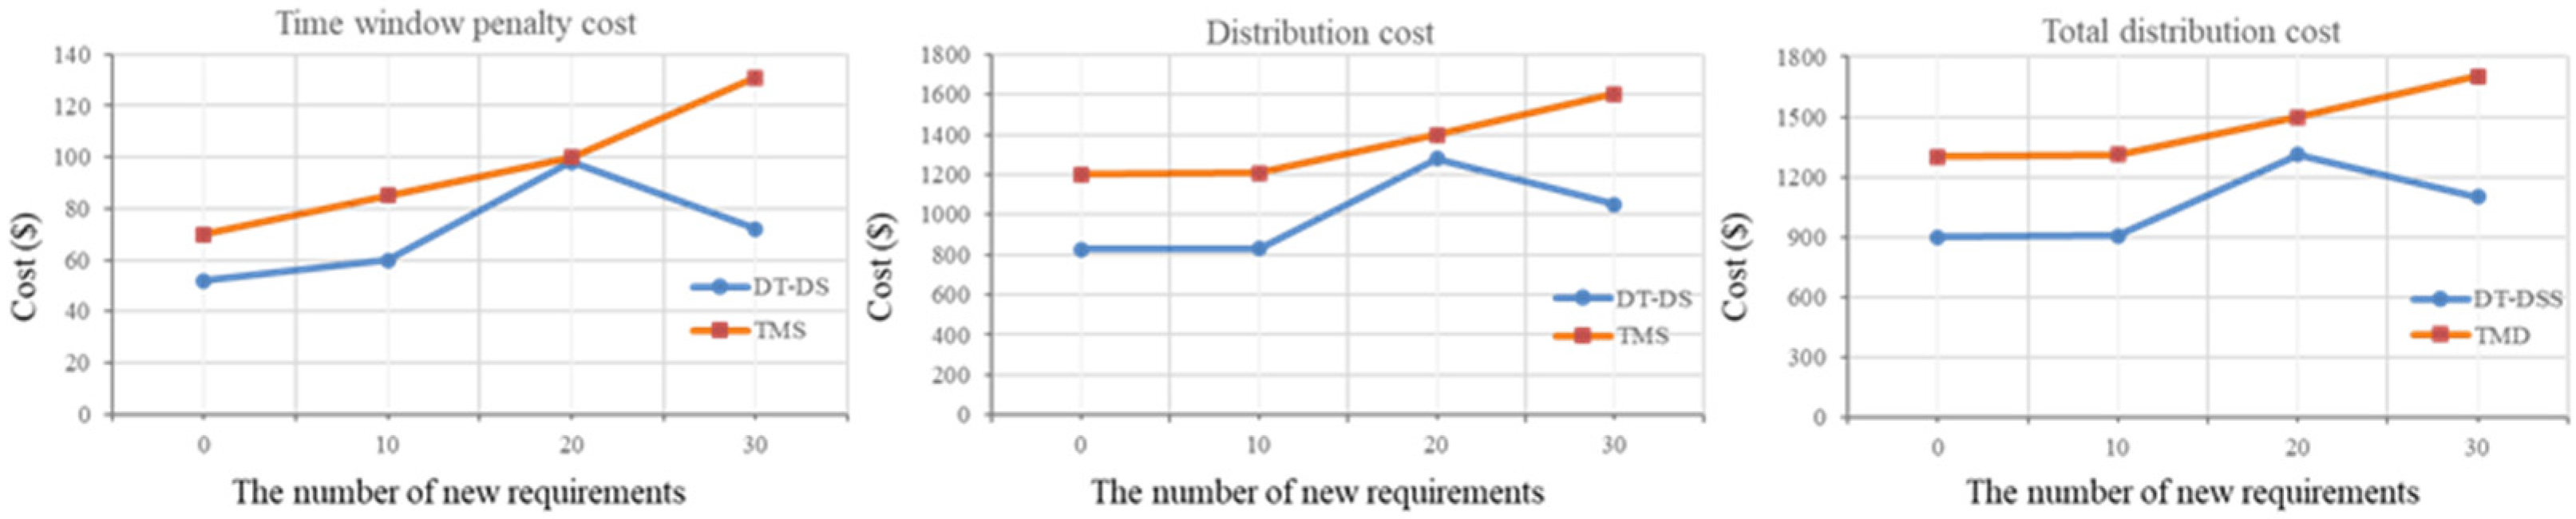
Different dynamic distribution demand volumes impose varying requirements on logistics resources and adjustment strategies. If managers choose inappropriate scheduling strategies, it can lead to varying degrees of increased material distribution costs. A representative dynamic scenario, the increase in demand, was analyzed in this section. The additional distribution demand begins at time 60 and gradually increases in increments of 10, reaching light dynamic (LD, 10), moderate dynamic (MD, 20), and heavy dynamic (HD, 30). The distribution time for all additional demands is set at 240.
As shown in Figure 8, the sensitivity analysis results for different dynamic distribution demand volumes reveal that, with other factors held constant, distribution costs, time penalty costs, and total distribution costs show an increasing-then-decreasing trend as the number of additional demands increases. Furthermore, irrespective of the amount of dynamic demand, adopting a dynamic scheduling strategy (i.e., DT-DS) results in lower costs across all three cost metrics compared to a traditional manual scheduling strategy (TMS).
The explanation for these results is that the costs exhibit an increasing-then-decreasing trend due to the instability of demand when additional demands are introduced. Traditional planning and routing strategies may no longer be effective as unstable demand requires additional resources, such as extra vehicles, inventory, or personnel, to meet these additional demands, leading to additional cost increases and an upward trend in total costs. However, as businesses enhance their adaptability to demand volatility, they can take various optimization measures, such as route optimization, order processing workflow adjustments, and improved vehicle utilization, to reduce these additional costs, leading to a decline in total costs.
From this sensitivity analysis, the following meaningful management insights can be derived:
- Managers need to enhance control of planning execution and demand forecasting and management. The increase in demand volume is positively correlated with the distribution total costs. Therefore, businesses should improve the stability of production plan execution and accurately predict dynamic demand through advanced logistics operation management strategies and precise demand forecasting models to mitigate the negative impact of unstable demand on the system.
- Managers should proactively adopt intelligent scheduling systems based on advanced technology. When faced with dynamic demand, employing dynamic scheduling strategies based on real-time information can effectively address various dynamic disruptions and, as a result, reduce various operational costs. Furthermore, when internal resources are insufficient to meet dynamic demand, timely introduction of flexible, high-quality, cost-effective external logistics resources ensures that the system can respond rapidly while reasonably controlling the usage costs of external resources to support sustainable business development.
Figure 8.
Distribution efficiency analysis under different dynamic new demand quantities.
6. Conclusions
Emerging industrial internet technologies hold the promise of creating real-time visibility and transparency in modern manufacturing environments, offering new opportunities for dynamic material distribution scheduling. This paper investigates a DT-based material distribution scheduling optimization model and strategy. The research encompasses several key aspects: Firstly, this study establishes a material distribution scheduling optimization model that accounts for workstation satisfaction, thereby achieving a more precise and comprehensive evaluation of the scheduling model. It also introduces a DT-based material distribution scheduling optimization decision framework, providing a detailed description of the composition and operation mechanisms of the DT-based material distribution system. Secondly, a dynamic material distribution scheduling optimization strategy based on DT is proposed, accompanied by enhancements to the traditional ACO algorithm. Finally, to validate the proposed methodology’s effectiveness, a case study was conducted using real data from a collaborative enterprise. The research results indicate that in dynamic environments, the DT-DS strategy proposed in this study outperforms traditional TMS strategies in terms of average load rates, distribution costs, and delay penalties.
This research makes several contributions to existing literature and practical applications:
Firstly, it establishes a material distribution scheduling optimization model that takes into account workstation satisfaction, allowing for a more accurate and comprehensive evaluation of the scheduling model.
Secondly, the proposed scheduling strategy incorporates real-time data into the decision framework, reducing interference from the source and integrating various scheduling types into a single framework. This significantly improves the DT-based material distribution scheduling optimization process, offering vital support for the increasingly prevalent field of data-driven production logistics operations management research.
Thirdly, the introduced IACO algorithm optimizes path node selection probabilities and pheromone update rules, leading to improved solution speed, quality, and stability.
However, this study also has certain limitations. The scheduling optimization model proposed in this study does not consider the production process and lacks a detailed description of how to harness real-time data from various sources. Consequently, future research exploring coordinated decision-making in production and logistics based on real-time data and big data analysis presents a promising avenue for further investigation.
Author Contributions
Conceptualization, Z.Z. and T.Q.; Supervision, T.Q., K.Z. and G.Q.H.; Validation, Z.Z.; Writing—original draft, Z.Z.; Writing—review & editing, T.Q., K.Z., K.Z., Y.Z., L.L., J. W. and Y.Z. All authors have read and agreed to the published version of the manuscript.
Funding
This research was funded by National Natural Science Foundation of China (52375498), National Key Research and Development Program of China (2021YFB3301701), 2019 Guangdong Special Support Talent Program–Innovation and Entrepreneurship Leading Team (China) (2019BT02S593), 2018 Guangzhou Leading Innovation Team Program (China) (201909010006), and the Science and Technology Development Fund (Macau SAR) (0078/2021/A), Guangdong Basic and Applied Basic Research Foundation (No. 2023A1515011712), the Outstanding Innovative Talents Cultivation Funded Programs for Doctoral Students of Jinan University (No. 2022CXB030).
Institutional Review Board Statement
Not applicable.
Informed Consent Statement
Not applicable.
Data Availability Statement
The experimental data in this paper were obtained from a well-known air conditioner manufacturer in China. The actual data were modified to some extent to protect their trade secrets. Some relevant data used in the case study of this paper are detailed in Appendix A.
Acknowledgments
This work is financially supported by National Natural Science Foundation of China (52375498), National Key Research and Development Program of China (2021YFB3301701), 2019 Guangdong Special Support Talent Program–Innovation and Entrepreneurship Leading Team (China) (2019BT02S593), 2018 Guangzhou Leading Innovation Team Program (China) (201909010006), and the Science and Technology Development Fund (Macau SAR) (0078/2021/A), Guangdong Basic and Applied Basic Research Foundation (No. 2023A1515011712), the Outstanding Innovative Talents Cultivation Funded Programs for Doctoral Students of Jinan University (No. 2022CXB030). We also appreciate the sponsorships from the industry, including but not limited to Carpoly Chemical Group Co., Ltd., Guangzhou Ink Stone Technology, Inc., Sendwant Logistic Ltd., Zhuhai Top Cloud Tech Co., Ltd. Guangdong International Cooperation Base of Science and Technology for GBA Smart Logistics by the Department of science and technology of Guangdong Province, thanks to which the international collaboration has been effectively conducted.
Conflicts of Interest
The authors declare no conflict of interest.
Appendix A
The tables specifically show the relevant data for Section 5.1.
Table A1.
Various vehicle distribution costs.
| Fixed costs ($/vehicle/times) |
Distribution cost per unit distance ($/m) |
Early arrival penalty costs ($/s) |
Late arrival penalty costs ($/s) |
|---|---|---|---|
| 5 | 0.1 | 0.5 | 0.5 |
Table A2.
Material distribution center and coordinates of each workstation.
| No. | X | Y | No. | X | Y |
|---|---|---|---|---|---|
| 0 | 5 | 20 | 17 | 25 | 20 |
| 1 | 15 | 4 | 18 | 25 | 29 |
| 2 | 15 | 8 | 19 | 25 | 34 |
| 3 | 15 | 17 | 20 | 29 | 34 |
| 4 | 15 | 24 | 21 | 29 | 31 |
| 5 | 15 | 30 | 22 | 29 | 23 |
| 6 | 15 | 34 | 23 | 29 | 16 |
| 7 | 19 | 36 | 24 | 29 | 9 |
| 8 | 19 | 32 | 25 | 29 | 5 |
| 9 | 19 | 26 | 26 | 27 | 2 |
| 10 | 19 | 20 | 27 | 35 | 7 |
| 11 | 19 | 16 | 28 | 35 | 11 |
| 12 | 19 | 10 | 29 | 35 | 20 |
| 13 | 18 | 2 | 30 | 35 | 25 |
| 14 | 25 | 4 | 31 | 35 | 31 |
| 15 | 25 | 8 | 32 | 35 | 33 |
| 16 | 25 | 13 |
Table A3.
The time window for material requirements and their unloading times.
| Workstation No. | Expected earliest time (s) | Expected latest time (s) | Distribution quantity (kg) | Unloading time (s) |
|---|---|---|---|---|
| 1 | 70 | 180 | 25 | 15 |
| 2 | 250 | 355 | 33 | 20 |
| 3 | 125 | 225 | 30 | 20 |
| 4 | 195 | 310 | 25 | 15 |
| 5 | 200 | 295 | 36 | 15 |
| 6 | 58 | 170 | 20 | 20 |
| 7 | 152 | 250 | 18 | 15 |
| 8 | 90 | 188 | 30 | 20 |
| 9 | 138 | 250 | 15 | 25 |
| 10 | 180 | 280 | 35 | 15 |
| 11 | 108 | 200 | 20 | 15 |
| 12 | 45 | 160 | 20 | 15 |
| 13 | 215 | 330 | 25 | 20 |
| 14 | 145 | 250 | 30 | 25 |
| 15 | 89 | 200 | 35 | 20 |
| 16 | 140 | 238 | 30 | 30 |
| 17 | 95 | 210 | 28 | 25 |
| 18 | 238 | 360 | 23 | 20 |
| 19 | 20 | 138 | 19 | 20 |
| 20 | 178 | 280 | 31 | 15 |
| 21 | 195 | 298 | 38 | 20 |
| 22 | 265 | 370 | 28 | 25 |
| 23 | 144 | 256 | 22 | 15 |
| 24 | 239 | 350 | 30 | 15 |
| 25 | 95 | 195 | 18 | 20 |
| 26 | 102 | 205 | 26 | 20 |
| 27 | 225 | 330 | 29 | 25 |
| 28 | 75 | 185 | 19 | 20 |
| 29 | 100 | 205 | 25 | 15 |
| 30 | 250 | 350 | 35 | 20 |
| 31 | 150 | 265 | 32 | 25 |
| 32 | 130 | 240 | 18 | 20 |
References
- Pozzi, R.; Rossi, T.; Secchi, R. Industry 4.0 technologies: Critical success factors for implementation and improvements in manufacturing companies. Prod. Plan. Control 2023, 34, 139–158. [Google Scholar] [CrossRef]
- Stroumpoulis, A.; Kopanaki, E. Theoretical perspectives on sustainable supply chain management and digital transformation: A literature review and a conceptual framework. Sustainability 2022, 14, 4862. [Google Scholar] [CrossRef]
- Ching, N.T.; Ghobakhloo, M.; Iranmanesh, M.; Maroufkhani, P.; Asadi, S. Industry 4.0 applications for sustainable manufacturing: A systematic literature review and a roadmap to sustainable development. J. Clean Prod. 2022, 334, 130133. [Google Scholar] [CrossRef]
- Qu, T.; Lei, S.P.; Wang, Z.Z.; Nie, D.X.; Chen, X.; Huang, G.Q. IoT-based real-time production logistics synchronization system under smart cloud manufacturing. Int. J. Adv. Manuf. Technol. 2016, 84, 147–164. [Google Scholar] [CrossRef]
- Tao, F.; Zhang, H.; Liu, A.; Nee, A.Y. Digital twin in industry, State-of-the-art. IEEE Trans. Ind. Inform. 2018, 15, 2405–2415. [Google Scholar] [CrossRef]
- Zhang, Y.; Ren, S.; Liu, Y.; Si, S. A big data analytics architecture for cleaner manufacturing and maintenance processes of complex products. J. Clean Prod. 2017, 142, 626–641. [Google Scholar] [CrossRef]
- Zhong, R.Y.; Xu, X.; Klotz, E.; Newman, S.T. Intelligent manufacturing in the context of industry 4.0: A review. Engineering 2017, 3, 616–630. [Google Scholar] [CrossRef]
- Shao, S.; Xu, G.; Li, M. The design of an IoT-based route optimization system: A smart product-service system (SPSS) approach. Adv. Eng. Inform. 2019, 42, 101006. [Google Scholar] [CrossRef]
- Liu, L.; Guo, K.; Gao, Z.; Li, J.; Sun, J. Digital Twin-Driven Adaptive Scheduling for Flexible Job Shops. Sustainability 2022, 14, 5340. [Google Scholar] [CrossRef]
- Haghnegahdar, L.; Joshi, S.S.; Dahotre, N.B. From IoT-based cloud manufacturing approach to intelligent additive manufacturing: Industrial Internet of Things—An overview. Int. J. Adv. Manuf. Technol. 2022, 1–18. [Google Scholar] [CrossRef]
- Li, F.; Li, T. Intelligent logistics Enterprise management based on the Internet of things. Math. Probl Eng. 2022. [Google Scholar] [CrossRef]
- Lei, N. Intelligent logistics scheduling model and algorithm based on Internet of Things technology. Alex. Eng. J. 2022, 61, 893–903. [Google Scholar] [CrossRef]
- Qing, C. Vehicle scheduling model of emergency logistics distribution based on internet of things. Int. J. App. Deci. Scie. 2018, 11, 36–54. [Google Scholar] [CrossRef]
- Ren, P.; Nie, M.; Ming, H. Optimization of sports good recycling management system based on Internet of Things. Wirel. Commun. Mob. Com. 2021, 1–11. [Google Scholar] [CrossRef]
- Wang, Y.; Wu, Z. Model construction of planning and scheduling system based on digital twin. Int. J. Adv. Manuf. Technol. 2020, 109, 2189–2203. [Google Scholar] [CrossRef]
- Fang, Y.; Peng, C.; Lou, P.; Zhou, Z.; Hu, J.; Yan, J. Digital-twin-based job shop scheduling toward smart manufacturing. IEEE T. Ind. Inform. 2019, 15, 6425–6435. [Google Scholar] [CrossRef]
- Zhang, K.; Qu, T.; Zhou, D.; Jiang, H.; Lin, Y.; Li, P.; Huang, G.Q. Digital twin-based opti-state control method for a synchronized production operation system. Robot. Comput.-Integr. Manuf. 2020, 63, 101892. [Google Scholar] [CrossRef]
- Hu, Y.; Yang, H.; Huang, Y. Conflict-free scheduling of large-scale multi-load AGVs in material transportation network. Transp. Res. Pt. e-Logist. Transp. Rev. 2022, 158, 102623. [Google Scholar] [CrossRef]
- Feng, B.; Ye, Q. Operations management of smart logistics, A literature review and future research. Front. Eng. Manag. 2021, 8, 344–355. [Google Scholar] [CrossRef]
- Pasha, J.; Nwodu, A.L.; Fathollahi-Fard, A.M.; Tian, G.; Li, Z.; Wang, H.; Dulebenets, M.A. Exact and metaheuristic algorithms for the vehicle routing problem with a factory-in-a-box in multi-objective settings. Adv. Eng. Inform. 2022, 52, 101623. [Google Scholar] [CrossRef]
- Klenk, E.; Galka, S.; Günthner, W.A. Operating strategies for in-plant milk-run systems. IFAC-PapersOnLine. 2015, 48, 1882–1887. [Google Scholar] [CrossRef]
- Klenk, E.; Galka, S. Analysis of real-time tour building and scheduling strategies for in-plant milk-run systems with volatile transportation demand. IFAC-PapersOnLine 2019, 52, 2110–2115. [Google Scholar] [CrossRef]
- Tao, Q.; Sang, H.; Guo, H.; Wang, P. Improved particle swarm optimization algorithm for AGV path planning. IEEE Access 2021, 9, 33522–33531. [Google Scholar]
- Wang, Y.; Wang, X.; Guan, X.; Li, Q.; Fan, J.; Wang, H. A combined intelligent and game theoretical methodology for collaborative multicenter pickup and delivery problems with time window assignment. Appl. Comput. Intell. S. 2021, 113, 107875. [Google Scholar] [CrossRef]
- Chen, T.; Chen, S.; Zhang, K.; Qiu, G.; Li, Q.; Chen, X. A jump point search improved ant colony hybrid optimization algorithm for path planning of mobile robot. Int. J. Adv. Robot. Syst. 2022, 19, 17298806221127953. [Google Scholar] [CrossRef]
- Li, H.; Wang, X.; Liu, Y.; Liu, G.; Zhai, Z.; Yan, X.; Zhang, Y. A novel robotic-vision-based defect inspection system for bracket weldments in a cloud–edge coordination environment. Sustainability 2023, 15, 10783. [Google Scholar] [CrossRef]
- Tao, F.; Liu, W.; Zhang, M.; Hu, T.L.; Qi, Q.; Zhang, H.; Huang, Z. Five-dimension digital twin model and its ten applications. Comput. Integr. Manuf. Syst. 2019, 25, 1–18. [Google Scholar]
- Zhou, Z.; Xu, L.; Ling, X.; Zhang, B. Digital-twin-based job shop multi-objective scheduling model and strategy. Int. J. Comput. Integr. Manuf. 2023, 1–21. [Google Scholar] [CrossRef]
Disclaimer/Publisher’s Note: The statements, opinions and data contained in all publications are solely those of the individual author(s) and contributor(s) and not of MDPI and/or the editor(s). MDPI and/or the editor(s) disclaim responsibility for any injury to people or property resulting from any ideas, methods, instructions or products referred to in the content. |
© 2023 by the authors. Licensee MDPI, Basel, Switzerland. This article is an open access article distributed under the terms and conditions of the Creative Commons Attribution (CC BY) license (http://creativecommons.org/licenses/by/4.0/).
Copyright: This open access article is published under a Creative Commons CC BY 4.0 license, which permit the free download, distribution, and reuse, provided that the author and preprint are cited in any reuse.


